route 460 location study alternatives … · route 460 location study alternatives development...
TRANSCRIPT
Route 460 Location Study
ALTERNATIVES DEVELOPMENT TECHNICAL REPORT
May 2005
Route 460 Location Study i Alternatives Development Technical Report May 2005
TABLE OF CONTENTS
1.0 ALTERNATIVES DEVELOPMENT --------------------------------------------------------------------------------1 1.1 ALTERNATIVES DEVELOPMENT PROCESS--------------------------------------------------------------1
1.1.1 Step I—Development of Conceptual Alternatives -------------------------------------------------------1 1.1.2 Step II—Purpose and Need Analysis -----------------------------------------------------------------------2 1.1.3 Step III—Alternative Screening-------------------------------------------------------------------------------2
1.2 ALTERNATIVE ELIMINATED------------------------------------------------------------------------------------3 1.2.1 Mass Transit Alternative ---------------------------------------------------------------------------------------4
1.3 ALTERNATIVES RETAINED-------------------------------------------------------------------------------------5 1.3.1 No-Build Alternative ---------------------------------------------------------------------------------------------5 1.3.2 Transportation Systems Management Alternative-------------------------------------------------------5 1.3.3 Build Alternatives ------------------------------------------------------------------------------------------------5 1.3.4 Comments on Specific Criteria ----------------------------------------------------------------------------- 12 1.3.5 Conclusions ----------------------------------------------------------------------------------------------------- 13
1.4 CBA ALIGNMENT SHIFTS ------------------------------------------------------------------------------------- 16 1.5 COST ESTIMATE------------------------------------------------------------------------------------------------- 18
1.5.1 Methodology for the Preliminary Cost Estimate-------------------------------------------------------- 18 1.5.2 Methodology for TSM Alternative-------------------------------------------------------------------------- 18 1.5.3 Methodology for Conceptual Build Alternatives -------------------------------------------------------- 18
1.6 ALTERNATIVE COMPARISONS FOR TRANSPORTATION FACTORS--------------------------- 19 1.6.1 Travel Demand------------------------------------------------------------------------------------------------- 19 1.6.2 Roadway Capacity -------------------------------------------------------------------------------------------- 21 1.6.3 Level of Service (LOS) --------------------------------------------------------------------------------------- 21
1.6.3.1 Intersection LOS ----------------------------------------------------------------------------------------- 21 1.6.3.2 Roadway LOS -------------------------------------------------------------------------------------------- 22
1.6.4 Travel Time Savings ------------------------------------------------------------------------------------------ 22 1.6.5 Hurricane Evacuation----------------------------------------------------------------------------------------- 23 1.6.6 Freight Accommodation-------------------------------------------------------------------------------------- 23 1.6.7 Safety------------------------------------------------------------------------------------------------------------- 24
1.7 TOLL FEASIBILITY STUDY------------------------------------------------------------------------------------ 24 2.0 REFERENCES -------------------------------------------------------------------------------------------------------- 25
Route 460 Location Study ii Alternatives Development Technical Report May 2005
LIST OF TABLES TABLE 1.1-1 SCREENING CRITERIA -----------------------------------------------------------------------------------3 TABLE 1.2-1 PURPOSE AND NEED ANALYSIS----------------------------------------------------------------------3 TABLE 1.3-1 EVALUATION RESULTS -------------------------------------------------------------------------------- 14 TABLE 1.5-1 EXISTING AND FORECASTED TRAVEL DEMAND --------------------------------------------- 19 TABLE 1.5-2 INTERSECTION LEVEL OF SERVICE – EXISTING ROUTE 460 ---------------------------- 21 TABLE 1.5-3 ROADWAY LEVEL OF SERVICE – EXISTING ROUTE 460 ----------------------------------- 22 TABLE 1.5-4 EASTBOUND TRAVEL TIME COMPARISONS FROM PETERSBURG--------------------- 23 TABLE 1.5-5 TRUCK PERCENTAGES -------------------------------------------------------------------------------- 24
LIST OF FIGURES FIGURE 1.1-1 ALTERNATIVES SCREENING PROCESS -----------------------------------------------------------1 FIGURE 1.3-1 TYPICAL SECTION OF BUILD IMPROVEMENTS ON EXISTING ALIGNMENT -----------6 FIGURE 1.3-2 TYPICAL SECTION OF ALTERNATIVES ON NEW LOCATION --------------------------------7 FIGURE 1.3-3 CONCEPTUAL ALTERNATIVES ------------------------------------------------------------------------9 FIGURE 1.3-4 HYBRID ALTERNATIVES ------------------------------------------------------------------------------- 11 FIGURE 1.3-5 CANDIDATE BUILD ALTERNATIVES---------------------------------------------------------------- 15 FIGURE 1.4-1 CBA ALIGNMENT SHIFTS ------------------------------------------------------------------------------ 17
Route 460 Location Study 1 Alternatives Development Technical Report May 2005
1.0 ALTERNATIVES DEVELOPMENT
1.1 ALTERNATIVES DEVELOPMENT PROCESS
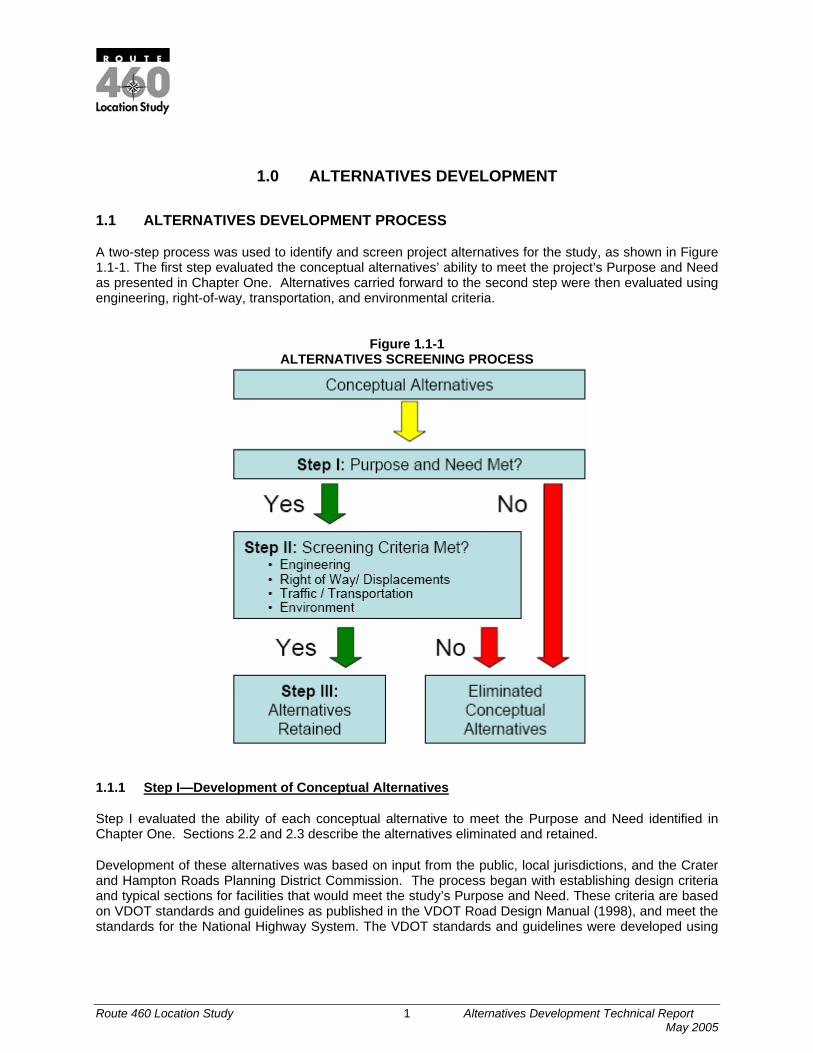
A two-step process was used to identify and screen project alternatives for the study, as shown in Figure 1.1-1. The first step evaluated the conceptual alternatives’ ability to meet the project’s Purpose and Need as presented in Chapter One. Alternatives carried forward to the second step were then evaluated using engineering, right-of-way, transportation, and environmental criteria.
Figure 1.1-1
ALTERNATIVES SCREENING PROCESS
1.1.1 Step I—Development of Conceptual Alternatives
Step I evaluated the ability of each conceptual alternative to meet the Purpose and Need identified in Chapter One. Sections 2.2 and 2.3 describe the alternatives eliminated and retained.
Development of these alternatives was based on input from the public, local jurisdictions, and the Crater and Hampton Roads Planning District Commission. The process began with establishing design criteria and typical sections for facilities that would meet the study’s Purpose and Need. These criteria are based on VDOT standards and guidelines as published in the VDOT Road Design Manual (1998), and meet the standards for the National Highway System. The VDOT standards and guidelines were developed using
Route 460 Location Study 2 Alternatives Development Technical Report May 2005
the 1990 edition of A Policy on Geometric Design of Highways and Streets, as published by the American Association of State Highway and Transportation officials (AASHTO).
All conceptual build alternatives would connect the Route 58 Bypass in Suffolk to I-295 near Petersburg. These termini were selected in accordance with FHWA Technical Guidelines for logical termini selection and address the needs of the project, while allowing the evaluation of project alternatives that would function independently.
1.1.2 Step II—Purpose and Need Analysis
Step II evaluated the ability of each conceptual alternative to meet the Purpose and Need identified in Chapter One. Sections 2.2 and 2.3 describe the alternatives eliminated and retained.
1.1.3 Step III—Alternative Screening
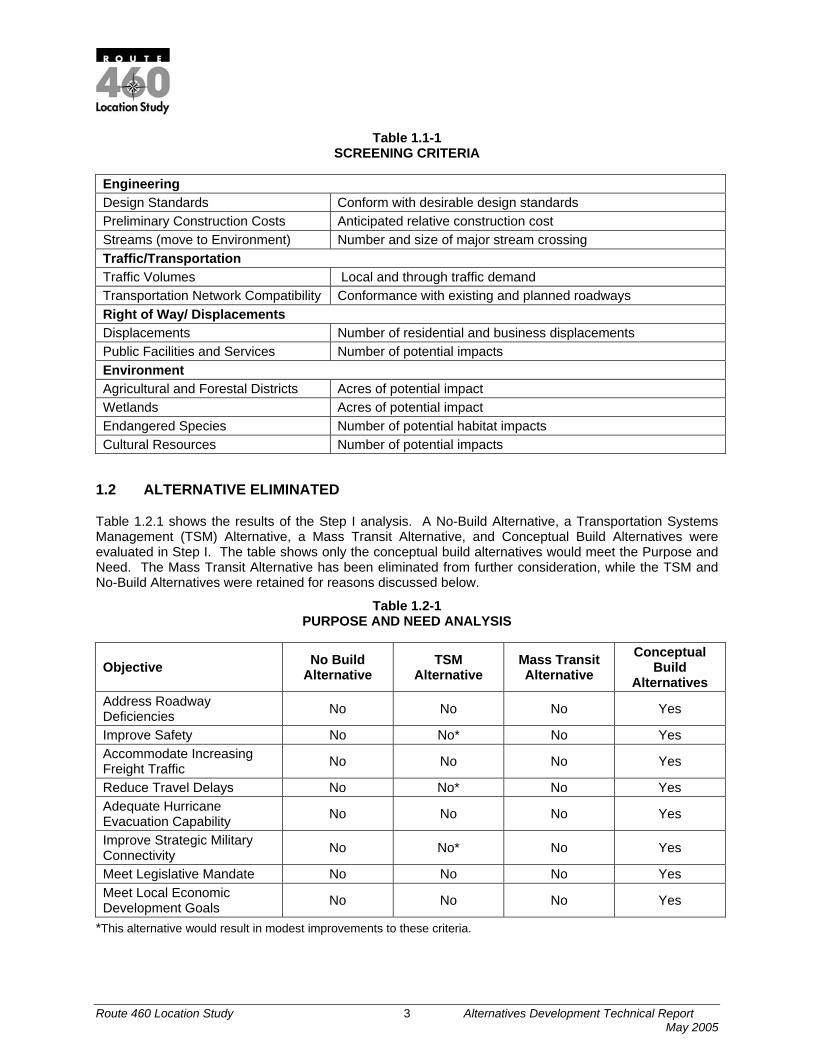
Alternatives that were retained for Step III underwent more detailed analysis based on previously developed Screening Criteria. Screening criteria were divided into several categories: Engineering, Traffic/Transportation, Right of way/Displacements, and Environment (see Table 1-1.1).
To screen the alternatives, travel demand estimates were prepared using a transportation model developed for the study. This “super-regional” model combines the Hampton Roads and Richmond regions’ existing travel demand models (see the Traffic and Transportation Technical Report for more information). The model provided the study team with traffic volumes for each conceptual alternative. Preliminary cost estimates were based upon standard unit costs for materials used in highway construction, and include estimates for the bridges and interchanges. These preliminary cost estimates did not include estimates for right of way costs, relocation of utilities, landscape features, wetlands mitigation and other miscellaneous items.
Potential impact areas were identified for the conceptual alternatives based on 500-foot wide corridors. Impact areas for interchange or intersection locations consisted of circles with 2000 foot diameters. Potential residential or commercial displacements were determined using high resolution aerial photography provided by the 2002 Virginia Base Mapping Program (VBMP).” Impacts to other resources such as wetlands and protected species habitat were determined using existing digital mapping from VDOT’s Geographic Information System (GIS). Impacts to known cultural resources were included in the Section 4(f) criterion. Selected environmental impacts were tabulated on a “per mile” basis, providing another means to compare alternative impacts. Later in the process, this approach also helped identify ‘hybrid’ alternatives using crossover segments and /or portions of other alternatives. Section 2.3.3 provides more detail on build alternative development and screening.
Route 460 Location Study 3 Alternatives Development Technical Report May 2005
Table 1.1-1 SCREENING CRITERIA
1.2 ALTERNATIVE ELIMINATED
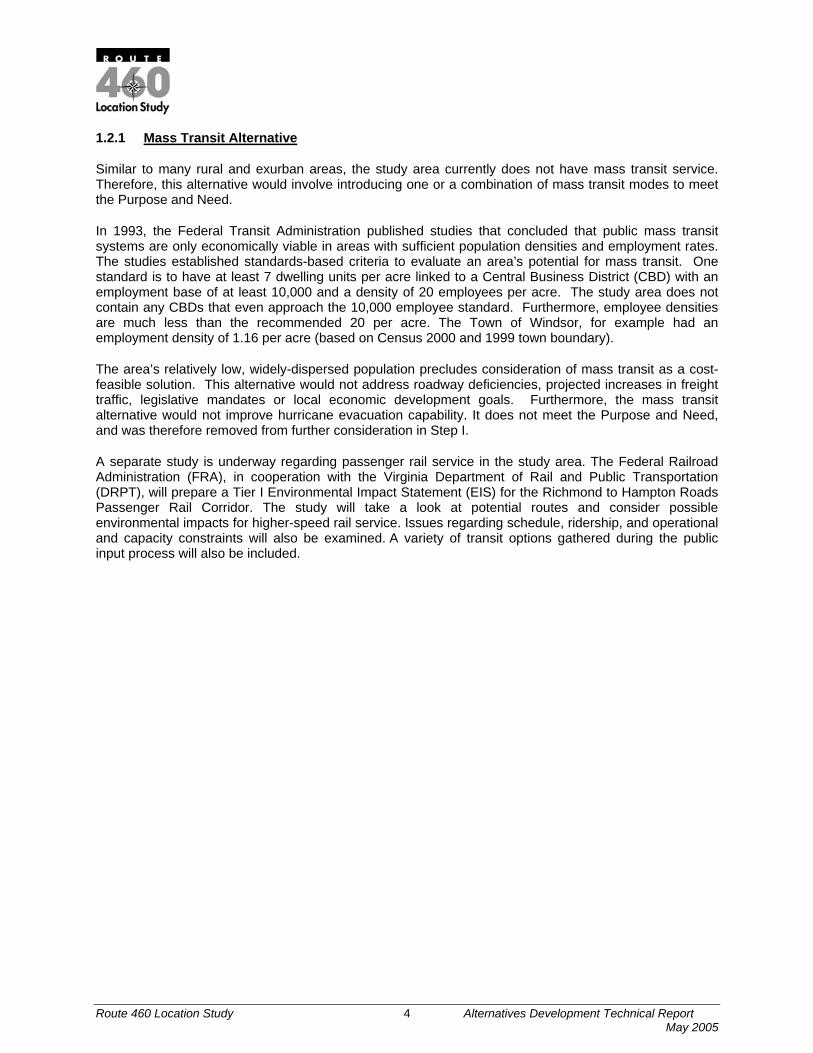
Table 1.2.1 shows the results of the Step I analysis. A No-Build Alternative, a Transportation Systems Management (TSM) Alternative, a Mass Transit Alternative, and Conceptual Build Alternatives were evaluated in Step I. The table shows only the conceptual build alternatives would meet the Purpose and Need. The Mass Transit Alternative has been eliminated from further consideration, while the TSM and No-Build Alternatives were retained for reasons discussed below.
Table 1.2-1 PURPOSE AND NEED ANALYSIS
*This alternative would result in modest improvements to these criteria.
Engineering Design Standards Conform with desirable design standards Preliminary Construction Costs Anticipated relative construction cost Streams (move to Environment) Number and size of major stream crossing Traffic/Transportation Traffic Volumes Local and through traffic demand Transportation Network Compatibility Conformance with existing and planned roadways Right of Way/ Displacements Displacements Number of residential and business displacements Public Facilities and Services Number of potential impacts Environment Agricultural and Forestal Districts Acres of potential impact Wetlands Acres of potential impact Endangered Species Number of potential habitat impacts Cultural Resources Number of potential impacts
Objective No Build Alternative
TSM Alternative
Mass Transit Alternative
Conceptual Build
Alternatives Address Roadway Deficiencies No No No Yes
Improve Safety No No* No Yes Accommodate Increasing Freight Traffic No No No Yes
Reduce Travel Delays No No* No Yes Adequate Hurricane Evacuation Capability No No No Yes
Improve Strategic Military Connectivity No No* No Yes
Meet Legislative Mandate No No No Yes Meet Local Economic Development Goals No No No Yes
Route 460 Location Study 4 Alternatives Development Technical Report May 2005
1.2.1 Mass Transit Alternative
Similar to many rural and exurban areas, the study area currently does not have mass transit service. Therefore, this alternative would involve introducing one or a combination of mass transit modes to meet the Purpose and Need.
In 1993, the Federal Transit Administration published studies that concluded that public mass transit systems are only economically viable in areas with sufficient population densities and employment rates. The studies established standards-based criteria to evaluate an area’s potential for mass transit. One standard is to have at least 7 dwelling units per acre linked to a Central Business District (CBD) with an employment base of at least 10,000 and a density of 20 employees per acre. The study area does not contain any CBDs that even approach the 10,000 employee standard. Furthermore, employee densities are much less than the recommended 20 per acre. The Town of Windsor, for example had an employment density of 1.16 per acre (based on Census 2000 and 1999 town boundary).
The area’s relatively low, widely-dispersed population precludes consideration of mass transit as a cost-feasible solution. This alternative would not address roadway deficiencies, projected increases in freight traffic, legislative mandates or local economic development goals. Furthermore, the mass transit alternative would not improve hurricane evacuation capability. It does not meet the Purpose and Need, and was therefore removed from further consideration in Step I.
A separate study is underway regarding passenger rail service in the study area. The Federal Railroad Administration (FRA), in cooperation with the Virginia Department of Rail and Public Transportation (DRPT), will prepare a Tier I Environmental Impact Statement (EIS) for the Richmond to Hampton Roads Passenger Rail Corridor. The study will take a look at potential routes and consider possible environmental impacts for higher-speed rail service. Issues regarding schedule, ridership, and operational and capacity constraints will also be examined. A variety of transit options gathered during the public input process will also be included.
Route 460 Location Study 5 Alternatives Development Technical Report May 2005
1.3 ALTERNATIVES RETAINED
Alternatives retained for detailed analysis in the DEIS include the following:
1.3.1 No-Build Alternative
The No-Build Alternative includes currently programmed committed and funded roadway projects in VDOT Six Year Plan and the Constrained Long Range Plan (CLRP) developed by the Metropolitan Planning Organizations (MPOs). The No-Build alternative does not address project needs such as improvements to roadway deficiencies, travel delay, hurricane evacuation, safety, and roadway infrastructure improvements. However, it has been retained to serve as a baseline for comparison with the build alternatives.. The following is a list of committed projects to improve existing Route 460:
• City of Suffolk - arterial signal system - Kings Fork Road to west corporate limits;
• Sussex County - dual left turn lanes on VA 604;
• Prince George County - left turn lane signal modification on VA 156;
• Prince George County - left turn lane signal modification on VA 629/Quaker Road.
1.3.2 Transportation Systems Management Alternative
Transportation System Management (TSM) improvements are low cost system enhancements that improve the efficiency of the existing transportation system. A TSM alternative could include improvements such as high-occupancy vehicle lanes, ridesharing, signal synchronization, and other actions. TSM could also include strategies to add capacity and improve operational deficiencies of the existing transportation system, including: (1) intelligent transportation systems, (2) travel demand management, (3) access management, and (4) minor geometric improvements.
TSM enhancements identified for this project include to:
• Add turning lanes at the intersection of Rt. 625.
• Add turning lanes at the intersection of Rt. 601 to the north and Rt. 624 to the south.
• Add right and left turn lanes to the intersection of Route 460 and Route 635.
• Add advance warning lights and/or rumble strips for stop light at the intersection of Route 460 and Route 616.
• Realign Route 460 and Route 618 intersection, with new right- and left-turn lanes.
• Install rumble strips along the existing Rt. 460 centerline.
These collective improvements provide only modest improvements to safety and roadway deficiencies and do not fully meet the Purpose and Need. However, the TSM Alternative has been retained for detailed study since it offers a low-cost option to improve transportation conditions in the study area.
1.3.3 Build Alternatives
According to AASHTO standards, rural principal arterials are characterized by corridor movements with trip length and density suitable for substantial statewide or interstate travel. The Conceptual Build Alternatives meet the Purpose and Need (Step I) and therefore were evaluated using the screening criteria in Step II. The build alternatives include sections on new alignment as well as sections on existing

Route 460 Location Study 6 Alternatives Development Technical Report May 2005
alignment; therefore two potential typical sections apply. All build alternatives have a design speed of 60 miles per hour.
Improvements on existing alignment would use a non-freeway rural principal arterial typical section (see Figure 1.3-1). The VDOT Road Design Manual (1998) refers to this typical section as a GS-1 ‘other’ roadway (‘other’ meaning ‘non-freeway’). With an average right of way width of 81 feet, this section uses either a center bi-directional turning lane (as shown) or a combination of raised and flush medians. Location-specific conditions would dictate shoulder width and/or the presence of curb and gutter sections. On cut and fill slopes, outside shoulders would be 10 feet wide and 13 feet wide, respectively.
Figure 1.3-1 TYPICAL SECTION OF BUILD IMPROVEMENTS ON EXISTING ALIGNMENT
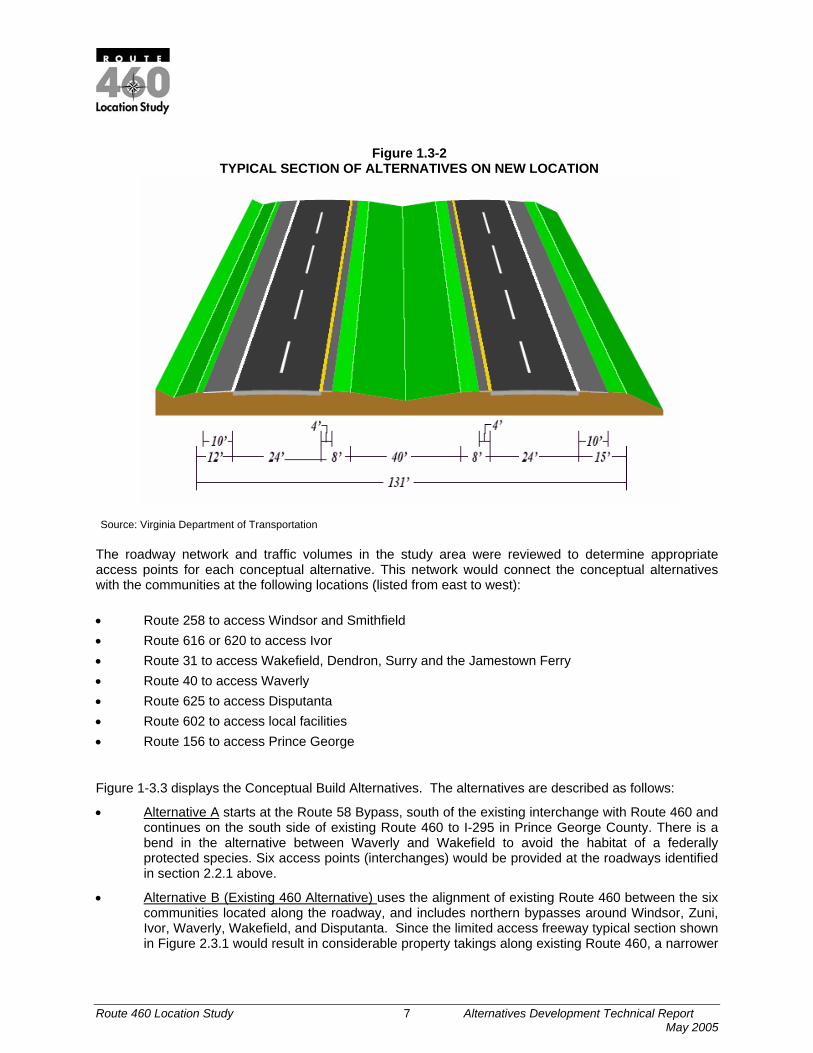
Build alternatives on new location would be classified as GS-1 (rural principal arterials) as stated in the VDOT Road Design Manual. Figure 1.3-2 depicts the typical section for the new location alternatives. The typical section consists of a four lane, divided highway with two 12-foot lanes in each direction. The divided highway section includes 40-foot wide depressed medians. Paved shoulders would be ten feet wide on the outside lane and four feet wide on the inside lane. On cut and fill slopes, outside shoulders would be 12 feet and 15 feet, respectively. The typical section would require an average right of way of 131 feet.
Route 460 Location Study 7 Alternatives Development Technical Report May 2005
Figure 1.3-2
TYPICAL SECTION OF ALTERNATIVES ON NEW LOCATION
Source: Virginia Department of Transportation
The roadway network and traffic volumes in the study area were reviewed to determine appropriate access points for each conceptual alternative. This network would connect the conceptual alternatives with the communities at the following locations (listed from east to west): • Route 258 to access Windsor and Smithfield • Route 616 or 620 to access Ivor • Route 31 to access Wakefield, Dendron, Surry and the Jamestown Ferry • Route 40 to access Waverly • Route 625 to access Disputanta • Route 602 to access local facilities • Route 156 to access Prince George
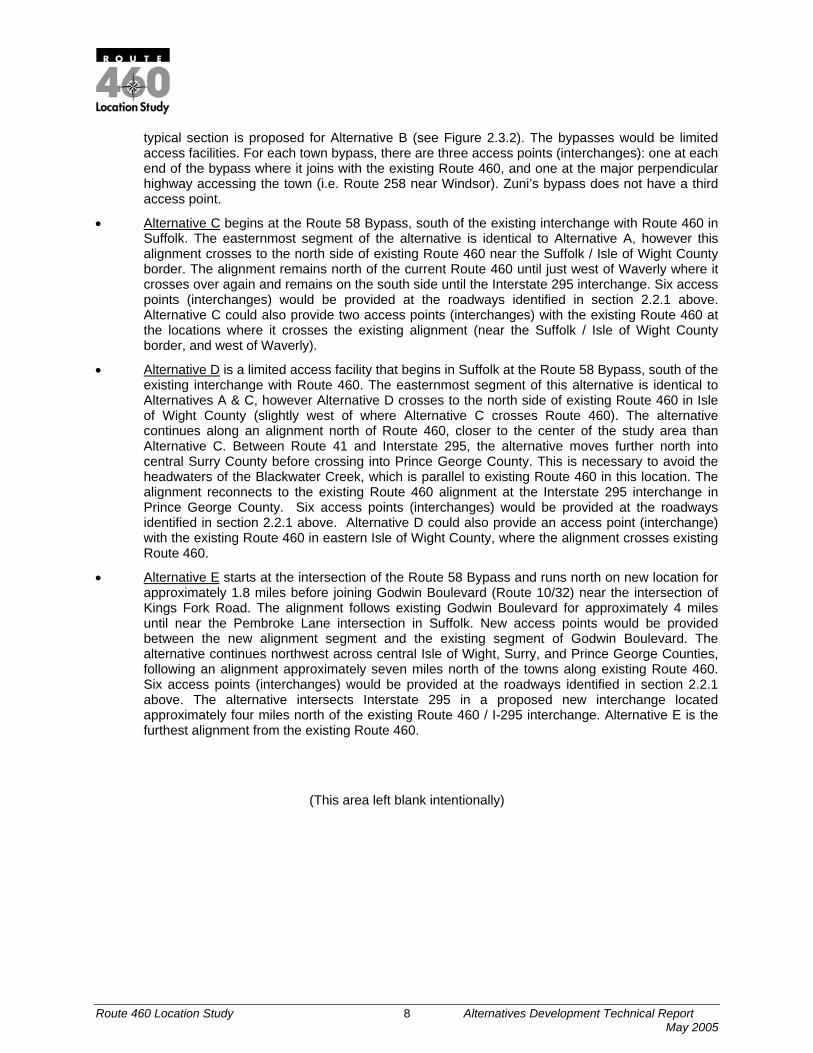
Figure 1-3.3 displays the Conceptual Build Alternatives. The alternatives are described as follows:
• Alternative A starts at the Route 58 Bypass, south of the existing interchange with Route 460 and continues on the south side of existing Route 460 to I-295 in Prince George County. There is a bend in the alternative between Waverly and Wakefield to avoid the habitat of a federally protected species. Six access points (interchanges) would be provided at the roadways identified in section 2.2.1 above.
• Alternative B (Existing 460 Alternative) uses the alignment of existing Route 460 between the six communities located along the roadway, and includes northern bypasses around Windsor, Zuni, Ivor, Waverly, Wakefield, and Disputanta. Since the limited access freeway typical section shown in Figure 2.3.1 would result in considerable property takings along existing Route 460, a narrower
Route 460 Location Study 8 Alternatives Development Technical Report May 2005
typical section is proposed for Alternative B (see Figure 2.3.2). The bypasses would be limited access facilities. For each town bypass, there are three access points (interchanges): one at each end of the bypass where it joins with the existing Route 460, and one at the major perpendicular highway accessing the town (i.e. Route 258 near Windsor). Zuni’s bypass does not have a third access point.
• Alternative C begins at the Route 58 Bypass, south of the existing interchange with Route 460 in Suffolk. The easternmost segment of the alternative is identical to Alternative A, however this alignment crosses to the north side of existing Route 460 near the Suffolk / Isle of Wight County border. The alignment remains north of the current Route 460 until just west of Waverly where it crosses over again and remains on the south side until the Interstate 295 interchange. Six access points (interchanges) would be provided at the roadways identified in section 2.2.1 above. Alternative C could also provide two access points (interchanges) with the existing Route 460 at the locations where it crosses the existing alignment (near the Suffolk / Isle of Wight County border, and west of Waverly).
• Alternative D is a limited access facility that begins in Suffolk at the Route 58 Bypass, south of the existing interchange with Route 460. The easternmost segment of this alternative is identical to Alternatives A & C, however Alternative D crosses to the north side of existing Route 460 in Isle of Wight County (slightly west of where Alternative C crosses Route 460). The alternative continues along an alignment north of Route 460, closer to the center of the study area than Alternative C. Between Route 41 and Interstate 295, the alternative moves further north into central Surry County before crossing into Prince George County. This is necessary to avoid the headwaters of the Blackwater Creek, which is parallel to existing Route 460 in this location. The alignment reconnects to the existing Route 460 alignment at the Interstate 295 interchange in Prince George County. Six access points (interchanges) would be provided at the roadways identified in section 2.2.1 above. Alternative D could also provide an access point (interchange) with the existing Route 460 in eastern Isle of Wight County, where the alignment crosses existing Route 460.
• Alternative E starts at the intersection of the Route 58 Bypass and runs north on new location for approximately 1.8 miles before joining Godwin Boulevard (Route 10/32) near the intersection of Kings Fork Road. The alignment follows existing Godwin Boulevard for approximately 4 miles until near the Pembroke Lane intersection in Suffolk. New access points would be provided between the new alignment segment and the existing segment of Godwin Boulevard. The alternative continues northwest across central Isle of Wight, Surry, and Prince George Counties, following an alignment approximately seven miles north of the towns along existing Route 460. Six access points (interchanges) would be provided at the roadways identified in section 2.2.1 above. The alternative intersects Interstate 295 in a proposed new interchange located approximately four miles north of the existing Route 460 / I-295 interchange. Alternative E is the furthest alignment from the existing Route 460.
(This area left blank intentionally)
James River
James River
$$
$$
$$$$$$$$
$$
$
$$$
$$$$$$$$
$
$$$$$$ $$$$
$ $$$$
$$$$$
$$$$$$
$$$ $$$$$
$$$$$$$$$$
$$$$$$$$$$$$$$$
$$$$$$$$$$$$
$$$$$$$
$$$
$
$
$
$
"""
""
"""
" " "
"
"
""
""
"
""""
""
"""
" """""""""""""
" " ""
"" ""
" " ""
"""
" """
"
""
"
"" "
"
"
"
""
""
""
""
""
"
""
""
"
""
""
""
"
"
""
""
" ""
"
""
" " " "
"""
!!
!
!!!!
!!!!
!!
!
!!
!!
!
!!
!!
!!
!!!!
!!
!!
!!
!!
!!
!!!!!
!! ! ! ! !! !
!!
!!
!!
!!
!!!!!
!!!!
!!!
!!
!!
!!!
!! ! ! !
!!
!!!
!!
! ! ! ! ! ! !
!!
!!
!! ! ! ! ! !
#
## ###
##
#
##
####
###########
#
# ####
#############
####
#
###
##
####
# ###
####
#
##
#
## ###
# ## #
#
###
#
#
# ##
##
#
#####
#####
#
#
###############
##
[[
[[[
[[
[
[[
[[[[[[[
[[[[[[[[[[[[[[[[[
[[[[[[[[
[[[
[[[[[[[[[
[[
[[[[[[[[[[[[
[[[[[
[[[[
[[[
[[[
[[
[[[[[[[[[[[[[
[
[[
[[
[[[[[[[
I«
Kâ
AÇ
Kâ ?õ?e
?õKØ
KØKâ
?d
?o
?o
Kâ
%&h(
%&h(
Aj
Aj
?õ
?o
?i
?i
?o
!"e$
?d
KØ
KØ
Iv
?õ
?õ
?d
?õ
?õ
Aj
Aj
?õ
IÁ
?i
I«
I«
I«
?î
?î
?î
!"̀$
?d
I²
I²
Aë
Kâ
!"̀$
ERSBURG
HOPEWELL
FRANKLIN
SMITHFIELD
DENDRONWAVERLY
CLAREMONT
SURRY
WAKEFIELD
COURTLANDCAPRON
DISPUTANTA
IVOR
ZUNI
WINDSOR
PRINCE GEORGE
SURRY
SUSSEX
SOUTHAMPTON
ISLE OF WIGHT
SUFFOLK
FIGURE 1.3-3CONCEPTUAL ALTERNATIVES
0 5 10Miles
0 5 10Kilometers
! ! ! ! ! ! Alternative A###### Alternative B" " " " " " Alternative C
[[[[[[Alternative D
$$$$$$ Alternative E
Crossover Segments
Study Area
Route 460 Location Study Alternatives Development Technical Report9
±
Route 460 Location Study 10 Alternatives Development Technical Report May 2005
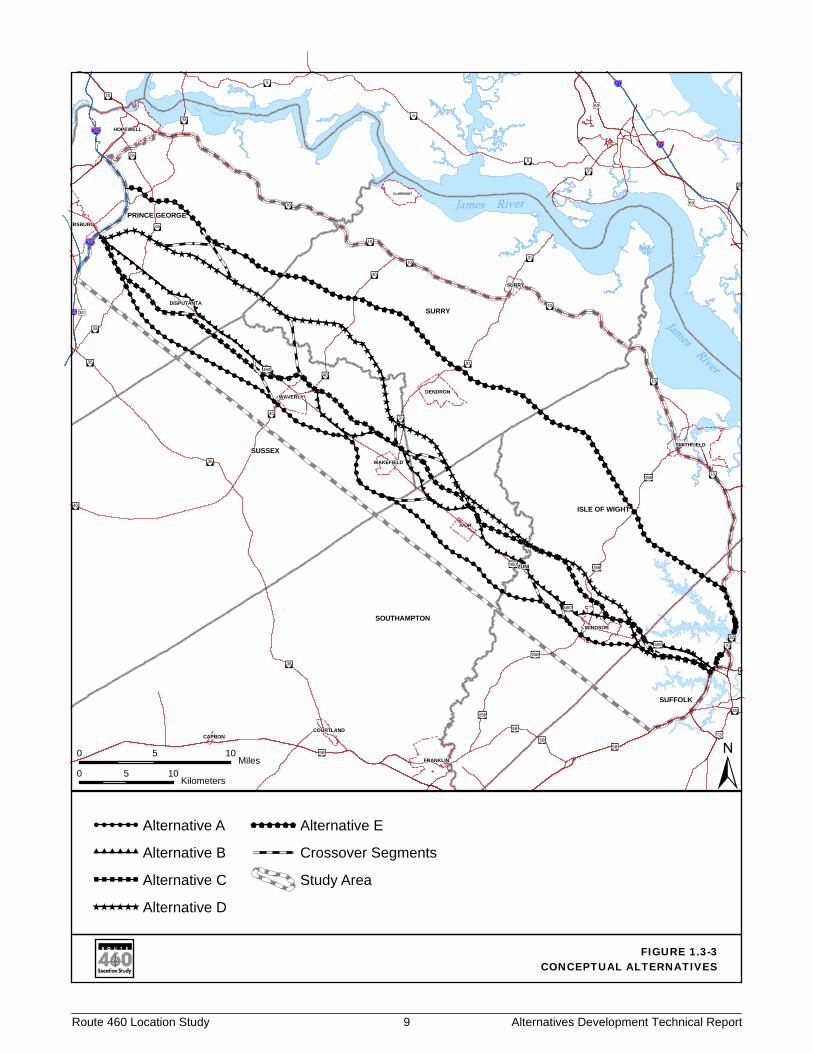
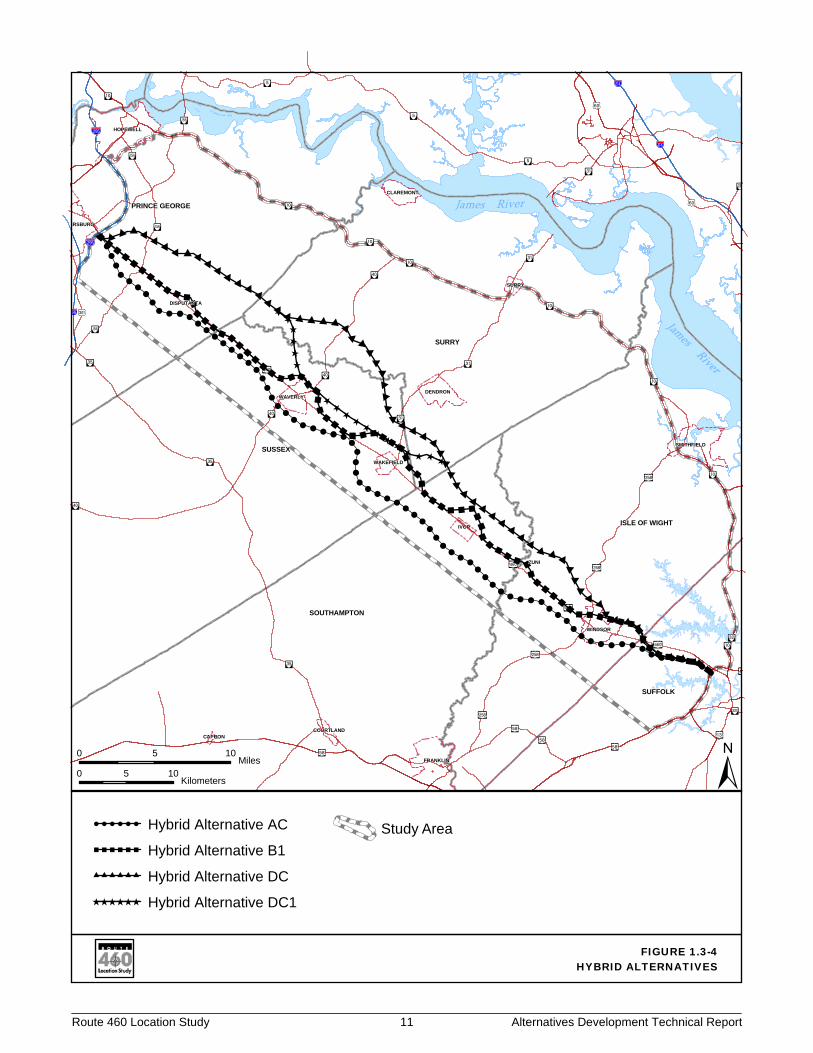
Crossover segments and /or portions of other alternatives were examined to link portions of discrete alternatives. This process led to the addition of four “hybrid” conceptual alternatives (see Figure1.3-4). These hybrid alternatives met the Purpose and Need while reducing impacts to one or more environmental constraints under study. The following list describes these alternatives:
• Hybrid Alternative A+C combines Alternatives A and C. It follows the alignment of Alternative A from Suffolk to Waverly where, from Waverly and Interstate 295, it follows the alignment of Alternative C. This alternative is closer to existing Route 460 and yet has fewer displacements than Alternative A.
• Hybrid Alternative B1 is similar to Alternative B; however east of Windsor it is located on the new alignment south of existing Route 460 (the same alignment as Alternatives A and C). This hybrid alternative was created to reduce the number of potential displacements along the segment of existing Route 460 in Suffolk.
• Hybrid Alternative DC combines Alternatives C and D. It follows the alignment of Alternative C from Suffolk to Windsor, where it shifts to the Alternative D alignment. This alternative reduces impacts to Section 4(f) properties and Agricultural Forestal Districts, and also reduces the wetland impacts of Alternative C. However, because it follows the alignment of Alternative D on the west end, it does not provide convenient access to Waverly and Wakefield.
• Hybrid Alternative DC1 combines Alternatives C and D. The alignment follows Alternative C from Suffolk to Windsor, Alternative D from Windsor to Wakefield, Alternative C from Wakefield to Waverly, and Alternative D from Waverly to Interstate 295. Similar to Alternative DC, it reduces Section 4(f) and Agricultural Forestal impacts, but is closer to existing Route 460 towns such as Wakefield and Waverly.
Both the original and hybrid alternatives were evaluated using nine criteria. Specific commentary on each criterion follows.
(This area left blank intentionally)
James River
James River
I«
Kâ
AÇ
Kâ ?õ?e
?õKØ
KØKâ
?d
?o
?o
Kâ
%&h(
%&h(
Aj
Aj
?õ
?o
?i
?i
?o
!"e$
?d
KØ
KØ
Iv
?õ
?õ
?d
?õ
?õ
Aj
Aj
?õ
IÁ
?i
I«
I«
I«
?î
?î
?î
!"̀$
?d
I²
I²
Aë
Kâ
!"̀$
!!
!!
!!!
!!!
! ! !!!!!!!!!
!!
!
!!!
! ! !! ! !
!!
!!
!!
!!!!!
!!!
!!
!!
!
!!
!! ! !
!!!
!
!! ! ! ! ! !
!! ! ! ! !
!
"""""""""
"""
"""" "
"""""
" " "
"
"
""
"""
" " " ""
"
"
""
""
""
" " """
"
"""
" ""
"""""
" " " " " "
""
""
" " " ""
## ###
### ##
######### # # # ##
#
########
# ###
####
######### ##
###
##
#
# ##
#
## # ##
[[
[[[[
[[
[[[[[[[[[[[[ [
ERSBURG
HOPEWELL
FRANKLIN
SMITHFIELD
DENDRONWAVERLY
CLAREMONT
SURRY
WAKEFIELD
COURTLANDCAPRON
DISPUTANTA
ZUNI
IVOR
WINDSOR
PRINCE GEORGE
SURRY
SUSSEX
SOUTHAMPTON
ISLE OF WIGHT
SUFFOLK
FIGURE 1.3-4HYBRID ALTERNATIVES
0 5 10Miles
0 5 10Kilometers
Study Area
Route 460 Location Study Alternatives Development Technical Report11
±! ! ! ! ! ! Hybrid Alternative AC" " " " " " Hybrid Alternative B1###### Hybrid Alternative DC
[[[[[[ Hybrid Alternative DC1
Route 460 Location Study 12 Alternatives Development Technical Report May 2005
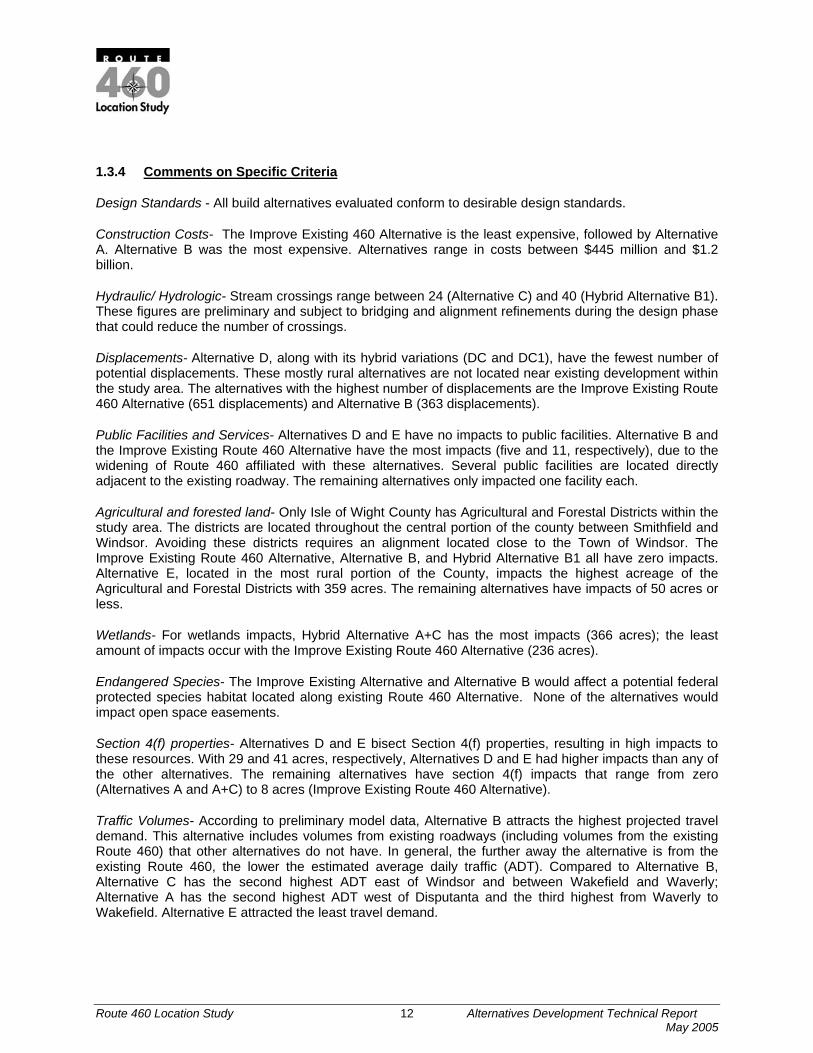
1.3.4 Comments on Specific Criteria
Design Standards - All build alternatives evaluated conform to desirable design standards.
Construction Costs- The Improve Existing 460 Alternative is the least expensive, followed by Alternative A. Alternative B was the most expensive. Alternatives range in costs between $445 million and $1.2 billion.
Hydraulic/ Hydrologic- Stream crossings range between 24 (Alternative C) and 40 (Hybrid Alternative B1). These figures are preliminary and subject to bridging and alignment refinements during the design phase that could reduce the number of crossings.
Displacements- Alternative D, along with its hybrid variations (DC and DC1), have the fewest number of potential displacements. These mostly rural alternatives are not located near existing development within the study area. The alternatives with the highest number of displacements are the Improve Existing Route 460 Alternative (651 displacements) and Alternative B (363 displacements).
Public Facilities and Services- Alternatives D and E have no impacts to public facilities. Alternative B and the Improve Existing Route 460 Alternative have the most impacts (five and 11, respectively), due to the widening of Route 460 affiliated with these alternatives. Several public facilities are located directly adjacent to the existing roadway. The remaining alternatives only impacted one facility each.
Agricultural and forested land- Only Isle of Wight County has Agricultural and Forestal Districts within the study area. The districts are located throughout the central portion of the county between Smithfield and Windsor. Avoiding these districts requires an alignment located close to the Town of Windsor. The Improve Existing Route 460 Alternative, Alternative B, and Hybrid Alternative B1 all have zero impacts. Alternative E, located in the most rural portion of the County, impacts the highest acreage of the Agricultural and Forestal Districts with 359 acres. The remaining alternatives have impacts of 50 acres or less.
Wetlands- For wetlands impacts, Hybrid Alternative A+C has the most impacts (366 acres); the least amount of impacts occur with the Improve Existing Route 460 Alternative (236 acres).
Endangered Species- The Improve Existing Alternative and Alternative B would affect a potential federal protected species habitat located along existing Route 460 Alternative. None of the alternatives would impact open space easements.
Section 4(f) properties- Alternatives D and E bisect Section 4(f) properties, resulting in high impacts to these resources. With 29 and 41 acres, respectively, Alternatives D and E had higher impacts than any of the other alternatives. The remaining alternatives have section 4(f) impacts that range from zero (Alternatives A and A+C) to 8 acres (Improve Existing Route 460 Alternative).
Traffic Volumes- According to preliminary model data, Alternative B attracts the highest projected travel demand. This alternative includes volumes from existing roadways (including volumes from the existing Route 460) that other alternatives do not have. In general, the further away the alternative is from the existing Route 460, the lower the estimated average daily traffic (ADT). Compared to Alternative B, Alternative C has the second highest ADT east of Windsor and between Wakefield and Waverly; Alternative A has the second highest ADT west of Disputanta and the third highest from Waverly to Wakefield. Alternative E attracted the least travel demand.
Route 460 Location Study 13 Alternatives Development Technical Report May 2005
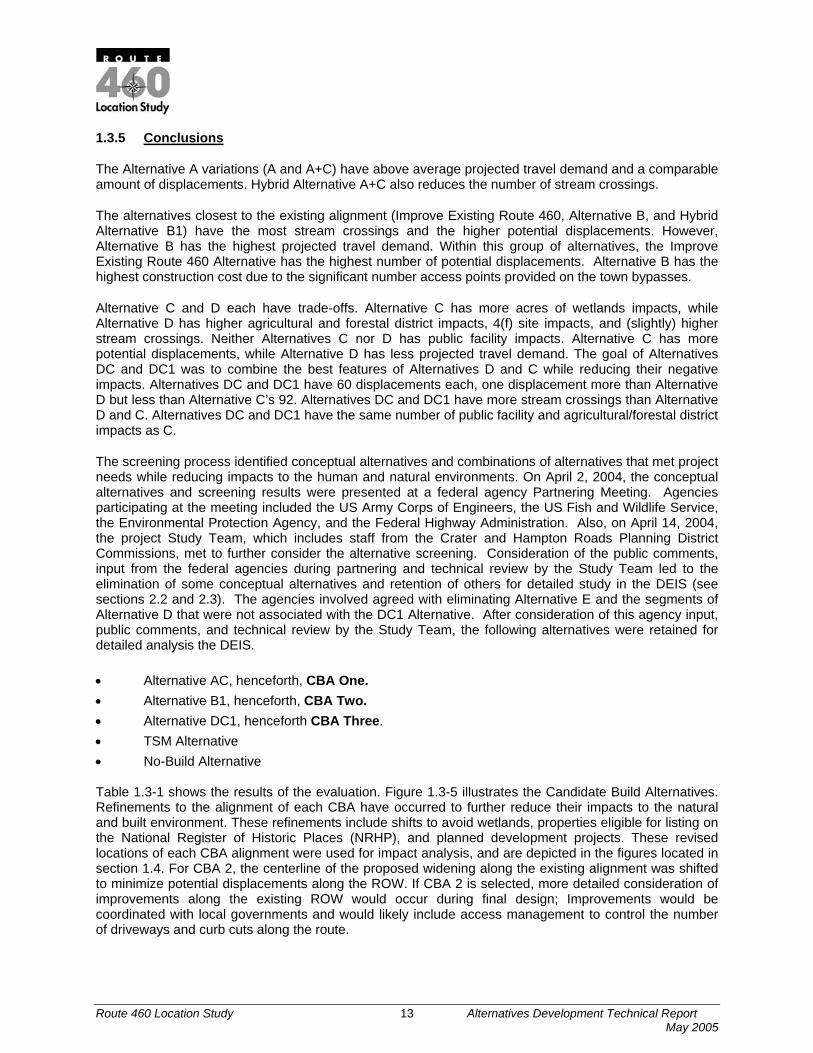
1.3.5 Conclusions
The Alternative A variations (A and A+C) have above average projected travel demand and a comparable amount of displacements. Hybrid Alternative A+C also reduces the number of stream crossings.
The alternatives closest to the existing alignment (Improve Existing Route 460, Alternative B, and Hybrid Alternative B1) have the most stream crossings and the higher potential displacements. However, Alternative B has the highest projected travel demand. Within this group of alternatives, the Improve Existing Route 460 Alternative has the highest number of potential displacements. Alternative B has the highest construction cost due to the significant number access points provided on the town bypasses.
Alternative C and D each have trade-offs. Alternative C has more acres of wetlands impacts, while Alternative D has higher agricultural and forestal district impacts, 4(f) site impacts, and (slightly) higher stream crossings. Neither Alternatives C nor D has public facility impacts. Alternative C has more potential displacements, while Alternative D has less projected travel demand. The goal of Alternatives DC and DC1 was to combine the best features of Alternatives D and C while reducing their negative impacts. Alternatives DC and DC1 have 60 displacements each, one displacement more than Alternative D but less than Alternative C’s 92. Alternatives DC and DC1 have more stream crossings than Alternative D and C. Alternatives DC and DC1 have the same number of public facility and agricultural/forestal district impacts as C.
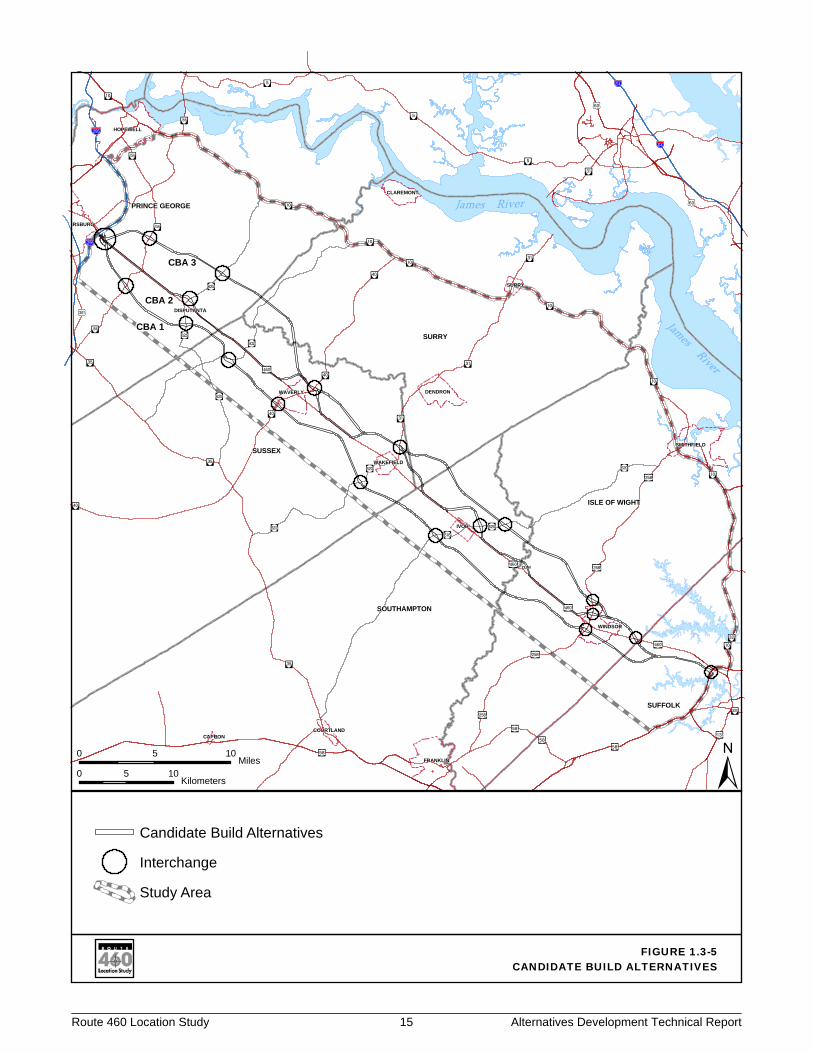
The screening process identified conceptual alternatives and combinations of alternatives that met project needs while reducing impacts to the human and natural environments. On April 2, 2004, the conceptual alternatives and screening results were presented at a federal agency Partnering Meeting. Agencies participating at the meeting included the US Army Corps of Engineers, the US Fish and Wildlife Service, the Environmental Protection Agency, and the Federal Highway Administration. Also, on April 14, 2004, the project Study Team, which includes staff from the Crater and Hampton Roads Planning District Commissions, met to further consider the alternative screening. Consideration of the public comments, input from the federal agencies during partnering and technical review by the Study Team led to the elimination of some conceptual alternatives and retention of others for detailed study in the DEIS (see sections 2.2 and 2.3). The agencies involved agreed with eliminating Alternative E and the segments of Alternative D that were not associated with the DC1 Alternative. After consideration of this agency input, public comments, and technical review by the Study Team, the following alternatives were retained for detailed analysis the DEIS. • Alternative AC, henceforth, CBA One. • Alternative B1, henceforth, CBA Two. • Alternative DC1, henceforth CBA Three. • TSM Alternative • No-Build Alternative Table 1.3-1 shows the results of the evaluation. Figure 1.3-5 illustrates the Candidate Build Alternatives. Refinements to the alignment of each CBA have occurred to further reduce their impacts to the natural and built environment. These refinements include shifts to avoid wetlands, properties eligible for listing on the National Register of Historic Places (NRHP), and planned development projects. These revised locations of each CBA alignment were used for impact analysis, and are depicted in the figures located in section 1.4. For CBA 2, the centerline of the proposed widening along the existing alignment was shifted to minimize potential displacements along the ROW. If CBA 2 is selected, more detailed consideration of improvements along the existing ROW would occur during final design; Improvements would be coordinated with local governments and would likely include access management to control the number of driveways and curb cuts along the route.
Route 460 Location 14 Alternatives Development Technical Report May 2005
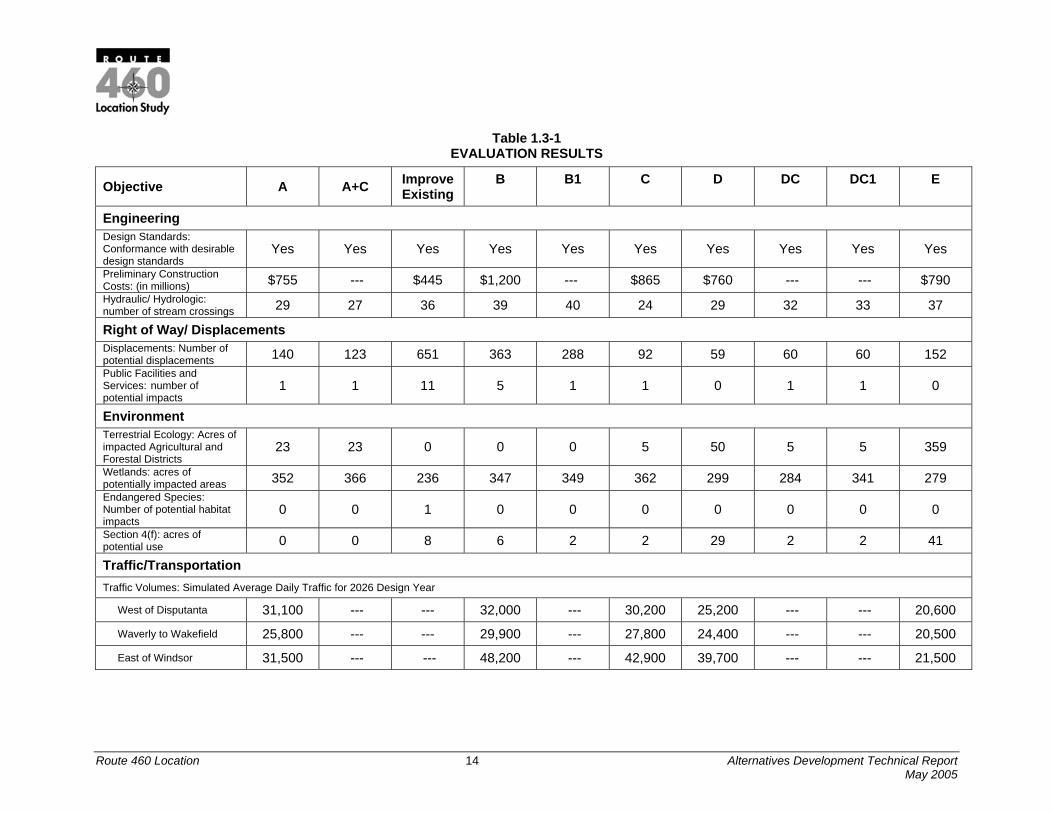
Table 1.3-1 EVALUATION RESULTS
Objective A A+C Improve Existing
B B1 C D DC DC1 E
Engineering Design Standards: Conformance with desirable design standards
Yes Yes Yes Yes Yes Yes Yes Yes Yes Yes
Preliminary Construction Costs: (in millions) $755 --- $445 $1,200 --- $865 $760 --- --- $790 Hydraulic/ Hydrologic: number of stream crossings 29 27 36 39 40 24 29 32 33 37
Right of Way/ Displacements Displacements: Number of potential displacements 140 123 651 363 288 92 59 60 60 152 Public Facilities and Services: number of potential impacts
1 1 11 5 1 1 0 1 1 0
Environment Terrestrial Ecology: Acres of impacted Agricultural and Forestal Districts
23 23 0 0 0 5 50 5 5 359
Wetlands: acres of potentially impacted areas 352 366 236 347 349 362 299 284 341 279 Endangered Species: Number of potential habitat impacts
0 0 1 0 0 0 0 0 0 0
Section 4(f): acres of potential use 0 0 8 6 2 2 29 2 2 41
Traffic/Transportation Traffic Volumes: Simulated Average Daily Traffic for 2026 Design Year
West of Disputanta 31,100 --- --- 32,000 --- 30,200 25,200 --- --- 20,600
Waverly to Wakefield 25,800 --- --- 29,900 --- 27,800 24,400 --- --- 20,500
East of Windsor 31,500 --- --- 48,200 --- 42,900 39,700 --- --- 21,500
James River
James River
I«
AÇ
Kâ ?õ?e
?õKØ
KØKâ
?t?p
?d
?o
?o
Kâ
%&h(
%&h(
Aj
Aj
?õ
?o
?i
?i
?y
?y
?y
?b
?o
?v
?t
?d
KØ
KØ
Iv
?õ
?t
?õ
?d
?õ
?õ
Aj
Aj
?õ
IÁ
?i
I«
I«
I«
?î
?î
?î
!"̀$
?d
I²
I²
Kâ
!"̀$
CBA 1
CBA 2
CBA 3
ERSBURG
HOPEWELL
FRANKLIN
SMITHFIELD
DENDRONWAVERLY
CLAREMONT
SURRY
WAKEFIELD
COURTLANDCAPRON
DISPUTANTA
IVOR
ZUNI
WINDSOR
PRINCE GEORGE
SURRY
SUSSEX
SOUTHAMPTON
ISLE OF WIGHT
SUFFOLK
FIGURE 1.3-5CANDIDATE BUILD ALTERNATIVES
0 5 10Miles
0 5 10Kilometers ±
Route 460 Location Study 15 Alternatives Development Technical Report
Candidate Build Alternatives
Study Area
Interchange
Route 460 Location Study 16 Alternatives Development Technical Report May 2005
1.4 CBA ALIGNMENT SHIFTS
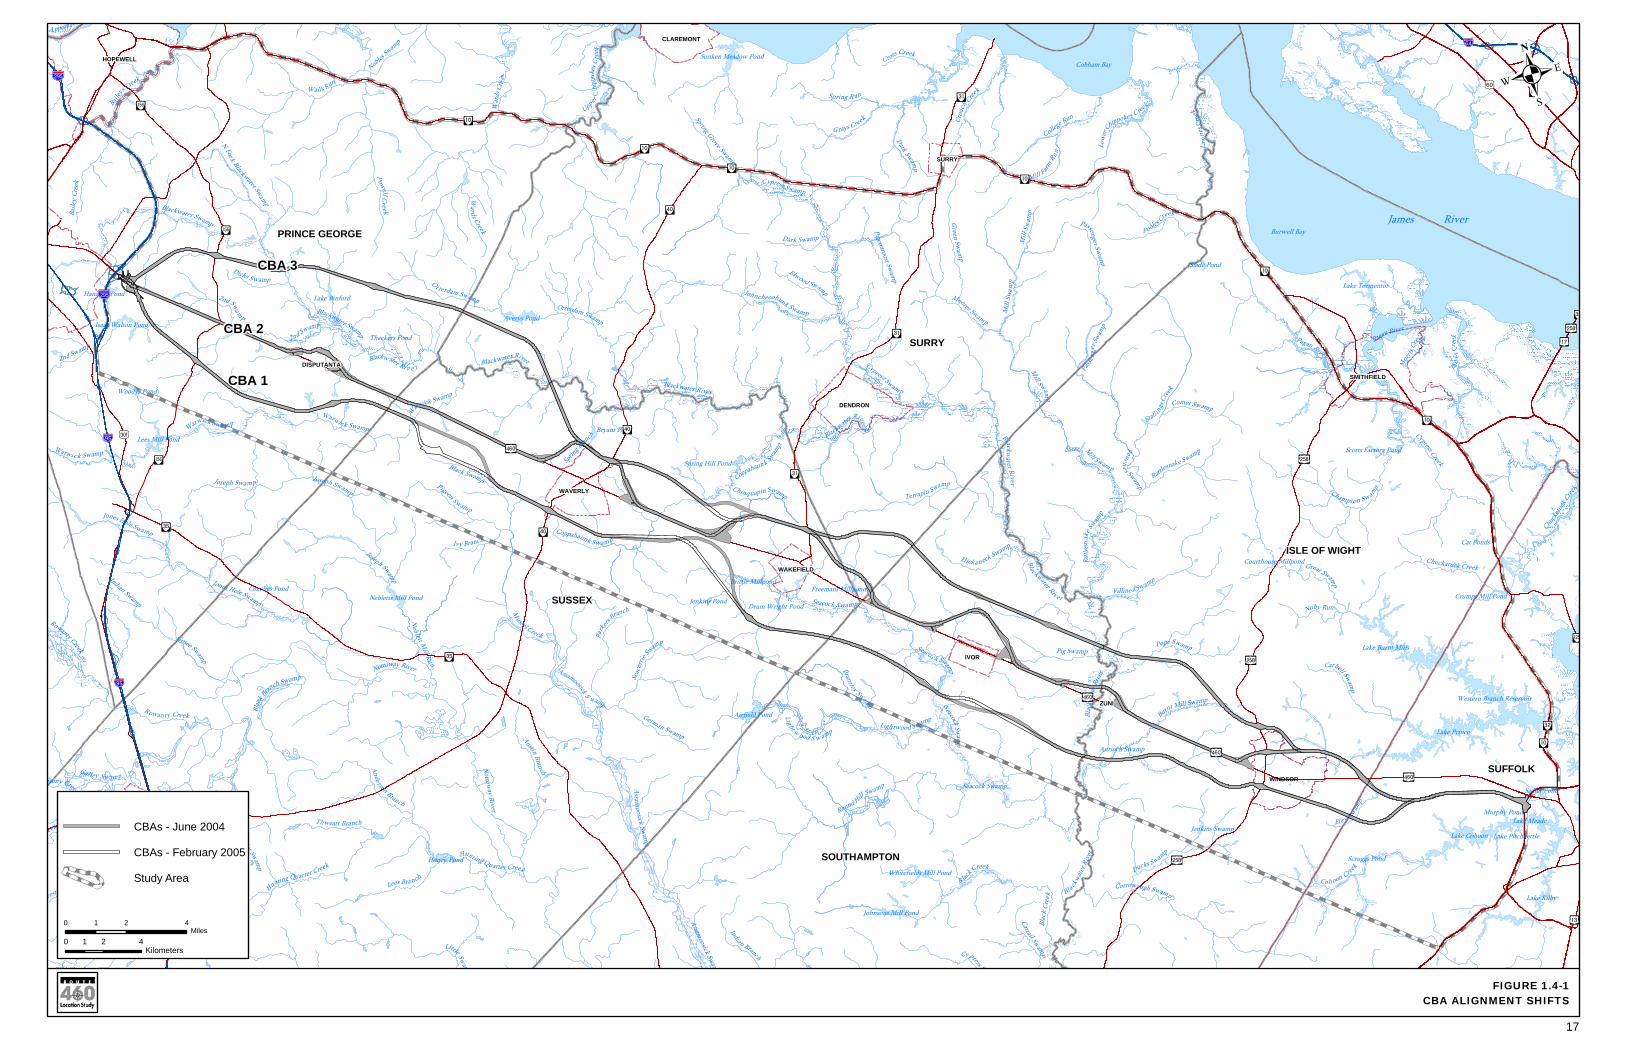
After the CBA alignments were determined for futures analysis, adjustments were made to minimize or eliminate major impacts. These shifts to the alignments, shown in Figure 1.4-1 avoided direct taking of cultural resources as defined under Section 4(f) of the regulations of the U.S. Department of Transportation (USDOT) Act of 1966. These shifts also reduced if not eliminated the impact to threatened or endangered species and natural resources.
For all CBAs, the alignment at the western terminus (the interchange with Interstate 295 in Prince George County) was modified to reduce its footprint. The preliminary footprint was so large that it impacted the Sacred Heart Church, which is a 4(f) property, a planned Norfolk Southern intermodal facility (refer to Section 4.19 of the Route 460 Location Study or Section 15.4 of the Indirect and Cumulative Technical Report); and a proposed Truck Service Plaza. The revised footprint reduced the amount of land necessary for the interchanges and access roads to eliminate the impact to the Church. Access roads were also rerouted so as to not conflict with the future Norfolk Southern facility or the truck service plaza.
There were five affected areas along the preliminary version of CBA 1 that were addressed. The first two were historic resources. The Pulley Farm and Parker House are located in Southampton and Sussex Counties, respectively; Both are NRHP-eligible architectural resources (refer to the Cultural Resources section in Chapter Four for more information). Sensitive threatened and endangers species, such as the Red Cockheaded Woodpecker, reside in Sussex County approximately southeast of Waverly and west of Wakefield. The alignment shift in eastern Sussex County accommodates the Red Cockheaded Woodpecker and the Parker House architectural resource. The shift in western Sussex County was made to accommodate a new interchange at Route 602 and the proposed power plant.
In the original version of CBA 2, the alignment contained large footprints where the CBA separated from the existing 460 onto a bypass. These footprints were large enough to accommodate grade-separated interchanges. The decision to allow only at-grade interchanges with the CBA 2 option nullified the necessary for the large footprints, and in turn those footprints were reduced. Along the Wakefield bypass, northwest of the Town of Wakefield, a portion of the original CBA 2 clips off a portion of the Woodland property. The revised CBA 2 contains a new curve that bypasses the entire property.
The original CBA 3 bisected the Woodland property. The improved CBA 3 contains a new curve to bypass the property.
(This area left blank intentionally)
James RiverBurwell Bay
Cobham Bay
Pagan River
Western Branch Reservoir
Lake Prince
Lake Burnt Mills
Lake Cohoon
Lake Meade
Lake Kilby
Averys Pond
Airfield Pond
Lees Mill Pond
Sunken Meadow Pond
Honey Pond
Lake Tormentor
Johnsons Mill Pond
Nebletts Mill Pond
Isaac Walton Pond
Brittle Millpond
Spring Hill Pond
Whitefields Mill Pond
Lake Binford
Bryant Pond
Jenkins Swamp
Sadler Pond
Crumps Mill Pond
Hanzliks Pond
Freemans Millpond
Woodys Pond
Jenkins Pond
Scruggs Pond
Thackers Pond
Scotts Factory Pond
Slade Pond
Drum Wright Pond
Couches Pond
Cat Ponds
Murphy Pond
Courthouse Millpond
Lake Pitchkettle
Rack Creek
Antioch Swamp
Seacock Swamp
Notto
way River
Mill
Sw
amp
Joseph Swamp
Cypress Swam p
Blackwater River
Blackwate
r River
2nd Swamp
Blackwater Swamp
Blackwater Swamp
Blackw ater Ri v e r
Warwick Swamp
Joseph SwampJoseph Swamp
Coppahaunk Swam p
Seacock S wamp
Seaco ck Swamp
Light w ood S w amp
Rattl
esna
ke Sw
am
p
Pouche s Swam
p
Blackwater RiverM
ill Swamp
Mill Swamp
Mill
Sw
amp
Passe
nger
Swam
p
Upper
Chi
ppok
es C
reek
Low
er
Chippokes C
reek
Law
nes C
reek
Pagan Riv er
Cypress Creek
Ja
nes
Cre
ek
Chuck
atuck
Cre
ek
Carbell Swam
p
Assamoosick Sw
am
Assam
oosick Swam
p
Nottow
ay River
Nottoway River
Jones Hole Swamp
Rowanty Creek
Warwi ck Swamp
Warw
ick Swamp
Sprin
g Bran
ch
Blackwater River
Coppahaunk Swam
p
Black Swamp
Chuckatuck Creek
El ey S wam
p
Blackw
ater
Riv
erBl
ackw
ater
Riv
er
2nd Swamp
Mussel Creek
Seacock Swam
p
Powell Creek
College Run
Stalli n
gs C
reek
Green Sw
amp
Passenger Swam
p
Stony Creek
Terrapin SwampW
ards
Cre
ek
G rays Creek
Round Hill Swamp
Seac
orrie
Sw
amp
west Swam p
Austin Branch
Moores Swamp
Crou
ch C
re
ek
Pope Swamp
Pigeon Swamp
Hunting Quarter Creek
Blac
k Cr
eek
Ande rson Branch
Cabin Point Swamp
Great Swamp
Champion Sw amp
P ooles
Creek
Lees Bra nch
Spring R un
Burnt Mill Swamp
German Swamp
Rowan ty Creek
reek
Johnchecohunk Swamp
Corrowaugh Swamp
Dark Swamp
Pa
rkers
Branch
Rattlesnake Swamp
Villine s Swamp
Ivy Branch
Ot terdam Swamp
Brantley Swamp
Elwood Swamp
Islan
d Swam
p
Cattail Swamp
Nuby Run
Indian Branch
Jones Hole Swamp
Assamoosick S wamp
Neb lett M
ill Run
Little Swam
Pig Swamp
Dicks S wamp
Warwick Swa mp
Thweatt Branch
Blac
k Bran
ch Swamp
Ducks Swamp
Hicka neck Swamp
Coh oon Creek
Spring Grove Swamp
Bailey
s Cree
k
B lackwater River
Lightwood Swamp
Comet Swamp
Gal ley Swamp
Baile
y Cr
eek
M
orris
Cree
k
N For k Blackwater Swamp
eek
A ppomatt
Mill F
arm R
un
Chinq uapin Swamp
Cross Creek
Indian Swamp
Nobles
Swam
p
Gosee Swamp
Pigeonroost Swam
p
Cypress Swamp
Hunting Quarter Creek
Wall s Run
Dark Swamp
B lac
k Creek
Otterdam Swamp
Wards Creek
2nd Swamp
Cypress S
Kâ
?õ
?e
Aè
IzKØ
?e
?õ
KØ
KØ
Kâ
?d
?o
?o
Kâ
%&h(
%&h(
Aj
Aj
?õ
?o
?i
?i
?o
!"e$
!"e$
!"e$
?d
KØ
Iv
?õ
?õ
?d
?õ
?õ
Aj
IÁ
IÁ
I²Aü
!"̀$
Kâ
HOPEWELL
SMITHFIELD
WINDSOR
DENDRON
WAVERLY
CLAREMONT
IVOR
SURRY
WAKEFIELD
STONY CREEK
ZUNI
DISPUTANTA
PRINCE GEORGE
SURRY
SUSSEX
SOUTHAMPTON
ISLE OF WIGHT
SUFFOLK
CBA 1
CBA 2
CBA 3
17
FIGURE 1.4-1CBA ALIGNMENT SHIFTS
0 2 41Miles
0 2 41Kilometers
.
CBAs - June 2004
CBAs - February 2005
Study Area

Route 460 Location Study 18 Alternatives Development Technical Report May 2005
1.5 COST ESTIMATE
1.5.1 Methodology for the Preliminary Cost Estimate
The preliminary cost estimate shown as part of Table 1.3-1 is derived from a simple calculation of roadway multiplied by an average cost of development of a four-lane highway per mile. The variable changes depending on the type of roadway built. Roadways can either be at-grade, below-grade (tunneled), or above grade (on a bridge, viaduct, or aerial). The least-expensive variable would be portions of the roadway at grade, then above-grave, and finally the below-grade would be the most expensive. For this Location Study, no option has a below grade alignment. The preliminary cost estimates assumed larger wetland impacts that what was determined at the subsequent cost estimate. As a mitigation matter, these wetland crossings were bridged. The higher per-mile cost of the bridges contributed to the higher preliminary cost estimates.
1.5.2 Methodology for TSM Alternative
The TSM Alternative includes minor upgrades to the existing Route 460. For purposes of the cost estimate, four intersections are improved with additional turning lanes, one intersection with light beacons, and one intersection with warning lights and/or rumble strips, and
1.5.3 Methodology for Conceptual Build Alternatives
The methodology for the final cost estimate shown in Table 1.5-1 is based on VDOT standards. A software program based on VDOT methodology, named the Project Cost Estimating System (PCES) was used to calculate the each CBA’s base construction and bridge costs. This section explains the methodology and how the PCES applies it.
The PCES Worksheet has various drop-down and fill-in boxes to enter project related data. Some of the project information entered that influenced the estimates included: Geometric Standard, Design Speed, Total Length (adding or building four lanes), Total Length (building ramps and loops), and Median Type. There was a lump sum cost for large drainage structures, such as box culverts, storm water management basins and large or unusual drainage facilities. Also included in the worksheet was a lump sum adjustment for unusual construction costs, for example: wetland mitigation sites, landscaping, retaining walls, lighting, etc.
Once all the project data and lump sum items were entered, the worksheet calculated the base construction estimate for the project, which is a total of the roadway construction based on today’s cost. This cost does include contingencies but not construction engineering. The construction engineering is based on a percentage of the base construction estimate with the percentages coming from historic data from completed projects.
Cost estimates for the bridges were calculated on a separate worksheet in PCES, with the cost per square foot based on closed out projects. In addition to the square foot cost, the bridge location and construction complexity applies a cost factor in determining the final construction cost of the proposed bridge. The geometry and type of structure were two of the items used to determine a bridge’s complexity. Other factors considered were construction over bodies of water, skew greater than 45 degrees, erection over traffic, and longer spans and pile lengths. Once the complexity was determined, the bridge’s length, width and percentage of the preliminary engineering work to be outsourced (assumed
Route 460 Location Study 19 Alternatives Development Technical Report May 2005
50%) were entered into the worksheet and the bridge construction cost was computed. The bridge construction engineering was also populated based on a percentage of the construction cost.
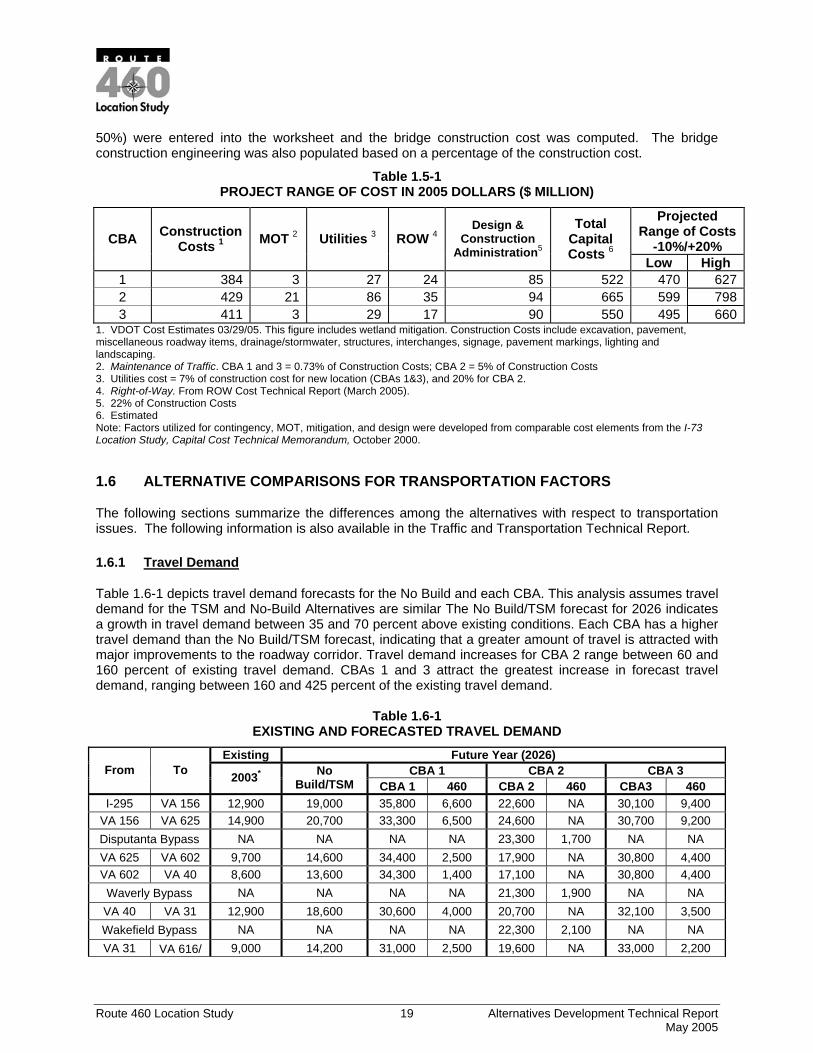
Table 1.5-1 PROJECT RANGE OF COST IN 2005 DOLLARS ($ MILLION)
Projected Range of Costs
-10%/+20% CBA Construction Costs 1 MOT 2 Utilities 3 ROW 4
Design & Construction
Administration5
Total Capital Costs 6 Low High
1 384 3 27 24 85 522 470 6272 429 21 86 35 94 665 599 7983 411 3 29 17 90 550 495 660
1. VDOT Cost Estimates 03/29/05. This figure includes wetland mitigation. Construction Costs include excavation, pavement, miscellaneous roadway items, drainage/stormwater, structures, interchanges, signage, pavement markings, lighting and landscaping. 2. Maintenance of Traffic. CBA 1 and 3 = 0.73% of Construction Costs; CBA 2 = 5% of Construction Costs 3. Utilities cost = 7% of construction cost for new location (CBAs 1&3), and 20% for CBA 2. 4. Right-of-Way. From ROW Cost Technical Report (March 2005). 5. 22% of Construction Costs 6. Estimated Note: Factors utilized for contingency, MOT, mitigation, and design were developed from comparable cost elements from the I-73 Location Study, Capital Cost Technical Memorandum, October 2000.
1.6 ALTERNATIVE COMPARISONS FOR TRANSPORTATION FACTORS
The following sections summarize the differences among the alternatives with respect to transportation issues. The following information is also available in the Traffic and Transportation Technical Report.
1.6.1 Travel Demand
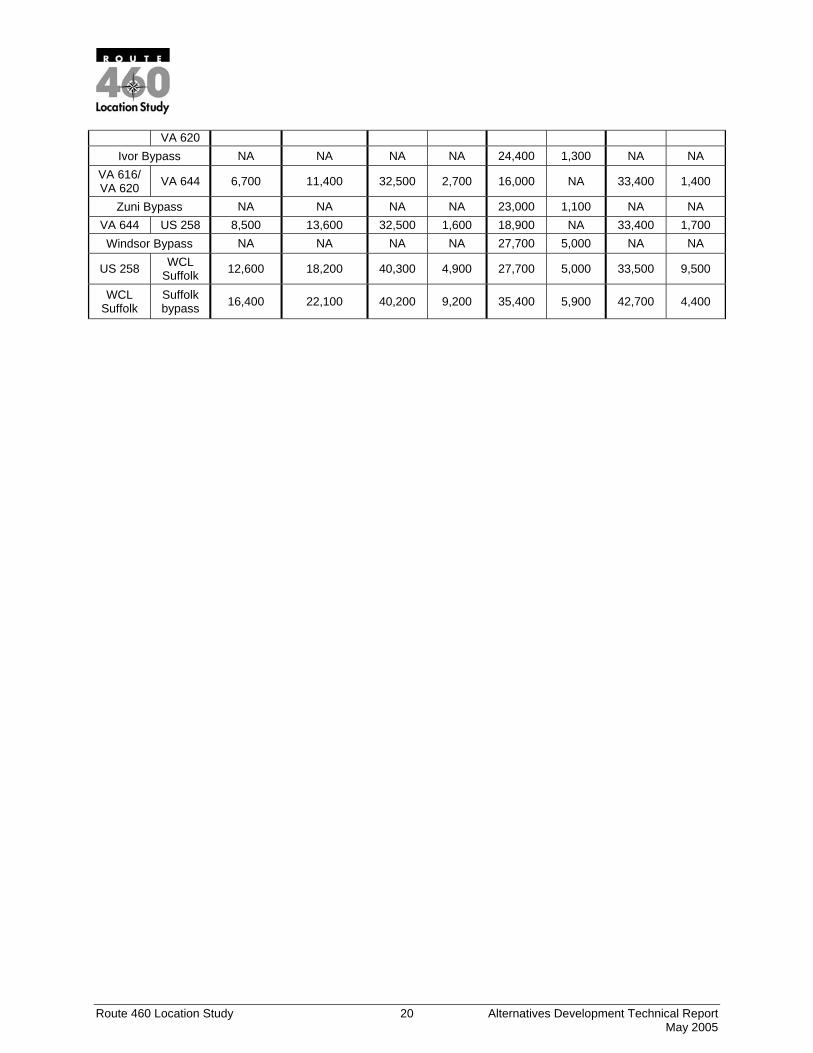
Table 1.6-1 depicts travel demand forecasts for the No Build and each CBA. This analysis assumes travel demand for the TSM and No-Build Alternatives are similar The No Build/TSM forecast for 2026 indicates a growth in travel demand between 35 and 70 percent above existing conditions. Each CBA has a higher travel demand than the No Build/TSM forecast, indicating that a greater amount of travel is attracted with major improvements to the roadway corridor. Travel demand increases for CBA 2 range between 60 and 160 percent of existing travel demand. CBAs 1 and 3 attract the greatest increase in forecast travel demand, ranging between 160 and 425 percent of the existing travel demand.
Table 1.6-1 EXISTING AND FORECASTED TRAVEL DEMAND
Existing Future Year (2026) CBA 1 CBA 2 CBA 3 From To 2003* No
Build/TSM CBA 1 460 CBA 2 460 CBA3 460 I-295 VA 156 12,900 19,000 35,800 6,600 22,600 NA 30,100 9,400
VA 156 VA 625 14,900 20,700 33,300 6,500 24,600 NA 30,700 9,200 Disputanta Bypass NA NA NA NA 23,300 1,700 NA NA VA 625 VA 602 9,700 14,600 34,400 2,500 17,900 NA 30,800 4,400 VA 602 VA 40 8,600 13,600 34,300 1,400 17,100 NA 30,800 4,400 Waverly Bypass NA NA NA NA 21,300 1,900 NA NA VA 40 VA 31 12,900 18,600 30,600 4,000 20,700 NA 32,100 3,500 Wakefield Bypass NA NA NA NA 22,300 2,100 NA NA VA 31 VA 616/ 9,000 14,200 31,000 2,500 19,600 NA 33,000 2,200
Route 460 Location Study 20 Alternatives Development Technical Report May 2005
VA 620 Ivor Bypass NA NA NA NA 24,400 1,300 NA NA
VA 616/ VA 620 VA 644 6,700 11,400 32,500 2,700 16,000 NA 33,400 1,400
Zuni Bypass NA NA NA NA 23,000 1,100 NA NA VA 644 US 258 8,500 13,600 32,500 1,600 18,900 NA 33,400 1,700 Windsor Bypass NA NA NA NA 27,700 5,000 NA NA
US 258 WCL Suffolk 12,600 18,200 40,300 4,900 27,700 5,000 33,500 9,500
WCL Suffolk
Suffolk bypass 16,400 22,100 40,200 9,200 35,400 5,900 42,700 4,400
Route 460 Location Study 21 Alternatives Development Technical Report May 2005
1.6.2 Roadway Capacity
The existing Route 460 is a four-lane undivided rural principal arterial. The No Build and TSM Alternatives do not increase through roadway capacity in the study area. CBAs 1 and 3 add four new travel lanes (two per direction) between Suffolk and Petersburg. Also, since CBAs 1 and 3 are proposed as limited access facilities, they would have more vehicular capacity than similar four-lane facilities lacking access control. Limited access facilities may carry up to 2,400 vehicles per hour per lane in uncongested conditions (ITE, 1999). For a four-lane facility such as proposed for CBAs 1 and 3, this equals the capacity to move over 100,000 vehicles per day per direction. CBA 2 adds bypasses to five of the communities along Route 460, thereby increasing capacity (at those locations) over the No Build alternative. CBA 2 also provides a new limited access alignment between the Route 58 bypass in Suffolk and Windsor, increasing capacity in this area. However, the capacity increase of CBA 2 is considerably less than for CBA 1 and 3 because west of Windsor CBA 2 uses the same alignment as existing Route 460 (other than the new bypasses).
1.6.3 Level of Service (LOS)
Level of Service (LOS) measures how well traffic operates on the roadway. At intersections, LOS is a measure of the travel delay attributed to the traffic control devices (traffic signals). Along roadway segments, LOS is a measure of the roadway’s ability to accommodate free-flowing traffic.
1.6.3.1 Intersection LOS
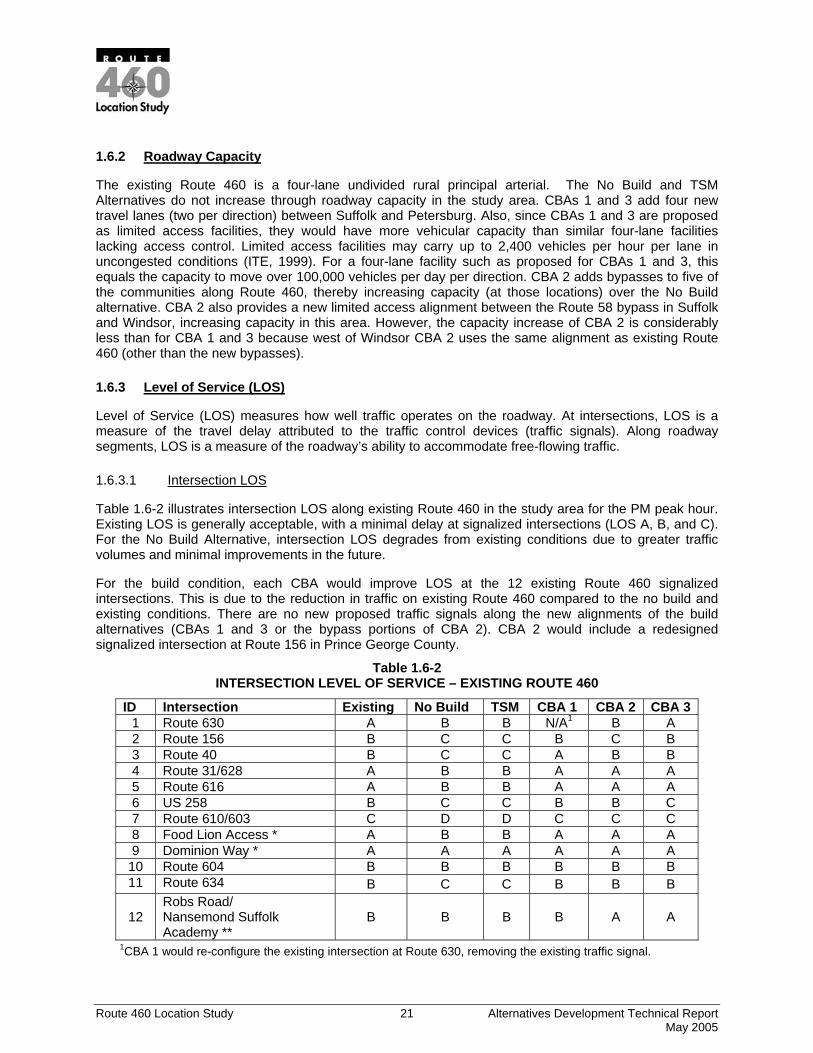
Table 1.6-2 illustrates intersection LOS along existing Route 460 in the study area for the PM peak hour. Existing LOS is generally acceptable, with a minimal delay at signalized intersections (LOS A, B, and C). For the No Build Alternative, intersection LOS degrades from existing conditions due to greater traffic volumes and minimal improvements in the future.
For the build condition, each CBA would improve LOS at the 12 existing Route 460 signalized intersections. This is due to the reduction in traffic on existing Route 460 compared to the no build and existing conditions. There are no new proposed traffic signals along the new alignments of the build alternatives (CBAs 1 and 3 or the bypass portions of CBA 2). CBA 2 would include a redesigned signalized intersection at Route 156 in Prince George County.
Table 1.6-2 INTERSECTION LEVEL OF SERVICE – EXISTING ROUTE 460
ID Intersection Existing No Build TSM CBA 1 CBA 2 CBA 31 Route 630 A B B N/A1 B A 2 Route 156 B C C B C B 3 Route 40 B C C A B B 4 Route 31/628 A B B A A A 5 Route 616 A B B A A A 6 US 258 B C C B B C 7 Route 610/603 C D D C C C 8 Food Lion Access * A B B A A A 9 Dominion Way * A A A A A A
10 Route 604 B B B B B B 11 Route 634 B C C B B B
12 Robs Road/ Nansemond Suffolk Academy **
B B B B A A
1CBA 1 would re-configure the existing intersection at Route 630, removing the existing traffic signal.
Route 460 Location Study 22 Alternatives Development Technical Report May 2005
1.6.3.2 Roadway LOS
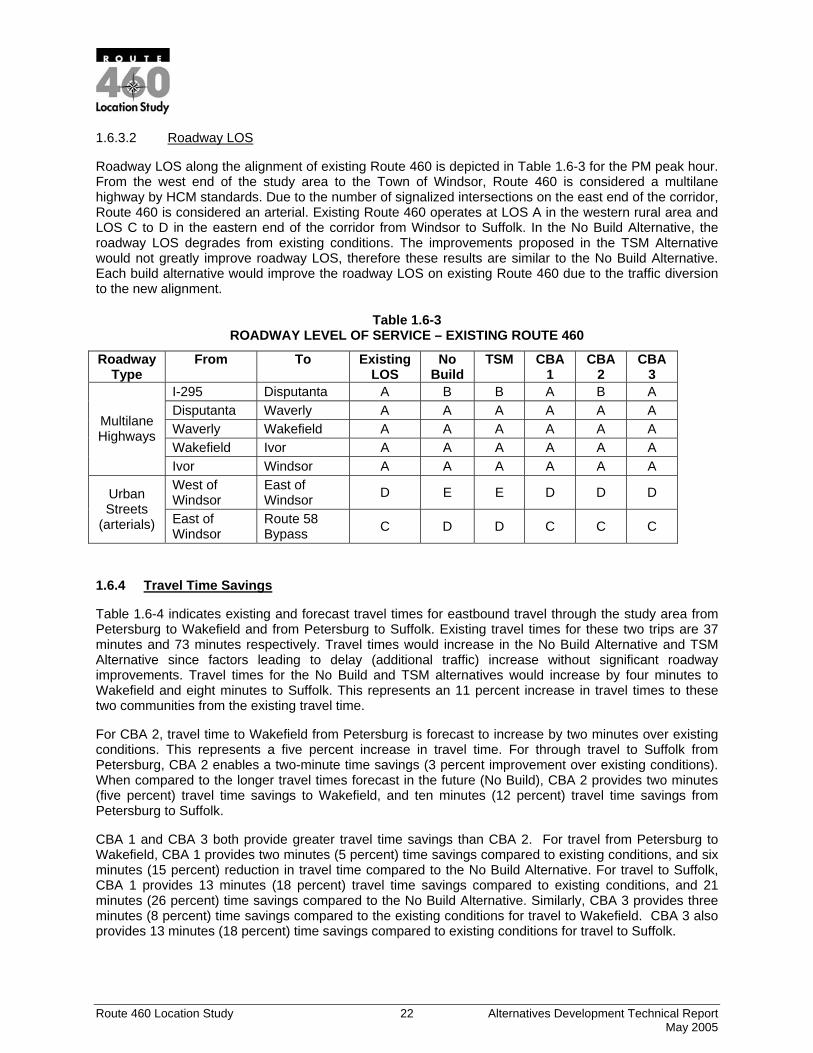
Roadway LOS along the alignment of existing Route 460 is depicted in Table 1.6-3 for the PM peak hour. From the west end of the study area to the Town of Windsor, Route 460 is considered a multilane highway by HCM standards. Due to the number of signalized intersections on the east end of the corridor, Route 460 is considered an arterial. Existing Route 460 operates at LOS A in the western rural area and LOS C to D in the eastern end of the corridor from Windsor to Suffolk. In the No Build Alternative, the roadway LOS degrades from existing conditions. The improvements proposed in the TSM Alternative would not greatly improve roadway LOS, therefore these results are similar to the No Build Alternative. Each build alternative would improve the roadway LOS on existing Route 460 due to the traffic diversion to the new alignment.
Table 1.6-3 ROADWAY LEVEL OF SERVICE – EXISTING ROUTE 460
Roadway Type
From To Existing LOS
No Build
TSM CBA 1
CBA 2
CBA 3
I-295 Disputanta A B B A B A Disputanta Waverly A A A A A A Waverly Wakefield A A A A A A Wakefield Ivor A A A A A A
Multilane Highways
Ivor Windsor A A A A A A West of Windsor
East of Windsor D E E D D D Urban
Streets (arterials) East of
Windsor Route 58 Bypass C D D C C C
1.6.4 Travel Time Savings
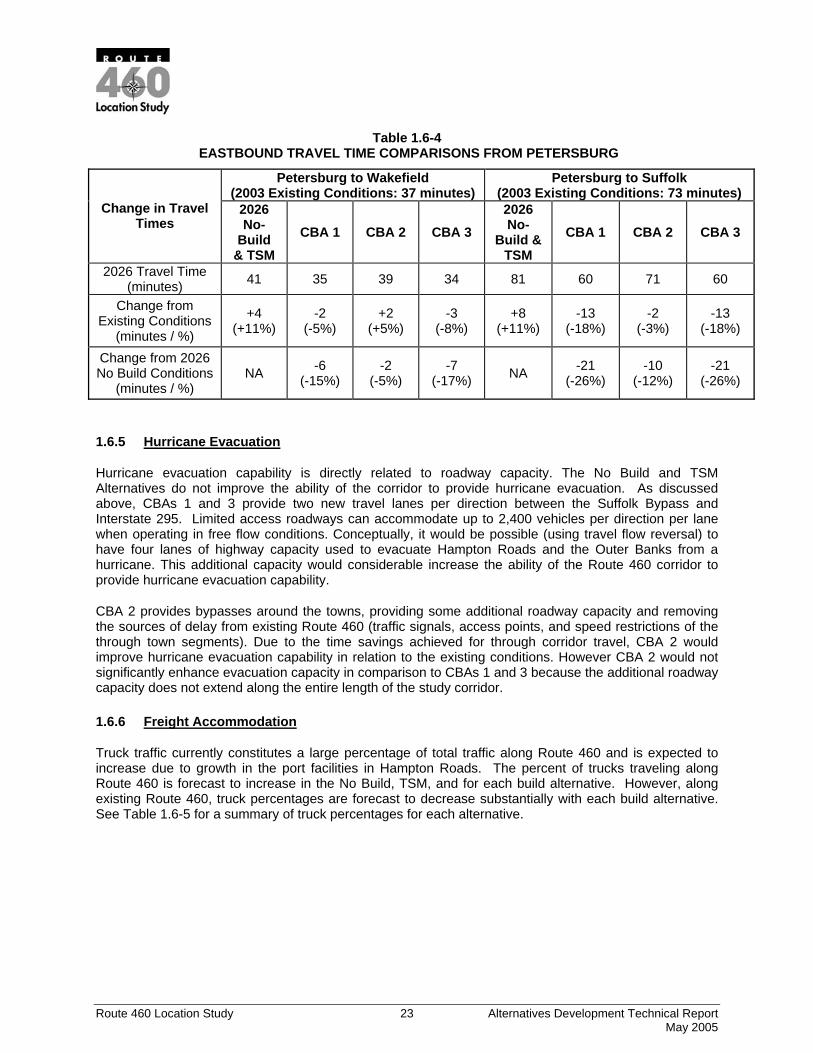
Table 1.6-4 indicates existing and forecast travel times for eastbound travel through the study area from Petersburg to Wakefield and from Petersburg to Suffolk. Existing travel times for these two trips are 37 minutes and 73 minutes respectively. Travel times would increase in the No Build Alternative and TSM Alternative since factors leading to delay (additional traffic) increase without significant roadway improvements. Travel times for the No Build and TSM alternatives would increase by four minutes to Wakefield and eight minutes to Suffolk. This represents an 11 percent increase in travel times to these two communities from the existing travel time.
For CBA 2, travel time to Wakefield from Petersburg is forecast to increase by two minutes over existing conditions. This represents a five percent increase in travel time. For through travel to Suffolk from Petersburg, CBA 2 enables a two-minute time savings (3 percent improvement over existing conditions). When compared to the longer travel times forecast in the future (No Build), CBA 2 provides two minutes (five percent) travel time savings to Wakefield, and ten minutes (12 percent) travel time savings from Petersburg to Suffolk.
CBA 1 and CBA 3 both provide greater travel time savings than CBA 2. For travel from Petersburg to Wakefield, CBA 1 provides two minutes (5 percent) time savings compared to existing conditions, and six minutes (15 percent) reduction in travel time compared to the No Build Alternative. For travel to Suffolk, CBA 1 provides 13 minutes (18 percent) travel time savings compared to existing conditions, and 21 minutes (26 percent) time savings compared to the No Build Alternative. Similarly, CBA 3 provides three minutes (8 percent) time savings compared to the existing conditions for travel to Wakefield. CBA 3 also provides 13 minutes (18 percent) time savings compared to existing conditions for travel to Suffolk.
Route 460 Location Study 23 Alternatives Development Technical Report May 2005
Table 1.6-4 EASTBOUND TRAVEL TIME COMPARISONS FROM PETERSBURG
Petersburg to Wakefield (2003 Existing Conditions: 37 minutes)
Petersburg to Suffolk (2003 Existing Conditions: 73 minutes)
Change in Travel Times
2026 No-
Build & TSM
CBA 1 CBA 2 CBA 3 2026 No-
Build & TSM
CBA 1 CBA 2 CBA 3
2026 Travel Time (minutes) 41 35 39 34 81 60 71 60
Change from Existing Conditions
(minutes / %)
+4 (+11%)
-2 (-5%)
+2 (+5%)
-3 (-8%)
+8 (+11%)
-13 (-18%)
-2 (-3%)
-13 (-18%)
Change from 2026 No Build Conditions
(minutes / %) NA -6
(-15%) -2
(-5%) -7
(-17%) NA -21 (-26%)
-10 (-12%)
-21 (-26%)
1.6.5 Hurricane Evacuation
Hurricane evacuation capability is directly related to roadway capacity. The No Build and TSM Alternatives do not improve the ability of the corridor to provide hurricane evacuation. As discussed above, CBAs 1 and 3 provide two new travel lanes per direction between the Suffolk Bypass and Interstate 295. Limited access roadways can accommodate up to 2,400 vehicles per direction per lane when operating in free flow conditions. Conceptually, it would be possible (using travel flow reversal) to have four lanes of highway capacity used to evacuate Hampton Roads and the Outer Banks from a hurricane. This additional capacity would considerable increase the ability of the Route 460 corridor to provide hurricane evacuation capability.
CBA 2 provides bypasses around the towns, providing some additional roadway capacity and removing the sources of delay from existing Route 460 (traffic signals, access points, and speed restrictions of the through town segments). Due to the time savings achieved for through corridor travel, CBA 2 would improve hurricane evacuation capability in relation to the existing conditions. However CBA 2 would not significantly enhance evacuation capacity in comparison to CBAs 1 and 3 because the additional roadway capacity does not extend along the entire length of the study corridor.
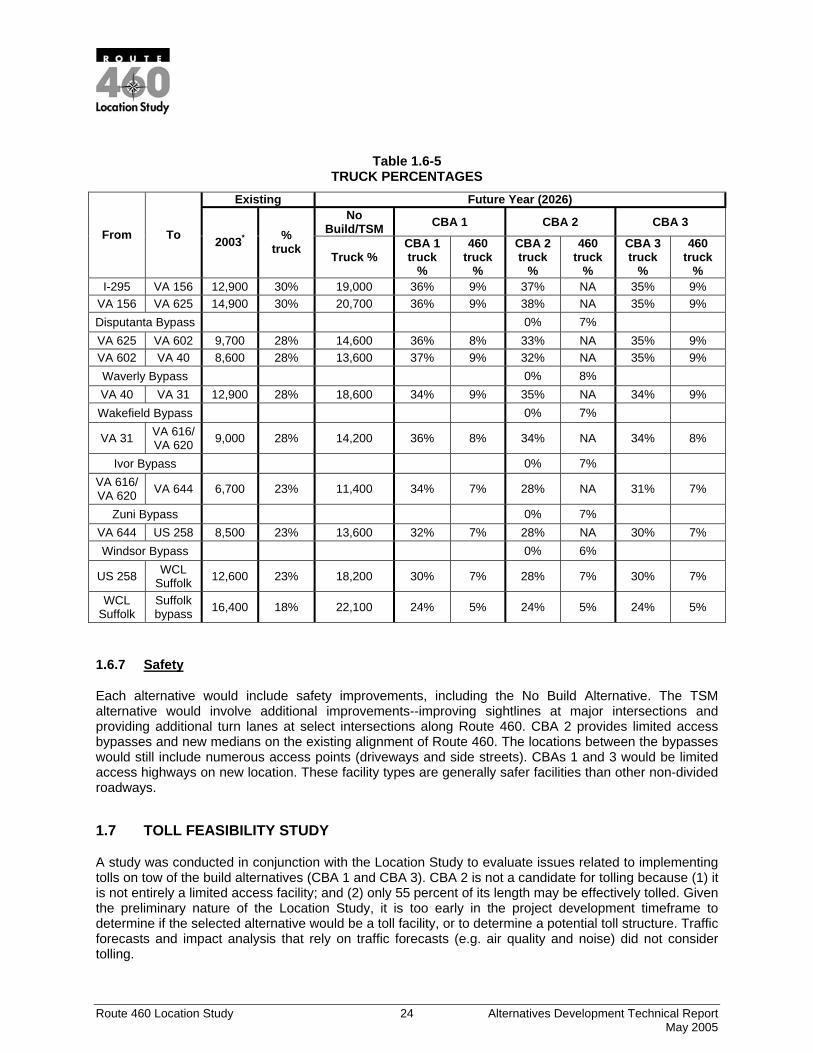
1.6.6 Freight Accommodation
Truck traffic currently constitutes a large percentage of total traffic along Route 460 and is expected to increase due to growth in the port facilities in Hampton Roads. The percent of trucks traveling along Route 460 is forecast to increase in the No Build, TSM, and for each build alternative. However, along existing Route 460, truck percentages are forecast to decrease substantially with each build alternative. See Table 1.6-5 for a summary of truck percentages for each alternative.
Route 460 Location Study 24 Alternatives Development Technical Report May 2005
Table 1.6-5 TRUCK PERCENTAGES
Existing Future Year (2026) No
Build/TSM CBA 1 CBA 2 CBA 3 From To 2003* %
truck Truck % CBA 1 truck
%
460 truck
%
CBA 2 truck
%
460 truck
%
CBA 3 truck
%
460 truck
% I-295 VA 156 12,900 30% 19,000 36% 9% 37% NA 35% 9%
VA 156 VA 625 14,900 30% 20,700 36% 9% 38% NA 35% 9% Disputanta Bypass 0% 7% VA 625 VA 602 9,700 28% 14,600 36% 8% 33% NA 35% 9% VA 602 VA 40 8,600 28% 13,600 37% 9% 32% NA 35% 9% Waverly Bypass 0% 8% VA 40 VA 31 12,900 28% 18,600 34% 9% 35% NA 34% 9% Wakefield Bypass 0% 7%
VA 31 VA 616/ VA 620 9,000 28% 14,200 36% 8% 34% NA 34% 8%
Ivor Bypass 0% 7% VA 616/ VA 620 VA 644 6,700 23% 11,400 34% 7% 28% NA 31% 7%
Zuni Bypass 0% 7% VA 644 US 258 8,500 23% 13,600 32% 7% 28% NA 30% 7% Windsor Bypass 0% 6%
US 258 WCL Suffolk 12,600 23% 18,200 30% 7% 28% 7% 30% 7%
WCL Suffolk
Suffolk bypass 16,400 18% 22,100 24% 5% 24% 5% 24% 5%
1.6.7 Safety
Each alternative would include safety improvements, including the No Build Alternative. The TSM alternative would involve additional improvements--improving sightlines at major intersections and providing additional turn lanes at select intersections along Route 460. CBA 2 provides limited access bypasses and new medians on the existing alignment of Route 460. The locations between the bypasses would still include numerous access points (driveways and side streets). CBAs 1 and 3 would be limited access highways on new location. These facility types are generally safer facilities than other non-divided roadways.
1.7 TOLL FEASIBILITY STUDY
A study was conducted in conjunction with the Location Study to evaluate issues related to implementing tolls on tow of the build alternatives (CBA 1 and CBA 3). CBA 2 is not a candidate for tolling because (1) it is not entirely a limited access facility; and (2) only 55 percent of its length may be effectively tolled. Given the preliminary nature of the Location Study, it is too early in the project development timeframe to determine if the selected alternative would be a toll facility, or to determine a potential toll structure. Traffic forecasts and impact analysis that rely on traffic forecasts (e.g. air quality and noise) did not consider tolling.

Route 460 Location Study 25 Alternatives Development Technical Report May 2005
2.0 REFERENCES
American Association of State Highway and Transportation Officials (AASHTO), “A Policy on Geometric Design of Highways and Streets”, 2001, p.8.
Intermodal Surface Transportation Efficiency Act of 1991, Section 1105(c) (3)
Intermodal Surface Transportation Efficiency Act of 1991, Section 1105 (b)
City of Suffolk, Virginia, 2018 Comprehensive Plan. Prepared by LDR International, et al. Adopted March 25, 1998
County of Sussex, Virginia. 1997 Comprehensive Plan Update. Prepared by William C. Overman Associates. Adopted November 20, 1997.
County of Prince George, Virginia, Comprehensive Plan Update. Adopted May 25, 1999.
County of Isle of Wight, Virginia, Board of Supervisors Resolution. August 7, 2003.
Land Development Plan, Surry County, Virginia. Adopted November 21, 1974