rout∑.i™ predictive modelling of autonomous shuttle
TRANSCRIPT
JANUARY 2021 AUTHORS D r . M a h m o o d N e s h e l i , S m a r t V e h i c l e R e s e a r c h e r D r . E l n a z A b o t a l e b i , S m a r t V e h i c l e P r o j e c t L e a d D r . R o b e r t o S a r d e n b e r g , M o d e l l e r & D a t a S c i e n c e R e s e a r c h e r D r . Y u t i a n Z h a o , M o d e l l e r & D a t a S c i e n c e R e s e a r c h e r M r . S h e r v i n B a k h t i a r i , T e a m L e a d : Z E B S i m u l a t i o n & R e s e a r c h M s . P a r v a t h y P i l l a i , P r o j e c t M a n a g e r : Z E B S i m u l a t i o n & C o m m e r c i a l i z a t i o n D r . J o s i p a P e t r u n i ć , P r e s i d e n t & C E O
CUTRIC National Smart Vehicle Joint Procurement Initiative: Rout∑.i™ predictive modelling of autonomous shuttle performance and passenger-carrying capacity of first-km/last-km solutions CUTRIC-ACATS Project Final Report

CUTRIC-CRITUC Low-Carbon Smart Mobility Knowledge Series No. 3 2020 Edition 1.0
2
COPYRIGHT © 2021 Information in this document is to be considered the intellectual property of the Canadian Urban Transit Research and Innovation Consortium (CUTRIC) in accordance with Canadian copyright law. The material in this report reflects CUTRIC’s best judgement, in the light of the information available to it, at the time of preparation. Any use which a third party makes of this report, or any reliance on or decisions to be made based on it, are the responsibility of such third parties. CUTRIC accepts no responsibility for damages, if any, suffered by any third party as a result of decisions made or actions based on this report. DISCLAIMER This project received funding support through Transport Canada’s Program to Advance Connectivity and Automation in the Transportation System (ACATS). The views and opinions expressed are those of the authors and do not necessarily reflect those of Transport Canada. Canadian Urban Transit Research and Innovation Consortium (CUTRIC) Consortium de recherche et d’innovation en transport urbain au Canada (CRITUC) 1 Yonge Street, Suite 1801 Toronto, ON M5E 1W7 [email protected]

CUTRIC-CRITUC Low-Carbon Smart Mobility Knowledge Series No. 3 2020 Edition 1.0
3
TABLE OF CONTENTS List of Tables ___________________________________________________ 6
List of Figures __________________________________________________ 7
List of Acronyms ________________________________________________ 8
Introduction ___________________________________________________ 10
Automated Vehicles ______________________________________________________ 10 Connected Vehicles ______________________________________________________ 11 Connected and Automated Vehicle Opportunities _______________________________ 12
Section I: Energy Consumption Feasibility Analysis ____________________ 13
Objectives and Goals _____________________________________________________ 13 Route Selection Parameters and Processes ___________________________________ 13 Introduction to CUTRIC’s RoutΣ.iTM Simulation Tool _____________________________ 19 Modelling Inputs and Assumptions __________________________________________ 19 Modelling Methodology ___________________________________________________ 19 Speed and Topography Profile Generation ____________________________________ 20 Results of the Feasibility Study _____________________________________________ 22
Energy Consumption Results _____________________________________________ 22 State-of-Charge and Charging-Time Results _________________________________ 24 Creation of a Schedule __________________________________________________ 25 Round Trips Completed Before Recharge Required ___________________________ 26
Conclusions and Future Steps ______________________________________________ 27
Section II: Transit Ridership Impact Analysis _________________________ 29
Four-Step Transportation Model ____________________________________________ 29
Trip Generation ________________________________________________________ 29 Trip Distribution ________________________________________________________ 30 Mode Split ____________________________________________________________ 30 Traffic Assignment ______________________________________________________ 30
Case Studies Suited for First-Kilometre/Last-Kilometre Applications ________________ 31
Route Profiles and Energy Consumption: Summary from Section I ________________ 31 Route Mapping ________________________________________________________ 34 Transit Hub Schedule ___________________________________________________ 38
Augmentation in Transit Ridership ___________________________________________ 40
Ridership Assumptions in Different Scenarios ________________________________ 40 Additional Assumptions __________________________________________________ 41
Discussions and Next Steps _______________________________________________ 43
Section III: Communication Software and Hardware Standardization Analysis 45
Connected Vehicle Standardization and Certification ____________________________ 45
CUTRIC-CRITUC Low-Carbon Smart Mobility Knowledge Series No. 3 2020 Edition 1.0
4
Security Credential Management System ____________________________________ 45 OmniAir Certification ____________________________________________________ 46
Automated Vehicle Sensory Systems ________________________________________ 48 Sensing Technologies ____________________________________________________ 49
LIDAR _______________________________________________________________ 49 Radar ________________________________________________________________ 51 Cameras _____________________________________________________________ 53 Ultrasonic Sensors _____________________________________________________ 53 Sensor Fusion _________________________________________________________ 54
Additional CUTRIC Data Sources and Considerations for e-LSAs __________________ 55
Section IV: Cybersecurity Software and Hardware Risks and Vulnerabilities _ 57
Introduction ____________________________________________________________ 57 An Overview of Connected and Autonomous Vehicles ___________________________ 57
Vehicle Connectivity ____________________________________________________ 57 Vehicle Automation _____________________________________________________ 58
Cyber-Attacks in Connected and Autonomous Vehicles __________________________ 58
Password and Key Attacks _______________________________________________ 58 Denial-of-Service Attacks ________________________________________________ 58 Impersonation/Masquerading Attacks _______________________________________ 60 Replay Attacks ________________________________________________________ 60 GPS Spoofing Attacks ___________________________________________________ 61 Routing Attacks ________________________________________________________ 61 Data Falsification Attacks ________________________________________________ 62 Eavesdropping Attacks __________________________________________________ 63 Location Trailing Attacks _________________________________________________ 64 Sensor Spoofing Attacks _________________________________________________ 64 Close Proximity Vulnerabilities ____________________________________________ 64 General Cyber-Attack Defense Strategies ___________________________________ 65
Cybersecurity and Safety Standards of CAVs __________________________________ 66
ISO 26262 ____________________________________________________________ 66 SAE J3061 ____________________________________________________________ 66 British Standards Institution’s Cybersecurity Standard __________________________ 67
Conclusion _____________________________________________________________ 68
Section V: National Smart Vehicle Joint Procurement Initiative Qualitative Outcomes 69
Summary of Session Dialogues and Outcomes from the Manufacturer Working Group Sessions (2018-2019) ____________________________________________________ 69
Session #1 ____________________________________________________________ 69 Session #2 ____________________________________________________________ 69 Session #3 ____________________________________________________________ 70 Session #4 ____________________________________________________________ 71

CUTRIC-CRITUC Low-Carbon Smart Mobility Knowledge Series No. 3 2020 Edition 1.0
5
Session #5 ____________________________________________________________ 72 Session #6 ____________________________________________________________ 73 Session #7 ____________________________________________________________ 74
Summary of Session Dialogues and Outcomes from the Smart Vehicle Joint Procurement Initiative Sessions (2020) __________________________________________________ 74
Session #1 ____________________________________________________________ 74 Session #2 ____________________________________________________________ 74 Session #3 ____________________________________________________________ 75
Summary of Key Themes and Trends ________________________________________ 75
Conclusion ____________________________________________________ 78
References ___________________________________________________ 81

CUTRIC-CRITUC Low-Carbon Smart Mobility Knowledge Series No. 3 2020 Edition 1.0
6
LIST OF TABLES Table 1. Route maps and associated characteristics. .................................................... 15
Table 2. General assumptions applied in the modelling work. ....................................... 19
Table 3. The shapes of chosen routes, either loops or non-loops (round trip). .............. 22
Table 4. Energy efficiency (kWh/km) of the vehicle. ...................................................... 23
Table 5. Energy usage (kWh) for completing one loop or round trips. ........................... 24
Table 6. Charging time for the various vehicles after completing a loop or round-trip. ... 25
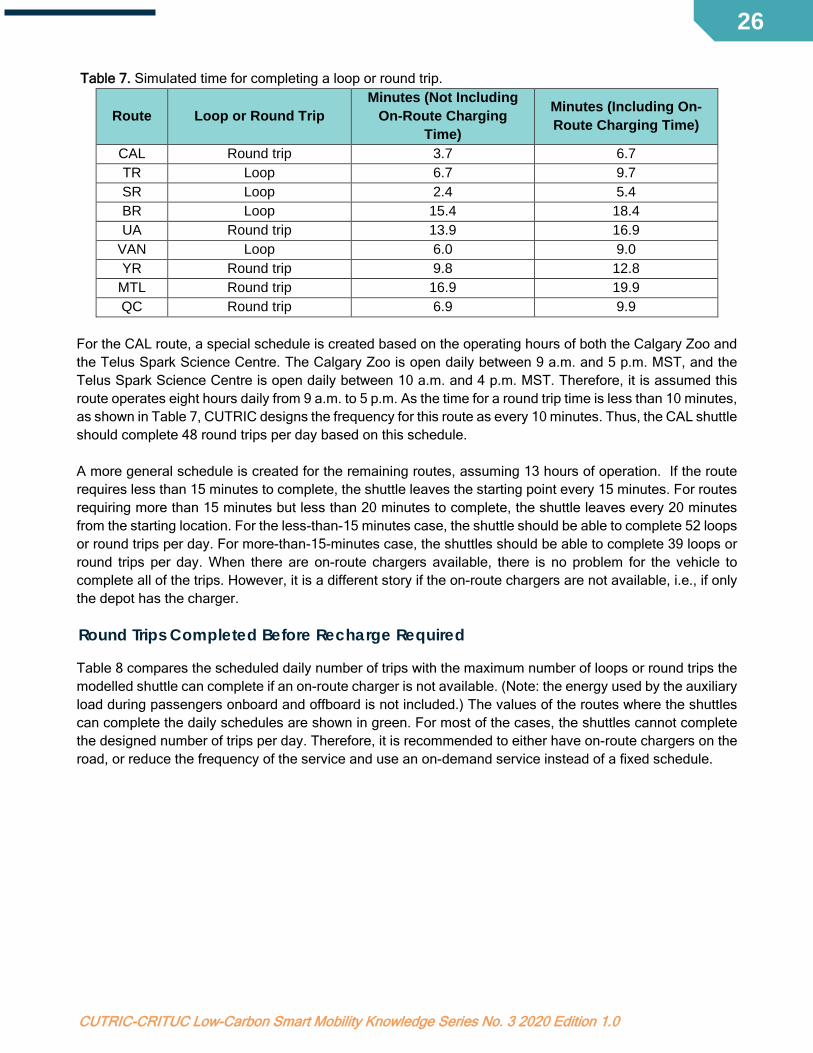
Table 7. Simulated time for completing a loop or round trip. .......................................... 26
Table 8. Maximum number of loops or round trips if an on-route charger is not available based on simulation results. Note the numbers in green indicate the vehicle is able to complete the designed daily service. .................................................................................................. 27
Table 9. Simulation results of e-LSA’s total service time before depleting the battery to a minimum SOC and requiring a recharge. ...................................................................... 27
Table 10. Route maps and associated characteristics. .................................................. 32
Table 11. Number of trips completed along each route within a 13-hour continuous, full service day. ................................................................................................................................ 33
Table 12. Number of round trips along the three selected routes that can be performed before the e-LSA requires a full recharge. ................................................................................ 34
Table 13. Scenario assumptions #1 and #2 to assess the theoretical impact of e-LSA integration. ..................................................................................................................... 41
Table 14. Data related to the number of people in a household, associated average vehicles owned and transit ridership. ........................................................................................... 42
Table 15. Simulation results for e-LSA deployments within different scenarios in Trois-Rivières. ...................................................................................................................................... 42
Table 16. Simulation results for e-LSA deployments within different scenarios in York Region. ...................................................................................................................................... 43
Table 17. Simulation results for e-LSA deploying within different scenarios in Brampton.43
CUTRIC-CRITUC Low-Carbon Smart Mobility Knowledge Series No. 3 2020 Edition 1.0
7
LIST OF FIGURES Figure 1. Example of path definition in MyMaps. ........................................................... 20
Figure 2. Example of stop definition along routes. ......................................................... 20
Figure 3. Simulated profiles for York Region route, forward direction. ........................... 21
Figure 4. Simulated profiles for York Region route, reverse direction. ........................... 21
Figure 5. Simulated profiles for Vancouver route, loop-shaped. .................................... 22
Figure 6. Variations in medium-duty cycle energy consumption results for the vehicle. 23
Figure 7. The vehicle’s energy efficiency on a per kilometre and per passenger basis for medium and heavy-duty cycles. .................................................................................... 24
Figure 8. SOC level after shuttle completes one loop or round trip of the routes. .......... 25
Figure 9. Parking areas and houses within a 200-metre radius of the Trois-Rivières route. ...................................................................................................................................... 35
Figure 10. Parking areas and houses within a 200-metre radius of the York Region route. ...................................................................................................................................... 36
Figure 11. Parking areas and houses within a 200-metre radius of the BR route. ......... 37
Figure 12. Typical trip for a resident of the targeted neighbourhood to commute to downtown Trois-Rivières. ............................................................................................................... 38
Figure 13. Typical trip for a resident of the targeted neighbourhood to the Maple GO Station. ...................................................................................................................................... 39
Figure 14. A typical trip for a resident of the targeted neighbourhood to get to the Chinguacousy-Zum Steeles Station Stop. ............................................................................................. 39
CUTRIC-CRITUC Low-Carbon Smart Mobility Knowledge Series No. 3 2020 Edition 1.0
8
LIST OF ACRONYMS Ad hoc on-demand distance vector (AODV) Advance Connectivity and Automation in the Transportation System (ACATS) Advanced driver assistance systems (ADAS) Application programming interface (API) Attacked packet detection algorithm (APDA) Automotive safety integrity level (ASIL) Automated vehicle (AV) Brampton (BR) Canada Motor Vehicle Safety Standards (CMVSS) Canadian Urban Transit Research and Innovation Consortium (CUTRIC) Certificate revocation list (CRL) Connected and Automated Vehicle Advisory Council (CAVAC) Connected and autonomous vehicle (CAV) Dedicated short-range communication (DSRC) Denial of service (DoS) Digital elevation model (DEM) Edmonton Transit Service (ETS) Electric low speed automated shuttle (e-LSA) Elliptic curve digital signature algorithm (ECDSA) European Committee for Standardization (CENT) Frequency modulated continuous wave (FMCW) Geographic information system (GIS) Global positioning system (GPS) Greater Toronto and Hamilton Area (GTHA) Hash message authentication code (HMAC) Information and communication technology (ICT) Infrared (IR) Intelligent transportation systems (ITS) International Electrotechnical Commission (IEC) International Organization for Standardization (ISO) Light detection and ranging (LIDAR) National Institute of Standards and Technology (NIST) Non-disclosure agreement (NDA) Media access control (MAC) Memorandum of Understanding (MOU) Micro-electro-mechanical-systems (MEMS) Motor Vehicle Safety Act (MVSA) On-board unit (OBU) Political, Economic, Social, Technological, Environmental and Legal (PESTEL) Physical challenge-response authentication (PyCRA) Public key infrastructure (PKI) Radio-frequency identification (RFID) Regional Transportation District (RTD) Request response detection algorithm (RRDA) Road-side unit (RSU) Security Credential Management Systems (SCMS) Sequence number (SN) Société de transport de Trois-Rivières (STTR)
CUTRIC-CRITUC Low-Carbon Smart Mobility Knowledge Series No. 3 2020 Edition 1.0
9
Society of Automotive Engineers (SAE) Software defined networking (SDN) State-of-charge (SOC) Strengths, Weaknesses, Opportunities and Threats (SWOT) Toronto Region Board of Trade (TRBOT) Trois-Rivières (TR) Toronto Transit Commission (TTC) Three-dimensional (3D) Trusted platform module (TPM) United States Department of Transportation (USDOT) Vehicle-to-everything (V2X) Vehicle-to-infrastructure (V2I) Vehicle-to-vehicle (V2V) Wireless access in vehicular environments (WAVE) York Region (YR)

CUTRIC-CRITUC Low-Carbon Smart Mobility Knowledge Series No. 3 2020 Edition 1.0
10
INTRODUCTION Transport Canada created the Advance Connectivity and Automation in the Transportation System (ACATS) program to help prepare the country for connected and automated vehicle (CAV) deployments on Canadian roads. The ACATS program distributed C$2.9 million across 15 different organizations to support: (1) research, studies and technology evaluations; (2) the development of codes, standards and guidance materials; and (3) capacity-building and knowledge-sharing activities. The Canadian Urban Transit Research and Innovation Consortium (CUTRIC) was one of the 15 organizations awarded a research contract through the ACATS program. This final report includes five sections that are allied to CUTRIC’s first-kilometre/last-kilometre electric low-speed automated shuttle (e-LSA) deployment efforts within the National Smart Vehicle Joint Procurement Initiative:
● Section I details the energy consumption feasibility analysis for electric low-speed automated shuttle deployment on nine first-kilometre/last-kilometre routes.
● Section II details the transit ridership impact analysis based on e-LSA deployment along three selected first-kilometre/last-kilometre routes.
● Section III provides an overview of communication software and hardware systems and applicable standards.
● Section IV provides an overview of cybersecurity software and hardware risks, vulnerabilities and standards.
● Section V provides a qualitative overview of the Manufacturer Working Group sessions that CUTRIC has hosted since 2018 to advance the National Smart Vehicle Joint Procurement Initiative.
Automated Vehicles Automated vehicles (AVs) can reduce the number of on-road collisions and fatalities, as well as congestion and transportation emissions overall, through optimized traffic-flow networks. The safety potential of AVs is of critical interest given that there were nearly 1,900 deaths and 108,500 personal injuries in Canada in 2018 from motor vehicle collisions [1]. It is estimated that 94 per cent of all serious motor-vehicle crashes result from human error while driving, highlighting the strong benefits AV technologies could offer to reduce road collisions [2]. An AV uses a combination of sensory, localization and navigation technologies to maneuver roadways without direct human guidance and supervision. A vehicle’s degree of automation is defined through the SAE J3016 standard, which outlines six levels of vehicle automation on a scale of 0 - 5, where Level 0 has no automation and Level 5 is full vehicle autonomy [3]. AVs use sensory technologies to detect surrounding environments in real time. Based on object classifications, the vehicle decides on a course of action regarding if, or how, it will navigate objects ahead. Manufacturers use a combination of sensory technologies within their vehicles to enable redundancies and minimize risk. The most common sensory technologies include light detection and ranging (LIDAR), radio detection and ranging (radar), cameras and ultrasonic sensors, as well as inertial-measurement units and infrared sensors. Each sensory technology has both strengths and limitations, necessitating multiple technologies to ensure a safe level of redundancy. Fully automated vehicles, therefore, receive multiple real-time data inputs from the sensors, and this information is amalgamated and processed in the central vehicular computer through a process called “sensor fusion.” Sensor fusion is a difficult computation given the volume of real-time data

CUTRIC-CRITUC Low-Carbon Smart Mobility Knowledge Series No. 3 2020 Edition 1.0
11
inputs from multiple sensors and the often-contradictory information across sensors. This remains one of the ongoing challenges to achieving fully automated vehicles [4]. AV navigation and location systems describe the technologies a vehicle requires to locate itself and navigate through established road networks. Manufacturers use several localization-technology options including high-definition (HD) mapping, global-positioning systems (GPS), global navigation satellite systems (GNSS), real-time kinetic (RTK) positioning, cameras and magnetic markers. Similar to sensory systems, each of these localization systems carries unique strengths and limitations, which often lead manufacturers to use a primary localization system with a secondary system for safety redundancy.
Connected Vehicles Interest in road-vehicle data connectivity has been growing steadily since the early 1990s [5]. With the explosion of high-speed wireless communications in the new millennium, as well as dramatic capability improvements and cost reductions in small-scale computing technologies (such as those related to smartphone devices), many ideas for vehicle connectivity, which may have seemed like a fantasy a few decades ago, are now technologically possible. Although some wireless communication standards for vehicle connectivity have yet to be resolved, trials of various connected vehicle technologies have begun to move forward, moving the automotive industry closer to large-scale deployment [6]. Connected vehicle technologies can improve both safety and efficiency, as well as overall data generation for improved decision making [7]. These advancements can benefit automobile operators, other road users (i.e. pedestrians and cyclists) and transportation authorities. Vehicle connectivity can be categorized by the entities exchanging data. Vehicle-to-vehicle (V2V) connectivity involves real-time wireless transmission and data reception between two or more vehicles in operation. Naturally, this requires the installation and use of compatible hardware and software in all vehicles involved. Applications for V2V connectivity could include forward collision warnings, intersection safety warnings and passing warnings. With V2V, the benefits to each automobile operator increase as more vehicles become equipped with the technology. Vehicle-to-infrastructure (V2I) connectivity, in contrast, enables data exchange between a vehicle and the road environment through which it travels. In particular, intersections offer a tremendous opportunity for improvements in safety and efficiency using V2I connectivity, such as the transmission of red and green light time-to-change information, red-light warnings, and transit and emergency vehicle priority systems [6]. Beyond intersections, V2I connectivity can convey pertinent information about speed limits, work zones, curve speeds and wrong-way warnings, potentially even allowing infrastructure to respond to a vehicle’s actions. Vehicle-to-pedestrian (V2P) connectivity is another area of current research, with potential applications including in-vehicle warning systems notifying drivers of pedestrians in the intended path of travel, or communication with vision-impaired pedestrians via smartphones [8]. When multiple vehicles and infrastructure elements can communicate together, additional capabilities become possible in what is collectively known as vehicle-to-everything (V2X) connectivity. In theory, V2X has the potential to help solve some of our most challenging traffic problems, as each vehicle can essentially participate in building a big-picture view of all roadway hazards and opportunities for efficiency.

CUTRIC-CRITUC Low-Carbon Smart Mobility Knowledge Series No. 3 2020 Edition 1.0
12
Connected and Automated Vehicle Opportunities Connected and automated vehicles (CAV) can potentially reduce congestion and greenhouse gas (GHG) emissions if policies promote ride sharing, increase carbon taxes, promote electrification, and enact road pricing mechanisms to control the threat of empty vehicles on roadways [9]. Despite the effects of COVID19 on reduce car travel throughout 2020, congestion in Canadian urban centres remains a long-term challenge. For example, there are over 2.74 million commuters for work in Toronto of which 17.2 per cent normally spend over 60 minutes on their daily commute. By comparison, in Vancouver and Montreal, prior to the pandemic only eight per cent of commuters spent over 60 minutes on their daily commute [10]. The higher commuter time in Toronto negatively effects both GHG emissions and gross domestic product (GDP) across one of the country’s most economically productive jurisdictions. Congestion causes direct economic losses and is likely to continue doing so post-pandemic as economies open up and regular commuter travel resumes to some degree. A 2008 study found the costs of congestion to the Greater Toronto and Hamilton Area (GTHA) is C$6 billion annually. The per capita cost of congestion in Toronto and the GTHA are, thus, higher than both New York and Chicago. Prior to the pandemic, those costs were predicted to rise higher [11]. CAVs can also reduce collisions and fatalities on roadways. Between 2013 and 2017, there have been approximately 300 pedestrian fatalities per year on Canadian roads [12]. It is estimated that 94 per cent of all vehicle collisions result from human error [2]. CAVs may eliminate the possibility of human error and drastically reduce the number of pedestrian fatalities if widely deployed. First-kilometre and last-kilometre connectivity for public transit systems is a global concern that agencies are trying to solve. A lack of first-kilometre/last-kilometre connections is a key barrier to public transit adoption in many major cities. Transit agencies operate on the basis that riders are less likely to use public transit if there are no bus or train stations within a 20-minute walk of either a rider’s home or a major destination. Using CAVs for transit in the form of e-LSAs presents an excellent opportunity to overcome first-kilometre/last-kilometre applications by providing a flexible short-route service from suburban neighbourhoods to transit hubs, or from transit hubs to popular destinations. Autonomous shuttles can offer economic, energy and operational efficiencies in such situations. This is why transit agencies around world – such as the Regional Transportation District (RTD) in Denver, Colorado, Trinity Metro in Fort Worth, Texas, Edmonton Transit Service (ETS) in Edmonton, Alberta and the Toronto Transit Commission (TTC) – have either planned or commissioned pilot projects to study the effects of AVs as first-kilometre/last-kilometre solutions and their impact on public transit ridership [13].
CUTRIC-CRITUC Low-Carbon Smart Mobility Knowledge Series No. 3 2020 Edition 1.0
13
SECTION I: ENERGY CONSUMPTION FEASIBILITY ANALYSIS Objectives and Goals The objective of this section is to highlight preliminary results of a feasibility analysis of e-LSA application across nine different routes in nine Canadian municipal jurisdictions. Municipal staff and transit agency representatives identified these specific routes as potentially suitable for e-LSA deployment. These routes do not indicate the respective municipality’s intent to actually deploy an e-LSA along these routes. Instead, they demonstrate the municipality’s interest in assessing the potential viability of these or similar routes from an energy consumption and scheduling feasibility standpoint, as they consider various e-LSA manufacturers for early-stage solutions for first-kilometre/last-kilometre mobility. Energy consumption, state-of-charge (SOC) of the battery, and charging times are key characteristics assessed in this feasibility analysis. These factors constitute critical considerations for e-LSA deployment along given routes based on the technical specifications of varying battery packs, electric powertrains and charging systems. To assess characteristics and their implications for e-LSA applications, CUTRIC used its in-house predictive analytic (physics-based) RoutΣ.iTM simulation tool. This section consists of the following:
• A description of the selected routes and their corresponding first-kilometre/last-kilometre characteristics
• A description of the modelling methodology • Modelling results and analysis
Route Selection Parameters and Processes Starting in July 2018, CUTRIC has worked with nine municipal jurisdictions to select routes that fit the criteria of a first-kilometre/last-kilometre e-LSA application. These cities include Vancouver, Surrey, Calgary, Edmonton, Brampton, York Region, Trois-Rivières, Montreal and Quebec City. Identifying city-specific routes took longer than originally forecasted due to political, educational and resource barriers. As CUTRIC has learned, the selection of simulated routes – even if hypothetical – raised numerous socioeconomic and transit-related questions that needed political and community engagement to resolve. Politically, some municipalities required prolonged internal discussions to determine which route to select based on several route-specific factors and limitations. CUTRIC provided specific route-selection parameters to support the process. Within this project, e-LSA application routes were to be no longer than two kilometres, since the goal of the project is to map first-kilometre/last-kilometre mobility gaps. The selected routes must link to an existing transit stop or hub, but possess no current or planned future transit (i.e. bus or light-rail transit) service. The route must include sufficient road space to create a dedicated laneway for AV shuttles. In sum, CUTRIC requested that routes identified followed these criteria:

CUTRIC-CRITUC Low-Carbon Smart Mobility Knowledge Series No. 3 2020 Edition 1.0
14
• The route should be a first-kilometre/last-kilometre application. • The route should be approximately one to two kilometres long (this parameter was ultimately
rendered more flexible). • The maximum road grade should not exceed six per cent, as per e-LSA manufacturer
recommendations, since this grade limit maximizes standing passenger comfort while travelling up or down slopes (this parameter was exceeded in one circumstance).
• The route should be located on a path where it is feasible to build a dedicated laneway. • The route should not currently operate any transit service.
Many municipal jurisdictions found it challenging to find a route that met these criteria. The biggest challenge was identifying roadways that possess enough space for a dedicated laneway for the shuttle, should such a requirement continue to be necessary for the effective deployment of shuttles that do not operate optimally in mixed traffic conditions. Some municipalities in the CUTRIC consortium were hesitant to share their determined route because of public risk aversion. These cities were concerned that in simply modelling a given or hypothetical route, citizens may expect them to actually apply e-LSAs to those routes, which might lead to unexpected and premature public debate or backlash with regards to AV deployments by the city in general. From an educational standpoint, some cities were unclear on what constitutes an actual first-kilometre/last-kilometre route. Additionally, some city and transit staff who selected routes for this study did not adequately understand the limitations of e-LSA speed and torque. As a result, some routes they initially provided were much longer compared with a strictly defined first-kilometre/last-kilometre route, while others were routed along very hilly terrains that the vehicles could not support. These staff, therefore, required additional insights and education by CUTRIC to ensure that the route requirements were well understood before they could be effectively selected for simulation purposes. The resulting nine routes eventually selected by each city, along with their associated route profiles and characteristics, are shown in Table 1.

CUTRIC-CRITUC Low-Carbon Smart Mobility Knowledge Series No. 3 2020 Edition 1.0
15
Table 1. Route maps and associated characteristics.
Route map Characteristics
Route Location: Calgary, Alberta, between the Calgary Zoo and the Telus Spark Science Centre Route Designation: CAL Route Length: 566 m Maximum Road Grade: 7.7% Average Road Grade: 1.8% Identified By: City of Calgary Number of Stops: Two (one at each end) First-Kilometre/Last-Kilometre Application: Yes Reasons for Picking this Route: The Calgary Zoo LRT station is located about 800 metres away from the entrance of the Science Centre. The two are separated by a large parking lot, which is not convenient for pedestrians to walk across.
Route Location: Trois-Rivières, Québec Route Designation: TR Route Length: 2.05 km Maximum Road Grade: 4.3% Average Road Grade: 1.0% Identified By: Société de Transport de Trois-Rivières (STTR) Number of Stops: Two (one at the start/end and a second stop at the middle of the route.) First-Kilometre/Last-Kilometre Application: Yes Reasons for Picking this Route: STTR wants to link the neighbourhood shown to the main route where transit is available.
CUTRIC-CRITUC Low-Carbon Smart Mobility Knowledge Series No. 3 2020 Edition 1.0
16
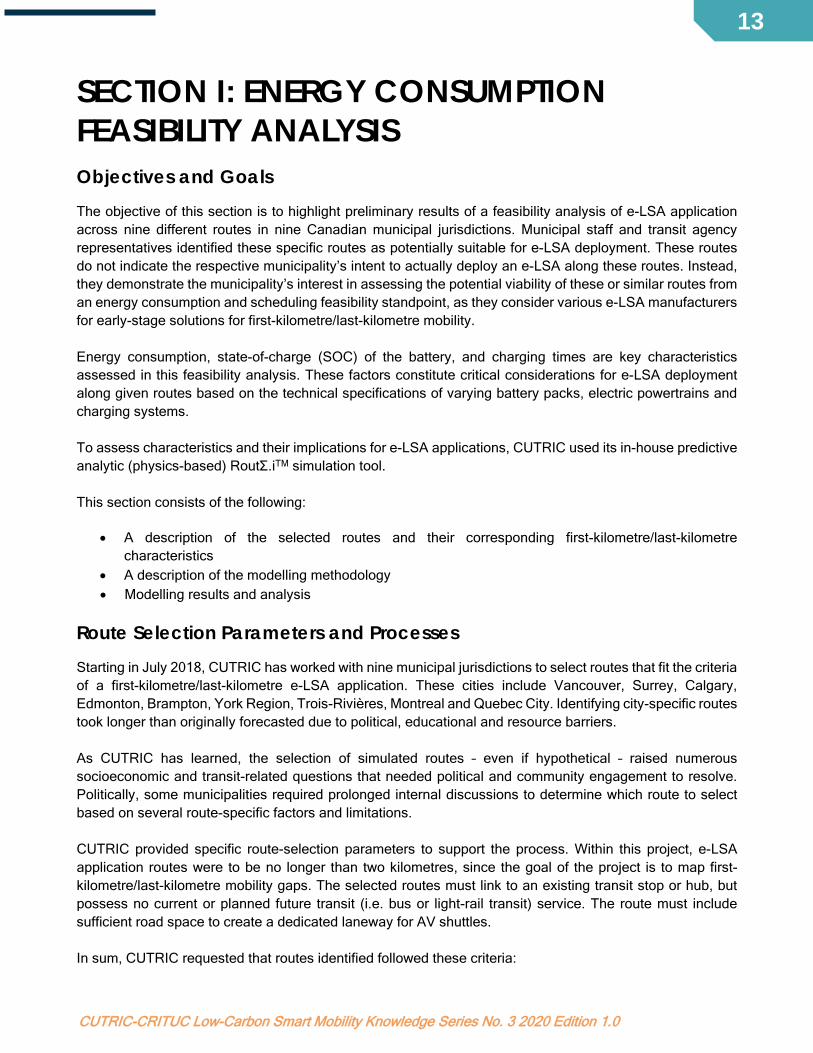
Route map Characteristics
Route Location: Surrey, British Columbia Route Designation: SR Route Length: 507 m Maximum Road Grade: 2.4% Average Road Grade: 0.7% Identified By: City of Surrey Number of Stops: Three (one at the start/end point, a second stop at the SkyTrain station, and a third at the library entrance) First-Kilometre/Last-Kilometre Application: Yes Reasons for Picking this Route: This is the route where Surrey deployed an e-LSA as a two-week pilot project.
Route Location: Brampton, Ontario Route Designation: BR Route Length: 3.61 km Maximum Road Grade: 5.9% Average Road Grade: 1.8% Identified By: Brampton Transit Number of Stops: Five (one at the start/end (Zum station) and four along the route, as indicated by the blue stars) First-Kilometre/Last-Kilometre Application: Yes Reasons for Picking this Route: This route links a major Zum station to a nearby neighbourhood that has little transit available.
CUTRIC-CRITUC Low-Carbon Smart Mobility Knowledge Series No. 3 2020 Edition 1.0
17
Route map Characteristics
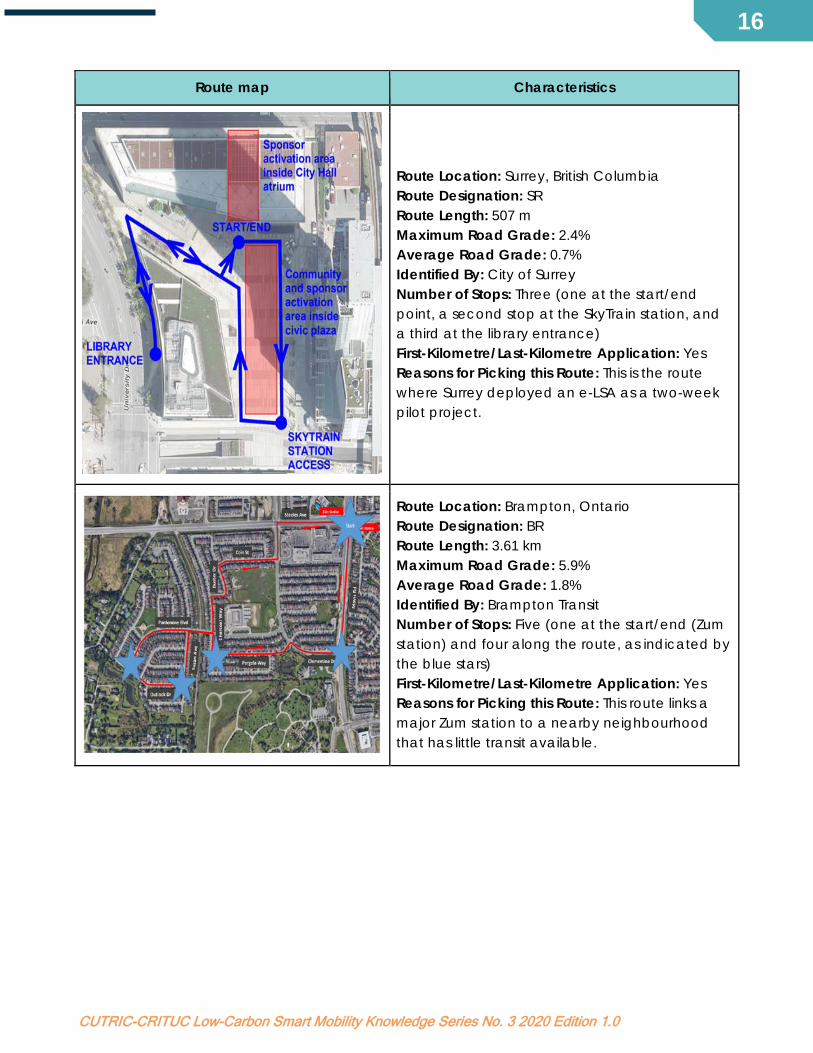
Route Location: University of Alberta, Edmonton, Alberta Route Designation: UA Route Length: 1.46 km Maximum Road Grade: 9.0% Average Road Grade: 3.8% Identified By: City of Edmonton Number of Stops: Four (one at the start point, one at the end point, and two additional stops along the route as indicated by blue stars) First-Kilometre/Last-Kilometre Application: Yes Reasons for Picking this Route: This route goes through the University of Alberta campus where transit is not easily accessible.
Route Location: Vancouver, British Columbia Route Designation: VAN Route Length: 1.6 km Maximum Road Grade: 9.2% Average Road Grade: 2.0% Identified By: City of Vancouver Number of Stops: Two (one at the start point and the second at the end point) First-Kilometre/Last-Kilometre Application: Yes Reasons for Picking this Route: This is the route where an e-LSA was deployed during Vancouver’s pilot project. It links a major intersection to a SkyTrain station.

CUTRIC-CRITUC Low-Carbon Smart Mobility Knowledge Series No. 3 2020 Edition 1.0
18
Route map Characteristics
Route Location: York Region, Ontario Route Designation: YR Route Length: 986 m Maximum Road Grade: 7.7% Average Road Grade: 2.3% Identified By: York Region Transit Number of Stops: Five (one at the start, one at the end point, and three along the route, as indicated by blue starts) First-Kilometre/Last-Kilometre Application: Yes Reasons for Picking this Route: This route links the Maple GO Station to its nearest neighbourhood. YRT conducted a survey identifying that most of the cars parked in the Maple GO Station parking lot were travelling from less than five kilometres away.
Route Location: Montreal, Quebec Route Designation: MTL Route Length: 2.25 km Maximum Road Grade: 9.4% Average Road Grade: 2.7% Identified By: Parc Olympique Number of Stops: Six (one at the start and one at the end point, with four additional stops on route as shown by blue stars) First-Kilometre/Last-Kilometre Application: Yes Reasons for Picking this Route: This route links several key tourist attractions from the two metro stations, Viau and Pie IX.
Route Location: Quebec City, Quebec Route Designation: QC Route Length: 1.21 km Maximum Road Grade: 8.5% Average Road Grade: 3.2% Identified By: RTC Number of Stops: Two (one at the start point and one at the end point) First-Kilometre/Last-Kilometre Application: No Reasons for Picking this Route: This route links two existing parallel transit lines that are not currently served by a connecting transit service.

CUTRIC-CRITUC Low-Carbon Smart Mobility Knowledge Series No. 3 2020 Edition 1.0
19
Introduction to CUTRIC’s RoutΣ.iTM Simulation Tool CUTRIC’s RoutΣ.i tool is a predictive analytical tool developed by modelling and data scientists at CUTRIC. The simulation tool is able to predict the performance of various e-LSA and e-charger models applied to specific routes. The tool models detailed electrical drivetrain, along with its interactions, to obtain the powertrain efficiency on a second-by-second basis. Three different duty cycles are designed to simulate different operating scenarios. The scenarios include light-duty cycle, medium-duty cycle and heavy-duty cycle, to consider low energy usage, average energy usage and extreme energy usage scenarios. The details of the three duty cycles are:
1. Light-duty cycle: the vehicle has no passengers onboard and no auxiliary capacity (e.g. heating or cooling)
2. Medium-duty cycle: the vehicle has half its passenger capacity with half of the maximum auxiliary turned on
3. Heavy-duty cycle: the vehicle is at its maximum passenger capacity with its maximum auxiliary load capacity
These three duty-cycles help to assess the intensity of energy consumption for electric vehicles under different conditions. They also help transit agencies to plan for the most extreme-use-case or worst-case scenarios.
Modelling Inputs and Assumptions CUTRIC used one e-LSA model vehicle in the simulation for analysis. Here is some basic information of the simulated vehicle:
• The maximum passenger capacity of the vehicle is 22 passengers. • The vehicle has a powerful motor to keep the vehicle running on challenging roads with heavy-duty
cycle. • The vehicle uses an automated on-route 90 kW charger, which allows the vehicle to remain on the
route for a long operation time or even for 24-hour continuous operation.
Table 2 lists the main assumptions used in the modelling work. Table 2. General assumptions applied in the modelling work.
General Assumptions
1 The maximum speed of the shuttle is 20 km/h.
2 The shuttle stays for 10 seconds at all stops for passengers to get on and off the shuttle.
3 Each passenger’s weight is 75 kg. 4 The charger power and efficiency do not fluctuate in use.
Modelling Methodology This section describes CUTRIC’s modelling methodology and provides some of the main inputs gathered from partner manufacturers to achieve the following outcomes:
• Generate speed profiles on the selected routes • Generate a topography profile on the selected routes
CUTRIC-CRITUC Low-Carbon Smart Mobility Knowledge Series No. 3 2020 Edition 1.0
20
• Calculate the energy consumption of the e-LSAs along the routes
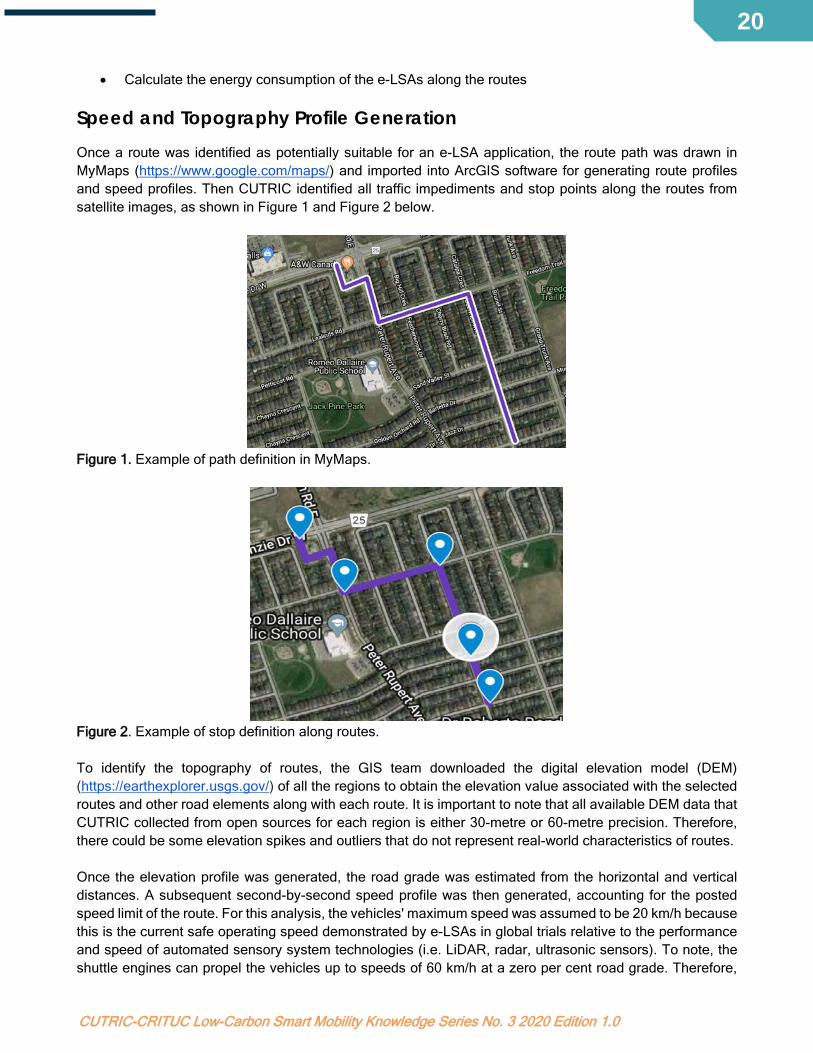
Speed and Topography Profile Generation Once a route was identified as potentially suitable for an e-LSA application, the route path was drawn in MyMaps (https://www.google.com/maps/) and imported into ArcGIS software for generating route profiles and speed profiles. Then CUTRIC identified all traffic impediments and stop points along the routes from satellite images, as shown in Figure 1 and Figure 2 below.
Figure 1. Example of path definition in MyMaps.
Figure 2. Example of stop definition along routes. To identify the topography of routes, the GIS team downloaded the digital elevation model (DEM)
(https://earthexplorer.usgs.gov/) of all the regions to obtain the elevation value associated with the selected routes and other road elements along with each route. It is important to note that all available DEM data that CUTRIC collected from open sources for each region is either 30-metre or 60-metre precision. Therefore, there could be some elevation spikes and outliers that do not represent real-world characteristics of routes. Once the elevation profile was generated, the road grade was estimated from the horizontal and vertical distances. A subsequent second-by-second speed profile was then generated, accounting for the posted speed limit of the route. For this analysis, the vehicles' maximum speed was assumed to be 20 km/h because this is the current safe operating speed demonstrated by e-LSAs in global trials relative to the performance and speed of automated sensory system technologies (i.e. LiDAR, radar, ultrasonic sensors). To note, the shuttle engines can propel the vehicles up to speeds of 60 km/h at a zero per cent road grade. Therefore,
CUTRIC-CRITUC Low-Carbon Smart Mobility Knowledge Series No. 3 2020 Edition 1.0
21
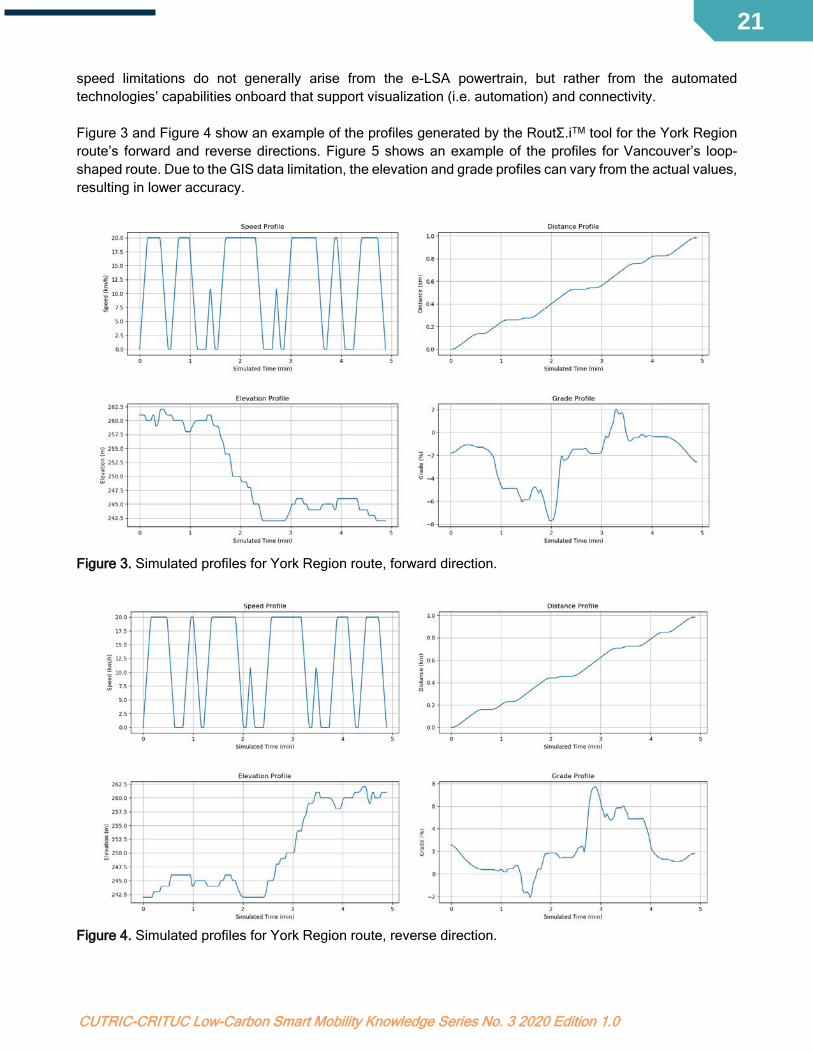
speed limitations do not generally arise from the e-LSA powertrain, but rather from the automated technologies’ capabilities onboard that support visualization (i.e. automation) and connectivity. Figure 3 and Figure 4 show an example of the profiles generated by the RoutΣ.iTM tool for the York Region route’s forward and reverse directions. Figure 5 shows an example of the profiles for Vancouver’s loop-shaped route. Due to the GIS data limitation, the elevation and grade profiles can vary from the actual values, resulting in lower accuracy.
Figure 3. Simulated profiles for York Region route, forward direction.
Figure 4. Simulated profiles for York Region route, reverse direction.
CUTRIC-CRITUC Low-Carbon Smart Mobility Knowledge Series No. 3 2020 Edition 1.0
22
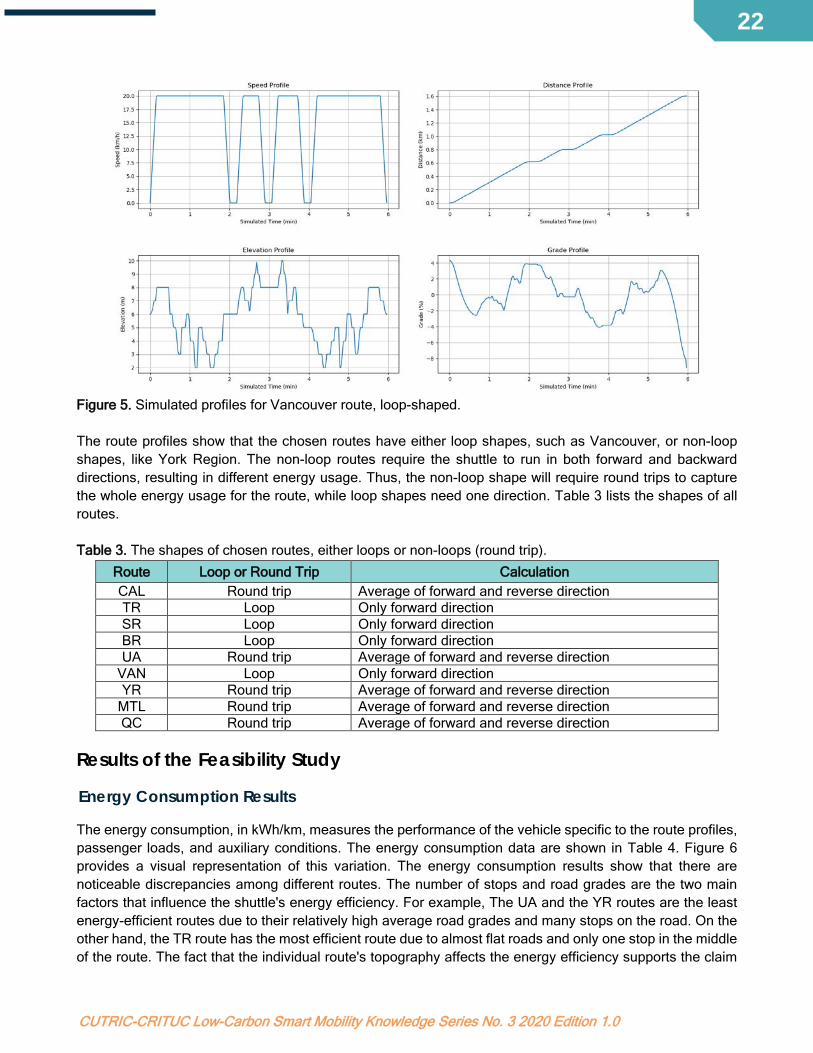
Figure 5. Simulated profiles for Vancouver route, loop-shaped. The route profiles show that the chosen routes have either loop shapes, such as Vancouver, or non-loop shapes, like York Region. The non-loop routes require the shuttle to run in both forward and backward directions, resulting in different energy usage. Thus, the non-loop shape will require round trips to capture the whole energy usage for the route, while loop shapes need one direction. Table 3 lists the shapes of all routes. Table 3. The shapes of chosen routes, either loops or non-loops (round trip).
Route Loop or Round Trip Calculation CAL Round trip Average of forward and reverse direction TR Loop Only forward direction SR Loop Only forward direction BR Loop Only forward direction UA Round trip Average of forward and reverse direction
VAN Loop Only forward direction YR Round trip Average of forward and reverse direction
MTL Round trip Average of forward and reverse direction QC Round trip Average of forward and reverse direction
Results of the Feasibility Study
Energy Consumption Results
The energy consumption, in kWh/km, measures the performance of the vehicle specific to the route profiles, passenger loads, and auxiliary conditions. The energy consumption data are shown in Table 4. Figure 6 provides a visual representation of this variation. The energy consumption results show that there are noticeable discrepancies among different routes. The number of stops and road grades are the two main factors that influence the shuttle's energy efficiency. For example, The UA and the YR routes are the least energy-efficient routes due to their relatively high average road grades and many stops on the road. On the other hand, the TR route has the most efficient route due to almost flat roads and only one stop in the middle of the route. The fact that the individual route's topography affects the energy efficiency supports the claim

CUTRIC-CRITUC Low-Carbon Smart Mobility Knowledge Series No. 3 2020 Edition 1.0
23
that it is crucial to use a route-based modelling tool to better capture actual road topographies and predict more precise vehicle performance ranges. Table 4. Energy efficiency (kWh/km) of the vehicle.
Route Light-Duty Cycle Medium-Duty Cycle Heavy-Duty Cycle CAL 0.22 0.49 0.75 TR 0.18 0.43 0.69 SR 0.29 0.66 1.02 BR 0.24 0.57 0.91 UA 0.34 0.72 1.11
VAN 0.22 0.52 0.81 YR 0.31 0.70 1.10
MTL 0.32 0.64 0.95 QC 0.29 0.56 0.82
Figure 6. Variations in medium-duty cycle energy consumption results for the vehicle. The total kWh/km per passenger, shown in Figure 7, is a relative comparative metric for the vehicle. Note: as no passenger is on board for the light-duty cycle, the figure only shows medium and heavy-duty cycle results. The vehicle under heavy-duty cycle consumes more energy in total than medium-duty cycle on a per kilometre basis, but uses less energy than medium-duty cycle on a per passenger per kilometre basis.

CUTRIC-CRITUC Low-Carbon Smart Mobility Knowledge Series No. 3 2020 Edition 1.0
24
Figure 7. The vehicle’s energy efficiency on a per kilometre and per passenger basis for medium and heavy-duty cycles.
State-of-Charge and Charging-Time Results
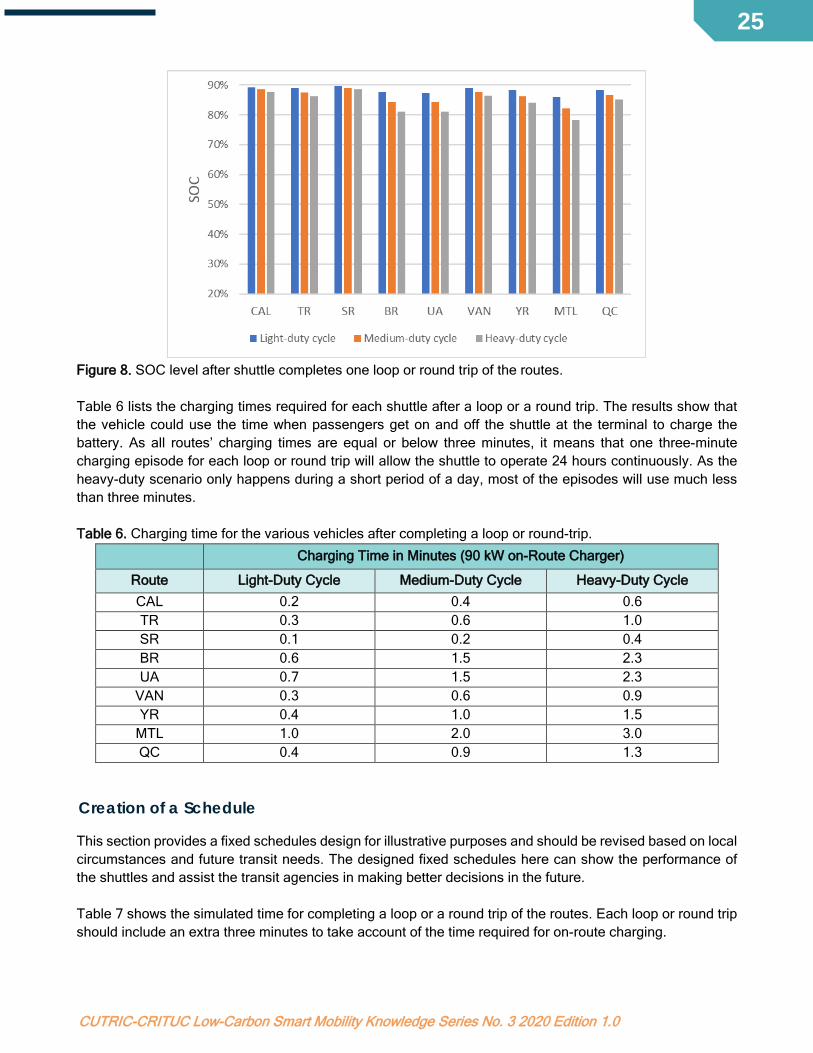
The state-of-charge (SOC) of a battery measures the remaining energy stored in the battery. The SOC is affected by battery chemistry and battery management systems. The vehicle’s manufacturer requires the shuttle to operate within a specific SOC range, i.e., between 20 and 90 per cent, to maintain the battery’s health and prevent excessive battery degradation. If the battery depletes to the minimum SOC limit of 20 per cent, the vehicle would theoretically require 18 minutes to fully recharge to 90 per cent SOC using its 90 kW on-route charging system. Table 5 shows the energy usage for completing one loop or a round trip of the routes. Figure 8 shows the remaining SOC level after the shuttle completes a loop trip or round trip. The SOC is lowest in heavy-duty cycle due to the highest passenger load and auxiliary load applied to the heavy-duty cycle. The Montreal route uses the most energy due to its long distance, multiple stops and relatively hilly road. Table 5. Energy usage (kWh) for completing one loop or round trips.
Route Light-Duty Cycle Medium-Duty Cycle Heavy-Duty Cycle
CAL 0.25 0.55 0.85 TR 0.37 0.89 1.42 SR 0.15 0.33 0.52 BR 0.86 2.07 3.28 UA 0.99 2.12 3.25
VAN 0.36 0.83 1.31 YR 0.61 1.38 2.16
MTL 1.45 2.88 4.30 QC 0.63 1.21 1.80
CUTRIC-CRITUC Low-Carbon Smart Mobility Knowledge Series No. 3 2020 Edition 1.0
25
Figure 8. SOC level after shuttle completes one loop or round trip of the routes. Table 6 lists the charging times required for each shuttle after a loop or a round trip. The results show that the vehicle could use the time when passengers get on and off the shuttle at the terminal to charge the battery. As all routes’ charging times are equal or below three minutes, it means that one three-minute charging episode for each loop or round trip will allow the shuttle to operate 24 hours continuously. As the heavy-duty scenario only happens during a short period of a day, most of the episodes will use much less than three minutes. Table 6. Charging time for the various vehicles after completing a loop or round-trip.
Charging Time in Minutes (90 kW on-Route Charger)
Route Light-Duty Cycle Medium-Duty Cycle Heavy-Duty Cycle CAL 0.2 0.4 0.6 TR 0.3 0.6 1.0 SR 0.1 0.2 0.4 BR 0.6 1.5 2.3 UA 0.7 1.5 2.3
VAN 0.3 0.6 0.9 YR 0.4 1.0 1.5
MTL 1.0 2.0 3.0 QC 0.4 0.9 1.3
Creation of a Schedule
This section provides a fixed schedules design for illustrative purposes and should be revised based on local circumstances and future transit needs. The designed fixed schedules here can show the performance of the shuttles and assist the transit agencies in making better decisions in the future. Table 7 shows the simulated time for completing a loop or a round trip of the routes. Each loop or round trip should include an extra three minutes to take account of the time required for on-route charging.
CUTRIC-CRITUC Low-Carbon Smart Mobility Knowledge Series No. 3 2020 Edition 1.0
26
Table 7. Simulated time for completing a loop or round trip.
Route Loop or Round Trip Minutes (Not Including
On-Route Charging Time)
Minutes (Including On-Route Charging Time)
CAL Round trip 3.7 6.7 TR Loop 6.7 9.7 SR Loop 2.4 5.4 BR Loop 15.4 18.4 UA Round trip 13.9 16.9
VAN Loop 6.0 9.0 YR Round trip 9.8 12.8
MTL Round trip 16.9 19.9 QC Round trip 6.9 9.9
For the CAL route, a special schedule is created based on the operating hours of both the Calgary Zoo and the Telus Spark Science Centre. The Calgary Zoo is open daily between 9 a.m. and 5 p.m. MST, and the Telus Spark Science Centre is open daily between 10 a.m. and 4 p.m. MST. Therefore, it is assumed this route operates eight hours daily from 9 a.m. to 5 p.m. As the time for a round trip time is less than 10 minutes, as shown in Table 7, CUTRIC designs the frequency for this route as every 10 minutes. Thus, the CAL shuttle should complete 48 round trips per day based on this schedule. A more general schedule is created for the remaining routes, assuming 13 hours of operation. If the route requires less than 15 minutes to complete, the shuttle leaves the starting point every 15 minutes. For routes requiring more than 15 minutes but less than 20 minutes to complete, the shuttle leaves every 20 minutes from the starting location. For the less-than-15 minutes case, the shuttle should be able to complete 52 loops or round trips per day. For more-than-15-minutes case, the shuttles should be able to complete 39 loops or round trips per day. When there are on-route chargers available, there is no problem for the vehicle to complete all of the trips. However, it is a different story if the on-route chargers are not available, i.e., if only the depot has the charger.
Round Trips Completed Before Recharge Required
Table 8 compares the scheduled daily number of trips with the maximum number of loops or round trips the modelled shuttle can complete if an on-route charger is not available. (Note: the energy used by the auxiliary load during passengers onboard and offboard is not included.) The values of the routes where the shuttles can complete the daily schedules are shown in green. For most of the cases, the shuttles cannot complete the designed number of trips per day. Therefore, it is recommended to either have on-route chargers on the road, or reduce the frequency of the service and use an on-demand service instead of a fixed schedule.

CUTRIC-CRITUC Low-Carbon Smart Mobility Knowledge Series No. 3 2020 Edition 1.0
27
Table 8. Maximum number of loops or round trips if an on-route charger is not available based on simulation results. Note the numbers in green indicate the vehicle is able to complete the designed daily service.
Route Scheduled No. of
Trips Light-Duty Cycle
Medium-Duty Cycle
Heavy-Duty Cycle
CAL 48 101 46 30 TR 52 69 28 18 SR 52 176 77 49 BR 39 29 12 7 UA 39 26 12 7
VAN 52 71 30 19 YR 52 42 18 11
MTL 39 17 8 5 QC 52 40 21 14
Table 9 outlines the total service time each e-LSA would be available on each route based on the number of round trips the shuttle can perform before depleting the battery to minimum SOC. (Note: the time for on-route charging is not included.) The time is much shorter than the designed schedule, meaning it is necessary to have on-route chargers available for the shuttle. Table 9. Simulation results of e-LSA’s total service time before depleting the battery to a minimum SOC and requiring a recharge.
Route Light-Duty Cycle Medium-Duty Cycle Heavy-Duty Cycle
CAL 5.9 hours 2.8 hours 1.8 hours TR 7.7 hours 3.1 hours 2.0 hours SR 7.0 hours 3.1 hours 2.0 hours BR 7.4 hours 3.1 hours 1.8 hours UA 6.0 hours 2.8 hours 1.6 hours
VAN 6.9 hours 3.0 hours 1.9 hours YR 6.9 hours 2.9 hours 1.8 hours
MTL 4.8 hours 2.3 hours 1.7 hours QC 4.7 hours 2.4 hours 1.6 hours
The assumptions made in scheduling shuttles should be revised based on local circumstances and future transit needs. For example, some projects in Europe do not deploy shuttles with fixed schedules, but rather use variable on-demand schedules. Typically, a larger number of shuttles are in service during peak commuting hours, while lower numbers are in service during mid-day low off-peak periods (e.g. congestion or peak-period relief). A similar approach can be used for this analysis in the future.
Conclusions and Future Steps This section has highlighted the e-LSA shuttle’s performance results for nine chosen routes across Canada, which are identified by transit agencies and municipalities as potential candidates for e-LSA demonstration projects. These routes are currently not mixed with traffic as the operating speed of the shuttle is only about 20 km/h. The simulation results show that if one three-minute on-route charging episode is allowed for each loop, or round trip, the shuttle can operate 24 hours continuously. Allowing 24-hour continuous operation is the advantage of using on-route chargers. The number of shuttles required on a route will depend on the desired frequency of service, length of route and required charging times. Predictive analysis of route completion time will help ensure the schedule allows
CUTRIC-CRITUC Low-Carbon Smart Mobility Knowledge Series No. 3 2020 Edition 1.0
28
for adequate buffer time for route completion, rider boarding and alighting, as well as charging times. If a higher schedule frequency is desired, additional shuttles may be required. Depending on route requirements, shuttle scheduling should be optimized to provide a higher frequency service during peak hours and lower frequency during non-peak hours. In many instances, providing an on-demand e-LSA offering would optimize the service. On-demand service can be used for the whole day or, alternatively, a fixed schedule can be deployed during on-peak hours and an on-demand service used during off-peak hours. The optimal solution depends on the jurisdiction and route. Charging schedules should also be optimized to minimize demand charges and the potential constraints of certain charging systems (e.g. the requirement of shuttles to return to a depot to recharge during the day). The location of the charging infrastructure is critical to the service availability of a shuttle. It is often suggested that charging systems should be located as close as possible to the route. For a long route with heavy-duty usage, it is recommended to have on-route chargers to extend the operation time. Further discussions are required with the manufacturers to obtain actual operation data to verify the reliability and validity of the model prediction.

CUTRIC-CRITUC Low-Carbon Smart Mobility Knowledge Series No. 3 2020 Edition 1.0
29
SECTION II: TRANSIT RIDERSHIP IMPACT ANALYSIS This section outlines the methodology and preliminary transit ridership impact analysis results for first-kilometre/last-kilometre e-LSA applications identified as part of this project. Methodologically, this process begins with an overview of a standard four-step modelling framework that explores the impact of e-LSAs on transit ridership. As there are no primary or secondary data sets available at the time of writing this report, CUTRIC has chosen to explore three case studies based on a predetermined set of assumptions to examine how, and to what degree, e-LSAs could improve transit ridership and reduce car usage. CUTRIC has developed two independent assumptions and four scenarios to enable further analysis of e-LSAs’ impact on transit ridership.
1. The first assumption addresses an increase in the percentage of transit ridership as a result of introducing e-LSAs into the current system based on the four-step transportation model explained below.
2. The second assumption deals with the percentage of transit riders who will be using shuttles to get to an associated transit station.
Four-Step Transportation Model The four-step transportation model consists of trip generation, trip distribution, mode split and traffic assignment [14]. Trip generation predicts the number of trips produced from each traffic zone, typically as a function of socioeconomic characteristics. Trip distribution predicts the routes of selected trips. (The four-step model links the origin and destination points produced by the trip generation model.) Mode split predicts the proportion of trips made by each mode of travel between the origin and destination. Mode choice is often based on the concept of utility, where travelers choose the modes that maximize their utility functions [15]. The utility function in this case defines travellers’ preferences for a given set of available travel modes and is typically calculated based on travellers’ socioeconomic characteristics and attributes of available modes [16]. Traffic assignment predicts which route is used during the trip, which is also calculated using the utility function, given travel time and cost measures, as well as travel system conditions (e.g. user equilibrium) [17]. This subsection examines primary factors active in determining each step of the four-step transportation model. CUTRIC explores how e-LSAs could potentially impact each of these steps and their resulting effects on transit demand.
Trip Generation
With e-LSAs in operation, disabled, elderly and those without a driver’s licence who cannot drive or walk to transit stations may realize a new way of accessing the transit system, hence increasing the number of trips generated [18].

CUTRIC-CRITUC Low-Carbon Smart Mobility Knowledge Series No. 3 2020 Edition 1.0
30
The convenience and comfort of using e-LSAs will have an additional positive impact on the number of trips generated. It is likely that e-LSAs will increase comfort by reducing driving and parking stress that arise from trying to find a parking spot at congested transit lots in time to catch the next train or bus. E-LSAs can also potentially decrease total travel time by operating in a dedicated laneway and, therefore, with less traffic congestion impeding their flow. Since travel time is one of the main factors in how travellers perceive costs, travel demand may increase due to a reduction in total travel time once e-LSAs are in operation. E-LSAs may also reduce total travel costs by eliminating the need for private vehicles, which are found to be more costly over the ownership life cycle as compared to transit usage. With reductions in both mobility barriers and overall costs, it is expected that e-LSA deployments will increase transit ridership overall. Although further reliable data are required to validate these trip generation outcomes, these factors strongly suggest e-LSAs will lead to an increase in the number of trips generated, as well as an increase in overall transit ridership [19].
Trip Distribution
E-LSAs are mainly deployed on first-kilometre/last-kilometre routes in urban, suburban and rural areas that have no transit service, or are underserved by transit. The shuttles would link riders to transit, displacing car trips either to the transit hub (removing the need for large parking lots) or to the final trip destination. For first-kilometre/last-kilometre routes that are only one to two kilometres in length, urban density is a key factor to consider in optimizing a deployment route due to expected higher ridership [18]. As the technology continues to develop and can provide services along longer and more flexible routes, e-LSAs will be able to provide critical lower-cost transit or accessibility solutions to rural areas.
Mode Split
E-LSAs could support the integration of a new mode of travel called “micro-transit” – a hybrid of shuttle and conventional transit systems – by serving as one of the main modes of transportation for commuters travelling between their origin and destination [20]. Micro-transit is defined as multi-passenger transportation services that are IT-enabled to serve riders using dynamically generated routes. E-LSAs often require the passenger to walk to and from their pick-up and drop-off location to optimize the route [21]. Micro-transit is expected to increase ridership due to mode shift from private vehicles toward e-LSAs. This shift could be substantial, especially in cases where e-LSA travel time and costs are significantly lower than those of private vehicles [18] and, therefore, could potentially reduce the number of vehicles owned per household.
Traffic Assignment
As previously stated, e-LSAs could shorten travel times, especially with strict adherence to schedules. Thus, they could increase the likelihood of commuters using shuttles over individual passenger cars [18]. Furthermore, if e-LSAs are assigned to dedicated lanes and offered transit signal priority at intersections, thereby significantly increasing the average speed of the shuttles and decreasing travel delays, e-LSA route utility would be high and would likely increase transit ridership. Additionally, on-demand e-LSAs deployed during off-peak hours may encourage people to use the service routes if they knew a shuttle would provide service within a reasonable time frame.
CUTRIC-CRITUC Low-Carbon Smart Mobility Knowledge Series No. 3 2020 Edition 1.0
31
For the purpose of this report, the routes identified in the case studies range from one to 11 minutes for an e-LSA to complete a single trip, which means on-demand wait times would be a maximum of 15 minutes, but could be significantly less with shorter routes and additional e-LSAs.
Case Studies Suited for First-Kilometre/Last-Kilometre Applications In this section, the transit ridership impacts resulting from three routes will be assessed: Trois-Rivières (TR), York Region (YR) and Brampton (BR). These routes traverse selected neighbourhoods within each jurisdiction and link routes that are not currently served by transit to an existing transit hub (e.g. a bus station, a bus rapid transit station or a train station). These routes were selected as case studies because they represent strong potential for first-kilometre/last-kilometre e-LSA deployments. This section is separated into three subsections:
1. The first details the energy consumption and charging times for the three routes outlined in Section I.
2. The second details GIS mapping results from the neighbourhoods near the routes, which help to determine the number of households and parking spots located on or near the route.
3. The third subsection describes different ridership scenarios to assess how many cars could theoretically be removed from roadways if e-LSAs were implemented under differing assumptions and scenarios.
Route Profiles and Energy Consumption: Summary from Section I
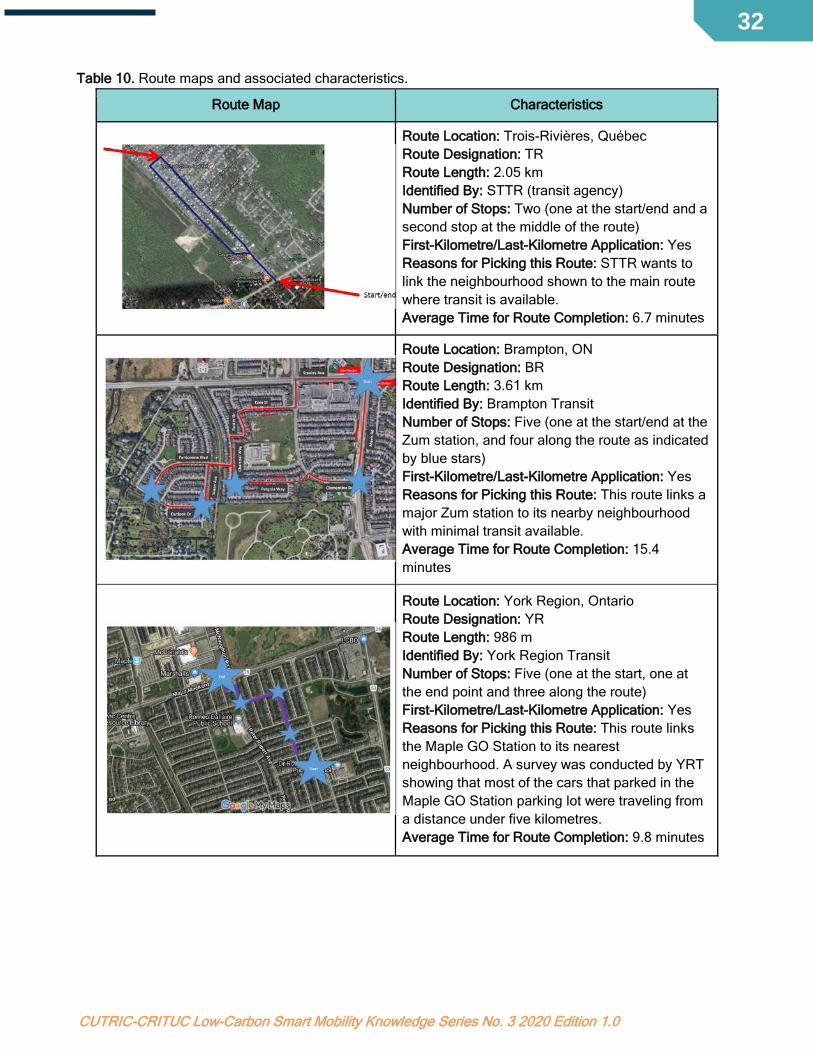
The three routes that are considered in this report are listed in Table 10, alongside their associated route characteristics. In this report, time to complete the route was added as this is a key metric to build an optimized shuttle schedule.
CUTRIC-CRITUC Low-Carbon Smart Mobility Knowledge Series No. 3 2020 Edition 1.0
32
Table 10. Route maps and associated characteristics.
Route Map Characteristics
Route Location: Trois-Rivières, Québec Route Designation: TR Route Length: 2.05 km Identified By: STTR (transit agency) Number of Stops: Two (one at the start/end and a second stop at the middle of the route) First-Kilometre/Last-Kilometre Application: Yes Reasons for Picking this Route: STTR wants to link the neighbourhood shown to the main route where transit is available. Average Time for Route Completion: 6.7 minutes
Route Location: Brampton, ON Route Designation: BR Route Length: 3.61 km Identified By: Brampton Transit Number of Stops: Five (one at the start/end at the Zum station, and four along the route as indicated by blue stars) First-Kilometre/Last-Kilometre Application: Yes Reasons for Picking this Route: This route links a major Zum station to its nearby neighbourhood with minimal transit available. Average Time for Route Completion: 15.4 minutes
Route Location: York Region, Ontario Route Designation: YR Route Length: 986 m Identified By: York Region Transit Number of Stops: Five (one at the start, one at the end point and three along the route) First-Kilometre/Last-Kilometre Application: Yes Reasons for Picking this Route: This route links the Maple GO Station to its nearest neighbourhood. A survey was conducted by YRT showing that most of the cars that parked in the Maple GO Station parking lot were traveling from a distance under five kilometres. Average Time for Route Completion: 9.8 minutes
CUTRIC-CRITUC Low-Carbon Smart Mobility Knowledge Series No. 3 2020 Edition 1.0
33
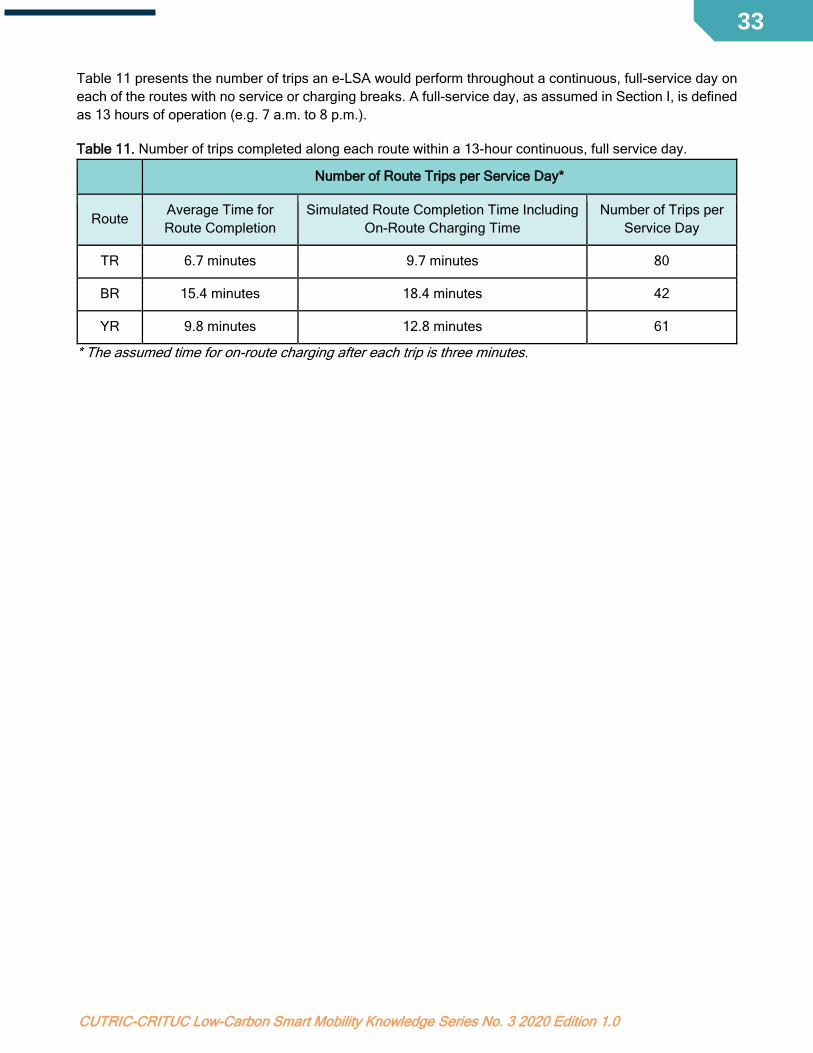
Table 11 presents the number of trips an e-LSA would perform throughout a continuous, full-service day on each of the routes with no service or charging breaks. A full-service day, as assumed in Section I, is defined as 13 hours of operation (e.g. 7 a.m. to 8 p.m.).
Table 11. Number of trips completed along each route within a 13-hour continuous, full service day.
Number of Route Trips per Service Day*
Route Average Time for Route Completion
Simulated Route Completion Time Including On-Route Charging Time
Number of Trips per Service Day
TR 6.7 minutes 9.7 minutes 80
BR 15.4 minutes 18.4 minutes 42
YR 9.8 minutes 12.8 minutes 61
* The assumed time for on-route charging after each trip is three minutes.

CUTRIC-CRITUC Low-Carbon Smart Mobility Knowledge Series No. 3 2020 Edition 1.0
34
Table 12 shows the number of round trips a given e-LSA can perform before it requires a full recharge. These results will help to establish an optimized schedule in the following sub-section.
Table 12. Number of rounds trips along the three selected routes that can be performed before the e-LSA requires a full recharge.
Number of Round Trips
Route Light-Duty Cycle Medium-Duty Cycle Heavy-Duty Cycle
TR 69 28 18
BR 29 12 7
YR 42 18 11
Route Mapping
CUTRIC worked with the aforementioned cities to gather data pertaining to their current ridership metrics. Available data sets were presented in differing formats and with varying gaps across the different cities, rendering it difficult to standardize the data for mapping and comparison purposes; therefore, CUTRIC developed a new methodology based on GIS digitization to estimate the potential number of users who would onboard and off the variously applied e-LSAs if the vehicles were deployed on the routes provided. GIS data were used to determine the number of housing units, estimated vehicle ownership per household, and estimated population density along each route. The results of GIS digitization are shown below.
GIS Data Sources
For Brampton and York Region, the geographical information for the provided routes was available through an overpass application programming interface (API). For the case of Trois-Rivières, “manual” digitization of the neighbourhood was required to extract sufficient geographical information. For all routes, an open source AI-generated map platform was used to calculate the number of houses (e.g. detached houses, semi-detached houses, residential buildings) and the area of residential building parking space (in square metres) within a 200-metre radius of the e-LSA route. Satellite images were also used to determine the parking capacity of public parking lots located within a 200-metre radius of the routes. In the case of York Region, the parking capacity of the Maple GO Station was provided directly by York Region Transit. The ratio of the numbers of cars relative to the overall parking space was determined to be 0.035 cars/m2 for this lot. The same ratio was used as an assumption to determine the percentage of reduction in parking areas that would result from e-LSA deployments as first-kilometre/last-kilometre applications on the proposed routes.

CUTRIC-CRITUC Low-Carbon Smart Mobility Knowledge Series No. 3 2020 Edition 1.0
35
Trois-Rivières Route
Figure 9 shows results of the digitization process for the Trois-Rivières route. A total of 459 houses were determined to be within a 200-metre radius of the route. Two parking lots were also identified to lie within a 200-metre radius, with an estimated capacity of 39 vehicles.
Figure 9. Parking areas and houses within a 200-metre radius of the Trois-Rivières route.
CUTRIC-CRITUC Low-Carbon Smart Mobility Knowledge Series No. 3 2020 Edition 1.0
36
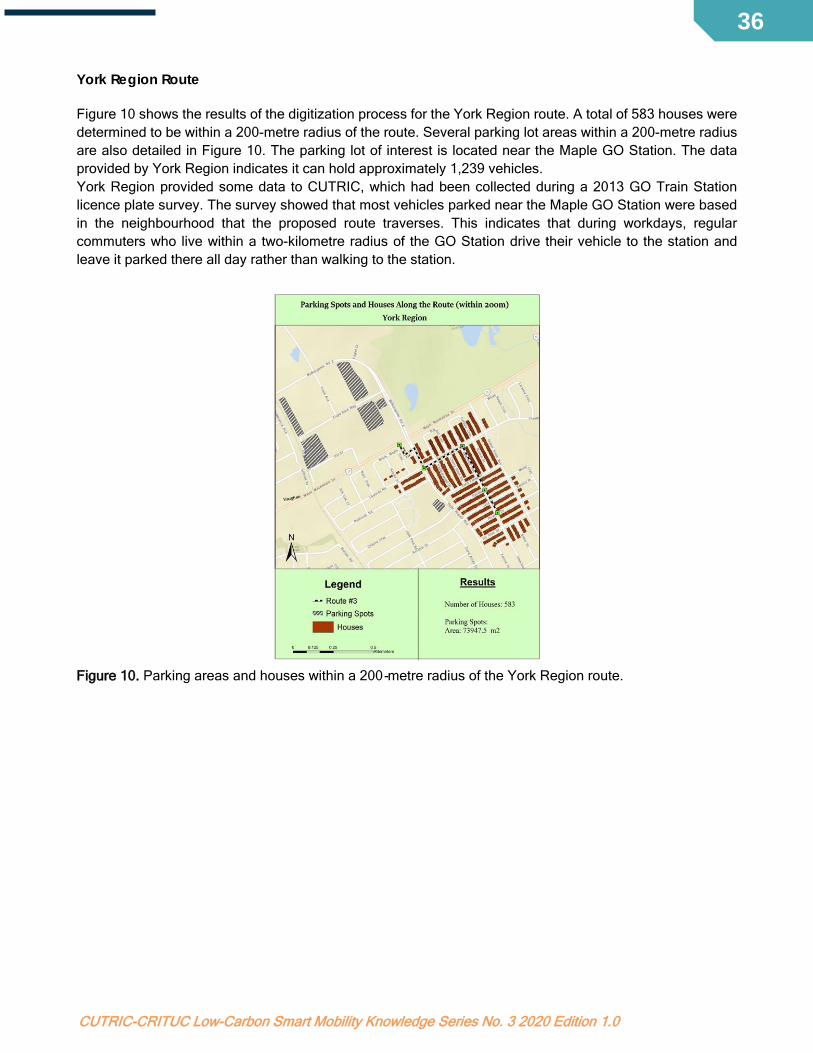
York Region Route
Figure 10 shows the results of the digitization process for the York Region route. A total of 583 houses were determined to be within a 200-metre radius of the route. Several parking lot areas within a 200-metre radius are also detailed in Figure 10. The parking lot of interest is located near the Maple GO Station. The data provided by York Region indicates it can hold approximately 1,239 vehicles. York Region provided some data to CUTRIC, which had been collected during a 2013 GO Train Station licence plate survey. The survey showed that most vehicles parked near the Maple GO Station were based in the neighbourhood that the proposed route traverses. This indicates that during workdays, regular commuters who live within a two-kilometre radius of the GO Station drive their vehicle to the station and leave it parked there all day rather than walking to the station.
Figure 10. Parking areas and houses within a 200-metre radius of the York Region route.

CUTRIC-CRITUC Low-Carbon Smart Mobility Knowledge Series No. 3 2020 Edition 1.0
37
Brampton Route
Figure 11 shows the results of the digitization process for the Brampton route: 631 houses were identified within a 200-metre radius of the provided route. Parking lot areas are indicated in Figure 11 and can hold approximately 794 vehicles.
Figure 11. Parking areas and houses within a 200-metre radius of the BR route.

CUTRIC-CRITUC Low-Carbon Smart Mobility Knowledge Series No. 3 2020 Edition 1.0
38
Transit Hub Schedule
It is important to understand the current transit landscape associated with each proposed e-LSA route to plan the shuttle deployment accurately and to ensure that first-kilometre/last-kilometre deployments occur on routes that maximize their expected benefits. A general schedule can be developed in each case using the energy-consumption and charging-time results that are unique to each city and are aligned with existing daily transit schedules.
Trois-Rivières Route
In Trois-Rivières, bus route #9 is routed through Chemin Ste. Marguerite and no other bus routes go through the neighbourhood shown in Figure 12. A commuter, therefore, must walk up to 22 minutes to catch bus #9 to commute to the downtown area. Deploying an e-LSA along this route would provide a first-kilometre/last-kilometre link and would incentivize residents to use transit rather than driving downtown, especially for individuals for whom walking 22 minutes (in all seasons) constitutes a barrier to using transit. The e-LSA would reduce connection time to bus #9 from a maximum walking time of 22 minutes to under four minutes.
Figure 12. Typical trip for a resident of the targeted neighbourhood to commute to downtown Trois-Rivières.
CUTRIC-CRITUC Low-Carbon Smart Mobility Knowledge Series No. 3 2020 Edition 1.0
39
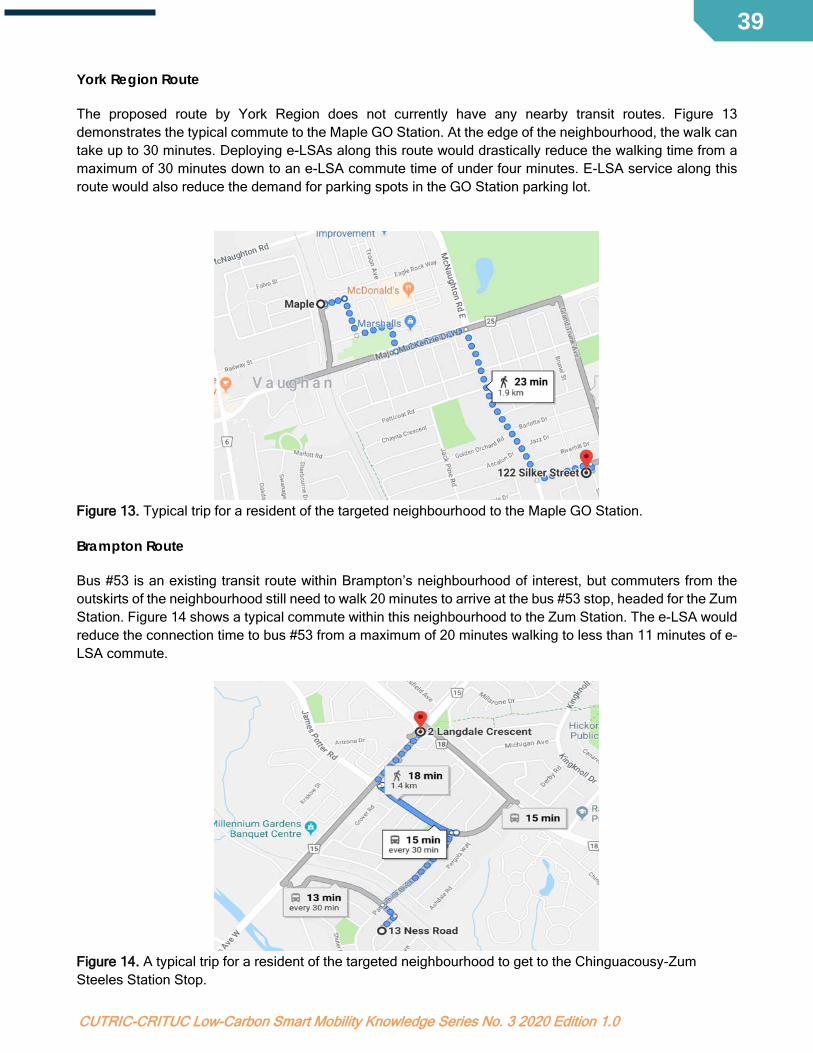
York Region Route
The proposed route by York Region does not currently have any nearby transit routes. Figure 13 demonstrates the typical commute to the Maple GO Station. At the edge of the neighbourhood, the walk can take up to 30 minutes. Deploying e-LSAs along this route would drastically reduce the walking time from a maximum of 30 minutes down to an e-LSA commute time of under four minutes. E-LSA service along this route would also reduce the demand for parking spots in the GO Station parking lot.
Figure 13. Typical trip for a resident of the targeted neighbourhood to the Maple GO Station.
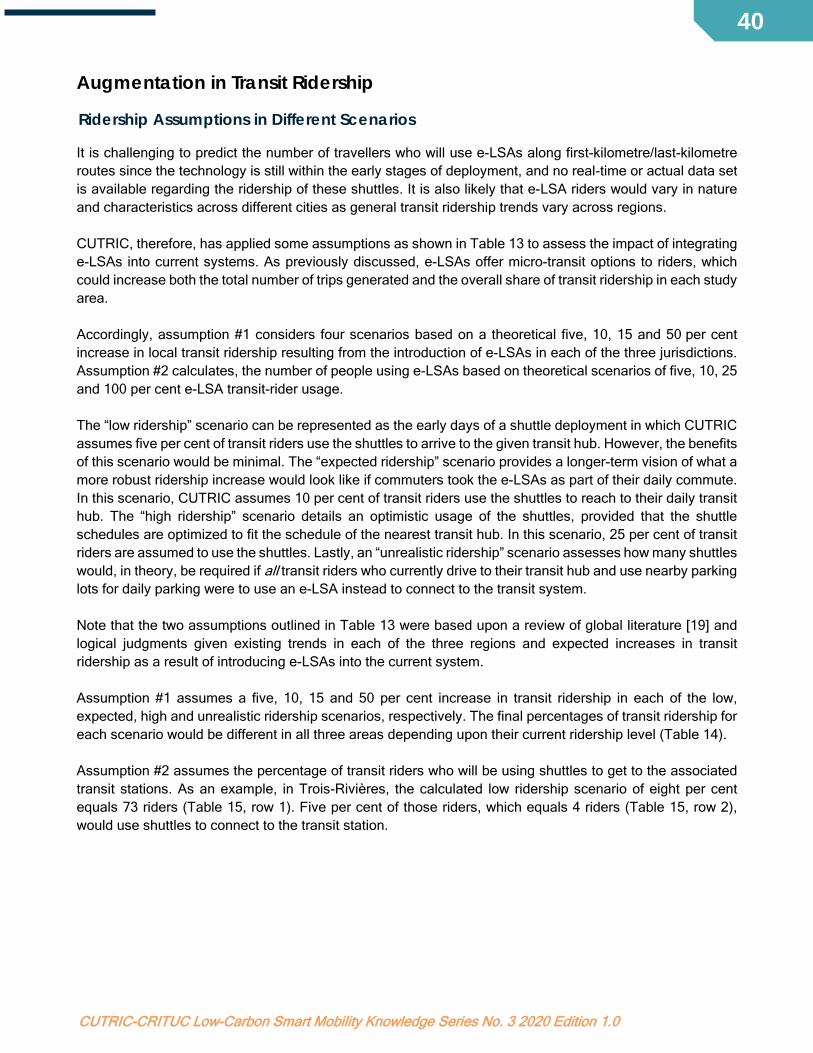
Brampton Route
Bus #53 is an existing transit route within Brampton’s neighbourhood of interest, but commuters from the outskirts of the neighbourhood still need to walk 20 minutes to arrive at the bus #53 stop, headed for the Zum Station. Figure 14 shows a typical commute within this neighbourhood to the Zum Station. The e-LSA would reduce the connection time to bus #53 from a maximum of 20 minutes walking to less than 11 minutes of e-LSA commute.
Figure 14. A typical trip for a resident of the targeted neighbourhood to get to the Chinguacousy-Zum Steeles Station Stop.
CUTRIC-CRITUC Low-Carbon Smart Mobility Knowledge Series No. 3 2020 Edition 1.0
40
Augmentation in Transit Ridership
Ridership Assumptions in Different Scenarios
It is challenging to predict the number of travellers who will use e-LSAs along first-kilometre/last-kilometre routes since the technology is still within the early stages of deployment, and no real-time or actual data set is available regarding the ridership of these shuttles. It is also likely that e-LSA riders would vary in nature and characteristics across different cities as general transit ridership trends vary across regions. CUTRIC, therefore, has applied some assumptions as shown in Table 13 to assess the impact of integrating e-LSAs into current systems. As previously discussed, e-LSAs offer micro-transit options to riders, which could increase both the total number of trips generated and the overall share of transit ridership in each study area. Accordingly, assumption #1 considers four scenarios based on a theoretical five, 10, 15 and 50 per cent increase in local transit ridership resulting from the introduction of e-LSAs in each of the three jurisdictions. Assumption #2 calculates, the number of people using e-LSAs based on theoretical scenarios of five, 10, 25 and 100 per cent e-LSA transit-rider usage. The “low ridership” scenario can be represented as the early days of a shuttle deployment in which CUTRIC assumes five per cent of transit riders use the shuttles to arrive to the given transit hub. However, the benefits of this scenario would be minimal. The “expected ridership” scenario provides a longer-term vision of what a more robust ridership increase would look like if commuters took the e-LSAs as part of their daily commute. In this scenario, CUTRIC assumes 10 per cent of transit riders use the shuttles to reach to their daily transit hub. The “high ridership” scenario details an optimistic usage of the shuttles, provided that the shuttle schedules are optimized to fit the schedule of the nearest transit hub. In this scenario, 25 per cent of transit riders are assumed to use the shuttles. Lastly, an “unrealistic ridership” scenario assesses how many shuttles would, in theory, be required if all transit riders who currently drive to their transit hub and use nearby parking lots for daily parking were to use an e-LSA instead to connect to the transit system. Note that the two assumptions outlined in Table 13 were based upon a review of global literature [19] and logical judgments given existing trends in each of the three regions and expected increases in transit ridership as a result of introducing e-LSAs into the current system. Assumption #1 assumes a five, 10, 15 and 50 per cent increase in transit ridership in each of the low, expected, high and unrealistic ridership scenarios, respectively. The final percentages of transit ridership for each scenario would be different in all three areas depending upon their current ridership level (Table 14). Assumption #2 assumes the percentage of transit riders who will be using shuttles to get to the associated transit stations. As an example, in Trois-Rivières, the calculated low ridership scenario of eight per cent equals 73 riders (Table 15, row 1). Five per cent of those riders, which equals 4 riders (Table 15, row 2), would use shuttles to connect to the transit station.

CUTRIC-CRITUC Low-Carbon Smart Mobility Knowledge Series No. 3 2020 Edition 1.0
41
Table 13. Scenario assumptions #1 and #2 to assess the theoretical impact of e-LSA integration.
Additional Assumptions
Trois-Rivières, Brampton and York Region demonstrate varying numbers of average residents per household, as listed in Statistics Canada’s database. In addition, York Region conducted a survey in 2015, wherein it calculated the average number of vehicles per household (1.86 vehicles). Such data sets are not available for Trois-Rivières or Brampton, so the average number of vehicles per household was assumed to be the same as York Region (Table 14). Each of the selected routes links to a different type of transit hub: regular bus station for Trois-Rivières, bus rapid transit station for Brampton, and train station for York Region. This report assumes the transit ridership in each area is a proxy for transit ridership in the three small neighbourhoods selected for this analysis, as shown in Table 14. CUTRIC also uses the average regional household size and the number of houses as two parameters to estimate the number of people living in each neighbourhood. The number of round trips required to transport commuters is calculated using the assumption that the shuttle is, on average, at 50 per cent of its maximum passenger capacity. CUTRIC assumes an average of 50 per cent passenger capacity to align with the shuttles operating in the medium-duty cycle to avoid over or underestimating results when calculating the number of round trips for each route. For the simulated shuttle vehicle, it represents 11 passengers. For the sake of this study, CUTRIC assumes that car and transit are the only modes of transportation available to travellers and, thus, the percentage increase in transit ridership will result in a similar reduction in the number of cars from households. Finally, CUTRIC assumes that all travellers’ vehicles are single occupancy.
Low Ridership Expected Ridership
High Ridership Unrealistic Ridership (All
Transit Riders Use Shuttles)
Assumption #1 5% increase in transit ridership
10% increase in transit ridership
15% increase in transit ridership
50% increase in transit ridership
Assumption #2 5% of transit riders use the
shuttles
10% of transit riders use the
shuttles
25% of transit riders use the
shuttles
100% of transit riders use the shuttles
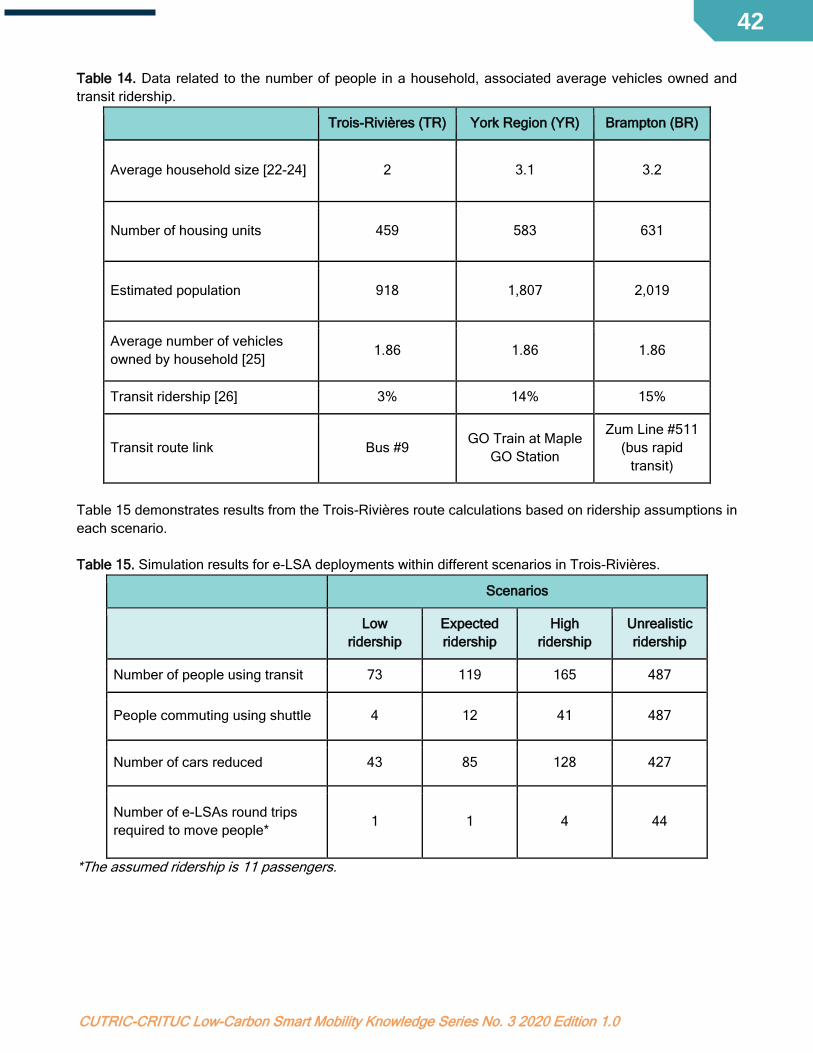
CUTRIC-CRITUC Low-Carbon Smart Mobility Knowledge Series No. 3 2020 Edition 1.0
42
Table 14. Data related to the number of people in a household, associated average vehicles owned and transit ridership.
Trois-Rivières (TR) York Region (YR) Brampton (BR)
Average household size [22-24] 2 3.1 3.2
Number of housing units 459 583 631
Estimated population 918 1,807 2,019
Average number of vehicles owned by household [25]
1.86 1.86 1.86
Transit ridership [26] 3% 14% 15%
Transit route link Bus #9 GO Train at Maple
GO Station
Zum Line #511 (bus rapid
transit)
Table 15 demonstrates results from the Trois-Rivières route calculations based on ridership assumptions in each scenario. Table 15. Simulation results for e-LSA deployments within different scenarios in Trois-Rivières.
Scenarios
Low
ridership Expected ridership
High ridership
Unrealistic ridership
Number of people using transit 73 119 165 487
People commuting using shuttle 4 12 41 487
Number of cars reduced 43 85 128 427
Number of e-LSAs round trips required to move people*
1 1 4 44
*The assumed ridership is 11 passengers.
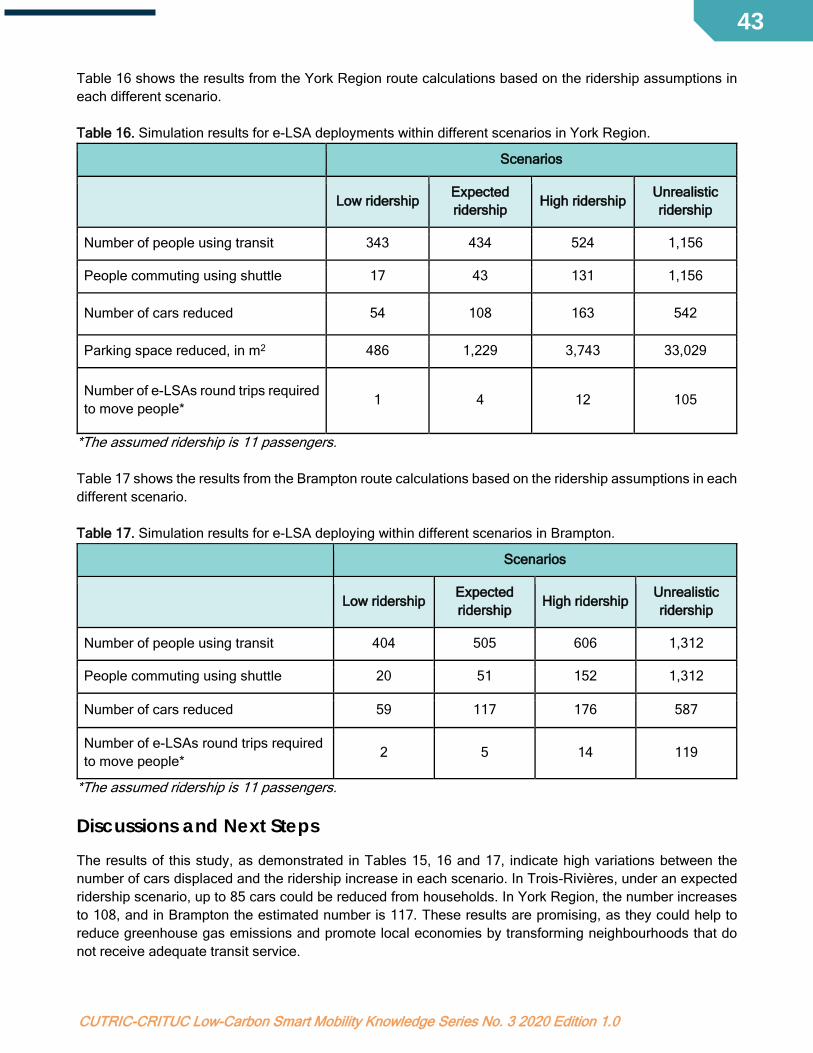
CUTRIC-CRITUC Low-Carbon Smart Mobility Knowledge Series No. 3 2020 Edition 1.0
43
Table 16 shows the results from the York Region route calculations based on the ridership assumptions in each different scenario. Table 16. Simulation results for e-LSA deployments within different scenarios in York Region.
Scenarios
Low ridership Expected ridership
High ridership Unrealistic ridership
Number of people using transit 343 434 524 1,156
People commuting using shuttle 17 43 131 1,156
Number of cars reduced 54 108 163 542
Parking space reduced, in m2 486 1,229 3,743 33,029
Number of e-LSAs round trips required to move people*
1 4 12 105
*The assumed ridership is 11 passengers. Table 17 shows the results from the Brampton route calculations based on the ridership assumptions in each different scenario. Table 17. Simulation results for e-LSA deploying within different scenarios in Brampton.
Scenarios
Low ridership Expected ridership
High ridership Unrealistic ridership
Number of people using transit 404 505 606 1,312
People commuting using shuttle 20 51 152 1,312
Number of cars reduced 59 117 176 587
Number of e-LSAs round trips required to move people*
2 5 14 119
*The assumed ridership is 11 passengers.
Discussions and Next Steps The results of this study, as demonstrated in Tables 15, 16 and 17, indicate high variations between the number of cars displaced and the ridership increase in each scenario. In Trois-Rivières, under an expected ridership scenario, up to 85 cars could be reduced from households. In York Region, the number increases to 108, and in Brampton the estimated number is 117. These results are promising, as they could help to reduce greenhouse gas emissions and promote local economies by transforming neighbourhoods that do not receive adequate transit service.

CUTRIC-CRITUC Low-Carbon Smart Mobility Knowledge Series No. 3 2020 Edition 1.0
44
CUTRIC acknowledges that these results are preliminary only and based upon predetermined assumptions made to fill the gap created by incomplete data regarding community profiles, household composition, car ownership, and alternative modes of mobility on a per community basis. This analysis provides a basis for calculating an estimated number of shuttles required in each scenario and subsequently their operation, optimization and scheduling factors. A more robust approach in the future would require comprehensive data sets and information related to both community profiles and e-LSA performance outcomes from trials. Once e-LSAs become more generally commercialized, and transit agencies and related organizations can collect substantive data, better fleet-wide procurement predictions can be developed to fully assess the impact on transit ridership in local communities. Ideal data sets would provide measures of the number of passengers boarding transit vehicles at the bus or train station of interest, as well as ridership data from shuttle providers in operation. The initial scope of this research aims to provide estimates for the number of people that may use the shuttles and optimize schedules for the shuttles based upon the operating constraints identified in each case and e-LSA technological parameters. These calculations are also helpful in planning CUTRIC’s National Smart Vehicle Joint Procurement Initiative nation-wide to understand the long-term potential for e-LSAs in Canada, especially in terms of assessing the cost and value of operating them in places with low-transit connectivity and problematic transit hub connectivity.

CUTRIC-CRITUC Low-Carbon Smart Mobility Knowledge Series No. 3 2020 Edition 1.0
45
SECTION III: COMMUNICATION SOFTWARE AND HARDWARE STANDARDIZATION ANALYSIS Connected Vehicle Standardization and Certification Connected vehicle technologies allow for V2V communication, V2I communication and V2X communication. V2V communication systems are more developed than V2X systems, the latter of which describes a broad ecosystem in which most physical objects, including pedestrian phones and other smart devices, communicate with vehicles and vehicular interactions. Certificate allocation and standardization are critical components to connected vehicle systems to ensure the safe, secure and private operation of the network. In the U.S., a Security Credential Management Systems (SCMS) has been initiated by the United States Department of Transportation (USDOT) to certify devices and enable all legitimate device messages sent to contain an SCMS certificate digital signature. If sent messages do not contain this digital signature, they will not be received by system users and are assumed to be malicious. The OmniAir Consortium has pioneered a dedicated short-range communication (DSRC) V2V, V2I and cellular-V2X (C-V2X) device certification process to ensure compliance with technical standards that certify the interoperability of the device. This section details the standardization and certification efforts of the SCMS and OmniAir Consortium. In Canada, the CSA Group received funding through Transport Canada’s ACATS program to assess gaps and develop a roadmap to strengthen the CAV codes and standards landscape in Canada and the U.S [27]. The CSA Group takes a consensus-based approach by gathering and engaging diverse stakeholders from across the value chain through the Connected and Automated Vehicle Advisory Council (CAVAC). In this report, the CAVAC group reviews updates to international codes and standards, activities from various standards development organizations, regulatory updates, key technological challenges and mitigations, updates on demonstrations and deployment initiatives, and upcoming industry events and Canadian participation [28].
Security Credential Management System
The USDOT established an SCMS to ensure that connected vehicle technologies are operated and deployed in a safe and secure manner that protects user privacy. Connected vehicles exchange critical information across vehicles, roadway infrastructure, traffic management centres and wireless mobile devices. Validation of system users is required to ensure that safety-critical messages transmitted and received are from trusted and legitimate sources. To enable a robust level of safety and trust, the USDOT partnered with the Crash Avoidance Metrics Partnership (CAMP) – a joint initiative between the automotive industry and industry security experts – to design and develop a state-of-the-art security system that enables users to trust other user messages and the security of the system as a whole.

CUTRIC-CRITUC Low-Carbon Smart Mobility Knowledge Series No. 3 2020 Edition 1.0
46
In March 2019,Transport Canada initiated a work plan to advance the development of an SCMS framework in Canada. [29]. This includes work with stakeholders in Canada to develop requirements for the system and recommend an operating and governance model for how the system can be used in Canada [30]. An SCMS is necessary for connected vehicles, given the need for real-time safety-critical information exchange that the vehicles rely on to navigate roadways. As such, trust is a fundamental basis for deploying a functioning connected vehicle network. For a message to be trusted, it must have the following:
1. Integrity: assurance that a message is not modified between sender and receiver 2. Authenticity: assurance that a message originates from a trustworthy and legitimate source 3. Privacy: assurance that a message protects the privacy of the sender
The SCMS uses a public key infrastructure (PKI) approach to encrypt and manage device certificates for trusted communication. The SCMS issues digital certificates to system participants to authenticate and validate the safety and mobility of messages transferred within the connected vehicle network. The certificates do not contain any personal or equipment-identifying information, to protect the privacy of the vehicle owners. Instead, they act as system credentials so that other users can trust the legitimacy and source of a message. The SCMS also identifies and removes misbehaving devices to ensure the content protection of each message. The SCMS provides the infrastructure to issue and manage the security certificates that create trust between connected V2V and V2I communication. Any manufacturer interested in commercializing V2V or V2I systems must receive their digital certificate through the SCMS to enable other devices to trust the authenticity of the messages transmitted from that device [31]. It is expected that security and interoperability certification will be a precursor for receiving certificates in an SCMS deployment, but this requirement has not yet been established.
OmniAir Certification
The OmniAir Consortium is an industry association in the U.S. promoting interoperability and certification for connected vehicles, intelligent transportation systems (ITS), and transportation payment systems. The Consortium membership includes public agencies, private companies, research institutions and independent test labs. OmniAir has collaborated with the USDOT on the Next Generation Certification Program for Connected Vehicles. OmniAir Consortium members are working together to develop technical specifications for the testing of DSRC, V2V and V2I communication [32]. OmniAir’s connected vehicle test specifications cover a number of standards, primarily under the IEEE 1609 Family of Standards for Wireless Access in Vehicle Environments (WAVE) [32]. The standards included in the OmniAir testing process are the following:
● IEEE 802.11-2016 – Telecommunications and Information Exchange between Systems Local and metropolitan area networks – Specific requirements – Part 11: Wireless LAN Medium Access Control and Physical Layer Specifications; Amendment 6: WAVE
○ This standard amendment specifies the extension to IEEE Standard 802.11 for wireless local area networks providing wireless communications while in a vehicular environment [33].
● IEEE 1609.2b-2019 – WAVE – Security Services for Applications and Management Messages ○ This standard defines secure message formats for use by WAVE devices, including methods
to secure WAVE management messages and methods to secure application messages. The standard also describes administrative functions necessary to support the core security functions [34].
● IEEE 1609.3-2016 – WAVE – Networking Services

CUTRIC-CRITUC Low-Carbon Smart Mobility Knowledge Series No. 3 2020 Edition 1.0
47
○ This standard provides services to WAVE devices and systems representing layer three and layer four of the open system interconnect model and the Internet Protocol (IP), User Datagram Protocol, and Transmission Control Protocol elements of the Internet model. Management and data services within WAVE devices are provided [35].
● IEEE 1609.4-2016 – WAVE – Multi-Channel Operation ○ This standard describes multi-channel wireless radio operations, WAVE mode, medium
access control and physical layers, including parameters for priority access, channel switching and routing, management services, and primitives designed for multi-channel operations [36].
● SAE J2945/1_202004 – On-Board Systems Requirements for V2V Safety Communications ○ This standard specifies the system requirements for on-board V2V safety communication
systems for light vehicles, including standards profiles, functional requirements and performance requirements. The system is capable of transmitting and receiving the SAE J2735-defined Basic Safety Message over a DSRC wireless communications link as defined in the IEEE 16019 suite and IEEE 802.11 standards [37].
The OmniAir Consortium has certified three on-board unit (OBU) and five road-side unit (RSU) modules from different manufacturers to date. The certified OBUs are as follows:
● Danlaw Inc. ○ OBU Model: AutoLink ASD100 ○ OBU Version: HW 1.8, SW 1.8.10 ○ Awarded: October 2018
● Commsignia Inc. ○ OBU Model: ITS-OB4 ○ OBU Version: v1.17.45-b186782 ○ Awarded: May 2018
● Lear Corporation ○ OBU Model: Locomate Roadstar OBU ○ OBU Version: PR12.06 ○ Awarded: January 2019
The certified RSUs are as follows:
● Kapsch TrafficCom AG ○ RSU Model: Roadside ITS Station / RIS-9160-1A0(x) ○ RSU Version: HW – 00 FW – 4.2.0.1039.17 & 4.9.124.ris-151.28 SW – 1.8.0-deb9 ○ Awarded: September 2019
● Kapsch TrafficCom AG ○ RSU Model: Roadside ITS Station RIS-9260-QAE(x) in DSRC Mode (variant of RIS-9160-
1A0(x) ○ RSU Version: HW – 00 FW – 4.2.0.1039.17 & 4.9.124.ris-151.28 SW - 1.8.0-deb9 ○ Awarded: September 2019
● Orange Traffic – Intersect ○ RSU Model: Intersect-ECO/INSECT-ECO-A RSU ○ RSU Version: HW 1.0A, SW: v1.3.0-ARMv7 ○ Awarded: May 2019
● Danlaw Inc. ○ RSU Model: RouteLink DSRC Roadside Unit/RSU001 ○ RSU Version: HW 1.93, SW 2.3 ○ Awarded: April 2019

CUTRIC-CRITUC Low-Carbon Smart Mobility Knowledge Series No. 3 2020 Edition 1.0
48
● Siemens Mobility Inc. ○ RSU Model: Sitraffic ESCoS Roadside Unit ○ RSU Version: HW 1.0, SW 01.01 ○ Awarded: October 2018 [38]
Automated Vehicle Sensory Systems AVs, without connected vehicle technologies, do not have any capacity for two-way communication with their surroundings (i.e. vehicles, infrastructure and pedestrians). Therefore, AVs employ a multitude of sensory technologies to observe and interpret their surroundings, and to gather real-time information that allows for safe operations and navigation. There are several published standards that pertain to AV systems and safety assurance. In addition, there are many new standards in discussion and development to further define aspects of AV technologies. The list below outlines some of the current published standards and related documents for AV technologies as outlined by the USDOT in their AV 3.0 - Preparing for the Future of Transportation Report [39]. The standardization efforts focus on the functional areas of definitions and architecture, data, design, functional/performance and testing/test target.
1. Society of Automotive Engineers (SAE) ○ SAE AS-4 - Joint Architecture for Unmanned Systems ○ SAE AIR5372A - Information on Brake-by-Wire Brake Control Systems ○ SAE J1698 - Event Data Recorder ○ SAE J2396 - Definitions and Experimental Measures Related to the Specification of Driver
Visual Behavior Using Video-Based Techniques ○ SAE J2735 - Dedicated Short-Range Communications (DSRC) Message Set Dictionary ○ SAE J2944 - Operational Definitions of Driving Performance Measures and Statistics ○ SAE J2945 - DSRC Systems Engineering Process Guidance ○ SAE J2958 - Report on Unmanned Ground Vehicle Reliability ○ SAE J2980 - Consideration for ISO 26262 Automotive Safety Integrity Levels Hazard
Classification ○ SAE J3016 - Taxonomy and Definitions for Terms Related to On-Road Motor Vehicle
Automated Driving Systems ○ SAE J3018 - Guidelines for Safe On-Road Testing of SAE Level 3, 4, and 5 Prototype
Automated Driving Systems ○ SAE J3048 - Driver-Vehicle Interface Considerations for Lane Keeping Assistance Systems ○ SAE J3063 - Active Safety Systems Terms and Definitions ○ SAE J3077 - Definitions and Data Sources for the Driver Vehicle Interface ○ SAE J3087 - Automatic Emergency Braking (AEB) Systems Performance Testing ○ SAE J3088 - Active Safety System Sensors ○ SAE J3092 - Dynamic Test Procedures for Verification & Validation of Automated Driving
Systems (ADS) ○ SAE J3114 - Human Factors Definitions for Automated Driving and Related Research Topics ○ SAE J3116 - Active Safety Pedestrian Test Mannequin Recommendation ○ SAE J3161 - C-V2X Deployment Profiles ○ SAE J3186 - Application Protocol and Requirements for Maneuver Sharing and Coordinating
Service 2. International Organization for Standardization (ISO)
○ ISO 2575 - Road Vehicles - Symbols for controls, indicators, and tell-tales
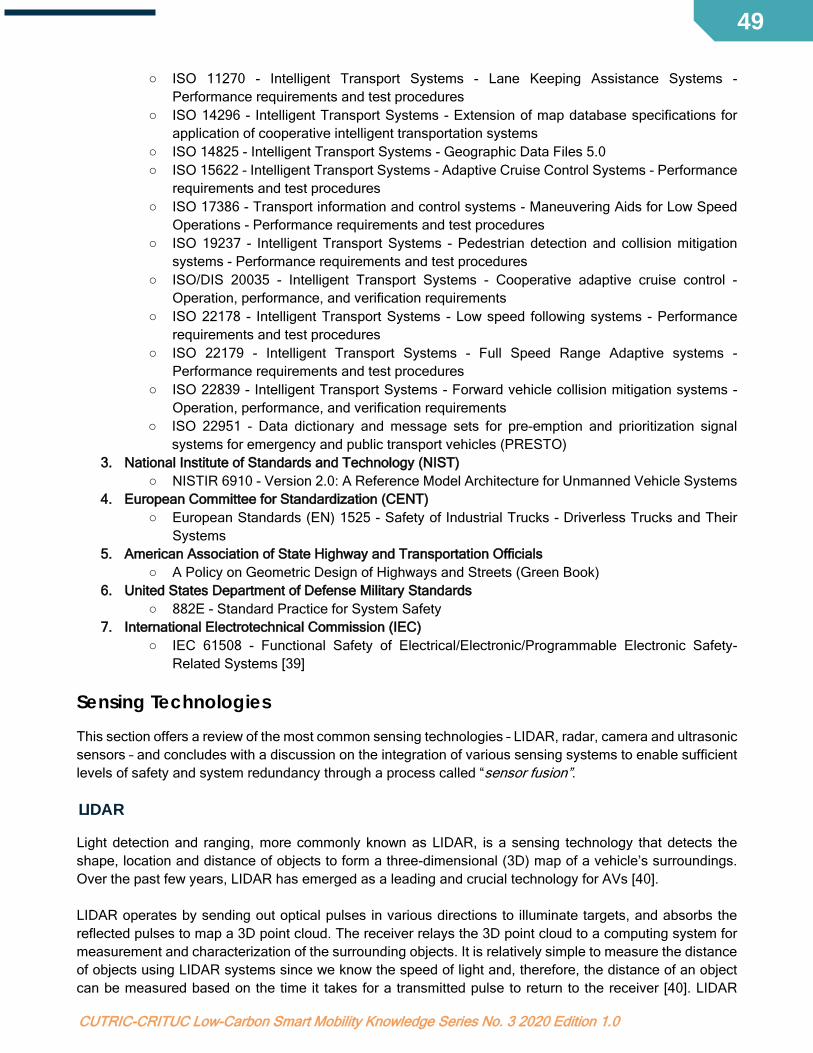
CUTRIC-CRITUC Low-Carbon Smart Mobility Knowledge Series No. 3 2020 Edition 1.0
49
○ ISO 11270 - Intelligent Transport Systems - Lane Keeping Assistance Systems - Performance requirements and test procedures
○ ISO 14296 - Intelligent Transport Systems - Extension of map database specifications for application of cooperative intelligent transportation systems
○ ISO 14825 - Intelligent Transport Systems - Geographic Data Files 5.0 ○ ISO 15622 - Intelligent Transport Systems - Adaptive Cruise Control Systems - Performance
requirements and test procedures ○ ISO 17386 - Transport information and control systems - Maneuvering Aids for Low Speed
Operations - Performance requirements and test procedures ○ ISO 19237 - Intelligent Transport Systems - Pedestrian detection and collision mitigation
systems - Performance requirements and test procedures ○ ISO/DIS 20035 - Intelligent Transport Systems - Cooperative adaptive cruise control -
Operation, performance, and verification requirements ○ ISO 22178 - Intelligent Transport Systems - Low speed following systems - Performance
requirements and test procedures ○ ISO 22179 - Intelligent Transport Systems - Full Speed Range Adaptive systems -
Performance requirements and test procedures ○ ISO 22839 - Intelligent Transport Systems - Forward vehicle collision mitigation systems -
Operation, performance, and verification requirements ○ ISO 22951 - Data dictionary and message sets for pre-emption and prioritization signal
systems for emergency and public transport vehicles (PRESTO) 3. National Institute of Standards and Technology (NIST)
○ NISTIR 6910 - Version 2.0: A Reference Model Architecture for Unmanned Vehicle Systems 4. European Committee for Standardization (CENT)
○ European Standards (EN) 1525 - Safety of Industrial Trucks - Driverless Trucks and Their Systems
5. American Association of State Highway and Transportation Officials ○ A Policy on Geometric Design of Highways and Streets (Green Book)
6. United States Department of Defense Military Standards ○ 882E - Standard Practice for System Safety
7. International Electrotechnical Commission (IEC) ○ IEC 61508 - Functional Safety of Electrical/Electronic/Programmable Electronic Safety-
Related Systems [39]
Sensing Technologies This section offers a review of the most common sensing technologies – LIDAR, radar, camera and ultrasonic sensors – and concludes with a discussion on the integration of various sensing systems to enable sufficient levels of safety and system redundancy through a process called “sensor fusion”.
LIDAR
Light detection and ranging, more commonly known as LIDAR, is a sensing technology that detects the shape, location and distance of objects to form a three-dimensional (3D) map of a vehicle’s surroundings. Over the past few years, LIDAR has emerged as a leading and crucial technology for AVs [40]. LIDAR operates by sending out optical pulses in various directions to illuminate targets, and absorbs the reflected pulses to map a 3D point cloud. The receiver relays the 3D point cloud to a computing system for measurement and characterization of the surrounding objects. It is relatively simple to measure the distance of objects using LIDAR systems since we know the speed of light and, therefore, the distance of an object can be measured based on the time it takes for a transmitted pulse to return to the receiver [40]. LIDAR

CUTRIC-CRITUC Low-Carbon Smart Mobility Knowledge Series No. 3 2020 Edition 1.0
50
systems can send up to 150,000 pulses per second, which provides the system with a clear picture of a moving object, including its trajectory and speed [41].
Field of View (FOV)
A large advantage of mechanically rotating LIDAR systems is the ability to provide a 360-degree FOV. This is the widest FOV for all advanced driver assistance systems (ADAS) technologies. Although not offering 360-degree rotation, solid-state LIDAR still features excellent horizontal FOV (azimuth) [40]. LIDAR systems also possess vertical FOV (elevation) with a sufficient range for most driving conditions, including viewing tall objects in front of the vehicle and maintaining sensory vision on the roadway while travelling down a slope [42]. In addition, LIDAR has a high angular resolution, greater than that of radar, which is a key feature for accurate object classification at high elevations [40, 43].
Range
The range of sensing technologies is an important metric that dictates the maximum speed of a vehicle based on the need for safe operations and reaction time to changing environments ahead. To achieve highway speeds, an AV requires sensing technologies that have a range of at least 200 metres. Sensing technologies with lower ranges allow for AV to operate only at slower speeds where the vehicle can safely detect and react to unexpected movements in the foreground, such as a pedestrian stepping onto the road or a car slamming on its breaks. LIDAR has a range of a few metres to over 200 metres, but struggles to detect objects very close to itself [42]. A factor affiliated with range is reflectivity, which refers to an object’s likelihood of reflecting light back to the LIDAR. In general, light-coloured objects are more reflective than dark-coloured objects. LIDAR technologies have been developed with high capabilities to detect low reflectivity objects at a distance, which is critical for automated driving [40, 43].
Resolution
High resolution sensing technologies are crucial for collision avoidance and object detection. The most advanced LIDAR sensors can detect the resolution of objects to within two to three centimetres. This finer resolution is superior to radar systems and provides the most defined vision for the surroundings [40]. Infrared (IR) light spatial resolution is possible on the order of 0.1° with LIDAR, due to the ability to collimate laser light and use short wavelengths from 905 nanometres to 1,550 nanometres. This level of IR light spatial resolution allows for very high-resolution 3D characterization of surroundings without significant back-end processing [40].
Adverse Weather Conditions
LIDAR, however, has shown limited performance in adverse weather conditions such as rain, fog and snow. LIDAR can improve performance in bad weather conditions when IR wavelengths of 1,550 nanometres are used. LIDAR is also susceptible to ambient light conditions and has demonstrated performance issues in direct sunlight. LIDAR does, however, perform well within night-time operations [40].
Types of LIDAR Systems
Most LIDAR sensors use one of four beam-steering technologies: (1) spinning LIDAR, (2) mechanical scanning LIDAR, (3) optical-phased array LIDAR, and (4) flash LIDAR [44].

CUTRIC-CRITUC Low-Carbon Smart Mobility Knowledge Series No. 3 2020 Edition 1.0
51
1. Spinning LIDAR systems feature a stack of lasers in a vertical column, which is spun around multiple times per second. LIDAR market leader, Velodyne, uses this technique with a vertical stack of 64 lasers. Spinning LIDAR offers a 360-degree FOV, but is a more expensive form of LIDAR and raises questions as to whether the cost can be lowered enough for mass-market use.
2. Mechanical-scanning LIDAR systems use a mirror to redirect a laser beam in multiple directions. Some companies use micro-electro-mechanical-systems (MEMS) technology to drive the internal mirror.
3. Optical-phased array LIDAR systems use a row of transmitters that adjust the relative phase of an electromagnetic beam to dictate the direction of the signal. If electromagnetic waves are emitted in sync from the transmitters, the beam will be transmitted perpendicular to the transmitter. The signal can be directed to the left by skewing the phase of the signal sent out by each transmitter’s antenna, whereby the signal from the left is emitted behind those on the right.
4. Flash LIDAR systems illuminate the entire FOV using a single flash and a wide-angle laser. This technique works only at short ranges since any single point receives a small fraction of the source laser’s light. Some companies are planning to expand flash LIDAR by building out multi-laser systems facing in multiple directions [44].
Market
The cost of LIDAR systems has dropped significantly over the past few years as its popularity has increased. For example, Velodyne’s industry-leading LIDAR systems range from an estimated US$100,000 for their new 128-laser spinning LIDAR model to approximately US$16,000 for their 16-laser spinning model. Velodyne also offers a solid-state LIDAR model, which is expected to cost less than US$1,000. However, it offers lower-end performance relative to the spinning LIDAR systems [44]. Below is list of nine companies leading the LIDAR industry globally:
1. Velodyne LiDAR 2. Luminar 3. Aeye Inc. 4. Ouster 5. Blackmore 6. Baraja 7. Quanergy 8. Cepton Technologies Inc. 9. Innoviz [44]
As LIDAR systems become more widespread and commercially available, their cost is expected to decrease over time. There is a debate as to whether manufacturers will be able to design LIDAR systems that are cheap enough for mass market deployments. Alternative sensory technologies such as cameras have received strong support from companies such as Tesla and Velodyne. These companies believe cameras will be able to perform all sensory requirements as a single system. They believe the cost of other sensory systems, namely LIDAR, will always remain a hindrance and will, therefore, result in cameras being the primary, single sensory technology used in the mass AV market [45].
Radar
Radar, or radio detection and ranging, emits electromagnetic waves to determine an object’s distance, velocity and angle. Radar systems are commonly used in automobiles for ADAS applications such as emergency braking systems and adaptive cruise control [46].

CUTRIC-CRITUC Low-Carbon Smart Mobility Knowledge Series No. 3 2020 Edition 1.0
52
Field of View
Radar possesses a very wide azimuth (horizontal FOV) and a modest elevation profile (vertical FOV) that is sufficient for most operating circumstances. Steep surfaces may, however, fall outside of the radar’s elevation FOV [40].
Range
Radar can detect objects at ranges varying from less than one metre to over 200 metres, depending on whether the system is a short, medium or long-range radar [40]. ADAS applications of radar use long-range radar systems of 80 metres to over 200 metres [46].
Resolution
Long-range radar systems operate in the 77 GHz frequency band, with a wavelength of 3.9 millimetres, which allows for improved accuracy and object resolution, a smaller antenna, and limited interference with other systems due to atmospheric absorption [46]. There are, however, still technical challenges. Radar systems distinguish objects using the frequency and strength of the returned signal, which is impacted by an object’s size, distance, absorption characteristics, reflection angle and transmission power [46]. Radar systems experience large reflections from larger objects such as passenger vehicles or trucks, but may struggle to identify motorcycles or pedestrians, which are smaller and bear fewer hard or metallic shapes for the signal to reflect off of. In a crowded environment, the strong signals from trucks and cars may cause the radar to miss other reflections. Additionally, smaller metal objects such as soda cans may cause disproportionately large reflections due to higher reflectivity [46].
Types of Radar Systems
The most common type of radar system for automotive use is the broadband Frequency Modulated Continuous Wave (FMCW). FMCW provides high resolution for depth perception and range and can detect objects such as pedestrians and cyclists. In an FMCW radar system, the transmitter and receiver continuously operate and emit a sequence called a chirp. In this sequence, the transmitter emits a sinusoidal carrier with an intermittent increasing and decreasing frequency. The transmitted chirp is emitted to the target object and gets reflected back to the receiver. Both travel time of the signal and object classification are measured by the difference in frequency of the transmitted and received signal [46].
Adverse Weather Conditions
Radar systems are efficient in a variety of weather conditions [40], but can still be affected by atmospheric conditions such as temperature inversion, moisture variations, water droplets and dust particles. Temperature inversions or moisture lapses can change the refraction index of the lower atmosphere, which causes a greater bending of radar waves – referred to as ducting – passing through the weather atmospheric condition and can have adverse impacts on radar performance. Water droplets and dust particles can cause radar energy to diffuse through reflection, absorption and scattering, which reduces the available energy striking the target and results in a smaller return echo. Higher frequency radar systems are more affected by adverse weather conditions than lower frequency radar systems [47].

CUTRIC-CRITUC Low-Carbon Smart Mobility Knowledge Series No. 3 2020 Edition 1.0
53
Market
Radar systems have become widely commercially available over the past few years, which has made them a highly compact and affordable technology [40]. Technavio’s 2016–2020 Global Radar Systems and Technology Market report indicates that the top five leading vendors globally for radar systems are as follows:
1. Lockheed Martin 2. Northrop Grumman 3. Raytheon 4. Reutech Radar Systems 5. Rockwell Collins [48]
Cameras
Cameras are the only sensory technology that can capture texture, colour and contrast information. They demonstrate strong object classification capabilities by the high level of detail captured. Cameras are also constantly improving in pixel resolution and are relatively affordable, making them the most common ADAS and AV technology. ADAS applications use cameras for adaptive cruise control, automatic high beam control, traffic sign recognition and lane-keep assist. Inside the vehicle, cameras are used for driver monitoring. In semi-automated applications, driver monitoring cameras can advise the automated system if drivers are capable of taking over control, based on their attention to the roadway [49]. AVs typically use multiple cameras externally at varying angles to jointly provide a 360-degree view of the surroundings. For example, Tesla vehicles have eight cameras installed on the outside that capture 2D images of the surrounding environment. The images are sent to a computing device, which amalgamates the images into a 3D navigable map [45]. In addition to the low-cost and accessible nature of cameras, they are also able to read existing lane marking and signs, enabling immediate use with current road infrastructure and minimal driver or operator inputs [45]. These factors contribute to the popularity and widespread use of cameras in ADAS and automated systems. Cameras, however, face their own challenges. One of the largest barriers is their poor functionality in adverse weather conditions. Rain, fog and snow can block the camera’s ability to “see” its surroundings [45]. Cameras also rely heavily on ambient-lighting conditions and cannot operate consistently in low-lighting conditions. A second barrier is the high level of processing required to effectively detect and identify useful information from surrounding environments [40]. Some companies, such as Tesla and Mobileye, believe that AVs can operate using cameras alone, and can forego other more expensive sensory technology such as LIDAR or radar. This has not been tangibly proven, given the operational limitations in all weather and lighting conditions. However, it is uncertain what future technological advancements may enable this [45].
Ultrasonic Sensors
Ultrasonic sensory systems emit short bursts of sound waves and measure the time it takes for the sound wave to be reflected off a target object and returned to the receiver. Objects that are closer to the transmitter will produce a stronger echo compared with ones farther away. A minimum noise-value threshold is programmed into the system, and any echoes below the threshold result in a false positive and are, therefore, ignored by the receiver. If a vehicle uses more than one ultrasonic sensor, the sensors must be adequately spaced and directed to avoid signal interference [50].

CUTRIC-CRITUC Low-Carbon Smart Mobility Knowledge Series No. 3 2020 Edition 1.0
54
Ultrasonic waves experience significant attenuation beyond a few metres of air travel and are best suited for short-range object detection [40]. The range of ultrasonic sensors is typically between a few centimetres to a few metres. For example, the Generation 6 Ultrasonic Sensors sold by Bosch feature a minimum range of 15 centimetres to a maximum range of 5.5 metres [51]. The speed of the sound waves emitted from an ultrasonic sensor can be impacted by air temperature, humidity and wind. Fluctuations in air temperature can cause the sound wave to travel faster at higher temperatures. This would make it appear as though a target object is closer than it is. Environmental air currents can also affect the path of an ultrasonic wave from fans or pneumatic equipment, which could result in a sensor failing to recognize the correct location of a target object [52]. Given the operating capabilities of ultrasonic sensors, they are typically used for short-range applications operating at low speeds. Many automobiles currently use them for features such as park assist and blind-spot detection. Ultrasonic sensors can replace cameras for some functions, as they are cost-effective and operate better at close ranges. Although they are more expensive than infrared sensors, ultrasonic sensors are more accurate and operate in direct sunlight, unlike infrared sensors [50].
Sensor Fusion
Fully automated vehicles require input from a multitude of sensory technologies to ensure safety and redundancy of the system while operating in crowded, complex and fast-moving road environments. AV manufacturers are, therefore, combining inputs from multiple sensors (e.g. LIDAR, radar, ultrasonic sensors and cameras) through a process called sensor fusion, to merge the benefits from each sensory technology and improve the overall reliability, range and accuracy [46]. Each sensory technology provides different sensory outputs and has unique limitations; therefore, sensor fusion involves instantaneous decision-making within a context of multiple and sometimes contradictory inputs [4]. Four theoretical examples of challenges with sensor fusion are described below, focused on radar, camera and LIDAR object detection and classification variations:
1. Scenario 1: A vehicle 150 metres ahead. ○ Radar: Identifies object as a vehicle. ○ Camera: Does not see the vehicle; vehicle is lost in the noise of the distant surroundings. ○ LIDAR: Identifies object as a vehicle. ○ Sensor fusion: Identifies object as a vehicle. This presents an ideal case where two sensors
agree on object classification early enough to navigate the vehicle. 2. Scenario 2: An unclassified object 100 metres ahead in a low-light setting.
○ Radar: Identifies object as a vehicle. ○ Camera: Identifies object as a bicycle. ○ LIDAR: Identifies object as a pedestrian. ○ Sensor fusion: Sensors all identify object differently. Decision is that the object is large
enough and should be avoided if possible. 3. Scenario 3: A cyclist is 50 metres ahead.
○ Radar: Identifies object as a bicycle. ○ Camera: Identifies object as a cyclist. ○ LIDAR: Identifies object as a pedestrian. ○ Sensor fusion: Identifies object as a cyclist. There are different classifications from different
sensors, but agreement that the object should be avoided. 4. Scenario 4: Unclassified object.

CUTRIC-CRITUC Low-Carbon Smart Mobility Knowledge Series No. 3 2020 Edition 1.0
55
○ Radar: Does not see object; lost as noise in surroundings. ○ Camera: Identified as scrap material (likely fallen off a vehicle). ○ LIDAR: Identifies object as a dog. ○ Sensor fusion: Uncertain whether to brake or ignore [4].
As illustrated above, the challenge in sensor fusion lies in the determination of a vehicle’s surroundings with sufficient resolution, confidence and latency to safely navigate the vehicle. The scenarios exemplify how sensors may interpret the same object differently given their specific technologies. Adverse weather conditions can interfere with LIDAR and camera functions, which causes vehicles to rely on radar in these scenarios. Smaller objects on roadways, such as pylons, potholes (either empty or filled with water) and littered objects (e.g. soda cans), can cause confusion and variations in object classification, making the sensor fusion unable to decide if the object can be safely ignored or if it should be avoided [4]. In conclusion, a vehicle’s ability to sense its surroundings is difficult and littered with limitations from both the sensory technologies and the sensor fusion process. These challenges associated with automated technologies demonstrate why the combination of automated and connected technologies is necessary for fully autonomous vehicles to operate at roadway and highway speeds. Connected vehicle technologies allow the sensory systems to have an additional input, which can currently articulate the location, direction and speed of surrounding vehicles. This location, direction and speed articulation is expected to progress to encapsulate pedestrian and cyclist movement through vehicle-to-smartphone communication, and will allow for additional concrete communication to a vehicle regarding its dynamic surrounding environment. Sensor data fusion remains a critical challenge for true AV deployments. The challenge is amplified due to a lack of guidance from technical standards on which specifications should be used to achieve the highest levels of safety. Standardizing sensor fusion is challenging since the algorithms are proprietary for each system manufacturer, and standardization could potentially result in lost competitive advantages. It is, however, critically important to achieve some standardized level of safety to ensure that no automated systems with inadequate sensor data fusion latency are deployed, which could cause a collision or fatality. This area requires further investigation, collaboration and standardization.
Additional CUTRIC Data Sources and Considerations for e-LSAs In 2019, the Toronto Region Board of Trade (TRBOT) contracted CUTRIC to conduct SWOT (strengths, weaknesses, opportunities and threats) and PESTEL (political, economic, social, technological, environmental and legal) analyses on the readiness of the GTHA for CAVs. The TRBOT hosted the SWOT consultation at their office in June 2019, hosting 28 leading stakeholders from GTHA-based organizations within the groupings of automotive manufacturers, fleet operators, insurance, government, not-for-profit, and cities and transit. The TRBOT also hosted the PESTEL consultation at their office in July 2019, hosting 50 leading stakeholders from GTHA-based organizations within the primary groupings of automotive manufacturers, fleet operators, cities and transit, telecoms and digital systems integrators, consulting and insurance, and rail and shuttle manufacturers, operators and integrators. A key area of discussion throughout both consultations included the opportunities and threats associated with CAV data that is generated, transmitted, collected and analyzed within a connected network. Stakeholders agreed there was a strong need for data collection and sharing under the merits of further technological development, transportation network optimization and economic opportunity for Canadian companies. There were concerns, however, about the uncertainty of data ownership, competing stakeholders resisting data sharing, and no public data trust mechanism to help cites share data effectively. Additional concerns were raised about the security and privacy of data collection and a cited lack of standards indicating how to ensure data security and privacy.

CUTRIC-CRITUC Low-Carbon Smart Mobility Knowledge Series No. 3 2020 Edition 1.0
56
In a similar vein, throughout 2019, and as part of the Government of Canada’s Car of the Future – renamed Vehicle of the Future – expert consultation group, CUTRIC proposed the concept of an ACES (Automated, Connected, Electric and Shared) Public Big Data Trust for Canadian cities to be led by the Ministry of Innovation, Science and Industry (formerly the Ministry of Innovation, Science and Economic Development). The ACES Big Data Trust would ensure that real-time data is collected from CAVs operating on city roads in public and private fleets in the near- to mid-term future. The focus of this proposal is to ensure Canadian cities optimize road design, decrease congestion, and decrease GHG emissions through the deployment, ideally, of electrified and automated shuttles, buses, and pods or shared cars. An ACES Big Data Trust would house a secure cloud portal that obtains the feeds from CAV pilots, test beds and on-road demonstrations, as well as on-road commercial deployments, going forward. A framework would need to be established wherein interested entities could access the data pools with different restriction levels and fees based on their status (e.g. cities and transit would receive the highest access levels, whereas private companies would have restricted access to aggregated data only, to avoid competitiveness risk among manufacturers). The ACES Big Data Trust would need to be hosted and run by a neutral not-for-profit agency representing a consortium of public owners and founding entities. Such a Big Data Trust would break through existing fragmentation barriers across municipal jurisdictions and provide the medium through which cities and transit could share their learning and experiences faster to ensure optimized and reduced public expenditures on CAV activities and procurements with greater and more meaningful positive effects on mobility.

CUTRIC-CRITUC Low-Carbon Smart Mobility Knowledge Series No. 3 2020 Edition 1.0
57
SECTION IV: CYBERSECURITY SOFTWARE AND HARDWARE RISKS AND VULNERABILITIES Introduction CAVs have been envisioned as transportation enhancers – technologies that could improve transportation efficiency, reduce accidents, improve safety, and provide great mobility and environmental benefits. A CAV paradigm will continue to unfold throughout the next decade with improvements in the infrastructure and information and communication technology (ICT) implemented to support their deployments. The global CAV market is expected to reach US$7 trillion by 2050, becoming one of the largest markets in the world [53]. Despite the potential benefits of CAVs, significant security and privacy challenges need to be addressed before widespread deployment for intelligent transportation systems may begin. In particular, security risks escalate with increasing levels of automation. For example, two researchers in a study demonstrate a successful hacking into a Jeep Cherokee using a laptop via the Internet in 2015 [54]. They could remotely control air-conditioning, radio, windshield wipers and brakes. As a result, Chrysler had to recall 1.4 million cars to manually install a patch for this leak. These attacks can cause financial loss and risk lives. This section outlines the risks and vulnerabilities associated with cyber-attacks related to CAVs and, therefore, e-LSAs. It summarizes corresponding defense solutions and the standards of security and safety that need to be addressed in widespread CAV and e-LSA deployments. This section is organized as follows: the first subsection presents an overview of CAVs, the second reviews various cyber-attacks, the third presents corresponding defense methods, the fourth describes the standards of security and safety of CAVs, and the fifth provides a conclusion for all presented data.
An Overview of Connected and Autonomous Vehicles In CAVs (including e-LSAs), vehicle connectivity and automation are two main features.
Vehicle Connectivity
Most vehicular communications associated with CAVs and e-LSAs are based on two main technologies: DSRC and cellular networks (e.g. 4G and 5G). DSRC is designed for direct V2V and V2I communications for traffic safety with low latency [55, 56]. In DSRC, there are two types of devices: RSU and OBU. Different countries and regions have approved different spectrums and standards. This report focuses on the standards adopted in North America. DSRC initially allocated the 75 MHz (5.850 - 5.925 GHz) spectrum at 5.9 GHz band by the U.S. Federal Communication Commission in 1999. The spectrum is divided into one control channel and six service channels, covering a range of one kilometre at most. The data rate of DSRC is up to 27 Mbps for a 10 MHz channel and a maximum of 54 Mbps for a 20 MHz combined channel. In terms of the protocol stack and the entire set of standards, DSRC and WAVE are generally interchangeable notions [57]. The DSRC/WAVE protocol stack consists mainly of the IEEE 802.11p and IEEE 1609 family. DSRC has some characteristics that differ from other networks [58-60], which include real-time guarantee, high mobility, rapidly changing and unstable topology, and multi-hop communication, etc.

CUTRIC-CRITUC Low-Carbon Smart Mobility Knowledge Series No. 3 2020 Edition 1.0
58
As cellular networks benefit from global deployment and fast commercialization, they can provide users with higher quality services than DSRC [61]. However, DSRC and cellular techniques can be integrated to provide even better services synergistically. By combining these two technologies, a vehicle can provide others with information acquired from its own sensors, other neighbouring vehicles, RSUs or direct access to the Internet. This may include traffic and environmental status, navigational and safety information, commercial advertisements or parking availability.
Vehicle Automation
In vehicle automation, a vehicle’s motion control includes a longitudinal and lateral direction, and an interface is required to connect powertrain and steering systems. GPS could provide an accurate location-based service, which ranges from centimetres to metres. Vehicle navigation and localization can be achieved by GPS and predefined road maps. In some dynamic situations, vehicle automation requires special sensors, such as LIDAR, radar and ultrasonic sensor, to increase environmental perception ability. With the assistance of high-resolution road maps and sensors, the centimetre-level location service could be provided for vehicle automation. There are some factors that may adversely impact the quality of received GPS signals. For example, wide-band radio frequency interference can reduce the effective GPS signal-to-noise ratio through signal attenuation. There are, however, various approaches for GPS receivers to enhance the tracking ability of weak, attenuated or corrupted GPS signals, using antenna design and signal processing techniques, including beam steering, null forming and adjusting radio-frequency front-end gains.
Cyber-Attacks in Connected and Autonomous Vehicles Significant security and privacy challenges need to be addressed for CAVs and e-LSAs, given the complexity and interconnected nature of their systems. This section provides a brief overview of common cyber-attacks against CAVs and corresponding defence strategies.
Password and Key Attacks
Password and key attacks can be classified into three categories: dictionary attack, rainbow-table attack and brute-force attack. A dictionary attack uses word lists to decode the password repeatedly. A rainbow-table attack uses a list of precomputed hashes, which are computed from all the possible passwords and the given algorithm. A brute-force attack can identify non-dictionary words by working through all the alpha-numeric combinations. This is dangerous for CAVs because password and key attacks could allow malicious access into CAVs software systems, and cause stolen privacy data or access to CAV control systems and dangerous service disruptions. Password and key attacks are quite complex to perform and typically require special hardware and software. Attacks of this nature can be executed for financial gain. Robust cryptographic mechanisms can be implemented to protect against these attacks, such as larger keys and more secure algorithms.
Denial-of-Service Attacks
Denial-of-service (DoS) attacks happen when the attacker blocks the whole communication channel with interference signals. It inserts useless messages or creates issues on network nodes. In these cases, authentic users cannot access network services, and correct messages cannot reach their destinations [62-64]. For the real-time communications associated with DSRC and WAVE, these types of attacks can be dangerous and even fatal for vehicles, which depend heavily on safety messages for operations.

CUTRIC-CRITUC Low-Carbon Smart Mobility Knowledge Series No. 3 2020 Edition 1.0
59
DoS attacks are difficult to correct even if detected [59]. Nonetheless, early detection could thwart attacks or alert the driver to implement efficient measures. Some detection strategies are related to the enter verification, which are performed on RSUs. One study detects a DoS attack in its early stages (before the verification) using the attacked packet detection algorithm (APDA), with which each RSU is equipped [65]. An APDA can recognize the attacked packets by their sending frequency, changing the position and velocity of the vehicle. The vehicle is considered to be attacked if the frequency and velocity are not within the normal range. To improve the efficiency of detection during validation, the request-response detection algorithm (RRDA) [66] is executed after APDA. RRDA compares the hop count in the request to the RSUs to judge malicious nodes. Similarly, Singh and Sharma [67] propose another detection mechanism, the enhanced attacked packet detection algorithm, to detect malicious nodes by the rate of sending packets within the allocated time slot. These verification-based detection strategies would refuse such malicious nodes access to vehicles, thereby reducing the attack influence. Malebary et al. [68] use a new metric, “packet delivery/send ratio,” to detect a reactive jamming attack. In this method, each RSU calculates and collects some relevant value in a non-jammed rush-hour scenario. RSU can be divided into two steps. The authors first identify the impact of vehicles’ density on network performance. Then, they study jamming effectiveness by different mobility patterns (stationary, random or targeting) and behaviours (constant, random or reactive). Notably, the consistency check algorithm could distinguish the packets’ loss due to jamming attack or traffic congestion with an over 99 per cent detection accuracy. There are also some strategies performed on the OBU. Lyamin et al. [69] propose a simple real-time jamming detection method in 802.11p vehicular networks. The first car in the platoon serves as a detector, which listens to the channel continuously. There are only two steps in this approach. First, all the vehicles in the platoon are divided into groups by the distinct beacon, which never result in collisions across the different groups. Second, the detector listens to the receiving status of the beacons and sends an alarm. Elliptic curve digital signature algorithms (ECDSA) can be used in IEEE 1609.2 for message authentication. The authentication delay allows an attacker to launch a DoS attack by flooding the network with invalid messages. Several studies focus on detecting and mitigating a DoS attack before this authentication process [70-72]. Wasef et al. [70] use a hash message authentication code (HMAC) mechanism to mitigate a DoS attack before message authentication. In this strategy, the vehicle collects all received invalid signatures within a time period and calculates the invalid signature ratio. The delay caused by HMAC function is far shorter than the ECDSA authentication process. HMAC is efficient at detecting outside attackers, who have no authentic access to the network. Pooja et al. [71] also adopt HMAC for entity authentication before signature verification. To detect inside attackers, each vehicle maintains a detection table, which records the entity’s identity with a fail signature in the verification process. Similarly, He and Zhu [72] also add a pre-authentication process to mitigate a DoS attack by a one-way hash chain and a group re-keying scheme. The hash chain is created from the initial identity and attached in each message for pre-verification. The proposed process takes less time and has lower overhead costs than HMAC. In common wireless networks, spread spectrum is usually applied to mitigate jamming. However, due to the fixed channels, the spread spectrum technique is not applicable in DSRC. Hasbullah, Soomro and Manan [63] adopt the run strategy, in which a processing unit uses the OBU to counter a DoS attack. After detecting the attack, the processing unit then informs the OBU to make alterations for sending messages. Other researchers use the reliability of safety applications to reduce the effects of jamming. Alturkostani and Krings [73] employ an adaptive threshold-based agreement algorithm to decrease the impact of a constant jammer. In a follow-up study, Alturkostani and Krings assess its resilience against jamming. Similarly, Mohamed et al. [74] propose an enhanced voting-based algorithm.

CUTRIC-CRITUC Low-Carbon Smart Mobility Knowledge Series No. 3 2020 Edition 1.0
60
Impersonation/Masquerading Attacks
Every vehicle has a unique identification that helps to recognize the vehicle and the messages it sends and receives. An impersonation/masquerading attack could be implemented using another identity or fake identity to mimic the actual vehicle. This attack consists of two scenarios [75, 76]. In the first scenario, one identity is spoofed at a time, called “node impersonation.” In the second scenario, different identities are spoofed simultaneously, called “Sybil attack.” Evidently, both scenarios can be dangerous for CAVs as vehicles could be spoofed or mimicked in real-time, confusing the network of communications, or diverting messages that are critical for a given vehicle towards the spoofing vehicle or the masquerading communication device/signal. The key is to explore the vehicle's actual position from which the message has originated to prevent impersonation attacks. Chatwal et al. [77] use the filter that is alerted as the secure connection is cultivated and other key factors to detect an impersonation attack. Pougajendy and Parthiban [76] propose a collaborative-detection approach in which a location-based verification strategy is formed from the received signal strength. Another solution is the genetic-based framework [78]. This adopts the vehicle’s genetic information, which consists of the vehicle's speed, direction and location to distinguish different vehicles. Other ideas have been proposed for resisting an impersonation attack. Shang and Gui [79] use the differential flag byte, where this strategy has low computational complexity. Sanzgiri et al. [80] adopt a third party to establish an authenticated routing protocol based on ad hoc on-demand distance vector (AODV). In this protocol, the route authentication is executed at each hop. A Sybil attack is a special type of impersonation attack that creates virtual nodes by forging identities and causes other vehicles to trust that the nodes exist. There are three modes of defense against Sybil attacks. The first detection strategy is based on the fact that vehicles move independently and have different motion trajectories. A group of Sybil nodes that originate from the same attacker always maintain the same travelling path. Based on this attribute, Grover et al. [75] and Sharma et al. [81] use the neighbour list to detect the simultaneous Sybil attack. Sybil nodes could be detected if they are neighbouring for a long time. The advantage of the neighbouring method is that no assistance is required from the RSUs. The second detection strategy takes advantage of the timestamp. There are timestamps attached to every message in vehicular communication, provided by the RSU when a vehicle drives by the module. Park et al. [82, 83] use this mechanism to explore the timestamp series approach to detect a Sybil attack. Similarly, Jumar and Maheshwari [84] use the timestamp to allow early detection of potentially suspect Sybil nodes. In this approach, the RSU sets a timer when a timestamp is provided to the vehicle. The third detection strategy depends on the certificates issued by trusted authorities. Trusted authorities are assumed never to be compromised. Some scholars argue that detecting a Sybil attack without centralized authority is almost impossible [85]. Based on the radio-frequency identification (RFID) technique, Triki et al. [86] propose a solution for detecting a Sybil attack. Similarly, Feng et al. [87] discuss an event-based reputation system that is also appropriate for defending against a multi-source Sybil attack.
Replay Attacks
One of the insidious attacks in a vehicular network is to alter existing data by replay attacks record and re-transmit the early valid packets at a later time [88]. In these cases, the attacker intercepts some exchanging messages and broadcasts them again. This communication may confuse authorities, mislead traffic communications, and damage transportation safety overall by causing mayhem within a communications system that relies heavily on accurate responses in time order. Attacks impersonating a legitimate vehicle or RSU are usually targeted at protocols related to system authorization or key agreements.

CUTRIC-CRITUC Low-Carbon Smart Mobility Knowledge Series No. 3 2020 Edition 1.0
61
Common strategies adopt timestamps, session keys or other data forms to thwart replay attacks [89, 90]. The session-key agreement derived from a random number in each session can be adopted to prevent a replay attack during the authentication and communication procedure [91]. A “nonce” – a semi-random or random number generated in cryptographic communication [92] – would be added in the authentication request message [93], preventing old messages replaying. Mambo et al. [94] adopt the proxy signature for defending against a replay attack. An ECDSA-based proxy signature mechanism [95] proposes to protect the messages from RSUs, which could thwart replayed packets, including messages from legitimate RSUs and false messages from the compromised RSUs. The ECDSA has been used in IEEE1609.2. Biswas [96] also uses the proxy signature mechanism. It signs all messages either from RSUs or OBUs. The media access control (MAC) address (a unique identifier assigned to a device for use as a network address) and GPS information of the RSUs are used to verify messages. In addition, Biswas proposes a new identity-based proxy signature mechanism on RSUs. The verification process in OBUs is lightweight, requiring only its location information without any public-key certificate. Due to this factor, the author argues that the identity-based proxy signature would potentially replace the conventional PKI-based mechanism in CAVs.
GPS Spoofing Attacks
AVs rely heavily on GPS, which provides location and time information and, therefore, supports many key processes, such as pseudonym certificates, basic safety messages and timestamps in messages. Truthfulness and accuracy in GPS communications are critical for CAV operations and safety. In GPS spoofing attacks, the system provides fake location and time messages to receivers on vehicles [97], so vehicles do not know where they are, what is positioned around them or how to navigate properly. These attacks can be catastrophic for passengers in a CAV, a set of CAVs and their passengers, and to pedestrians. Anouar et al. [97] show that a validation process can help to correct an incorrect position. In the instance of a fake GPS time, an alternative reliable time source [98] replaces GPS time. It is worth mentioning that there are fewer outcomes for the recovery after detection of GPS spoofing.
Routing Attacks
Routing attacks exploit the drawback and vulnerability of routing protocols. Every node acts as a router in CAVs. Attackers can disturb the normal routing process or drop passing packets, which would redirect a signal away from its intended receiver node and would disrupt the transmission of critical communications. There are two kinds of routing attacks – “black hole attacks” and “wormhole attacks.” In a black hole attack, a black hole node attracts and drops the packets from other vehicles by pretending to have the shortest path to destination. Some researchers use the watchdog technique to detect a black hole attack. The watchdog technique is widely applied to identify misbehaving nodes by monitoring adjacent nodes’ behaviours of packets forwarding and matching with its buffer [99, 100]. However, it cannot differentiate misbehaving nodes from packet collisions or an attack. Thus, the literature discusses some technique’s extensions. Cai et al. [101] modify the monitoring method of the watchdog. The node, with a forwarding rate lower than the threshold, is a black or grey hole. Cai et al. [101] use a collaborative architecture to prevent a black hole attack. To overcome the watchdog technique’s drawbacks, the authors add two individual intrusion detectors [100]. In the network layer, these two schemes co-operated with the watchdog and exchanged information to improve detection accuracy and performance.
CUTRIC-CRITUC Low-Carbon Smart Mobility Knowledge Series No. 3 2020 Edition 1.0
62
The difference in the sequence number (SN) of AODV can detect a black hole attack. Based on AODV, Tan and Kim [102] provide a modified protocol to deter a black hole attack. This strategy refines the threshold and identifies black hole nodes as nodes with an SN greater than the new threshold. There are also some trust-based approaches to consider. Almutairi et al. [103] show that each node records and updates a trusted routing table periodically in a greedy geographic routing protocol. Similarly, Kaur et al. [104] provide a trust-based detection and elimination of the black hole node algorithm. Each node has a trust value, which is evaluated by its packet delivery ratio. The communication path is the largest sum of the trust value of all nodes in the path. Based on the trust value, Patel and Jhaveri [105] propose an ant colony optimization algorithm. Rafique et al. [106] also adopt the trust value based on trust management and fuzzy logic analyzer. Another study proposes a lightweight black hole detection protocol for the security of highways [107]. This strategy can be deployed on RSUs if the vehicle reports suspicious nodes. To prevent attacks and make a vehicle more intelligent, Alheeti et al. [108] design an intelligent intrusion detection system. They use a simulation approach to model the realistic traffic scenario and behaviours of nodes. The study applies a Fuzzy set to classify normal and abnormal behaviour. Finally, they use an artificial neural network to detect black hole nodes. In wormhole attacks, two wormhole endpoints make other nodes believe that they are neighbours in periodic routing protocols. Other nodes will discard all route request packets in on-demand routing protocols. Hu et al. [109] introduce the Packet leash as a solution. There are two types of leashes – geographical and temporal. TESLA [110] adopts the temporal leash with instant key disclosure protocol [109] to defend against the wormhole attacks. Safi et al. [111] present a scheme that can efficiently perform the AODV protocol with low overhead. The plausibility checks follow logical rules of spatial and temporal checks, similar to packets leashes [112]. Eidie et al. [113] and Lee et al. [114] demonstrate that neighbouring information can avoid wormhole attacks. Chiu and Lui [115] use the delay per hop indication method to detect a wormhole attack. For normal propagation, the delays for each hop should be proximate. If there is a wormhole attack, its delay is greater than another hop. Khobragade and Padiya [116] present the same idea. The aforementioned strategies focus on the time cost of normal nodes and then distinguish abnormal nodes. An advanced AODV approach [117] considers the behaviour of wormhole attacks and the wormhole tunnel’s time consumption. Gupta et al. [118] propose a wormhole attack detection protocol based on the AODV protocol and hound packet. In this protocol, the detection of a wormhole attack performs after the route discovery. Kaur et al. [119] perceive a wormhole attack by the same idea – an attack detects if the hop count exceeds the threshold.
Data Falsification Attacks
One major requirement of vehicular communication is truthfulness, which is the basis for ensuring road safety and avoiding accidents. Data falsification attacks could send or broadcast false information and safety alerts [120, 121], which could mislead the receptor’s (i.e. a vehicle or RSU’s) reaction and cause fatalities. Message tampering, suppression, fabrication and alteration may produce a fake message. In any of these cases, false information leads to incorrect decision-making by a vehicle or any RSU supporting it. In CAVs, the time constraint is critical, and even half-second delays can cause traffic accidents. A delayed attack, which is a special data falsification attack, can delay message transmission by adding a time interval and could affect both V2V and V2I communications. If an attacker could selectively delay a message in one direction (e.g. the sync message), the locally calculated offset will have an error that equals half of the imposed delay.
CUTRIC-CRITUC Low-Carbon Smart Mobility Knowledge Series No. 3 2020 Edition 1.0
63
There are two levels of delay attacks. The basic level delay attack influences unicast communication, and the extended level delay attack influences broadcast communication [122]. Sumra et al. [122] discusses various delay attack scenarios, including peer-to-peer delay attack, extended level delay attack, delay attack for authentication, and delay attack for taking services. Detecting falsified data is difficult – the issue lies in the data instead of the data providers. There are two methods for detecting falsified data attacks – trust-based strategy and data-centric strategy. Researchers have made efforts to build the trust and reputation model to improve security. Mármol and Pérez [123] propose a trust and reputation infrastructure-based proposal. Their study shows nodes accept or deny the alert message depending on the sender's trust level. Some scholars pay more attention to the trustworthiness of the information. Wu et al. [124] proposed an RSU-aided trust establishment scheme to improve the resilience to falsified data attacks. Another type of solution is a data-centric approach. A data-centric misbehaviour detection approach can apply to detect false alert messages [125]. Zaidi et al. [120] construct a co-operative detection and correction scheme based on neighbours’ co-operation, which can detect false emergency messages. Each vehicle calculates traffic flow, density and speed based on received packets and the data from sensors. These conditions are shared with vehicles, and nearby nodes will obtain similar values. Neighbours confirm for each other and distinguish the discrepant messages (i.e. false messages). Moreover, former parameters can be used in the intrusion detection system [121]. For more accuracy, the study uses a hypothesis-testing approach to estimate whether the suspect data is in the acceptance region.
Eavesdropping Attacks
Eavesdropping attacks occur by overhearing the wireless medium, allowing attackers to gather private information [59, 126]. It is difficult to defend against eavesdropping attacks because the victim is unaware, as there is no direct impact to the network. Hence, eavesdropping is also known as a stealth attack. There are anonymous authentication schemes that usually preload the master private key into tamper-proof devices for generating the pseudo-identity and signature for each vehicle. Encryption is a common method to prevent eavesdropping. In current DSRC/WAVE standard IEEE 1609.2, the elliptic curve integrated encryption scheme (ECIES) is used to agree on an encryption key. The key, however, needs to keep changing to prevent eavesdropping and tracking. Büttner and Huss [127] add ring signatures and application-specific pseudonyms based on ECIES. In communication, application-specific pseudonyms and ECIES parameters apply to create ring signatures. A ring refers to a set of possible signers [127, 128]. In a ring, the real signer is anonymous, not controlled by any other part. Büttner et al., evaluate and prove the prototype of this proposal in the real environment [129]. Besides the current ECIES and its improved algorithms, there are many schemes that enhance message encryption, such as identity-based cryptography [130, 131] and location-based cryptography [132, 133]. In addition, some multifold encryption and re-encryption schemes emerge. Malik and Panday [134] depict an enhanced intermediary re-encryption approach to combat eavesdropping. Feng et al. [135] propose a security transmission routing protocol to prevent eavesdropping. This strategy includes three aspects. First, the multi-input-multi-output technology applies to limit the transmission range and improves security to some degree. Second, during the route-building process, nodes can obtain only limited information of others. Third, based on the total channel equalization between the source and the destination node, other nodes cannot receive all of the channel information.

CUTRIC-CRITUC Low-Carbon Smart Mobility Knowledge Series No. 3 2020 Edition 1.0
64
Location Trailing Attacks
Location trailing attacks can reveal drivers’ private information through locating and tracking vehicles. With the help of location information, an attacker could discover the cars’ behaviours and activities, and even obtain the driver’s profile and match it to personal privacy. As a result, messages are anonymously transmitted, and pseudonyms may be changed frequently to preserve privacy. However, pseudonyms are not sufficient to resist all forms of location trailing attacks. Pseudonymous position samples can be collected and combined into pseudonymous location profiles that an attacker can easily relate to specific vehicles. For example, profiles that include the same origin and destination location on weekday mornings may reveal home and work addresses. One solution to protect location privacy is k-anonymity. Sweeney [136] uses k-anonymity approach to blur an entity in k-entities. Zhu et al. [137] combine secure multi-party computation and dynamic k-anonymity to achieve vehicular location information. Corser et al. [138] consider additional metrics such as KDT-anonymity formulas to preserve location privacy. Mix-zone is another major solution to resist location trailing. Suppose multiple vehicles enter the mix-zone and change pseudonymous identities. In that case, their identities are mixed and protected due to the random directions. Therefore, the link between the old and new pseudonym is indistinguishable [139]. For promotion, vehicles in a mix-zone send only encrypted messages to their neighbours in a threshold distance and simultaneously change their pseudonyms to avoid being tracked [140]. Moreover, the suspicious vehicle can be isolated if it stays in the mix-zone for longer than a threshold. The mix-zone could be built on silent period [141] group communication [142], or cryptographic communication [143]. The mix-zone protects location privacy. However, the cost of implementation is considerable [144]. Sun et al. [144] propose a mix-zone deployment scheme to select a setlist of locations. It ensures any vehicle can travel across a mix-zone in restricted driving time and the extra overhead time. Their scheme model maps directed graphs and solves the shortest path to find the potential locations for deploying mix-zone.
Sensor Spoofing Attacks
In a sensor spoofing attack, an attacker can modify a physical system overall. In this instance, undesirable or unintended behaviours may emerge within an embedded system. The attacker is usually familiar with the control logic of the system in connected and autonomous vehicles, and can mimic aspects of it. Common methods to search the control logic include code checking and experimentation, but sensor spoofing can create dangerous circumstances for AVs, causing them to make poor decisions. In 2015, Shoukry et al. [145] proposed the physical challenge-response authentication (PyCRA) method for active sensors. However, PyCRA could decrease the radar system’s availability. Dutta et al. [146] address this issue in the automotive radar system. Based on the recursive least square, the authors use PyCRA to detect sensor spoofing attacks by turning the radar off at random times. In addition, the estimated distance will be provided to the lead vehicle by minimizing the sum of the squared errors in a challenging period. However, this process can result in large errors. To avoid this problem, Kapoor et al. [147] implement a spatio-temporal challenge-response technique to detect and eliminate a sensor spoofing attack by verifying physical signals in the analog domain, which supports both attack detection and resilience.
Close Proximity Vulnerabilities
Close proximity vulnerabilities are created within short-range communication mechanisms when on-board sensors could attack a communication system. The attack may be primitive and may even occur by coincidence. Nonetheless, the attack can be performed by Bluetooth or keyless entry and ignition systems.
CUTRIC-CRITUC Low-Carbon Smart Mobility Knowledge Series No. 3 2020 Edition 1.0
65
It has been proven that Bluetooth control code contains a potential memory exploit, which allows the execution of code from any paired Bluetooth device. In the primitive systems, remote central locking signals could be captured and replicated to gain access to a vehicle. The alarm and immobilizers could be disabled to allow vehicles to be stolen. For example, an attacker can build an inexpensive and small electronic device conceal on or near a locked vehicle. This device can capture a single keyless entry code for unlocking the vehicle later, while also transmitting a jamming signal to block the vehicle’s reception of rolling code signals from the owner’s fob. The signals from both attempts are needed to unlock the vehicle. Additionally, some alarms and immobilizers rely on fragile secret keys and decode by laptops in just a few minutes. Many secure Bluetooth protocols have been developed using cryptographic techniques. However, most commercial products do not adopt these protocols since they can negatively impact usability. The protocols use cryptography to establish trust and prevent attacks from using open-source tools, but they cannot prevent the execution of malicious nodes by memory exploitation. If thieves can gain physical access to premium Audi RS4 vehicles, they can add a new key into the system [148]. Although this is a sophisticated premeditated attack, Audi has dismissed any liability. Scholars from the University of Birmingham [149] have developed techniques to decode mechanisms, which can be used for keyless entry. However, they were prevented from publishing their research results by the British government.
General Cyber-Attack Defense Strategies
In reality, multiple attacks usually happen at the same time. Security approaches cannot simply discover or defend against only one special attack. To detect and resist various threats, more comprehensive schemes are required, which are described as follows. Certificate revocation is a popular technology that could defend against various malicious attacks in a conventional wired network. It is also introduced into the vehicular network [150]. The certificate revocation list (CRL) evaluates and records vehicles’ abnormal behaviours. The CRL will then broadcast throughout the entire network. When a vehicle receives a message, it will consider or ignore the message depending on whether the message sender has a valid certificate. The vehicle will also report if the sender has no certificate at all, but the size of a CRL is considerably vast. Hence, many studies focus on reducing CRL’s size. Raya and Hubaux [151] use a compressed CRL and distribute a revocation protocol. Samara et al. [152] use a network that is divided into small clusters. Trust is a critical element of security and is vital for combating attacks in the vehicular network [153]. Some researchers improve security by implementing a trusted platform module (TPM). Sumra and Hasbullah [154] show that service providers issue cards with 16-bit attestation keys embedded into a TPM. Other scholars have established various trust models to resist misbehaviour. Li and Song [155] discuss a full-scale trust scheme, including data trust and node trust, to defend against multiple attacks. This scheme combines local and external evidence to evaluate trustworthiness. A cloud-assisted solution is another general defense strategy. Zhang et al. [156] propose a cloud-assisted vehicle malware defense framework, which uses the cloud’s detection and scanning capability and its enormous up-to-date malware information database. Mallissery et al. [157] depict a cloud-enabled vehicular ad hoc network scheme that provides double safeguards to ensure message security.
CUTRIC-CRITUC Low-Carbon Smart Mobility Knowledge Series No. 3 2020 Edition 1.0
66
The benefits and applications of software-defined networking (SDN) have been discussed in recent years. Many studies have proposed SDN to improve a vehicle security system [158, 159]. Hussein et al. [160] propose a security service architecture based on an SDN, fog computing and vehicular network. This subsection has outlined various cyber-attack pathways that could attack e-LSAs when deployed along first-kilometre/last-kilometre routes. Defense mechanisms against each of the cyber-attack pathways and general cyber-attack defense strategies are described. Cybersecurity will remain at a forefront risk for e-LSA deployment (and all CAVs) given the increasing number of cyber-attack pathways and increasing CAV technology nodes, which may be susceptible to hacking and render the entire system vulnerable. Therefore, cities and transit agencies must plan a long-term cybersecurity strategy by maintaining strong relationships with manufacturers and updating systems as needed to ensure that the latest industry cybersecurity standards are embedded.
Cybersecurity and Safety Standards of CAVs In addition to the defense strategies discussed, several cybersecurity and safety standards have been designed for CAVs, including ISO 26262, SAE J3061 and the British Standards Institution’s (BSI) cybersecurity standard. They are described as follows.
ISO 26262
ISO 26262 is derived from IEC 61508, which is used for electrical safety-related systems. This standard provides a safety lifecycle in the phases of management, development, production, operation, service and decommissioning, and supports tailoring necessary activities in these phases. ISO 26262 includes 10 parts: vocabulary, management of functional safety, product development, supporting processes, automotive safety integrity level (ASIL), etc. ASIL is determined by severity classification, exposure classification and controllability classification. Moreover, it can quantify the severity of an injury, probability of occurrence and controllability of the situation. Available techniques to assess ASIL contain hazard analysis and risk assessment, fault tree analysis, failure mode and effects analysis. In 2018, ISO 26262 was revised to include rules for trucks, buses, trailers, semi-trailers and motorcycles [161]. The revised standard also includes guidance on model-based development, software safety analysis, dependent failure analysis, semiconductors, fault tolerance, special safety-related features and software tools. Furthermore, the revised standard contains extended vocabulary, more detailed objectives, objective-oriented confirmation measures, information on managing safety anomalies, references to cybersecurity, updated values for hardware architecture metrics and methods to evaluate hardware elements.
SAE J3061
Based on ISO 26262, SAE J3061 identifies the growing threat landscape. This standard establishes the terminology of threat, vulnerability and risk, providing an overview and distinction between system safety and cybersecurity. Also, it presents general guiding principles concerning cybersecurity that apply to any organization within a company. As with system safety, cybersecurity must be built into features. Hence, it requires an appropriate life-cycle process from the concept phase through production, operation, service and decommissioning. It also provides information on some standard existing tools and methods for designing, verifying and validating cyber-physical vehicle systems. The foundation is then applicable for further standard development activities and in-vehicle cybersecurity. Finally, appendices provide additional information that may help improve the cybersecurity of design features. SAE J3061 makes some suggestions for maintaining consistency between safety and cybersecurity, including building appropriate checkpoints into the product life cycle of both processes, using a risk analysis

CUTRIC-CRITUC Low-Carbon Smart Mobility Knowledge Series No. 3 2020 Edition 1.0
67
method to address threats, and identifying various paths between safety and cybersecurity. Besides, SAE J3061 points out that while a cybersecurity-critical system may not be safety-critical, the reverse is true.
British Standards Institution’s Cybersecurity Standard
In December 2018, the British Standards Institution (BSI) published a new cybersecurity standard, PAS1885:2018 [162], following a publication from August 2017 of the key principles of vehicle cybersecurity for CAVs [163]. According to BSI, a security system’s principles include three aspects. First, organizational security should be owned, governed and promoted at the board level. Second, security risks should be assessed and managed appropriately and proportionately, including those specific to the supply chain. Third, to ensure systems are secure over their lifetime, organizations require product aftercare and incident response. In this standard, the principles of system design include five aspects, which are shown as follows:
1. All organizations, including sub-contractors, suppliers and potential third parties, should work together to enhance the security of the system.
2. The security architecture uses defense-in-depth and segmented techniques. It seeks to mitigate risks with complementary controls, such as monitoring, alerting, segregation, reducing attack surfaces, trust layers and other security protocols.
3. The security of all software is managed throughout its lifetime. Organizations should adopt secure coding practices to proportionately manage risks from known and unknown vulnerabilities in software, including existing code libraries. It must be possible to ascertain the status of all software, firmware and their configuration, and the software should be updated safely and securely. The software should adopt open design practices.
4. Data must be sufficiently secure when stored and transmitted, with only the intended recipient or system functions able to receive and access them. Personal identifiable data must be managed appropriately, which means users are able to delete sensitive data.
5. The system should be able to withstand receiving corrupt, invalid or malicious data or commands by its external and internal interfaces, while remaining available for primary use. Systems should be resilient and fail-safe if safety-critical functions are compromised or cease to work. The mechanism is proportionate to the risk. The systems can respond appropriately if non-safety critical functions fail [163].
Additional relevant cybersecurity standards and frameworks include the following:
● NIST Cybersecurity Framework ● National Highway Traffic Safety Administration Cybersecurity Framework ● IEC 62443 - Industrial communication networks - Network and system security ● ISO/IEC 15408 - Information technology - Security techniques - Evaluation criteria for information
technology security ● ISO/IEC TR 15446 - Information technology - Security Techniques - Guidance for the production of
protection profiles and security targets ● ISO/IEC 18045 - Information technology - Security techniques - Methodology for IT security
evaluation [39] ● ISO/IEC 20889 - Privacy Enhancing Data De-Identification Terminology and Classification of
Techniques ● ISO/IEC 27001 - Information technology - Security Techniques - Information Security Management
Systems - Requirements ● ISO/IEC 29100 - Information Technology - Security Techniques - Privacy Framework
CUTRIC-CRITUC Low-Carbon Smart Mobility Knowledge Series No. 3 2020 Edition 1.0
68
● ISO/IEC 29134 - Information Technology - Security Techniques - Guidelines for Privacy Impact Assessment (PIA)
● ISO/TR 12859 - Intelligent Transport Systems - System Architecture - Privacy Aspects in ITS Standards and Systems
Conclusion The security challenges faced by CAVs and e-LSAs must be tackled broadly by a comprehensive research and development effort, as well as through trial-and-error pilot and trial projects on dedicated laneways in low-risk communities or on low-risk routes. This section surveyed several major attacks and their attack methods in CAVs, as well as corresponding strategies to resist them. Finally, several cybersecurity and safety standards were described for CAV risk assessment. CAVs and e-LSAs, as platforms for CAV mobility, require continuously improved cybersecurity frameworks to prevent multiple cyber threats to a fully connected transportation vehicle and infrastructure network, with an unprecedented number of potential attack vectors. Cyber safety frameworks, guidelines and standards for CAVs will need to be collaboratively and comprehensively developed with all relevant Canadian and international public and private bodies. Cities and transit agencies interested in deploying e-LSAs on first-kilometre/last-kilometre routes must, therefore, ensure that there is a robust, collaborative and iterative strategic plan for the long-term cybersecurity of the system. Cities will need to remain up to date on the latest cybersecurity protocols by working closely with private sector and academic experts, and only procuring systems that are aligned with the latest industry standards and best practices for cybersecurity.

CUTRIC-CRITUC Low-Carbon Smart Mobility Knowledge Series No. 3 2020 Edition 1.0
69
SECTION V: NATIONAL SMART VEHICLE JOINT PROCUREMENT INITIATIVE QUALITATIVE OUTCOMES Summary of Session Dialogues and Outcomes from the Manufacturer Working Group Sessions (2018-2019) As part of the National Smart Vehicle Joint Procurement Initiative (previously known as “National Smart Vehicle Demonstration and Integration Trial”) led by CUTRIC, a Smart Vehicle Working Group was formed in 2018 to bring together national stakeholders, including manufacturers and city representatives, to discuss opportunities for multi-manufacturer first-kilometre/last-kilometre standardized e-LSA deployments. That group was refined to include leading and champion e-LSA manufacturers, and cities and transit agencies, over a 24-month period. The section below outlines key outcomes from the CUTRIC-led Smart Vehicle Working Group consultation sessions held across Canada from 2018 to 2019. Specific e-LSA and charger manufacturer details have been removed below, as required, to maintain confidentiality outside of CUTRIC’s membership base.
Session #1
Following a series of five technical planning sessions over the course of 2017 and 2018, the first Smart Vehicle Working Group Session took place on September 6, 2018 in Toronto, with additional attendees participating via webinar. Session 1 included a product overview by one of the e-LSA manufacturers, describing the vehicle and software technologies used in their automated shuttle system. This began with an explanation of the physical parameters of the shuttle, its battery and charging systems, and some of its controls and management software. In a follow-up discussion, additional details were requested on the charging system design, and concerns were brought up related to operations in cold weather and snow. The e-LSA manufacturer provided a second presentation on the shuttle’s communication systems. This included an overview of the hardware, software, data collection and storage, and cybersecurity protocols used for communications. Attendees wanted to learn more about manufacturer’s infrastructure and operations control requirements. They had clarified that this system would require either a Wi-Fi or 4G/5G network to operate and communicate with the fleet management systems. Bombardier expressed interest in managing control operations if a municipal client required it. The operation of multiple deployments by a single control centre was described as possible but not planned. Finally, the Working Group discussed further potential issues with snow and ice, as well as cybersecurity, none of which the manufacturer foresaw as a problem.
Session #2
The second session of the Smart Vehicle Working Group took place in Toronto on October 25, 2018. The focus was on current global and Canadian standards for shuttle CAVs. The session began with a review of the Working Group Charter, which identified a target of developing standards for the Canadian deployment of e-LSAs. Attendees expressed interest in expanding the scope of testing. A review of the Project Risk Registry followed, with feedback suggesting additional risks such as
CUTRIC-CRITUC Low-Carbon Smart Mobility Knowledge Series No. 3 2020 Edition 1.0
70
government election cycles, changing public sentiment, technical risks and complexity in working with many stakeholders. The Working Group also reviewed the first session of the CUTRIC-led National Advisory Committee (NAC), which brought together representatives from six Canadian universities to determine which elements of the Smart Vehicle Project they believed they could conduct additional research on. Suggestions included vehicle light weighting and crash-worthiness, charging optimization, cybersecurity, and sensor performance in winter conditions. An overview of the current global standardization efforts for connected vehicle technologies was provided, including those in Europe, the United States and Canada. A key set of SAE and IEEE standards were outlined for DSRC and WAVE, comprising the current North American DSRC standard. Siemens presented the company’s offerings for vehicle connectivity systems, including red light violation and crash predictions, as well as pedestrian safety, travel time, and other data collection and management. They offered a detailed look into the communications standards related to Siemens’ vehicle connectivity solutions. Attendees questioned the focus on DSRC, which Siemens explained was purely due to the lead DSRC had taken over its alternative, C-V2X. Following this was a presentation by one of the e-LSA manufacturers, showing the wireless communications technologies used in their shuttle systems. Here, they emphasized layers of communication, with separate considerations for motion control, vehicle coordination and navigation. A follow-up discussion included topics of conflicting standards across jurisdictions, cybersecurity within communications standards, and fare integrations, which was not expected to be included in either of the vehicle connectivity systems presented.
Session #3
The third Smart Vehicle Working Group session took place in Montreal on December 12, 2018. The focus of this session was on the interoperability of charging systems. After presenting a review of the content and progress made in previous Smart Vehicle Working Group sessions, CUTRIC shared an overview of its e-LSA modelling work for ACATS. In the feedback and discussion that followed, participants clarified some of the techniques and measures used in the modelling work, including vehicle acceleration rates, passenger load and charging efficiency calculations. There were questions surrounding the need for personnel to operate charging equipment, as well as uncertainties for cities regarding passenger load, which affects modelling. Next, the Town of Cochrane presented a set of municipal perspectives on smart vehicle deployments. eCAMION followed, presenting a description and explanation of the company’s battery-based charging solution for AVs. Subsequent discussions included clarifications about the system’s power levels, voltage and physical design. Following this, ABB showcased their alternative AV charging systems. Both the opportunity and maintenance area charging solutions designed by ABB offer multiple power levels to meet different operational requirements and the ability to connect via 3G to high-level management software. The opportunity pantograph charger supports higher power levels to charge buses, with an arm that offers nearly two metres of height range to accommodate both large and small vehicles. An e-LSA manufacturer then shared a review of their charging system. The plate structure used for this charging system would ideally be located under a covered station, protecting it from weather, although other options exist for automatically cleaning the plates or heating the plates to keep them free of snow and ice.

CUTRIC-CRITUC Low-Carbon Smart Mobility Knowledge Series No. 3 2020 Edition 1.0
71
Regarding standards, the manufacturer offers a complete package solution. It does not focus on adhering to industry standards or generally share its technical standards with others. For the purposes of this project, standardization of the charging system was a requirement.
Session #4
The fourth Smart Vehicle Working Group session took place in Ottawa on January 30, 2019. The focus of this session was on regulatory frameworks, both federal and provincial, affecting demonstration parameters. CUTRIC began with a review and update on progress made to date on the Smart Vehicle Project. The meeting thereafter segued into presentations by Canadian municipalities on their Smart City programs and their experiences with e-LSA pilot deployments. Surrey shared updates on their joint proposal with Vancouver to the Federal Smart Cities Challenge, describing how the two cities planned to implement Canada’s first two collision-free multimodal transportation corridors. The presenter also gave details on their collaborative e-LSA demonstration, nicknamed “ELA”, scheduled for February 2019. Next, the City of Brampton discussed their municipality’s Smart City initiatives, which included connected vehicle and ITS pilots to gather real time traffic information, transit fleet data and GIS-enabled infrastructure management. They also mentioned open data as a key component for Brampton in growing engagement and modernizing decision making. Transport Canada then shared an update on the ACATS program, providing details on a few of the 15 projects that had received C$2.9 million in funding from the program. This included an e-LSA “ELA” trial in Northeast Calgary, a planned e-LSA deployment in Toronto, and a project by the CSA Group to create a multi-stakeholder CAV Advisory Council to develop industry guidelines, standards and training material for CAV deployment. A second Transport Canada presentation offered an overview of Canada’s motor vehicle self-certification regime. They explained that, through the Motor Vehicle Safety Act (MVSA), Transport Canada is empowered to issue and enforce safety regulations for motor vehicles and equipment. Canada Motor Vehicle Safety Standards (CMVSS) detail these vehicle requirements and companies are responsible for meeting them, as well as documenting and communicating their compliance. For new types of vehicles, such as the e-LSAs, they described a process through which temporary imports, testing and demonstration could be permitted, or exemptions could be attained. Attendees sought clarification on the operational definition of a shuttle, for which Transport Canada said documentation is still being developed. They also asked whether provinces would have a future role in regulating vehicles with Level 4 or Level 5 automation, to which Transport Canada responded that it was likely but presently undetermined. An interprovincial and federal working group was said to be considering this. The government’s role in regulating connected vehicle technologies was then discussed, including the present role of ISED (Ministry of Innovation, Science, and Economic Development). Current debates on DSRC versus 5G, playing out particularly in the United States, were described. Although Transport Canada does not take a stance on a particular technology, federal and provincial governments have contributed millions of dollars to build 5G networks. The meeting concluded with additional presentations by ISED on frameworks for data privacy and by the Ontario Ministry of Transportation on its AV Pilot Program.

CUTRIC-CRITUC Low-Carbon Smart Mobility Knowledge Series No. 3 2020 Edition 1.0
72
Session #5
The fifth Smart Vehicle Working Group session took place in Toronto on March 21, 2019. The focus of this session was on providing cities and transit systems with information needed to determine standardization requirements across manufacturers, including an examination of physical and digital shuttle platforms and charging systems. After CUTRIC provided an update on the overall Smart Vehicle Project, an e-LSA manufacturer presented their shuttle system. The manufacturer clarified that the 16-hour maximum battery life of the vehicle was likely to be limited to 12 hours if used with full air conditioning or heating, or 11 hours if also maintaining full passenger loads. The manufacturer described the accessibility ramp on their shuttle as being housed under the vehicle from where it can automatically roll out. The manufacturer uses Amazon cloud services for its software platform, although they would be open to finding a Canadian base if needed. Likewise, the company is open to discussing options on where the vehicles will be manufactured. The manufacturer has experience with projects that combine multiple manufacturers’ vehicles on a single route and have integrated their shuttles with a transit agency’s existing operations. The manufacturer shuttles can also store any number of routes, and the fleet management system can instruct the shuttles on where to go at any time. The manufacturer does not manufacture their own OBUs and are agnostic to the OBU manufacturer used. In terms of infrastructure, DSRC modules are required whenever the shuttle crosses a traffic signal. In addition, the system relies on the services of an external GNSS provider, which refines the vehicle’s position with centimetre accuracy. This service has coverage in all major residential areas in Canada and requires a fee that the manufacturer incorporates into its pricing. In the following presentation, a second e-LSA manufacturer outlined their AV system. They gave details on the system’s specifications, cybersecurity and costs. During follow up questions, they explained that the shuttle uses DSRC for infrastructure communications (i.e. at intersections) and a GNSS base station that should be stored in a protected area near the vehicles’ operations. As a backup to GNSS localization, LiDAR HD mapping is used. If location awareness is lost or there is an obstruction, the vehicle will, by default, come to a stop. This manufacturer is also agnostic to the OBU manufacturer and uses Amazon web services for its cloud data centre. The company has experience being the sole form of local transit for a community and has also operated alongside a competitive e-LSA manufacturer on a closed course (though the vehicles were not connected or operated with the same software). There is an API for the vehicles to share or receive data from third-party operators, and the manufacturer has experience doing so – scheduling and on-demand functionality can be achieved in this way. Although the manufacturer is not opposed to considering manufacturing in Canada, they currently build their vehicles at two plants located in the United States and Europe. The session then shifted to the topic of charging systems, beginning with a presentation by eCAMION about their two automated charging systems in development. The following presentation by ELIX Wireless detailed the wireless charging system offered by the Canadian company. This charging method was described as a low-cost solution that could be fully autonomous and, therefore, avoid efficiency losses, foreign object heating and high-frequency electromagnetic interference. Their system is compatible with and has experience working with multiple shuttle manufacturers. Attendees learned that the system’s maximum power level is 7.2 kW and the actual system installation only takes about half a day. SmartCone Technologies then gave a presentation on their data collection and signage systems. SmartCone communicates with third-party signage equipment to flash messages when a shuttle is coming. The group learned how SmartCone and Aurrigo came to collaborate to launch a project with the Town of Whitby, Ontario, dedicating a lane of traffic for a shuttle to aid in first-kilometre/last-kilometre connections to the GO Transit station. This project included involvement from AVIN and Durham Region Transit, and support from
CUTRIC-CRITUC Low-Carbon Smart Mobility Knowledge Series No. 3 2020 Edition 1.0
73
Metrolinx. SmartCone indicated its future interest lies in growing its partnerships with both manufacturers and cities. They also clarified that their system can operate with multiple manufacturers’ proprietary systems at the same time. Finally, the third e-LSA manufacturer participating in the project presented further details about the company’s vehicle and software systems. They clarified that their fleet management system has an open API that supports integrations with third-party data. Prospects for manufacturing their vehicles in Canada were unknown but considered possible, as this process was outsourced by the company. Current deployments were listed in the Netherlands, Abu Dhabi, Dubai and Singapore, with the fleet management software also used in ride systems in Universal Studios in Florida and port environments around the world.
Session #6
The sixth Smart Vehicle Working Group session took place as a digital webinar on May 31, 2019 and included only the members of the Working Group who represented cities and their transit agencies. The focus of this session was on sharing each city’s e-LSA standardization objectives and deployment timelines. The meeting began with an update by CUTRIC on the standardization goals of the project. This included V2V and V2I interoperability and standardization, and the merging of an operator’s system and data through an API with transit controls or fleet management software. Also, semi-standardization of charging, both in-depot and on-route, was noted as an additional goal. The Town of Cochrane delivered the first municipal presentation. Although the town does not currently have public transit, they said they will be launching a fully on-demand stop-to-stop system in 2019, as well as an electric regional bus system providing commuter service into Calgary by the end of 2020. Cochrane would be potentially interested in deploying automated shuttles on a route parallel to its historic downtown area, as well as on a route through the tech district and shopping centres. The on-demand transit system would need to be proved before expanding to include automated shuttles. Second, the City of Vancouver described how they were currently regrouping after two years of hard work toward their Smart Cities Challenge bid, which was unsuccessful. They believed that the work done and partnerships formed for the bid could be leveraged to future opportunities, including acquiring funding through either Western Economic Diversification Canada or the Strategic Innovation Fund: Stream 5. Vancouver highlighted a potential point-to-point CAV corridor and developed an interest in testing emerging 5G technologies for CAVs. Equity, including gender equity, was noted as a desirable area for further discussion regarding CAV technologies. York Region Transit followed by stating that, although they do not currently have a Smart City plan in place, they will be reviewing emerging technologies, including CAVs, which they believe could help address both vehicle emissions and first kilometre/last-kilometre challenges. York Region is interested specifically in routes connecting to GO stations. Deployment within the next 12 months was not considered feasible, but additional explorations into Innovation P3© options were of interest. The City of Montreal then discussed how it received C$5 million from the Ministère des Transports du Québec for AV pilot projects over the next two to five years. The City said it was currently working with Transdev to deploy a shuttle near the Olympic Stadium area. The goal of its deployments is to provide realistic solutions for communities, not for show. With the C$50 million it won through Infrastructure Canada’s Smart Cities Challenge, the City plans to launch a variety of projects oriented around smart mobility and sustainability. The stated goal for CAV deployments was to connect as closely as possible to transit.
CUTRIC-CRITUC Low-Carbon Smart Mobility Knowledge Series No. 3 2020 Edition 1.0
74
While standardization has not yet been a priority in Montreal’s CAV endeavours, the RSUs that have been used (from Siemens) are not proprietary and could support a variety of manufacturers. So far, Montreal’s transit agency, STM, has not been involved in the operations of Montreal’s shuttle pilots. At this point, trials have mainly been focused on achieving a proof of concept, both technologically and socially.
Session #7
The seventh Smart Vehicle Working Group session took place in Toronto on July 2, 2019. The focus of this session was on discussions of each city’s e-LSA deployment timelines and on bids for funding. The session began with an overview of funding options available, including the Strategic Innovation Fund: Stream 5, Western Economic Diversification Canada – Regional Innovation Ecosystems, and CUTRIC’s own Innovation P3© Initiative. Following this, municipal and transit representatives briefly outlined their own CAV and e-LSA deployment timelines, including relevant current and past projects.
Summary of Session Dialogues and Outcomes from the Smart Vehicle Joint Procurement Initiative Sessions (2020)
Session #1
The first session of the Smart Vehicle Joint Procurement Initiative in 2020 took place as a digital webinar on April 14, 2020. The session began with a review of preliminary technical specification guidance of smart shuttle joint procurement. The project focuses on joint procurement of commonly designed shuttle systems composed of approximately 30 vehicle units Canada wide, with real-time data-sharing and performance evaluation of battery range, battery degradation, ridership and passenger levels, on-time performance, maintenance failures, and other core variables determined by partnering transit agency and airport members. The session continued with a summary of outcomes associated with transit automation expertise feedback, which was conducted as part of a semi-structured interview with stakeholders from transit agencies, industry stakeholders, and government entities. The interview focused on gathering feedback regarding the opportunities, challenges, and solutions allied to automated transit technology deployment. The interview’s key findings mandate an essential need for a coordinated and structured dialogue engaging core stakeholders from government and transit systems, potential users and private industry to generate an immediate e-LSA roadmap in Canada. The roadmap would include a strategic plan with a realistic timeline and strategic goals for the deployment of e-LSAs on Canadian streets (e.g. percentage of congestion reduction or car reduction, and percentage of transit ridership increase in service areas). The outcomes of this research will be used to help CUTRIC better formulate its National Smart Vehicle Project. CUTRIC researchers also shared summary outcomes of a recent study titled “Driverless Shuttle User's Perception and Experience: Global Assessment Using Twitter Data.” This analysis shows that the primary inclination of users is to understand the technology itself at this stage. The study also found that users’ opinions evolved gradually from generally more positive sentiment in 2015 to more negative by 2019, reflecting perhaps the transition from people’s excitement with the new technology to more critical views of its practical abilities.
Session #2
The second session took place on June 5, 2020, digitally. The session continued the joint procurement planning by exploring empirical demonstration evidence and lessons learned from trial data across the country and globally. The goal was to provide a current picture of the Canadian landscape and activities within the autonomous and connected vehicle space. During this session, speakers from the City of Candiac, Calgary Transit, the City of Toronto and the Utah Transit Authority shared their logic for piloting smart
CUTRIC-CRITUC Low-Carbon Smart Mobility Knowledge Series No. 3 2020 Edition 1.0
75
shuttles, and short-term and long-term goals for shuttle deployments. They also provided information on experiences with smart shuttle performance, technical features, lessons learned and recommendations that came out during the procurement processes. CUTRIC researchers also provided detailed interview outcomes with stakeholders with a specific focus on a few themes, including the performance of smart shuttles, financing and procurement options, and cost overview. General considerations based on the interview outcomes are listed below:
• Key governmental considerations should be focused on the need for aligned investments across government levels to prioritize funding options for advanced public transit solutions, which enables smart vehicle technology testing and job growth.
• Transit agencies can reduce operating costs by integrating a shuttle with a transit system. A robust cost-benefit analysis based on real data is required.
• Manufacturers should move away from developing prototype vehicles towards a commercially available vehicle that can move people and ensure compliance with the relevant federal safety standards.
• Cities must build out smart roadway infrastructure across regions to enable smart vehicle technology connectivity and functionality. At the same time, it is important to establish strong collaboration across public and private players to determine ownership, operations and maintenance models for the full gamut of expensive smart infrastructure required to support the technologies.
• A P3 model may provide budgetary stability and allows the transference of risk, with participants only required to assume risks in the areas in which they are experts.
Session #3
The third session of the Smart Vehicle Joint Procurement Initiative in 2020 took place as a digital webinar on July 23, 2020. The session began with an overview of state of landscape of CAV Standards in Canada, which was published by the CSA group as part of the ACATS program. The focus of this review was on connectivity, cybersecurity and on-road standards of smart shuttles. Some potential gaps identified from this review include a lack of standards and security framework that directly relate to cybersecurity and privacy protection within CAV technology. Another gap related to the development, availability and compatibility of HD mapping and localization technology to support the operation of CAVs. The session continued with a standard overview of European procurements shared with 2GetThere, the shuttle manufacturer based in Europe. Customer satisfaction, communications systems, charging time, and funding and financing experiences were some themes that the 2GetThere representative discussed during the session. CUTRIC shared available financing and funding options for smart shuttle joint procurement, followed by a roundtable discussion on key opportunities and challenges associated with a joint procurement of AV smart shuttles among three to four cities or airport fleets in Canada.
Summary of Key Themes and Trends Across seven sessions of the Smart Vehicle Project Manufacturer Working Group, a broad set of topics was presented and detailed, covering manufacturer e-LSA products, global and Canadian CAV standards, the interoperability of charging systems, regulatory frameworks and deployment timelines. Participants were able to dive deeper into areas of uncertainty, and to express their thoughts or concerns on specific issues and key areas of importance. Throughout the Smart Vehicle Working Group sessions, a topic that arose frequently was how the challenges of cold weather, ice and snow could impact the operation and maintenance of e-LSA vehicles and their charging systems. Structures to house vehicles at proper temperatures were discussed, as well as options

CUTRIC-CRITUC Low-Carbon Smart Mobility Knowledge Series No. 3 2020 Edition 1.0
76
for keeping installed charging pads clear and dry. Both solutions would, however, increase capital costs for transit agencies and cities aiming to integrate e-LSAs in the near-term future. Other questions were raised about how well charging infrastructure could accommodate multiple types of vehicles used by Canadian transit agencies, including full-sized battery electric buses (BEBs). Participants were also interested in the ability for e-LSA systems to integrate with transit operations and fare collection systems, as well as their flexibility to be used in different applications and for multiple routes. Currently, most e-LSAs are not designed to interoperate with standardized high-powered overhead charging systems for BEBs, although transit clients could demand manufacturers to align in the future. Related themes emerged in discussions as to what additional infrastructure would be needed to deploy fleet-wide e-LSA systems, and how those infrastructure installations would be maintained if they required specialized knowledge. Participants aimed to understand which manufacturers would make which components of a working system, including OBUs and RSUs, and maintain them. Further interest was given to which vehicles or parts might be manufactured in Canada, and how Canada might be privileged as a location for remote operation control centres and data storage by manufacturers. Infrastructure outsourcing (both ownership and operations) was promoted as a potential solution for mid-sized cities in particular, which cannot absorb new digital control teams for low volume e-LSA integration in early years. Additionally, international manufacturers were encouraged to consider localizing their digital control teams so that e-LSAs operating in, say, Brampton would not be operated from the Netherlands or the U.S. Standards were also a major discussion theme. Participants frequently discussed issues surrounding which standards should be used in public tenders for e-LSAs, especially in charging and communications systems, as well as who would play a role in determining those standards. This extended into concerns about ensuring the compatibility between multiple vehicle, charging and software manufacturers, as well as interest in how willing manufacturers would be to collaborate and operate compatible systems. A large-scale national integration trial – similar to CUTRIC’s Pan-Canadian Electric Bus Demonstration & Integration Trial – which integrates multiple BEB and e-charger manufacturers, was promoted as a model to follow in launching a nation-wide multi-city e-LSA standardization trial with multiple manufacturers. Given the fundamentally different navigation and charging systems used by the three e-LSA manufacturers involved in the project today, however, an integration trial for e-LSAs would be much more complex and commercially risky for manufacturers compared with the CUTRIC BEB integration project. Safety and reliability were also common topics. Participants wished to clarify how cybersecurity issues would be addressed, how critical systems such as those for navigation and vehicle control would be backed up with fail safes, and what crash-test or even radiation information existed for various components. Furthermore, participants questioned what the best methods might be for assessing the safety of these systems, as it represented new territory for regulators in many ways. Participants proposed integrating the CSA Group as a leading voice in helping to define a core set of tender-ready cybersecurity protocols that could be integrated into city-led e-LSA procurements over the next 24-month period. Finally, it is worth noting themes that were largely absent from these discussions. Overall, the costs of e-LSAs and their charging systems (which can vary from hundreds of thousands of dollars to millions of dollars per vehicle-charger set) were not discussed. Their components and their operation were left to future CUTRIC technical planning sessions on the basis that some of the operations, at least, could be outsourced in an innovative public-private partnership model. Likewise, the issue of a scale-up strategy – from a few trial e-LSAs to a fleet of e-LSAs for city-wide first-kilometre/last-kilometre resolution – was left to future technical sessions planned in 2020, as was the matter of economic lifecycle assessment costings for e-LSAs, including their degradation patterns and residual values at end-of-life.

CUTRIC-CRITUC Low-Carbon Smart Mobility Knowledge Series No. 3 2020 Edition 1.0
77
These latter issues would constitute valuable follow-up research for Transport Canada to pursue in the future as part of an e-LSA pilot program, and deployment program planning process and feasibility assessment.

CUTRIC-CRITUC Low-Carbon Smart Mobility Knowledge Series No. 3 2020 Edition 1.0
78
CONCLUSION In this report, five separate sections were outlined relating to e-LSA deployment as first-kilometre/last-kilometre transit solutions. This research was performed in relation to CUTRIC’s National Smart Vehicle Joint Procurement Initiative, which aims to deploy e-LSAs along first-kilometre/last-kilometre transit routes in multiple jurisdictions across Canada. The research in this report was aided by CUTRIC’s experience leading the National Smart Vehicle Project over the last three years with stakeholders from industry, academia, cities, and provincial and federal governments. The National Smart Vehicle Project will move towards funding and on-road deployment of e-LSAs in 2020-2021. Section I provided an energy consumption feasibility analysis for the deployment of an e-LSA along first-kilometre/last-kilometre routes selected as theoretical deployment routes by the cities of Calgary, Trois-Rivières, Surrey, Brampton, Edmonton, Vancouver, York Region, Montreal and Quebec City. The routes were selected based on a series of criteria provided to the cities, and range from 435 metres to 3.37 kilometres long, and 1.69 per cent to 6.86 per cent in road gradient. The technical specifications of the shuttle manufacturer were input into the model to assess the SOC of the e-LSA along each route under three duty cycles, and the resulting implications on scheduling. The results of the model show the high variance in kWh/hr among different routes, given the different routes provided (i.e. route length, topography and stops). The results also show that under the medium-duty and heavy-duty cycle simulations, the simulated vehicle would not be able to perform a full-service day along most routes on a single battery charge. The simulated vehicle does offer an on-route opportunity charging system and would, therefore, be able to recharge after each round trip or loop on the road, making it easier for the operators to manage the shuttle. The feasibility study also showed that the optimal first-kilometre/last-kilometre routes should have low traffic volumes, low roadway gradients and high-power opportunity charging. Low traffic congestion was seen as a key requirement, since e-LSAs currently cannot travel at posted roadway speeds (i.e. 50 km/h), making them more suitable in dedicated laneways or semi-dedicated laneways where traffic congestion is low and the shuttle can be avoided by other vehicles. Low roadway gradients are a requirement since high slopes consume significantly more energy and will have a marked impact on the number of round trips of service hours the shuttle can perform. This is of particular importance for shuttles without on-route charging. High-powered opportunity charging will be required for most of the routes. These results show that shuttle schedules must, therefore, be built on a per-route basis depending on the maximum number of round trips a shuttle could perform before needing a recharge, and the charging system used (on-route versus in-depot). Empirical data is required to validate the results of this feasibility study. CUTRIC is working with its partner organizations to obtain second-by-second validation for this model. Section II provided a transit ridership impact analysis based on assumptions stemmed from a four-step transportation model that consists of trip generation, trip distribution, mode split and traffic assignment. Three routes from Section I were selected for this analysis: Trois-Rivières, York Region and Brampton, since these routes met the required first-kilometre/last-kilometre criterion and presented quantifiable impact analysis scenarios. A number of metrics were either obtained or assumed based on available data sets from the cities or literature-sourced values. Ridership impact scenario simulations were performed based on two different assumption scenarios under four different categories – low ridership, expected ridership, high ridership and unrealistic ridership. The results showed a high variation between the number of cars displaced and the increased ridership in each scenario. In Trois-Rivières, under an expected ridership scenario, up to 85 cars could be reduced from households. In York Region, the number increases to 108, and in Brampton the estimated number is 117.
CUTRIC-CRITUC Low-Carbon Smart Mobility Knowledge Series No. 3 2020 Edition 1.0
79
These results are quite substantial, since this simulation includes only a single shuttle along one fixed route. Although this simulation was highly theoretical and would require access to additional data sets for a more robust analysis, the results show that e-LSA deployments could help cities achieve mode-shift, congestion reduction and emissions reductions targets by making transit access a more convenient and efficient option with e-LSAs. Section III provided an overview of standards and certifications for CAVs. The section also reviewed the strengths and drawbacks of various sensory systems, including LIDAR, radar, cameras and ultrasonic sensors. Each of these sensory systems has its own unique strengths and drawbacks. There is no single sensory technology that can provide the comprehensive sensory need for safe AV operations. Manufacturers, therefore, pair multiple sensor technologies in order to ensure sufficient redundancy for safe operations in all conditions. The process and challenges of sensor fusion were also detailed, including scenarios where multiple sensory systems on a single vehicle interpret an object differently, and latency concerns with computing mass amounts of sensor data from multiple inputs in real time. Sensor fusion remains a hurdle for low-latency AV operations, especially at higher speeds. The computing power necessary to collect and interpret data from multiple sensors in real time is substantial and requires further innovation to reduce latency. This section also detailed CUTRIC’s ACES Big Data Trust initiative, which would house a secure cloud portal that obtains the feeds from CAV pilots, test beds, on-road demonstrations and commercial deployments. The Ministry of Innovation, Science and Industry has adopted this initiative proposal as part of the Vehicle of the Future expert consultation group. Section IV detailed the many possible cyber-attack pathways for malicious hacking into CAVs with respective defence strategies. The complexity and range of cyber-attack methods, paired with the evolving cyber-attack landscape, underscore the need for a collaborative and iterative approach for cybersecurity so that new risks can be reported, and defense strategies developed and adopted. This section also highlighted the range of cybersecurity standards that currently exist. Even though a number of technical standards currently exist pertaining to CAV cybersecurity, no suite of standards can sufficiently ensure a vehicle is cyber-safe. All system components need to be purpose-built with embedded cybersecurity measures, and standards need to be updated as the CAV network is deployed and more CAV nodes enter the connected environment. Section V provided key presentations and discussions from the National Smart Vehicle Project Working Group Sessions #1–7 for the National Smart Vehicle Project from 2018 and 2019, and Smart Vehicle Sessions #1–3 that took place in 2020. Throughout the sessions, primary topics of conversation were various e-LSA manufacturer products, global and Canadian AV standards, interoperability of electric charging systems for e-LSAs, regulatory frameworks and deployment timelines. Future sessions will focus on developing a memorandum of understanding (MOU) with interested partners, including an option for government funding, as well as an innovative public-private partnership model that could provide outsourced operations and private systems financing to solve current funding gaps and equalized risk distribution across public and private stakeholders. In sum, e-LSAs deployed as first-kilometre/last-kilometre transit solutions present a multitude of potential benefits, including congestion reductions, emissions reductions, a decreased number of passenger cars on roads, increased transit ridership and increased roadway safety. Despite the benefits, e-LSA deployments are not straightforward and require proper pre-planning. Key requirements for cities looking to deploy e-LSA include the following:
• Optimizing the shuttle schedule around on-peak commuter periods and route-specific charging requirements

CUTRIC-CRITUC Low-Carbon Smart Mobility Knowledge Series No. 3 2020 Edition 1.0
80
• Maximizing the modal switch from passenger cars to transit by choosing a high-traffic first-kilometre/last-kilometre route
• Ensuring sensory systems have a safe level of latency and redundancy • Maintaining the latest industry standards and best practices of cybersecurity
The complex CAV ecosystem requires champion cities to deploy long-term applications of first-kilometre/last-kilometre e-LSAs to understand the technology and prove the feasibility of standardized multi-manufacturer systems on a given route. The broader ecosystem will need to be built out in collaboration with public and private sector entities to ensure that CAV deployments achieve the intended public benefits, while also enabling strong Canadian innovation and commercialization for CAV technologies.
CUTRIC-CRITUC Low-Carbon Smart Mobility Knowledge Series No. 3 2020 Edition 1.0
81
REFERENCES [1] Transport Canada. (2020, 20 September 2020). Canadian Motor Vehicle Traffic Collision Statistics:
2018. Available: https://tc.canada.ca/en/road-transportation/motor-vehicle-safety/canadian-motor-vehicle-traffic-collision-statistics-2018
[2] National Highway Traffic Safety Administration, "Critical Reasons for Crashes Investigated in the National Motor Vehicle Crash Causation Survey," NHTSA’s National Center for Statistics and Analysis2015, Available: https://crashstats.nhtsa.dot.gov/Api/Public/ViewPublication/812115.
[3] SAE International. (2019, September 3). SAE J3016 Levels of Driving Automation. Available: https://www.sae.org/news/2019/01/sae-updates-j3016-automated-driving-graphic
[4] R. Thakur, "Infrared Sensors for Autonomous Vehicles," Recent Development in Optoelectronic Devices, R. Srivastava, Ed., 2017. [Online]. Available: https://www.intechopen.com/books/recent-development-in-optoelectronic-devices/infrared-sensors-for-autonomous-vehicles.
[5] NHTSA. (2014, September 14). Vehicle-to-Vehicle Communications: Readiness of V2V Technology for Application. Available: https://www.nhtsa.gov/sites/nhtsa.dot.gov/files/readiness-of-v2v-technology-for-application-812014.pdf
[6] ITS Canada, "Connected Vehicles Technology," ed. YouTube, 2019.
[7] Center for Advanced Automotive Technology. (September 18). Connected and Automated Vehicles. Available: http://autocaat.org/Technologies/Automated_and_Connected_Vehicles/
[8] USDOT. (September 18). Vehicle to Pedestrian Communications. Available: https://sharedusemobilitycenter.org/wp-content/uploads/2016/10/Reference-Guide-Editsweb-version-10.24.2016.pdf
[9] K. Shaver. (2019, September 13). City planners eye self-driving vehicles to correct mistakes of the 20th-century auto. Available: https://www.washingtonpost.com/transportation/2019/07/20/city-planners-eye-self-driving-vehicles-correct-mistakes-th-century-auto/?noredirect=on
[10] T. Yaropud, J. Gilmore, and S. LaRochelle-Côté. (2019, September 4). Results from the 2016 Census: Long commutes to work by car. Available: https://www150.statcan.gc.ca/n1/pub/75-006-x/2019001/article/00002-eng.htm
[11] HDR Corporation, "Costs of Road Congestion in the Greater Toronto and Hamilton Area; Impact and Cost-Benefit Analysis of the Metrolinx Draft Regional Transportation Plan," Metrolinx2008, Available: http://www.metrolinx.com/en/regionalplanning/costsofcongestion/ISP_08-015_Cost_of_Congestion_report_1128081.pdf.
[12] Transport Canada. (2019, September 3). Canadian Motor Vehicle Traffic Collision Statistics: 2017. Available: https://www.tc.gc.ca/eng/motorvehiclesafety/canadian-motor-vehicle-traffic-collision-statistics-2017.html
[13] The Globe and Mail. (2019, October 4). Can smart mobility solutions answer transit’s first/last mile challenge? Available: https://www.theglobeandmail.com/business/adv/article-can-smart-mobility-solutions-answer-transits-firstlast-mile/

CUTRIC-CRITUC Low-Carbon Smart Mobility Knowledge Series No. 3 2020 Edition 1.0
82
[14] J. d. D. Ortúzar and L. G. Willumsen, Modelling Transport, Fourth ed.: John Wiley & Sons, Ltd, 2011. [Online]. Available: https://onlinelibrary.wiley.com/doi/book/10.1002/9781119993308. Accessed on May 14, 2019.
[15] M. Ben-Akiva and S. R. Lerman, Discrete Choice Analysis: Theory and Application to Travel Demand, 2018. [Online]. Available: https://mitpress.mit.edu/books/discrete-choice-analysis.
[16] C. Williams and J. Khim. (2019, December 24). Utility Functions. Available: https://brilliant.org/wiki/utility-functions/
[17] Y.-C. Chiu et al., "Dynamic Traffic Assignment: A Primer," Transportation Research Board, Transportation Research Circular E-C1532011, Available: https://onlinepubs.trb.org/onlinepubs/circulars/ec153.pdf.
[18] A. M. Hezaveh, C. Brakewood, and C. R. Cherry, "Exploring the effect of autonomous vehicles on transit ridership," presented at the Transportation Research Board 98th Annual Meeting, Washington, DC, USA, 2019. Available: https://www.researchgate.net/publication/328979918_Exploring_the_effect_of_autonomous_vehicles_on_transit_ridership
[19] E. J. Miller, A. Shalaby, E. Diab, and D. Kasraian, "Canadian Transit Ridership Trends Study," University of Toronto, Faculty of Applied Science & Engineering, Transportation Research Institute2018, Available: http://cutaactu.ca/sites/default/files/cuta_ridership_report_final_october_2018_en.pdf.
[20] T. Litman, "Autonomous Vehicle Implementation Predictions - Implications for Transport Planning," Victoria Transport Policy Institute2019, Available: https://www.vtpi.org/avip.pdf.
[21] USDOT. (2017, January 14). Shared Mobility Definitions. Available: https://www.transit.dot.gov/regulations-and-guidance/shared-mobility-definitions
[22] S. Canada. (2016, 2019-06-17). Census Profile, 2016 Census: York Region Municipality. Available: https://www12.statcan.gc.ca/census-recensement/2016/dp-pd/prof/details/page.cfm?Lang=E&Geo1=CD&Code1=3519&Geo2=PR&Code2=35&Data=Count&SearchText=York&SearchType=Begins&SearchPR=01&B1=All&GeoLevel=PR&GeoCode=3519&TABID=1
[23] W. P. Review. (2019, June 17). Brampton Population 2019. Available: http://worldpopulationreview.com/world-cities/brampton-population/
[24] S. Canada. (2016, 2019-06-17). Census Profile, 2016 Census: Trois Rivieres. Available: https://www12.statcan.gc.ca/census-recensement/2016/dp-pd/prof/details/page.cfm?Lang=E&Geo1=POPC&Code1=0953&Geo2=PR&Code2=24&Data=Count&SearchText=Trois-
[25] T. R. M. o. York. (2015, June 17). 2015 Transportation Fact Book. Available: https://www.york.ca/wps/wcm/connect/yorkpublic/520a6d51-bfcd-460d-befa-bad562f89aca/2015+Transportation+Fact+Book+Accessible.pdf?MOD=AJPERES
[26] Statistics Canada. (2016, June 15). Data tables, 2016 Census. Available: https://www12.statcan.gc.ca/census-recensement/2016/dp-pd/dt-td/Rp-eng.cfm?TABID=4&LANG=E&A=R&APATH=3&DETAIL=0&DIM=0&FL=A&FREE=0&GC=3521010
CUTRIC-CRITUC Low-Carbon Smart Mobility Knowledge Series No. 3 2020 Edition 1.0
83
&GL=-1&GID=1259722&GK=3&GRP=1&O=D&PID=110716&PRID=10&PTYPE=109445&S=0&SHOWALL=0&SUB=0&Temporal=2017&THEME=125&VID=0&VNAMEE=&VNAMEF=&D1=0&D2=0&D3=0&D4=0&D5=0&D6=0
[27] CSA Group. (2018). Driving Connected and Automated Vehicle Technology Forward through Standardization. Available: https://www.csagroup.org/article/driving-connected-automated-vehicle-technology-forward-standardization/?utm_referrer=https%3A%2F%2Fwww.google.com%2F
[28] CSA Group, "Connected and Automated Vehicle Technologies – Insights for Codes and Standards in Canada," CSA Group,2020, Available: https://www.csagroup.org/article/research/connected-and-automated-vehicle-technologies-insights-for-codes-and-standards-in-canada/.
[29] ESCRYPT. (January 14). About Us. Available: https://www.escrypt.com/en/about-us
[30] Transport Canada. (219, September 30). Transport Canada awards contract to ESCRYPT to enhance the privacy and security of connected vehicles. Available: https://www.canada.ca/en/transport-canada/news/2019/03/transport-canada-awards-contract-to-escrypt-to-enhance-the-privacy-and-security-of-connected-vehicles.html
[31] (2018). Security Credential Management System (SCMS) Proof of Concept (POC). Available: https://www.its.dot.gov/resources/scms.htm
[32] OmniAir Consortium. (2018, May 15). OmniAir Services. Available: https://omniair.org/services/
[33] IEEE Standards Association. (2010, May 24). IEEE 802.11p-2010 - IEEE Standard for Information technology-- Local and metropolitan area networks-- Specific requirements-- Part 11: Wireless LAN Medium Access Control (MAC) and Physical Layer (PHY) Specifications Amendment 6: Wireless Access in Vehicular Environments. Available: https://standards.ieee.org/standard/802_11p-2010.html
[34] IEEE Standards Association. (2019, September 14). IEEE 1609.2b-2019 - IEEE Standard for Wireless Access in Vehicular Environments--Security Services for Applications and Management Messages - Amendment 2-PDU Functional Types and Encryption Key Management. Available: https://standards.ieee.org/standard/1609_2b-2019.html
[35] IEEE Standards Association, "IEEE 1609.3-2016 - IEEE Standard for Wireless Access in Vehicular Environments (WAVE) -- Networking Services," 2016.
[36] IEEE Standards Association, "IEEE 1609.4-2016 - IEEE Standard for Wireless Access in Vehicular Environments (WAVE) -- Multi-Channel Operation," 2016.
[37] SAE International. (2020, September 14). On-Board System Requirements for V2V Safety Communications J2945/1_202004. Available: https://www.sae.org/standards/content/j2945/1_202004/
[38] OmniAir Consortium. (2018, May 24). Certified Product Catalog. Available: https://omniair.org/certified-products/?keyword=&category=107,117&brands=&sort=asc
[39] U.S. Department of Transportation, "Automated Vehicles 3.0 - Preparing for the Future of Transportation," 2018, Available: https://www.transportation.gov/sites/dot.gov/files/docs/policy-initiatives/automated-vehicles/320711/preparing-future-transportation-automated-vehicle-30.pdf.

CUTRIC-CRITUC Low-Carbon Smart Mobility Knowledge Series No. 3 2020 Edition 1.0
84
[40] M. Khader and S. Cherian, "An Introduction to Automotive LIDAR," Accessed on: May 15, 2019Available: http://www.ti.com/lit/wp/slyy150/slyy150.pdf
[41] LiDAR UK. (2019, May 15). How does LiDAR work? Available: http://www.lidar-uk.com/how-lidar-works/
[42] Velodyne Lidar. (2018, May 15). How LiDAR Technology Enables Autonomous Cars to Operate Safely. Available: https://velodynelidar.com/newsroom/how-lidar-technology-enables-autonomous-cars-to-operate-safely/
[43] A. Saxena. (2018, May 15). How LIDAR Based ADAS Works for Autonomous Vehicles. Available: https://www.einfochips.com/blog/how-lidar-based-adas-work-for-autonomous-vehicles/
[44] T. B. Lee. (2019, May 15). How 10 leading companies are trying to make powerful, low-cost lidar. Available: https://arstechnica.com/cars/2019/02/the-ars-technica-guide-to-the-lidar-industry/
[45] J. Quinn. (2017, May 15). Cameras: The Eyes of Autonomous Vehicles. Available: https://sites.tufts.edu/jquinn/2017/10/10/cameras-the-eyes-of-autonomous-vehicles/
[46] P. Pickering. (2017, May 15). The Radar Technology Behind Autonomous Vehicles. Available: https://www.ecnmag.com/article/2017/12/radar-technology-behind-autonomous-vehicles
[47] Integrated Publishing Inc. (2019, December 24). Factors Affecting Radar Performance. Available: http://electronicstechnician.tpub.com/14089/css/Factors-Affecting-Radar-Performance-14.htm
[48] Technavio Research. (2016, May 15). Technavio Announces Top Five Vendors in the Global Radar Systems and Technology Market. Available: https://www.businesswire.com/news/home/20160406005037/en/Technavio-Announces-Top-Vendors-Global-Radar-Systems
[49] NXP. (2018, May 15). RADAR, camera, LiDAR and V2X for autonomous cars. Available: https://blog.nxp.com/automotive/radar-camera-and-lidar-for-autonomous-cars
[50] P. Pickering. (2017, May 15). Radar and Ultrasonic Sensors Strengthen ADAS Object Detection. Available: https://www.electronicdesign.com/automotive/radar-and-ultrasonic-sensors-strengthen-adas-object-detection
[51] BOSCH, "Ultrasonic-based driver assistance systems," ed. BOSCH Mobility Solutions, 2018.
[52] Banner Engineering. (2019, December 24). Ultrasonic Sensors 101: Answers to Frequently Asked Questions. Available: https://www.bannerengineering.com/in/en/company/expert-insights/ultrasonic-sensors-101.html#
[53] D. Morris. (2017, January 14). Driverless Cars Will Be Part of a $7 Trillion Market by 2050. Available: https://fortune.com/2017/06/03/autonomous-vehicles-market/
[54] A. Greenberg, "Hackers remotely kill a jeep on the highway—With me in it," Wired, vol. 7, p. 21, 2015.
[55] D. Jiang, V. Taliwal, A. Meier, W. Holfelder, and R. Herrtwich, "Design of 5.9 GHz DSRC-based vehicular safety communication," IEEE Wireless Communications, vol. 13, no. 5, pp. 36-43, 2006.
[56] Y. L. Morgan, "Notes on DSRC & WAVE standards suite: Its architecture, design, and characteristics," IEEE Communications Surveys & Tutorials, vol. 12, no. 4, pp. 504-518, 2010.

CUTRIC-CRITUC Low-Carbon Smart Mobility Knowledge Series No. 3 2020 Edition 1.0
85
[57] M. N. Mejri, J. Ben-Othman, and M. Hamdi, "Survey on VANET security challenges and possible cryptographic solutions," Vehicular Communications, vol. 1, no. 2, pp. 53-66, 2014.
[58] G. Samara, W. A. Al-Salihy, and R. Sures, "Security issues and challenges of vehicular ad hoc networks (VANET)," in 4th International Conference on New Trends in Information Science and Service Science, 2010, pp. 393-398: IEEE.
[59] R. G. Engoulou, M. Bellaïche, S. Pierre, and A. Quintero, "VANET security surveys," Computer Communications, vol. 44, pp. 1-13, 2014.
[60] K. D. Thilak and A. Amuthan, "DoS attack on VANET routing and possible defending solutions-A survey," in 2016 International Conference on Information Communication and Embedded Systems (ICICES), 2016, pp. 1-7: IEEE.
[61] S. Chen, J. Hu, Y. Shi, and L. Zhao, "LTE-V: A TD-LTE-based V2X solution for future vehicular network," IEEE Internet of Things journal, vol. 3, no. 6, pp. 997-1005, 2016.
[62] I. Aad, J.-P. Hubaux, and E. W. Knightly, "Impact of denial of service attacks on ad hoc networks," IEEE/ACM transactions on networking, vol. 16, no. 4, pp. 791-802, 2008.
[63] H. Hasbullah, I. Ahmed Soomro, and J.-l. Ab Manan, "Denial of service (DOS) attack and its possible solutions in VANET," World Academy of Science, Engineering and Technology (WASET), vol. 65, pp. 411-415, 2010.
[64] A. M. Malla and R. K. Sahu, "Security attacks with an effective solution for dos attacks in VANET," International Journal of Computer Applications, vol. 66, no. 22, 2013.
[65] S. RoselinMary, M. Maheshwari, and M. Thamaraiselvan, "Early detection of DOS attacks in VANET using Attacked Packet Detection Algorithm (APDA)," in 2013 international conference on information communication and embedded systems (ICICES), 2013, pp. 237-240: IEEE.
[66] U. D. Gandhi and R. Keerthana, "Request response detection algorithm for detecting DoS attack in VANET," in 2014 International Conference on Reliability Optimization and Information Technology (ICROIT), 2014, pp. 192-194: IEEE.
[67] A. Singh and P. Sharma, "A novel mechanism for detecting DOS attack in VANET using enhanced attacked packet detection algorithm (EAPDA)," in 2015 2nd International Conference on Recent Advances in Engineering & Computational Sciences (RAECS), 2015, pp. 1-5: IEEE.
[68] S. Malebary, W. Xu, and C.-T. Huang, "Jamming mobility in 802.11 p networks: Modeling, evaluation, and detection," in 2016 IEEE 35th International Performance Computing and Communications Conference (IPCCC), 2016, pp. 1-7: IEEE.
[69] N. Lyamin, A. Vinel, M. Jonsson, and J. Loo, "Real-time detection of denial-of-service attacks in IEEE 802.11 p vehicular networks," IEEE Communications letters, vol. 18, no. 1, pp. 110-113, 2013.
[70] A. Wasef, R. Lu, X. Lin, and X. Shen, "Complementing public key infrastructure to secure vehicular ad hoc networks [security and privacy in emerging wireless networks]," IEEE Wireless Communications, vol. 17, no. 5, pp. 22-28, 2010.

CUTRIC-CRITUC Low-Carbon Smart Mobility Knowledge Series No. 3 2020 Edition 1.0
86
[71] B. Pooja, M. M. Pai, R. M. Pai, N. Ajam, and J. Mouzna, "Mitigation of insider and outsider DoS attack against signature based authentication in VANETs," in 2014 Asia-Pacific Conference on Computer Aided System Engineering (APCASE), 2014, pp. 152-157: IEEE.
[72] L. He and W. T. Zhu, "Mitigating DoS attacks against signature-based authentication in VANETs," in 2012 IEEE International Conference on Computer Science and Automation Engineering (CSAE), 2012, vol. 3, pp. 261-265: IEEE.
[73] H. Alturkostani and A. Krings, "The impact of jamming on threshold-based agreement in VANET," in 2014 International Conference on Connected Vehicles and Expo (ICCVE), 2014, pp. 882-887: IEEE.
[74] M. S. Mohamed, S. Hussein, and A. Krings, "An enhanced voting algorithm for hybrid jamming attacks in VANET," in 2017 IEEE 7th Annual Computing and Communication Workshop and Conference (CCWC), 2017, pp. 1-7: IEEE.
[75] J. Grover, M. S. Gaur, V. Laxmi, and N. K. Prajapati, "A sybil attack detection approach using neighboring vehicles in VANET," in Proceedings of the 4th international conference on Security of information and networks, 2011, pp. 151-158: ACM.
[76] J. Pougajendy and A. R. K. Parthiban, "CDAI: a novel collaborative detection approach for impersonation attacks in vehicular ad‐hoc networks," Security and Communication Networks, vol. 9, no. 18, pp. 5547-5562, 2016.
[77] S. S. Chhatwal and M. Sharma, "Detection of impersonation attack in VANETs using BUCK Filter and VANET Content Fragile Watermarking (VCFW)," in 2015 International Conference on Computer Communication and Informatics (ICCCI), 2015, pp. 1-5: IEEE.
[78] A. K. Malhi and S. Batra, "Genetic‐based framework for prevention of masquerade and DDoS attacks in vehicular ad‐hocnetworks," Security and Communication Networks, vol. 9, no. 15, pp. 2612-2626, 2016.
[79] T. Shang and L. Y. Gui, "Identification and prevention of impersonation attack based on a new flag byte," in 2015 4th International Conference on Computer Science and Network Technology (ICCSNT), 2015, vol. 1, pp. 972-976: IEEE.
[80] K. Sanzgiri, B. Dahilly, B. N. Leviney, C. Shields, and E. M. Belding-Royer, "A Secure Routing Protocol for Ad Hoc Networks," Proc. 10th IEEE International Conference on Network Protocols, pp. pp. 78 – 87, 2002.
[81] A. K. Sharma, S. K. Saroj, S. K. Chauhan, and S. K. Saini, "Sybil attack prevention and detection in vehicular ad hoc network," in 2016 International Conference on Computing, Communication and Automation (ICCCA), 2016, pp. 594-599: IEEE.
[82] S. Park, B. Aslam, D. Turgut, and C. C. Zou, "Defense against sybil attack in vehicular ad hoc network based on roadside unit support," in MILCOM 2009-2009 IEEE Military Communications Conference, 2009, pp. 1-7: IEEE.
[83] S. Park, B. Aslam, D. Turgut, and C. C. Zou, "Defense against Sybil attack in the initial deployment stage of vehicular ad hoc network based on roadside unit support," Security and Communication Networks, vol. 6, no. 4, pp. 523-538, 2013.
CUTRIC-CRITUC Low-Carbon Smart Mobility Knowledge Series No. 3 2020 Edition 1.0
87
[84] P. V. Kumar and M. Maheshwari, "Prevention of Sybil attack and priority batch verification in VANETs," in International Conference on Information Communication and Embedded Systems (ICICES2014), 2014, pp. 1-5: IEEE.
[85] J. Grover, D. Kumar, M. Sargurunathan, M. S. Gaur, and V. Laxmi, "Performance evaluation and detection of sybil attacks in vehicular Ad-Hoc networks," in International Conference on Network Security and Applications, 2010, pp. 473-482: Springer.
[86] B. Triki, S. Rekhis, M. Chammem, and N. Boudriga, "A privacy preserving solution for the protection against sybil attacks in vehicular ad hoc networks," in 6th Joint IFIP Wireless and Mobile Networking Conference (WMNC), 2013, pp. 1-8: IEEE.
[87] X. Feng, C.-y. Li, D.-x. Chen, and J. Tang, "A method for defensing against multi-source Sybil attacks in VANET," Peer-to-Peer Networking and Applications, vol. 10, no. 2, pp. 305-314, 2017.
[88] B. Parno and A. Perrig, "Challenges in securing vehicular networks," in Workshop on hot topics in networks (HotNets-IV), 2005, pp. 1-6: Maryland, USA.
[89] C. Garrigues, N. Migas, W. Buchanan, S. Robles, and J. Borrell, "Protecting mobile agents from external replay attacks," Journal of Systems and Software, vol. 82, no. 2, pp. 197-206, 2009.
[90] E. Hamida, H. Noura, and W. Znaidi, "Security of cooperative intelligent transport systems: Standards, threats analysis and cryptographic countermeasures," Electronics, vol. 4, no. 3, pp. 380-423, 2015.
[91] M.-C. Chuang and J.-F. Lee, "TEAM: Trust-extended authentication mechanism for vehicular ad hoc networks," IEEE systems journal, vol. 8, no. 3, pp. 749-758, 2013.
[92] M. Rouse. (2019, December 20). Cryptographic nonce. Available: https://searchsecurity.techtarget.com/definition/nonce
[93] W.-C. Wu and Y.-M. Chen, "Improving the authentication scheme and access control protocol for vanets," Entropy, vol. 16, no. 11, pp. 6152-6165, 2014.
[94] M. Mambo, K. Usuda, and E. Okamoto, "Proxy signatures for delegating signing operation," in Proceedings of the 3rd ACM conference on Computer and communications security, 1996, pp. 48-57: ACM.
[95] S. Biswas and J. Mišić, "Establishing trust on VANET safety messages," in International Conference on Ad Hoc Networks, 2010, pp. 314-327: Springer.
[96] S. Biswas, "Establishing security and privacy in WAVE-enabled vehicular ad hoc networks," 2013.
[97] B. Anouar, B. Mohammed, G. Abderrahim, and B. Mohammed, "Vehicular navigation spoofing detection based on V2I calibration," in 2016 4th IEEE International Colloquium on Information Science and Technology (CiSt), 2016, pp. 847-849: IEEE.
[98] S. Bittl, A. A. Gonzalez, M. Myrtus, H. Beckmann, S. Sailer, and B. Eissfeller, "Emerging attacks on VANET security based on GPS Time Spoofing," in 2015 IEEE Conference on Communications and Network Security (CNS), 2015, pp. 344-352: IEEE.

CUTRIC-CRITUC Low-Carbon Smart Mobility Knowledge Series No. 3 2020 Edition 1.0
88
[99] A. Patcha and A. Mishra, "Collaborative security architecture for black hole attack prevention in mobile ad hoc networks," in Radio and Wireless Conference, 2003. RAWCON'03. Proceedings, 2003, pp. 75-78: IEEE.
[100] R. Baiad, O. Alhussein, H. Otrok, and S. Muhaidat, "Novel cross layer detection schemes to detect blackhole attack against QoS-OLSR protocol in VANET," Vehicular Communications, vol. 5, pp. 9-17, 2016.
[101] J. Cai, P. Yi, J. Chen, Z. Wang, and N. Liu, "An adaptive approach to detecting black and gray hole attacks in ad hoc network," in 2010 24th IEEE International Conference on Advanced Information Networking and Applications, 2010, pp. 775-780: IEEE.
[102] S. Tan and K. Kim, "Secure Route Discovery for preventing black hole attacks on AODV-based MANETs," in 2013 IEEE 10th International Conference on High Performance Computing and Communications & 2013 IEEE International Conference on Embedded and Ubiquitous Computing, 2013, pp. 1159-1164: IEEE.
[103] H. Almutairi, S. Chelloug, H. Alqarni, R. Aljaber, A. Alshehri, and D. Alotaish, "A New Black Hole Detection Scheme for VANETs," in Proceedings of the 6th International Conference on Management of Emergent Digital EcoSystems, 2014, pp. 133-138: ACM.
[104] J. Kaur and T. Singh, "Trust based discovery and disposal of blackhole attack in mobile ad hoc networks," network, vol. 5, p. 6, 2015.
[105] K. N. Patel and R. H. Jhaveri, "Isolating packet dropping misbehavior in VANET using Ant Colony Optimization," International Journal of Computer Applications, vol. 120, no. 24, 2015.
[106] N. Rafique, M. A. Khan, N. A. Saqib, F. Bashir, C. Beard, and Z. Li, "Black hole prevention in vanets using trust management and fuzzy logic analyzer," International Journal of Computer Science and Information Security, vol. 14, no. 9, p. 1226, 2016.
[107] S. S. Albouq and E. M. Fredericks, "Lightweight detection and isolation of black hole attacks in connected vehicles," in 2017 IEEE 37th International Conference on Distributed Computing Systems Workshops (ICDCSW), 2017, pp. 97-104: IEEE.
[108] K. M. A. Alheeti, A. Gruebler, and K. D. McDonald-Maier, "An intrusion detection system against black hole attacks on the communication network of self-driving cars," in 2015 sixth international conference on emerging security technologies (EST), 2015, pp. 86-91: IEEE.
[109] Y.-C. Hu, A. Perrig, and D. B. Johnson, "Packet leashes: A defense against wormhole attacks in wireless ad hoc networks," in Proceedings of INFOCOM, 2003.
[110] A. Perrig, R. Canetti, J. D. Tygar, and D. Song, "Efficient authentication and signing of multicast streams over lossy channels," in IEEE Symposium on Security and Privacy,, 2000, pp. 56-73.
[111] S. M. Safi, A. Movaghar, and M. Mohammadizadeh, "A novel approach for avoiding wormhole attacks in VANET," in Second International Workshop on Computer Science and Engineering, 2009, pp. 160-165.
[112] N. Alsharif, A. Wasef, and X. Shen, "Mitigating the effects of position based routing attacks in vehicular ad hoc networks," in IEEE International Conference on Communications, 2011, pp. 1-5.

CUTRIC-CRITUC Low-Carbon Smart Mobility Knowledge Series No. 3 2020 Edition 1.0
89
[113] S. Eidie, B. Akbari, and P. Poshtiban, "WANI: wormhole avoidance using neighbor information," in 7th Conference on Information and Knowledge Technology, 2015, pp. 1-6.
[114] G. Lee, J. Seo, and D.-k. Kim, "An approach to mitigate wormhole attack in wireless ad hoc networks," in International Conference on Information Security and Assurance, 2008, pp. 220-225.
[115] H. S. Chiu and K.-S. Lui, "DelPHI: wormhole detection mechanism for ad hoc wireless networks," in 1st International Symposium on Wireless Pervasive Computing, 2006.
[116] S. Khobragade and P. Padiya, "Detection and prevention of wormhole attack based on delay per hop technique for wireless mobile ad-hoc network," in International Conference on Signal Processing, Communication, Power and Embedded System, 2016, pp. 1332-1339.
[117] H. Ghayvat, S. Pandya, S. Shah, S. Mukhopadhyay, M. Yap, and K. Wandra, "Advanced AODV approach for efficient detection and mitigation of wormhole attack in MANET," in 10th International Conference on Sensing Technology, 2016, pp. 1-6.
[118] S. Gupta, S. Kar, and S. Dharmaraja, "WHOP: wormhole attack detection protocol using hound packet," in International Conference on Innovations in Information Technology, 2011, pp. 226-231.
[119] H. Kaur, S. Batish, and A. Kakaria, "An approach to detect the wormhole attack in vehicular adhoc networks," Int. J. Smart Sens. Ad Hoc Netw, vol. 4, pp. 86-89, 2012.
[120] K. Zaidi, M. Milojevic, V. Rakocevic, and M. Rajarajan, "Data-centric rogue node detection in VANETs," in 2014 IEEE 13th International Conference on Trust, Security and Privacy in Computing and Communications, 2014, pp. 398-405: IEEE.
[121] K. Zaidi, M. B. Milojevic, V. Rakocevic, A. Nallanathan, and M. Rajarajan, "Host-based intrusion detection for vanets: a statistical approach to rogue node detection," IEEE transactions on vehicular technology, vol. 65, no. 8, pp. 6703-6714, 2015.
[122] I. A. Sumra, J.-L. Ab Manan, and H. Hasbullah, "Timing attack in vehicular network," in Proceedings of the 15th WSEAS International Conference on Computers, World Scientific and Engineering Academy and Society (WSEAS), Corfu Island, Greece, 2011, pp. 151-155.
[123] F. G. Mármol and G. M. Pérez, "TRIP, a trust and reputation infrastructure-based proposal for vehicular ad hoc networks," Journal of network and computer applications, vol. 35, no. 3, pp. 934-941, 2012.
[124] A. Wu, J. Ma, and S. Zhang, "RATE: a RSU-aided scheme for data-centric trust establishment in VANETs," in 2011 7th International Conference on Wireless Communications, Networking and Mobile Computing, 2011, pp. 1-6: IEEE.
[125] S. Ruj, M. A. Cavenaghi, Z. Huang, A. Nayak, and I. Stojmenovic, "On data-centric misbehavior detection in VANETs," in 2011 IEEE Vehicular Technology Conference (VTC Fall), 2011, pp. 1-5: IEEE.
[126] F. Sakiz and S. Sen, "A survey of attacks and detection mechanisms on intelligent transportation systems: VANETs and IoV," Ad Hoc Networks, vol. 61, pp. 33-50, 2017.

CUTRIC-CRITUC Low-Carbon Smart Mobility Knowledge Series No. 3 2020 Edition 1.0
90
[127] C. Büttner and S. A. Huss, "A novel anonymous authenticated key agreement protocol for vehicular ad hoc networks," in 2015 International Conference on Information Systems Security and Privacy (ICISSP), 2015, pp. 259-269: IEEE.
[128] R. L. Rivest, A. Shamir, and Y. Tauman, "How to leak a secret," in International Conference on the Theory and Application of Cryptology and Information Security, 2001, pp. 552-565: Springer.
[129] C. Büttner, F. Bartels, and S. A. Huss, "Real-world evaluation of an anonymous authenticated key agreement protocol for vehicular ad-hoc networks," in 2015 IEEE 11th International Conference on Wireless and Mobile Computing, Networking and Communications (WiMob), 2015, pp. 651-658: IEEE.
[130] P. Kamat, A. Baliga, and W. Trappe, "An identity-based security framework for VANETs," in Proceedings of the 3rd international workshop on Vehicular ad hoc networks, 2006, pp. 94-95: ACM.
[131] R. J. Hwang, Y.-K. Hsiao, and Y.-F. Liu, "Secure communication scheme of VANET with privacy preserving," in 2011 IEEE 17th International Conference on Parallel and Distributed Systems, 2011, pp. 654-659: IEEE.
[132] A. Al-Fuqaha and O. Al-Ibrahim, "Geo-encryption protocol for mobile networks," Computer Communications, vol. 30, no. 11-12, pp. 2510-2517, 2007.
[133] G. Yan and S. Olariu, "An efficient geographic location-based security mechanism for vehicular ad hoc networks," in 2009 IEEE 6th International Conference on Mobile Adhoc and Sensor Systems, 2009, pp. 804-809: IEEE.
[134] A. Malik and B. Panday, "Performance analysis of enhanced authentication scheme using re-key in VANET," in 2016 6th International Conference-Cloud System and Big Data Engineering (Confluence), 2016, pp. 591-596: IEEE.
[135] L. Feng, Y. Xiu-Ping, and W. Jie, "Security transmission routing protocol for MIMO-VANET," in Proceedings of 2014 International Conference on Cloud Computing and Internet of Things, 2014, pp. 152-156: IEEE.
[136] L. Sweeney, "k-anonymity: A model for protecting privacy," International Journal of Uncertainty, Fuzziness and Knowledge-Based Systems, vol. 10, no. 05, pp. 557-570, 2002.
[137] X. Zhu, D. Hu, Z. Hou, and L. Ding, "A location privacy preserving solution to resist passive and active attacks in VANET," China Communications, vol. 11, no. 9, pp. 60-67, 2014.
[138] G. P. Corser, H. Fu, and A. Banihani, "Evaluating location privacy in vehicular communications and applications," IEEE transactions on intelligent transportation systems, vol. 17, no. 9, pp. 2658-2667, 2016.
[139] A. R. Beresford and F. Stajano, "Location privacy in pervasive computing," IEEE Pervasive computing, no. 1, pp. 46-55, 2003.
[140] A. M. Carianha, L. P. Barreto, and G. Lima, "Improving location privacy in mix-zones for VANETs," in 30th IEEE International Performance Computing and Communications Conference, 2011, pp. 1-6: IEEE.

CUTRIC-CRITUC Low-Carbon Smart Mobility Knowledge Series No. 3 2020 Edition 1.0
91
[141] L. Huang, K. Matsuura, H. Yamane, and K. Sezaki, "Enhancing wireless location privacy using silent period," in IEEE Wireless Communications and Networking Conference, 2005, 2005, vol. 2, pp. 1187-1192: IEEE.
[142] K. Sampigethaya, M. Li, L. Huang, and R. Poovendran, "AMOEBA: Robust location privacy scheme for VANET," IEEE Journal on Selected Areas in Communications, vol. 25, no. 8, pp. 1569-1589, 2007.
[143] J. Freudiger, M. Raya, M. Félegyházi, P. Papadimitratos, and J.-P. Hubaux, "Mix-zones for location privacy in vehicular networks," in ACM Workshop on Wireless Networking for Intelligent Transportation Systems (WiN-ITS), 2007, no. CONF.
[144] Y. Sun, X. Su, B. Zhao, and J. Su, "Mix-zones deployment for location privacy preservation in vehicular communications," in 2010 10th IEEE International Conference on Computer and Information Technology, 2010, pp. 2825-2830: IEEE.
[145] Y. Shoukry, P. Martin, Y. Yona, S. Diggavi, and M. Srivastava, "Pycra: Physical challenge-response authentication for active sensors under spoofing attacks," in Proceedings of the 22nd ACM SIGSAC Conference on Computer and Communications Security, 2015, pp. 1004-1015: ACM.
[146] R. G. Dutta et al., "Estimation of safe sensor measurements of autonomous system under attack," in Proceedings of the 54th Annual Design Automation Conference 2017, 2017, p. 46: ACM.
[147] P. Kapoor, A. Vora, and K.-D. Kang, "Detecting and Mitigating Spoofing Attack Against an Automotive Radar," in 2018 IEEE 88th Vehicular Technology Conference (VTC-Fall), 2018, pp. 1-6: IEEE.
[148] D. Dolgov, S. Thrun, M. Montemerlo, and J. Diebel, "Path planning for autonomous vehicles in unknown semi-structured environments," The International Journal of Robotics Research, vol. 29, no. 5, pp. 485-501, 2010.
[149] R. Verdult et al., "Dismantling megamos crypto: Wirelessly lockpicking a vehicle immobilizer," in 22nd Security Symposium (Security 13), 2013, pp. 687-702.
[150] J. J. Haas, Y.-C. Hu, and K. P. Laberteaux, "Design and analysis of a lightweight certificate revocation mechanism for VANET," in Proceedings of the sixth ACM international workshop on VehiculAr InterNETworking, 2009, pp. 89-98: ACM.
[151] M. Raya and J.-P. Hubaux, "Securing vehicular ad hoc networks," Journal of computer security, vol. 15, no. 1, pp. 39-68, 2007.
[152] G. Samara, S. Ramadas, and W. A. Al-Salihy, "Design of simple and efficient revocation list distribution in urban areas for vanet's," arXiv preprint arXiv:1006.5113, 2010.
[153] S. A. Soleymani et al., "A secure trust model based on fuzzy logic in vehicular ad hoc networks with fog computing," IEEE Access, vol. 5, pp. 15619-15629, 2017.
[154] I. A. Sumra and H. B. Hasbullah, "Using TPM to ensure security, trust and privacy (STP) in VANET," in 2015 5th National Symposium on Information Technology: Towards New Smart World (NSITNSW), 2015, pp. 1-6: IEEE.

CUTRIC-CRITUC Low-Carbon Smart Mobility Knowledge Series No. 3 2020 Edition 1.0
92
[155] W. Li and H. Song, "ART: An attack-resistant trust management scheme for securing vehicular ad hoc networks," IEEE transactions on intelligent transportation systems, vol. 17, no. 4, pp. 960-969, 2015.
[156] T. Zhang, H. Antunes, and S. Aggarwal, "Defending connected vehicles against malware: Challenges and a solution framework," IEEE Internet of Things journal, vol. 1, no. 1, pp. 10-21, 2014.
[157] S. Mallissery, M. M. Pai, R. M. Pai, and A. Smitha, "Cloud enabled secure communication in Vehicular Ad-hoc Networks," in 2014 International Conference on Connected Vehicles and Expo (ICCVE), 2014, pp. 596-601: IEEE.
[158] I. Ku, Y. Lu, M. Gerla, R. L. Gomes, F. Ongaro, and E. Cerqueira, "Towards software-defined VANET: Architecture and services," in Med-Hoc-Net, 2014, pp. 103-110.
[159] H. Li, M. Dong, and K. Ota, "Control plane optimization in software-defined vehicular ad hoc networks," IEEE Transactions on Vehicular Technology, vol. 65, no. 10, pp. 7895-7904, 2016.
[160] A. Hussein, I. H. Elhajj, A. Chehab, and A. Kayssi, "SDN VANETs in 5G: An architecture for resilient security services," in 2017 Fourth International Conference on Software Defined Systems (SDS), 2017, pp. 67-74: IEEE.
[161] International Organization for Standardization. (2018, May 14). ISO 26262-1:2018(en): Road vehicles — Functional safety — Part 1: Vocabulary. Available: https://www.iso.org/obp/ui/#iso:std:iso:26262:-1:ed-2:v1:en
[162] British Standards Institution. (2018, June 15). PAS 1885:2018: The fundamental principles of automotive cyber security. Available: https://shop.bsigroup.com/ProductDetail/?pid=000000000030365446&_ga=2.267667464.704902458.1545217114-2008390051.1545217114
[163] UK Department for Transport. (2017, June 15). The key principles of vehicle cyber security for connected and automated vehicles. Available: https://www.gov.uk/government/publications/principles-of-cyber-security-for-connected-and-automated-vehicles/the-key-principles-of-vehicle-cyber-security-for-connected-and-automated-vehicles