royal insititute of technology worldwide campus...
TRANSCRIPT

ROYAL INSITITUTE OF TECHNOLOGY WORLDWIDE CAMPUS
(Addis Ababa University, Ethiopia)
Project title:
Feasibility Study on Mini‐hydroelectric Power
Plant for Rural Electrification
MSc. Thesis
By: Girum Teferi Tessema
(Department of Energy Technology
KTH student ID-No. 821210-A375)

i
MasterofScienceThesisEGI2010:MJ211X
Title
Feasibility Study on Mini-hydroelectric Power
Plant for Rural Electrification
Girum Teferi Tessema
Student ID-No. 821210-A375
Approved
Date
Examiner
Name
Supervisor
Name
Commissioner
Contactperson

ii
ACKNOWLEDGMENT
I would like to give Glory to God and the Virgin Mary without which the completion of this
thesis would have been unthinkable. Next, I would like to express my deepest gratitude to
my advisor, Jens EA. Fridh for his expert guidance, constructive comments, suggestion and
encouragement without which this work could have not been completed. He has been a
constant source of inspiration during my study period. I am also grateful to Dr. Ing.
Abebayehu Assefa for his kind helps on different ideas and materials.
Lastly, to my wife Tsigereda Teka for her patience and stood always by my side.

iii
TABLE OF CONTIENT
ACKNOWLEDGMENT .................................................................................................................................................... ii
LIST OF TABLES ........................................................................................................................................................... viii
LIST OF FIGURES .......................................................................................................................................................... ix
Figure 2.1 Average annual water surplus regions in Ethiopia [1]…………….……...........…. ............................... ix
Figure 2.2 Scheme lay out with high head………………….………....…………….…………. ................................ ix
NOMENCLATURE ........................................................................................................................................................... x
LIST OF ABBREVIATIONS AND ACRONYMS ........................................................................................................ xiii
ABSTRACT ......................................................................................................................................................................... xiv
CHAPTER ONE ............................................................................................................................................................... 1
INTRODUCTION .............................................................................................................................................................. 1
1.1 Problem Statement ............................................................................................................................................... 1
1.2 Objective ................................................................................................................................................................ 1
1.3 Method of attack .................................................................................................................................................... 1
1.4 Outline of the Report ............................................................................................................................................ 2
CHAPTER 2 .......................................................................................................................................................................... 3
LITERATURE REVIEW ........................................................................................................................................................... 3
2.1 Rural electrification In Ethiopia ........................................................................................................................... 3
2.1.1 Resource ........................................................................................................................................................ 3
2.1.2 Mini-Hydro Resources and Existing Experience in Ethiopia ................................................................... 4
2.2 Hydro Power Basics: ................................................................................................................................................. 6
2.2.1 Head and Flow ............................................................................................................................................... 7
2.2.2 Scheme layout and Available Head............................................................................................................ 8
2.2.3 Hydrology Flow Rate ................................................................................................................................... 11
iv
2.2.4 Power Output ............................................................................................................................................... 12
2.2.5 Efficiency ...................................................................................................................................................... 13
2.2.6 Energy Yield ................................................................................................................................................. 16
CHAPTER THREE ........................................................................................................................................................ 19
Hydro power Generation ............................................................................................................................................... 19
3.1 General Description about Hydro Power Generation .................................................................................... 19
3.1.1Types of Hydro Power ................................................................................................................................. 19
3.2 Basic Concepts of Mini-Hydro Power Generation .......................................................................................... 20
3.3 Scheme Components ......................................................................................................................................... 21
3.3.1 Dam and Weirs ............................................................................................................................................ 21
3.3.2 Intake structure ............................................................................................................................................ 22
3.3.3 Leats .............................................................................................................................................................. 29
3.3.4 Pipeline ......................................................................................................................................................... 32
CHAPTER FOUR ................................................................................................................................................................. 38
Electrical and Mechanical Equipment of Mini‐Hydro Power Generation .................................................................... 38
4.1 Turbine.................................................................................................................................................................. 38
4.1.1 Impulse turbine ............................................................................................................................................ 38
4.1.2 Reaction Turbine ......................................................................................................................................... 41
4.2 Electrical Equipment, Generator ....................................................................................................................... 43
4.2.1Types of Generator used in Micro Hydro Power Generation ................................................................. 43
4.3 Devices Used for Speed Increment ................................................................................................................. 44
4.3.1 Belt drive ....................................................................................................................................................... 44
4.3.2 Chain Drive ................................................................................................................................................... 45
4.3.3 Gear Box....................................................................................................................................................... 45

v
4.4 Controlling and operation units ......................................................................................................................... 45
4.4.1Automatic flow and level controller- ........................................................................................................... 45
4.4.2 Parallel and Isolated Operation ................................................................................................................. 45
CHAPTER FIVE ............................................................................................................................................................. 47
ECONOMIC ASPECT OF SMALL HYDRO SCHEME ......................................................................................... 47
5.1 Introduction .......................................................................................................................................................... 47
5.2 Scheme Components cost ................................................................................................................................ 47
5.2.1 Dewatering and diversion works ............................................................................................................... 47
5.2.2 Intake structures .......................................................................................................................................... 47
5.2.3 Automatic screen cleaning ......................................................................................................................... 47
5.2.4 Leats and tailraces ...................................................................................................................................... 47
5.2.5 Header tankers ............................................................................................................................................ 47
5.2.6 Pipelines – low and high pressure ............................................................................................................ 48
5.2.7 Turbo generators ......................................................................................................................................... 48
5.2.8 Power houses .............................................................................................................................................. 48
5.2.9 Electrical protection and switch gear ........................................................................................................ 48
5.2.10 Automatic flow/level controller ................................................................................................................. 48
5.2.11 Transformers ............................................................................................................................................. 48
5.2.12 Transmission ............................................................................................................................................. 48
5.2.13 Access road ............................................................................................................................................... 48
5.2.14 Installation and commissioning of turbo-generators ............................................................................ 48
5.2.15 Additional work bank protection and excavation .................................................................................. 49
5.2.16 Engineering Fee ....................................................................................................................................... 49
5.2.17 Contingencies ............................................................................................................................................ 49
vi
5.2.18 Operation and maintenance fee ............................................................................................................. 49
5.2 Energy Value ................................................................................................................................................. 49
5.3.1 Export scheme ............................................................................................................................................. 49
5.3.2 Isolated Scheme .......................................................................................................................................... 49
5.3.3 Parallel operated schemes ........................................................................................................................ 50
5.3 Economics .............................................................................................................................................................. 50
5.4.1 Internal Rate of Return ................................................................................................................................... 50
5.4.1 Energy Cost ................................................................................................................................................. 51
CHAPTER SIX ............................................................................................................................................................... 52
Environmental Effect of Mini Hydropower Plant ........................................................................................................ 52
6.1 Hydrological Effect .............................................................................................................................................. 52
6.2 Landscape ............................................................................................................................................................ 52
6.3 Social Effects ....................................................................................................................................................... 52
CHAPTER SEVEN ........................................................................................................................................................ 53
7.1 MARKET STUDY AND PLANT CAPACITY .................................................................................................... 53
7.2 Power Demand .................................................................................................................................................... 55
7.3 Electricity Pricing and Distribution .................................................................................................................... 56
CHAPTER EIGHT .......................................................................................................................................................... 57
POWER GENERATION SYSTEM DESIGN AND ANALYSIS ................................................................................ 57
8.1 Power Generation system ................................................................................................................................. 57
8.2 Power Generation Capacity .............................................................................................................................. 58
8.3 MATERIALS INPUTS ......................................................................................................................................... 59
8.3.1 Consumables ............................................................................................................................................... 59
8.3.2 Utilities .......................................................................................................................................................... 59

vii
8.4.1 Sizing of Cross Flow Turbine ..................................................................................................................... 60
8.4.2 Turbine Efficiency ........................................................................................................................................ 60
8.5 Sizing of penstock ............................................................................................................................................... 61
8.6 Power Available From the River ....................................................................................................................... 62
8.7 Capacity Factor ................................................................................................................................................... 63
CHAPTER NINE ............................................................................................................................................................ 64
Cost Evaluation of Mini hydropower Generation ....................................................................................................... 64
9.1 Cost of the penstock ........................................................................................................................................... 64
9.2 Turbine Cost ........................................................................................................................................................ 64
9.3 Land, Building and Civil Work ........................................................................................................................... 65
9.4 Over Head Transmission line ............................................................................................................................ 66
9.5 Installation Cost ................................................................................................................................................... 66
9.6 Financial Evolution and Analysis ...................................................................................................................... 67
9.7 Man Power and Trainings .................................................................................................................................. 69
9.7.1 Manpower Requirements ........................................................................................................................... 69
9.7.2 Training Requirement ................................................................................................................................. 69
9.8 Pay Back Period ...................................................................................................................................................... 70
CONCLUSION and RECOMMENDATION ................................................................................................................ 71
10.1 CONCLUSION .................................................................................................................................................. 71
10.2 RECOMMENDATION ...................................................................................................................................... 71
References ........................................................................................................................................................................ 72

viii
LIST OF TABLES
Table 2.1 An overview of renewable energy resource in Ethiopia………………................4
Table 2.2 Summary of technical mini hydro potential in Ethiopia per region……..............6
Table 2.3 Maximum Turbine efficiency at various rated power…………….......…............15
Table 3.1 Values of Manning’s roughness coefficient n for straight uniform Channel…..30
Table 3.2 Hydraulic radius for most coefficient leat section..............................................31
Table 3.3 Dimensions for most efficient leat section ........................................................32
Table 3.4 characteristics of commonly available pipe types.............................................33
Table 3.5 Relative Roughness..........................................................................................36
Table 7.1 electric Access coverage in southern regional state………..……………....…...54
Table7.2 Projected demands for electricity ………………..…………….…………………...55
Table 8.1 Classification hydro turbines according to head, flow rate and power output ..59
Table 9.1 cost of different components of the power plant…………………………..……...65
Table 9.2 Installation Cost..........………………………………………………………………67
Table 9.3 Manpower requirement and labour cost……………………...…………………..69

ix
LIST OF FIGURES
Figure 2.1 Average annual water surplus regions in Ethiopia [1]…………….……...........…5
Figure 2.2 Scheme lay out with high head………………….………....…………….………….8
Figure 2.3 High head with leat……………………………………………………………………9
Figure 2.4 Low head scheme…………………………..….………………………………….….9
Figure 2.5 power house Dam …………………………………..………………………………10
Figure 2.6 Flow Duration curve for values of BFI(Base Flow Index) ………..……………..13
Figure 2.7 Turbine Efficiency Curves from Manufacturer’s Data………………….…….…..14
Figure2.8 Calculation of Energy yield for Cross flow and Impulse Turbine………………..17
Figure2.9 Estimation of Net Turbine Head…………………………..……………………..…18
Figure 3.1 Layout of a typical micro hydro scheme ………………………………………....21
Figure 3.2 Simple Diversion Wall forms Intake……………………………………………….23
Figure 3.3 High Head Intake……………………………………..……………………………..24
Figure 3.4 Low Head scheme ...........................................................................................26
Figure 3.5 Head Loss through Trash Screen ....................................................................28
Figure 3.6 Trash Screen Head loss Coefficient k..............................................................28
Figure 3.7 Common leat Profile.........................................................................................31
Figure 3.8 Moody Diagram................................................................................................35
Figure 3.9 Approximate pipeline design chart...................................................................37
Figure 4.1Pelton turbine....................................................................................................39
Figure 4.2 Turgo turbine....................................................................................................40
Figure 4.3 Cross flow turbine ...........................................................................................40
Figure 4.4 Kaplan Turbine.................................................................................................41
Figure 4.5 Francis Turbine ..............................................................................................42
Figure 4.6 centrifugal pump used as a Turbine.................................................................42
Figure 5.1 Internal Rate of Return against Present Value Factor ……..…………………..51

x
Figure 8.1 power house lay-out …………………………...........……………………….……57
Figure 8.2Relative efficiency of turbines for mini hydropower generation …………....…61
Figure 8.3 Typical System efficiency of micro-hydropower generation …………….……62

xi
NOMENCLATURE
P= Electric power output (KW)
W=Specific weight of water (KN/m3)
Qi =Design Flow rate (m3/s)
H= Hydraulic Head (m)
o=Generation/ overall efficiency
Qm=annual mean flow (m3/s)
SAAR=Standard annual average rainfall for the catchment (mm)
Ea=actual evapo-transpiration (mm)
A= catchment area (km2)
T- Turbine efficiency
D- Drive efficiency
P- Pipeline efficiency
h=head loss through screen (m)
K=trash screen coefficient
t/b= ratio of bar thickness to bar spacing
g=gravitational constant (9.81 m/s2)
ø = angle of bars to the horizontal
L-Length of settling bas in (m)
Q-flow rate (m3/s)
Vo-particle settling velocity (m/minute)
W-width of chamber
v=velocity (m/s)
R=Area (m2)/wetted perimeter, hydraulic radius
S=slop of the leat
n=Manning’s coefficent

xii
V=velocity (m/s)
F=frequency
N=rotational speed (revs/sec)
P= number of pairs of poles
hf=head loss in m
f=friction factor
L=Pipeline length in m
v=flow velocity in m/s
D=pipe diameter in m

xiii
LIST OF ABBREVIATIONS AND ACRONYMS
FDC-Flow Duration Curve
FDVB –fixed distributor variable blade
GRP-Glass Reinforced Plastic
ICS-Inter-Connected System
EEPCO- Ethiopia Electric Power Corporation
BFI-base flow index
xiv
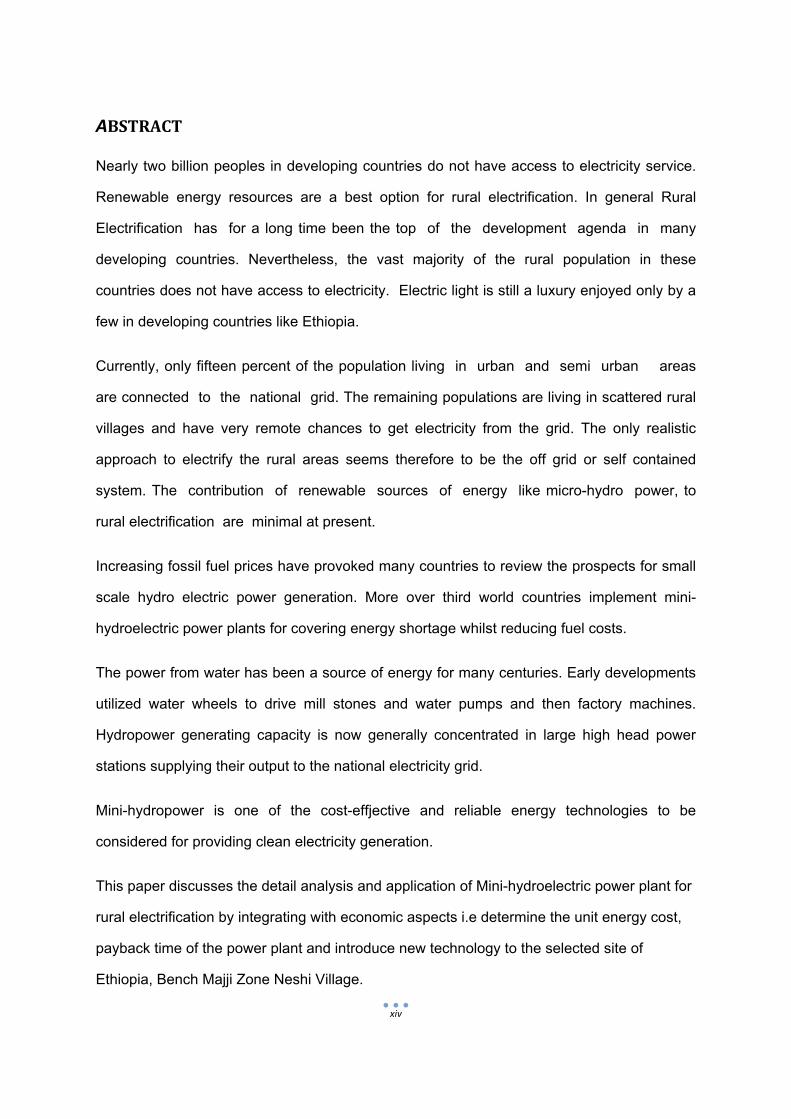
ABSTRACT
Nearly two billion peoples in developing countries do not have access to electricity service.
Renewable energy resources are a best option for rural electrification. In general Rural
Electrification has for a long time been the top of the development agenda in many
developing countries. Nevertheless, the vast majority of the rural population in these
countries does not have access to electricity. Electric light is still a luxury enjoyed only by a
few in developing countries like Ethiopia.
Currently, only fifteen percent of the population living in urban and semi urban areas
are connected to the national grid. The remaining populations are living in scattered rural
villages and have very remote chances to get electricity from the grid. The only realistic
approach to electrify the rural areas seems therefore to be the off grid or self contained
system. The contribution of renewable sources of energy like micro-hydro power, to
rural electrification are minimal at present.
Increasing fossil fuel prices have provoked many countries to review the prospects for small
scale hydro electric power generation. More over third world countries implement mini-
hydroelectric power plants for covering energy shortage whilst reducing fuel costs.
The power from water has been a source of energy for many centuries. Early developments
utilized water wheels to drive mill stones and water pumps and then factory machines.
Hydropower generating capacity is now generally concentrated in large high head power
stations supplying their output to the national electricity grid.
Mini-hydropower is one of the cost-effjective and reliable energy technologies to be
considered for providing clean electricity generation.
This paper discusses the detail analysis and application of Mini-hydroelectric power plant for
rural electrification by integrating with economic aspects i.e determine the unit energy cost,
payback time of the power plant and introduce new technology to the selected site of
Ethiopia, Bench Majji Zone Neshi Village.

1
CHAPTER ONE
INTRODUCTION
1.1 Problem Statement
The development of any country depends on the amount of energy consumed. Energy
consumption is proportional to the level of economic development. In Ethiopia, the
energy consumption per capita is very low and it is almost exclusively generated from
biomass and this has a direct impact for the deforestation. The lighting system, in rural
areas, use kerosene and it produces emission of pollutants. Furthermore, it has a
direct impact on the health of the people.
Ethiopia has a marvelous amount of hydro power potential. Because of the high initial
investment cost, it is able to develop only two percent of its potential so far. To avoid
the electric energy draught, renewable energy technologies like mini hydro power
generation, solar photovoltaic and wind turbine can be used to electrify the rural
areas.
1.2 Objective
To analyze the technical and economical aspects of Mini-hydropower plant
technologies for rural electrification in the selected site of Ethiopia is the general
objective of this paper.
The Specific Objective is to propose a mini-hydro plant for rural electrification with 500
KW generating capacity and having the possible shortest payback time.
1.3 Method of attack
Assess micro-hydro power resources and get the preliminary data for micro-
hydro power generation.
Meteorological data collection for the site in consideration (i.e. area, location,
orientation, climate, topography and geology and the amount of rain fail at the
nearest station of the selected site)
2
System design for the energy source at the selected site using analytical
methods.
Conduct economic analysis of the energy consumption methods.
Economic evaluation of the system to determine the payback time and their
feasibilities.
Make conclusion on the place where micro-hydro power generation will
be installed in selected sites of rural area of Ethiopia in the future scenario.
1.4 Outline of the Report
Chapter Two reviews literatures about potential of renewable energy in Ethiopia and
techniques of renewable energy techniques of renewable technology especially Mini-
hydropower. Chapter Three presents detail components of hydroelectric power plant.
Chapter Four describes Electro-Mechanical equipments of the power plant including
controlling units. Chapter Five deal about general economic aspect of small hydro-
power plant. Environmental effect of Mini hydropower plant is explained in Chapter
Six. Chapter Seven is about market study and the capacity of the plant. Power
generation system and design is deeply explained in this the eighth chapter. In
chapter nine, cost evaluation including payback period of mini-hydropower generation
is intensely explained. Chapter ten presents conclusion and recommendation.

3
CHAPTER2
LITERATUREREVIEW
Small hydro is the development of hydroelectric power on a scale serving a small
community or an industrial plant. The definition of a small hydro project varies but a
generating capacity of up to 10 megawatts (MW) is generally accepted as the upper limit of
what can be termed small hydro.
Small hydro can be further subdivided into mini hydro, usually defined as between 100 KW
and 1,000 kW, micro hydro which is less than 100 kW.
Micro hydro is usually the application of hydroelectric power sized for small communities,
single families or small enterprise.
Small hydro plants may be connected to conventional electrical distribution networks as a
source of low-cost renewable energy. Alternatively, small hydro projects may be built in
isolated areas that would be uneconomic to serve from a network, or in areas where there is
no national electrical distribution network. Since small hydro projects usually have minimal
reservoirs and civil construction work, they are seen as having a relatively low
environmental impact compared to large hydro. This decreased environmental impact
depends strongly on the balance between stream flow and power production.
2.1 Rural electrification In Ethiopia
2.1.1 Resource
In Ethiopia there is a massive energy resource potential , that, if utilized, could
minimize the present energy crisis prevailing in the country and enhance for the process of
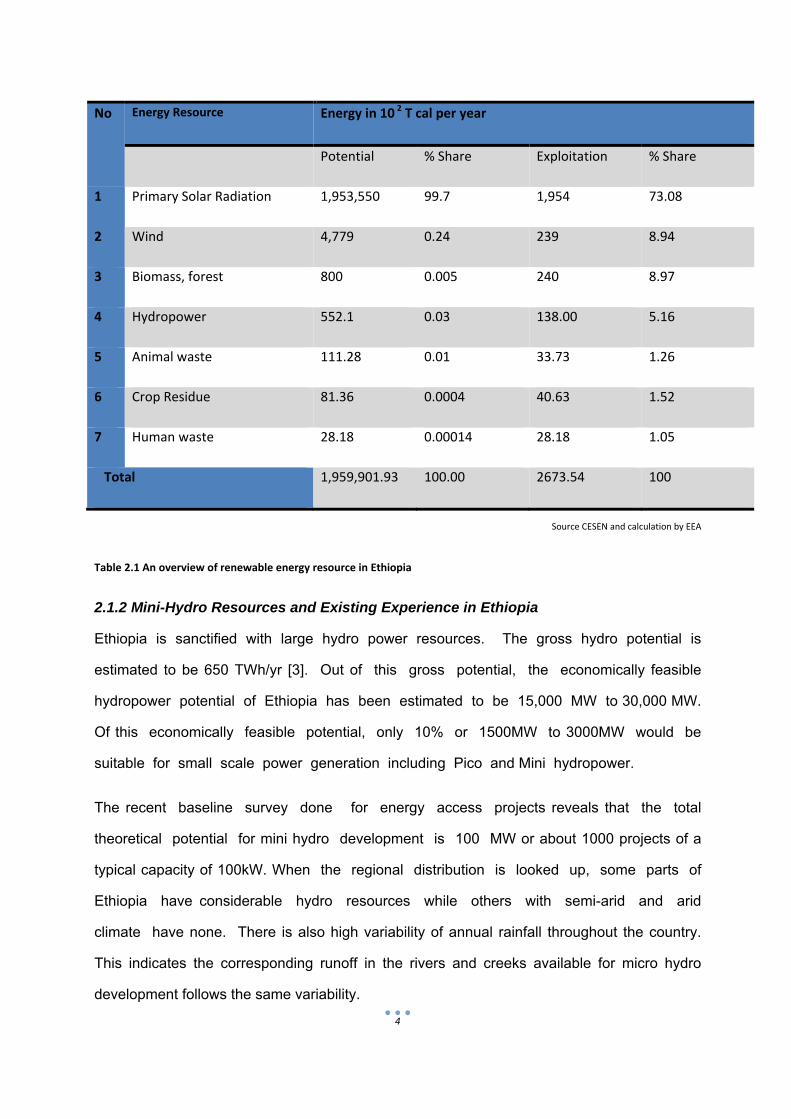
rural electrification. The total exploitable renewable energy that can be derived
annually from primary hydropower , solar radiation, wind, forest biomass, animal waste ,
crop residue and human waste is about 1,959x103 T cal per year.[1] The following
table illustrates the available Renewable Energy Resource in Ethiopia;
4
No Energy Resource Energy in 10 2 T cal per year
Potential % Share Exploitation % Share
1 Primary Solar Radiation 1,953,550 99.7 1,954 73.08
2 Wind 4,779 0.24 239 8.94
3 Biomass, forest 800 0.005 240 8.97
4 Hydropower 552.1 0.03 138.00 5.16
5 Animal waste 111.28 0.01 33.73 1.26
6 Crop Residue 81.36 0.0004 40.63 1.52
7 Human waste 28.18 0.00014 28.18 1.05
Total 1,959,901.93 100.00 2673.54 100
Source CESEN and calculation by EEA
Table 2.1 An overview of renewable energy resource in Ethiopia
2.1.2 Mini-Hydro Resources and Existing Experience in Ethiopia
Ethiopia is sanctified with large hydro power resources. The gross hydro potential is
estimated to be 650 TWh/yr [3]. Out of this gross potential, the economically feasible
hydropower potential of Ethiopia has been estimated to be 15,000 MW to 30,000 MW.
Of this economically feasible potential, only 10% or 1500MW to 3000MW would be
suitable for small scale power generation including Pico and Mini hydropower.
The recent baseline survey done for energy access projects reveals that the total
theoretical potential for mini hydro development is 100 MW or about 1000 projects of a
typical capacity of 100kW. When the regional distribution is looked up, some parts of
Ethiopia have considerable hydro resources while others with semi-arid and arid
climate have none. There is also high variability of annual rainfall throughout the country.
This indicates the corresponding runoff in the rivers and creeks available for micro hydro
development follows the same variability.

5
Pico and mini hydro systems for village application are of the run-of-river type and water
availability is the most important aspect.
The design flow of the plant must not exceed the minimum dry-season flow of the water
resource. Stand-alone hydro schemes without alternative or back-up systems run the
risk of insufficient capacity due to lower water.
2.1.2.1 Regional Distribution of Micro Hydro Power
The Central and Southwestern highlands of the country have an annual water surplus which
provides the basis for run-of-river hydro development on small scale.
Figure 2.1 Average annual water surplus regions in Ethiopia [1]
6
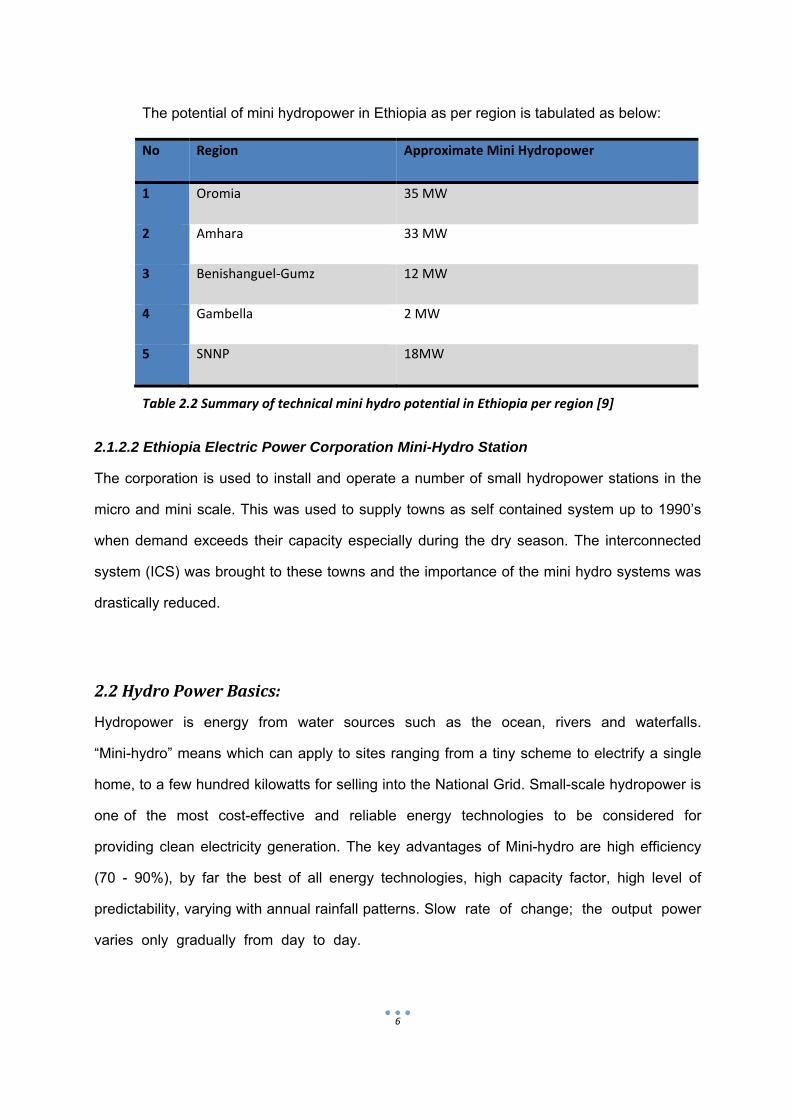
The potential of mini hydropower in Ethiopia as per region is tabulated as below:
No Region Approximate Mini Hydropower
1 Oromia 35 MW
2 Amhara 33 MW
3 Benishanguel‐Gumz 12 MW
4 Gambella 2 MW
5 SNNP 18MW
Table 2.2 Summary of technical mini hydro potential in Ethiopia per region [9]
2.1.2.2 Ethiopia Electric Power Corporation Mini-Hydro Station
The corporation is used to install and operate a number of small hydropower stations in the
micro and mini scale. This was used to supply towns as self contained system up to 1990’s
when demand exceeds their capacity especially during the dry season. The interconnected
system (ICS) was brought to these towns and the importance of the mini hydro systems was
drastically reduced.
2.2HydroPowerBasics:
Hydropower is energy from water sources such as the ocean, rivers and waterfalls.
“Mini-hydro” means which can apply to sites ranging from a tiny scheme to electrify a single
home, to a few hundred kilowatts for selling into the National Grid. Small-scale hydropower is
one of the most cost-effective and reliable energy technologies to be considered for
providing clean electricity generation. The key advantages of Mini-hydro are high efficiency
(70 - 90%), by far the best of all energy technologies, high capacity factor, high level of
predictability, varying with annual rainfall patterns. Slow rate of change; the output power
varies only gradually from day to day.

7
It is a long-lasting and robust technology; systems can readily be engineered to last
for 50 years or more. It is also environmentally benign. Mini hydro is in most cases “run-of-
river”; in other words any dam or barrage is quite small, usually just a weir, and little
or no water is stored.
Therefore, run-of-river installations do not have the same kinds of adverse effect on the local
environment as large-scale hydro.
The selection of the mini hydropower technology serves both local and global
objectives. Some of the advantages are [4]
A. It is renewable, non-polluting, utilizes indigenous resource;
B. Mini hydro schemes permit the energy to be generated near where it to be used,
leading to reduced transmission costs;
C. It can be easily integrated with irrigation and water supply projects in rural
areas;
D. Micro hydro schemes permit the generation of mechanical energy to drive
agro-processing machinery or establish cottage industries in rural areas;
E. It is a much more concentrated energy resource than either wind or solar
power;
F. The energy available is readily predictable;
G. No fuel and only limited maintenance are required;
Against these, the main short coming is a site-specific technology [4].
2.2.1 Head and Flow
The possible power at the outset and this will be dependent upon the available head, the
catchment of the river, the constraint of the civil work and the final use of the energy. The
potential power of a hydropower site is evaluated by the following principle:

8
P=Qi g H o where, P= Electric power output (W=N*m/s)
g=gravitational acceleration (m/s2)
=density (kg/m2)
Qi =Design Flow rate (m3/s)
H= Hydraulic Head (m)
o=Generation efficiency
2.2.2 Scheme layout and Available Head
To find out the gross head available at a site it is necessary to layout an interim plan. It may
be dependent upon scheme type, and involves the location of the intake structure the power
house and the channel for supplying water between the two. This conduit can take the form of
an open channel contour canal a low pressure pipeline, a high pressure pipeline or a
combination of any two or three. There are various forms of scheme layout possible:[10,11]
2.2.2.1 A high head and/ or medium- scheme where water is conveyed directly to the power
house by a high pressure pipeline as shown in the figure 2.2.
Figure 2.2 Scheme lay out with high head[10,11]

9
2.2.2.2 A High head and/ or medium scheme where water is carried from the
intake structure to the turbine forebay by a low pressure pipe line and hence to the
power house via high pressure pipe line.
Figure 2.3 High head with leat (this is a part of power plant which is open, contour‐canals for
the conveyance of water) [10,11]
2.2.2.3 Low head scheme -incorporating a diversion weir and intake works
feeding water through a low pressure pipe line to the power house. Water is returned
to the river by a tailrace channel.
Figure 2.4 Low head scheme[10,11]
2.2.2.4 The dam scheme is where the head is created by the construction of a
bombardment incorporating a power house.

10
Figure 2.5 power house Dam [10,11]
A number of factors upon like landscape, access, availability and comparative cost of
materials, the skills of the labour force, the requirements of other riparian users and land
drainage requirements to choice the scheme layout . In the case of a previously developed
hydropower scheme, this has subsequently fallen in to disuse, the scheme layout may
already be determined to a large extent.
The scheme layout determines the head available for generation. The head is either the
vertical difference in level between the water surface in the turbine forebay and the water
surface in the tail race for the schemes using pipelines and reaction turbines or the turbine
runner for scheme using pipe line and impulse turbine.
The other is that the vertical difference in level between the water surface immediately
upstream of the power house and the water surface in the tail race for low head leated
schemes and the power house dams.
Head measurement methods can be performed by a surveyor level or thedolite, an altimeter
or a surveyor’s staff, plumb line, tape, builder’s level, and total station. [10,11]

11
2.2.3 Hydrology Flow Rate
The occurrence estimate and the volume of the flow passing a proposed hydro-electric site
must be made if the development is to be properly sized and the installed capacity
determined. The selection of rated flow is of important since the sizing and hence cost of all
equipment and structures are dependent upon this parameter.
The hydrology of the catchment area and the consequent runoff and ground water conditions
determine the river flows. The catchment area is the whole of the land and water surface
contributing to the discharge at a particular location.
The river flow of the catchment is dependent upon many factors like area, location,
orientation, rainfall, climate, topography and geology. The volume of water in the river
available for generation is quantified by the annual mean flow. The appropriate installed or
rated turbine flow is dependant up on the optimum sizing of the power generating equipments
and the civil work in relation to the end use for the energy.
The study of the effect of rated flow for economic return between undertaken for a number of
sites of differing hydrological and scheme types. This analysis shows that optimum economic
benefit is likely to be obtained when rated flow is set at mean annual flow minus
compensation flow and accordingly this flow provides a reasonable first estimate for use in
preliminary appraisal and potential studies.
2.2.3.1 Mean Flow
For estimating mean flow several methods are available as shown below:
Mean flow can be estimated
Qm = ( SAAR‐Ea)*A*10 3 where Qm=annual mean flow(m3/s)
8760*3600 SAAR=Standard annual
average rainfall
for the
catchment
(mm)

12
Ea=actual evapo‐transpiration
(mm)
A= catchment area (m2)
Standard annual average rainfall for the catchment (SAAR) can be obtained from map
produced by Ethiopian Metrological Agency. The actual evapo-transpiration can be obtained
from potential evaporation (Ep). Ep is obtained from a Metrological Agency Map. The quantity
SAAR-Ea can be termed as net rainfall.[12]
2.2.4 Power Output
The power output from a potential mini-hydroelectric scheme is calculated by use of the Flow
Duration Curve (FDC), Fig. 2-6, together with consideration of the efficiency and part flow
characteristics of turbine and the overall efficiency of generation. An accurate assessment of
annual power output cannot be over-stressed, since it is the quantity of energy produced
which provides the income for such hydropower plant. Over estimation of the net turbine head
and the FDC will lead to over sizing of generating plant, in the case of this lead to
specification of an incorrect rotational speed for turbine which will lead to operation at
reduced efficiency.

13
Fig 2.6 Flow Duration Curve for Values of BFI (base flow index) [13]
2.2.5 Efficiency
It is necessary to obtain a value for the overall efficiency of generation, usually for output at
the electrical generator terminals to calculate the installed capacity. This is a product of

14
turbine, drive and electrical efficiencies and should also make allowance for head loss in the
pipe line where one is integrated.
The efficiency of the turbine curve is plotted where relative efficiency against the percentage
of rated flow and the curve for the main turbine type is shown as below for mini hydro power
plants:
Figure 2.7 Turbine Efficiency Curves from Manufacturer’s Data[14]
From the above curve one can understand that relative flat curve for the cross flow and
impulse when compared to the Francis and propeller machines.
The relative efficiency curve can be used only when a value has been obtained for likely peak
efficiency. This efficiency is dependent upon a number of factors: design, size, manufacturing
15
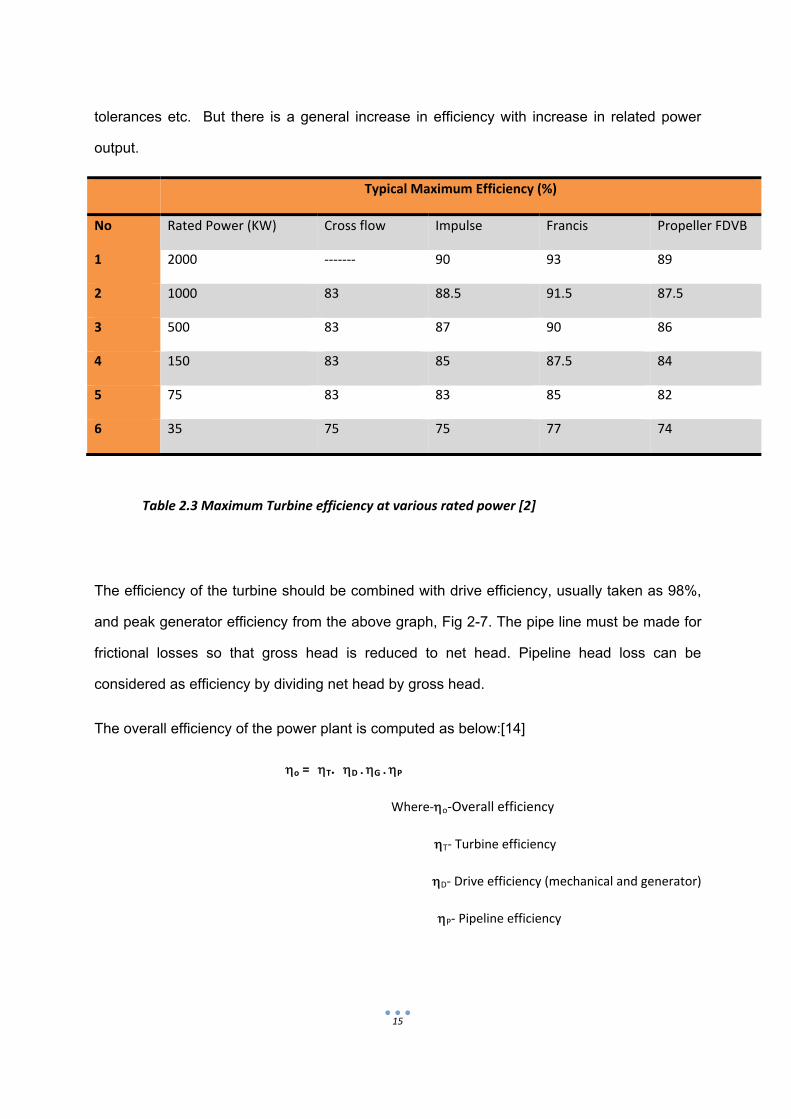
tolerances etc. But there is a general increase in efficiency with increase in related power
output.
Typical Maximum Efficiency (%)
No Rated Power (KW) Cross flow Impulse Francis Propeller FDVB
1 2000 ‐‐‐‐‐‐‐ 90 93 89
2 1000 83 88.5 91.5 87.5
3 500 83 87 90 86
4 150 83 85 87.5 84
5 75 83 83 85 82
6 35 75 75 77 74
Table 2.3 Maximum Turbine efficiency at various rated power [2]
The efficiency of the turbine should be combined with drive efficiency, usually taken as 98%,
and peak generator efficiency from the above graph, Fig 2-7. The pipe line must be made for
frictional losses so that gross head is reduced to net head. Pipeline head loss can be
considered as efficiency by dividing net head by gross head.
The overall efficiency of the power plant is computed as below:[14]
o = T. D.G.P
Where‐o‐Overall efficiency
T‐ Turbine efficiency
D‐ Drive efficiency (mechanical and generator)
P‐ Pipeline efficiency
16
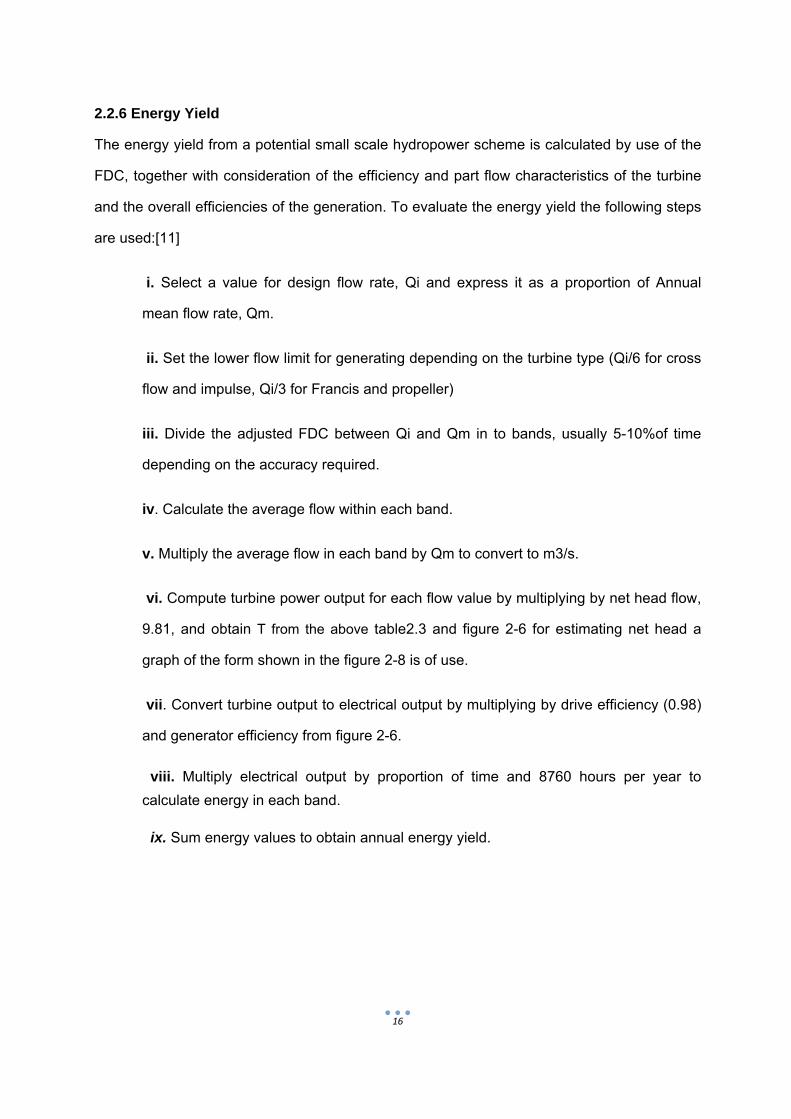
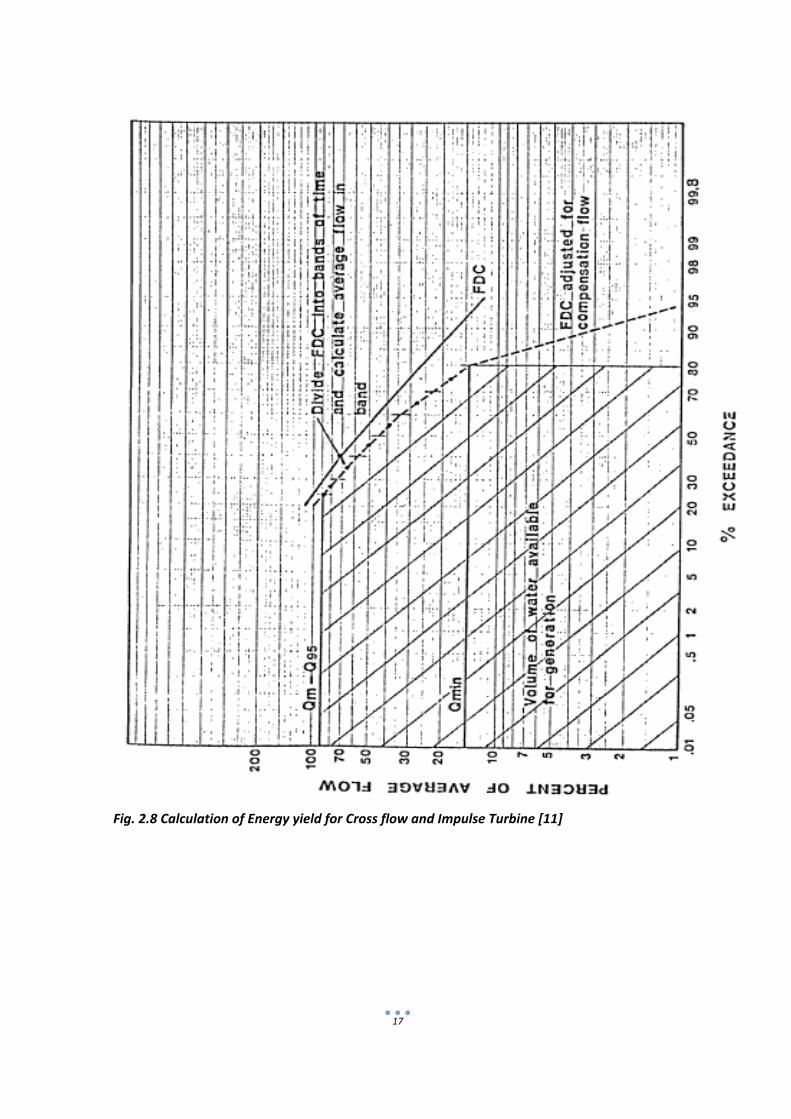
2.2.6 Energy Yield
The energy yield from a potential small scale hydropower scheme is calculated by use of the
FDC, together with consideration of the efficiency and part flow characteristics of the turbine
and the overall efficiencies of the generation. To evaluate the energy yield the following steps
are used:[11]
i. Select a value for design flow rate, Qi and express it as a proportion of Annual
mean flow rate, Qm.
ii. Set the lower flow limit for generating depending on the turbine type (Qi/6 for cross
flow and impulse, Qi/3 for Francis and propeller)
iii. Divide the adjusted FDC between Qi and Qm in to bands, usually 5-10%of time
depending on the accuracy required.
iv. Calculate the average flow within each band.
v. Multiply the average flow in each band by Qm to convert to m3/s.
vi. Compute turbine power output for each flow value by multiplying by net head flow,
9.81, and obtain T from the above table2.3 and figure 2-6 for estimating net head a
graph of the form shown in the figure 2-8 is of use.
vii. Convert turbine output to electrical output by multiplying by drive efficiency (0.98)
and generator efficiency from figure 2-6.
viii. Multiply electrical output by proportion of time and 8760 hours per year to
calculate energy in each band.
ix. Sum energy values to obtain annual energy yield.
17
Fig. 2.8 Calculation of Energy yield for Cross flow and Impulse Turbine [11]

18
[
Figure 2.9Estimation of Net Turbine Head[11]

19
CHAPTER THREE
Hydro power Generation
3.1 General Description about Hydro Power Generation
Hydropower engineering refers to the technology involved in converting the pressure
energy and kinetic energy of water into more easily used electrical energy. The prime
mover in the case of hydropower is a water wheel or hydraulic turbine which
transforms the energy of the water into mechanical energy. Mechanical energy will be
converted to electrical energy by using electrical generator [2].
3.1.1Types of Hydro Power
Generally there are four basic types of hydro power generation
3.1.1.1 Impoundment
An impoundment facility, typically in a large hydropower system, uses a dam to
store river water in a reservoir.
The water may be released either to meet changing electricity needs or to maintain a
constant reservoir level.
3.1.1.2 Run-of-river
Run of river has a dam with a short penstock (supply pipe) directs the water to the turbines,
using the natural flow of the river with very little alteration to the terrain stream channel at the
site and little impoundment of the water.
3.1.1.3 Diversion and Canal
In this type the water is diverted from the natural channel into a canal or a long penstock, thus
hanging the flow of the water in the stream for a considerable distance.
3.1.1.4 Pumped Storage
The demand for electricity is low, pumped storage facility stores energy by pumping
water from a lower reservoir to an upper reservoir. During periods of high electrical
demand, the water is released back to the lower reservoir to generate electricity.

20
3.2 Basic Concepts of Mini-Hydro Power Generation
Mini-hydro schemes are smaller still and usually do not supply electricity to the
national grid at all and it is usually refers to hydraulic turbine systems having a
capacity of 100 kW just enough to provide domestic lighting to a group of houses
through a battery charging to 100kWh which can be used for small factories and to
supply an independent local mini-grid which is not part of the national grid. This small
unites have been used for many years, but recent increases in the value of electrical
energy and incentive programs have made the construction and development of micro-
hydro power plants much more attractive to developers. Likewise small villages and
isolated communities in developing nations are finding it beneficial and economical to use
micro-hydro power generation [2].
The principle of operation, types of units, and the mathematical equations used in
selection of micro-hydro power systems are essentially the same as for conventional
hydropower developments. However, there are unique problems and often the costs of
the feasibility studies and the expenses of meeting all regulatory requirements make it
difficult to justify micro-hydro power developments on an economic basis.

21
Figure 3.1 Layout of a typical micro hydro scheme [2,4]
3.3 Scheme Components
3.3.1 Dam and Weirs
Mini hydropower plant in most cases are run-of-river in other words any dam or barrage is
quite small, usually just a weir, and little or no water is stored.
The costs involved in the construction of large impounding dams are such that the majority of
small hydropower schemes are of the run-of river type and as such does not have storage.
Low weirs are used and their primary function is to divert the water in to the intake work,
providing adequate water depth to ensure submergence of the pipe line or adequate depth in
the leat so that it can carry its design flow. A variety of materials can be used to construct weir
including masonry, concrete, steel, timber, and composite. The simplest type of weir, often
found in developing countries, is simply formed by placing boulders across the flow to divert
water. These structure often being swept away during large floods which are common in the

22
tropics. But labor is cheap and the boulders are easily replaced, such a diversion weir is often
adequate.
Permanent types of weir are usually constructed to raise the water level slightly, in which
case they collect the bed load and debris carried by the water. To assuage this problem it is
common to incorporate a sliding gate on the intake side of the weir, this permits sufficiently
high speeds near the intake to remove debris. For low-head, high-flow sites, it is unlikely that
a scheme will be economic if a weir to develop all the head has to be constructed. This site
will only be economic where the weir is an existing feature or where a low head a low weir
can be built on top of a natural ledge. For such areas flooding due to increase water levels
can also be a problem, and it may be necessary to construct flood relief gates over at least a
portion of the weir length. In Mini-hydro-power, dams are rarely used, however where they
are, careful consideration to their design must be taken.[15]
3.3.2 Intake structure
Mainly there are two main function of intake; to control the quality and quantity of water
entering the leat or the pipeline. Penstocks and spillway are the usual means of controlling
the amount of water entering the intake, whilst trash screens, skimmers and settling basins
are used to control water quality. The design depends on the scheme layout and as such is
site specific in nature integrating some or all of the above features. It is important that the
location of the intake structure is of importance since use of local features can simplify the
intake design. As usual intake structure is oriented perpendicular to the main direction of river
flow so avoiding the problem of debris and bed load entering the intake particularly during
flooding.
3.3.2.1 High and Medium head intake
In this category the use of a leat supplies water to the turbine forebay (settling area), and
those which pass water to the pipeline.
A. Channel Scheme

23
The channel scheme is the simplest form where no penstock and screens but a diversion wall
is used to deflect debris and restrict the flow during floods.
Figure 3.2 Simple Diversion Wall forms Intake
During flooding the water levels is significantly raised; the effectiveness of the wall in reducing
flows entering the channel is limited. For that reason, adequate spillway facilities must be
incorporated along the length of the channel to ensure that these flows are dealt with.

24
In addition to this there is no control of bed load sediment entering the channel, and hence
where such bed loads are high more sophisticated type of intake must be used. On the
downstream end of the leated scheme is the turbine forebay. This forebay usually integrated
with the settling basin, fine screen and spillway arrangement. For dewatering purpose stop
log grooves are incorporated in the pipe line.
B. Pipeline scheme
The pipe line scheme where water is passed directly from the intake to the pipeline, it is
necessary to remove all debris and most of the deposit from the flow prior to flow entering the
pipeline.
Figure 3.3 High Head Intake[16]
The intake includes course screens upstream of the penstock to protect it from damage by
large floating materials. The penstock gate controls the quantity of water entering the intake,
and this is supported by the insertion of a side spillway to accommodate temporary flow
fluctuation. Settling area is used to catch suspended material and fine screen to allow
removal of vegetation and other small debris.

25
As shown in the figure 3.3 the screen is placed above the base of the intake chamber on a
concrete ledge which further helps to trap sediments.[16]
3.3.2.2 Low Head Intakes
The preliminary settling basin is the weir and as explicated above the side sluice allows
removal of sediment from the intake area. The surface skimmer at the entrance to the
channel prevents large floating materials entering the leat.
A coarse screen prevents damage to the penstock and large debris to enter the leat. The
quantity of water entering the leat can be controlled by the penstock. In this category a
bypass penstock is also included for additional flow control and to allow distilling of the leat.

26
Figure 3.4 Low Head scheme

27
3.3.2.3 Trash Screens
This is a basic part of a hydropower to intercept all flow being passed to the turbine and
remove all debris which cannot be safely being passed through the turbine. A serious of
parallel metal bars can make the screen to scrape up the debris. It is usually installed at an
angle of 45 deg to 60 deg to horizontal. Such position aids raking, and allows a degree of self
cleaning as the flow velocity through the screen tends to move debris towards the top. When
the quantity of water allow, this action can be used to permit self cleaning by allowing water to
flow over the top of the screen and then taking some debris to the collector as shown in the
picture below.[17]
The screen head loss can be computed as below:
H=k(t/b)4/3 (V2/2g )Sin ø where H=head loss through screen(m)
k=trash screen coefficient
t/b= ratio of bar thickness to bar spacing
g=gravitational constant (9.81 m/s2)
ø = angle of bars to the horizontal
V=Velocity (m/s)

28
Figure 3.5 Head Loss through Trash Screen [17]
Figure 3.6 Trash Screen Head loss Coefficient k[17]
29
The flows are so large that annual raking is difficult automatic raking can be incorporated. In
general an electrical supply will be required and this adds a border complexity in isolate
areas. Electrically operated automatic screen are mostly employed at low head sites and due
to their cost they can only be used for large design.
3.3.2.4 Settling basin
The following formula illustrates the design settling basin:
L=60 Q / (Vo W) where L-Length of settling bas in (m)
Q-flow rate (m3/s)
Vo-particle settling velocity (m/minute)
W-width of chamber
Even though for mini hydropower 2 m/minute settling velocity is often used to remove
particles with diameters greater than 0.3 mm, the particle velocity is dependent upon particle
size and type.[18]
3.3.3 Leats
This is a part of power plant which is open, contour-canals for the conveyance of water. It is
constructed to carry water from the intake works to the forebay in high heads or from the
intake work directly to the power house in the low head scheme. For low pressure pipeline
leats are often preferred and directly conveying water to the power house by high pressure
pipeline. Its gradient, shape and the fabric can vary the flow capacity of the leat.
There are two types of leat lined and unlined. Unlined are frequently employed as the
expense is minimal and easily constructed and maintained relatively inexpert labour force.
Lined leats can be constructed from a variety of material like masonry, concrete, clay,
geotextile and sheet pile lining.
3.3.3.1 Design of leats
Manning’s equation can be used to design the leat and it can be written as below;[12]

30
v=R2/3 S1/2/n where v=velocity (m/s)
R=Area (m2)/wetted perimeter, hydraulic radius
S=slop of the leat
n=Manning’s roughness coefficient from table 3.1
Table 3.1 Values of Manning’s roughness coefficient n for straight uniform channels [12]
The shape of the leat is determined by the manning’s equation , characterized by its hydraulic
radius, it is useful to note that given the profile to be used for the leat, there is a specific value
for R which provides the most efficient section.
Material Type n
Smooth timber 0.011
Cement‐asbestos pipes, welded steel 0.012
Concrete‐lined (high quality formwork) 0.013
Brickwork well‐laid and flush‐jointed 0.014
Concrete and cast iron pipes 0.015
Rolled earth: brick in poor condition 0.018
Rough‐dressed stone paved, without sharp bends 0.021
Natural stream channel, flowing smoothly in clean conditions 0.030
Standard natural stream or river in stable condition 0.035
River with shallows and meanders and noticeable aquatic growth 0.045
River or stream with stones and rocks, shallow and weedy 0.060
Slow flowing meandering river with pools, slight rapids, very weedy
and overgrowth 0.100

31
Figure 3.7 Common leat Profile
Table 3.2 Hydraulic radius for most coefficient leat section[18]
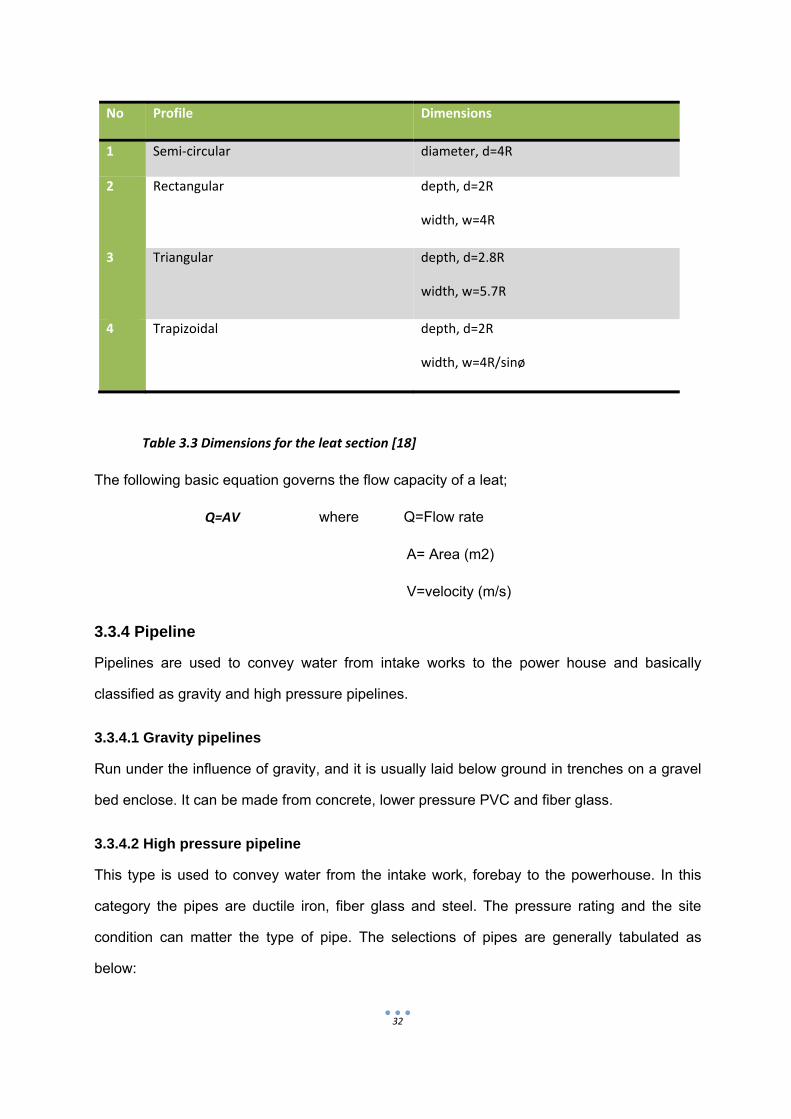
The following table describes dimensions for most efficient leat sections
32
No Profile Dimensions
1 Semi‐circular diameter, d=4R
2 Rectangular depth, d=2R
width, w=4R
3 Triangular depth, d=2.8R
width, w=5.7R
4 Trapizoidal depth, d=2R
width, w=4R/sinø
Table 3.3 Dimensions for the leat section [18]
The following basic equation governs the flow capacity of a leat;
Q=AV where Q=Flow rate
A= Area (m2)
V=velocity (m/s)
3.3.4 Pipeline
Pipelines are used to convey water from intake works to the power house and basically
classified as gravity and high pressure pipelines.
3.3.4.1 Gravity pipelines
Run under the influence of gravity, and it is usually laid below ground in trenches on a gravel
bed enclose. It can be made from concrete, lower pressure PVC and fiber glass.
3.3.4.2 High pressure pipeline
This type is used to convey water from the intake work, forebay to the powerhouse. In this
category the pipes are ductile iron, fiber glass and steel. The pressure rating and the site
condition can matter the type of pipe. The selections of pipes are generally tabulated as
below:

33
No Pipe type Size range
(mm)
Pressure
rating (m of
water)
Comment
1 Ductile iron 80‐1600 250‐400 Cost effective and durable when laid above
ground. In trenches do not require a
gravel surrounding but must be wrapped
to prevent corrosion.
Cement mortar lining reduces internal
corrosion. Disadvantage is weight.
2 Steel
tube(seamless)
80‐400 160‐4000 Main advantages are high pressure rating
and strength. Disadvantages are weight
and requires for coating to protection
against corrosion.
Pipes are joined by on site welding which
can be expensive.
3 PVC 80‐600 60‐150 Main advantage is light weight, hence easy
to install. Small range of sizes only and PVC
Deteriorate due to UV light.
4 Glass Reinforced
Plastic (GRP)
900‐2500
200‐1000
200‐2500
60‐260
60‐240
Gravity
Light weight, easy to install and cost
effective.
The main disadvantage when laying below
the ground require prepared bed or
granular surround.
5 Concrete 300‐2100 Gravity <10m Useful for gravity or low pressure
application but are heavy compared to
glass reinforced plastic.
Table 3.4 characteristics of commonly available pipe types

34
3.3.4.3 Design of a pipeline
The basic criteria to select the pipe are the ability to withstand normal operating position and
the sporadic surge pressure. The diameter of the pipe depends on the rated discharge and
the pipe friction losses. The loss varies with the pipeline material.
For mini hydropower pipe diameter is usually selected to give a loss of head along the
straight pipe length equivalent to 5% of the gross head. When a further allowance of 5% has
been made for losses at valves and beds, the net operating head of 90 % of gross head is
reached. On the other hand a detailed analysis can be used to compute the head loss as
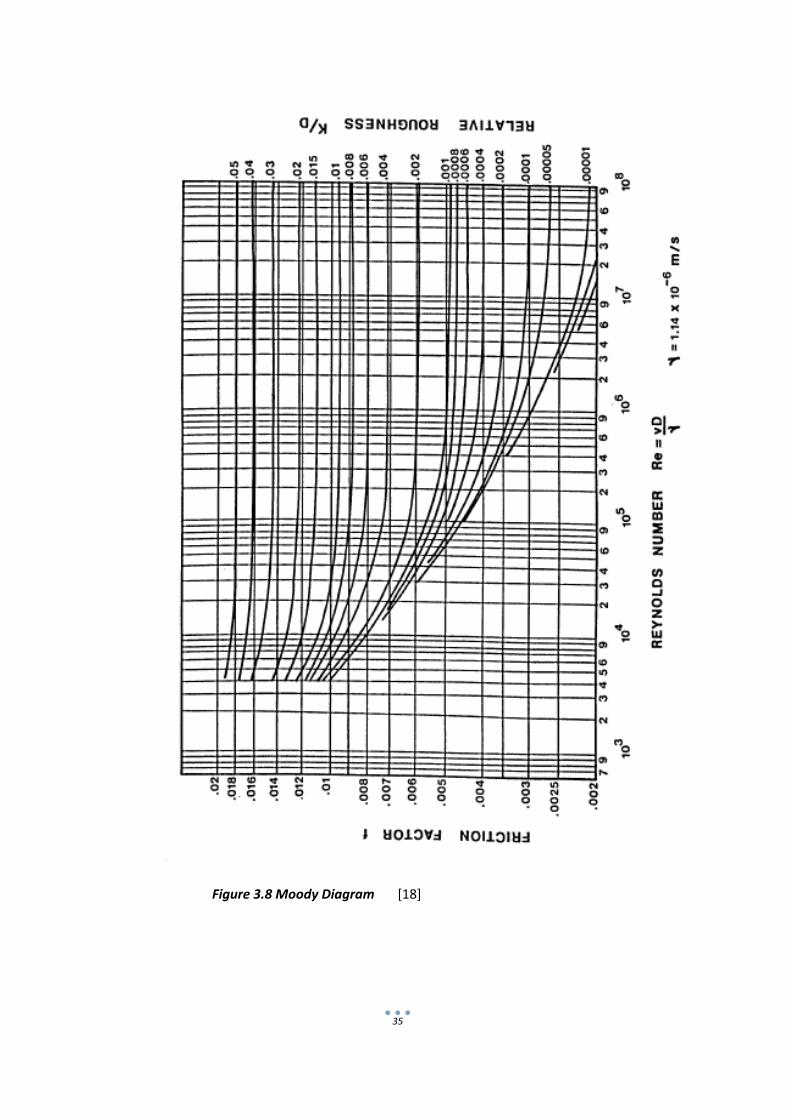
below:
hf=4fLv2/2gD where hf=head loss in m
f=friction factor
L=Pipeline length in m
v=flow velocity in m/s
D=pipe diameter in m
g=gravitational acceleration (9.81 m/s2)
By imputing the value of pipe diameter and friction factor the value of hf can be obtained,
since the value of pipe length and the flows are already known. The friction factor can be
obtained from the Moody diagram.[19]
35
Figure 3.8 Moody Diagram [18]

36
No Pipe line material Relative roughness k (mm)
1 Riveted steel 1.0 ‐ 10
2 Concrete 0.3 ‐ 3
3 Wood stave 0.2 – 1
4 Cast iron 0.25
5 Galvanized steel 0.15
6 Asphalt cast iron 0.12
7 Commercial steel 0.045
8 Plastic and GRP 0.003
Table 3.5 Relative Roughness [18]
The above pipe friction equation relates to losses along straight lengths of pipe; however
allowances can also be made for losses at bends, valves and tapers by equating them to
equivalent length of straight pipe.

37
Figure 3.9 Approximate pipeline design chart[18]
38
CHAPTERFOUR
ElectricalandMechanicalEquipmentofMini‐HydroPowerGeneration
The Basic electrical and mechanical components of a mini - hydro power plant are the turbine
and generator.
4.1 Turbine
A hydraulic turbine is a rotating machine that converts the potential energy of the
water to mechanical energy. There are two basic types of turbines, denoted as impulse and
reaction turbine. The impulse turbine converts the potential energy of water in to kinetic
energy in a jet issuing from a nozzle and projected onto the runner buckets or vanes. The
reaction turbine develops power from the combined action of pressure energy and
kinetic energy of the water.
The runner is completely submerged and both the pressure and the kinetic energy
decrease from the inlet to the outlet The turbine has vanes, blades or buckets that rotate
about an axis by the action of the water. The rotating part of the turbine or water wheel
is often referred to as the runner. Rotary action of the water turbine in turn drives an
electrical generator that produces electrical energy or could drive other rotating machinery.
Impulse turbines are further classified in to Pelton, Turgo and cross flow type, and Reaction
turbines are classified as Kaplane, Propeller, and Francis turbines [5].
4.1.1 Impulse turbine
By the nozzles through which the water is formed into free jets which strike the runner, all the
available head is converted to kinetic energy.
4.1.1.1 Pelton Turbine
A Pelton turbine consists of a set of specially shaped buckets mounted on a
periphery of a circular disc. It is turned by jets of water which are discharged from one
or more nozzles and strike the buckets. The buckets are split into two halves so that the
central area does not act a s a dead spot incapable of deflecting water away from the
oncoming jet. The cutaway on the lower lip allows the following bucket to move further

39
before cutting off the jet propelling the bucket ahead of it and also permits a smoother
entrance of the bucket into the jet. The Pelton bucket is designed to deflect the jet through
165 degrees which is the maximum angle possible without the return jet interfering with the
following bucket for the oncoming jet.
Figure 4.1 Pelton turbine [5,20]

40
4.1.1.2 Turgo Turbine
The Turgo turbine can operate under a head in the range of 30 to 300 meter. Like a pelton
it is an impulse turbine, but its bucket are shaped differently and commonly the jet
of water strikes the plane of its runner at an angle of 20o.
Water enters the runner through one side of the runner disk and emerges from the other.
The higher runner speed of the turgo, due to its larger diameter compared to other
types, make direct coupling of turbine and generator more likely[5].
Figure 4.2 Turgo turbine[5,20]
4.1.1.3 Cross flow Turbine
Cross flow turbines are also called Banki, Mitchell or Ossberger turbine. A cross flow
turbine comprises a drum shaped runner consisting of two parallel disc connected
together near their firm by a series of curved blades. A cross flow turbine has its runner shaft
horizontal to the ground in all cases. It is easy to manufacture in developing countries.
Figure 4.3 Cross flow turbine (1) cross section through the turbine and (2) arrangements of cross flow
turbine blades [5,20]
41
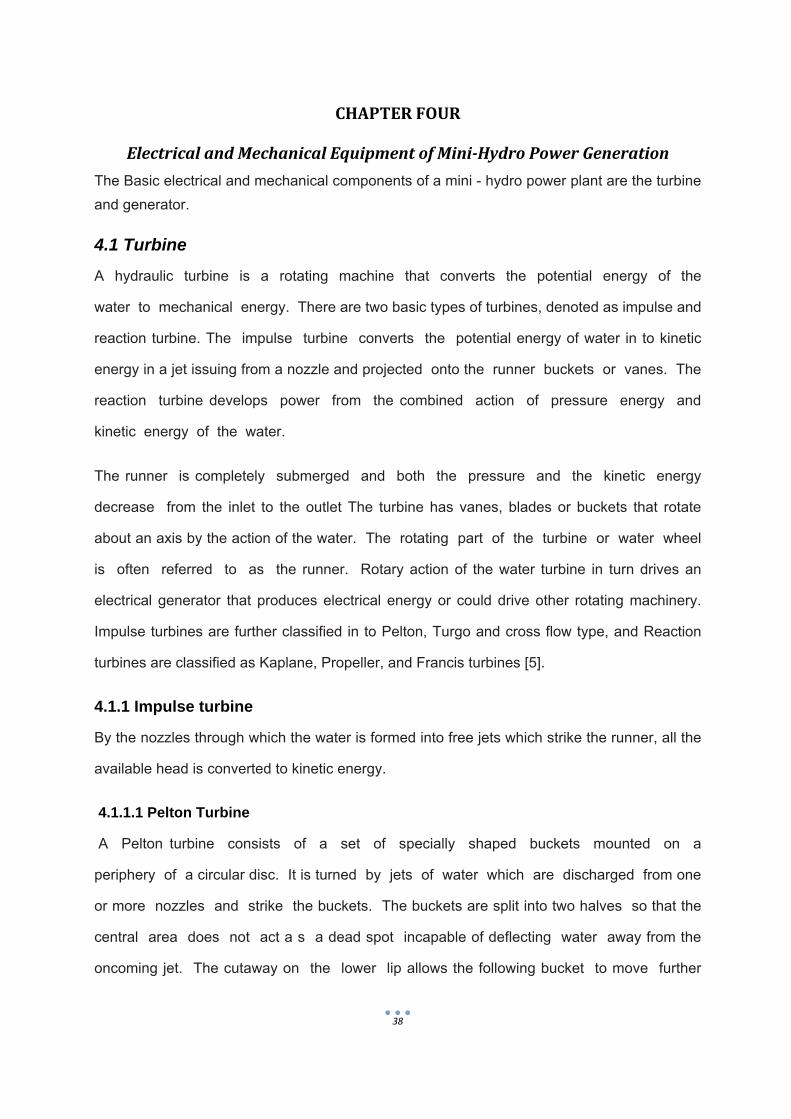
4.1.1.4 Kaplan and Propeller Turbines
Kaplan and propeller turbines are axial-flow reaction turbines, generally used for low
heads (usually under 16 m). The Kaplan turbine has adjustable runner blades and may or
may not have adjustable guide -vanes.
Figure 4.4 Kaplan turbine [5,20]
4.1.2 Reaction Turbine
In this type of turbine flow from headwater through to the tail water takes place in an
enclosed pressure system.
A part of the available head is converted to kinetic energy at the entrance to the runner, the
remaining as pressure head which varies throughout the water passage and in the draft
tube, producing an effective suction on the downstream side of the turbine runner.[5]
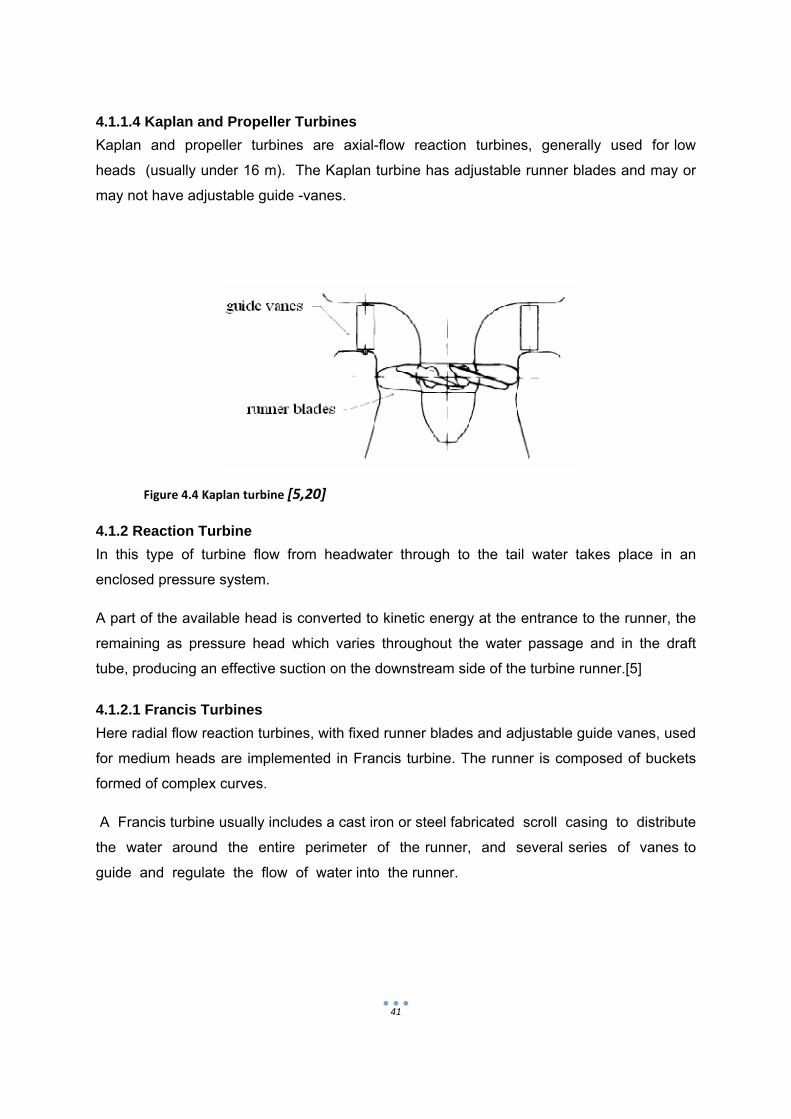
4.1.2.1 Francis Turbines
Here radial flow reaction turbines, with fixed runner blades and adjustable guide vanes, used
for medium heads are implemented in Francis turbine. The runner is composed of buckets
formed of complex curves.
A Francis turbine usually includes a cast iron or steel fabricated scroll casing to distribute
the water around the entire perimeter of the runner, and several series of vanes to
guide and regulate the flow of water into the runner.
42
Figure 4.5 Francis turbine [5,20]
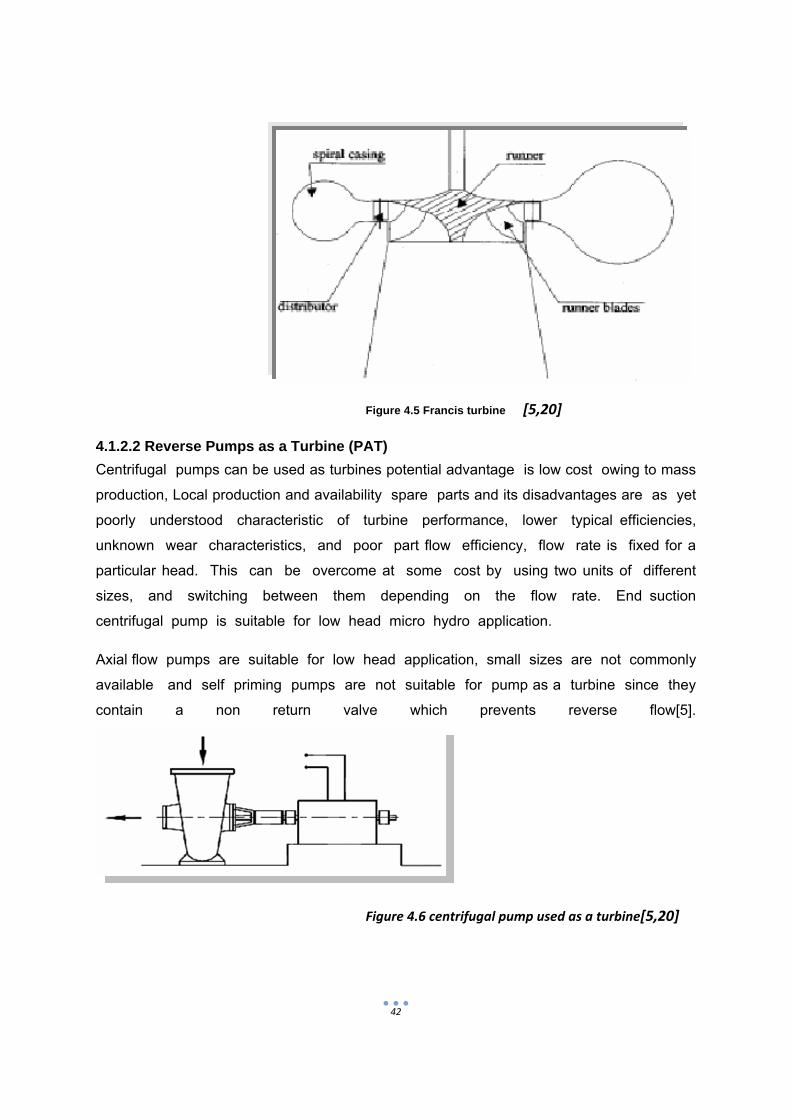
4.1.2.2 Reverse Pumps as a Turbine (PAT)
Centrifugal pumps can be used as turbines potential advantage is low cost owing to mass
production, Local production and availability spare parts and its disadvantages are as yet
poorly understood characteristic of turbine performance, lower typical efficiencies,
unknown wear characteristics, and poor part flow efficiency, flow rate is fixed for a
particular head. This can be overcome at some cost by using two units of different
sizes, and switching between them depending on the flow rate. End suction
centrifugal pump is suitable for low head micro hydro application.
Axial flow pumps are suitable for low head application, small sizes are not commonly
available and self priming pumps are not suitable for pump as a turbine since they
contain a non return valve which prevents reverse flow[5].
Figure 4.6 centrifugal pump used as a turbine[5,20]

43
4.2 Electrical Equipment, Generator
Electrical equipments are used after the above mentioned mechanical parts. There are
various arrangements to in order to maximize the benefits from generation. About two
arrangements either isolated generating systems or a generating system in parallel with the
local electric grid.
Isolated operations are on one hand appropriate for smaller output since the protection
equipment necessary for parallel operation becomes exceptionally costly. On the other
hand this operation is usually beneficial because the electrical switching arrangements are
simplified and an increased income can be obtained from the sale of surplus power.
In parallel operation, either induction (asynchronous) or alternator (synchronous) generator
can be implemented. It is obvious that erection of transmission line over a distance is very
costly and there is a considerable power loss. In this case a transformer would be placed at
each end of the line as a result the voltage can be increased and the transmission loss is
reduced. [21]
4.2.1Types of Generator used in Micro Hydro Power Generation
Electrical generators can produce either alternating current (AC) or direct current
(DC). In the case of AC current, a voltage cycles sinusoidal with time from positive peak
value to negative peak value. DC current flows in a single direction as a result of a steady
voltage. [21]
4.2.1.1 AC generators:
The frequency of AC generators is determined by the rotational speed of the generator and
the number of poles and it can be computed as follow;
f=Np where f-frequency
N-rotational speed (revs/sec)
p- number of pairs of poles
For many countries the frequency of generation is ranging from 50-60 Hz and electrical
appliances are designed to operate at this frequency. [21]

44
Rating of electrical equipments is specified in kVA and is the product of output voltage and
current. Depending on the type of load connected the kVA rating makes allowance for power
factor ranging from 0.8 to 1.
Power (KW)=KVA*Power factor
Depending of the size and type of the load single or three phase generators can be used.
For single phase not more than 100 kVA power rating is used. In the case of three phase
system the current for each phase is designed to accommodate 1/3 of the generators rated
power output.
In case of a single phase, generators are more economic at lower power ratings since they
require switchgear, monitoring, control and protection equipment for only one phase
compared to three phase systems.
There are two types of generators suitable for use in a mini-hydro electricity supply scheme.
These are synchronous generators (or ‘alternators’) and induction generators (in which
induction motors used as a generator) this machine is simpler or more reliable machine than
the synchronous generator. It contains fewer parts, is less expensive, is more easily
available from electrical suppliers.
It has the ability to withstand 200% runway speeds without harm, and has no brush or other
parts which require maintenance. These factors all make induction generator an attractive
choice for micro hydro power generation than that of synchronous generators. There is a
difficulty in mini-hydro power plant since during load rejection the turbine will accelerate to
the no-load runaway speed. [21]
4.3 Devices Used for Speed Increment
For mini hydropower plants speed increasing devices are required to couple the turbine to
the generator. The most commonly available are
4.3.1 Belt drive
There are various types of belts are available like flat, V-belt and timing belt. Flat belts are
made of synthetic fibers with typical efficiencies of 98 %. The basic limitation is that it must
be aligned carefully to ensure the belt doesn’t run off the pulley and it must be run at high
tension to prevent slippage. Another type of belt is the V-belt which is made of rubber
reinforced with cotton cords and fabrics and it has an efficiency of about 96 % and capable
of operating with slightly misaligned pulleys. The final type of belt is timing belt and it has a

45
tooth used for mechanical coupling rather than friction, but it is noisy and relatively
expensive.
4.3.2 Chain Drive
This type of drive are not commonly employed in hydropower plant even if it has an
advantage of high efficiencies (98-99%) but it has a limitation due to noise and cost.
4.3.3 Gear Box
This type of drives is employed at large power ratings where direct coupling is not possible.
Bevel gears can also be used to increase speed as well as connect vertical and horizontal
shafts.
4.4 Controlling and operation units
4.4.1Automatic flow and level controller-
Turbine flow adjustment would normally undertake manually in mini hydropower plant. On
the other hand in larger plants which are grid-connected and automatic flow/ level control
system is often integrated. The flow reaching the turbine should be continually adjusted to
ensure a particular level maintained either in an upstream reservoir or downstream tail
water.
4.4.2 Parallel and Isolated Operation
Based on the operation of the power plant, parallel and isolated systems are implemented.
In parallel system the hydro scheme is operated in parallel connection with the local grid. On
the other hand isolated operations are developed to meet isolated loads which could be a
factory, house for rural electrification.
In the case of isolated system, the generator power output and the electrical load must be
balanced to maintain the required constant rotational speed and thus constant frequency
alternative current output. And this can be attained either by flow control in which the turbine
power output is adjusted to match the load, or by load control in which the load on the prime
mover is maintained equal to the hydraulic power output.
To control the flow electromechanical governor is linked to the turbine either on the guide
vanes or on the runner blades and these types of controlling system is relatively expensive.
Another types of controlling units are called Electronic Load Governor, consists of electric
circuit which provides a variable dump load, which added to the real load equals the power

46
being produced from the plant by linking power output to a secondary resistance circuit in
response to changes in frequency or generated voltage.
The ballast load or the secondary circuit may be used for low priority energy demands such
as an immersion heater or space heaters. And finally the total ballast load plus the priority
load must be equal at all times to the output of the generator, and the ballast load must be
large enough to absorb the maximum generator output [3].

47
CHAPTER FIVE
ECONOMIC ASPECT OF SMALL HYDRO SCHEME
5.1 Introduction
The above chapter shows that small hydro-schemes can be considered as a number of
discrete components. It is possible therefore to produce an estimating packages which
allows a potential developer to build up a provisional estimate of scheme cost from the
various scheme components and hence to consider the economics of generation.
5.2 Scheme Components cost
Scheme costs are built up from the following components
5.2.1 Dewatering and diversion works
Diverting the river flow and maintaining a dry environment for construction of the civil works.
The amount ranges depending on the scheme layout where construction will involve use of
cofferdams, as in the case of some low-head and high-flow sites.
5.2.2 Intake structures
It is defined here as the portion of the civil works which house the screens and the penstocks
or sluice gates. The package allows for the costing of both the installation of new screens
and/or penstocks into existing civil works and for the construction of new intakes. In all cases
the estimation is made depending on the design flow.
5.2.3 Automatic screen cleaning
The removal of debris from screen by hand will be impractical for large high flow schemes
and hence mechanical ranking is preferable but for mini hydropower plant it is considered as
optional.
5.2.4 Leats and tailraces
Unlined, geo textile, lined and reinforced concrete are the three main types of leat/ tailrace.
5.2.5 Header tankers
It is required at the junction of low pressure and high pressure pipelines to prevent
transmission of surge pressure to the lower pressure pipeline.

48
5.2.6 Pipelines – low and high pressure
The method of selection of the required pipe diameter is discussed section 3.3.4 and the
cost of the pipeline is then obtained by multiplying the pipeline length by the cost. These pipe
costs include either laying in trenches or on mass concrete piers.
5.2.7 Turbo generators
The head and flow condition is the basic criteria to select the appropriate turbine type from
the turbine application chart.
5.2.8 Power houses
The cost of the power house for the selected turbine type may be determined from market
value.
5.2.9 Electrical protection and switch gear
The cost of protection and switch gear equipment are not easily defined and it is dependant
up on the operation like isolated and parallel.
5.2.10 Automatic flow/level controller
For automatic flow/ level controller the cost depends on its degree of sophistication.
5.2.11 Transformers
The cost of the transformer various with the required capacity and its quality of the
transformer.
5.2.12 Transmission
The cost of transmission at both low voltage and high voltage do not vary greatly with rated
capacity over the range 25 kW to 1500kW. This is because the cable has to be of a certain
size to have the required strength, and poles likewise have to be a certain sizes to carry the
cable load.
5.2.13 Access road
The cost of the construction of access road depends on the length, width and on the use of
hardcore and a geo-textile.
5.2.14 Installation and commissioning of turbo-generators
The installation and commissioning of turbo generators cost depends to some degree upon
the size of the set, however the complexity of the machine has the greater effect.
49
5.2.15 Additional work bank protection and excavation
In this category costing of additional works allow for excavation, ground clearance, and
bank protection. Excavation for construction of leats, powerhouses etc has previously been
allowed for in the costing of the specific works. However, in certain circumstances additional
excavation and site clearance may be required.
5.2.16 Engineering Fee
Owing to the site specific nature of a small-scale hydro-electric generation and the scale of
the works involved, the costs for engineering fees and for supervision are generally a greater
proportion of the cost of the works than would be anticipated for large scale civil work.
5.2.17 Contingencies
Contingencies are allowed some value of the total scheme cost inclusive of engineering
fees.
5.2.18 Operation and maintenance fee
The cost associated with the operation and maintenance of hydro-electric plant is low. An
appropriate value for small-hydro is 2% of the total scheme cost per annum.
5.2 Energy Value
The above part shows the detail method for calculating the annual energy yield from a
hydropower scheme. Nevertheless, in order to estimate the economics of generation at a
potential site, it is necessary to calculate the value of the energy produced. This requires the
consideration of end use for the energy. Commonly, three types of scheme which can be
considered.
5.3.1 Export scheme
The developed small hydropower scheme is solely for the supply of energy to local electricity
board grid system.
5.3.2 Isolated Scheme
In this scheme the developed power plant is for supply to loads such as factories, farms or
domestic households. It would be usual to size the scheme so that it meets the winter
demand. These could be in the form of heating, lighting, and electrical power supply. In such
cases, it is often impracticable to usefully use all the energy generated. Generally from study
typical value for the utilization factor would be 50 to 60%.

50
5.3.3 Parallel operated schemes
Parallel operated scheme are developed for parallel supply of loads as in section 5.3.2
above with sale of surplus energy to local electricity grid.
5.3EconomicsThe economics of a scheme can be considered in a number of ways, the most commonly
used being internal rate of return, and energy cost.
5.4.1InternalRateofReturn
It is defined as the discount or interest rate which is applied to constant net annual revenue
over a period of n years will result in a present value of the income stream equal to the
capital cost. The present value factor (PVF) is computed as below:
The equation may be set out as follow:
PVF=capital cost/Annual net revenue, if the right hand side of this equation is known and n
is selected then the value of r is calculable. Usually for hydropower scheme n is taken as 30
years [2].

51
Figure 5.1 Internal Rate of Return against Present Value Factor
5.4.1 Energy Cost
The energy cost may be calculated from the formula
Energy cost (p/kwh) = Capital cost + (PVF*Annual operating cost)
PVF*Annual output
PVF is dependent upon the rate of return required by the potential developer.

52
CHAPTER SIX
Environmental Effect of Mini Hydropower Plant
Mini-hydropower plant is characterized by a variety of potential effects on the environment
both positive and negative. It doesn’t produces carbon dioxide (CO2) and has little other
effects on the atmosphere compared to conventional power plants. The noise pollution is
also insignificant.
Hydropower plant produces environmental and related social effects i.e. hydrological effect,
landscape effect, and social effect.
6.1 Hydrological Effect
This is significantly affecting the ecology of a land and for the local community, especially in
the case of a large scale installation. The diversion of a mountain stream in to a pipe does
not, may be seriously change the flow at the valley bottom but it will have a noticeable effect
on the intermediate levels. Storing part of the water in a reservoir is another problem since it
may reduce the final flow as a result of evaporation from a large exposed surface. In addition
to this ground water is reduced to a hydropower plant the surrounding countryside might
cause suffer a number of changes and impacts which might affect the economy and the
ecology.
6.2 Landscape
The erection of hydropower plant may affect the landscape. The process itself causes
disturbance even the building period lasts only a few years. The disturbances are magnified
when the construction timetable is not met, as is often the case with large-scale hydropower
plant.
6.3 Social EffectsIn general hydropower plant has positive and negative effects; there are people who have
benefits of this and other pay for this. The construction of dams may have very different
consequences on the people immediately affected. The effect of hydropower on human
health is the most significant, especially in countries where the possibility of the spreading of
diseases such as malaria. The other social effect is the displacement of people living in
villages, which are to become water reservoirs. Historically, on a lot of occasions thousands
of people were forced to move from their house in order for a hydropower plant to be erected

53
CHAPTER SEVEN
7.1 MARKET STUDY AND PLANT CAPACITY
Ethiopia has nine region states among this Southern National Nationalities People’s
Regional State is the focus of this paper. It is a broad region and a home for more than 45
nations, nationalities and peoples. Consequently, it is difficult to cover some the special
“Woredas” (area categorization for administration purpose in Ethiopia which has less
population density than zone and region) and zones on surface transport. Currently, the
power sector is not matured and electricity supply is inadequate.
In this regional state there are one hundred four towns among this only forty one are
electrified yet the detail are shown in table 7.1. Thus, electric access coverage accounts only
about 39 % of the towns in the region.
S/
No
Name of Woreda/ Zones
The Available towns and/ or Village
Electrified Not electrified Total
1 Bench Maji 1 8 9
2 Dawuro 0 5 5
3 Gamo Gofa 5 8 13
4 Gedo 2 2 4
5 Gurage 6 6 12
6 Hadiya 4 3 7
7 Kaffa 1 9 10
8 Kambata Tembaro 4 0 4
9 Shaka 1 2 3

54
Source: Rural Energy and Minerals Resources Development Agency
Table 7.1 Electric Access coverage in southern regional state
This region falls in the Omo-Gibe Basin, Baro-Akobo Basin, Rift Valley System and Awash
Basin, it is known for it’ s water resources. According to the resource potential assessment,
the hydropower potential in different parts of the region is estimated to be more than 186,730
KW. There are numerous streams, canals, and rivulets with drops at many places in the
region. Hence, it is possible to set up a large number of mini hydropower plants that are vital
for rural electrification and establishment of small industries in remote area. Currently, a 500
KW mini hydropower plant could satisfy the demand for electricity of each non-electrified
village/ town in the regional state.
10 Sidama 7 3 10
11 Silty 2 4 6
12 South Omo 1 5 6
13 Wolaita 5 2 7
Special Woreda
14 Alaba 1 0 1
15 Amaro 0 1 1
16 Basketo 0 1 1
17 Burji 0 1 1
18 Darashe 1 0 1
19 konso 0 1 1
20 Konta 0 1 1
21 yem 0 1 1
Total 41 63 104

55
7.2 Power Demand
In general economic growth, industrialization, urbanization, population growth and
development are an influence for the demand of electricity. As the population size increases,
the demand for electricity for electricity also rises due to increased household demand for
lighting and powering various household appliances. Urbanization also increase the demand
for electricity due to increased demand for street lighting and the expansion of offices,
hotels, restaurants, and the other service rendering institutions. Apparently, industrialization
requires an enormous supply of electric power.
The development of mini hydropower plant assists the rural electrification and hence many
units of such plant would be required to satisfy the raised demand.
S/No Year Projected demand (KW) Remark
1 2013 500
2 2014 500
3 2015 500
4 2016 500
5 2017 500
6 2018 500
7 2019 500
8 2020 500
9 2021 500
10 2022 500
Table 7.2 Projected demands for electricity in Bench Maji Zone Neshi village

56
7.3 Electricity Pricing and Distribution
Depending on the end user of electricity there are different categories like domestic,
commercial, street lighting and industrial users. The pricing of electricity generated by the
power plants under Ethiopian Electric Power Corporation (EEPCO) varies according to
different categories of users.

57
CHAPTER EIGHT
POWER GENERATION SYSTEM DESIGN AND ANALYSIS
The actual power available from the mini-hydropower plant at any given flow rate value and
gross head can be obtained.
8.1 Power Generation system
Hydropower generation is a site specific technology and scheme configuration that varies
from site to site. The flow of water in a river may be regulated by means of a small dam or
weir. The weir also slightly raises the water level of the river and diverts sufficient water into
the conveyance system. The water is channeled to a forebay tank where it is stored until
required and it forms the connection between the channel and penstock. The penstock
carries the water under pressure from forebay to the turbine. The penstock is a very
important part of a hydropower project as it can affect the overall cost and capacity of a
scheme. The penstock connects to the hydraulic turbine, which is located within the
powerhouse
Figure 8.1 power house lay‐out
58
8.2 Power Generation Capacity
The resource potential assessment study which is conducted by Inter Power Solution for the
region, sites suitable for mini-hydropower development are available at different location of
the region. Identified water falls in Southern National Nationalities Peoples regional State
include Omo-Gibe basin, Baro-Akobo Basin, Rift valley system and the Awash Basin. The
power generated depends on the quantity of water available at the upper stream, the head of
the waterfall, and the sustainability of water flow over the dry seasons of the year. It would,
therefore, be possible to generate from very low to several kilowatts. The intention of this
thesis is to utilize the generated power in areas not far from the power house for rural
electrification.
The standard voltage of 240 V is to be transmitted, and then it is rarely transmitted more
than a couple of kilometers. To transmit further a transformer is used to step up the voltage.
In this study a generator of 240/415 V AC is anticipated and power will be transmitted to
longer distances with the help of step-up transformers.
To determine the output power of mini-hydropower plant, it would be necessary to specify,
further the net head and the flow of water fall. This would help to determine the turbine
specifications and the sizing of penstock pipes. The net head and flow are usually specified
by the site developer. Based on this the equipment supplier can state the actual value of the
output power of the turbo-generator. The plant will operate 10 hours a day, and for 365 days
a year.
Electrical power generation can be effected fully once commissioning work is complete.
However, distribution of power to commercial and residential areas can take time. It is
believed that preliminary preparations will be carried out with regard to electrification of
towns and villages together with erection and commissioning.
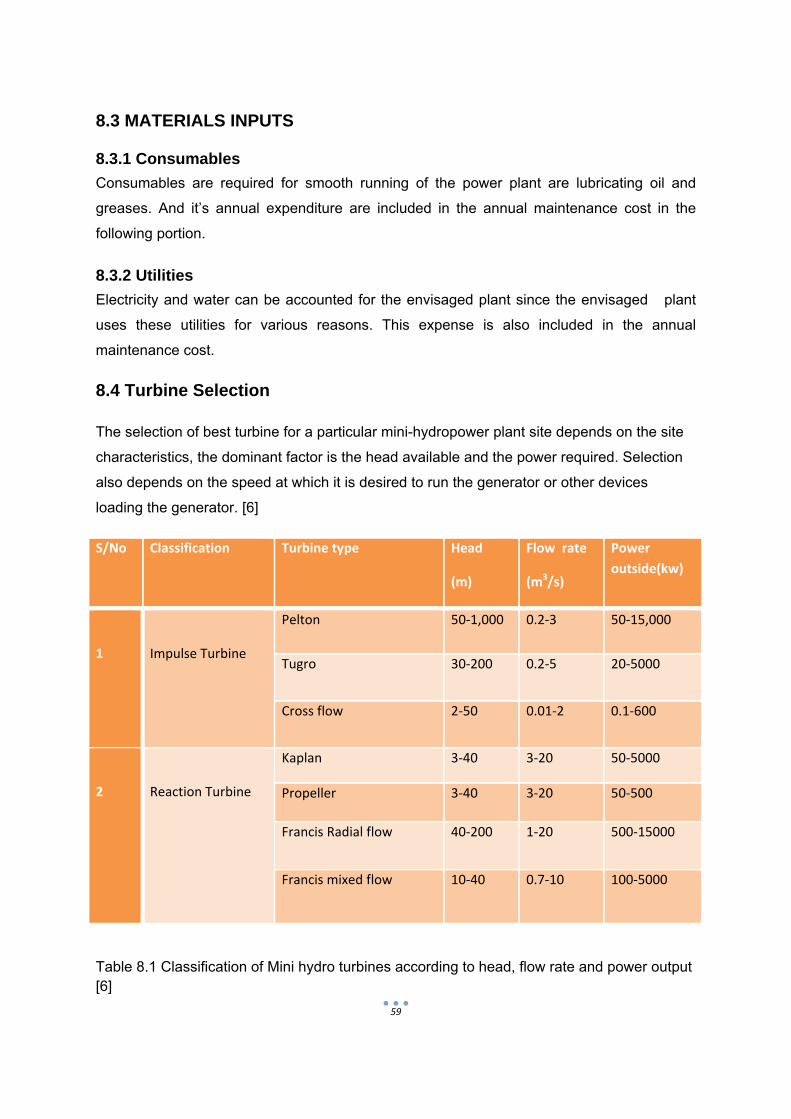
59
8.3 MATERIALS INPUTS
8.3.1 Consumables
Consumables are required for smooth running of the power plant are lubricating oil and
greases. And it’s annual expenditure are included in the annual maintenance cost in the
following portion.
8.3.2 Utilities
Electricity and water can be accounted for the envisaged plant since the envisaged plant
uses these utilities for various reasons. This expense is also included in the annual
maintenance cost.
8.4 Turbine Selection
The selection of best turbine for a particular mini-hydropower plant site depends on the site
characteristics, the dominant factor is the head available and the power required. Selection
also depends on the speed at which it is desired to run the generator or other devices
loading the generator. [6]
S/No Classification Turbine type Head
(m)
Flow rate
(m3/s)
Power
outside(kw)
1
Impulse Turbine
Pelton 50‐1,000 0.2‐3 50‐15,000
Tugro 30‐200 0.2‐5 20‐5000
Cross flow 2‐50 0.01‐2 0.1‐600
2
Reaction Turbine
Kaplan 3‐40 3‐20 50‐5000
Propeller 3‐40 3‐20 50‐500
Francis Radial flow 40‐200 1‐20 500‐15000
Francis mixed flow 10‐40 0.7‐10 100‐5000
Table 8.1 Classification of Mini hydro turbines according to head, flow rate and power output [6]
60
8.4.1 Sizing of Cross Flow Turbine
For this specific project, Bench Maji Zone, Neshi village, sizing of cross flow turbine, the
dimension of interest is the runner length L runner, diameter D runner and jut thickness t jet. If the
gear ratio is assumed to be 2 and the speed of the alternator is 1500 rpm then the diameter
of the runner can be calculated as below;
D runner=4l√Hnet, where Turbine Speed( Nt)=alternator rpm = 1500
Nt gear ratio 2
=750 rpm
Hnet=Gross head-Head loss: Head loss is usually taken from 2 to 7% of gross head
Hnet=Hg‐Hloss
Hnet=Hg‐7%Hg
= (53.5‐3.5) m
=50 m
By substituting the values in the above formula the D runner becomes
Drunner=0.39 m
The jet thickness is usually one tenth of the runner diameter [6]
tjet=Drunnerx1/10=0.039m
Having tjet, the approximate runner length (Lrunner) can be obtained from the orifice discharge
equation. The runner length will be equivalent to the jet width.
Q=Anozzle √2gHnet= tjetxLrunnerx√2gHnet for Q=1.96 m3/s
Lrunner= 1.6 m
8.4.2 Turbine Efficiency
To estimate the turbine efficiency it is assumed that the three parameters are design flow
(Qd ), flow rate at any time (Q) and peak flow (Qp) are to be equal.[6]
ht=0.79‐0.15(Qd –Q)‐1.37(Qd‐Q)14
Qp Qp
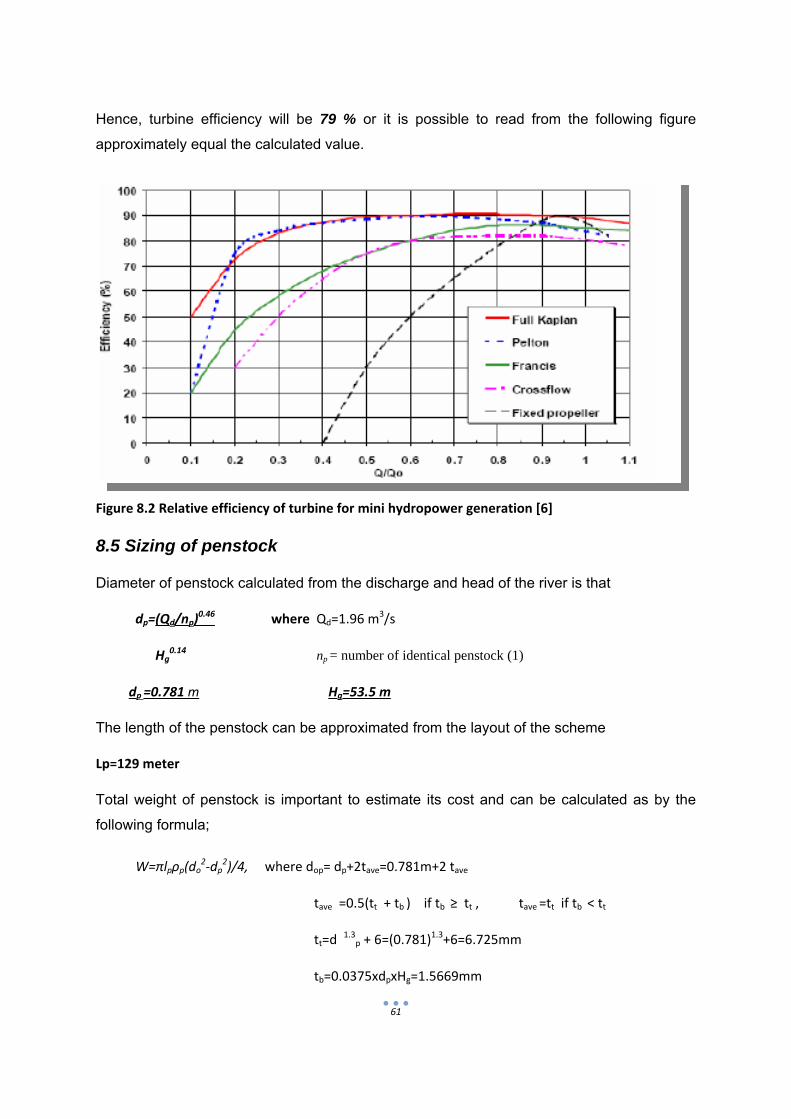
61
Hence, turbine efficiency will be 79 % or it is possible to read from the following figure
approximately equal the calculated value.
Figure 8.2 Relative efficiency of turbine for mini hydropower generation [6]
8.5 Sizing of penstock
Diameter of penstock calculated from the discharge and head of the river is that
dp=(Qd/np)0.46 where Qd=1.96 m
3/s
Hg0.14 np = number of identical penstock (1)
dp =0.781 m Hg=53.5 m
The length of the penstock can be approximated from the layout of the scheme
Lp=129 meter
Total weight of penstock is important to estimate its cost and can be calculated as by the
following formula;
W=πlpρp(do2‐dp
2)/4, where dop= dp+2tave=0.781m+2 tave
tave =0.5(tt + tb ) if tb ≥ tt , tave =tt if tb < tt
tt=d 1.3
p + 6=(0.781)1.3+6=6.725mm
tb=0.0375xdpxHg=1.5669mm

62
From this, it can be concluded that tave is 6.725 mm and do is 0.7945 m therefore the mass
of the penstock will be then
W=πlpρp(do2‐dp
2)/4 = 16,753.77 kg
8.6 Power Available From the River
The available power is the sum of the power output and the loss through the channel,
penstock, turbine, generator and the line. The power input, or the power absorbed by the
hydropower scheme is the gross power and the power usually delivered is the net power.
The overall efficiency of the scheme is termed as o.
Power input=Power output-Losses
Pnet=ρghgrossQo, where o= chanalpenstockturbinegeneratorline
Figure 8.3 Typical System efficiency of micro‐hydropower generation [6]
Hence, the actual power i.e Pnet available from the river is 500 KW.
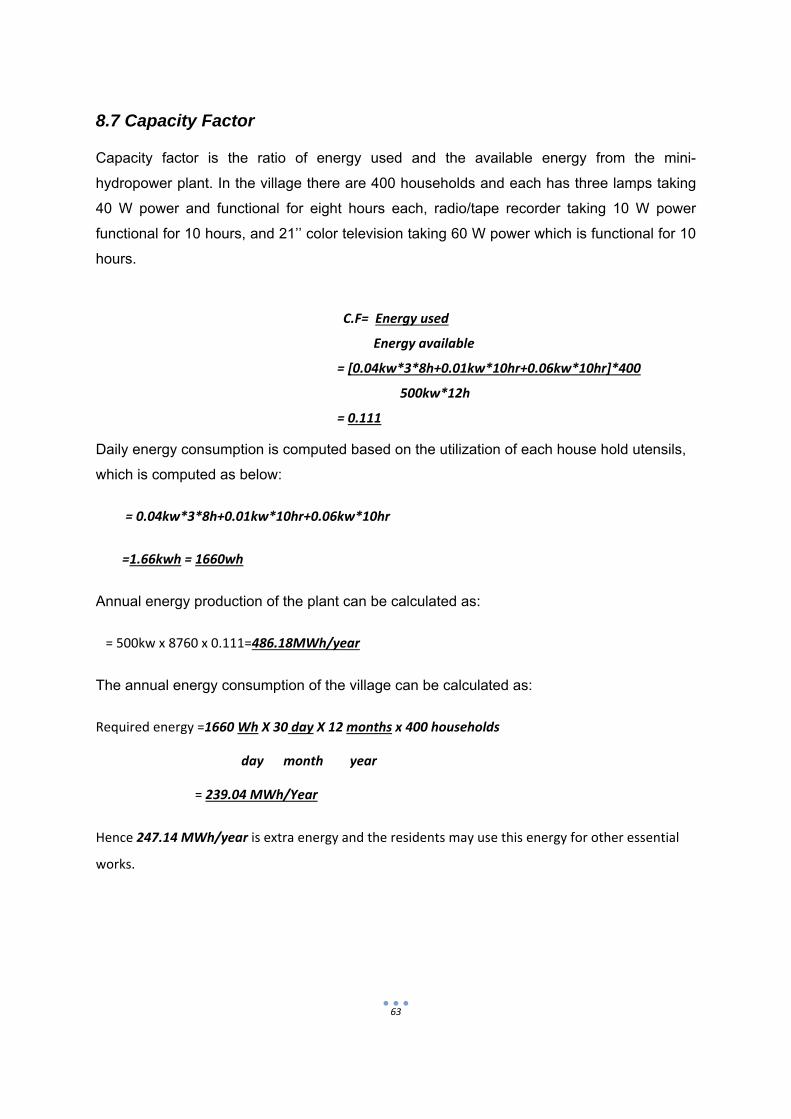
63
8.7 Capacity Factor
Capacity factor is the ratio of energy used and the available energy from the mini-
hydropower plant. In the village there are 400 households and each has three lamps taking
40 W power and functional for eight hours each, radio/tape recorder taking 10 W power
functional for 10 hours, and 21’’ color television taking 60 W power which is functional for 10
hours.
C.F= Energy used
Energy available
= [0.04kw*3*8h+0.01kw*10hr+0.06kw*10hr]*400
500kw*12h
= 0.111
Daily energy consumption is computed based on the utilization of each house hold utensils,
which is computed as below:
= 0.04kw*3*8h+0.01kw*10hr+0.06kw*10hr
=1.66kwh = 1660wh
Annual energy production of the plant can be calculated as:
= 500kw x 8760 x 0.111=486.18MWh/year
The annual energy consumption of the village can be calculated as:
Required energy =1660 Wh X 30 day X 12 months x 400 households
day month year
= 239.04 MWh/Year
Hence 247.14 MWh/year is extra energy and the residents may use this energy for other essential
works.
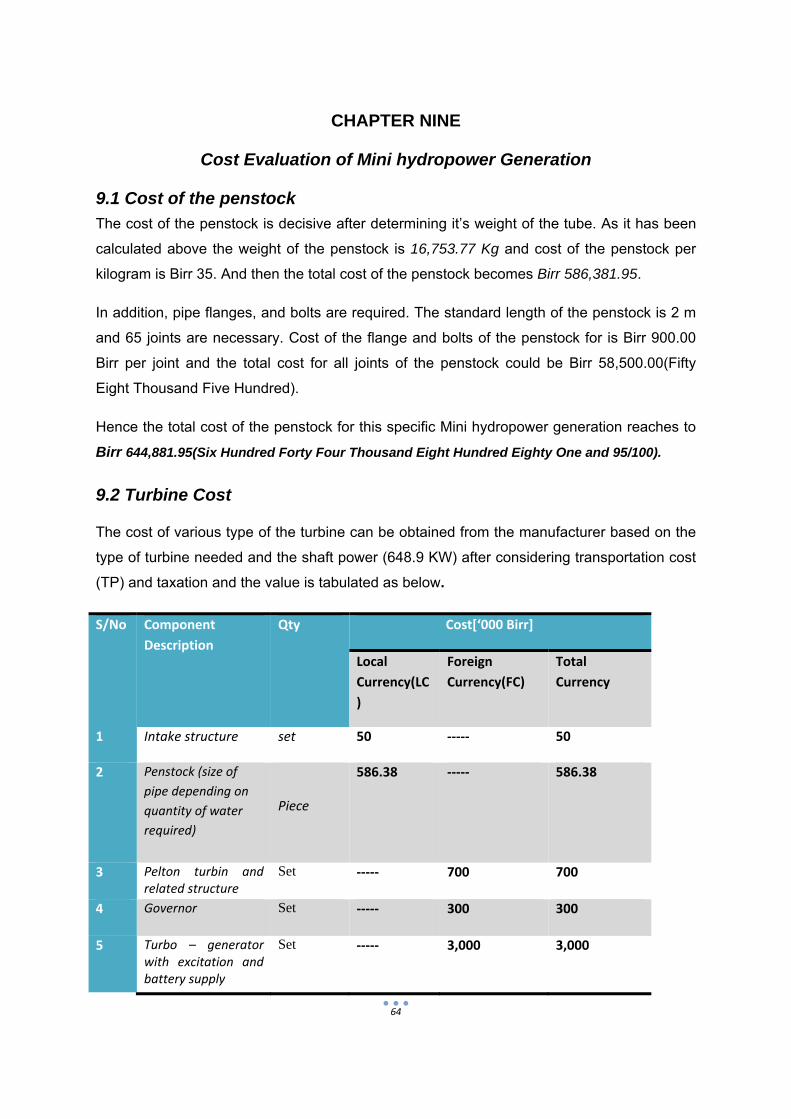
64
CHAPTER NINE
Cost Evaluation of Mini hydropower Generation
9.1 Cost of the penstock
The cost of the penstock is decisive after determining it’s weight of the tube. As it has been
calculated above the weight of the penstock is 16,753.77 Kg and cost of the penstock per
kilogram is Birr 35. And then the total cost of the penstock becomes Birr 586,381.95.
In addition, pipe flanges, and bolts are required. The standard length of the penstock is 2 m
and 65 joints are necessary. Cost of the flange and bolts of the penstock for is Birr 900.00
Birr per joint and the total cost for all joints of the penstock could be Birr 58,500.00(Fifty
Eight Thousand Five Hundred).
Hence the total cost of the penstock for this specific Mini hydropower generation reaches to
Birr 644,881.95(Six Hundred Forty Four Thousand Eight Hundred Eighty One and 95/100).
9.2 Turbine Cost
The cost of various type of the turbine can be obtained from the manufacturer based on the
type of turbine needed and the shaft power (648.9 KW) after considering transportation cost
(TP) and taxation and the value is tabulated as below.
S/No Component
Description
Qty Cost[‘000 Birr]
Local
Currency(LC
)
Foreign
Currency(FC)
Total
Currency
1 Intake structure set 50 ‐‐‐‐‐ 50
2 Penstock (size of
pipe depending on
quantity of water
required)
Piece
586.38 ‐‐‐‐‐ 586.38
3 Pelton turbin and related structure
Set ‐‐‐‐‐ 700 700
4 Governor Set ‐‐‐‐‐ 300 300
5 Turbo – generator with excitation and battery supply
Set ‐‐‐‐‐ 3,000 3,000

65
6 Transformer (s) – step up voltage, complete with switch gear
Set ‐‐‐‐‐ 2,100 2,100
7 Overhead transmission line complete with all accessories and step‐down substation
- 100 2,000 2,100
8 Accessories As required
75 75
9 Wooden pole 20,000 pcs 1,000 ‐‐‐‐ 1,000
FOB price 1,736.38 8,175 9,911.38
Fright, Insurance, Bank charges, etc…
300 300
CIF Landed Cost 2,036.38 8,175 10,211.38
Note ‐Birr is an Ethiopian currency and one Dollar is equivalent to 18.97 Birr
Table 9.1 cost of different components of the power plant
9.3 Land, Building and Civil Work
Land requirement for the plant consists of diversion site, intake and power conduit area, and
spillways, forebay, penstock, Power house, and tailrace.
At some locations, the lay of the land and natural formations within the stream may direct
sufficient water in to without a weir structure. Simply placing a few selected stones across
the river stream bed also could achieve the purpose. A weir is a dam across a river to raise
the level of water upstream.
The required land coverage refers to the intake structure area, the penstock, power house
and tailrace. The size of the land, therefore, depends on the topography of the plant site for
this specific project a total land area of about 3000 m2 will be required for the project of
which only 150 m2 areas will be used for the power house. As per the county regulations it is
proposed here that for the measure of encouragement developing rural electrification the
regional state provide land for free of charge. Therefore no cost is assumed for acquiring the
land which would be utilized for the mini hydropower plant.
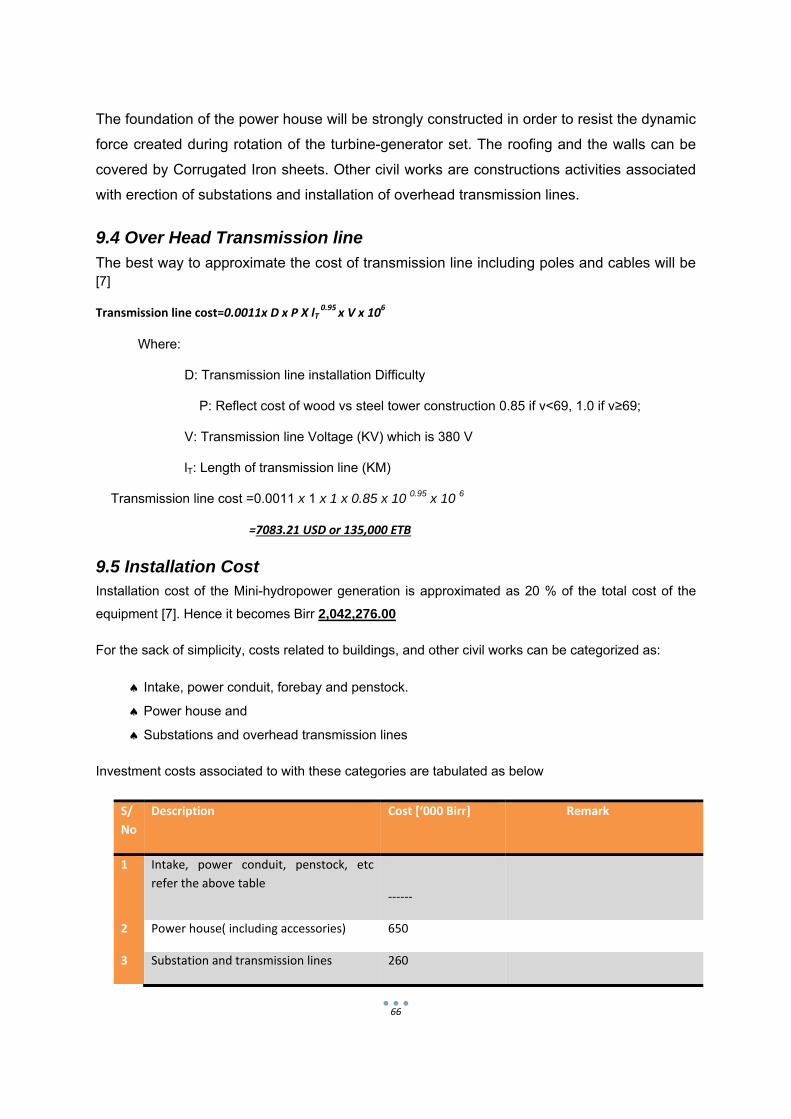
66
The foundation of the power house will be strongly constructed in order to resist the dynamic
force created during rotation of the turbine-generator set. The roofing and the walls can be
covered by Corrugated Iron sheets. Other civil works are constructions activities associated
with erection of substations and installation of overhead transmission lines.
9.4 Over Head Transmission line
The best way to approximate the cost of transmission line including poles and cables will be [7]
Transmission line cost=0.0011x D x P X lT 0.95 x V x 106
Where:
D: Transmission line installation Difficulty
P: Reflect cost of wood vs steel tower construction 0.85 if v<69, 1.0 if v≥69;
V: Transmission line Voltage (KV) which is 380 V
lT: Length of transmission line (KM)
Transmission line cost =0.0011 x 1 x 1 x 0.85 x 10 0.95 x 10 6
=7083.21 USD or 135,000 ETB
9.5 Installation Cost Installation cost of the Mini-hydropower generation is approximated as 20 % of the total cost of the
equipment [7]. Hence it becomes Birr 2,042,276.00
For the sack of simplicity, costs related to buildings, and other civil works can be categorized as:
Intake, power conduit, forebay and penstock.
Power house and
Substations and overhead transmission lines
Investment costs associated to with these categories are tabulated as below
S/
No
Description Cost [‘000 Birr] Remark
1 Intake, power conduit, penstock, etc
refer the above table
‐‐‐‐‐‐
2 Power house( including accessories) 650
3 Substation and transmission lines 260

67
Total 910
Table 9.2 Installation Cost
9.6 Financial Evolution and Analysis
The financial analysis of the Mini hydropower project is based on the data presented in the
previous chapters and the following assumption:‐
Construction period One year
Source of finance 30% equity
70% loan
Tax holiday 5 year
Bank interest 8%
Discount cash flow 8.5 %
Accounts receivable 30 days
Raw material local 30 days
Work in progress 5 days
Finished products 30 days
Cash in hand 5 days
Accounts payable 30 days
The economic feasibility of rural electrification can be checked by using such as internal rate
of return, net present value and pay-back. Hence, the method used in this study is the
different option is using the electricity service cost either in monthly or unit energy basis. The
monthly energy cost which has to be beard by the user is calculated from the annual cost of
the investment and annual operating cost which is mainly maintenance cost. Similarly, the
unit energy cost can be calculated by dividing the total annual cost by the energy generated
per annum.
CA= CI + Cm
(1+i)n ‐1
i(1+i)n
Where CA=Annual Payment
CI=Capital Cost
CM=Maintenance cost
n= life span

68
i= interest rate
The unit energy cost (price) is determined by dividing the total annual cost by the total of
electrical energy generated per year. For Mini hydropower power generation:
Pe = CA
365*Ed*Total number of house hold
Where Pe= unit energy cost
Ed=Daily energy cost
The initial capital cost of the mini hydropower generation system is Birr 13,298,662
according to this situation.
The annual maintenance cost of mini hydropower generation is usually taken as 2 % of the
initial investment cost of the system; this includes the utilities and the consumables expense.
Hence, annual maintenance cost will become Birr 265,973.
Monthly payment of the system
To evaluate the system, an assumption of 10% interest rate is taken in to consideration
CA= CI + Cm
(1+i)n ‐1
i(1+i)n
CA= 13,298,662 + 265,973 = Birr 1,730,583.35
(1+0.1)25 ‐1
0.1(1+0.1)25
Monthly payment (MP)= 1,730,583.35 =Birr 361
12 X 400
The unit energy cost is Pe = CA
365*Ed * Total number of house hold
= Birr 1,730,583.35
365x1.660x400
=7.14 Birr /KWh
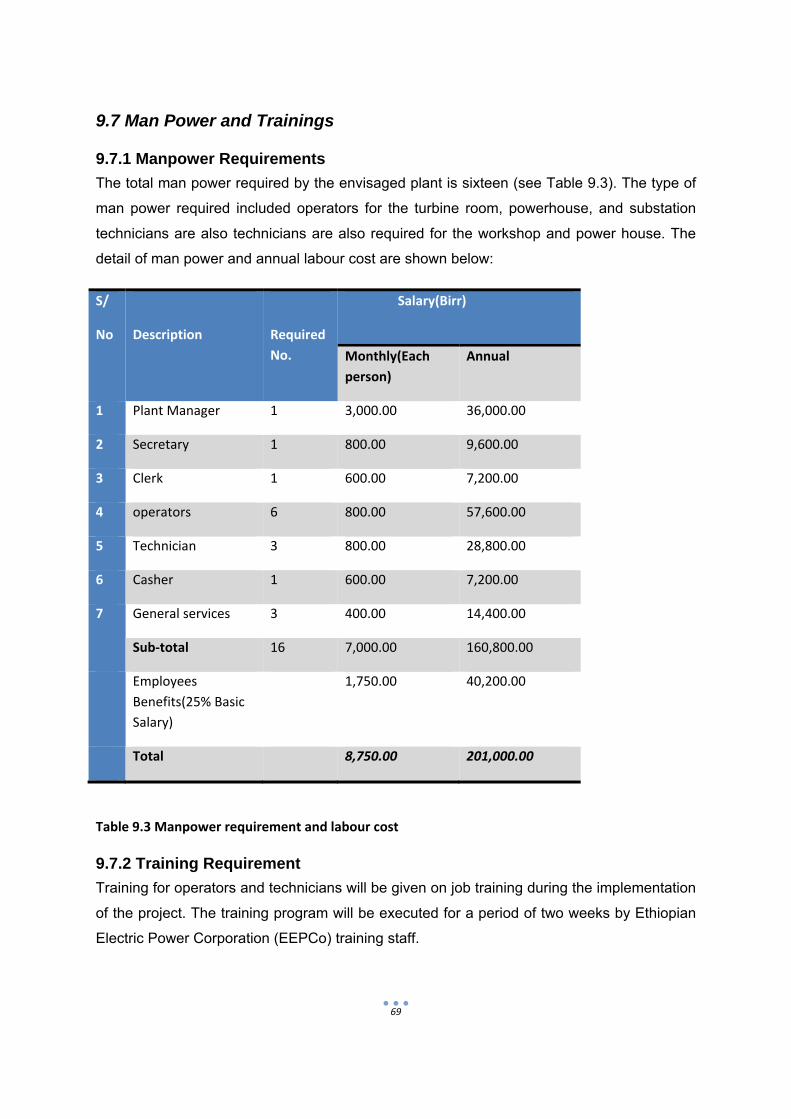
69
9.7 Man Power and Trainings
9.7.1 Manpower Requirements
The total man power required by the envisaged plant is sixteen (see Table 9.3). The type of
man power required included operators for the turbine room, powerhouse, and substation
technicians are also technicians are also required for the workshop and power house. The
detail of man power and annual labour cost are shown below:
S/
No
Description
Required
No.
Salary(Birr)
Monthly(Each
person)
Annual
1 Plant Manager 1 3,000.00 36,000.00
2 Secretary 1 800.00 9,600.00
3 Clerk 1 600.00 7,200.00
4 operators 6 800.00 57,600.00
5 Technician 3 800.00 28,800.00
6 Casher 1 600.00 7,200.00
7 General services 3 400.00 14,400.00
Sub‐total 16 7,000.00 160,800.00
Employees
Benefits(25% Basic
Salary)
1,750.00 40,200.00
Total 8,750.00 201,000.00
Table 9.3 Manpower requirement and labour cost
9.7.2 Training Requirement
Training for operators and technicians will be given on job training during the implementation
of the project. The training program will be executed for a period of two weeks by Ethiopian
Electric Power Corporation (EEPCo) training staff.

70
9.8PayBackPeriodThe payback time of the project can be computed based on the initial investment cost and
overhead costs is
Payback period= Total initial investment cost
Net Annual collected payment
Where: -Total initial investment cost=13,298,662
-Net Annual collected payment=CA-Annual Staff salary (see table 9.3)
=Birr (1,730,583.35-201,000)
=Birr 1,529,583.35
Payback period = 13,298,662 Birr 8.7 Year
1,529,583.35 Birr/ Year
Therefore the project initial investment cost will be fully recovered within 8.7 years after the
commencement of the power plant.

71
CHAPTER TEN
CONCLUSION and RECOMMENDATION
10.1 CONCLUSION
o In the previous chapters the unit energy cost of the mini-hydropower plant is 7.14
Birr/KWh and the monthly payment is Birr 361.
o From the payback period calculation the power plant returns its initial investment cost
within 8.7 years of operation and after this year onwards the plant generate profit.
o The people, in which the power plant is going to be installed, have gain new
technology and can create employment for 16 persons.
o The analyzed technical and economical aspects of Mini-hydropower plant technologies
for rural electrification with a generating capacity of 500 KW in the selected site of
Ethiopia, Bench Majji Zone Neshi Village, is feasible.
10.2 RECOMMENDATION
o It has been shown that, from the thesis work, Ethiopia has a huge potential for rural
electrification through the off grid system. There are, however, formidability
challenges like low purchasing power of the rural people, unfavorable public attitude
towards the private sector and unfair regulations that work against development and
distribution of renewable energy technologies. It is thus recommended that the
government, non-governmental organizations and the public make combined efforts
to overcome these challenges by using more flexible approaches to improve the
current terrible state of rural electrification in Ethiopia.
o From the current situation the government cannot simply afford to electrify rural areas
of Ethiopia, maximum effort must be exerted to change the prevailing attitude
towards the private investors and help the private sector in all possible ways beyond
the planning regulations.
o This thesis work only describes one selected site of Ethiopia and doesn’t represent
all areas of the county. So, in the future this study should be expanded to include
other sites to make it beneficial for the rural people.

72
References
[1] Aklilu Dalelo, Rural Electrification in Ethiopia: opportunities and bottlenecks, Addis
Ababa University, College of Education
[2] Harvey, A., Brown, A., Hettiarachi, P., A (1998): Micro Hydro design manual, a guide to
small – scale water power schemes, Intermediate Technology Publications
[3] Protection and Automatic control for small scale hydro electric plants, J M Bogart, small
hydropower in Africa, workshop proceeding, Mbabne, Swaziland, 1983.
[4] Biniam Abate, “Design of Micro‐Hydro Turbine Suitable for Most Ethiopian Sites”, June
2004
[5] Chaniotakis, E. (2001), MSc. Thesis on Energy Systems and the Environment,
Department of Mechanical Engineering University of Strathclyd.
[6] Harvey,A., Brown,A., Hettiarachi, P.,A(1998):Microhydro Design Manual a Guide to small
scale Water Power Schemes, Intermediate Technology Publications.
[7] RETScreen International Clean Energy Decision Supply Center, Small Hydro project
Analysis Chapter, Canada. [online] www.retscreen.net
[8] The International Bank for Reconstruction and Development / The World Bank 20061818 H Street, NW, Ethiopia, Managing Water Resources to Maximize Sustainable Growth, the World Report. [9] Berhanu Adane, Eyasu chirko (1997): Report on small hydro power sites
investigation in East and West Gojjam, May 1997, Addis Ababa
[10] Surveying, A Bannister and S Raymond, pitman publishing limited.
[11] Common flows in small hydro plants, W I Pentin, Water power and Dam Construction.
[12] Engineering hydrology, E M Wilson, MacMillan Publishers Limited.
[13]Low flow report, Institute of technology
[14] Speed governing and voltage control for isolated plants G Newman, third international
conference on small hydro plant, cancun, Mixico,.
[15] Design of small dams, United States Bureau of Reclamation.

73
[16] Innovative static self cleaning intake screen protects both aquatic life and turbine equipment, JJ Strong, Third International Conference on Small Hydro, Cancun, Mexico, April 1988. [17] Handbook of applied hydraulics, Davis and Sorenson, McGraw Hill Book Company. [18] Micro hydro power source book, AR Inversin, NRECA International Foundation, [19] Mechanics of fluids, BS Massey, Van Nostrand Reinhold Company, [20] Ethiopian energy access: Baseline survey monitoring and Evaluation frame work
Hydro market development strategy. Part II, Final Report, may 2003
[21] Selection of electro‐mechanical equipment for micro and mini hydro‐electric plants, RJ Armstrong Evans, Small hydropower in Africa, Workshop proceedings, Mbabane, Swaziland, June 1993.