“royal” quarterly show continues - icici direct · 2016-03-14 · “royal” quarterly show...
TRANSCRIPT
November 9, 2015
ICICI Securities Ltd | Retail Equity Research
Result Update
“Royal” quarterly show continues • Eicher Motors (EML) again reported a strong operational
performance in Q3FY16 with revenues growing 37.3% YoY, 7.1% QoQ to | 3123 crore. Although revenues were below our estimates on account of lower revenues from medium duty engines (MDE) business, EBITDA margins of 15.8% (up 236 bps YoY, 98 bps QoQ) came above our estimates of 15.6%
• The Royal Enfield (RE) business (standalone) reported net revenues of | 1301 crore (up 58.5% YoY, 18.6% QoQ), below our estimates of | 1314 crore, mainly due to lower than estimated ASPs. RE volumes for Q3FY16 were at 127611, up 51.5% YoY
• The RE (standalone) business margins expanded 272 bps YoY, 129 bps QoQ to 27.7% (our estimate 26.9%) mainly due to commodity price & operating leverage benefit. The VECV (CV business) business margins of 7.3% (up 34 bps YoY, down 54 bps QoQ) came below our estimates of 7.8% on account of a poor product mix
• Consequently the PAT (before MI) was at | 286 crore against our estimate of | 266 crore. Reported PAT (after MI) grew 54.8% YoY, 15.2% QoQ to | 255 crore
RE ramping up; exponential growth expected to stabilise in FY17 RE volumes grew at 42.4% CAGR in CY09-14 vs. 8% CAGR in CY00-10. Transformation from a low volume company (51661 units in CY09; 302601 units in CY14) to a strong lifestyle brand in premium segment has been due to strong execution & branding. Launch of Classic brand & inclusion of new engine unit construction engine (UCE) in CY09 spurred demand while growth momentum was maintained through new launches, quality improvements, production ramp up & expansion in dealer network. Given this situation of demand outstripping supply, the board has given an in-principle approval for setting up a third plant at Vallam Vadagal, which will take the total capacity to 900,000 units in CY18. Although the management has slightly cut down its CY15 (exit rate at ~48,000 units per month; earlier estimate ~50,000 per month) units & CY16 production estimates (annual capacity of~620,000 units; our estimate- ~650,000 units), the fact that the company has begun planning its third plant before Oragadam hits its full planned capacity, is an indicator of the managements confidence on the future demand prospects of its products. CV business to grow inline with industry growth The VECV JV boasts of the best business model among its peers, reflected in the fact that even in the worst CV cycle seen by the industry, VECV’s margins have stayed in the positive territory throughout the weak demand scenario, declining to 5.3% in Q4FY13 vis-à-vis incumbents Tata Motors. As discounting levels taper off and operating leverage plays out, we expect EBITDA margins to improve. Great businesses demand rich valuations EML has justifiably commanded a premium over other auto OEs as RE’s business is in full throttle and VECV reaps the benefits of an economic revival. We maintain peer valuation parameters (relative valuation vis-à-vis HOG’s high growth phase) and ascribe a higher multiple of 32xFY17E EPS for RE, VECV at 10x FY17E EV/EBITDA, respectively, to arrive at an SOTP target price of | 19000. We have a BUY recommendation on the stock with an upside potential of ~14%.
Rating matrix Rating : BuyTarget : | 19000Target Period : 12 monthsPotential Upside : 14%
What’s Changed?
Target Changed from | 20545 to | 19000EPS FY16E Changed from | 562.1 to 520.7EPS FY17E Changed from | 708.1 to 607.4Rating changed from Hold to Buy
Quarterly Performance
Q3FY16 Q3CY14 YoY (%) Q2FY16 QoQ (%)Revenue 3,122.5 2,275.0 37.3 2,916.7 7.1EBITDA 492.7 305.3 61.4 431.6 14.1EBITDA (%) 15.8 13.4 236 bps 14.8 98 bpsPAT 255.5 165.0 54.8 221.8 15.2
Change in accounting year, FY16E is a 15 month period Key Financials | Crore CY13 CY14 FY16E FY17ENet Sales 6,685 8,599 15,633 16,908 EBITDA 713 1,115 2,421 2,874 Net Profit 394 615 1,406 1,640 EPS (|) 145.9 227.1 520.7 607.4
* Change in accounting year, FY16E is a 15 month period Valuation summary
CY13 CY14 FY16E FY17EP/E (x) 114.4 73.5 32.1 27.5 Adj. EV/E (x) 138.5 95.5 54.1 24.2 Tgt.Adj.EV/E(x) 121.4 83.8 47.5 21.2 P/BV (x) 21.9 18.0 12.8 9.6 RoNW (%) 19.2 24.5 39.9 34.9 RoCE (%) 18.3 24.5 43.5 39.6
* Change in accounting year, FY16E is a 15 month period Stock data Particular AmountMarket Capitalization | 45085.1 CroreTotal Debt (CY14) | 58.4 CroreCash and Investments (CY14) | 481.5 CroreEV (CY14) | 44662 Crore52 week H/L (|) 21555 / 8162Equity capital (| crore) | 27 CroreFace value (|) | 10
Price performance (%)
1M 3M 6M 12MEicher Motors Ltd -10.4 -18.9 10.7 29.7Tata Motors Ltd 18.7 3.4 -20.4 -25.3M&M Ltd -1.2 -10.6 7.4 -0.5
Eicher Motors (EICMOT) | 16692
Research Analyst
Nishit Zota
Vidrum Mehta
ICICI Securities Ltd | Retail Equity Research Page 2
Variance analysis Q3FY16 Q3FY16E Q3CY14 YoY (%) Q2FY16 QoQ (%) Comments
Total Operating Income 3,123 3,208 2,275 37.3 2,917 7.1 Lower than estimates on account of lower than estimated MDE revenuesRaw Material Expenses 1,592 1,734 1,218 30.7 1,532 3.9Purchase of traded goods 425 370 276 53.8 374 13.6
EBITDA 493 502 305 61.4 432 14.1EBITDA Margin (%) 15.8 15.6 13.4 236 bps 14.8 98 bps Beat on the margin fromt because of RE margins, which came in at 27.7% against
estimate of 26.9%
Other Income 13 3 19 -34.2 7 86.2Depreciation 88 91 56 55.9 79 10.6Interest 3 2 1 214.1 2 68.0Total Tax 129 125 81 58.8 101 28.1PAT before MI 286 266 186 53.6 257 11.3 Above estimates on account of higher margins & other incomeMinority Interest 30 0 21 44.2 35 -13.0PAT 255 266 165 54.8 222 15.2 Below estimates on account of minority interest
Key MetricsRoyal Enfield ASP(|) 114,688 115,589 108,660 5.5 115,589 -0.8VECV ASP (| lakhs) 15.3 15.2 14.0 9.4 14.7 4.0
Source: Company, ICICIdirect.com Research Change in estimates
(| Crore) Old New % Change Old New % Change CommentsRevenue 15,708 15,633 -0.5 17459 16,908 -3.2 Topline estimates revised downwards post downward revision of volumes in both RE & VECV
businessEBITDA 2,491 2,421 -2.8 3168 2,874 -9.3EBITDA Margin (%) 15.9 15.5 -37 bps 18.1 17.0 -115 bps Downward revison of margins as we do not expect the VECV margin expansion as per our
previous expectationsPAT 1,518 1,406 -7.4 1913 1,640 -14.2EPS (|) 562 521 -7.4 708 607 -14.2
FY16E* FY17E
Source: Company, ICICIdirect.com Research * Change in accounting year, FY16E is a 15 month period Assumptions
Current Earlier CommentsCY13 CY14 FY16E* FY17E FY16E* FY17E
Royal Enfield volumes 177646 302601 615773 652921 591990 667597Downward revison in volumes as company gave guidance of an exit capacity of ~48,000 units per month in CY15 while the guidance for exit production of CY16 is ~620,000
Royal Enfield ASP/unit (|) 107,257 109,177 115,106 120,648 115,734 121,622VECV volumes 41,421 40,978 60,150 59,774 62,121 62,064 We have reduced the volume estimates on the back of H1FY16 performance, where VECV
lags industry growth in segments where it has significant market share
VECV ASP/unit (| lakh) 12.6 13.5 14.8 16.1 14.5 15.6
Source: Company, ICICIdirect.com Research * Change in accounting year, FY16E is a 15 month period
ICICI Securities Ltd | Retail Equity Research Page 3
Key conference call takeaways • Eicher Motor’s standalone business (Royal Enfield), for Q3FY16,
revenue grew 58.5% YoY to | 1,301 crore (volume growth of 52% YoY to 127,611 units). EBITDA margins came in at 27.7%. PAT grew by 62% YoY to | 228.5 crore
• Motorcycle capacity is likely to increase to ~48,000 units per month
by December 2015 (earlier estimate - ~50,000 units per month) from the current capacity of 45,000 units. The management has guided for a production capacity of 620,000 units in CY16 (we were building in a capacity of ~650,000 units)
• The company board has given an in-principle approval for setting up
a third plant at Vallam Vadagal (10 km from Oragadam), which will enhance the production capacity to ~900,000 in CY18
• The company is working on two new platforms, of which one will be
launched in CY16 and the other in CY17 • The dealer network is likely to be expanded from 400 dealers in CY14
to 500 dealers in CY15E and to 550 dealers in CY16E • The waiting period has reduced from four to five months to one to
four months (due to increase in capacity). However, new orders still outpace the production run rate every month
• The top 20 cities contribute nearly ~60% of RE volume sales. Existing
stores in these cities are witnessing growth of 15-20% YoY • In the 5-14 tonne segment, the company has been growing slower
than the industry • In VECV, tax benefits related to R&D expenditure will lead to tax rate
below 20% • Engine volumes grew 27% YoY to 4,800 • Eicher - Polaris joint venture (JV) started production of personal utility
vehicle “Multix”. The company has sold 231 units till October. The product is currently available in seven states across 31 locations
ICICI Securities Ltd | Retail Equity Research Page 4
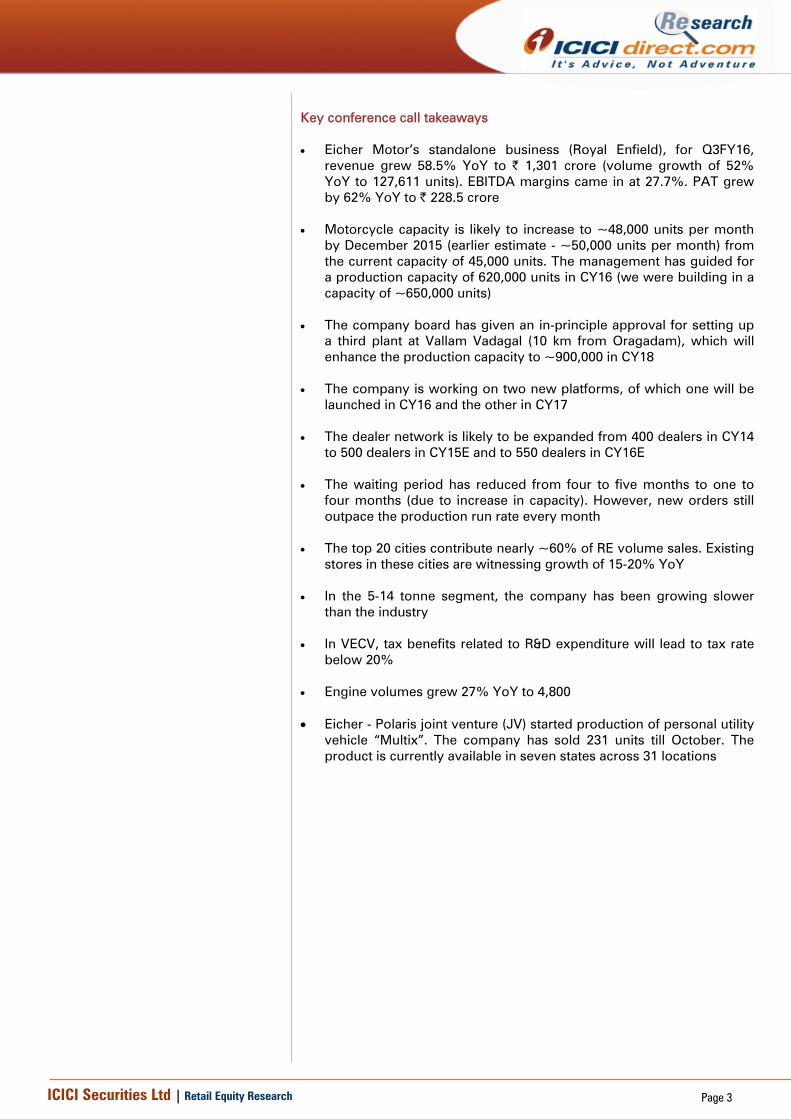
Company Analysis Our demographic analysis reveals that in the coming decade (2021) we could witness the share of the 15-40 years age population declining to 60% from 64% of total driveable population (>15<70 years). We observe that the first generation Splendor (Launched 1994) driving population (15>) would have been born <1980s. The same generation in 2014 would be aged ~ 34+ highlighting that as we move into 2021 the same class of buyers would be >42+. We assume that a bulk of 2-W drivers would be young (15-40 years). Thus, we interpret the fact that as we move into the next decade bulk of the young population i.e. (>15<30 years- Gen Z) would have been born in nineties and beyond, thereby having vastly different purchase habits and priorities (e.g. mileage/affordability vs. brand perception/comfort to their fathers (born <1980’s- Gen Y). Royal Enfield (RE), the world’s oldest active motorcycle brand, with its uniquely classical and powerful bikes, was always a cult among bike lovers. However, in the recent past, the new India emerging higher middle class have taken to it with few comparables. Exhibit 1: Young India to be big buyer class in next decade
30 24 20
2728
27
1415
15
18 21 22
5 5 6
5 7 9
0%
20%
40%
60%
80%
100%
2011 2016 20210 year> 15 year> 30 year> 40 year> 60 year> 70 year>
Source: Company, CIA World Fact book, ICICIdirect.com Research Assumed 1.25% CAGR population growth
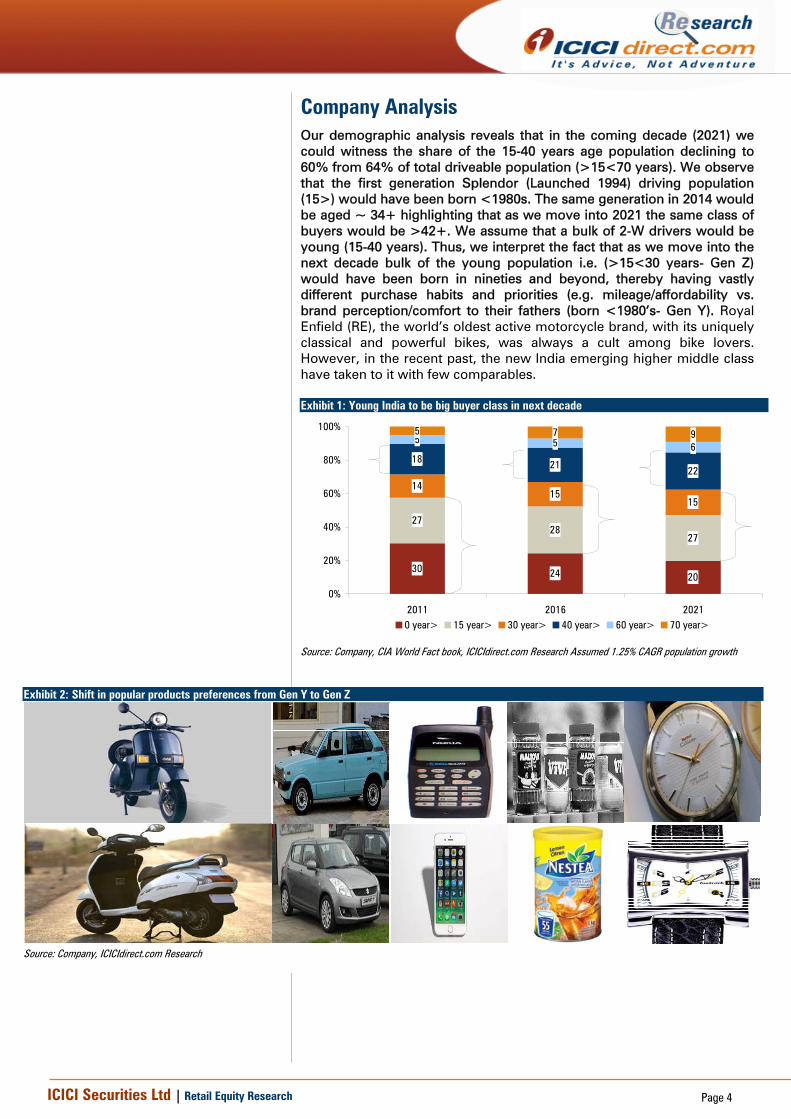
Exhibit 2: Shift in popular products preferences from Gen Y to Gen Z
Source: Company, ICICIdirect.com Research
ICICI Securities Ltd | Retail Equity Research Page 5
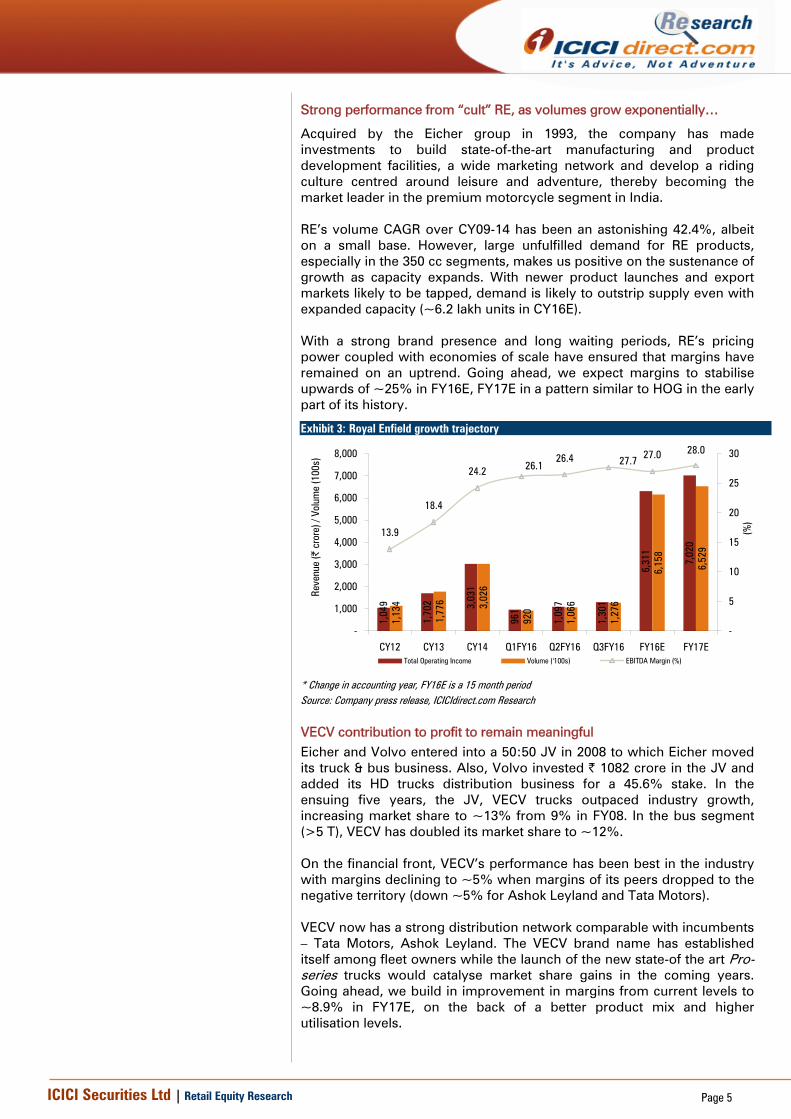
Strong performance from “cult” RE, as volumes grow exponentially…
Acquired by the Eicher group in 1993, the company has made investments to build state-of-the-art manufacturing and product development facilities, a wide marketing network and develop a riding culture centred around leisure and adventure, thereby becoming the market leader in the premium motorcycle segment in India. RE’s volume CAGR over CY09-14 has been an astonishing 42.4%, albeit on a small base. However, large unfulfilled demand for RE products, especially in the 350 cc segments, makes us positive on the sustenance of growth as capacity expands. With newer product launches and export markets likely to be tapped, demand is likely to outstrip supply even with expanded capacity (~6.2 lakh units in CY16E). With a strong brand presence and long waiting periods, RE’s pricing power coupled with economies of scale have ensured that margins have remained on an uptrend. Going ahead, we expect margins to stabilise upwards of ~25% in FY16E, FY17E in a pattern similar to HOG in the early part of its history.
VECV contribution to profit to remain meaningful Eicher and Volvo entered into a 50:50 JV in 2008 to which Eicher moved its truck & bus business. Also, Volvo invested | 1082 crore in the JV and added its HD trucks distribution business for a 45.6% stake. In the ensuing five years, the JV, VECV trucks outpaced industry growth, increasing market share to ~13% from 9% in FY08. In the bus segment (>5 T), VECV has doubled its market share to ~12%. On the financial front, VECV’s performance has been best in the industry with margins declining to ~5% when margins of its peers dropped to the negative territory (down ~5% for Ashok Leyland and Tata Motors). VECV now has a strong distribution network comparable with incumbents – Tata Motors, Ashok Leyland. The VECV brand name has established itself among fleet owners while the launch of the new state-of the art Pro-series trucks would catalyse market share gains in the coming years. Going ahead, we build in improvement in margins from current levels to ~8.9% in FY17E, on the back of a better product mix and higher utilisation levels.
Exhibit 3: Royal Enfield growth trajectory
1,04
9
1,70
2 3,03
1
1,09
7
1,30
1
6,31
1
7,02
0
1,13
4
1,77
6 3,02
6
1,06
6
1,27
6
6,15
8
6,52
9
961
920
13.9
18.4
24.226.4 27.0 28.0
26.1 27.7
-
1,000
2,000
3,000
4,000
5,000
6,000
7,000
8,000
CY12 CY13 CY14 Q1FY16 Q2FY16 Q3FY16 FY16E FY17E
Reve
nue
(| c
rore
) / V
olum
e (1
00s)
-
5
10
15
20
25
30
(%)
Total Operating Income Volume ('100s) EBITDA Margin (%)
* Change in accounting year, FY16E is a 15 month period Source: Company press release, ICICIdirect.com Research
ICICI Securities Ltd | Retail Equity Research Page 6
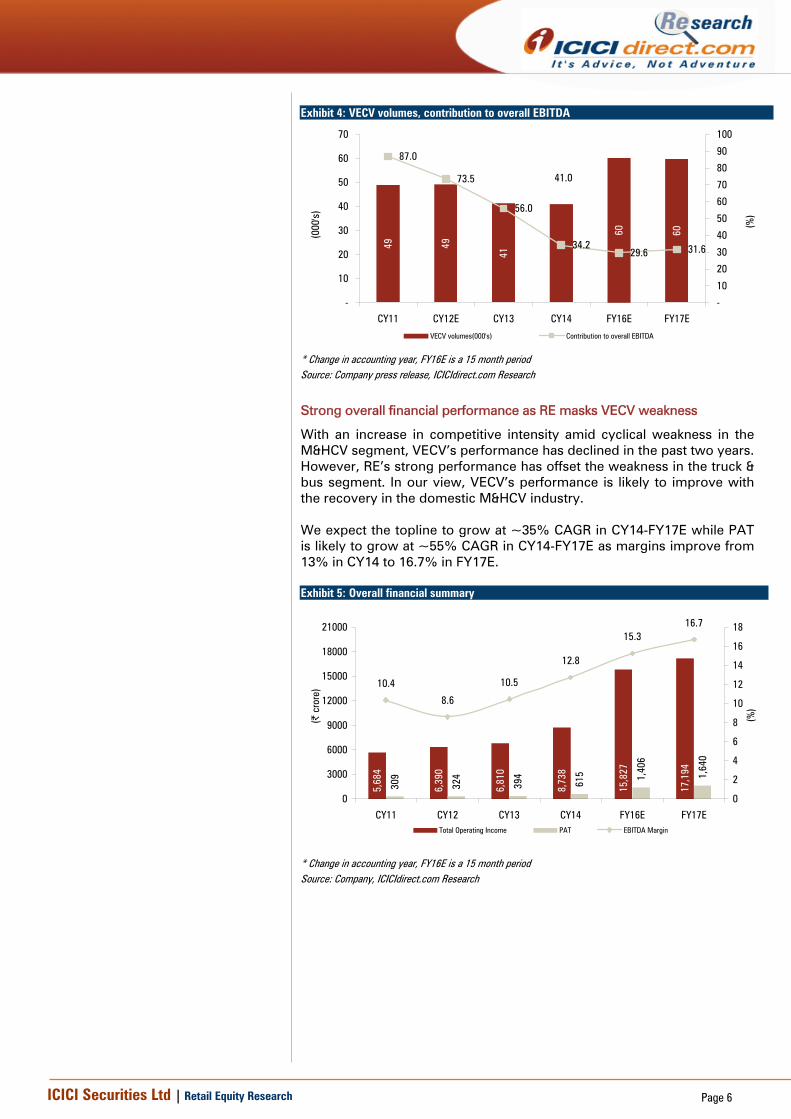
Strong overall financial performance as RE masks VECV weakness
With an increase in competitive intensity amid cyclical weakness in the M&HCV segment, VECV’s performance has declined in the past two years. However, RE’s strong performance has offset the weakness in the truck & bus segment. In our view, VECV’s performance is likely to improve with the recovery in the domestic M&HCV industry. We expect the topline to grow at ~35% CAGR in CY14-FY17E while PAT is likely to grow at ~55% CAGR in CY14-FY17E as margins improve from 13% in CY14 to 16.7% in FY17E. Exhibit 5: Overall financial summary
5,68
4
6,39
0
6,81
0
8,73
8
15,8
27
17,1
94
309
324
394
615 1,40
6
1,64
0
10.4
8.6
10.5
12.8
15.316.7
0
3000
6000
9000
12000
15000
18000
21000
CY11 CY12 CY13 CY14 FY16E FY17E
(| c
rore
)
0
2
4
6
8
10
12
14
16
18
(%)
Total Operating Income PAT EBITDA Margin
* Change in accounting year, FY16E is a 15 month period Source: Company, ICICIdirect.com Research
Exhibit 4: VECV volumes, contribution to overall EBITDA
49 49
41
60 60
41.0
87.0
73.5
56.0
34.229.6 31.6
-
10
20
30
40
50
60
70
CY11 CY12E CY13 CY14 FY16E FY17E(0
00's)
-
10
20
30
40
50
60
70
80
90
100
(%)
VECV volumes(000's) Contribution to overall EBITDA
* Change in accounting year, FY16E is a 15 month period Source: Company press release, ICICIdirect.com Research
ICICI Securities Ltd | Retail Equity Research Page 7
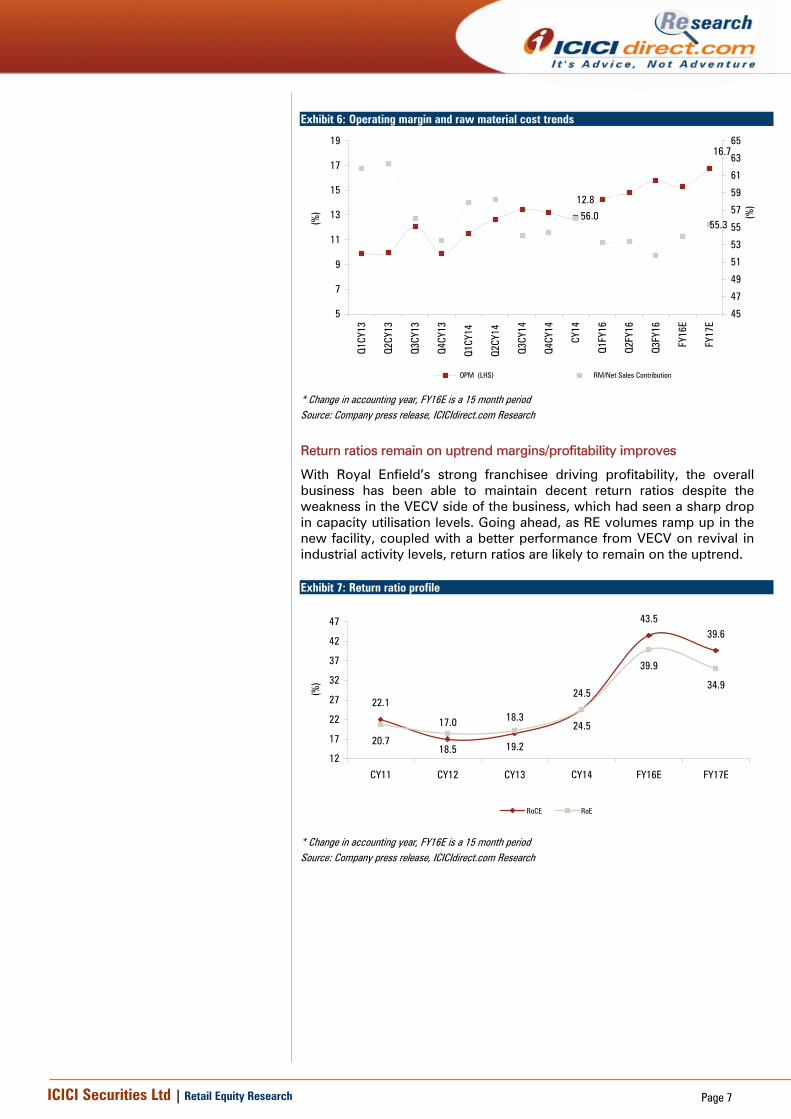
Return ratios remain on uptrend margins/profitability improves
With Royal Enfield’s strong franchisee driving profitability, the overall business has been able to maintain decent return ratios despite the weakness in the VECV side of the business, which had seen a sharp drop in capacity utilisation levels. Going ahead, as RE volumes ramp up in the new facility, coupled with a better performance from VECV on revival in industrial activity levels, return ratios are likely to remain on the uptrend.
Exhibit 6: Operating margin and raw material cost trends
12.8
16.7
56.055.3
5
7
9
11
13
15
17
19
Q1CY
13
Q2CY
13
Q3CY
13
Q4CY
13
Q1CY
14
Q2CY
14
Q3CY
14
Q4CY
14
CY14
Q1FY
16
Q2FY
16
Q3FY
16
FY16
E
FY17
E
(%)
45
47
49
51
53
55
57
59
61
63
65
(%)
OPM (LHS) RM/Net Sales Contribution
* Change in accounting year, FY16E is a 15 month period Source: Company press release, ICICIdirect.com Research
Exhibit 7: Return ratio profile
22.1
20.7
17.0 18.3
24.5
43.539.6
18.5 19.2
24.5
39.9
34.9
12
17
22
27
32
37
42
47
CY11 CY12 CY13 CY14 FY16E FY17E
(%)
RoCE RoE
* Change in accounting year, FY16E is a 15 month period Source: Company press release, ICICIdirect.com Research

ICICI Securities Ltd | Retail Equity Research Page 8
Outlook and valuation Eicher’s business performance has been strong with Royal Enfield seeming unfazed by the slowdown in the Indian economy. With Indians lapping up cruiser bikes from Royal Enfield and witnessing huge waiting periods, RE has now enhanced capacity and looks set to make hay as the proverbial sun continues to shine. We believe RE is set to trace a similar path to Harley-Davidson’s (HOG) high growth phase (1998-2003). During this period where topline, bottomline grew ~2.5x, ~3.5x with EBITDA margins expanding from ~19% to ~27% and RoEs improving from 23% to 29%, respectively, HOG’s average valuations were >30x on one-year forward basis/PEG for two-year forward averaged ~0.6x (1998-2003). Prior to this high growth phase, HOG was able to grow its topline only by 2x in the preceding 10 years and exploded in the next five years. All these valuations need to be digested with the mature market multiples the US market would typically enjoy. In case of RE, in the last five years, revenue growth was ~5x. However, till FY17E, we expect profitability to grow ~2.5x. We believe with similar financials panning out for RE, its valuations are likely to replicate HOG’s journey. Exhibit 8: Brief on Harley Davidson’s financials during the growth phase (mn USD) CY 95 CY 96 CY 97 CY 98 CY 99 CY 0 CY 01 CY 02 CY 03 CY 04Revenue 1350 1531 1763 2064 2453 3083 3588 4302 4904 5320Growth(%) 13 15 17 19 26 16 20 14 8EBITDA margins (%) 16.3 18.0 18.6 19.4 20.5 21.0 22.7 24.6 27.5 29.6Net Income 112 166 174 214 267 348 438 580 761 890Growth(%) 48 5 23 25 30 26 33 31 17ROE (%) 24 29 23 23 24 27 28 29 29 29PE-1year forward (x) 17 17 19 27 28 31 28 19 20 18PEG-2year forward (x) 0.4 1.0 0.6 0.6 0.6 0.6 0.7 0.6 0.9 0.7
Source: Company, ICICIdirect.com Research
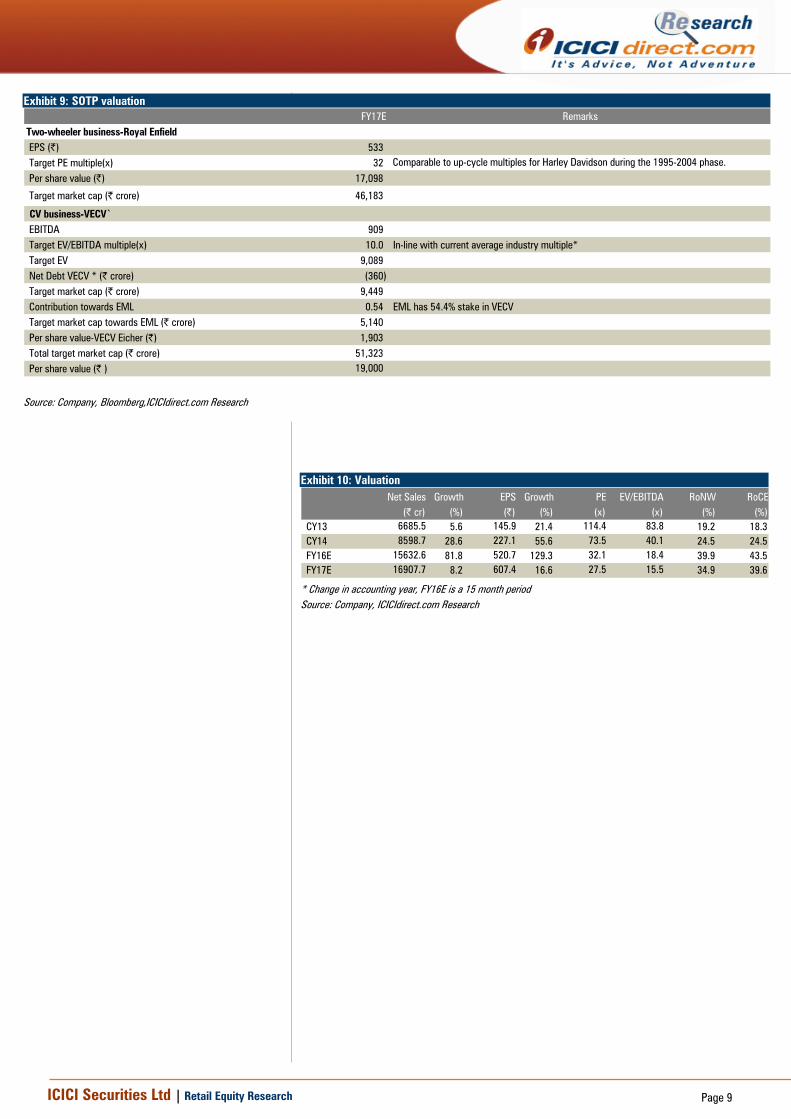
EML has justifiably commanded a premium over other auto OEs as RE’s business is on full throttle, VECV reaps benefits of the economic revival. We maintain peer valuation parameters (relative valuation vis-à-vis HOG’s high growth phase) and ascribe a higher multiple of 32xFY17E EPS for RE, VECV at 10x FY17E EV/EBITDA, respectively. Considering Royal Enfield caters to the second largest two-wheeler market in the world with dominant market share positioning and superior financials vis-à-vis HOG (during 1998-2003), we believe RE could trade at a premium to HOG’s multiple considering the mature market nature of developed economies. Furthermore, on the VECV front, we value it at domestic CV manufacturers average multiple at 10x FY17E EV/EBITDA, respectively, to arrive at an SOTP target price of | 19,000. We have a BUY recommendation on the stock.
ICICI Securities Ltd | Retail Equity Research Page 9
Exhibit 9: SOTP valuation FY17E Remarks
Two-wheeler business-Royal EnfieldEPS (|) 533 Target PE multiple(x) 32 Comparable to up-cycle multiples for Harley Davidson during the 1995-2004 phase.
Per share value (|) 17,098
Target market cap (| crore) 46,183
CV business-VECV`EBITDA 909 Target EV/EBITDA multiple(x) 10.0 In-line with current average industry multiple*Target EV 9,089 Net Debt VECV * (| crore) (360) Target market cap (| crore) 9,449 Contribution towards EML 0.54 EML has 54.4% stake in VECVTarget market cap towards EML (| crore) 5,140 Per share value-VECV Eicher (|) 1,903 Total target market cap (| crore) 51,323 Per share value (| ) 19,000
Source: Company, Bloomberg,ICICIdirect.com Research
Exhibit 10: Valuation
Net Sales Growth EPS Growth PE EV/EBITDA RoNW RoCE (| cr) (%) (|) (%) (x) (x) (%) (%)
CY13 6685.5 5.6 145.9 21.4 114.4 83.8 19.2 18.3CY14 8598.7 28.6 227.1 55.6 73.5 40.1 24.5 24.5FY16E 15632.6 81.8 520.7 129.3 32.1 18.4 39.9 43.5FY17E 16907.7 8.2 607.4 16.6 27.5 15.5 34.9 39.6
* Change in accounting year, FY16E is a 15 month period Source: Company, ICICIdirect.com Research
ICICI Securities Ltd | Retail Equity Research Page 10
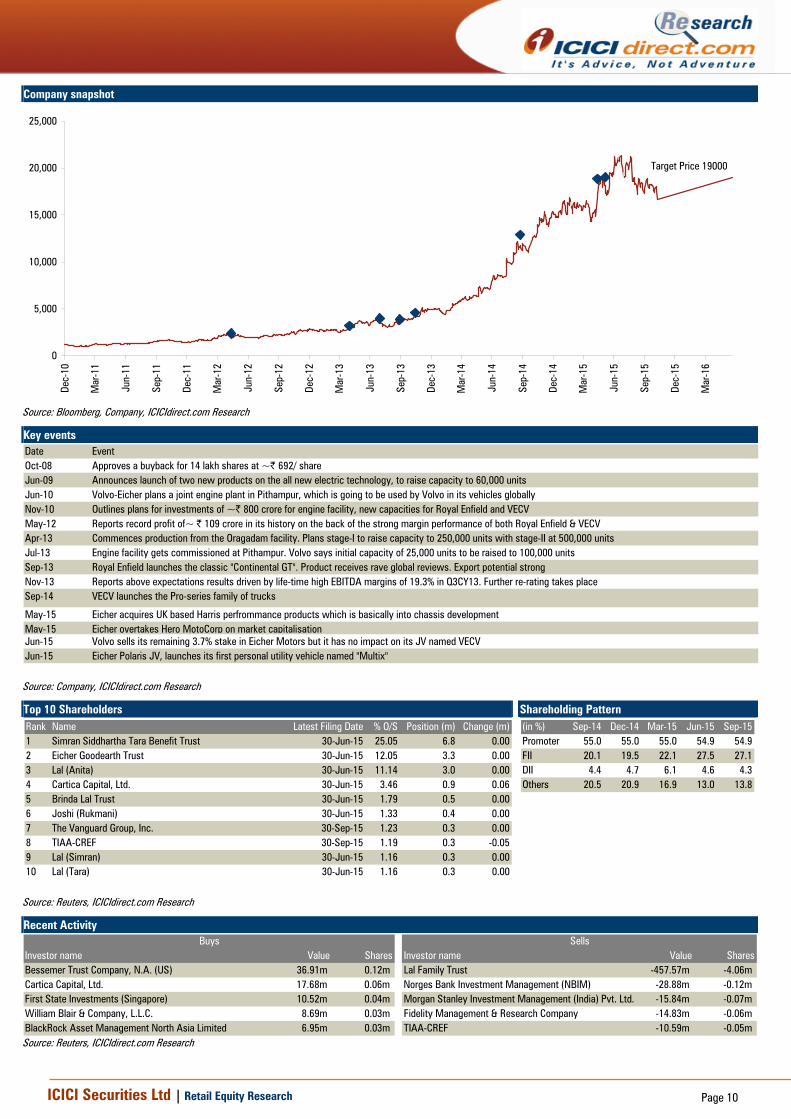
Company snapshot
Target Price 19000
0
5,000
10,000
15,000
20,000
25,000
Dec-
10
Mar
-11
Jun-
11
Sep-
11
Dec-
11
Mar
-12
Jun-
12
Sep-
12
Dec-
12
Mar
-13
Jun-
13
Sep-
13
Dec-
13
Mar
-14
Jun-
14
Sep-
14
Dec-
14
Mar
-15
Jun-
15
Sep-
15
Dec-
15
Mar
-16
Source: Bloomberg, Company, ICICIdirect.com Research
Key events Date EventOct-08 Approves a buyback for 14 lakh shares at ~| 692/ shareJun-09 Announces launch of two new products on the all new electric technology, to raise capacity to 60,000 unitsJun-10 Volvo-Eicher plans a joint engine plant in Pithampur, which is going to be used by Volvo in its vehicles globallyNov-10 Outlines plans for investments of ~| 800 crore for engine facility, new capacities for Royal Enfield and VECVMay-12 Reports record profit of~ | 109 crore in its history on the back of the strong margin performance of both Royal Enfield & VECVApr-13 Commences production from the Oragadam facility. Plans stage-I to raise capacity to 250,000 units with stage-II at 500,000 unitsJul-13 Engine facility gets commissioned at Pithampur. Volvo says initial capacity of 25,000 units to be raised to 100,000 unitsSep-13 Royal Enfield launches the classic "Continental GT". Product receives rave global reviews. Export potential strongNov-13 Reports above expectations results driven by life-time high EBITDA margins of 19.3% in Q3CY13. Further re-rating takes placeSep-14 VECV launches the Pro-series family of trucks
May-15 Eicher acquires UK based Harris perfrommance products which is basically into chassis developmentMay-15 Eicher overtakes Hero MotoCorp on market capitalisationJun-15 Volvo sells its remaining 3.7% stake in Eicher Motors but it has no impact on its JV named VECVJun-15 Eicher Polaris JV, launches its first personal utility vehicle named "Multix"
Source: Company, ICICIdirect.com Research
Top 10 Shareholders Shareholding Pattern Rank Name Latest Filing Date % O/S Position (m) Change (m)1 Simran Siddhartha Tara Benefit Trust 30-Jun-15 25.05 6.8 0.002 Eicher Goodearth Trust 30-Jun-15 12.05 3.3 0.003 Lal (Anita) 30-Jun-15 11.14 3.0 0.004 Cartica Capital, Ltd. 30-Jun-15 3.46 0.9 0.065 Brinda Lal Trust 30-Jun-15 1.79 0.5 0.006 Joshi (Rukmani) 30-Jun-15 1.33 0.4 0.007 The Vanguard Group, Inc. 30-Sep-15 1.23 0.3 0.008 TIAA-CREF 30-Sep-15 1.19 0.3 -0.059 Lal (Simran) 30-Jun-15 1.16 0.3 0.0010 Lal (Tara) 30-Jun-15 1.16 0.3 0.00
(in %) Sep-14 Dec-14 Mar-15 Jun-15 Sep-15Promoter 55.0 55.0 55.0 54.9 54.9FII 20.1 19.5 22.1 27.5 27.1DII 4.4 4.7 6.1 4.6 4.3Others 20.5 20.9 16.9 13.0 13.8
Source: Reuters, ICICIdirect.com Research
Recent Activity
Investor name Value Shares Investor name Value SharesBessemer Trust Company, N.A. (US) 36.91m 0.12m Lal Family Trust -457.57m -4.06m Cartica Capital, Ltd. 17.68m 0.06m Norges Bank Investment Management (NBIM) -28.88m -0.12m First State Investments (Singapore) 10.52m 0.04m Morgan Stanley Investment Management (India) Pvt. Ltd. -15.84m -0.07m William Blair & Company, L.L.C. 8.69m 0.03m Fidelity Management & Research Company -14.83m -0.06m BlackRock Asset Management North Asia Limited 6.95m 0.03m TIAA-CREF -10.59m -0.05m
Buys Sells
Source: Reuters, ICICIdirect.com Research
ICICI Securities Ltd | Retail Equity Research Page 11
.
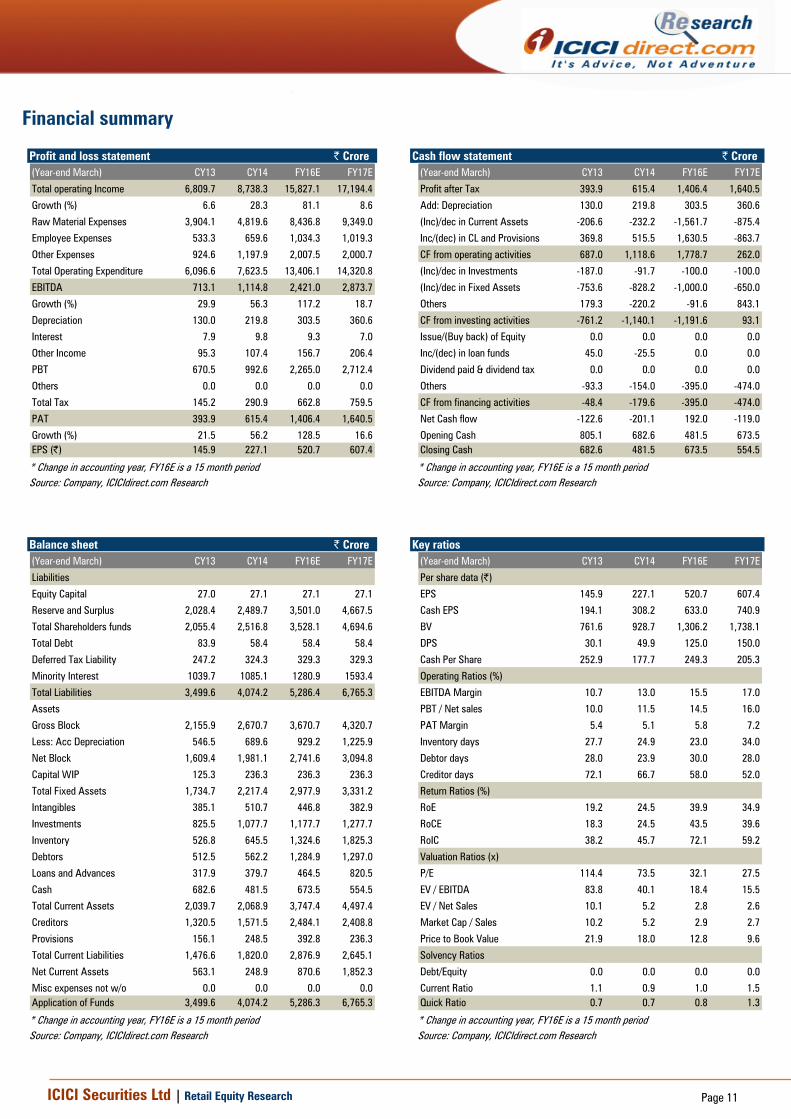
Financial summary
Profit and loss statement | Crore (Year-end March) CY13 CY14 FY16E FY17E
Total operating Income 6,809.7 8,738.3 15,827.1 17,194.4
Growth (%) 6.6 28.3 81.1 8.6
Raw Material Expenses 3,904.1 4,819.6 8,436.8 9,349.0
Employee Expenses 533.3 659.6 1,034.3 1,019.3
Other Expenses 924.6 1,197.9 2,007.5 2,000.7
Total Operating Expenditure 6,096.6 7,623.5 13,406.1 14,320.8
EBITDA 713.1 1,114.8 2,421.0 2,873.7
Growth (%) 29.9 56.3 117.2 18.7
Depreciation 130.0 219.8 303.5 360.6
Interest 7.9 9.8 9.3 7.0
Other Income 95.3 107.4 156.7 206.4
PBT 670.5 992.6 2,265.0 2,712.4
Others 0.0 0.0 0.0 0.0
Total Tax 145.2 290.9 662.8 759.5
PAT 393.9 615.4 1,406.4 1,640.5
Growth (%) 21.5 56.2 128.5 16.6EPS (|) 145.9 227.1 520.7 607.4
* Change in accounting year, FY16E is a 15 month period Source: Company, ICICIdirect.com Research
Cash flow statement | Crore(Year-end March) CY13 CY14 FY16E FY17E
Profit after Tax 393.9 615.4 1,406.4 1,640.5
Add: Depreciation 130.0 219.8 303.5 360.6
(Inc)/dec in Current Assets -206.6 -232.2 -1,561.7 -875.4
Inc/(dec) in CL and Provisions 369.8 515.5 1,630.5 -863.7
CF from operating activities 687.0 1,118.6 1,778.7 262.0
(Inc)/dec in Investments -187.0 -91.7 -100.0 -100.0
(Inc)/dec in Fixed Assets -753.6 -828.2 -1,000.0 -650.0
Others 179.3 -220.2 -91.6 843.1
CF from investing activities -761.2 -1,140.1 -1,191.6 93.1
Issue/(Buy back) of Equity 0.0 0.0 0.0 0.0
Inc/(dec) in loan funds 45.0 -25.5 0.0 0.0
Dividend paid & dividend tax 0.0 0.0 0.0 0.0
Others -93.3 -154.0 -395.0 -474.0
CF from financing activities -48.4 -179.6 -395.0 -474.0
Net Cash flow -122.6 -201.1 192.0 -119.0
Opening Cash 805.1 682.6 481.5 673.5Closing Cash 682.6 481.5 673.5 554.5
* Change in accounting year, FY16E is a 15 month period Source: Company, ICICIdirect.com Research
Balance sheet | Crore (Year-end March) CY13 CY14 FY16E FY17E
Liabilities
Equity Capital 27.0 27.1 27.1 27.1
Reserve and Surplus 2,028.4 2,489.7 3,501.0 4,667.5
Total Shareholders funds 2,055.4 2,516.8 3,528.1 4,694.6
Total Debt 83.9 58.4 58.4 58.4
Deferred Tax Liability 247.2 324.3 329.3 329.3
Minority Interest 1039.7 1085.1 1280.9 1593.4
Total Liabilities 3,499.6 4,074.2 5,286.4 6,765.3
Assets
Gross Block 2,155.9 2,670.7 3,670.7 4,320.7
Less: Acc Depreciation 546.5 689.6 929.2 1,225.9
Net Block 1,609.4 1,981.1 2,741.6 3,094.8
Capital WIP 125.3 236.3 236.3 236.3
Total Fixed Assets 1,734.7 2,217.4 2,977.9 3,331.2
Intangibles 385.1 510.7 446.8 382.9
Investments 825.5 1,077.7 1,177.7 1,277.7
Inventory 526.8 645.5 1,324.6 1,825.3
Debtors 512.5 562.2 1,284.9 1,297.0
Loans and Advances 317.9 379.7 464.5 820.5
Cash 682.6 481.5 673.5 554.5
Total Current Assets 2,039.7 2,068.9 3,747.4 4,497.4
Creditors 1,320.5 1,571.5 2,484.1 2,408.8
Provisions 156.1 248.5 392.8 236.3
Total Current Liabilities 1,476.6 1,820.0 2,876.9 2,645.1
Net Current Assets 563.1 248.9 870.6 1,852.3
Misc expenses not w/o 0.0 0.0 0.0 0.0Application of Funds 3,499.6 4,074.2 5,286.3 6,765.3
* Change in accounting year, FY16E is a 15 month period Source: Company, ICICIdirect.com Research
Key ratios (Year-end March) CY13 CY14 FY16E FY17E
Per share data (|)
EPS 145.9 227.1 520.7 607.4
Cash EPS 194.1 308.2 633.0 740.9
BV 761.6 928.7 1,306.2 1,738.1
DPS 30.1 49.9 125.0 150.0
Cash Per Share 252.9 177.7 249.3 205.3
Operating Ratios (%)
EBITDA Margin 10.7 13.0 15.5 17.0
PBT / Net sales 10.0 11.5 14.5 16.0
PAT Margin 5.4 5.1 5.8 7.2
Inventory days 27.7 24.9 23.0 34.0
Debtor days 28.0 23.9 30.0 28.0
Creditor days 72.1 66.7 58.0 52.0
Return Ratios (%)
RoE 19.2 24.5 39.9 34.9
RoCE 18.3 24.5 43.5 39.6
RoIC 38.2 45.7 72.1 59.2
Valuation Ratios (x)
P/E 114.4 73.5 32.1 27.5
EV / EBITDA 83.8 40.1 18.4 15.5
EV / Net Sales 10.1 5.2 2.8 2.6
Market Cap / Sales 10.2 5.2 2.9 2.7
Price to Book Value 21.9 18.0 12.8 9.6
Solvency Ratios
Debt/Equity 0.0 0.0 0.0 0.0
Current Ratio 1.1 0.9 1.0 1.5Quick Ratio 0.7 0.7 0.8 1.3
* Change in accounting year, FY16E is a 15 month period Source: Company, ICICIdirect.com Research

ICICI Securities Ltd | Retail Equity Research Page 12
ICICIdirect.com coverage universe (Auto & Auto Ancillary) CMP M Cap(|) TP(|) Rating (| Cr) FY15E FY16E FY17E FY15E FY16E FY17E FY15E FY16E FY17E FY15E FY16E FY17E FY15E FY16E FY17E
Amara Raja (AMARAJ) 888 1000 Buy 15166 24.1 29.8 39.5 36.9 29.8 22.5 21.6 18.1 13.7 34.3 32.2 34.0 25.6 24.1 25.4Apollo Tyre (APOTYR) 159 200 Buy 8010 19.0 20.6 20.5 8.4 7.7 7.7 4.5 4.7 4.9 26.0 23.1 18.9 18.9 17.9 15.5Ashok Leyland (ASHLEY) 88 90 Hold 24747 1.2 3.5 5.0 74.5 25.1 17.5 26.4 12.7 10.2 7.2 18.3 23.0 6.5 17.2 21.0Bajaj Auto (BAAUTO) 2429 2910 Buy 70301 97.2 129.9 165.3 25.0 18.7 14.7 16.0 12.7 10.1 35.6 38.4 41.1 26.3 31.1 33.8Balkrishna Ind. (BALIND) 668 720 Hold 6453 50.6 55.7 58.5 13.5 12.3 11.7 8.2 7.7 6.6 17.8 17.7 19.0 21.3 17.8 17.7Bharat Forge (BHAFOR) 866 970 Buy 20188 32.8 40.1 46.9 26.4 21.6 18.5 14.8 12.6 10.9 18.6 22.3 25.1 22.2 24.2 23.7Bosch (MICO) 19365 22500 Buy 60807 426.0 414.0 546.7 45.5 46.8 35.4 29.6 30.7 24.8 18.2 15.6 17.8 19.4 18.0 19.5Eicher Motors (EICMOT) 16693 19000 Hold 45089 227.1 520.7 607.4 73.5 32.1 27.5 40.1 18.4 15.5 24.5 43.5 39.6 24.5 39.9 34.9Escorts (ESCORT) 154 152 Hold 1840 6.7 10.6 26.0 24.9 15.6 6.4 13.3 10.3 4.1 4.5 5.7 14.0 4.4 6.3 13.6Exide Industries (EXIIND) 143 175 Buy 12151 6.4 7.2 8.7 22.3 19.8 16.4 14.4 12.4 10.5 18.9 19.7 21.3 13.5 13.9 15.1Hero Mototcorp (HERHON) 2640 2625 Hold 52718 119.5 155.9 175.0 22.1 16.9 15.1 0.0 0.0 0.0 45.9 48.5 45.3 36.5 39.1 36.9JK Tyre & Ind (JKIND) 93 130 Buy 2110 14.5 22.6 24.7 6.4 4.1 3.8 5.2 3.8 3.5 18.7 23.5 22.7 23.3 27.5 23.5M&M (MAHMAH) 1250 1525 Buy 73763 50.7 61.6 78.8 24.6 20.3 15.9 18.0 11.5 9.0 14.5 17.0 19.9 17.1 16.5 18.2Mahindra CIE (MAHAUT) 249 300 Buy 8054 -2.4 8.8 13.1 NA 28.2 19.0 22.7 13.5 10.8 -4.1 12.3 16.9 5.9 11.5 15.9Maruti Suzuki (MARUTI) 4523 5090 Buy 136679 122.9 178.3 231.5 36.8 25.4 19.5 20.1 14.2 11.4 17.2 23.6 24.5 15.6 19.3 20.9Motherson (MOTSUM) 266 347 Hold 35218 6.5 10.7 18.8 40.8 24.8 14.1 15.1 12.4 8.2 24.7 27.9 38.7 25.9 34.5 46.0Tata Motors (TELCO) 396 480 Buy 121051 41.2 40.5 52.5 8.5 8.7 6.7 3.4 3.3 2.6 22.8 14.8 16.3 24.9 13.8 15.2Wabco India (WABTVS) 6658 6080 Hold 12649 63.6 114.8 168.9 104.7 58.0 39.4 57.2 37.2 26.4 14.0 20.5 23.5 18.2 24.4 27.8
Sector / CompanyRoE (%)EPS (|) P/E (x) EV/EBITDA (x) RoCE (%)
Source: Company, ICICIdirect.com Research
ICICI Securities Ltd | Retail Equity Research Page 13
RATING RATIONALE ICICIdirect.com endeavours to provide objective opinions and recommendations. ICICIdirect.com assigns ratings to its stocks according to their notional target price vs. current market price and then categorises them as Strong Buy, Buy, Hold and Sell. The performance horizon is two years unless specified and the notional target price is defined as the analysts' valuation for a stock. Strong Buy: >15%/20% for large caps/midcaps, respectively, with high conviction; Buy: >10%/15% for large caps/midcaps, respectively; Hold: Up to +/-10%; Sell: -10% or more;
Pankaj Pandey Head – Research [email protected]
ICICIdirect.com Research Desk, ICICI Securities Limited, 1st Floor, Akruti Trade Centre, Road No 7, MIDC, Andheri (East) Mumbai – 400 093
ICICI Securities Ltd | Retail Equity Research Page 14
ANALYST CERTIFICATION We /I, Nishit Zota, MBA & Vidrum Mehta, MBA research analysts, authors and the names subscribed to this report, hereby certify that all of the views expressed in this research report accurately reflect our views about the subject issuer(s) or securities. We also certify that no part of our compensation was, is, or will be directly or indirectly related to the specific recommendation(s) or view(s) in this report.
Terms & conditions and other disclosures: ICICI Securities Limited is a Sebi registered Research Analyst having registration no. INH000000990.ICICI Securities Limited (ICICI Securities) is a full-service, integrated investment banking and is, inter alia, engaged in the business of stock brokering and distribution of financial products. ICICI Securities is a wholly-owned subsidiary of ICICI Bank which is India’s largest private sector bank and has its various subsidiaries engaged in businesses of housing finance, asset management, life insurance, general insurance, venture capital fund management, etc. (“associates”), the details in respect of which are available on www.icicibank.com. ICICI Securities is one of the leading merchant bankers/ underwriters of securities and participate in virtually all securities trading markets in India. We and our associates might have investment banking and other business relationship with a significant percentage of companies covered by our Investment Research Department. ICICI Securities generally prohibits its analysts, persons reporting to analysts and their relatives from maintaining a financial interest in the securities or derivatives of any companies that the analysts cover. The information and opinions in this report have been prepared by ICICI Securities and are subject to change without any notice. The report and information contained herein is strictly confidential and meant solely for the selected recipient and may not be altered in any way, transmitted to, copied or distributed, in part or in whole, to any other person or to the media or reproduced in any form, without prior written consent of ICICI Securities. While we would endeavour to update the information herein on a reasonable basis, ICICI Securities is under no obligation to update or keep the information current. Also, there may be regulatory, compliance or other reasons that may prevent ICICI Securities from doing so. Non-rated securities indicate that rating on a particular security has been suspended temporarily and such suspension is in compliance with applicable regulations and/or ICICI Securities policies, in circumstances where ICICI Securities might be acting in an advisory capacity to this company, or in certain other circumstances. This report is based on information obtained from public sources and sources believed to be reliable, but no independent verification has been made nor is its accuracy or completeness guaranteed. This report and information herein is solely for informational purpose and shall not be used or considered as an offer document or solicitation of offer to buy or sell or subscribe for securities or other financial instruments. Though disseminated to all the customers simultaneously, not all customers may receive this report at the same time. ICICI Securities will not treat recipients as customers by virtue of their receiving this report. Nothing in this report constitutes investment, legal, accounting and tax advice or a representation that any investment or strategy is suitable or appropriate to your specific circumstances. The securities discussed and opinions expressed in this report may not be suitable for all investors, who must make their own investment decisions, based on their own investment objectives, financial positions and needs of specific recipient. This may not be taken in substitution for the exercise of independent judgment by any recipient. The recipient should independently evaluate the investment risks. The value and return on investment may vary because of changes in interest rates, foreign exchange rates or any other reason. ICICI Securities accepts no liabilities whatsoever for any loss or damage of any kind arising out of the use of this report. Past performance is not necessarily a guide to future performance. Investors are advised to see Risk Disclosure Document to understand the risks associated before investing in the securities markets. Actual results may differ materially from those set forth in projections. Forward-looking statements are not predictions and may be subject to change without notice. ICICI Securities or its associates might have managed or co-managed public offering of securities for the subject company or might have been mandated by the subject company for any other assignment in the past twelve months. ICICI Securities or its associates might have received any compensation from the companies mentioned in the report during the period preceding twelve months from the date of this report for services in respect of managing or co-managing public offerings, corporate finance, investment banking or merchant banking, brokerage services or other advisory service in a merger or specific transaction. ICICI Securities or its associates might have received any compensation for products or services other than investment banking or merchant banking or brokerage services from the companies mentioned in the report in the past twelve months. ICICI Securities encourages independence in research report preparation and strives to minimize conflict in preparation of research report. ICICI Securities or its analysts did not receive any compensation or other benefits from the companies mentioned in the report or third party in connection with preparation of the research report. Accordingly, neither ICICI Securities nor Research Analysts have any material conflict of interest at the time of publication of this report. It is confirmed that Nishit Zota, MBA & Vidrum Mehta, MBA research analysts of this report have not received any compensation from the companies mentioned in the report in the preceding twelve months. Compensation of our Research Analyst is not based on any specific merchant banking, investment banking or brokerage service transactions. ICICI Securities or its subsidiaries collectively or Research Analysts do not own 1% or more of the equity securities of the Company mentioned in the report as of the last day of the month preceding the publication of the research report. Since associates of ICICI Securities are engaged in various financial service businesses, they might have financial interests or beneficial ownership in various companies including the subject company/companies mentioned in this report. It is confirmed that Nishit Zota, MBA & Vidrum Mehta, MBA research analysts do not serve as an officer, director or employee of the companies mentioned in the report. ICICI Securities may have issued other reports that are inconsistent with and reach different conclusion from the information presented in this report. Neither the Research Analyst nor ICICI Securities have been engaged in market making activity for the companies mentioned in the report. We submit that no material disciplinary action has been taken on ICICI Securities by any Regulatory Authority impacting Equity Research Analysis activities. This report is not directed or intended for distribution to, or use by, any person or entity who is a citizen or resident of or located in any locality, state, country or other jurisdiction, where such distribution, publication, availability or use would be contrary to law, regulation or which would subject ICICI Securities and affiliates to any registration or licensing requirement within such jurisdiction. The securities described herein may or may not be eligible for sale in all jurisdictions or to certain category of investors. Persons in whose possession this document may come are required to inform themselves of and to observe such restriction.