quarterly financial report - q2 2017 - city of vancouver … · quarterly financial report ... the...
TRANSCRIPT
"A colorful past, a bright future"
Quarterly Financial Report
Second Quarter 2017
Second Quarter 2017 Financial Report City of Vancouver 1
Second Quarter 2017 Financial Report (This report contains un-audited financial information as of May 17, 2017)
Table of Contents
Section Page
I. Executive Summary 3 II. Economic Report 4 III. Financial Results 13 IV. Outstanding Debt 26 V. Investments 26 VI. Interfund Loans 29
Attachments
A Expenditure Summary by Fund 30 B Revenue Summary by Fund 32 C Investment Portfolio Tables 34 D Outstanding Debt 38
- - - - - For additional information on the City’s financial performance please contact Natasha Ramras in the City’s Financial & Management Services Department at 360-487-8484.
Second Quarter 2017 Financial Report City of Vancouver 2
I. Executive Summary
The national economy continued to grow through the second quarter of 2017 at a pace of 2.6%, according to the “advance” estimate published by the Bureau of Economic Analysis. In the first quarter, real GDP increased 1.2%. The most recent data indicates that the increase was mostly due to increases in personal consumption expenditures, nonresidential fixed investment, exports and federal government spending that were partially offset by negative contributions from private residential fixed investment, private inventory investment and state and local government spending. The national unemployment rate fell to 4.4% in June of 2017.
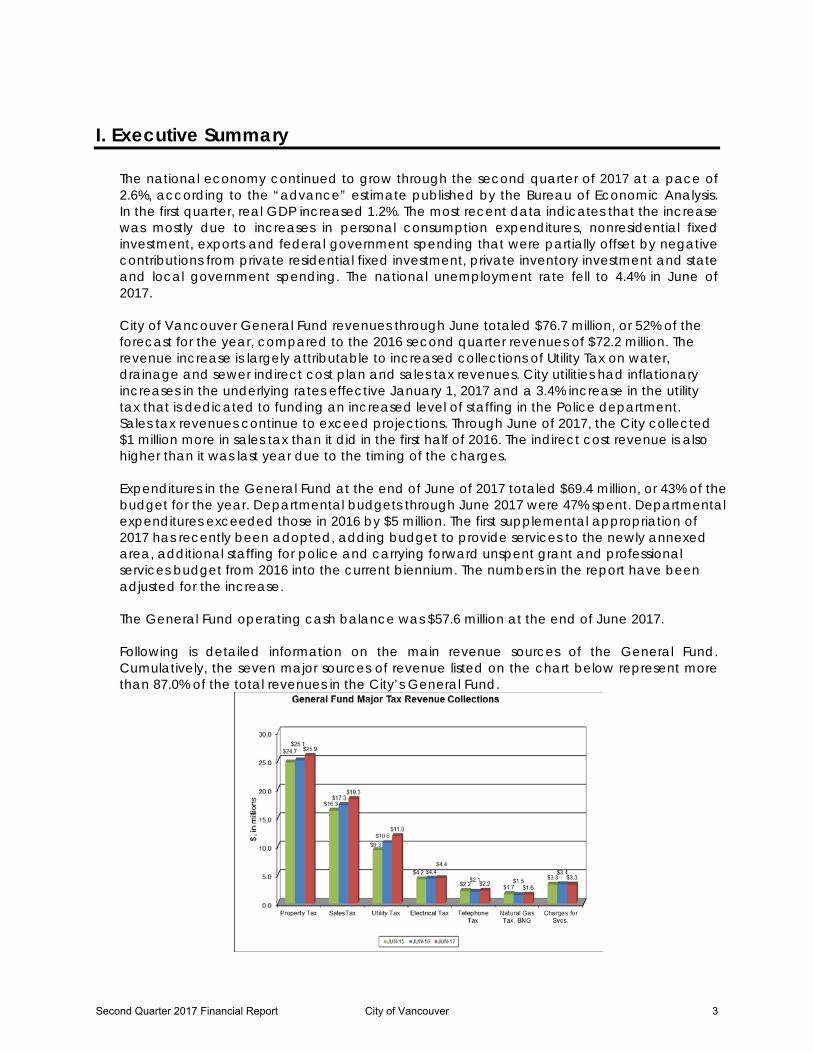
City of Vancouver General Fund revenues through June totaled $76.7 million, or 52% of the forecast for the year, compared to the 2016 second quarter revenues of $72.2 million. The revenue increase is largely attributable to increased collections of Utility Tax on water, drainage and sewer indirect cost plan and sales tax revenues. City utilities had inflationary increases in the underlying rates effective January 1, 2017 and a 3.4% increase in the utility tax that is dedicated to funding an increased level of staffing in the Police department. Sales tax revenues continue to exceed projections. Through June of 2017, the City collected $1 million more in sales tax than it did in the first half of 2016. The indirect cost revenue is also higher than it was last year due to the timing of the charges. Expenditures in the General Fund at the end of June of 2017 totaled $69.4 million, or 43% of the budget for the year. Departmental budgets through June 2017 were 47% spent. Departmental expenditures exceeded those in 2016 by $5 million. The first supplemental appropriation of 2017 has recently been adopted, adding budget to provide services to the newly annexed area, additional staffing for police and carrying forward unspent grant and professional services budget from 2016 into the current biennium. The numbers in the report have been adjusted for the increase. The General Fund operating cash balance was $57.6 million at the end of June 2017. Following is detailed information on the main revenue sources of the General Fund. Cumulatively, the seven major sources of revenue listed on the chart below represent more than 87.0% of the total revenues in the City’s General Fund.
Second Quarter 2017 Financial Report City of Vancouver 3
Note: Utility tax revenue above includes the tax on Solid Waste, Charges for Services exclude the Business License revenue.
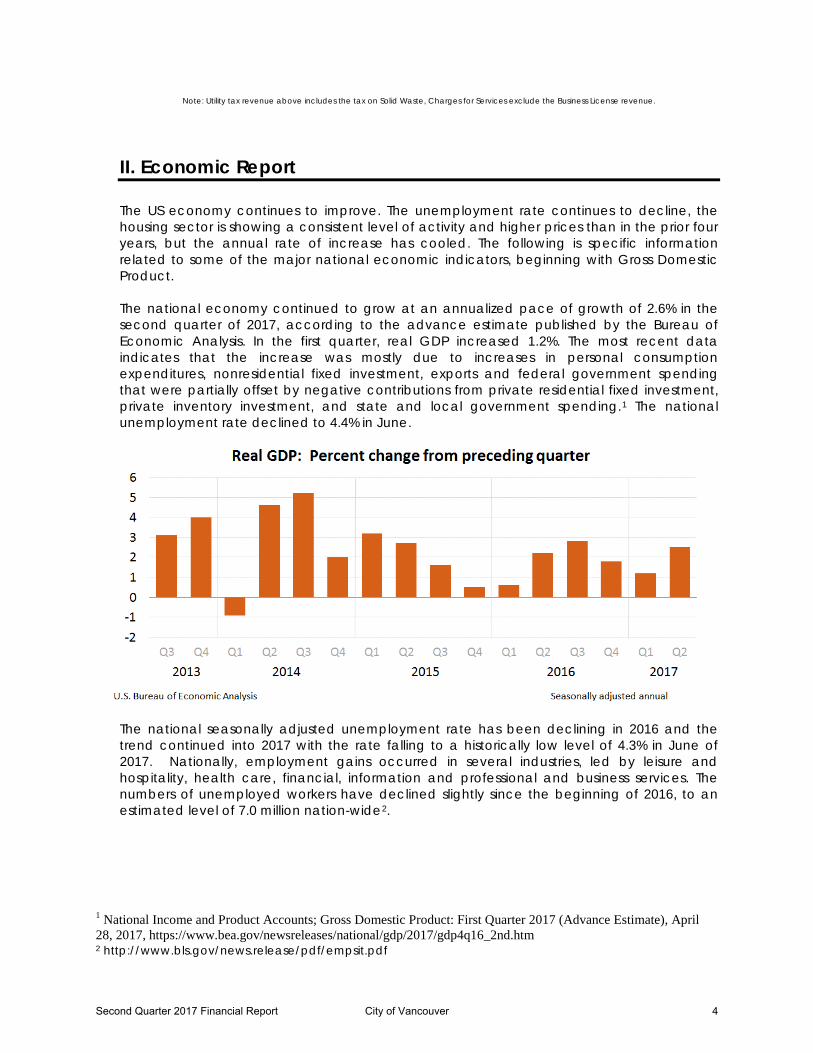
II. Economic Report The US economy continues to improve. The unemployment rate continues to decline, the housing sector is showing a consistent level of activity and higher prices than in the prior four years, but the annual rate of increase has cooled. The following is specific information related to some of the major national economic indicators, beginning with Gross Domestic Product. The national economy continued to grow at an annualized pace of growth of 2.6% in the second quarter of 2017, according to the advance estimate published by the Bureau of Economic Analysis. In the first quarter, real GDP increased 1.2%. The most recent data indicates that the increase was mostly due to increases in personal consumption expenditures, nonresidential fixed investment, exports and federal government spending that were partially offset by negative contributions from private residential fixed investment, private inventory investment, and state and local government spending.1 The national unemployment rate declined to 4.4% in June.
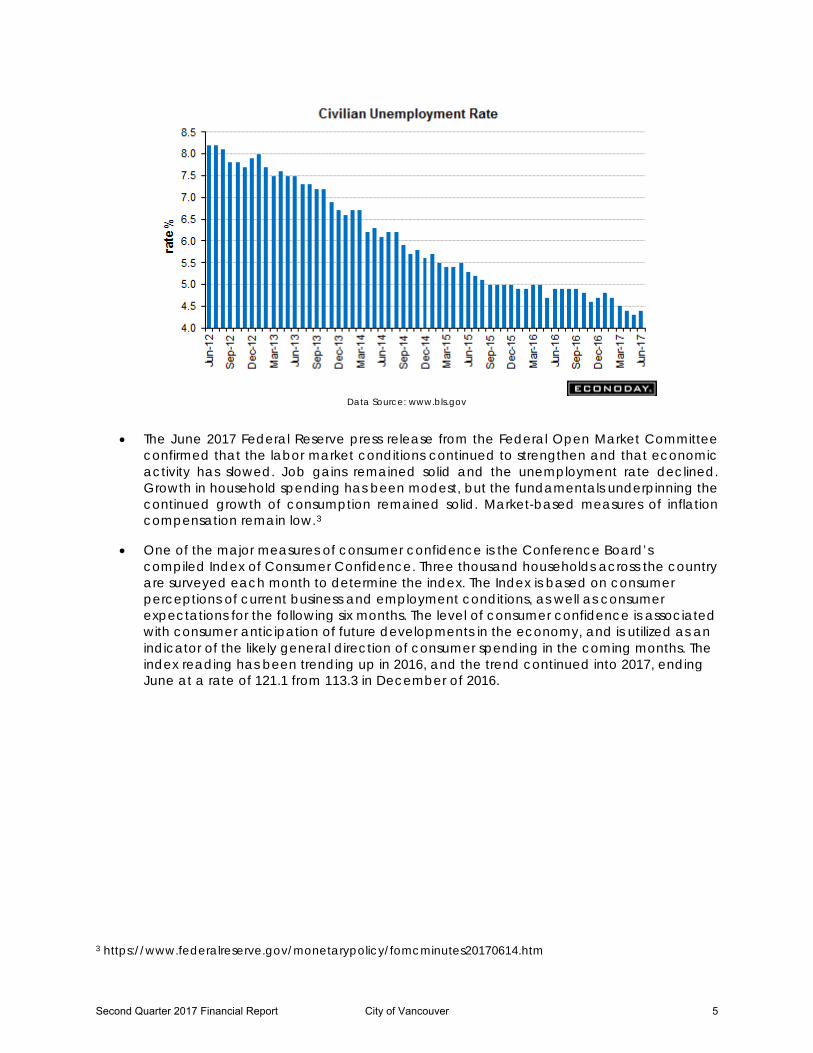
The national seasonally adjusted unemployment rate has been declining in 2016 and the trend continued into 2017 with the rate falling to a historically low level of 4.3% in June of 2017. Nationally, employment gains occurred in several industries, led by leisure and hospitality, health care, financial, information and professional and business services. The numbers of unemployed workers have declined slightly since the beginning of 2016, to an estimated level of 7.0 million nation-wide2.
1 National Income and Product Accounts; Gross Domestic Product: First Quarter 2017 (Advance Estimate), April 28, 2017, https://www.bea.gov/newsreleases/national/gdp/2017/gdp4q16_2nd.htm 2 http://www.bls.gov/news.release/pdf/empsit.pdf
Second Quarter 2017 Financial Report City of Vancouver 4
Data Source: www.bls.gov
• The June 2017 Federal Reserve press release from the Federal Open Market Committee confirmed that the labor market conditions continued to strengthen and that economic activity has slowed. Job gains remained solid and the unemployment rate declined. Growth in household spending has been modest, but the fundamentals underpinning the continued growth of consumption remained solid. Market-based measures of inflation compensation remain low.3
• One of the major measures of consumer confidence is the Conference Board’s compiled Index of Consumer Confidence. Three thousand households across the country are surveyed each month to determine the index. The Index is based on consumer perceptions of current business and employment conditions, as well as consumer expectations for the following six months. The level of consumer confidence is associated with consumer anticipation of future developments in the economy, and is utilized as an indicator of the likely general direction of consumer spending in the coming months. The index reading has been trending up in 2016, and the trend continued into 2017, ending June at a rate of 121.1 from 113.3 in December of 2016.
3 https://www.federalreserve.gov/monetarypolicy/fomcminutes20170614.htm
Second Quarter 2017 Financial Report City of Vancouver 5
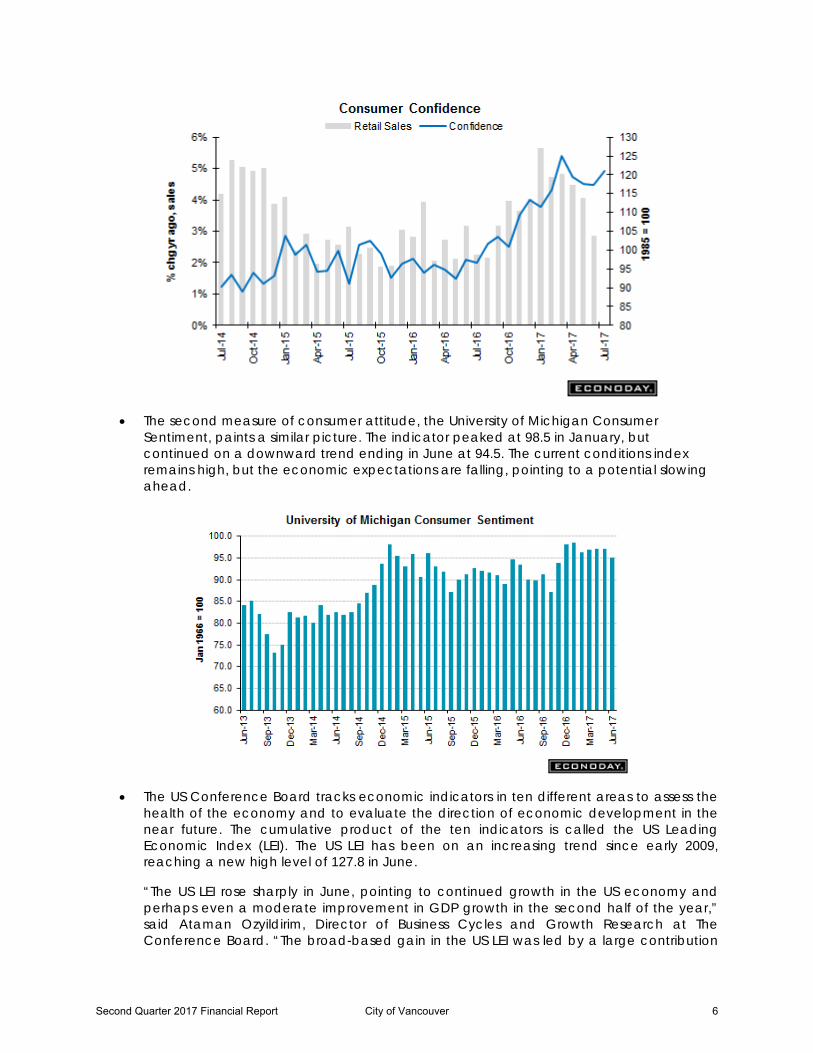
• The second measure of consumer attitude, the University of Michigan Consumer Sentiment, paints a similar picture. The indicator peaked at 98.5 in January, but continued on a downward trend ending in June at 94.5. The current conditions index remains high, but the economic expectations are falling, pointing to a potential slowing ahead.
• The US Conference Board tracks economic indicators in ten different areas to assess the health of the economy and to evaluate the direction of economic development in the near future. The cumulative product of the ten indicators is called the US Leading Economic Index (LEI). The US LEI has been on an increasing trend since early 2009, reaching a new high level of 127.8 in June.
“The US LEI rose sharply in June, pointing to continued growth in the US economy and perhaps even a moderate improvement in GDP growth in the second half of the year,” said Ataman Ozyildirim, Director of Business Cycles and Growth Research at The Conference Board. “The broad-based gain in the US LEI was led by a large contribution
Second Quarter 2017 Financial Report City of Vancouver 6
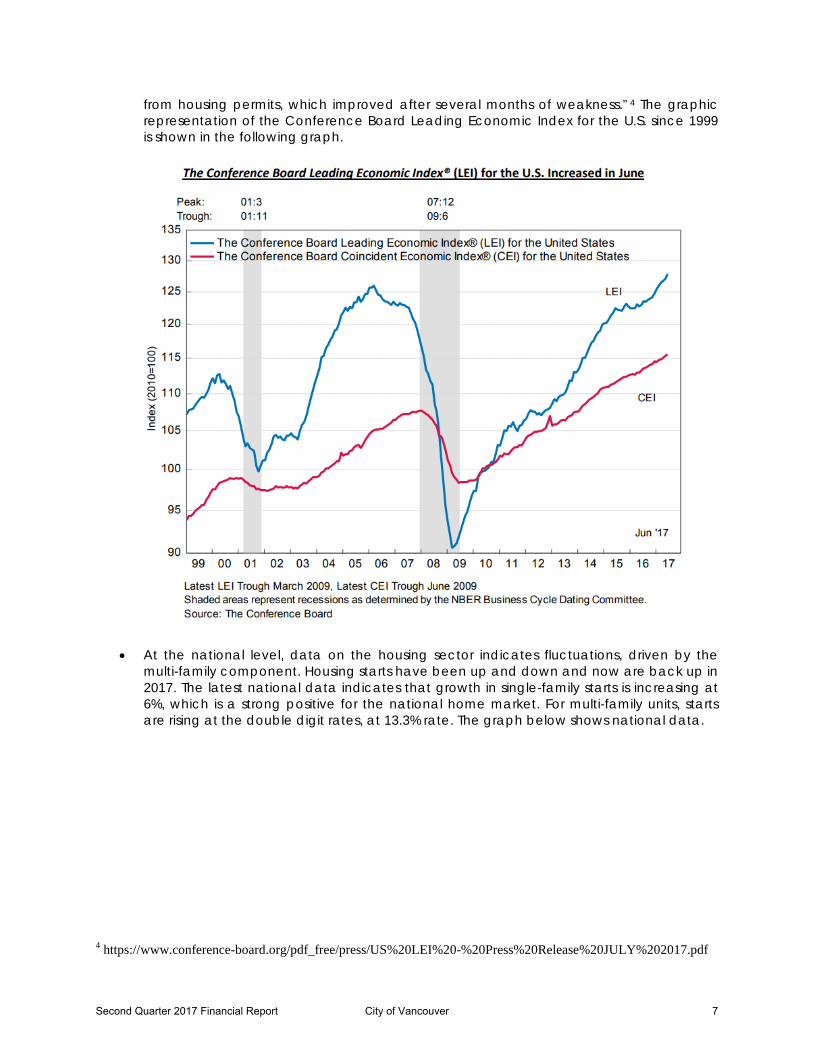
from housing permits, which improved after several months of weakness.”4 The graphic representation of the Conference Board Leading Economic Index for the U.S. since 1999 is shown in the following graph.
• At the national level, data on the housing sector indicates fluctuations, driven by the multi-family component. Housing starts have been up and down and now are back up in 2017. The latest national data indicates that growth in single-family starts is increasing at 6%, which is a strong positive for the national home market. For multi-family units, starts are rising at the double digit rates, at 13.3% rate. The graph below shows national data.
4 https://www.conference-board.org/pdf_free/press/US%20LEI%20-%20Press%20Release%20JULY%202017.pdf
Second Quarter 2017 Financial Report City of Vancouver 7
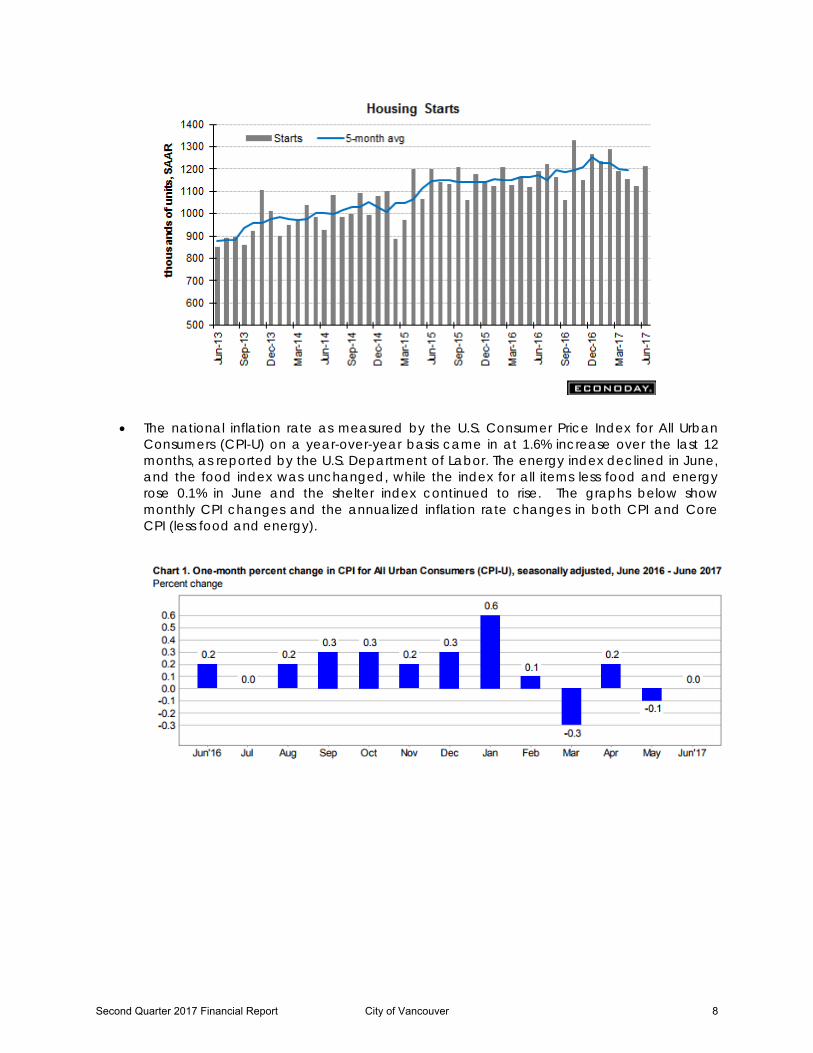
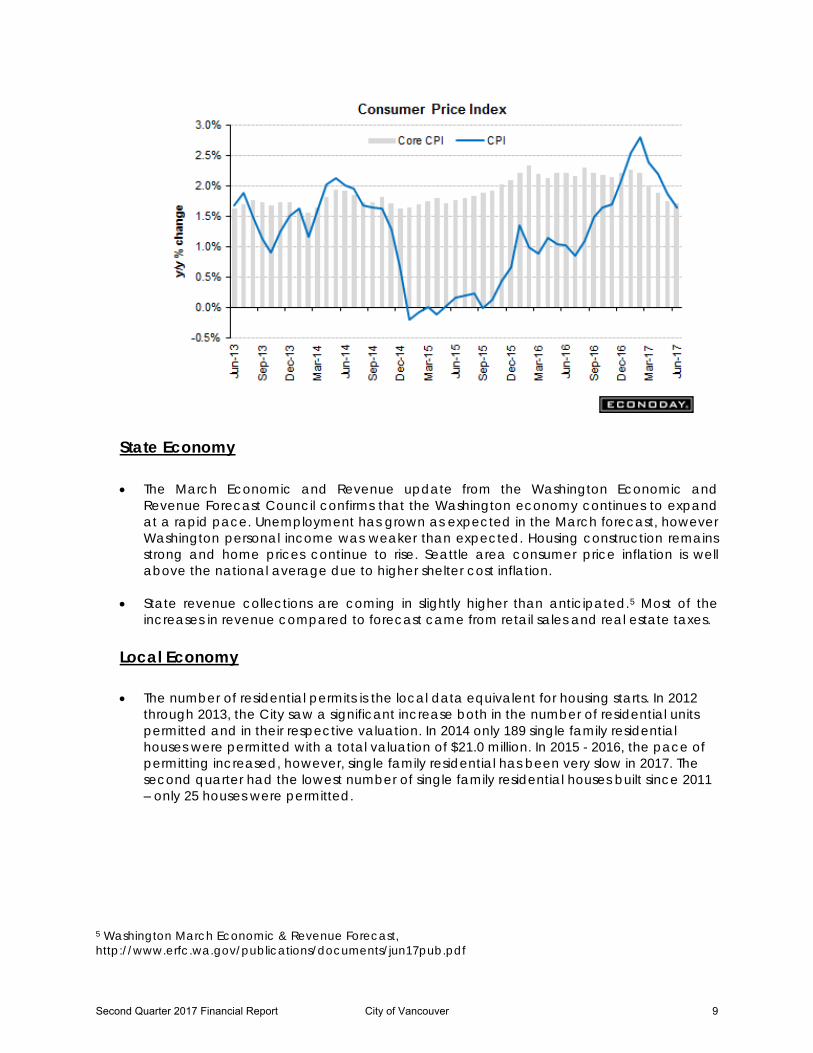
• The national inflation rate as measured by the U.S. Consumer Price Index for All Urban Consumers (CPI-U) on a year-over-year basis came in at 1.6% increase over the last 12 months, as reported by the U.S. Department of Labor. The energy index declined in June, and the food index was unchanged, while the index for all items less food and energy rose 0.1% in June and the shelter index continued to rise. The graphs below show monthly CPI changes and the annualized inflation rate changes in both CPI and Core CPI (less food and energy).
Second Quarter 2017 Financial Report City of Vancouver 8
State Economy • The March Economic and Revenue update from the Washington Economic and
Revenue Forecast Council confirms that the Washington economy continues to expand at a rapid pace. Unemployment has grown as expected in the March forecast, however Washington personal income was weaker than expected. Housing construction remains strong and home prices continue to rise. Seattle area consumer price inflation is well above the national average due to higher shelter cost inflation.
• State revenue collections are coming in slightly higher than anticipated.5 Most of the increases in revenue compared to forecast came from retail sales and real estate taxes.
Local Economy
• The number of residential permits is the local data equivalent for housing starts. In 2012 through 2013, the City saw a significant increase both in the number of residential units permitted and in their respective valuation. In 2014 only 189 single family residential houses were permitted with a total valuation of $21.0 million. In 2015 - 2016, the pace of permitting increased, however, single family residential has been very slow in 2017. The second quarter had the lowest number of single family residential houses built since 2011 – only 25 houses were permitted.
5 Washington March Economic & Revenue Forecast, http://www.erfc.wa.gov/publications/documents/jun17pub.pdf
Second Quarter 2017 Financial Report City of Vancouver 9
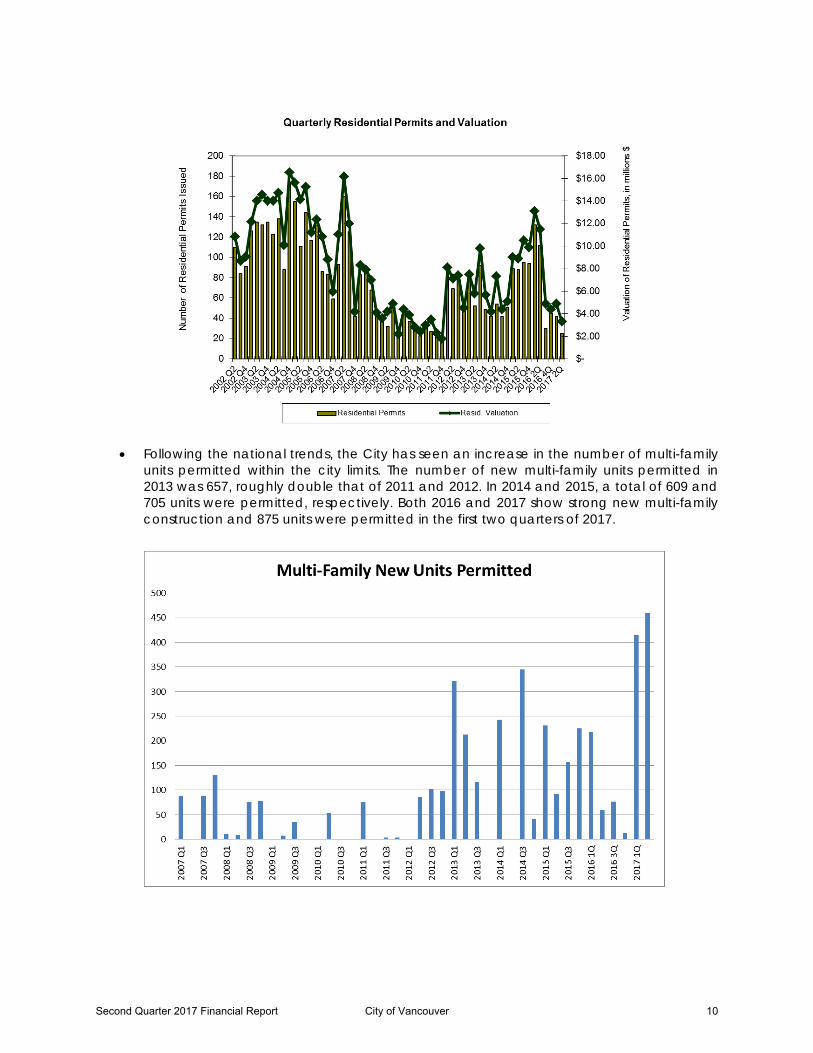
• Following the national trends, the City has seen an increase in the number of multi-family
units permitted within the city limits. The number of new multi-family units permitted in 2013 was 657, roughly double that of 2011 and 2012. In 2014 and 2015, a total of 609 and 705 units were permitted, respectively. Both 2016 and 2017 show strong new multi-family construction and 875 units were permitted in the first two quarters of 2017.
Second Quarter 2017 Financial Report City of Vancouver 10
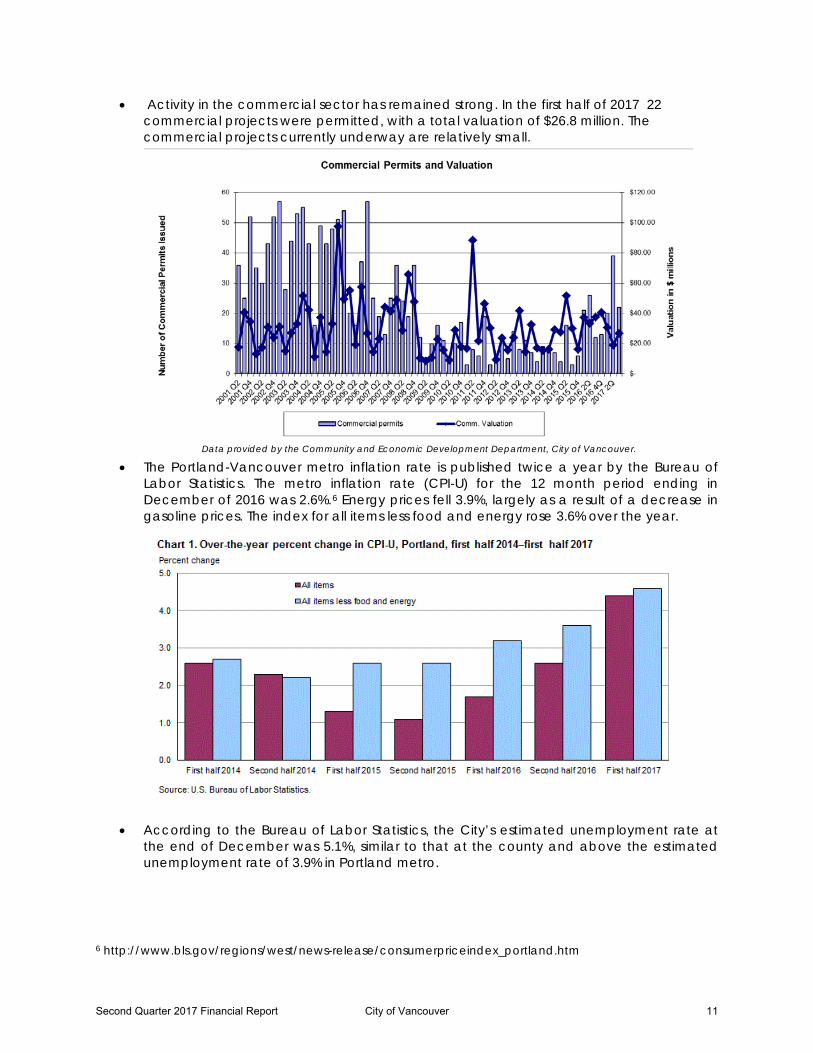
• Activity in the commercial sector has remained strong. In the first half of 2017 22 commercial projects were permitted, with a total valuation of $26.8 million. The commercial projects currently underway are relatively small.
Data provided by the Community and Economic Development Department, City of Vancouver.
• The Portland-Vancouver metro inflation rate is published twice a year by the Bureau of Labor Statistics. The metro inflation rate (CPI-U) for the 12 month period ending in December of 2016 was 2.6%.6 Energy prices fell 3.9%, largely as a result of a decrease in gasoline prices. The index for all items less food and energy rose 3.6% over the year.
• According to the Bureau of Labor Statistics, the City’s estimated unemployment rate at the end of December was 5.1%, similar to that at the county and above the estimated unemployment rate of 3.9% in Portland metro.
6 http://www.bls.gov/regions/west/news-release/consumerpriceindex_portland.htm
Second Quarter 2017 Financial Report City of Vancouver 11
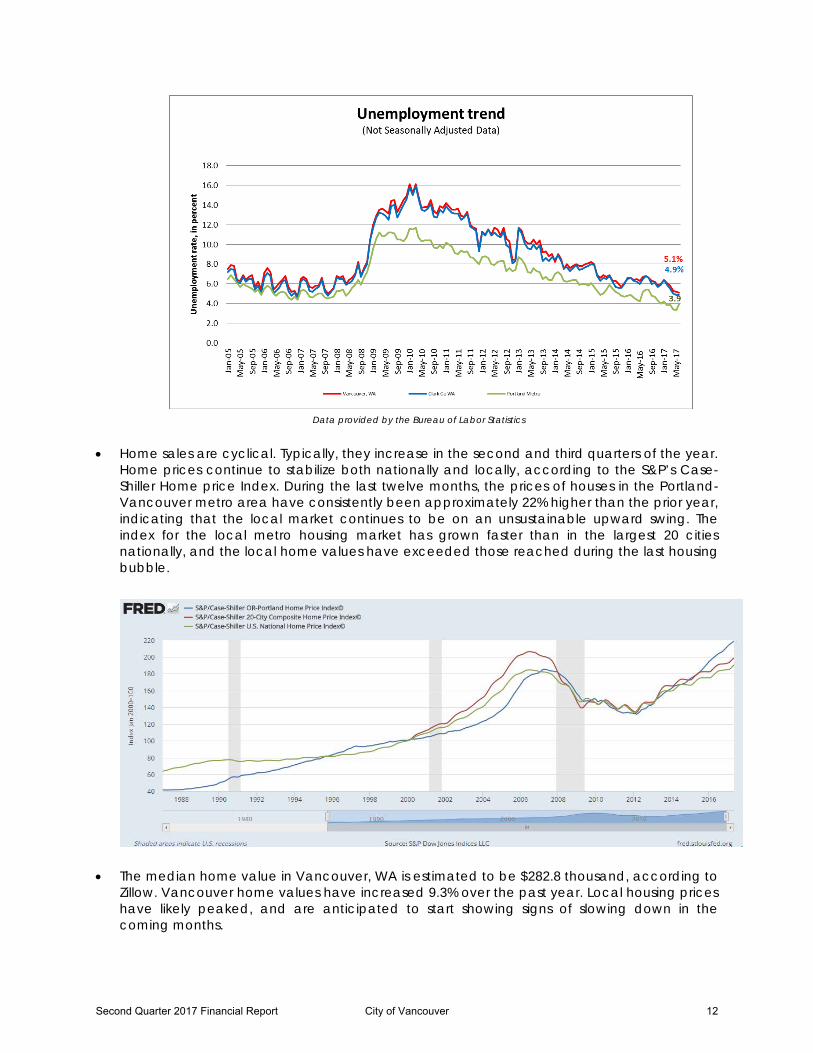
Data provided by the Bureau of Labor Statistics
• Home sales are cyclical. Typically, they increase in the second and third quarters of the year. Home prices continue to stabilize both nationally and locally, according to the S&P’s Case-Shiller Home price Index. During the last twelve months, the prices of houses in the Portland-Vancouver metro area have consistently been approximately 22% higher than the prior year, indicating that the local market continues to be on an unsustainable upward swing. The index for the local metro housing market has grown faster than in the largest 20 cities nationally, and the local home values have exceeded those reached during the last housing bubble.
• The median home value in Vancouver, WA is estimated to be $282.8 thousand, according to Zillow. Vancouver home values have increased 9.3% over the past year. Local housing prices have likely peaked, and are anticipated to start showing signs of slowing down in the coming months.
Second Quarter 2017 Financial Report City of Vancouver 12
• Zillow evaluates Vancouver’s real estate market as relatively healthy, relative to other markets across the county. The Market Health index is based on up to 10 metrics, including those capturing past and projected home values, the prevalence of foreclosures, foreclosure re-sales, negative equity, and delinquency. The Vancouver market is currently rated 8.8 out of a possible10.
III. Financial Results General Fund REVENUES
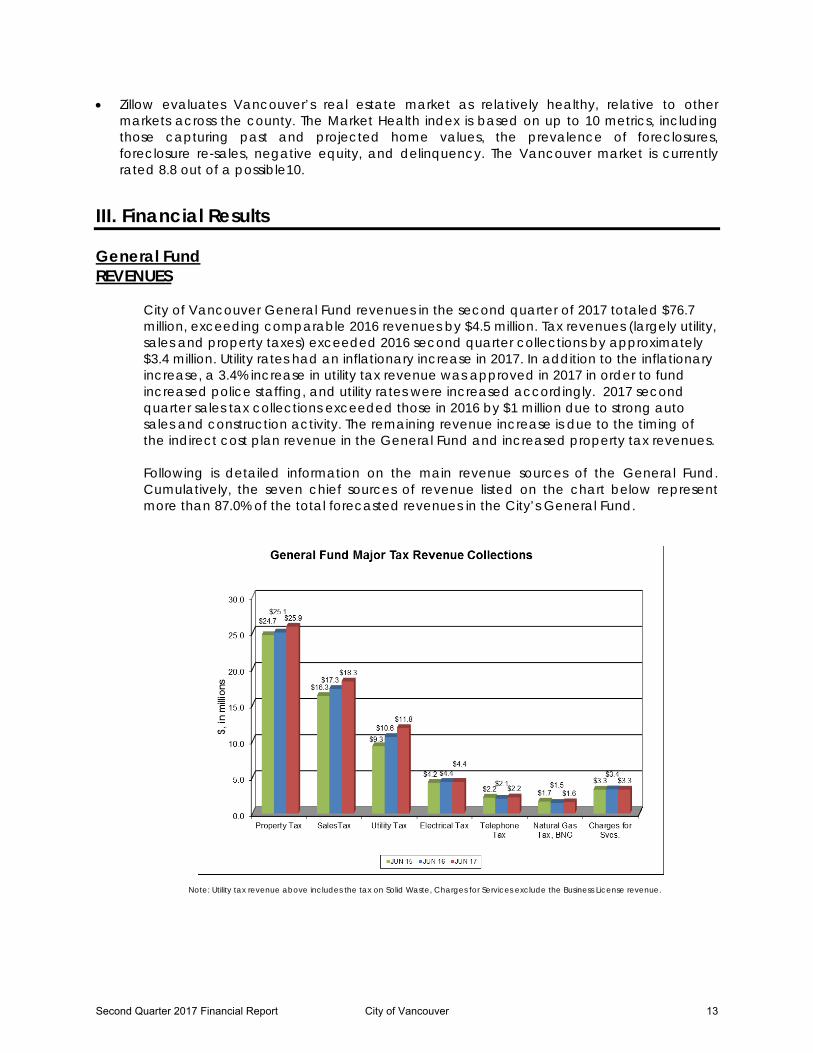
City of Vancouver General Fund revenues in the second quarter of 2017 totaled $76.7 million, exceeding comparable 2016 revenues by $4.5 million. Tax revenues (largely utility, sales and property taxes) exceeded 2016 second quarter collections by approximately $3.4 million. Utility rates had an inflationary increase in 2017. In addition to the inflationary increase, a 3.4% increase in utility tax revenue was approved in 2017 in order to fund increased police staffing, and utility rates were increased accordingly. 2017 second quarter sales tax collections exceeded those in 2016 by $1 million due to strong auto sales and construction activity. The remaining revenue increase is due to the timing of the indirect cost plan revenue in the General Fund and increased property tax revenues. Following is detailed information on the main revenue sources of the General Fund. Cumulatively, the seven chief sources of revenue listed on the chart below represent more than 87.0% of the total forecasted revenues in the City’s General Fund.
Note: Utility tax revenue above includes the tax on Solid Waste, Charges for Services exclude the Business License revenue.
Second Quarter 2017 Financial Report City of Vancouver 13
Property Tax • Property tax revenues are typically received during the second and fourth quarters of the
year. The amount of revenue is based on the assessed valuation and is estimated using the County Assessor’s data. Deviations from estimates in this revenue source are mostly related to the amount of new construction and delinquency rates.
• By Council action, there was a 1% property tax levy increase in 2017. The total City of Vancouver levy rate in 2017 is $2.477 per $1,000 of assessed value, which was applied to a total taxable value of approximately $18.6 billion. The total levy consists of $2.47 per $1,000 in assessed value that is collected in the General Fund. An additional $0.32 levy was approved by voters in November of 2016 for the Affordable Housing Fund. The new levy is anticipated to generate $6 million per year to be dedicated to increasing the number of affordable housing units in the City. The Affordable Housing tax levy does not come into the City’s General Fund, but goes to a newly created Affordable Housing Fund.
• The City experienced a 23.5% combined reduction in assessed valuation between 2009
and 2012. The reduction in assessed valuation resulted in an increase of the City’s property tax levy rate, but did not impact revenues. The City’s assessed valuation between 2013 and 2017 increased by 32.3%. The increase in assessed valuation in 2017 alone was 10.7%.
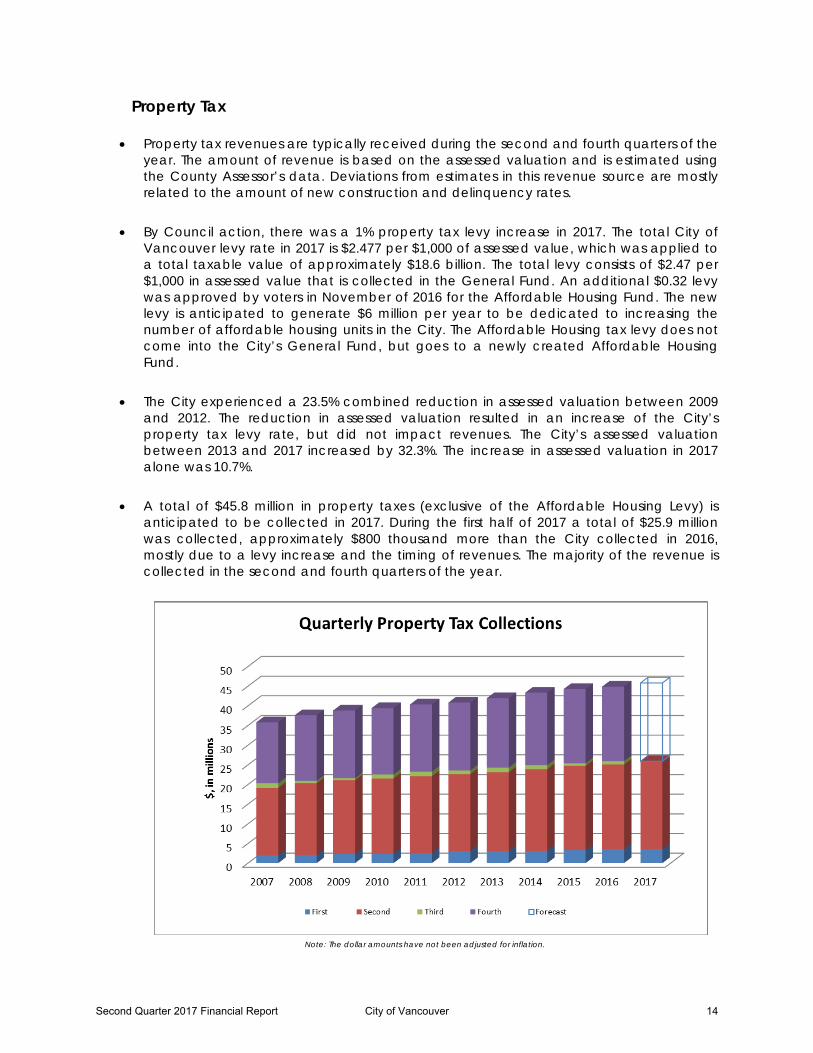
• A total of $45.8 million in property taxes (exclusive of the Affordable Housing Levy) is
anticipated to be collected in 2017. During the first half of 2017 a total of $25.9 million was collected, approximately $800 thousand more than the City collected in 2016, mostly due to a levy increase and the timing of revenues. The majority of the revenue is collected in the second and fourth quarters of the year.
Note: The dollar amounts have not been adjusted for inflation.
Second Quarter 2017 Financial Report City of Vancouver 14
Sales Tax
• The sales tax rate of 8.4% in the incorporated area is distributed as follows: 6.5% to the State, 0.5% for the City’s “basic” sales tax, 0.3% for the City’s “optional” sales tax, 0.2% for the City restricted to funding Public Safety, the County’s additional optional 0.1% for Law and Justice and 0.1% for addressing the region’s methamphetamine drug addiction and related crime, and 0.7% for C-TRAN.
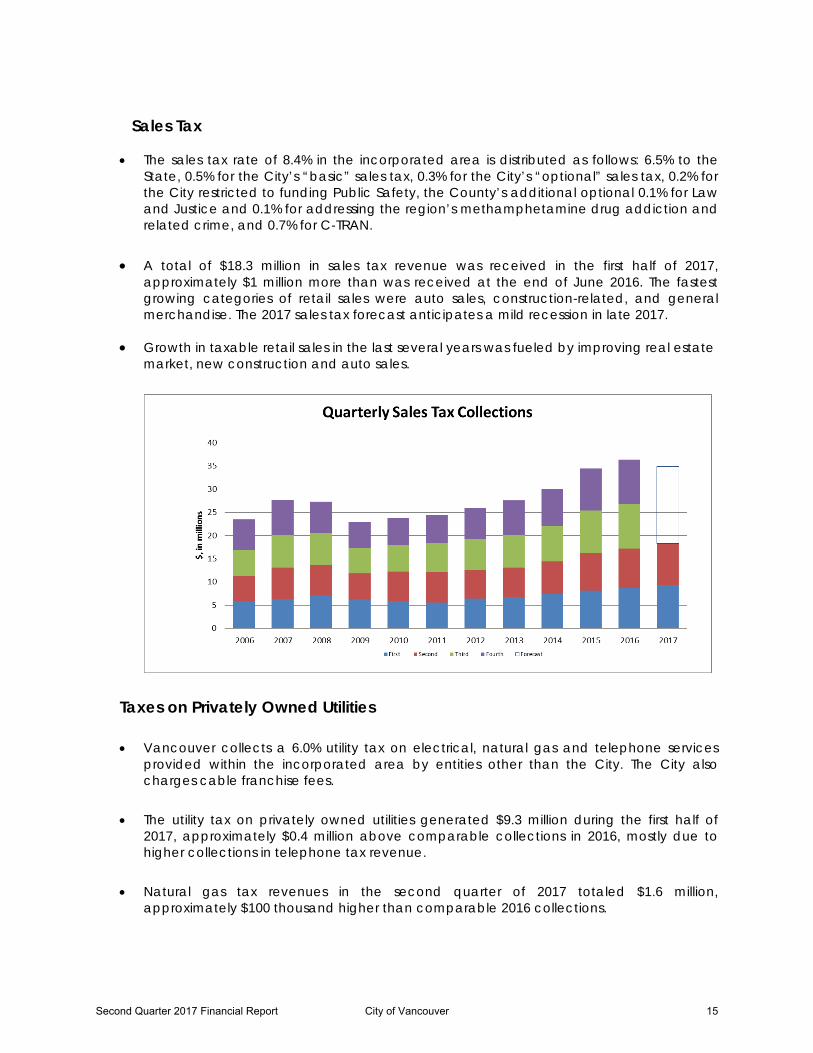
• A total of $18.3 million in sales tax revenue was received in the first half of 2017,
approximately $1 million more than was received at the end of June 2016. The fastest growing categories of retail sales were auto sales, construction-related, and general merchandise. The 2017 sales tax forecast anticipates a mild recession in late 2017.
• Growth in taxable retail sales in the last several years was fueled by improving real estate
market, new construction and auto sales.
Taxes on Privately Owned Utilities • Vancouver collects a 6.0% utility tax on electrical, natural gas and telephone services
provided within the incorporated area by entities other than the City. The City also charges cable franchise fees.
• The utility tax on privately owned utilities generated $9.3 million during the first half of
2017, approximately $0.4 million above comparable collections in 2016, mostly due to higher collections in telephone tax revenue.
• Natural gas tax revenues in the second quarter of 2017 totaled $1.6 million,
approximately $100 thousand higher than comparable 2016 collections.
Second Quarter 2017 Financial Report City of Vancouver 15
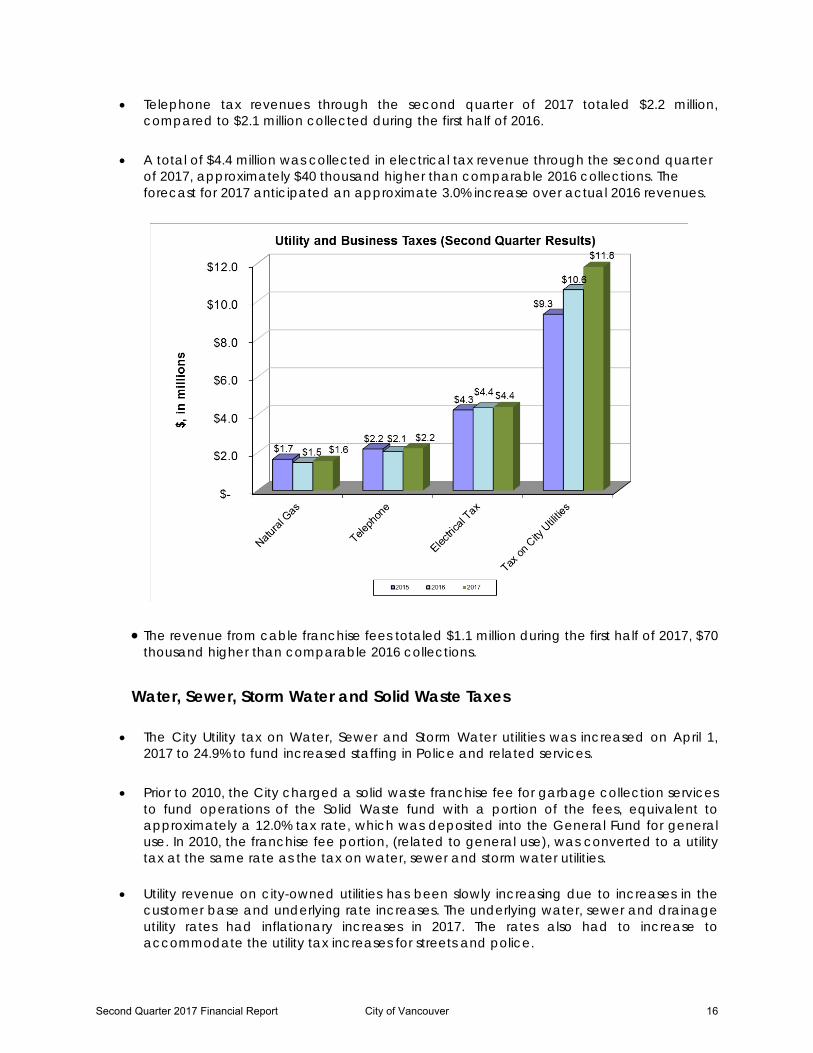
• Telephone tax revenues through the second quarter of 2017 totaled $2.2 million, compared to $2.1 million collected during the first half of 2016.
• A total of $4.4 million was collected in electrical tax revenue through the second quarter
of 2017, approximately $40 thousand higher than comparable 2016 collections. The forecast for 2017 anticipated an approximate 3.0% increase over actual 2016 revenues.
• The revenue from cable franchise fees totaled $1.1 million during the first half of 2017, $70 thousand higher than comparable 2016 collections.
Water, Sewer, Storm Water and Solid Waste Taxes
• The City Utility tax on Water, Sewer and Storm Water utilities was increased on April 1, 2017 to 24.9% to fund increased staffing in Police and related services.
• Prior to 2010, the City charged a solid waste franchise fee for garbage collection services
to fund operations of the Solid Waste fund with a portion of the fees, equivalent to approximately a 12.0% tax rate, which was deposited into the General Fund for general use. In 2010, the franchise fee portion, (related to general use), was converted to a utility tax at the same rate as the tax on water, sewer and storm water utilities.
• Utility revenue on city-owned utilities has been slowly increasing due to increases in the customer base and underlying rate increases. The underlying water, sewer and drainage utility rates had inflationary increases in 2017. The rates also had to increase to accommodate the utility tax increases for streets and police.
Second Quarter 2017 Financial Report City of Vancouver 16
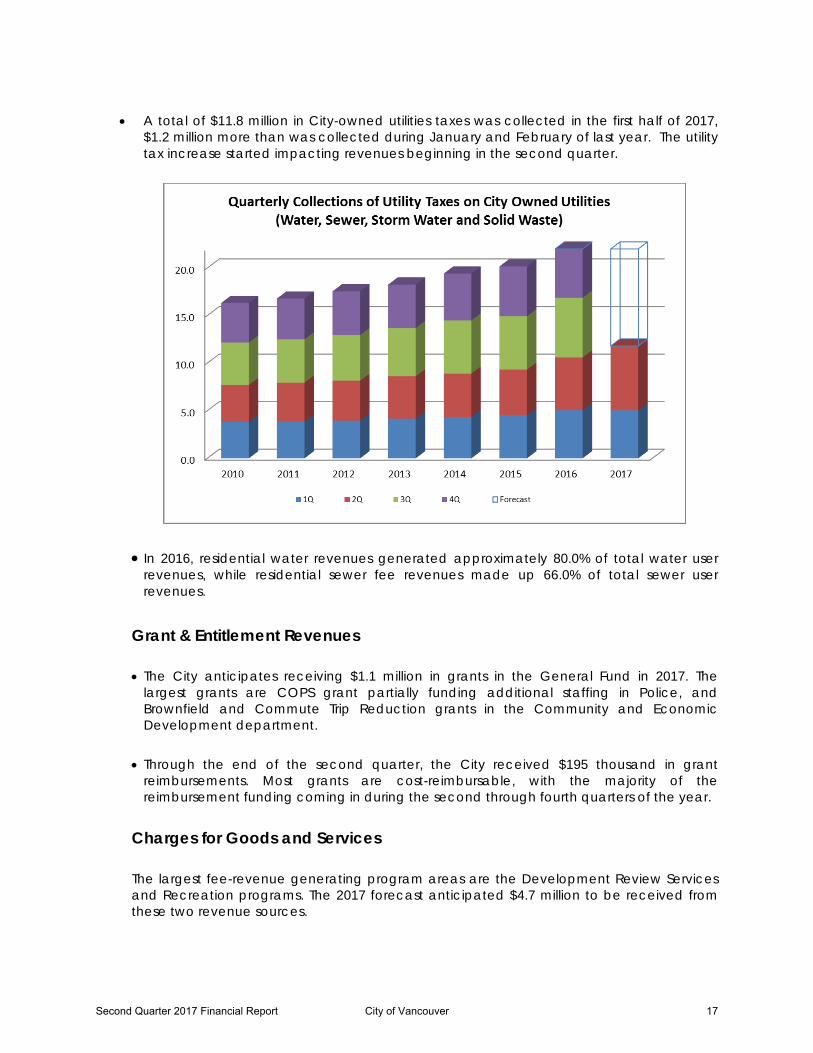
• A total of $11.8 million in City-owned utilities taxes was collected in the first half of 2017,
$1.2 million more than was collected during January and February of last year. The utility tax increase started impacting revenues beginning in the second quarter.
• In 2016, residential water revenues generated approximately 80.0% of total water user revenues, while residential sewer fee revenues made up 66.0% of total sewer user revenues.
Grant & Entitlement Revenues • The City anticipates receiving $1.1 million in grants in the General Fund in 2017. The
largest grants are COPS grant partially funding additional staffing in Police, and Brownfield and Commute Trip Reduction grants in the Community and Economic Development department.
• Through the end of the second quarter, the City received $195 thousand in grant reimbursements. Most grants are cost-reimbursable, with the majority of the reimbursement funding coming in during the second through fourth quarters of the year.
Charges for Goods and Services The largest fee-revenue generating program areas are the Development Review Services and Recreation programs. The 2017 forecast anticipated $4.7 million to be received from these two revenue sources.
Second Quarter 2017 Financial Report City of Vancouver 17
Land Use and Other Planning Permits
• From 2008 through 2010, the City experienced a significant decrease in both the number of single family residential permits issued and in their valuation. Collections from 2011 through 2013 remained relatively flat, but 2014 through 2016 saw significant annual increases in land use fees. Similar trends appear to continue into 2017.
• During the first half of 2017 a total of $540 thousand in planning permit fee revenues were collected by the City, approximately $55 thousand above revenues received during a comparable time period in 2016. Local activity remains elevated compared to the last few years.
Recreation Program Fees
A total of $4.0 million in recreation fees was anticipated to be received in 2017. However, one of the two recreation centers is currently undergoing a major swimming pool renovation, and a portion of the center is closed to customers. The total recreation fee revenue received through the end of June was $2.2 million; almost $200 thousand lower than comparable revenues in 2016.
EXPENDITURES
• General Fund expenditures through the second quarter of 2017 totaled $69.4 million, or 43.0% of the budget for the year, on track with the adopted budget.
• Departments spent $37.7 million, $5 million more than was spent in the first half of 2016. The increase in spending is the result of increased 2017 costs and new staffing.
• Expenses vs. budget by category within the General Fund are shown in the chart below.
Second Quarter 2017 Financial Report City of Vancouver 18
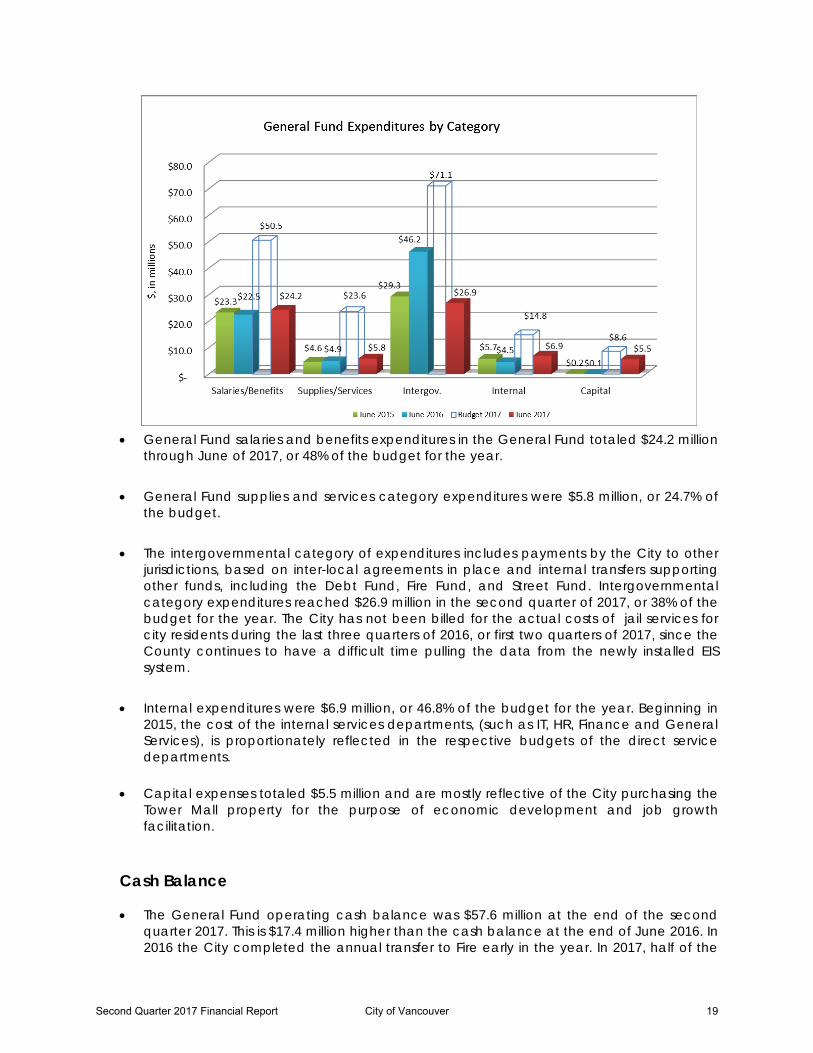
• General Fund salaries and benefits expenditures in the General Fund totaled $24.2 million
through June of 2017, or 48% of the budget for the year.
• General Fund supplies and services category expenditures were $5.8 million, or 24.7% of the budget.
• The intergovernmental category of expenditures includes payments by the City to other jurisdictions, based on inter-local agreements in place and internal transfers supporting other funds, including the Debt Fund, Fire Fund, and Street Fund. Intergovernmental category expenditures reached $26.9 million in the second quarter of 2017, or 38% of the budget for the year. The City has not been billed for the actual costs of jail services for city residents during the last three quarters of 2016, or first two quarters of 2017, since the County continues to have a difficult time pulling the data from the newly installed EIS system.
• Internal expenditures were $6.9 million, or 46.8% of the budget for the year. Beginning in
2015, the cost of the internal services departments, (such as IT, HR, Finance and General Services), is proportionately reflected in the respective budgets of the direct service departments.
• Capital expenses totaled $5.5 million and are mostly reflective of the City purchasing the Tower Mall property for the purpose of economic development and job growth facilitation.
Cash Balance
• The General Fund operating cash balance was $57.6 million at the end of the second quarter 2017. This is $17.4 million higher than the cash balance at the end of June 2016. In 2016 the City completed the annual transfer to Fire early in the year. In 2017, half of the
Second Quarter 2017 Financial Report City of Vancouver 19
transfer was made. Overall, the City is behind on transfers, impacting the cash balance at the end of June.
• In addition to the operating cash balance, the General Fund has an emergency reserve totaling $11.5 million at the end of June 2017, compared to $10.9 million in June 2016. Council updated the emergency reserve balance financial policy in 2012, requiring that the emergency reserve balance equal 7.0% of actual external revenues in the preceding fiscal year for the General, Street, and Fire Funds. These funds are intended to be used only for extraordinary events, such as natural disasters.
Fund Balance • The cash balance represents a snapshot of a particular date, while the fund balance
factors in revenues that are anticipated to be received by the end of the year and expenditures that are anticipated to happen through the end of the year.
• The total fund balance in the General Fund at the end of 2016 was $65.2 million, according to the City’s audited financial statements. An estimated $0.3 million of the fund balance represents prepaid items. This portion of the balance is not spendable. The remaining balance is composed of the Restricted, Committed, Assigned and Unassigned balances. The Restricted balance of $0.1 million represents the grant revenue received in advance of expenditures in VPD. The Committed balance of $20.9 million represents reserves in accordance with the City Financial Policies: the City Emergency reserve of $11.0 million, Revenue Stabilization reserve of $3.7 million, and $6.2 million of reserve restricted for capital purposes. The balance pays for the ongoing operations of the General Fund when the incoming seasonal revenues are not sufficient to cover the expenses, and eliminates the need for short-term borrowing. The Assigned reserve of an estimated $34.3 million represents the City’s working capital of $30.4 million, which is required to ensure sufficient cash flow in the fund. The Assigned balance also includes funding of 50% of accrued compensated absences. The remaining $9.8 million portion of the balance was determined to be undesignated at the end of 2016. The undesignated fund balance has declined by approximately $3.8 million between 2015 and 2016, representing planned spending of the balance. Approximately $3.0-3.5 million from the 2016 appropriation will be carried forward and use the corresponding fund balance.
Street Fund • Expenditures in the Street Fund through the second quarter of 2017 totaled $7.2 million, or
18% of the budget, approximately $0.6 million higher than comparable expenditures in 2016.
• The revenues in the fund, (excluding a budgeted general fund transfer), totaled $1.9 million,
matching the comparable collections in 2016. This fund’s largest sources of revenue are state shared revenues from the motor vehicle fuel tax (MVFT), real estate excise tax (REET), and a transfer from the General Fund. The 2017 budgeted General Fund transfer to the Street fund is $11million.
Second Quarter 2017 Financial Report City of Vancouver 20
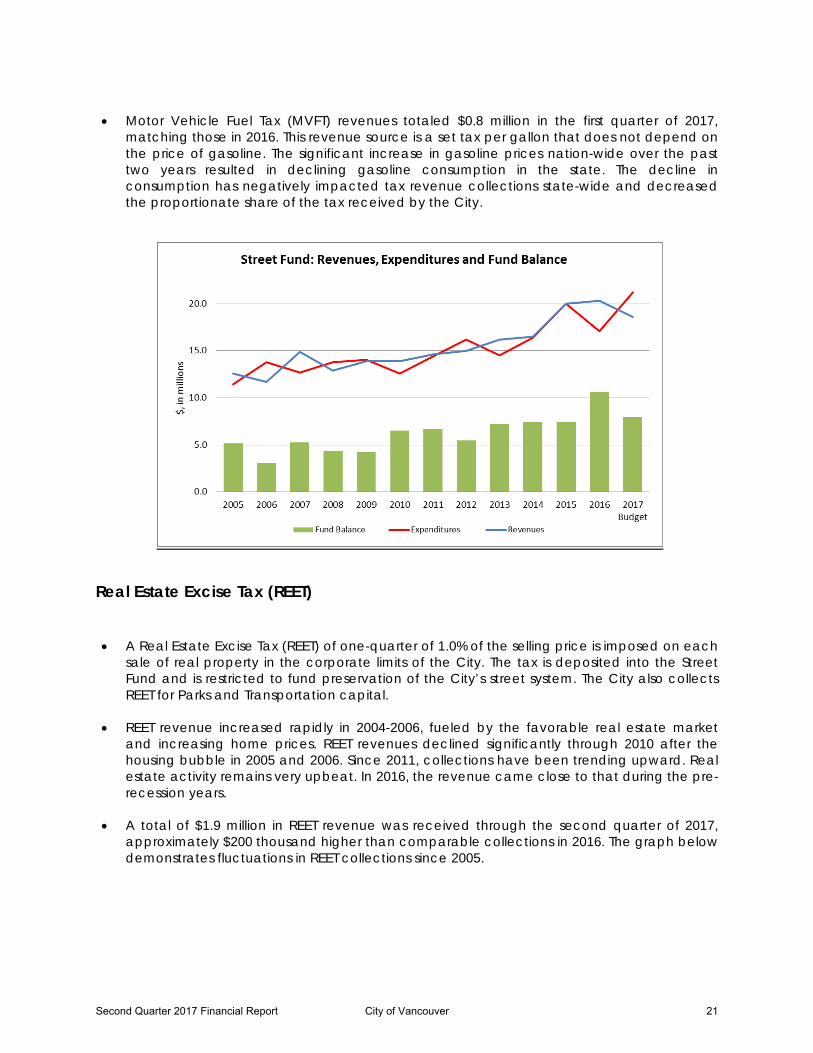
• Motor Vehicle Fuel Tax (MVFT) revenues totaled $0.8 million in the first quarter of 2017,
matching those in 2016. This revenue source is a set tax per gallon that does not depend on the price of gasoline. The significant increase in gasoline prices nation-wide over the past two years resulted in declining gasoline consumption in the state. The decline in consumption has negatively impacted tax revenue collections state-wide and decreased the proportionate share of the tax received by the City.
Real Estate Excise Tax (REET)
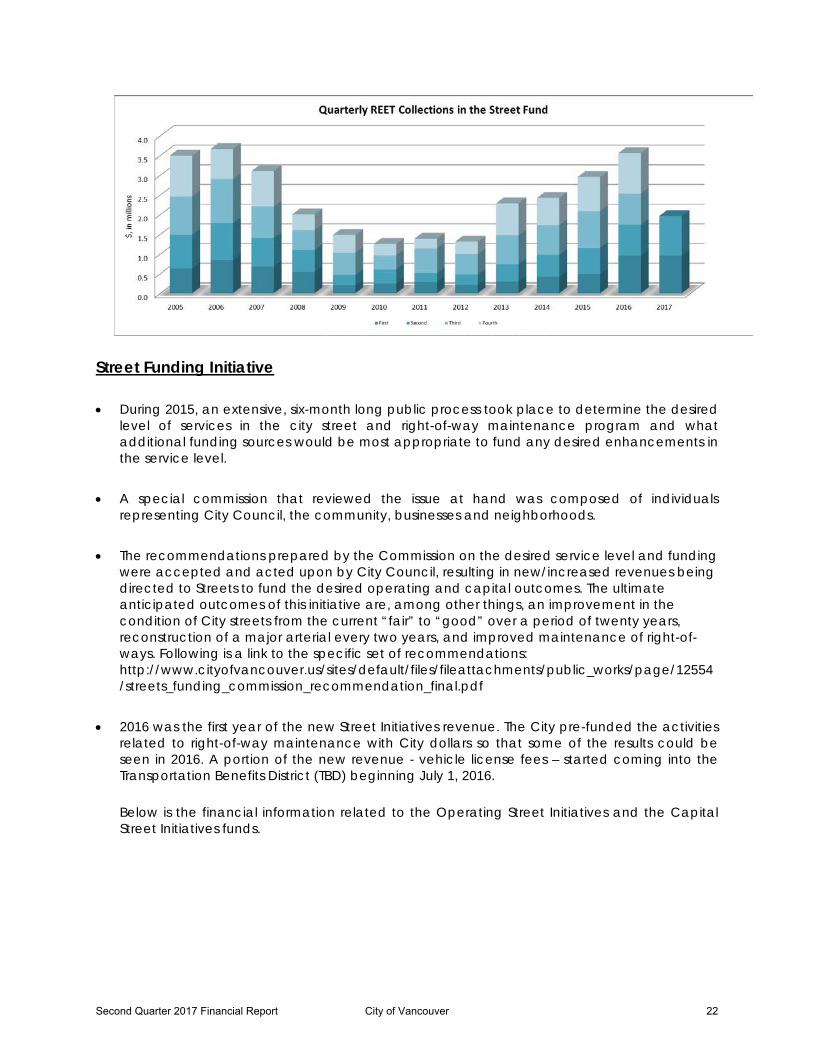
• A Real Estate Excise Tax (REET) of one-quarter of 1.0% of the selling price is imposed on each sale of real property in the corporate limits of the City. The tax is deposited into the Street Fund and is restricted to fund preservation of the City’s street system. The City also collects REET for Parks and Transportation capital.
• REET revenue increased rapidly in 2004-2006, fueled by the favorable real estate market
and increasing home prices. REET revenues declined significantly through 2010 after the housing bubble in 2005 and 2006. Since 2011, collections have been trending upward. Real estate activity remains very upbeat. In 2016, the revenue came close to that during the pre-recession years.
• A total of $1.9 million in REET revenue was received through the second quarter of 2017,
approximately $200 thousand higher than comparable collections in 2016. The graph below demonstrates fluctuations in REET collections since 2005.
Second Quarter 2017 Financial Report City of Vancouver 21
Street Funding Initiative • During 2015, an extensive, six-month long public process took place to determine the desired
level of services in the city street and right-of-way maintenance program and what additional funding sources would be most appropriate to fund any desired enhancements in the service level.
• A special commission that reviewed the issue at hand was composed of individuals representing City Council, the community, businesses and neighborhoods.
• The recommendations prepared by the Commission on the desired service level and funding
were accepted and acted upon by City Council, resulting in new/increased revenues being directed to Streets to fund the desired operating and capital outcomes. The ultimate anticipated outcomes of this initiative are, among other things, an improvement in the condition of City streets from the current “fair” to “good” over a period of twenty years, reconstruction of a major arterial every two years, and improved maintenance of right-of-ways. Following is a link to the specific set of recommendations: http://www.cityofvancouver.us/sites/default/files/fileattachments/public_works/page/12554/streets_funding_commission_recommendation_final.pdf
• 2016 was the first year of the new Street Initiatives revenue. The City pre-funded the activities
related to right-of-way maintenance with City dollars so that some of the results could be seen in 2016. A portion of the new revenue - vehicle license fees – started coming into the Transportation Benefits District (TBD) beginning July 1, 2016.
Below is the financial information related to the Operating Street Initiatives and the Capital Street Initiatives funds.
Second Quarter 2017 Financial Report City of Vancouver 22
2015 2016 2017 2017 %Revenues Actual Actual Budget March Budget Street Initiative Operating Fund 50,852 921,851 4,463,580 1,656,551 37%
Street Funding Initiative - Capital Fund - 348,921 1,654,715 94,799 6%
Transportation Benefits District - 1,058,954 3,400,000 1,178,435 35%
ExpendituresStreet Initiative- NEW Fund - 748,655 4,684,183 405,084 9%Capital Streets Initiative Fund (NEW) - 999,039 1,654,715 121,426 7%
Transportation Benefits District - - 1,731,165 465,582 27% Consolidated Fire Fund
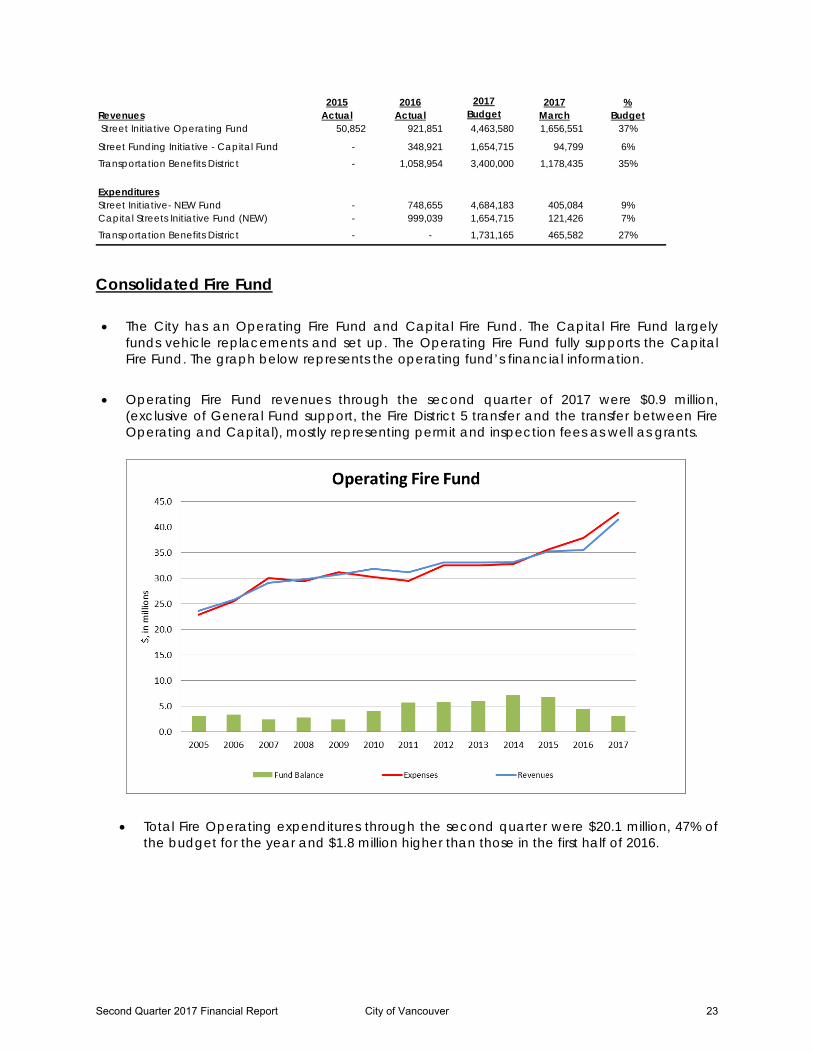
• The City has an Operating Fire Fund and Capital Fire Fund. The Capital Fire Fund largely
funds vehicle replacements and set up. The Operating Fire Fund fully supports the Capital Fire Fund. The graph below represents the operating fund’s financial information.
• Operating Fire Fund revenues through the second quarter of 2017 were $0.9 million, (exclusive of General Fund support, the Fire District 5 transfer and the transfer between Fire Operating and Capital), mostly representing permit and inspection fees as well as grants.
• Total Fire Operating expenditures through the second quarter were $20.1 million, 47% of the budget for the year and $1.8 million higher than those in the first half of 2016.
Second Quarter 2017 Financial Report City of Vancouver 23
Building Inspection Fund
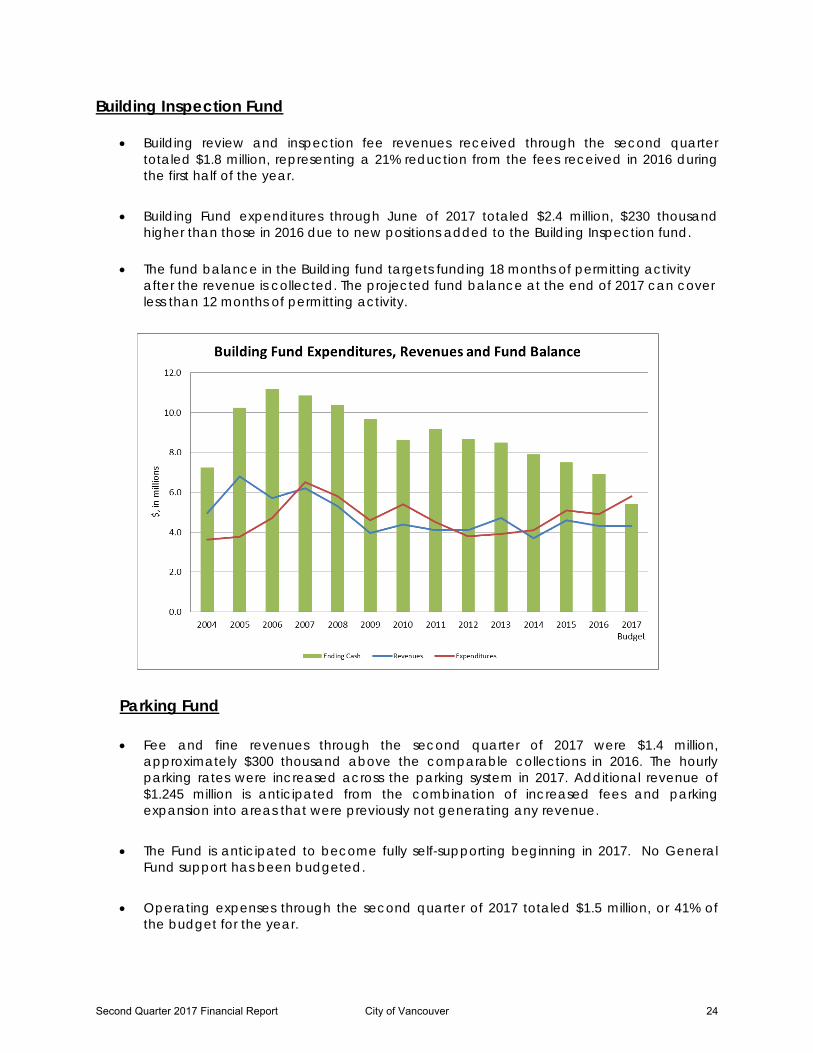
• Building review and inspection fee revenues received through the second quarter totaled $1.8 million, representing a 21% reduction from the fees received in 2016 during the first half of the year.
• Building Fund expenditures through June of 2017 totaled $2.4 million, $230 thousand
higher than those in 2016 due to new positions added to the Building Inspection fund.
• The fund balance in the Building fund targets funding 18 months of permitting activity after the revenue is collected. The projected fund balance at the end of 2017 can cover less than 12 months of permitting activity.
Parking Fund
• Fee and fine revenues through the second quarter of 2017 were $1.4 million, approximately $300 thousand above the comparable collections in 2016. The hourly parking rates were increased across the parking system in 2017. Additional revenue of $1.245 million is anticipated from the combination of increased fees and parking expansion into areas that were previously not generating any revenue.
• The Fund is anticipated to become fully self-supporting beginning in 2017. No General Fund support has been budgeted.
• Operating expenses through the second quarter of 2017 totaled $1.5 million, or 41% of
the budget for the year.
Second Quarter 2017 Financial Report City of Vancouver 24
Utility Operations • Operating transfers between the Water, Sewer and Storm Water funds are included in
the accompanying report, Attachment A, per budget requirements. These transfers are generally eliminated when financial statements are prepared. Financial statements for utility funds are prepared on a quarterly basis. Please call (360) 487-8441 to receive a copy of the detailed financial statements for the Utility Funds.
Water
• Water sales revenues totaled $13.4 million through June, or 42% of the forecast. Collections were $0.5 million above the comparable 2016 collections, largely due to the impact of tax increases for Street Initiatives, (effective in 2016), inflationary rate increases, and the impact of the 3.4% utility tax increase to fund additional staffing in police, (effective April 1, 2017).
• Expenditures in the Water fund through June of 2017 totaled $14.9 million, or 34% of the budget.
Sewer
• Sewer charge revenues in the Sewer Fund were $21.1 million by June 2017, approximately $1 million above the comparable 2016 revenues. Sewer rates had inflationary increases in 2017, as well as an adjustment for a 3.4% utility tax increase to fund increased police staffing.
• Sewer expenditures through June of 2017 totaled $20.8 million, $0.8 million above the 2016
comparable expenditures, mostly due to the timing of the capital projects. Storm Water
• A total of $7.5 million in storm water fee revenue was received through the second quarter of 2017, approximately $0.8 million higher than the 2016 comparable revenues. In 2017, the rates had an inflationary increase as well as an adjustment for a 3.4% utility tax increase to fund increased police staffing.
• Overall, the expenditures in the Storm Water fund were $8.2 million by June of 2017, or 50% of the budget, approximately $2.4 million higher than those in the first half of 2016.
Internal Service Funds Equipment Services Operating and Capital Funds
• A total of $3 million was spent by the Equipment Services on operating activities, or 40% of the budget for the year. ER&R Capital fund spent only $0.5 million by the end of June, or 6% of the budget for the year due to the timing of the vehicle purchases.
Second Quarter 2017 Financial Report City of Vancouver 25
Technology ER&R Fund
• A total of $0.6 million, or 9% of the budget was spent on equipment replacement. A large portion of the budget for 2017 is earmarked for the replacement of the City’s 16-year old ERP System, Oracle. Negotiations are under way with the vendor and implementation partner of the future ERP system.
Internal Services Fund
• A total of $6.3 million was spent by the Internal Services departments (IT, Finance, HR and General Services) during the first half of 2017. This represents 42% of the budget for the year.
Risk Fund
• A total of $1.1 million was spent by June of 2017, or 22% of the budget. The majority of the costs occur later during the year.
Benefits and Self Insured Health Insurance Funds
• A total of $8.5 million was spent through June of 2017 on employee benefits, including health insurance and payments to medical trusts. The amount spent represents 49% of the budget for the year.
IV. Outstanding Debt
• At the end of the second quarter of 2017, the City had about $82.9 million of general
obligation (G.O.) debt outstanding and approximately $14.6 million of revenue bond debt outstanding. General obligation debt is backed by the full faith and credit of the City and by general taxes. Revenue bond debt is supported by a pledge of specific revenues. All of the City’s revenue bond debt is supported by the City’s water and sewer utilities. The weighted average interest rate for the City’s general obligation debt is 3.21% while the average interest rate for the City’s revenue bond debt is 4.01%.
A complete list of the City’s outstanding debt is included in Attachment C.
V. Investments
Market Conditions • Information received since the Federal Open Market Committee met in May indicates that
the labor market has continued to strengthen and that economic activity has been rising moderately so far this year. Job gains have moderated but have been solid, on average, since the beginning of the year, and the unemployment rate has declined. Household spending has picked up in recent months, and business fixed investment has continued to
Second Quarter 2017 Financial Report City of Vancouver 26
expand. On a 12-month basis, inflation has declined recently and excluding food and energy prices, is running somewhat below 2 percent. Market-based measures of inflation remain low; survey-based measures of longer-term inflation expectations are little changed, on balance.
• Consistent with its statutory mandate, the FOMC seeks to foster maximum employment and price stability. The Committee expects that, with gradual adjustments in the stance of monetary policy, economic activity will expand at a moderate pace, labor market conditions will strengthen somewhat further, and inflation will stabilize around 2 percent over the medium term. Near-term risks to the economic outlook appear roughly balanced. The Committee continues to closely monitor inflation indicators and global economic and financial developments.
• The FOMC is maintaining its existing policy of reinvesting principal payments from its holdings
of agency debt and agency mortgage-backed securities in agency mortgage-backed securities and of rolling over maturing Treasury securities at auction, and it anticipates doing so until normalization of the level of the federal funds rate is well under way. This policy, by keeping the Committee's holdings of longer-term securities at sizable levels, should help maintain accommodative financial conditions.
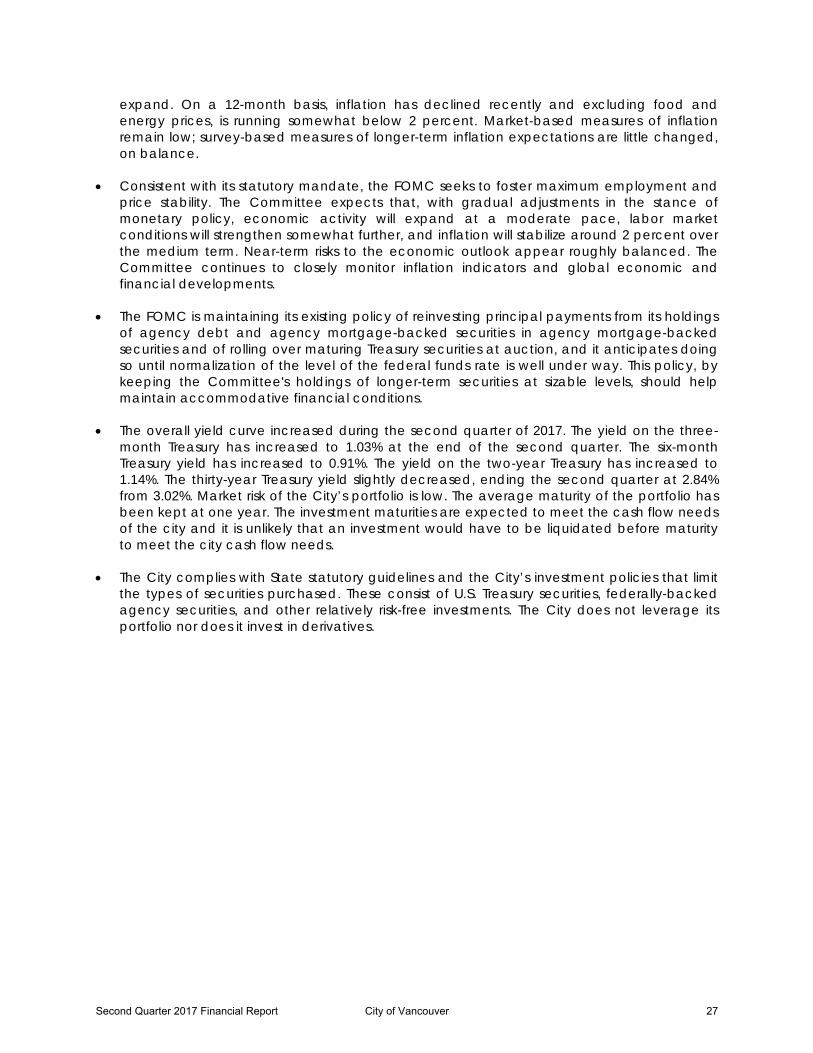
• The overall yield curve increased during the second quarter of 2017. The yield on the three-
month Treasury has increased to 1.03% at the end of the second quarter. The six-month Treasury yield has increased to 0.91%. The yield on the two-year Treasury has increased to 1.14%. The thirty-year Treasury yield slightly decreased, ending the second quarter at 2.84% from 3.02%. Market risk of the City’s portfolio is low. The average maturity of the portfolio has been kept at one year. The investment maturities are expected to meet the cash flow needs of the city and it is unlikely that an investment would have to be liquidated before maturity to meet the city cash flow needs.
• The City complies with State statutory guidelines and the City’s investment policies that limit the types of securities purchased. These consist of U.S. Treasury securities, federally-backed agency securities, and other relatively risk-free investments. The City does not leverage its portfolio nor does it invest in derivatives.
Second Quarter 2017 Financial Report City of Vancouver 27
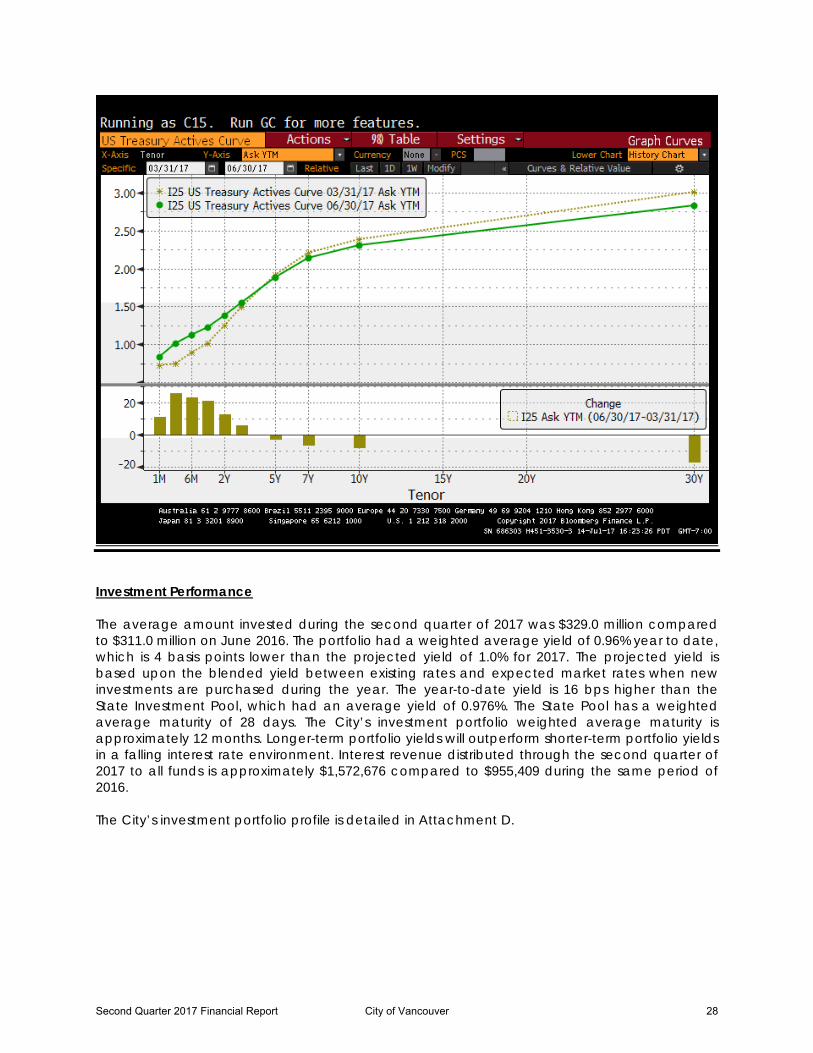
Investment Performance The average amount invested during the second quarter of 2017 was $329.0 million compared to $311.0 million on June 2016. The portfolio had a weighted average yield of 0.96% year to date, which is 4 basis points lower than the projected yield of 1.0% for 2017. The projected yield is based upon the blended yield between existing rates and expected market rates when new investments are purchased during the year. The year-to-date yield is 16 bps higher than the State Investment Pool, which had an average yield of 0.976%. The State Pool has a weighted average maturity of 28 days. The City’s investment portfolio weighted average maturity is approximately 12 months. Longer-term portfolio yields will outperform shorter-term portfolio yields in a falling interest rate environment. Interest revenue distributed through the second quarter of 2017 to all funds is approximately $1,572,676 compared to $955,409 during the same period of 2016. The City’s investment portfolio profile is detailed in Attachment D.
Second Quarter 2017 Financial Report City of Vancouver 28
VI. Interfund Loans In 2003, Council passed an ordinance giving the City Treasurer the authority to make interfund loans to meet the short term liquidity and cash flow needs of the City’s various funds. The ordinance requires the City Treasurer to provide a quarterly report to City Council showing the amount of all interfund loans outstanding and the repayment plan for those loans. Through the second quarter of 2017, there have not been any funds needing an interfund loan. City of Vancouver Outstanding Interfund LoansThrough Second Quarter 2017
Balance InterestOutstanding Interest Expense
Fund Description 06/30/17 Lending Fund Rate Paid in 2017 Repayment Plan
Total Outstanding Interfund Loan Balance -$
Second Quarter 2017 Financial Report City of Vancouver 29
Attachment A
A A B A
RANGE NAME ADJ-16 JUN-16 JUL-17 JUN-17
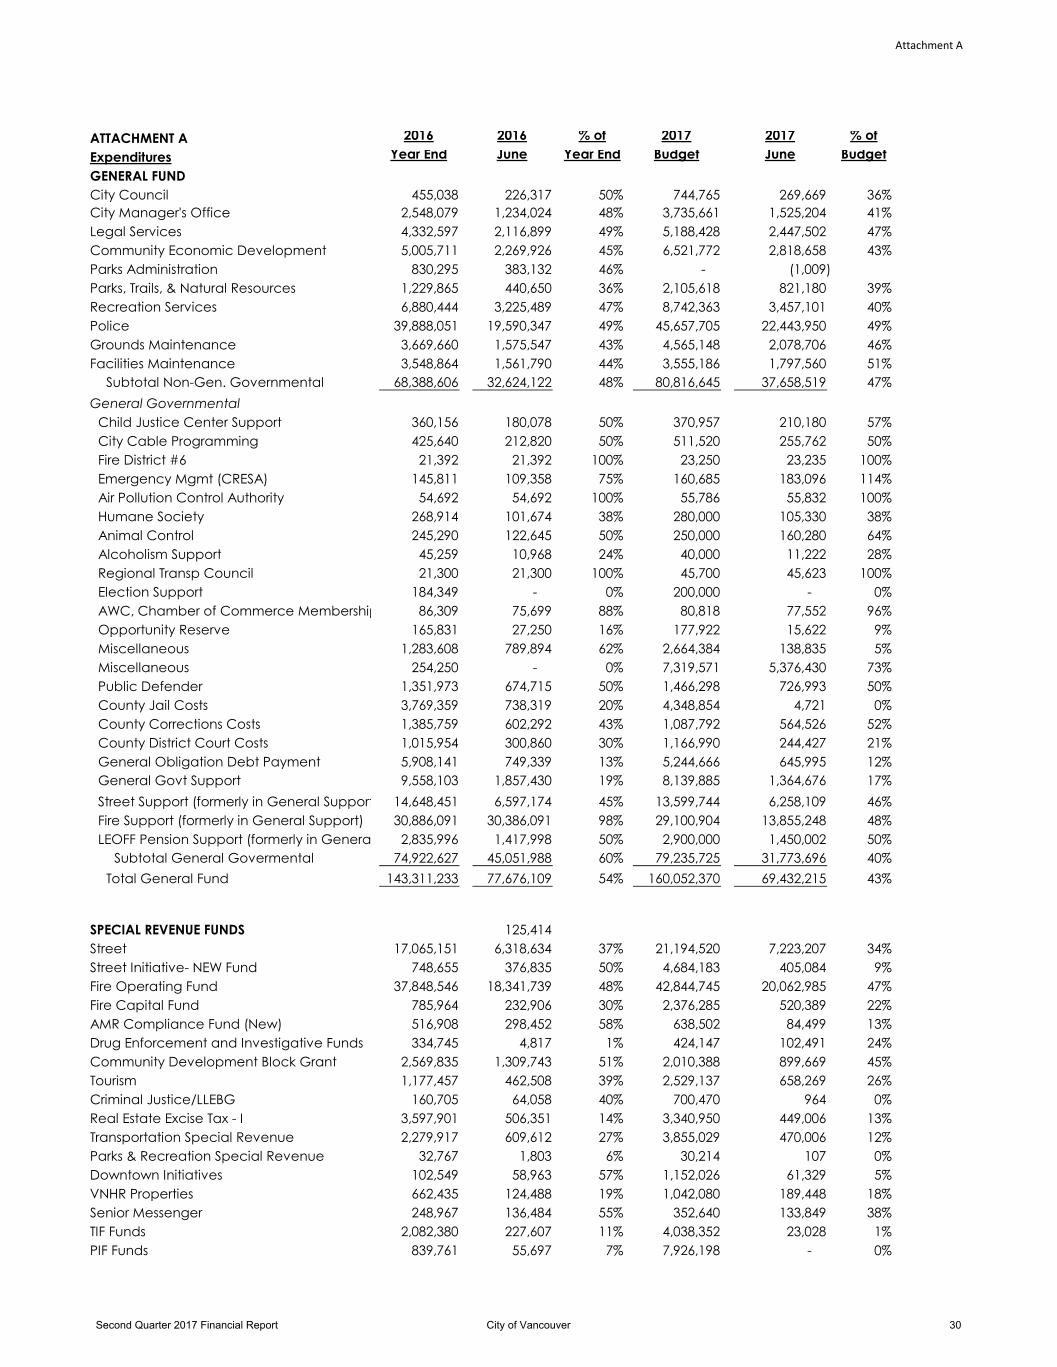
ATTACHMENT A 2016 2016 % of 2017 2017 % of
Expenditures Year End June Year End Budget June Budget
GENERAL FUND
City Council 455,038 226,317 50% 744,765 269,669 36%
City Manager's Office 2,548,079 1,234,024 48% 3,735,661 1,525,204 41%
Legal Services 4,332,597 2,116,899 49% 5,188,428 2,447,502 47%
Community Economic Development 5,005,711 2,269,926 45% 6,521,772 2,818,658 43%
Parks Administration 830,295 383,132 46% - (1,009)
Parks, Trails, & Natural Resources 1,229,865 440,650 36% 2,105,618 821,180 39%
Recreation Services 6,880,444 3,225,489 47% 8,742,363 3,457,101 40%
Police 39,888,051 19,590,347 49% 45,657,705 22,443,950 49%
Grounds Maintenance 3,669,660 1,575,547 43% 4,565,148 2,078,706 46%
Facilities Maintenance 3,548,864 1,561,790 44% 3,555,186 1,797,560 51%
Subtotal Non-Gen. Governmental 68,388,606 32,624,122 48% 80,816,645 37,658,519 47%
General Governmental
Child Justice Center Support 360,156 180,078 50% 370,957 210,180 57%
City Cable Programming 425,640 212,820 50% 511,520 255,762 50%
Fire District #6 21,392 21,392 100% 23,250 23,235 100%
Emergency Mgmt (CRESA) 145,811 109,358 75% 160,685 183,096 114%
Air Pollution Control Authority 54,692 54,692 100% 55,786 55,832 100%
Humane Society 268,914 101,674 38% 280,000 105,330 38%
Animal Control 245,290 122,645 50% 250,000 160,280 64%
Alcoholism Support 45,259 10,968 24% 40,000 11,222 28%
Regional Transp Council 21,300 21,300 100% 45,700 45,623 100%
Election Support 184,349 - 0% 200,000 - 0%
AWC, Chamber of Commerce Memberships 86,309 75,699 88% 80,818 77,552 96%
Opportunity Reserve 165,831 27,250 16% 177,922 15,622 9%
Miscellaneous 1,283,608 789,894 62% 2,664,384 138,835 5%
Miscellaneous 254,250 - 0% 7,319,571 5,376,430 73%
Public Defender 1,351,973 674,715 50% 1,466,298 726,993 50%
County Jail Costs 3,769,359 738,319 20% 4,348,854 4,721 0%
County Corrections Costs 1,385,759 602,292 43% 1,087,792 564,526 52%
County District Court Costs 1,015,954 300,860 30% 1,166,990 244,427 21%
General Obligation Debt Payment 5,908,141 749,339 13% 5,244,666 645,995 12%
General Govt Support 9,558,103 1,857,430 19% 8,139,885 1,364,676 17%
Street Support (formerly in General Support) 14,648,451 6,597,174 45% 13,599,744 6,258,109 46%
Fire Support (formerly in General Support) 30,886,091 30,386,091 98% 29,100,904 13,855,248 48%
LEOFF Pension Support (formerly in General Support)2,835,996 1,417,998 50% 2,900,000 1,450,002 50%
Subtotal General Govermental 74,922,627 45,051,988 60% 79,235,725 31,773,696 40%
Total General Fund 143,311,233 77,676,109 54% 160,052,370 69,432,215 43%
SPECIAL REVENUE FUNDS 125,414
Street 17,065,151 6,318,634 37% 21,194,520 7,223,207 34%
Street Initiative- NEW Fund 748,655 376,835 50% 4,684,183 405,084 9%
Fire Operating Fund 37,848,546 18,341,739 48% 42,844,745 20,062,985 47%
Fire Capital Fund 785,964 232,906 30% 2,376,285 520,389 22%
AMR Compliance Fund (New) 516,908 298,452 58% 638,502 84,499 13%
Drug Enforcement and Investigative Funds 334,745 4,817 1% 424,147 102,491 24%
Community Development Block Grant 2,569,835 1,309,743 51% 2,010,388 899,669 45%
Tourism 1,177,457 462,508 39% 2,529,137 658,269 26%
Criminal Justice/LLEBG 160,705 64,058 40% 700,470 964 0%
Real Estate Excise Tax - I 3,597,901 506,351 14% 3,340,950 449,006 13%
Transportation Special Revenue 2,279,917 609,612 27% 3,855,029 470,006 12%
Parks & Recreation Special Revenue 32,767 1,803 6% 30,214 107 0%
Downtown Initiatives 102,549 58,963 57% 1,152,026 61,329 5%
VNHR Properties 662,435 124,488 19% 1,042,080 189,448 18%
Senior Messenger 248,967 136,484 55% 352,640 133,849 38%
TIF Funds 2,082,380 227,607 11% 4,038,352 23,028 1%
PIF Funds 839,761 55,697 7% 7,926,198 - 0%
Second Quarter 2017 Financial Report City of Vancouver 30
Attachment A
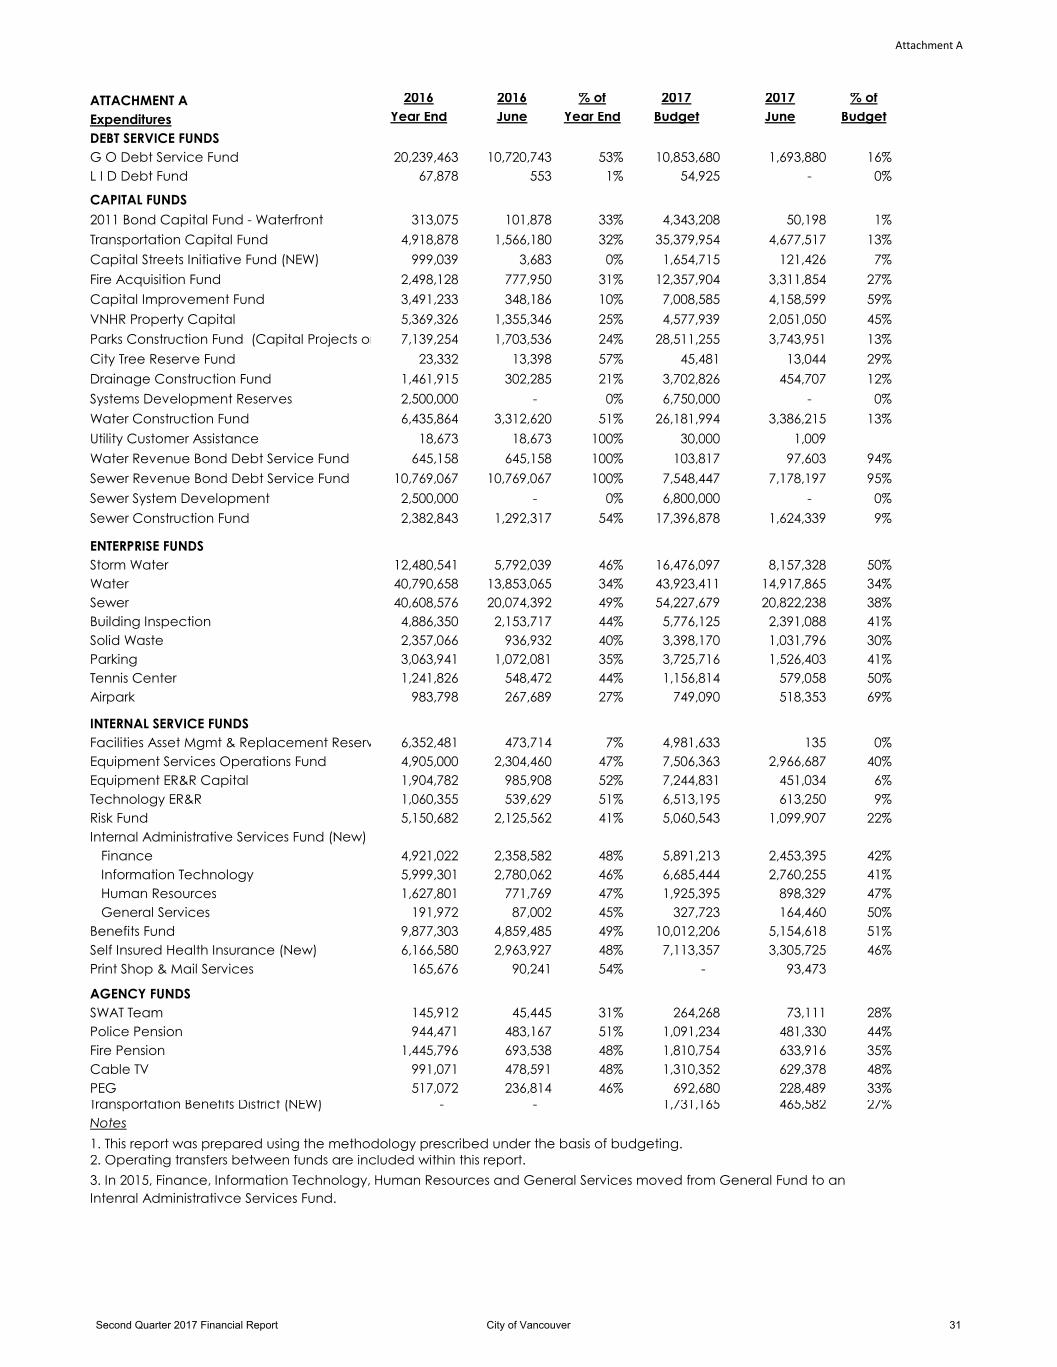
ATTACHMENT A 2016 2016 % of 2017 2017 % of
Expenditures Year End June Year End Budget June Budget
DEBT SERVICE FUNDS
G O Debt Service Fund 20,239,463 10,720,743 53% 10,853,680 1,693,880 16%
L I D Debt Fund 67,878 553 1% 54,925 - 0%#DIV/0! #DIV/0!
CAPITAL FUNDS
2011 Bond Capital Fund - Waterfront 313,075 101,878 33% 4,343,208 50,198 1%
Transportation Capital Fund 4,918,878 1,566,180 32% 35,379,954 4,677,517 13%
Capital Streets Initiative Fund (NEW) 999,039 3,683 0% 1,654,715 121,426 7%
Fire Acquisition Fund 2,498,128 777,950 31% 12,357,904 3,311,854 27%
Capital Improvement Fund 3,491,233 348,186 10% 7,008,585 4,158,599 59%
VNHR Property Capital 5,369,326 1,355,346 25% 4,577,939 2,051,050 45%
Parks Construction Fund (Capital Projects only) 7,139,254 1,703,536 24% 28,511,255 3,743,951 13%
City Tree Reserve Fund 23,332 13,398 57% 45,481 13,044 29%
Drainage Construction Fund 1,461,915 302,285 21% 3,702,826 454,707 12%
Systems Development Reserves 2,500,000 - 0% 6,750,000 - 0%
Water Construction Fund 6,435,864 3,312,620 51% 26,181,994 3,386,215 13%
Utility Customer Assistance 18,673 18,673 100% 30,000 1,009
Water Revenue Bond Debt Service Fund 645,158 645,158 100% 103,817 97,603 94%
Sewer Revenue Bond Debt Service Fund 10,769,067 10,769,067 100% 7,548,447 7,178,197 95%
Sewer System Development 2,500,000 - 0% 6,800,000 - 0%
Sewer Construction Fund 2,382,843 1,292,317 54% 17,396,878 1,624,339 9%
ENTERPRISE FUNDS
Storm Water 12,480,541 5,792,039 46% 16,476,097 8,157,328 50%
Water 40,790,658 13,853,065 34% 43,923,411 14,917,865 34%
Sewer 40,608,576 20,074,392 49% 54,227,679 20,822,238 38%
Building Inspection 4,886,350 2,153,717 44% 5,776,125 2,391,088 41%
Solid Waste 2,357,066 936,932 40% 3,398,170 1,031,796 30%
Parking 3,063,941 1,072,081 35% 3,725,716 1,526,403 41%
Tennis Center 1,241,826 548,472 44% 1,156,814 579,058 50%
Airpark 983,798 267,689 27% 749,090 518,353 69%
INTERNAL SERVICE FUNDS
Facilities Asset Mgmt & Replacement Reserve Fund6,352,481 473,714 7% 4,981,633 135 0%
Equipment Services Operations Fund 4,905,000 2,304,460 47% 7,506,363 2,966,687 40%
Equipment ER&R Capital 1,904,782 985,908 52% 7,244,831 451,034 6%
Technology ER&R 1,060,355 539,629 51% 6,513,195 613,250 9%
Risk Fund 5,150,682 2,125,562 41% 5,060,543 1,099,907 22%
Internal Administrative Services Fund (New)
Finance 4,921,022 2,358,582 48% 5,891,213 2,453,395 42%
Information Technology 5,999,301 2,780,062 46% 6,685,444 2,760,255 41%
Human Resources 1,627,801 771,769 47% 1,925,395 898,329 47%
General Services 191,972 87,002 45% 327,723 164,460 50%
Benefits Fund 9,877,303 4,859,485 49% 10,012,206 5,154,618 51%
Self Insured Health Insurance (New) 6,166,580 2,963,927 48% 7,113,357 3,305,725 46%
Print Shop & Mail Services 165,676 90,241 54% - 93,473
AGENCY FUNDS
SWAT Team 145,912 45,445 31% 264,268 73,111 28%
Police Pension 944,471 483,167 51% 1,091,234 481,330 44%
Fire Pension 1,445,796 693,538 48% 1,810,754 633,916 35%
Cable TV 991,071 478,591 48% 1,310,352 629,378 48%
PEG 517,072 236,814 46% 692,680 228,489 33%
Transportation Benefits District (NEW) - - 1,731,165 465,582 27%
Notes
2. Operating transfers between funds are included within this report.
1. This report was prepared using the methodology prescribed under the basis of budgeting.
3. In 2015, Finance, Information Technology, Human Resources and General Services moved from General Fund to an
Intenral Administrativce Services Fund.
Second Quarter 2017 Financial Report City of Vancouver 31
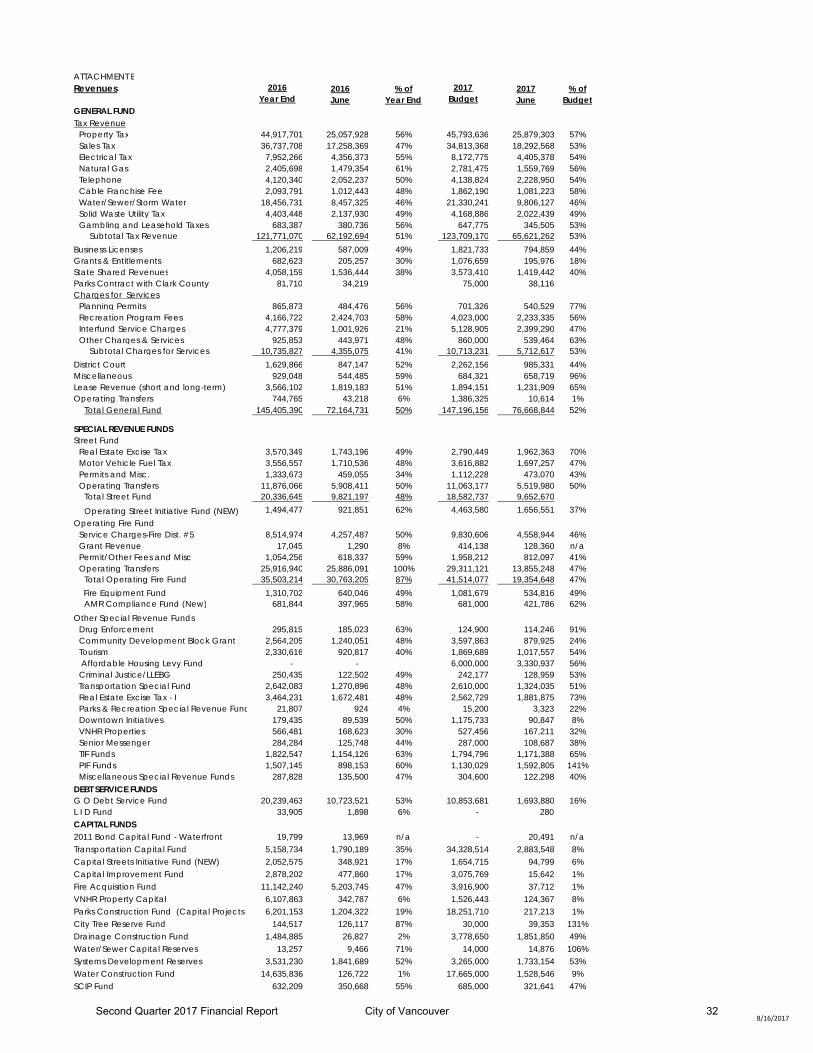
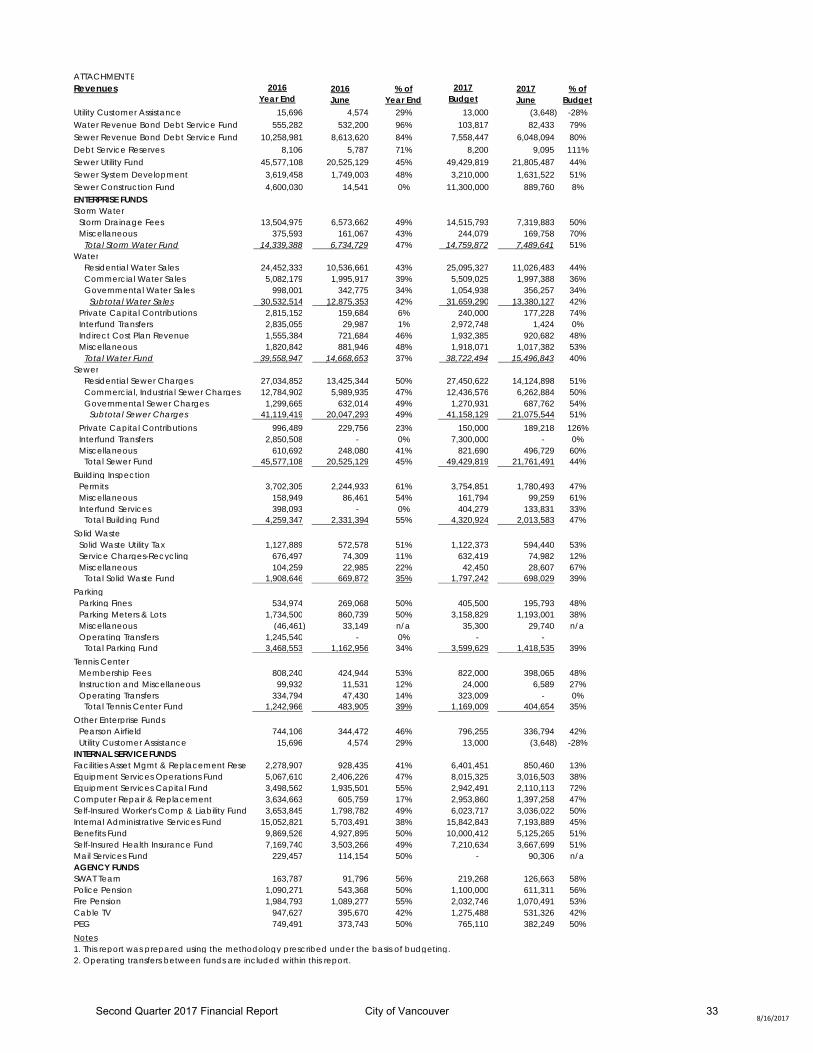
ATTACHMENT B ADJ-16 JUN-16 JUL-17 JUN-17Revenues 2016 2016 % of 2017 2017 % of
Year End June Year End Budget June BudgetGENERAL FUNDTax Revenue
Property Tax 44,917,701 25,057,928 56% 45,793,636 25,879,303 57%Sales Tax 36,737,708 17,258,369 47% 34,813,368 18,292,568 53%Electrical Tax 7,952,266 4,356,373 55% 8,172,775 4,405,378 54%Natural Gas 2,405,698 1,479,354 61% 2,781,475 1,559,769 56%Telephone 4,120,340 2,052,237 50% 4,138,824 2,228,950 54%Cable Franchise Fee 2,093,791 1,012,443 48% 1,862,190 1,081,223 58%Water/Sewer/Storm Water 18,456,731 8,457,325 46% 21,330,241 9,806,127 46%Solid Waste Utility Tax 4,403,448 2,137,930 49% 4,168,886 2,022,439 49%Gambling and Leasehold Taxes 683,387 380,736 56% 647,775 345,505 53%
Subtotal Tax Revenue 121,771,070 62,192,694 51% 123,709,170 65,621,262 53%Business Licenses 1,206,219 587,009 49% 1,821,733 794,859 44%Grants & Entitlements 682,623 205,257 30% 1,076,659 195,976 18%State Shared Revenues 4,058,159 1,536,444 38% 3,573,410 1,419,442 40%Parks Contract with Clark County 81,710 34,219 75,000 38,116 Charges for Services
Planning Permits 865,873 484,476 56% 701,326 540,529 77%Recreation Program Fees 4,166,722 2,424,703 58% 4,023,000 2,233,335 56%Interfund Service Charges 4,777,379 1,001,926 21% 5,128,905 2,399,290 47%Other Charges & Services 925,853 443,971 48% 860,000 539,464 63%
Subtotal Charges for Services 10,735,827 4,355,075 41% 10,713,231 5,712,617 53%District Court 1,629,866 847,147 52% 2,262,156 985,331 44%Miscellaneous 929,048 544,485 59% 684,321 658,719 96%Lease Revenue (short and long-term) 3,566,102 1,819,183 51% 1,894,151 1,231,909 65%Operating Transfers 744,765 43,218 6% 1,386,325 10,614 1%
Total General Fund 145,405,390 72,164,731 50% 147,196,156 76,668,844 52%
SPECIAL REVENUE FUNDSStreet Fund
Real Estate Excise Tax 3,570,349 1,743,196 49% 2,790,449 1,962,363 70%Motor Vehicle Fuel Tax 3,556,557 1,710,536 48% 3,616,882 1,697,257 47%Permits and Misc. 1,333,673 459,055 34% 1,112,228 473,070 43%Operating Transfers 11,876,066 5,908,411 50% 11,063,177 5,519,980 50%
Total Street Fund 20,336,645 9,821,197 48% 18,582,737 9,652,670
Operating Street Initiative Fund (NEW) 1,494,477 921,851 62% 4,463,580 1,656,551 37%Operating Fire Fund
Service Charges-Fire Dist. #5 8,514,974 4,257,487 50% 9,830,606 4,558,944 46%Grant Revenue 17,045 1,290 8% 414,138 128,360 n/aPermit/Other Fees and Misc 1,054,256 618,337 59% 1,958,212 812,097 41%Operating Transfers 25,916,940 25,886,091 100% 29,311,121 13,855,248 47%
Total Operating Fire Fund 35,503,214 30,763,205 87% 41,514,077 19,354,648 47% Fire Equipment Fund 1,310,702 640,046 49% 1,081,679 534,816 49%
AMR Compliance Fund (New) 681,844 397,965 58% 681,000 421,786 62%Other Special Revenue Funds
Drug Enforcement 295,815 185,023 63% 124,900 114,246 91%Community Development Block Grant 2,564,205 1,240,051 48% 3,597,863 879,925 24%Tourism 2,330,616 920,817 40% 1,869,689 1,017,557 54% Affordable Housing Levy Fund - - 6,000,000 3,330,937 56%Criminal Justice/LLEBG 250,435 122,502 49% 242,177 128,959 53%
Transportation Special Fund 2,642,083 1,270,896 48% 2,610,000 1,324,035 51%Real Estate Excise Tax - I 3,464,231 1,672,481 48% 2,562,729 1,881,875 73%Parks & Recreation Special Revenue Fund 21,807 924 4% 15,200 3,323 22%Downtown Initiatives 179,435 89,539 50% 1,175,733 90,847 8%VNHR Properties 566,481 168,623 30% 527,456 167,211 32%Senior Messenger 284,284 125,748 44% 287,000 108,687 38%TIF Funds 1,822,547 1,154,126 63% 1,794,796 1,171,388 65%PIF Funds 1,507,145 898,153 60% 1,130,029 1,592,805 141%Miscellaneous Special Revenue Funds 287,828 135,500 47% 304,600 122,298 40%
DEBT SERVICE FUNDSG O Debt Service Fund 20,239,463 10,723,521 53% 10,853,681 1,693,880 16%L I D Fund 33,905 1,898 6% - 280 CAPITAL FUNDS2011 Bond Capital Fund - Waterfront 19,799 13,969 n/a - 20,491 n/aTransportation Capital Fund 5,158,734 1,790,189 35% 34,328,514 2,883,548 8%Capital Streets Initiative Fund (NEW) 2,052,575 348,921 17% 1,654,715 94,799 6%Capital Improvement Fund 2,878,202 477,860 17% 3,075,769 15,642 1%Fire Acquisition Fund 11,142,240 5,203,745 47% 3,916,900 37,712 1%VNHR Property Capital 6,107,863 342,787 6% 1,526,443 124,367 8%Parks Construction Fund (Capital Projects o 6,201,153 1,204,322 19% 18,251,710 217,213 1%City Tree Reserve Fund 144,517 126,117 87% 30,000 39,353 131%Drainage Construction Fund 1,484,885 26,827 2% 3,778,650 1,851,850 49%Water/Sewer Capital Reserves 13,257 9,466 71% 14,000 14,876 106%Systems Development Reserves 3,531,230 1,841,689 52% 3,265,000 1,733,154 53%Water Construction Fund 14,635,836 126,722 1% 17,665,000 1,528,546 9%SCIP Fund 632,209 350,668 55% 685,000 321,641 47%
8/16/2017Second Quarter 2017 Financial Report City of Vancouver 32
ATTACHMENT B ADJ-16 JUN-16 JUL-17 JUN-17Revenues 2016 2016 % of 2017 2017 % of
Year End June Year End Budget June BudgetUtility Customer Assistance 15,696 4,574 29% 13,000 (3,648) -28%Water Revenue Bond Debt Service Fund 555,282 532,200 96% 103,817 82,433 79%Sewer Revenue Bond Debt Service Fund 10,258,981 8,613,620 84% 7,558,447 6,048,094 80%Debt Service Reserves 8,106 5,787 71% 8,200 9,095 111%Sewer Utility Fund 45,577,108 20,525,129 45% 49,429,819 21,805,487 44%Sewer System Development 3,619,458 1,749,003 48% 3,210,000 1,631,522 51%Sewer Construction Fund 4,600,030 14,541 0% 11,300,000 889,760 8%ENTERPRISE FUNDSStorm Water
Storm Drainage Fees 13,504,975 6,573,662 49% 14,515,793 7,319,883 50%Miscellaneous 375,593 161,067 43% 244,079 169,758 70%
Total Storm Water Fund 14,339,388 6,734,729 47% 14,759,872 7,489,641 51%Water
Residential Water Sales 24,452,333 10,536,661 43% 25,095,327 11,026,483 44%Commercial Water Sales 5,082,179 1,995,917 39% 5,509,025 1,997,388 36%Governmental Water Sales 998,001 342,775 34% 1,054,938 356,257 34%
Subtotal Water Sales 30,532,514 12,875,353 42% 31,659,290 13,380,127 42%Private Capital Contributions 2,815,152 159,684 6% 240,000 177,228 74%Interfund Transfers 2,835,055 29,987 1% 2,972,748 1,424 0%Indirect Cost Plan Revenue 1,555,384 721,684 46% 1,932,385 920,682 48%Miscellaneous 1,820,842 881,946 48% 1,918,071 1,017,382 53%
Total Water Fund 39,558,947 14,668,653 37% 38,722,494 15,496,843 40%Sewer
Residential Sewer Charges 27,034,852 13,425,344 50% 27,450,622 14,124,898 51%Commercial, Industrial Sewer Charges 12,784,902 5,989,935 47% 12,436,576 6,262,884 50%Governmental Sewer Charges 1,299,665 632,014 49% 1,270,931 687,762 54%
Subtotal Sewer Charges 41,119,419 20,047,293 49% 41,158,129 21,075,544 51%Private Capital Contributions 996,489 229,756 23% 150,000 189,218 126%Interfund Transfers 2,850,508 - 0% 7,300,000 - 0%Miscellaneous 610,692 248,080 41% 821,690 496,729 60%
Total Sewer Fund 45,577,108 20,525,129 45% 49,429,819 21,761,491 44%Building Inspection
Permits 3,702,305 2,244,933 61% 3,754,851 1,780,493 47%Miscellaneous 158,949 86,461 54% 161,794 99,259 61%Interfund Services 398,093 - 0% 404,279 133,831 33%
Total Building Fund 4,259,347 2,331,394 55% 4,320,924 2,013,583 47%Solid Waste
Solid Waste Utility Tax 1,127,889 572,578 51% 1,122,373 594,440 53%Service Charges-Recycling 676,497 74,309 11% 632,419 74,982 12%Miscellaneous 104,259 22,985 22% 42,450 28,607 67%
Total Solid Waste Fund 1,908,646 669,872 35% 1,797,242 698,029 39%Parking
Parking Fines 534,974 269,068 50% 405,500 195,793 48%Parking Meters & Lots 1,734,500 860,739 50% 3,158,829 1,193,001 38%Miscellaneous (46,461) 33,149 n/a 35,300 29,740 n/aOperating Transfers 1,245,540 - 0% - -
Total Parking Fund 3,468,553 1,162,956 34% 3,599,629 1,418,535 39%Tennis Center
Membership Fees 808,240 424,944 53% 822,000 398,065 48%Instruction and Miscellaneous 99,932 11,531 12% 24,000 6,589 27%Operating Transfers 334,794 47,430 14% 323,009 - 0%
Total Tennis Center Fund 1,242,966 483,905 39% 1,169,009 404,654 35%Other Enterprise Funds
Pearson Airfield 744,106 344,472 46% 796,255 336,794 42%Utility Customer Assistance 15,696 4,574 29% 13,000 (3,648) -28%
INTERNAL SERVICE FUNDSFacilities Asset Mgmt & Replacement Reser 2,278,907 928,435 41% 6,401,451 850,460 13%Equipment Services Operations Fund 5,067,610 2,406,226 47% 8,015,325 3,016,503 38%Equipment Services Capital Fund 3,498,562 1,935,501 55% 2,942,491 2,110,113 72%Computer Repair & Replacement 3,634,663 605,759 17% 2,953,860 1,397,258 47%Self-Insured Worker's Comp & Liability Fund 3,653,845 1,798,782 49% 6,023,717 3,036,022 50%Internal Administrative Services Fund 15,052,821 5,703,491 38% 15,842,843 7,193,889 45%Benefits Fund 9,869,526 4,927,895 50% 10,000,412 5,125,265 51%Self-Insured Health Insurance Fund 7,169,740 3,503,266 49% 7,210,634 3,667,699 51%Mail Services Fund 229,457 114,154 50% - 90,306 n/aAGENCY FUNDSSWAT Team 163,787 91,796 56% 219,268 126,663 58%Police Pension 1,090,271 543,368 50% 1,100,000 611,311 56%Fire Pension 1,984,793 1,089,277 55% 2,032,746 1,070,491 53%Cable TV 947,627 395,670 42% 1,275,488 531,326 42%PEG 749,491 373,743 50% 765,110 382,249 50%Notes1. This report was prepared using the methodology prescribed under the basis of budgeting.2. Operating transfers between funds are included within this report.
8/16/2017Second Quarter 2017 Financial Report City of Vancouver 33
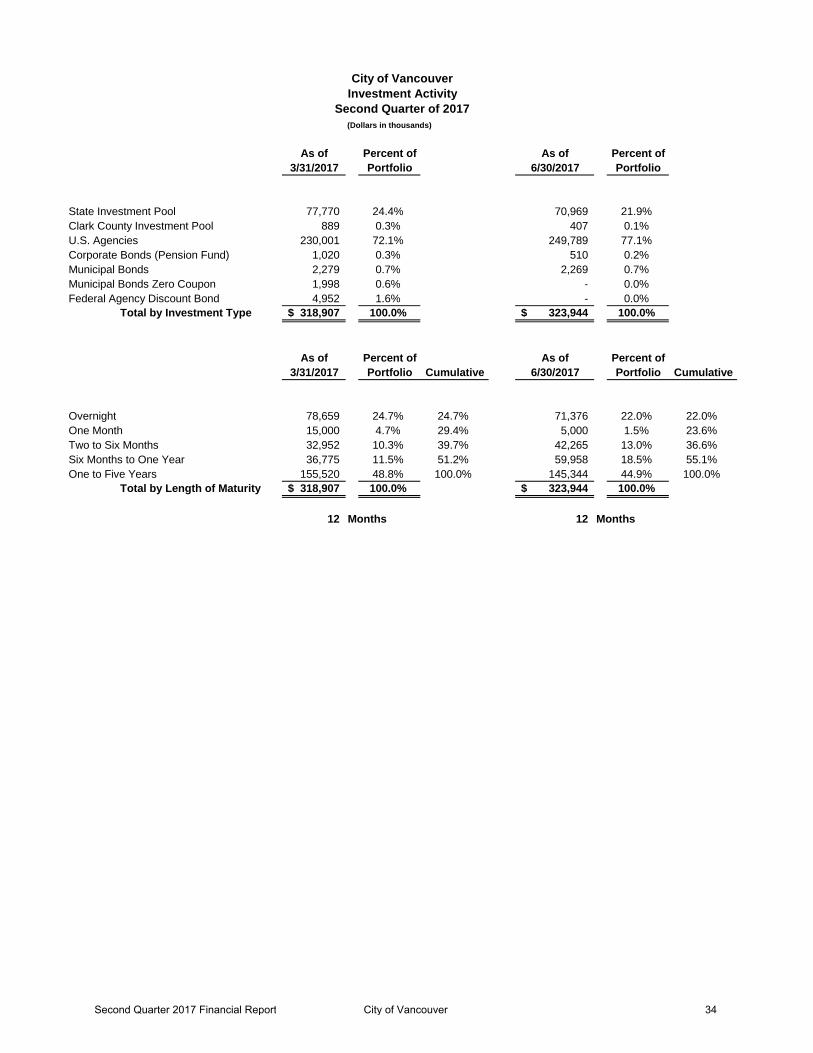
City of VancouverInvestment Activity
Second Quarter of 2017(Dollars in thousands)
As of Percent of As of Percent of3/31/2017 Portfolio 6/30/2017 Portfolio
State Investment Pool 77,770 24.4% 70,969 21.9%Clark County Investment Pool 889 0.3% 407 0.1%U.S. Agencies 230,001 72.1% 249,789 77.1%Corporate Bonds (Pension Fund) 1,020 0.3% 510 0.2%Municipal Bonds 2,279 0.7% 2,269 0.7%Municipal Bonds Zero Coupon 1,998 0.6% - 0.0%Federal Agency Discount Bond 4,952 1.6% - 0.0%
Total by Investment Type 318,907$ 100.0% 323,944$ 100.0%
As of Percent of As of Percent of3/31/2017 Portfolio Cumulative 6/30/2017 Portfolio Cumulative
Overnight 78,659 24.7% 24.7% 71,376 22.0% 22.0%One Month 15,000 4.7% 29.4% 5,000 1.5% 23.6%Two to Six Months 32,952 10.3% 39.7% 42,265 13.0% 36.6%Six Months to One Year 36,775 11.5% 51.2% 59,958 18.5% 55.1%One to Five Years 155,520 48.8% 100.0% 145,344 44.9% 100.0%
Total by Length of Maturity 318,907$ 100.0% 323,944$ 100.0%
12 Months 12 Months
Second Quarter 2017 Financial Report City of Vancouver 34
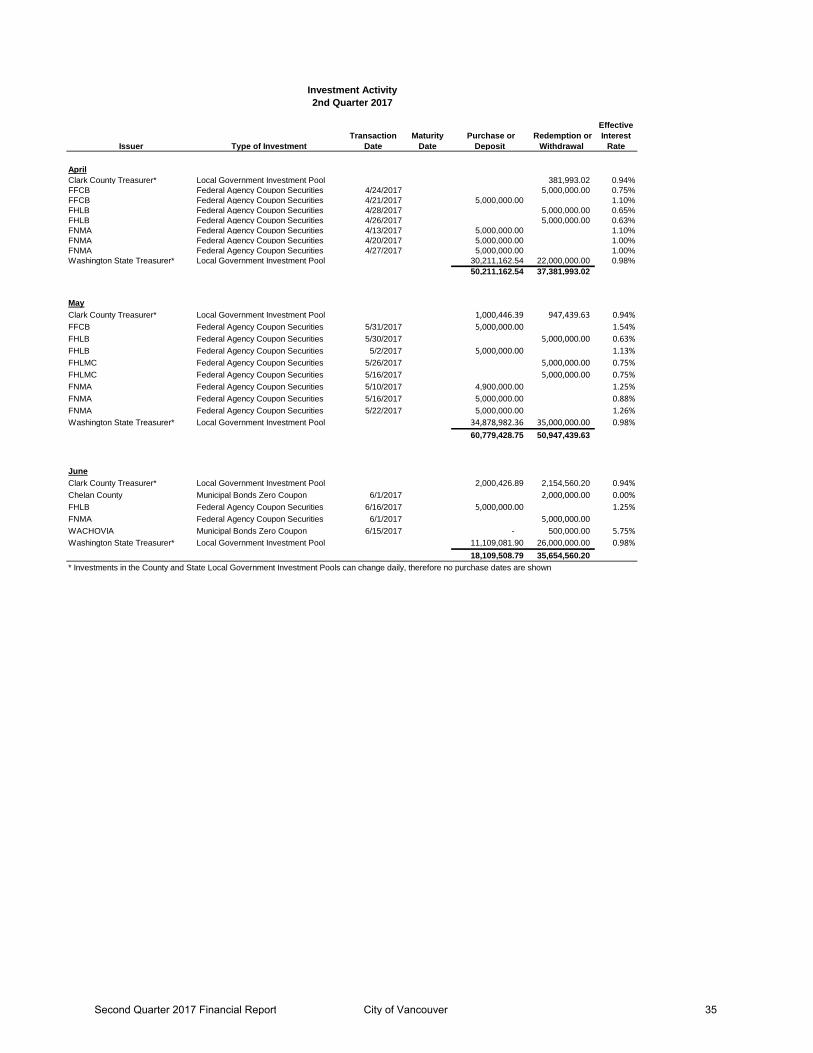
Investment Activity2nd Quarter 2017
Issuer Type of InvestmentTransaction
DateMaturity
Date Purchase or
Deposit Redemption or
Withdrawal
Effective Interest
Rate
AprilClark County Treasurer* Local Government Investment Pool 381,993.02 0.94%FFCB Federal Agency Coupon Securities 4/24/2017 5,000,000.00 0.75%FFCB Federal Agency Coupon Securities 4/21/2017 5,000,000.00 1.10%FHLB Federal Agency Coupon Securities 4/28/2017 5,000,000.00 0.65%FHLB Federal Agency Coupon Securities 4/26/2017 5,000,000.00 0.63%FNMA Federal Agency Coupon Securities 4/13/2017 5,000,000.00 1.10%FNMA Federal Agency Coupon Securities 4/20/2017 5,000,000.00 1.00%FNMA Federal Agency Coupon Securities 4/27/2017 5,000,000.00 1.00%Washington State Treasurer* Local Government Investment Pool 30,211,162.54 22,000,000.00 0.98%
50,211,162.54 37,381,993.02
MayClark County Treasurer* Local Government Investment Pool 1,000,446.39 947,439.63 0.94%FFCB Federal Agency Coupon Securities 5/31/2017 5,000,000.00 1.54%FHLB Federal Agency Coupon Securities 5/30/2017 5,000,000.00 0.63%FHLB Federal Agency Coupon Securities 5/2/2017 5,000,000.00 1.13%FHLMC Federal Agency Coupon Securities 5/26/2017 5,000,000.00 0.75%FHLMC Federal Agency Coupon Securities 5/16/2017 5,000,000.00 0.75%FNMA Federal Agency Coupon Securities 5/10/2017 4,900,000.00 1.25%FNMA Federal Agency Coupon Securities 5/16/2017 5,000,000.00 0.88%FNMA Federal Agency Coupon Securities 5/22/2017 5,000,000.00 1.26%Washington State Treasurer* Local Government Investment Pool 34,878,982.36 35,000,000.00 0.98%
60,779,428.75 50,947,439.63
JuneClark County Treasurer* Local Government Investment Pool 2,000,426.89 2,154,560.20 0.94%Chelan County Municipal Bonds Zero Coupon 6/1/2017 2,000,000.00 0.00%FHLB Federal Agency Coupon Securities 6/16/2017 5,000,000.00 1.25%FNMA Federal Agency Coupon Securities 6/1/2017 5,000,000.00 WACHOVIA Municipal Bonds Zero Coupon 6/15/2017 - 500,000.00 5.75%Washington State Treasurer* Local Government Investment Pool 11,109,081.90 26,000,000.00 0.98%
18,109,508.79 35,654,560.20 * Investments in the County and State Local Government Investment Pools can change daily, therefore no purchase dates are shown
Second Quarter 2017 Financial Report City of Vancouver 35
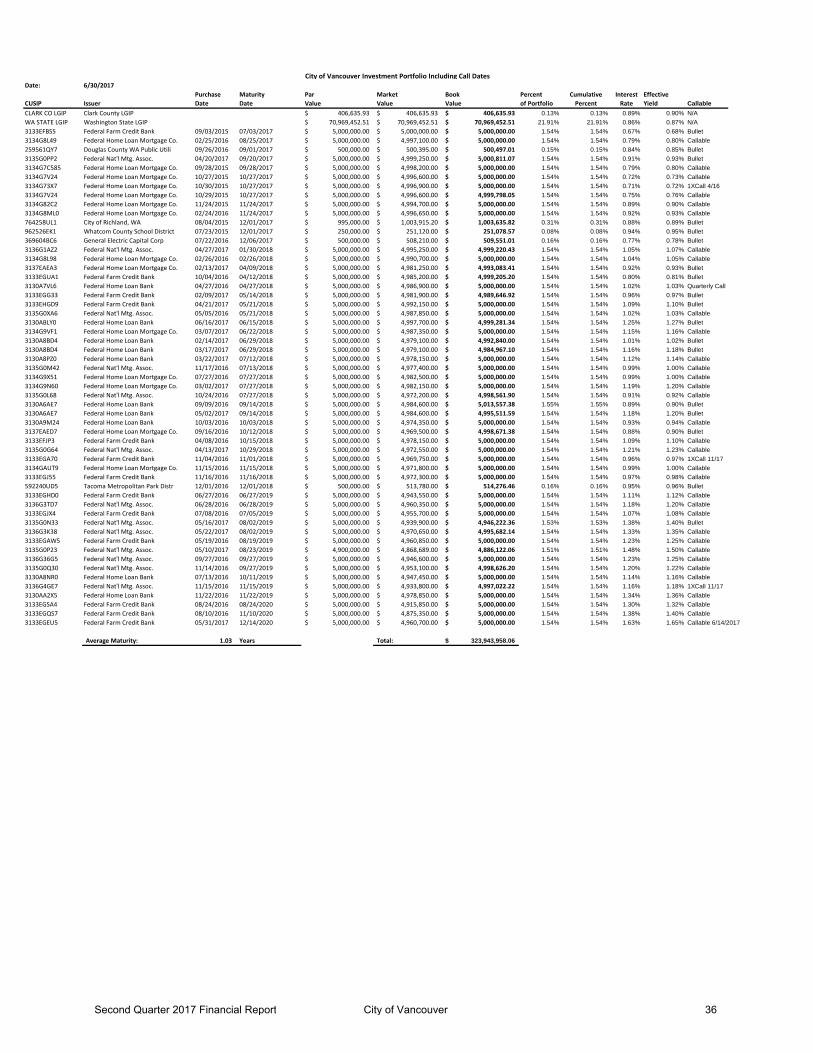
City of Vancouver Investment Portfolio Including Call DatesDate: 6/30/2017
Purchase Maturity Par Market Book Percent Cumulative Interest EffectiveCUSIP Issuer Date Date Value Value Value of Portfolio Percent Rate Yield CallableCLARK CO LGIP Clark County LGIP 406,635.93$ 406,635.93$ 406,635.93$ 0.13% 0.13% 0.89% 0.90% N/AWA STATE LGIP Washington State LGIP 70,969,452.51$ 70,969,452.51$ 70,969,452.51$ 21.91% 21.91% 0.86% 0.87% N/A3133EFBS5 Federal Farm Credit Bank 09/03/2015 07/03/2017 5,000,000.00$ 5,000,000.00$ 5,000,000.00$ 1.54% 1.54% 0.67% 0.68% Bullet3134G8L49 Federal Home Loan Mortgage Co. 02/25/2016 08/25/2017 5,000,000.00$ 4,997,100.00$ 5,000,000.00$ 1.54% 1.54% 0.79% 0.80% Callable259561QY7 Douglas County WA Public Utili 09/26/2016 09/01/2017 500,000.00$ 500,395.00$ 500,497.01$ 0.15% 0.15% 0.84% 0.85% Bullet3135G0PP2 Federal Nat'l Mtg. Assoc. 04/20/2017 09/20/2017 5,000,000.00$ 4,999,250.00$ 5,000,811.07$ 1.54% 1.54% 0.91% 0.93% Bullet3134G7C585 Federal Home Loan Mortgage Co. 09/28/2015 09/28/2017 5,000,000.00$ 4,998,200.00$ 5,000,000.00$ 1.54% 1.54% 0.79% 0.80% Callable3134G7V24 Federal Home Loan Mortgage Co. 10/27/2015 10/27/2017 5,000,000.00$ 4,996,600.00$ 5,000,000.00$ 1.54% 1.54% 0.72% 0.73% Callable3134G73X7 Federal Home Loan Mortgage Co. 10/30/2015 10/27/2017 5,000,000.00$ 4,996,900.00$ 5,000,000.00$ 1.54% 1.54% 0.71% 0.72% 1XCall 4/163134G7V24 Federal Home Loan Mortgage Co. 10/29/2015 10/27/2017 5,000,000.00$ 4,996,600.00$ 4,999,798.05$ 1.54% 1.54% 0.75% 0.76% Callable3134G82C2 Federal Home Loan Mortgage Co. 11/24/2015 11/24/2017 5,000,000.00$ 4,994,700.00$ 5,000,000.00$ 1.54% 1.54% 0.89% 0.90% Callable3134G8ML0 Federal Home Loan Mortgage Co. 02/24/2016 11/24/2017 5,000,000.00$ 4,996,650.00$ 5,000,000.00$ 1.54% 1.54% 0.92% 0.93% Callable764258UL1 City of Richland, WA 08/04/2015 12/01/2017 995,000.00$ 1,003,915.20$ 1,003,635.82$ 0.31% 0.31% 0.88% 0.89% Bullet962526EK1 Whatcom County School District 07/23/2015 12/01/2017 250,000.00$ 251,120.00$ 251,078.57$ 0.08% 0.08% 0.94% 0.95% Bullet369604BC6 General Electric Capital Corp 07/22/2016 12/06/2017 500,000.00$ 508,210.00$ 509,551.01$ 0.16% 0.16% 0.77% 0.78% Bullet3136G1AZ2 Federal Nat'l Mtg. Assoc. 04/27/2017 01/30/2018 5,000,000.00$ 4,995,250.00$ 4,999,220.43$ 1.54% 1.54% 1.05% 1.07% Callable3134G8L98 Federal Home Loan Mortgage Co. 02/26/2016 02/26/2018 5,000,000.00$ 4,990,700.00$ 5,000,000.00$ 1.54% 1.54% 1.04% 1.05% Callable3137EAEA3 Federal Home Loan Mortgage Co. 02/13/2017 04/09/2018 5,000,000.00$ 4,981,250.00$ 4,993,083.41$ 1.54% 1.54% 0.92% 0.93% Bullet3133EGUA1 Federal Farm Credit Bank 10/04/2016 04/12/2018 5,000,000.00$ 4,985,200.00$ 4,999,205.20$ 1.54% 1.54% 0.80% 0.81% Bullet3130A7VL6 Federal Home Loan Bank 04/27/2016 04/27/2018 5,000,000.00$ 4,986,900.00$ 5,000,000.00$ 1.54% 1.54% 1.02% 1.03% Quarterly Call3133EGG33 Federal Farm Credit Bank 02/09/2017 05/14/2018 5,000,000.00$ 4,981,900.00$ 4,989,646.92$ 1.54% 1.54% 0.96% 0.97% Bullet3133EHGD9 Federal Farm Credit Bank 04/21/2017 05/21/2018 5,000,000.00$ 4,992,150.00$ 5,000,000.00$ 1.54% 1.54% 1.09% 1.10% Bullet3135G0XA6 Federal Nat'l Mtg. Assoc. 05/05/2016 05/21/2018 5,000,000.00$ 4,987,850.00$ 5,000,000.00$ 1.54% 1.54% 1.02% 1.03% Callable3130ABLY0 Federal Home Loan Bank 06/16/2017 06/15/2018 5,000,000.00$ 4,997,700.00$ 4,999,281.34$ 1.54% 1.54% 1.25% 1.27% Bullet3134G9VF1 Federal Home Loan Mortgage Co. 03/07/2017 06/22/2018 5,000,000.00$ 4,987,350.00$ 5,000,000.00$ 1.54% 1.54% 1.15% 1.16% Callable3130A8BD4 Federal Home Loan Bank 02/14/2017 06/29/2018 5,000,000.00$ 4,979,100.00$ 4,992,840.00$ 1.54% 1.54% 1.01% 1.02% Bullet3130A8BD4 Federal Home Loan Bank 03/17/2017 06/29/2018 5,000,000.00$ 4,979,100.00$ 4,984,967.10$ 1.54% 1.54% 1.16% 1.18% Bullet3130A8PZ0 Federal Home Loan Bank 03/22/2017 07/12/2018 5,000,000.00$ 4,978,150.00$ 5,000,000.00$ 1.54% 1.54% 1.12% 1.14% Callable3135G0M42 Federal Nat'l Mtg. Assoc. 11/17/2016 07/13/2018 5,000,000.00$ 4,977,400.00$ 5,000,000.00$ 1.54% 1.54% 0.99% 1.00% Callable3134G9X51 Federal Home Loan Mortgage Co. 07/27/2016 07/27/2018 5,000,000.00$ 4,982,500.00$ 5,000,000.00$ 1.54% 1.54% 0.99% 1.00% Callable3134G9N60 Federal Home Loan Mortgage Co. 03/02/2017 07/27/2018 5,000,000.00$ 4,982,150.00$ 5,000,000.00$ 1.54% 1.54% 1.19% 1.20% Callable3135G0L68 Federal Nat'l Mtg. Assoc. 10/24/2016 07/27/2018 5,000,000.00$ 4,972,200.00$ 4,998,561.90$ 1.54% 1.54% 0.91% 0.92% Callable3130A6AE7 Federal Home Loan Bank 09/09/2016 09/14/2018 5,000,000.00$ 4,984,600.00$ 5,013,557.38$ 1.55% 1.55% 0.89% 0.90% Bullet3130A6AE7 Federal Home Loan Bank 05/02/2017 09/14/2018 5,000,000.00$ 4,984,600.00$ 4,995,511.59$ 1.54% 1.54% 1.18% 1.20% Bullet3130A9M24 Federal Home Loan Bank 10/03/2016 10/03/2018 5,000,000.00$ 4,974,350.00$ 5,000,000.00$ 1.54% 1.54% 0.93% 0.94% Callable3137EAED7 Federal Home Loan Mortgage Co. 09/16/2016 10/12/2018 5,000,000.00$ 4,969,500.00$ 4,998,671.38$ 1.54% 1.54% 0.88% 0.90% Bullet3133EFJP3 Federal Farm Credit Bank 04/08/2016 10/15/2018 5,000,000.00$ 4,978,150.00$ 5,000,000.00$ 1.54% 1.54% 1.09% 1.10% Callable3135G0G64 Federal Nat'l Mtg. Assoc. 04/13/2017 10/29/2018 5,000,000.00$ 4,972,550.00$ 5,000,000.00$ 1.54% 1.54% 1.21% 1.23% Callable3133EGA70 Federal Farm Credit Bank 11/04/2016 11/01/2018 5,000,000.00$ 4,969,750.00$ 5,000,000.00$ 1.54% 1.54% 0.96% 0.97% 1XCall 11/173134GAUT9 Federal Home Loan Mortgage Co. 11/15/2016 11/15/2018 5,000,000.00$ 4,971,800.00$ 5,000,000.00$ 1.54% 1.54% 0.99% 1.00% Callable3133EGJ55 Federal Farm Credit Bank 11/16/2016 11/16/2018 5,000,000.00$ 4,972,300.00$ 5,000,000.00$ 1.54% 1.54% 0.97% 0.98% Callable592240UD5 Tacoma Metropolitan Park Distr 12/01/2016 12/01/2018 500,000.00$ 513,780.00$ 514,276.46$ 0.16% 0.16% 0.95% 0.96% Bullet3133EGHD0 Federal Farm Credit Bank 06/27/2016 06/27/2019 5,000,000.00$ 4,943,550.00$ 5,000,000.00$ 1.54% 1.54% 1.11% 1.12% Callable3136G3TD7 Federal Nat'l Mtg. Assoc. 06/28/2016 06/28/2019 5,000,000.00$ 4,960,350.00$ 5,000,000.00$ 1.54% 1.54% 1.18% 1.20% Callable3133EGJX4 Federal Farm Credit Bank 07/08/2016 07/05/2019 5,000,000.00$ 4,955,700.00$ 5,000,000.00$ 1.54% 1.54% 1.07% 1.08% Callable3135G0N33 Federal Nat'l Mtg. Assoc. 05/16/2017 08/02/2019 5,000,000.00$ 4,939,900.00$ 4,946,222.36$ 1.53% 1.53% 1.38% 1.40% Bullet3136G3K38 Federal Nat'l Mtg. Assoc. 05/22/2017 08/02/2019 5,000,000.00$ 4,970,650.00$ 4,995,682.14$ 1.54% 1.54% 1.33% 1.35% Callable3133EGAW5 Federal Farm Credit Bank 05/19/2016 08/19/2019 5,000,000.00$ 4,960,850.00$ 5,000,000.00$ 1.54% 1.54% 1.23% 1.25% Callable3135G0P23 Federal Nat'l Mtg. Assoc. 05/10/2017 08/23/2019 4,900,000.00$ 4,868,689.00$ 4,886,122.06$ 1.51% 1.51% 1.48% 1.50% Callable3136G36G5 Federal Nat'l Mtg. Assoc. 09/27/2016 09/27/2019 5,000,000.00$ 4,946,600.00$ 5,000,000.00$ 1.54% 1.54% 1.23% 1.25% Callable3135G0Q30 Federal Nat'l Mtg. Assoc. 11/14/2016 09/27/2019 5,000,000.00$ 4,953,100.00$ 4,998,626.20$ 1.54% 1.54% 1.20% 1.22% Callable3130A8NR0 Federal Home Loan Bank 07/13/2016 10/11/2019 5,000,000.00$ 4,947,450.00$ 5,000,000.00$ 1.54% 1.54% 1.14% 1.16% Callable3136G4GE7 Federal Nat'l Mtg. Assoc. 11/15/2016 11/15/2019 5,000,000.00$ 4,933,800.00$ 4,997,022.22$ 1.54% 1.54% 1.16% 1.18% 1XCall 11/173130AA2X5 Federal Home Loan Bank 11/22/2016 11/22/2019 5,000,000.00$ 4,978,850.00$ 5,000,000.00$ 1.54% 1.54% 1.34% 1.36% Callable3133EGSA4 Federal Farm Credit Bank 08/24/2016 08/24/2020 5,000,000.00$ 4,915,850.00$ 5,000,000.00$ 1.54% 1.54% 1.30% 1.32% Callable3133EGQS7 Federal Farm Credit Bank 08/10/2016 11/10/2020 5,000,000.00$ 4,875,350.00$ 5,000,000.00$ 1.54% 1.54% 1.38% 1.40% Callable3133EGEU5 Federal Farm Credit Bank 05/31/2017 12/14/2020 5,000,000.00$ 4,960,700.00$ 5,000,000.00$ 1.54% 1.54% 1.63% 1.65% Callable 6/14/2017
Average Maturity: 1.03 Years Total: 323,943,958.06$
Second Quarter 2017 Financial Report City of Vancouver 36
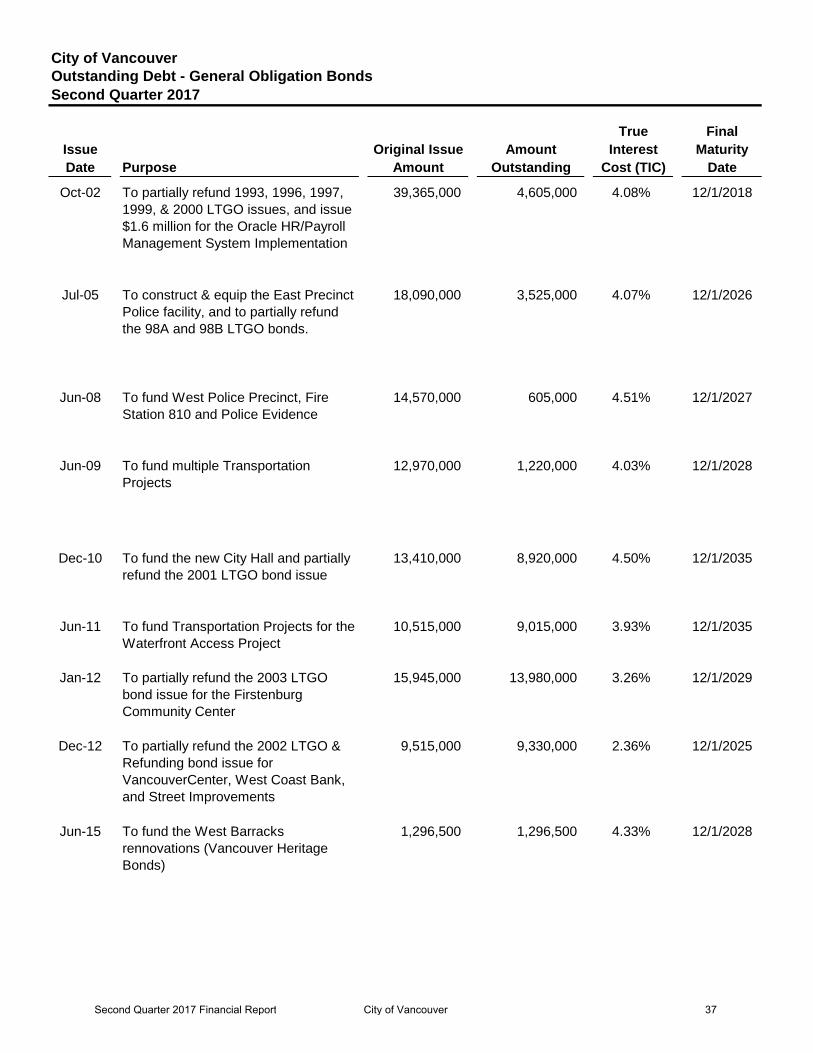
City of VancouverOutstanding Debt - General Obligation BondsSecond Quarter 2017
True FinalIssue Original Issue Amount Interest MaturityDate Purpose Amount Outstanding Cost (TIC) Date
Oct-02 To partially refund 1993, 1996, 1997, 1999, & 2000 LTGO issues, and issue $1.6 million for the Oracle HR/Payroll Management System Implementation
39,365,000 4,605,000 4.08% 12/1/2018
Jul-05 To construct & equip the East Precinct Police facility, and to partially refund the 98A and 98B LTGO bonds.
18,090,000 3,525,000 4.07% 12/1/2026
Jun-08 To fund West Police Precinct, Fire Station 810 and Police Evidence
14,570,000 605,000 4.51% 12/1/2027
Jun-09 To fund multiple Transportation Projects
12,970,000 1,220,000 4.03% 12/1/2028
Dec-10 To fund the new City Hall and partially refund the 2001 LTGO bond issue
13,410,000 8,920,000 4.50% 12/1/2035
Jun-11 To fund Transportation Projects for the Waterfront Access Project
10,515,000 9,015,000 3.93% 12/1/2035
Jan-12 To partially refund the 2003 LTGO bond issue for the Firstenburg Community Center
15,945,000 13,980,000 3.26% 12/1/2029
Dec-12 To partially refund the 2002 LTGO & Refunding bond issue for VancouverCenter, West Coast Bank, and Street Improvements
9,515,000 9,330,000 2.36% 12/1/2025
Jun-15 To fund the West Barracks rennovations (Vancouver Heritage Bonds)
1,296,500 1,296,500 4.33% 12/1/2028
Second Quarter 2017 Financial Report City of Vancouver 37
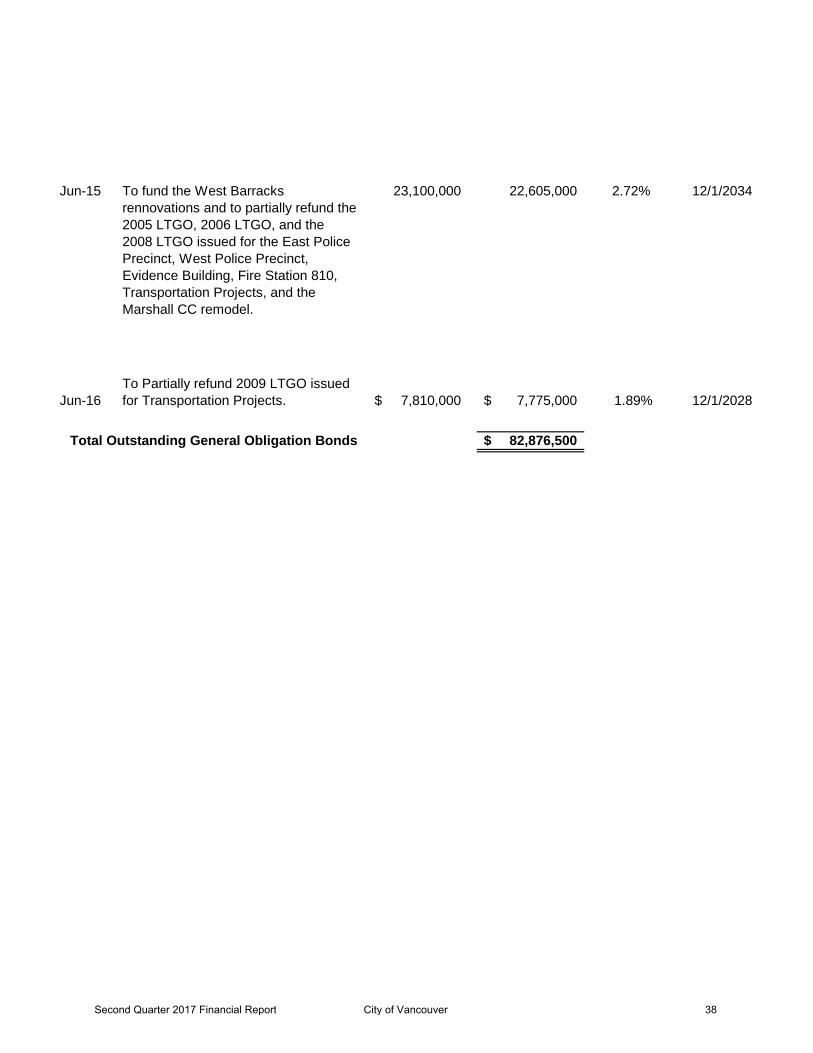
Jun-15 To fund the West Barracks rennovations and to partially refund the 2005 LTGO, 2006 LTGO, and the 2008 LTGO issued for the East Police Precinct, West Police Precinct, Evidence Building, Fire Station 810, Transportation Projects, and the Marshall CC remodel.
23,100,000 22,605,000 2.72% 12/1/2034
Jun-16To Partially refund 2009 LTGO issued for Transportation Projects. 7,810,000$ 7,775,000$ 1.89% 12/1/2028
Total Outstanding General Obligation Bonds 82,876,500$
Second Quarter 2017 Financial Report City of Vancouver 38
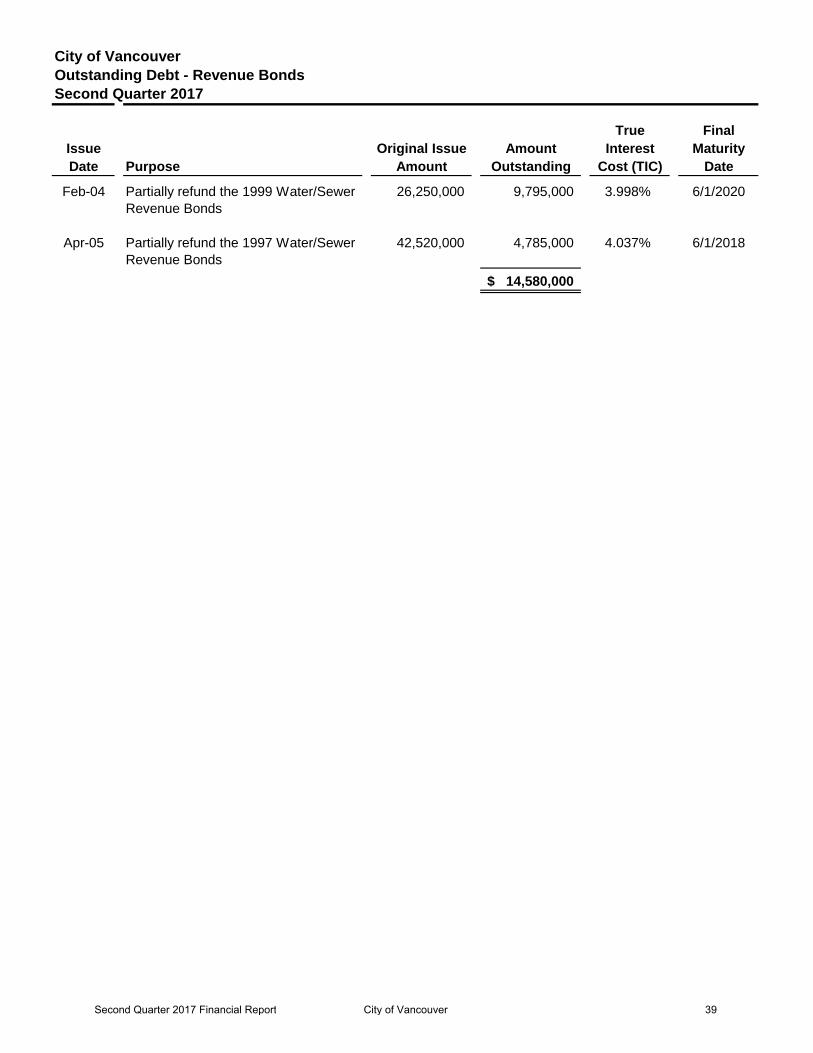
City of VancouverOutstanding Debt - Revenue BondsSecond Quarter 2017
True FinalIssue Original Issue Amount Interest MaturityDate Purpose Amount Outstanding Cost (TIC) Date
Feb-04 Partially refund the 1999 Water/Sewer Revenue Bonds
26,250,000 9,795,000 3.998% 6/1/2020
Apr-05 Partially refund the 1997 Water/Sewer Revenue Bonds
42,520,000 4,785,000 4.037% 6/1/2018
14,580,000$
Second Quarter 2017 Financial Report City of Vancouver 39