quarterly financial report q1 2017 - city of vancouver home · quarterly financial report . ......
TRANSCRIPT
"A colorful past, a bright future"
Quarterly Financial Report
First Quarter 2017
First Quarter 2017 Financial Report City of Vancouver 1
First Quarter 2017 Financial Report (This report contains un-audited financial information as of May 17, 2017)
Table of Contents
Section Page
I. Executive Summary 3 II. Economic Report 4 III. Financial Results 14 IV. Outstanding Debt 28 V. Investments 28 VI. Interfund Loans 30
Attachments
A Expenditure Summary by Fund 31 B Revenue Summary by Fund 34 C Investment Portfolio Tables 37 D Outstanding Debt 40
- - - - - For additional information on the City’s financial performance please contact Natasha Ramras in the City’s Financial & Management Services Department at 360-487-8484.
I. Executive Summary
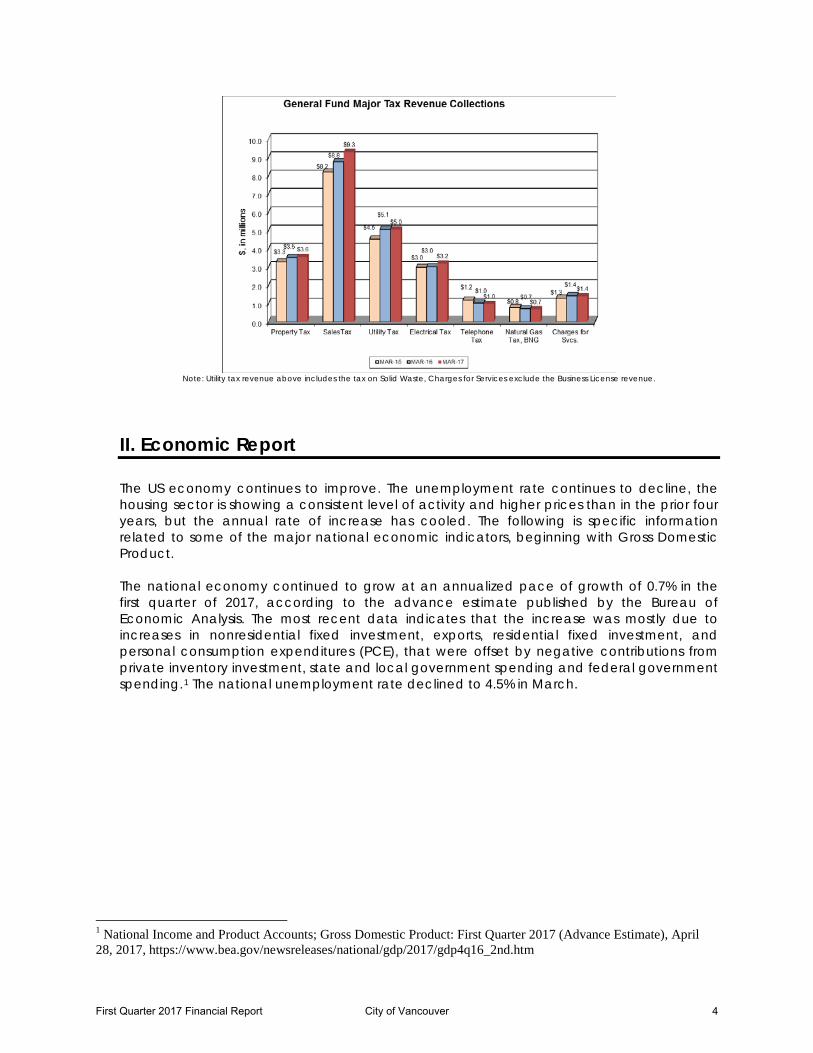
The national economy continued to grow through the first quarter of 2017, but the pace of growth has slowed down to the annualized rate of 0.7%, according to the “advance” estimate published by the Bureau of Economic Analysis. The most recent data indicates that the increase was mostly due to increases in nonresidential fixed investment, exports, residential fixed investment and personal consumption expenditures (PCE), that were offset by negative contributions from private inventory investment, state and local government spending and federal government spending. The national unemployment rate fell to 4.5% in March of 2017.
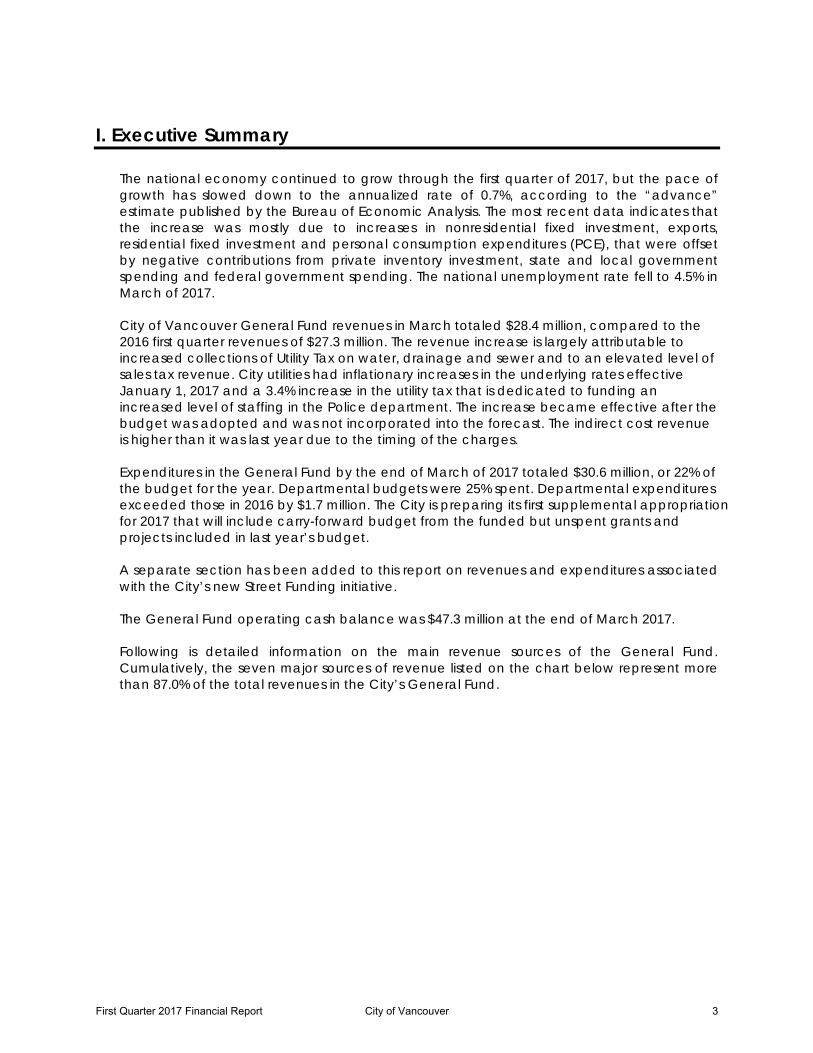
City of Vancouver General Fund revenues in March totaled $28.4 million, compared to the 2016 first quarter revenues of $27.3 million. The revenue increase is largely attributable to increased collections of Utility Tax on water, drainage and sewer and to an elevated level of sales tax revenue. City utilities had inflationary increases in the underlying rates effective January 1, 2017 and a 3.4% increase in the utility tax that is dedicated to funding an increased level of staffing in the Police department. The increase became effective after the budget was adopted and was not incorporated into the forecast. The indirect cost revenue is higher than it was last year due to the timing of the charges. Expenditures in the General Fund by the end of March of 2017 totaled $30.6 million, or 22% of the budget for the year. Departmental budgets were 25% spent. Departmental expenditures exceeded those in 2016 by $1.7 million. The City is preparing its first supplemental appropriation for 2017 that will include carry-forward budget from the funded but unspent grants and projects included in last year’s budget. A separate section has been added to this report on revenues and expenditures associated with the City’s new Street Funding initiative. The General Fund operating cash balance was $47.3 million at the end of March 2017. Following is detailed information on the main revenue sources of the General Fund. Cumulatively, the seven major sources of revenue listed on the chart below represent more than 87.0% of the total revenues in the City’s General Fund.
First Quarter 2017 Financial Report City of Vancouver 3
Note: Utility tax revenue above includes the tax on Solid Waste, Charges for Services exclude the Business License revenue.
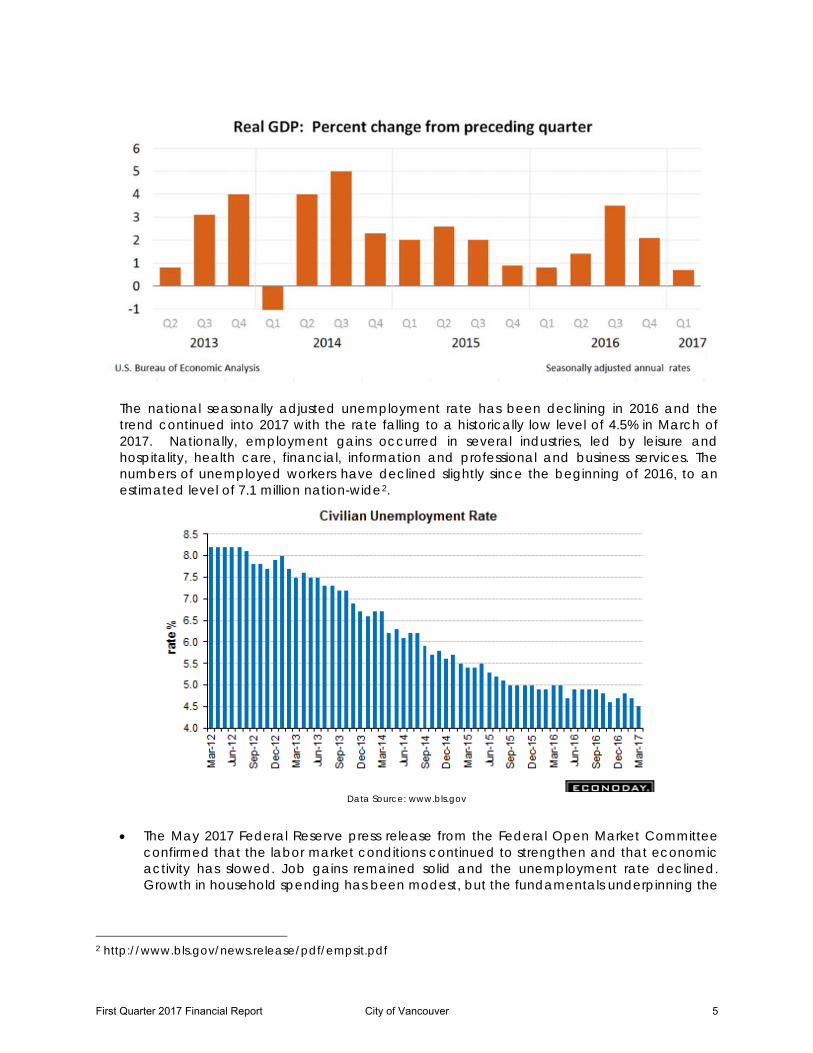
II. Economic Report The US economy continues to improve. The unemployment rate continues to decline, the housing sector is showing a consistent level of activity and higher prices than in the prior four years, but the annual rate of increase has cooled. The following is specific information related to some of the major national economic indicators, beginning with Gross Domestic Product. The national economy continued to grow at an annualized pace of growth of 0.7% in the first quarter of 2017, according to the advance estimate published by the Bureau of Economic Analysis. The most recent data indicates that the increase was mostly due to increases in nonresidential fixed investment, exports, residential fixed investment, and personal consumption expenditures (PCE), that were offset by negative contributions from private inventory investment, state and local government spending and federal government spending.1 The national unemployment rate declined to 4.5% in March.
1 National Income and Product Accounts; Gross Domestic Product: First Quarter 2017 (Advance Estimate), April 28, 2017, https://www.bea.gov/newsreleases/national/gdp/2017/gdp4q16_2nd.htm
First Quarter 2017 Financial Report City of Vancouver 4
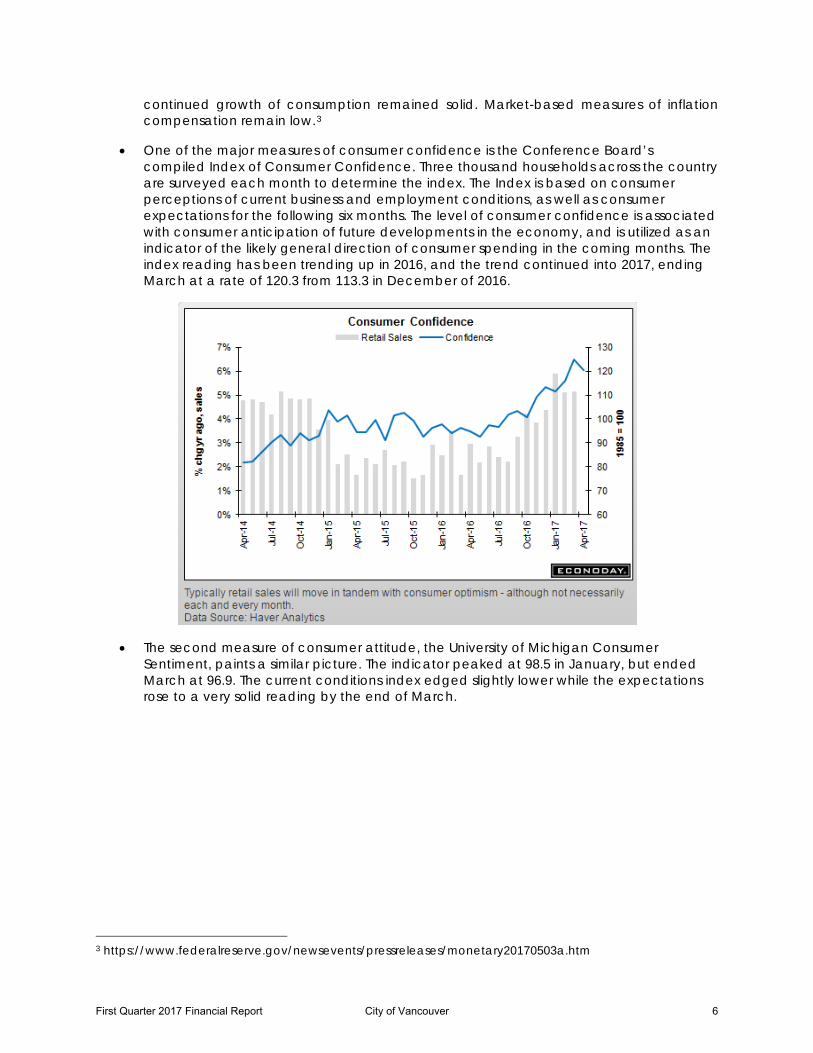
The national seasonally adjusted unemployment rate has been declining in 2016 and the trend continued into 2017 with the rate falling to a historically low level of 4.5% in March of 2017. Nationally, employment gains occurred in several industries, led by leisure and hospitality, health care, financial, information and professional and business services. The numbers of unemployed workers have declined slightly since the beginning of 2016, to an estimated level of 7.1 million nation-wide2.
Data Source: www.bls.gov
• The May 2017 Federal Reserve press release from the Federal Open Market Committee confirmed that the labor market conditions continued to strengthen and that economic activity has slowed. Job gains remained solid and the unemployment rate declined. Growth in household spending has been modest, but the fundamentals underpinning the
2 http://www.bls.gov/news.release/pdf/empsit.pdf
First Quarter 2017 Financial Report City of Vancouver 5
continued growth of consumption remained solid. Market-based measures of inflation compensation remain low.3
• One of the major measures of consumer confidence is the Conference Board’s compiled Index of Consumer Confidence. Three thousand households across the country are surveyed each month to determine the index. The Index is based on consumer perceptions of current business and employment conditions, as well as consumer expectations for the following six months. The level of consumer confidence is associated with consumer anticipation of future developments in the economy, and is utilized as an indicator of the likely general direction of consumer spending in the coming months. The index reading has been trending up in 2016, and the trend continued into 2017, ending March at a rate of 120.3 from 113.3 in December of 2016.
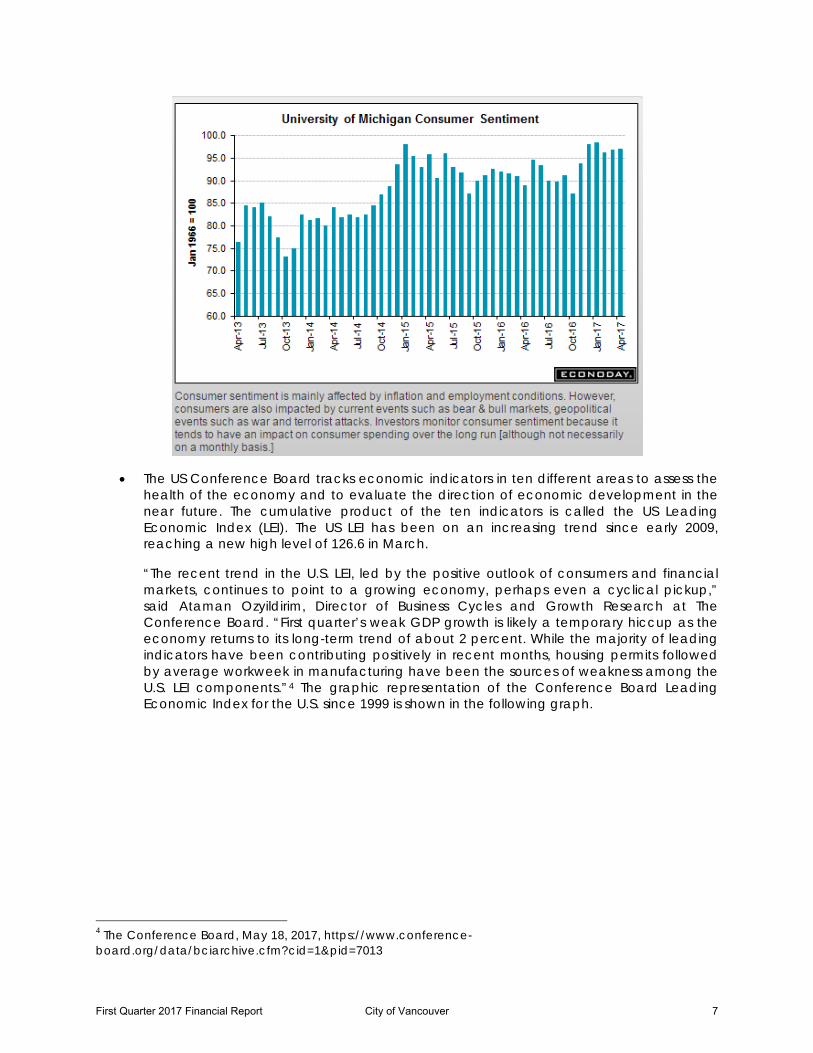
• The second measure of consumer attitude, the University of Michigan Consumer Sentiment, paints a similar picture. The indicator peaked at 98.5 in January, but ended March at 96.9. The current conditions index edged slightly lower while the expectations rose to a very solid reading by the end of March.
3 https://www.federalreserve.gov/newsevents/pressreleases/monetary20170503a.htm
First Quarter 2017 Financial Report City of Vancouver 6
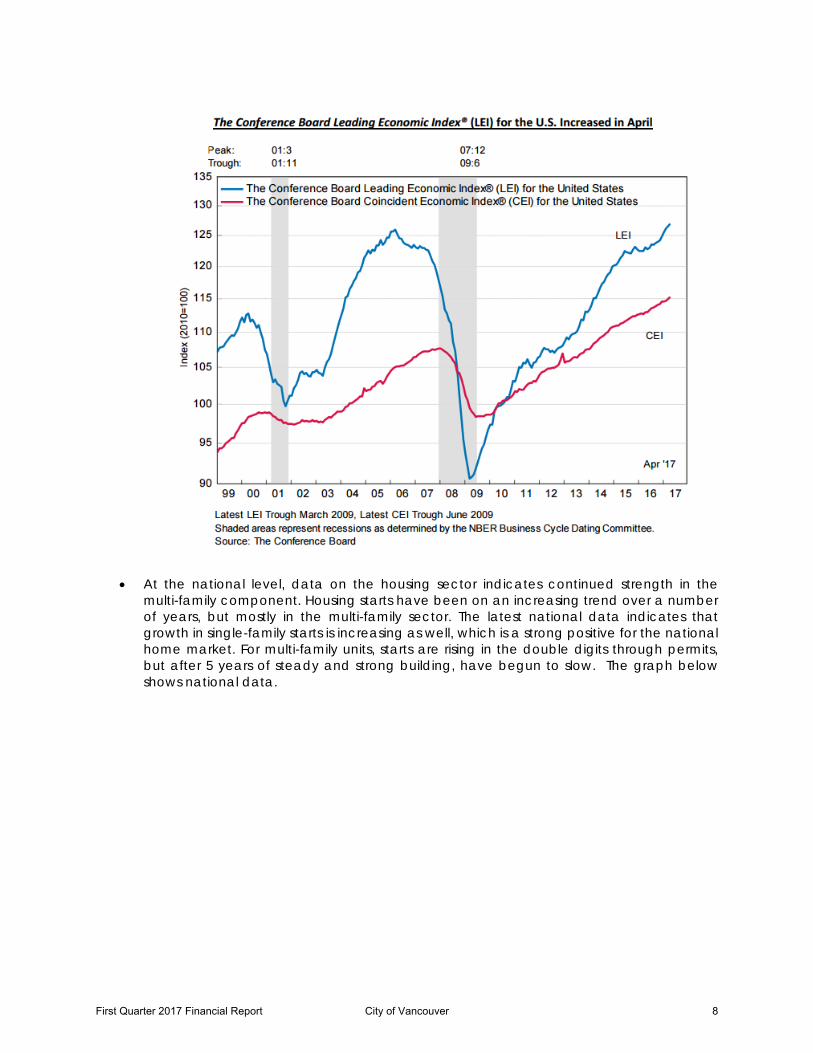
• The US Conference Board tracks economic indicators in ten different areas to assess the health of the economy and to evaluate the direction of economic development in the near future. The cumulative product of the ten indicators is called the US Leading Economic Index (LEI). The US LEI has been on an increasing trend since early 2009, reaching a new high level of 126.6 in March.
“The recent trend in the U.S. LEI, led by the positive outlook of consumers and financial markets, continues to point to a growing economy, perhaps even a cyclical pickup,” said Ataman Ozyildirim, Director of Business Cycles and Growth Research at The Conference Board. “First quarter’s weak GDP growth is likely a temporary hiccup as the economy returns to its long-term trend of about 2 percent. While the majority of leading indicators have been contributing positively in recent months, housing permits followed by average workweek in manufacturing have been the sources of weakness among the U.S. LEI components.”4 The graphic representation of the Conference Board Leading Economic Index for the U.S. since 1999 is shown in the following graph.
4 The Conference Board, May 18, 2017, https://www.conference-board.org/data/bciarchive.cfm?cid=1&pid=7013
First Quarter 2017 Financial Report City of Vancouver 7
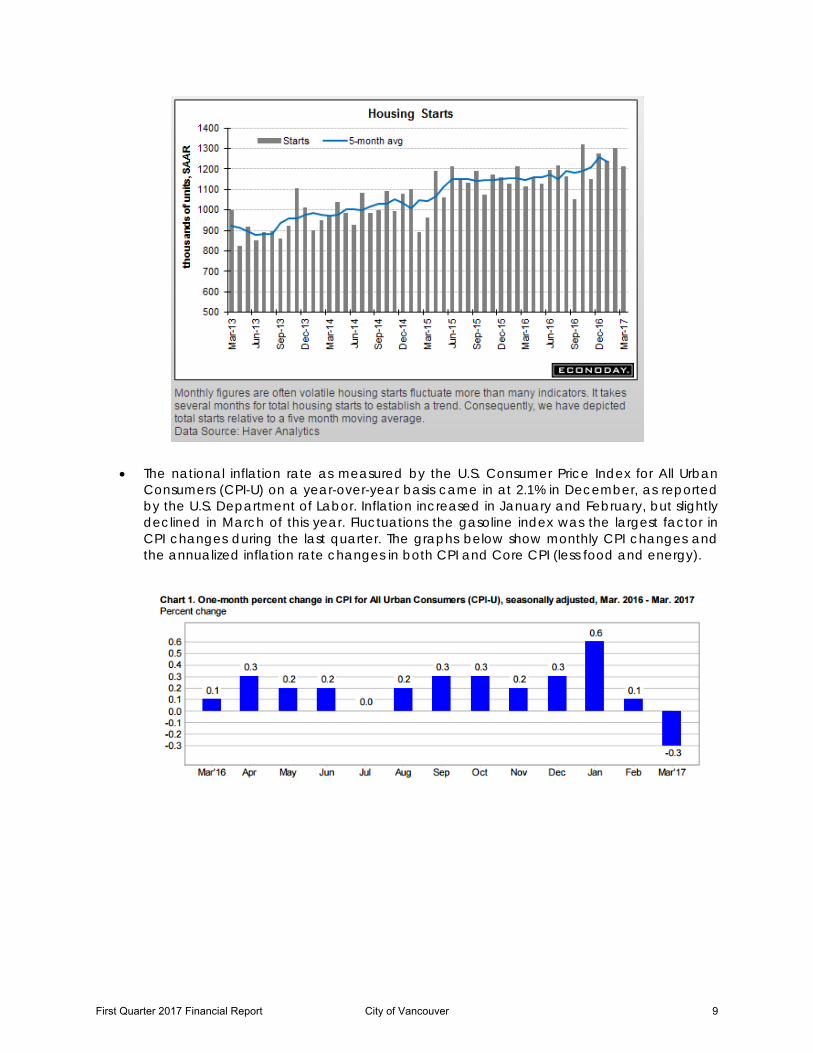
• At the national level, data on the housing sector indicates continued strength in the multi-family component. Housing starts have been on an increasing trend over a number of years, but mostly in the multi-family sector. The latest national data indicates that growth in single-family starts is increasing as well, which is a strong positive for the national home market. For multi-family units, starts are rising in the double digits through permits, but after 5 years of steady and strong building, have begun to slow. The graph below shows national data.
First Quarter 2017 Financial Report City of Vancouver 8
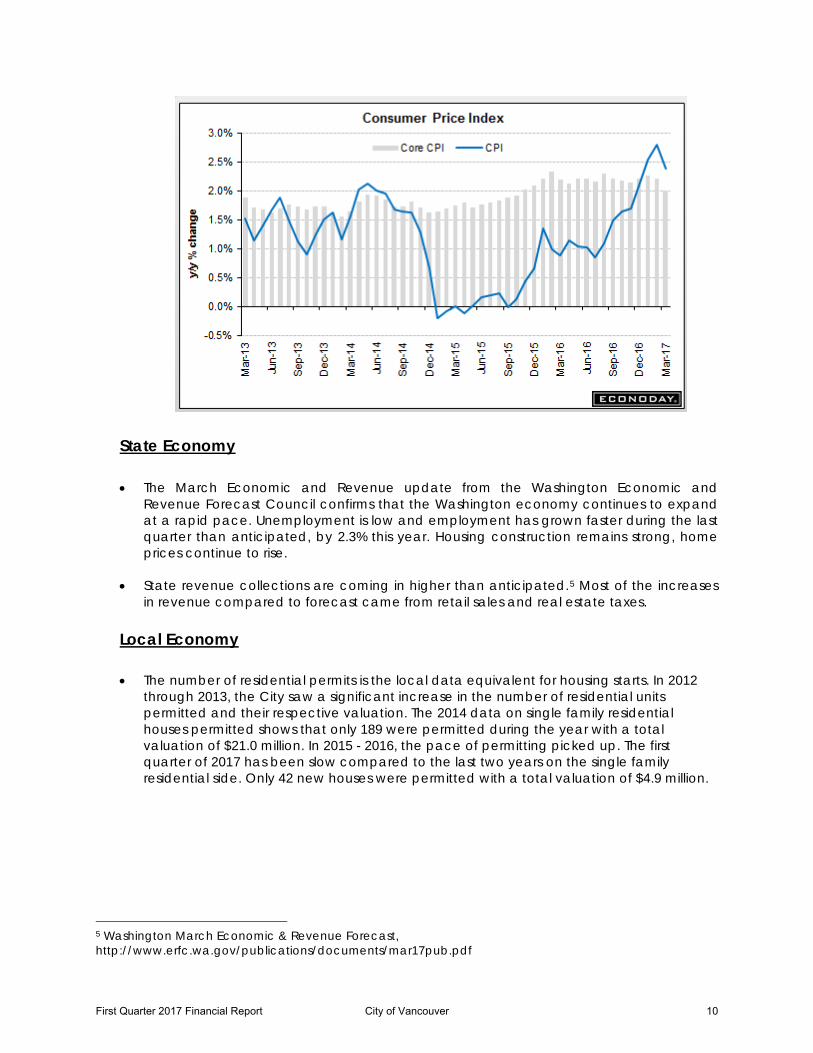
• The national inflation rate as measured by the U.S. Consumer Price Index for All Urban Consumers (CPI-U) on a year-over-year basis came in at 2.1% in December, as reported by the U.S. Department of Labor. Inflation increased in January and February, but slightly declined in March of this year. Fluctuations the gasoline index was the largest factor in CPI changes during the last quarter. The graphs below show monthly CPI changes and the annualized inflation rate changes in both CPI and Core CPI (less food and energy).
First Quarter 2017 Financial Report City of Vancouver 9
State Economy • The March Economic and Revenue update from the Washington Economic and
Revenue Forecast Council confirms that the Washington economy continues to expand at a rapid pace. Unemployment is low and employment has grown faster during the last quarter than anticipated, by 2.3% this year. Housing construction remains strong, home prices continue to rise.
• State revenue collections are coming in higher than anticipated.5 Most of the increases in revenue compared to forecast came from retail sales and real estate taxes.
Local Economy
• The number of residential permits is the local data equivalent for housing starts. In 2012 through 2013, the City saw a significant increase in the number of residential units permitted and their respective valuation. The 2014 data on single family residential houses permitted shows that only 189 were permitted during the year with a total valuation of $21.0 million. In 2015 - 2016, the pace of permitting picked up. The first quarter of 2017 has been slow compared to the last two years on the single family residential side. Only 42 new houses were permitted with a total valuation of $4.9 million.
5 Washington March Economic & Revenue Forecast, http://www.erfc.wa.gov/publications/documents/mar17pub.pdf
First Quarter 2017 Financial Report City of Vancouver 10
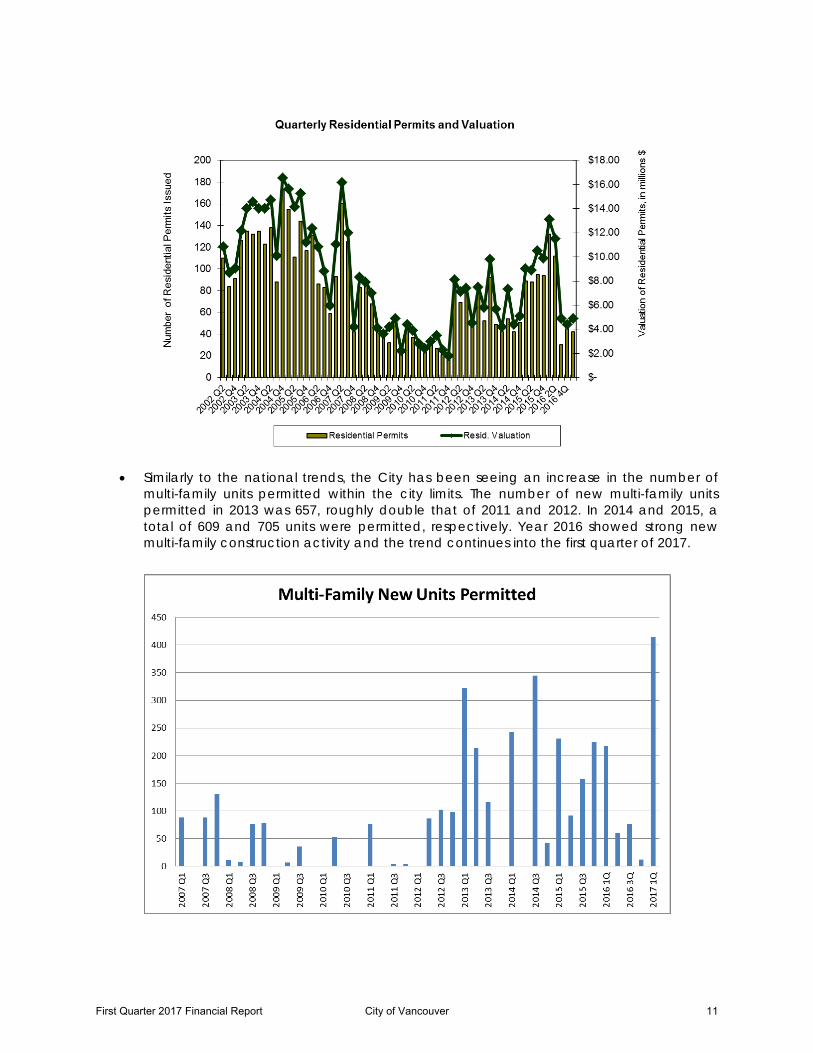
• Similarly to the national trends, the City has been seeing an increase in the number of
multi-family units permitted within the city limits. The number of new multi-family units permitted in 2013 was 657, roughly double that of 2011 and 2012. In 2014 and 2015, a total of 609 and 705 units were permitted, respectively. Year 2016 showed strong new multi-family construction activity and the trend continues into the first quarter of 2017.
First Quarter 2017 Financial Report City of Vancouver 11
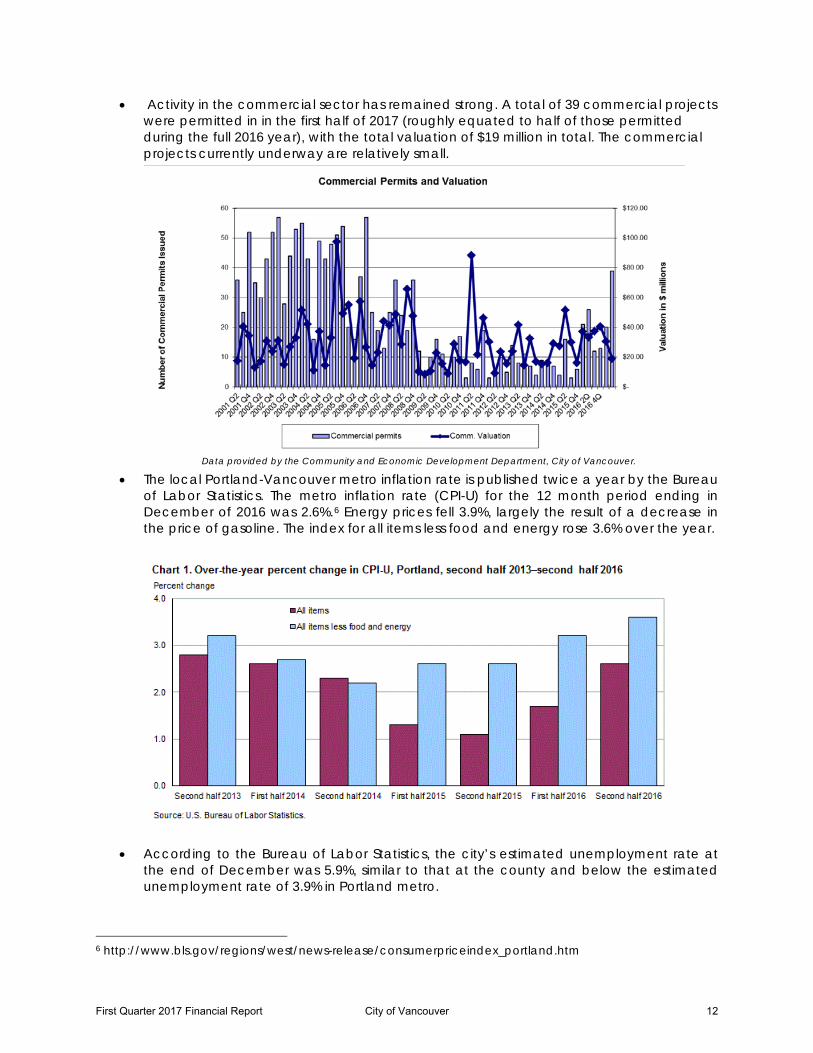
• Activity in the commercial sector has remained strong. A total of 39 commercial projects were permitted in in the first half of 2017 (roughly equated to half of those permitted during the full 2016 year), with the total valuation of $19 million in total. The commercial projects currently underway are relatively small.
Data provided by the Community and Economic Development Department, City of Vancouver.
• The local Portland-Vancouver metro inflation rate is published twice a year by the Bureau of Labor Statistics. The metro inflation rate (CPI-U) for the 12 month period ending in December of 2016 was 2.6%.6 Energy prices fell 3.9%, largely the result of a decrease in the price of gasoline. The index for all items less food and energy rose 3.6% over the year.
• According to the Bureau of Labor Statistics, the city’s estimated unemployment rate at the end of December was 5.9%, similar to that at the county and below the estimated unemployment rate of 3.9% in Portland metro.
6 http://www.bls.gov/regions/west/news-release/consumerpriceindex_portland.htm
First Quarter 2017 Financial Report City of Vancouver 12
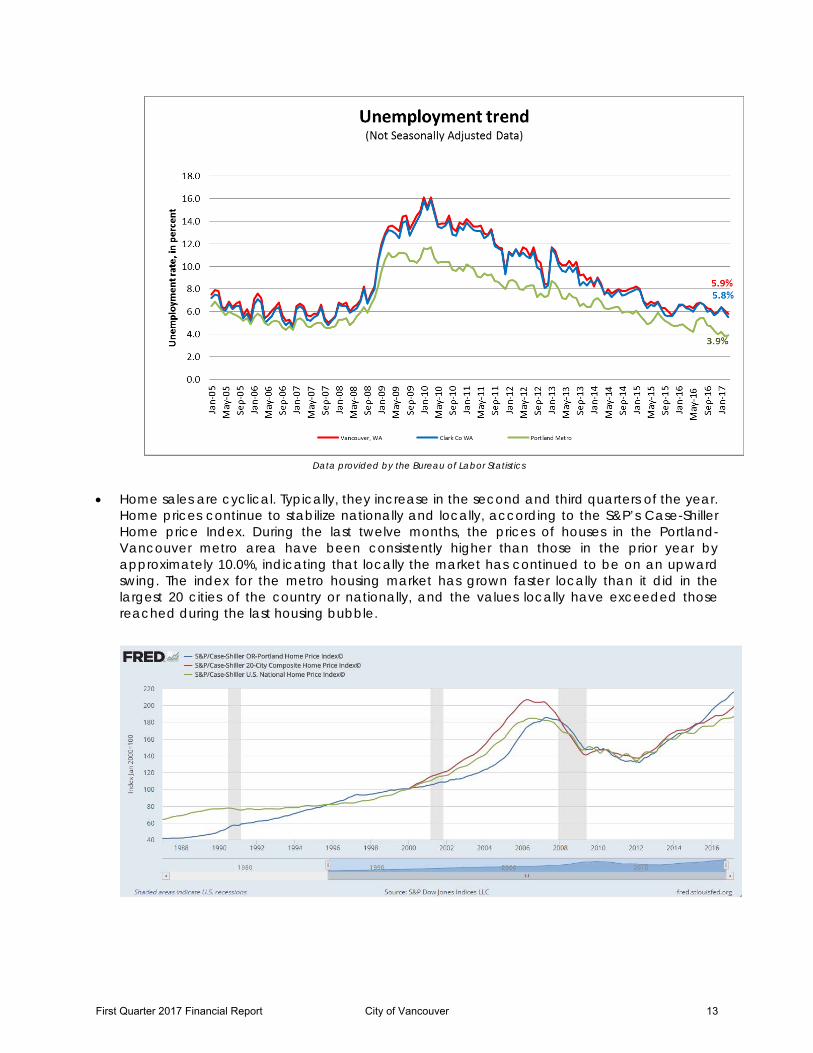
Data provided by the Bureau of Labor Statistics
• Home sales are cyclical. Typically, they increase in the second and third quarters of the year. Home prices continue to stabilize nationally and locally, according to the S&P’s Case-Shiller Home price Index. During the last twelve months, the prices of houses in the Portland-Vancouver metro area have been consistently higher than those in the prior year by approximately 10.0%, indicating that locally the market has continued to be on an upward swing. The index for the metro housing market has grown faster locally than it did in the largest 20 cities of the country or nationally, and the values locally have exceeded those reached during the last housing bubble.
First Quarter 2017 Financial Report City of Vancouver 13

• The median home value price in Vancouver, WA is estimated to be $276.6 thousand, according to Zillow. Housing prices in the local area have likely reached their peak and are anticipated to start showing signs of a slowdown in the coming months.
• Zillow evaluates Vancouver’s real estate market as relatively healthy, relative to other markets across the county. The Market Health index is based on up to 10 metrics including those capturing the past and projected evolution of home values, the prevalence of foreclosures, foreclosure re-sales, negative equity and delinquency among others. The Vancouver market is currently rated at 7.1 out of 10 possible.
III. Financial Results General Fund REVENUES
City of Vancouver General Fund revenues in the first quarter of 2017 totaled $28.4 million, exceeding the comparable 2016 revenues by $1.1 million. Tax revenues, largely utility, sales and property taxes exceeded the first quarter of 2016 collections by approximately $600 thousand, mostly due to the higher sales tax and utility tax. Utility rates had an inflationary increase in 2017. In addition to the inflationary increase, an additional 3.4% increase in utility tax revenue was approved in 2017 to fund an increase in police staffing and utility rates were increased accordingly. First quarter of 2017 collections of Sales tax exceeded those in 2016 by $0.5 million due to strong auto sales and construction activity. The remainder of the revenue increase is due to the timing of the indirect cost plan revenue in the General Fund. Following is detailed information on the main revenue sources of the General Fund. Cumulatively, the seven chief sources of revenue listed on the chart below represent more than 87.0% of the total forecasted revenues in the City’s General Fund.
First Quarter 2017 Financial Report City of Vancouver 14
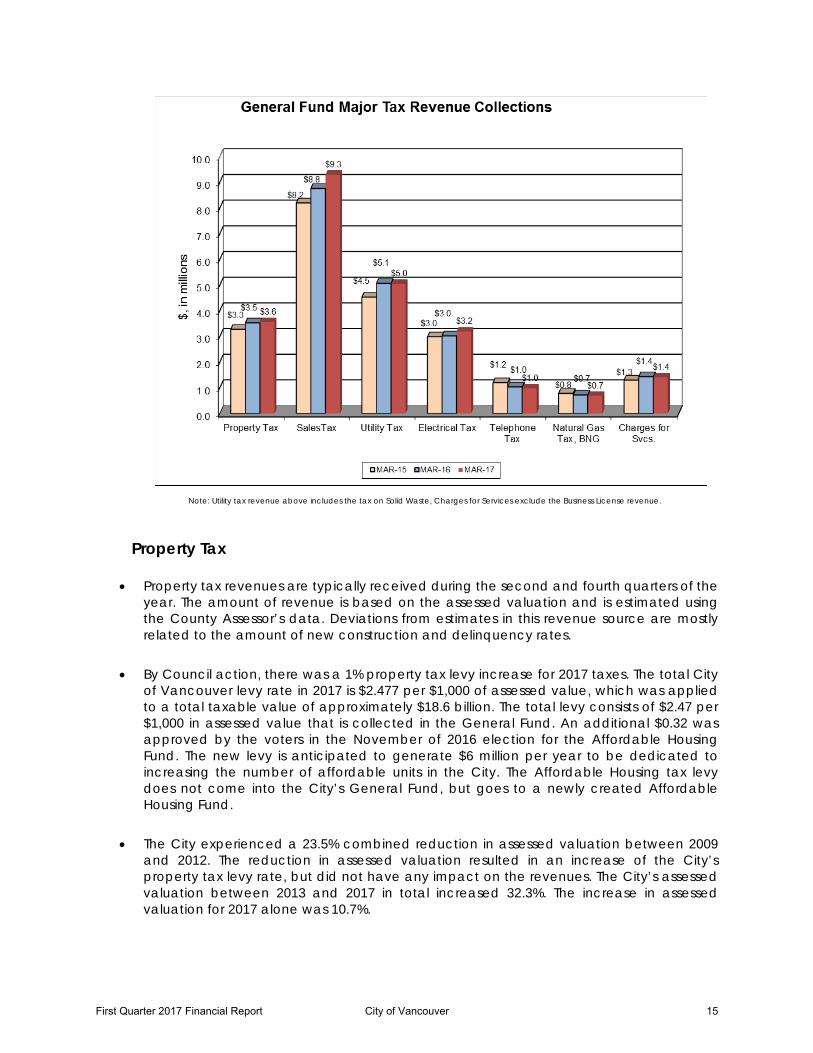
Note: Utility tax revenue above includes the tax on Solid Waste, Charges for Services exclude the Business License revenue.
Property Tax • Property tax revenues are typically received during the second and fourth quarters of the
year. The amount of revenue is based on the assessed valuation and is estimated using the County Assessor’s data. Deviations from estimates in this revenue source are mostly related to the amount of new construction and delinquency rates.
• By Council action, there was a 1% property tax levy increase for 2017 taxes. The total City of Vancouver levy rate in 2017 is $2.477 per $1,000 of assessed value, which was applied to a total taxable value of approximately $18.6 billion. The total levy consists of $2.47 per $1,000 in assessed value that is collected in the General Fund. An additional $0.32 was approved by the voters in the November of 2016 election for the Affordable Housing Fund. The new levy is anticipated to generate $6 million per year to be dedicated to increasing the number of affordable units in the City. The Affordable Housing tax levy does not come into the City’s General Fund, but goes to a newly created Affordable Housing Fund.
• The City experienced a 23.5% combined reduction in assessed valuation between 2009
and 2012. The reduction in assessed valuation resulted in an increase of the City’s property tax levy rate, but did not have any impact on the revenues. The City’s assessed valuation between 2013 and 2017 in total increased 32.3%. The increase in assessed valuation for 2017 alone was 10.7%.
First Quarter 2017 Financial Report City of Vancouver 15
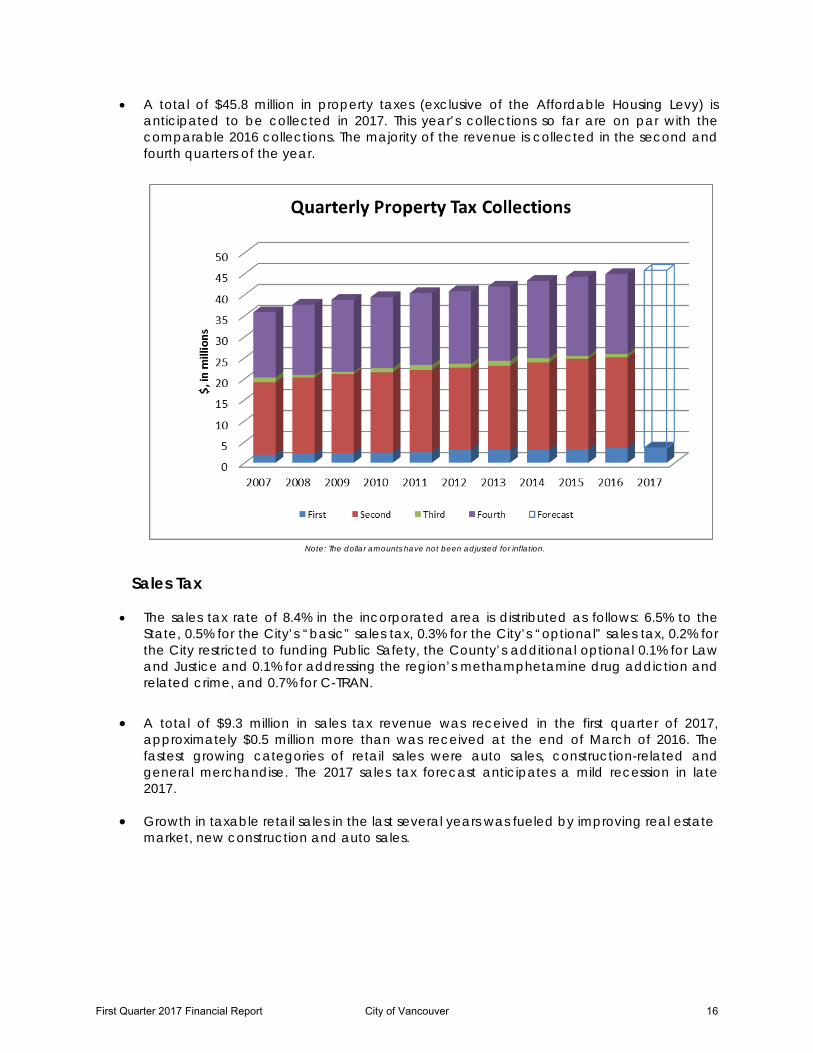
• A total of $45.8 million in property taxes (exclusive of the Affordable Housing Levy) is anticipated to be collected in 2017. This year’s collections so far are on par with the comparable 2016 collections. The majority of the revenue is collected in the second and fourth quarters of the year.
Note: The dollar amounts have not been adjusted for inflation.
Sales Tax
• The sales tax rate of 8.4% in the incorporated area is distributed as follows: 6.5% to the State, 0.5% for the City’s “basic” sales tax, 0.3% for the City’s “optional” sales tax, 0.2% for the City restricted to funding Public Safety, the County’s additional optional 0.1% for Law and Justice and 0.1% for addressing the region’s methamphetamine drug addiction and related crime, and 0.7% for C-TRAN.
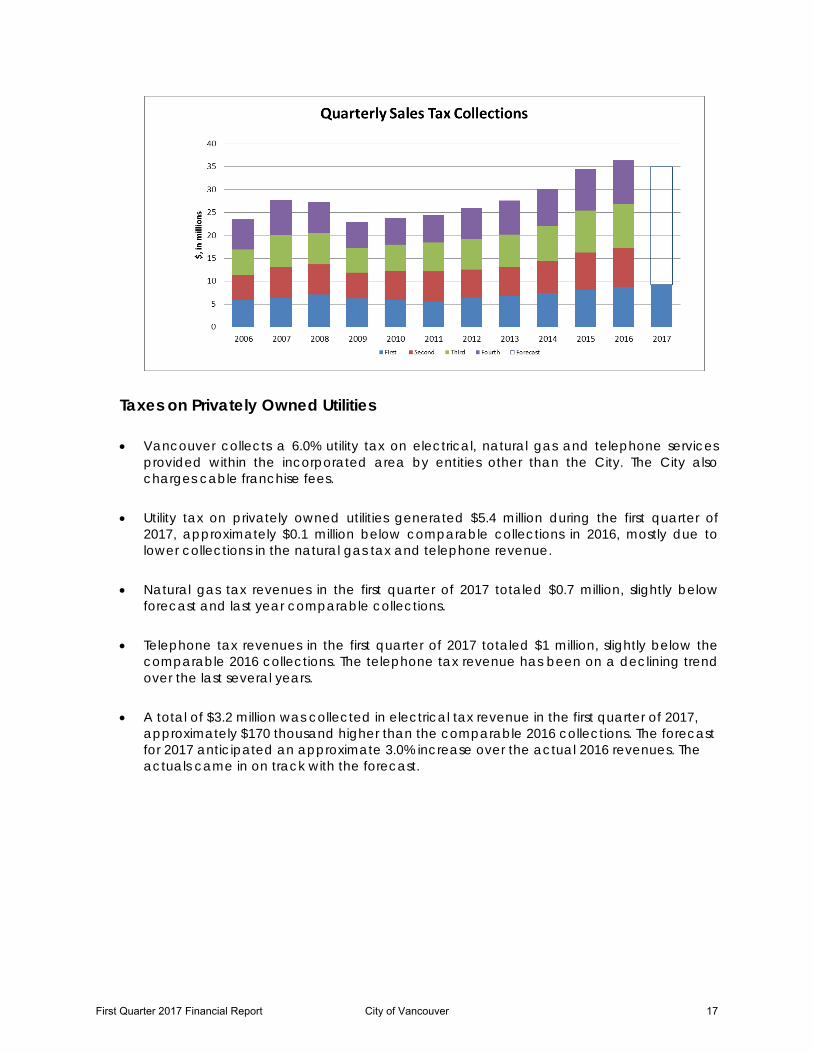
• A total of $9.3 million in sales tax revenue was received in the first quarter of 2017,
approximately $0.5 million more than was received at the end of March of 2016. The fastest growing categories of retail sales were auto sales, construction-related and general merchandise. The 2017 sales tax forecast anticipates a mild recession in late 2017.
• Growth in taxable retail sales in the last several years was fueled by improving real estate
market, new construction and auto sales.
First Quarter 2017 Financial Report City of Vancouver 16
Taxes on Privately Owned Utilities • Vancouver collects a 6.0% utility tax on electrical, natural gas and telephone services
provided within the incorporated area by entities other than the City. The City also charges cable franchise fees.
• Utility tax on privately owned utilities generated $5.4 million during the first quarter of
2017, approximately $0.1 million below comparable collections in 2016, mostly due to lower collections in the natural gas tax and telephone revenue.
• Natural gas tax revenues in the first quarter of 2017 totaled $0.7 million, slightly below
forecast and last year comparable collections.
• Telephone tax revenues in the first quarter of 2017 totaled $1 million, slightly below the comparable 2016 collections. The telephone tax revenue has been on a declining trend over the last several years.
• A total of $3.2 million was collected in electrical tax revenue in the first quarter of 2017,
approximately $170 thousand higher than the comparable 2016 collections. The forecast for 2017 anticipated an approximate 3.0% increase over the actual 2016 revenues. The actuals came in on track with the forecast.
First Quarter 2017 Financial Report City of Vancouver 17
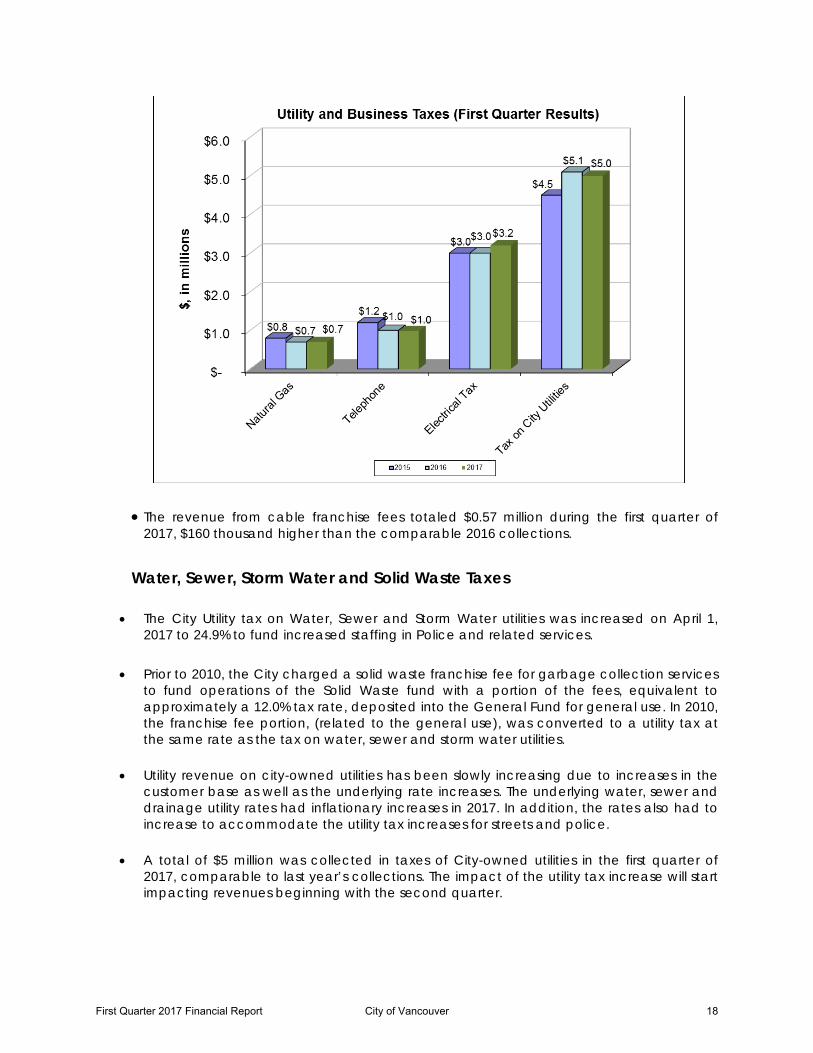
• The revenue from cable franchise fees totaled $0.57 million during the first quarter of 2017, $160 thousand higher than the comparable 2016 collections.
Water, Sewer, Storm Water and Solid Waste Taxes
• The City Utility tax on Water, Sewer and Storm Water utilities was increased on April 1, 2017 to 24.9% to fund increased staffing in Police and related services.
• Prior to 2010, the City charged a solid waste franchise fee for garbage collection services
to fund operations of the Solid Waste fund with a portion of the fees, equivalent to approximately a 12.0% tax rate, deposited into the General Fund for general use. In 2010, the franchise fee portion, (related to the general use), was converted to a utility tax at the same rate as the tax on water, sewer and storm water utilities.
• Utility revenue on city-owned utilities has been slowly increasing due to increases in the customer base as well as the underlying rate increases. The underlying water, sewer and drainage utility rates had inflationary increases in 2017. In addition, the rates also had to increase to accommodate the utility tax increases for streets and police.
• A total of $5 million was collected in taxes of City-owned utilities in the first quarter of 2017, comparable to last year’s collections. The impact of the utility tax increase will start impacting revenues beginning with the second quarter.
First Quarter 2017 Financial Report City of Vancouver 18
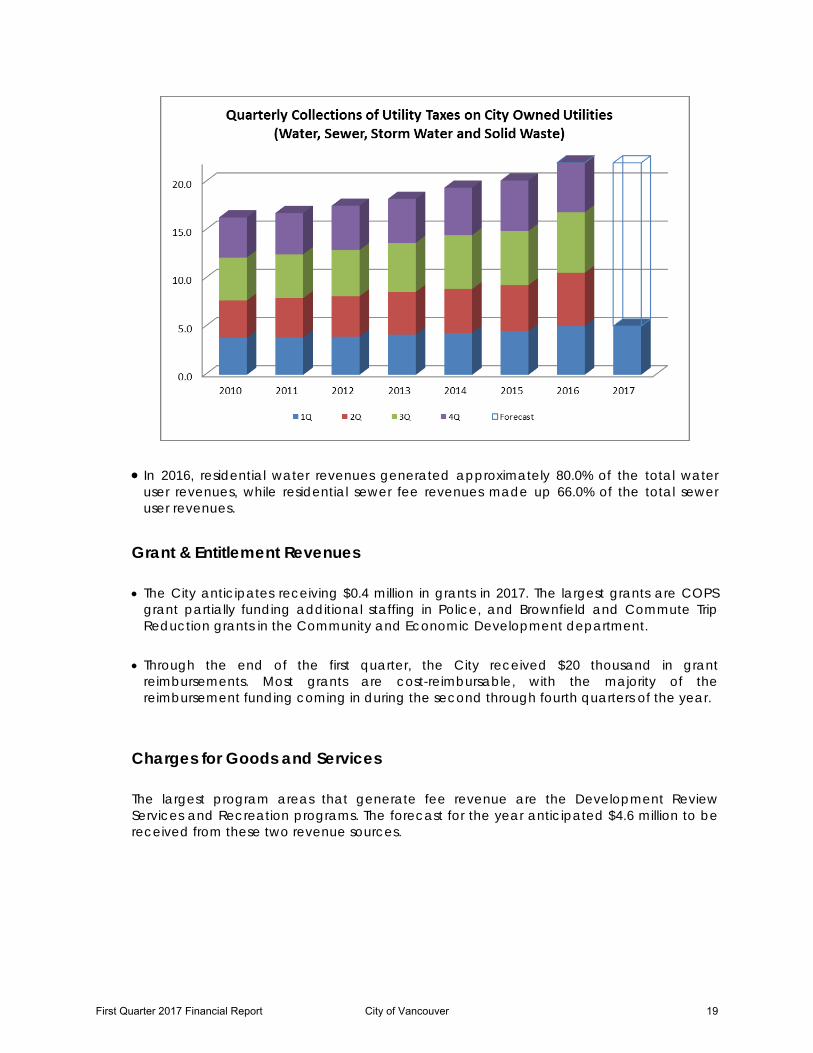
• In 2016, residential water revenues generated approximately 80.0% of the total water user revenues, while residential sewer fee revenues made up 66.0% of the total sewer user revenues.
Grant & Entitlement Revenues • The City anticipates receiving $0.4 million in grants in 2017. The largest grants are COPS
grant partially funding additional staffing in Police, and Brownfield and Commute Trip Reduction grants in the Community and Economic Development department.
• Through the end of the first quarter, the City received $20 thousand in grant reimbursements. Most grants are cost-reimbursable, with the majority of the reimbursement funding coming in during the second through fourth quarters of the year.
Charges for Goods and Services The largest program areas that generate fee revenue are the Development Review Services and Recreation programs. The forecast for the year anticipated $4.6 million to be received from these two revenue sources.
First Quarter 2017 Financial Report City of Vancouver 19
Land Use and Other Planning Permits • During 2008 through 2010, the City experienced a significant decrease in both the
number of single family residential permits issued and in their valuation. The collections over 2011 through 2013 remained relatively flat. Years 2014 through 2016 saw significant annual increases in land use fees. Similar trends appear to continue into 2017.
• During the first quarter, a total of $274 thousand in planning permit fee revenues was collected by the City, approximately $50 thousand above revenues received during a comparable time period of 2016. The activity remains elevated locally compared to the last few years.
Recreation Program Fees
A total of $4.0 million in recreation fees was anticipated to be received in 2017. One of the two recreation centers is currently undergoing a major renovation of the pool and a portion of the center is closed to customers.
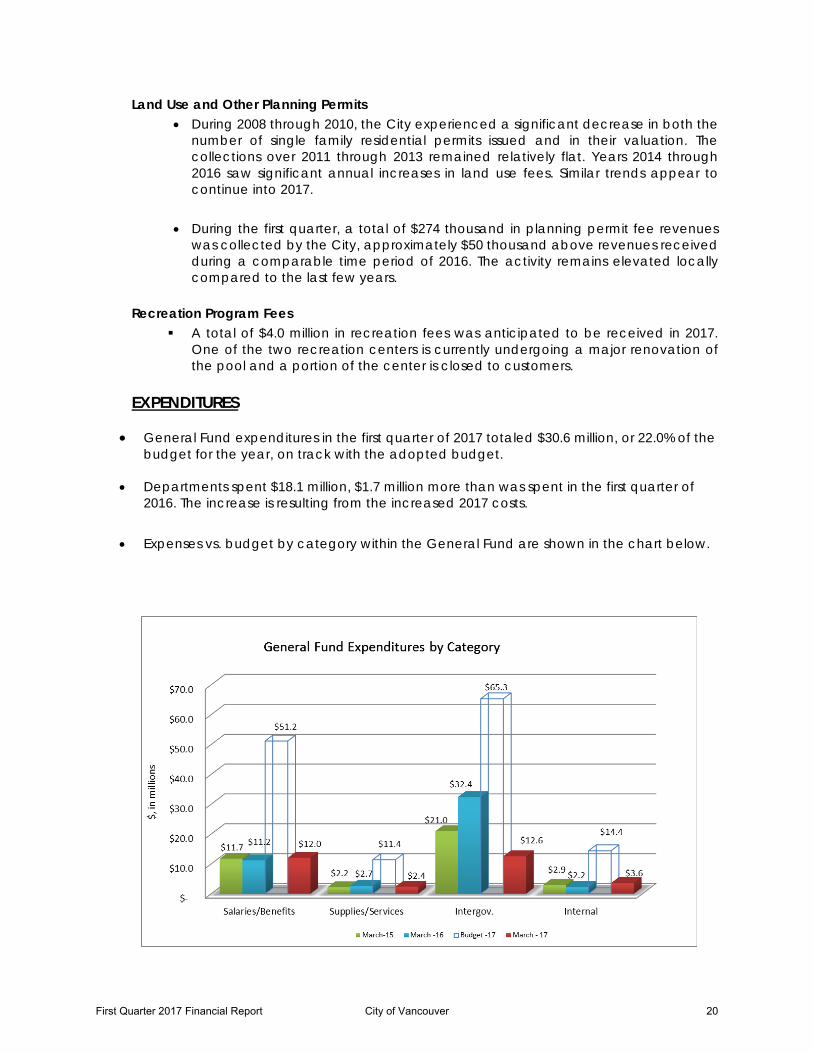
EXPENDITURES
• General Fund expenditures in the first quarter of 2017 totaled $30.6 million, or 22.0% of the budget for the year, on track with the adopted budget.
• Departments spent $18.1 million, $1.7 million more than was spent in the first quarter of 2016. The increase is resulting from the increased 2017 costs.
• Expenses vs. budget by category within the General Fund are shown in the chart below.
First Quarter 2017 Financial Report City of Vancouver 20
• Salaries and benefits expenditures in the General Fund totaled $12 million in the first quarter of 2017, or 23.5% of the budget for the year.
• General Fund expenditures in the supplies and services category were $2.4 million, or 20.8% of the budget.
• The intergovernmental category of expenditures includes payments by the City to other jurisdictions, based on inter-local agreements in place and internal transfers supporting other funds, including the Debt Fund, Fire Fund, and Street Fund. Expenditures in the Intergovernmental category reached $12.5 million in the first quarter of 2017, or 19.3% of the budget for the year. The City has not been billed for the actual costs for jail services for city residents, since the County continues to have a difficult time pulling the data from the newly installed EIS system.
• Internal expenditures were $3.6 million, $0.7 million above those in the first quarter of 2016
and at 25.1% of the budget for the year.
• Beginning in 2015, the cost of the internal services departments, (such as IT, HR, Finance and General Services), is proportionately reflected in the respective budgets of the direct service departments.
Cash Balance
• The General Fund operating cash balance was $47.3 million at the end of the first quarter 2017. This is $4.1 million lower than the cash balance at the end of December of 2016.
• In addition to the operating cash balance, the General Fund has an emergency reserve totaling $11.5 million at the end of March 2017, compared to $10.9 million in March 2016. Council updated the financial policy related to the emergency reserve balance in 2012. The policy requires the emergency reserve balance to equal 7.0% of actual external revenues in the preceding fiscal year for the General, Street, and Fire Funds. These funds are intended to be used only for extraordinary events, such as natural disasters.
Fund Balance • The cash balance represents a snapshot on a particular date, while the fund balance
factors in revenues that are anticipated to be received by the end of the year and expenditures that are anticipated to happen through the end of the year.
• The total fund balance in the General Fund at the end of 2016 was $65.2 million, according to the City’s audited financial statements. A portion of the fund balance estimated at $0.3 million represents prepaid items. This portion of the balance is not spendable. The remaining balance is composed of the Restricted, Committed, Assigned and Unassigned balances. The Restricted balance of $0.1 million represents the grant revenue received in advance of expenditures in VPD. The Committed balance of $20.9 million represents reserves in accordance with the City Financial Policies: the City Emergency reserve of $11.0 million, Revenue Stabilization reserve of $3.7 million, reserve
First Quarter 2017 Financial Report City of Vancouver 21
restricted for capital purposes of $6.2 million. The balance pays for the ongoing operations of the General Fund when the incoming seasonal revenues are not sufficient to cover the expenses and eliminate the need for short-term borrowing. The Assigned reserve of an estimated $34.3 million represents the City’s working capital of $30.4 million. The working capital is required to ensure sufficient cash flow in the fund. The Assigned balance also includes funding of 50% of accrued compensated absences. The remaining portion of the balance of $9.8 million was determined to be undesignated at the end of 2016. The undesignated fund balance has declined by approximately $3.8 million between 2015 and 2016, representing planned spending of the balance. Approximately $3.0-3.5 million from the 2016 appropriation will be carried forward and use the corresponding fund balance.
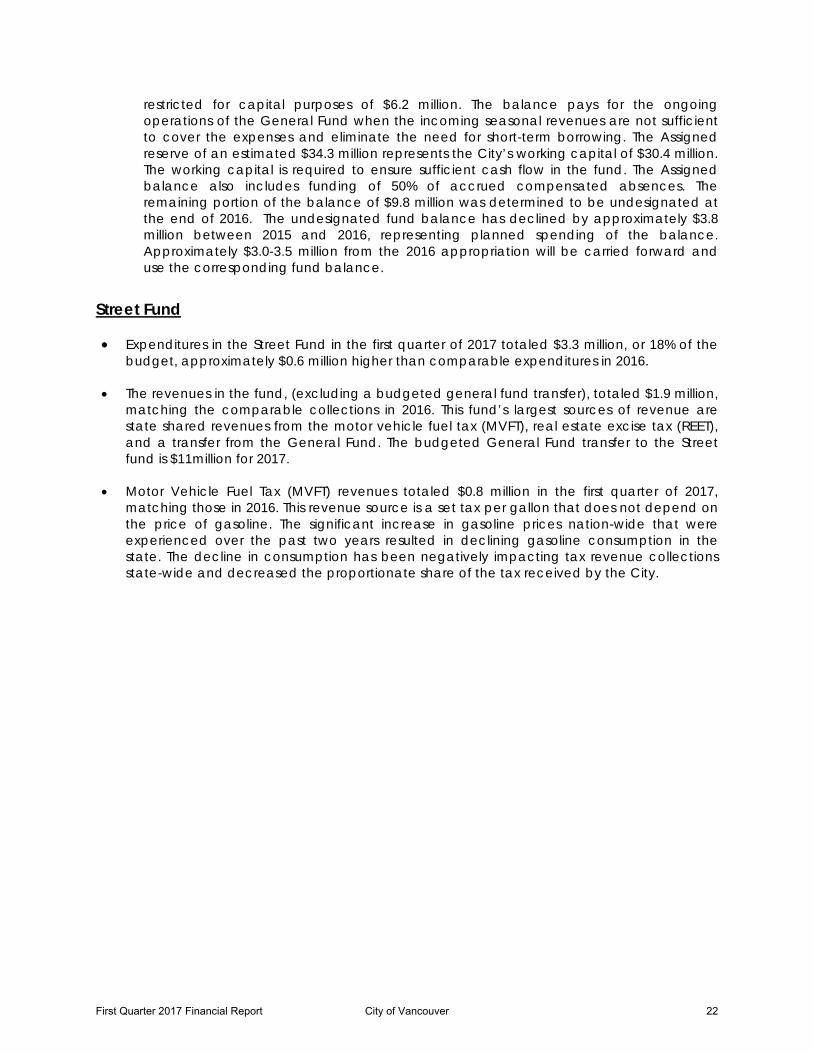
Street Fund • Expenditures in the Street Fund in the first quarter of 2017 totaled $3.3 million, or 18% of the
budget, approximately $0.6 million higher than comparable expenditures in 2016. • The revenues in the fund, (excluding a budgeted general fund transfer), totaled $1.9 million,
matching the comparable collections in 2016. This fund’s largest sources of revenue are state shared revenues from the motor vehicle fuel tax (MVFT), real estate excise tax (REET), and a transfer from the General Fund. The budgeted General Fund transfer to the Street fund is $11million for 2017.
• Motor Vehicle Fuel Tax (MVFT) revenues totaled $0.8 million in the first quarter of 2017,
matching those in 2016. This revenue source is a set tax per gallon that does not depend on the price of gasoline. The significant increase in gasoline prices nation-wide that were experienced over the past two years resulted in declining gasoline consumption in the state. The decline in consumption has been negatively impacting tax revenue collections state-wide and decreased the proportionate share of the tax received by the City.
First Quarter 2017 Financial Report City of Vancouver 22
Real Estate Excise Tax (REET)
• Real Estate Excise Tax (REET) of one-quarter of 1.0% of the selling price is imposed on each sale of real property in the corporate limits of the City. The tax is deposited into the Street Fund and is restricted to fund preservation of the City’s street system. The City also collects REET for Parks and Transportation capital.
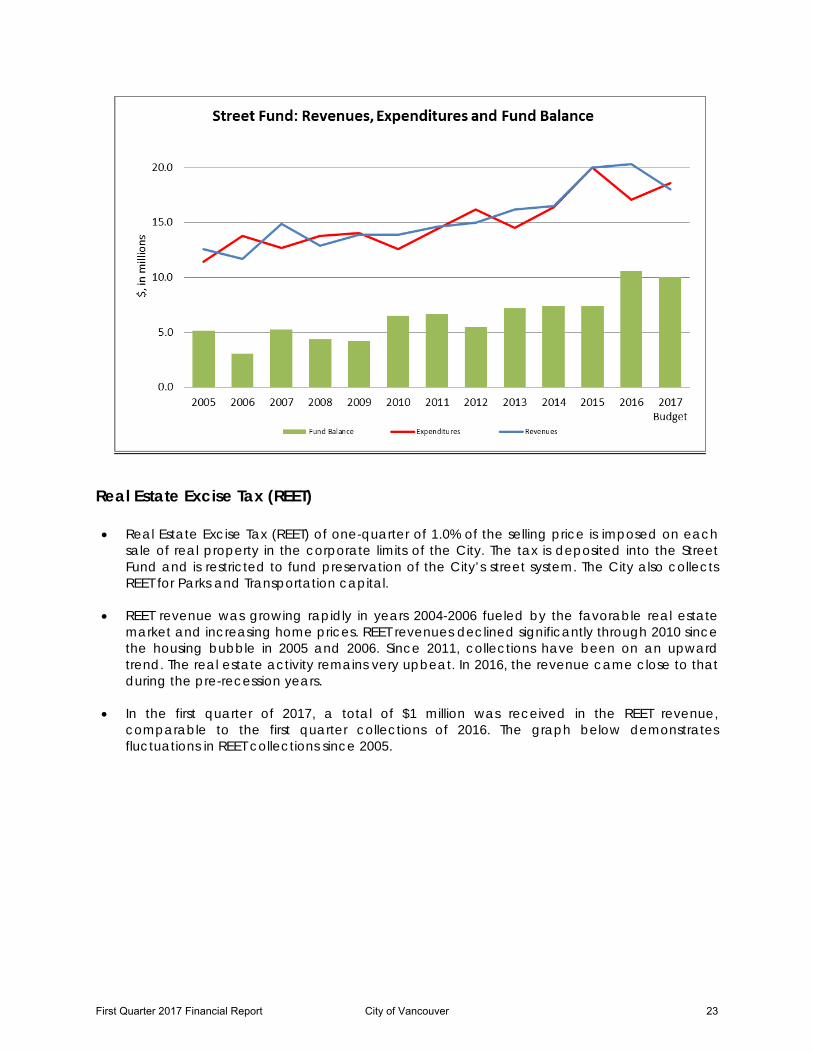
• REET revenue was growing rapidly in years 2004-2006 fueled by the favorable real estate
market and increasing home prices. REET revenues declined significantly through 2010 since the housing bubble in 2005 and 2006. Since 2011, collections have been on an upward trend. The real estate activity remains very upbeat. In 2016, the revenue came close to that during the pre-recession years.
• In the first quarter of 2017, a total of $1 million was received in the REET revenue,
comparable to the first quarter collections of 2016. The graph below demonstrates fluctuations in REET collections since 2005.
First Quarter 2017 Financial Report City of Vancouver 23
Street Funding Initiative • During 2015, an extensive, six-month long public process took place to determine the desired
level of services in the city street and right-of-way maintenance program and what additional funding sources would be most appropriate to fund any desired enhancements in the service level.
• A special commission that reviewed the issue at hand was composed of individuals representing City Council, the community, businesses and neighborhoods.
• The recommendations prepared by the Commission on the desired service level and funding
were accepted and acted upon by City Council, resulting in new/increased revenues being directed to Streets to fund the desired operating and capital outcomes. The ultimate anticipated outcomes of this initiative are the improvement in the condition of City streets from the current “fair” to “good” over a period of twenty years, reconstruction of a major arterial every two years and improved maintenance of right-of-ways, among other things. Following is a link to the specific set of recommendations: http://www.cityofvancouver.us/sites/default/files/fileattachments/public_works/page/12554/streets_funding_commission_recommendation_final.pdf
• Year 2016 was the first year of the new Street Initiatives revenue. The City has pre-funded the
activities related to right-of-way maintenance with City dollars so some of the results could be seen in 2016. A portion of the new revenue - vehicle license fees – started coming into the Transportation Benefits District (TBD) beginning July 1, 2016.
Below is the financial information related to the Operating Street Initiatives and the Capital Street Initiatives funds.
First Quarter 2017 Financial Report City of Vancouver 24
2015 2016 2017 2017 %Revenues Actual Actual Budget March Budget Street Initiative Operating Fund 50,852 467,980 4,463,580 767,443 17%
Street Funding Initiative - Capital Fund - 112,480 970,000 28,078 3%
Transportation Benefits District - 1,058,954 3,400,000 501,656
ExpendituresStreet Initiative- NEW Fund - 748,655 4,467,809 145,326 3%Capital Streets Initiative Fund (NEW) - 999,039 970,000 43,182
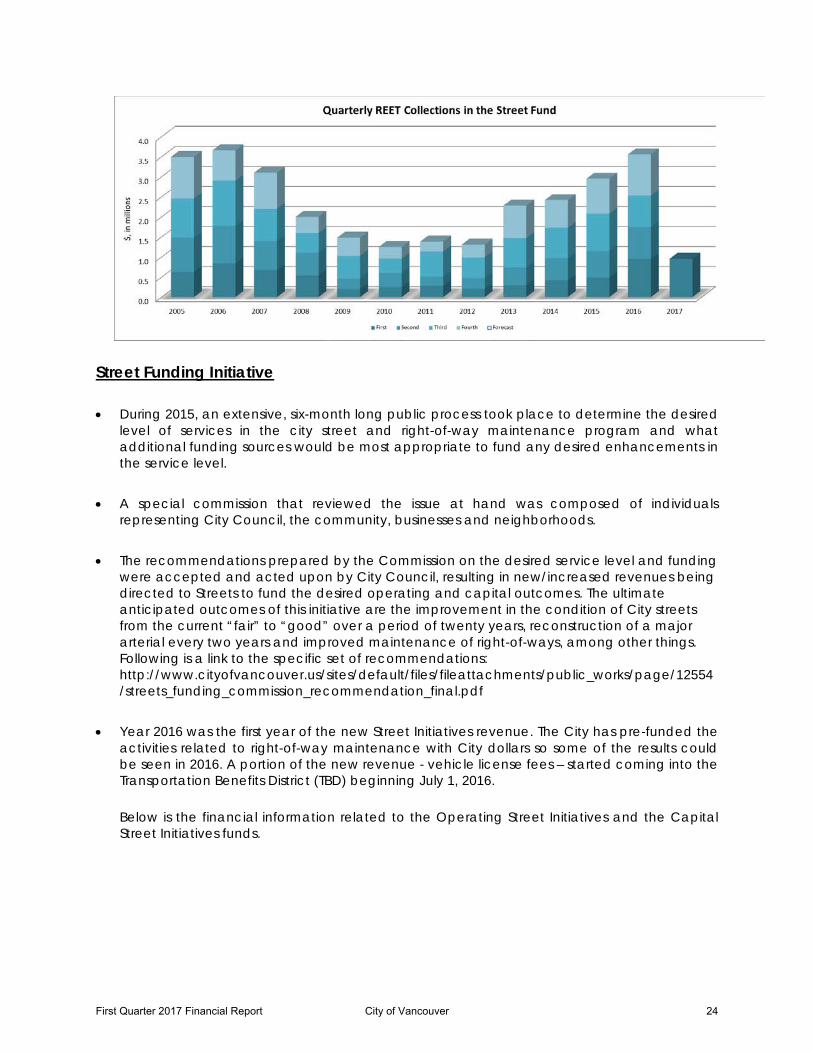
Consolidated Fire Fund
• The City has an Operating Fire Fund and Capital Fire Fund. The Capital Fire Fund largely funds vehicle replacements and set up. The Operating Fire Fund fully supports the Capital Fire Fund. The graph below represents the operating fund’s financial information.
• Operating Fire Fund revenues in the first quarter of 2017 were $0.4 million, (exclusive of General Fund support, the Fire District 5 transfer and the transfer between Fire Operating and Capital), mostly representing permit and inspection fees.
• Total Fire Operating expenditures in the first quarter were $9.5 million, 24% of the budget for the year and $0.3 million higher than those in the first quarter of 2016.
First Quarter 2017 Financial Report City of Vancouver 25
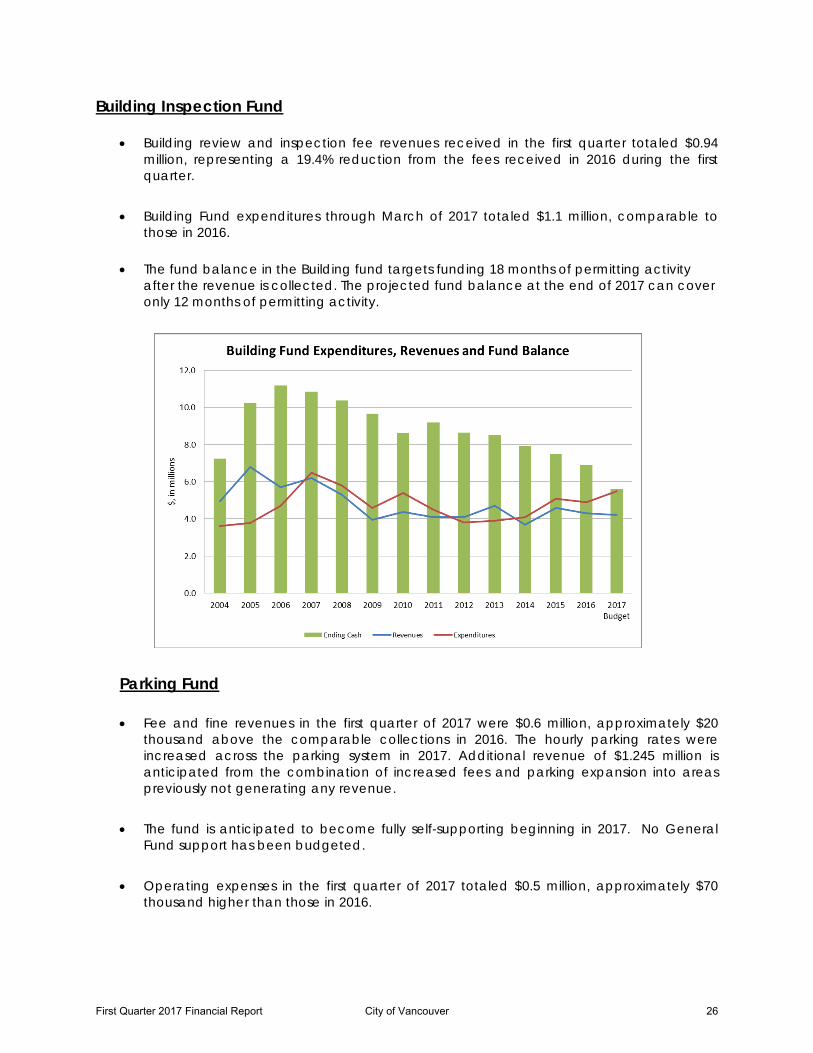
Building Inspection Fund
• Building review and inspection fee revenues received in the first quarter totaled $0.94 million, representing a 19.4% reduction from the fees received in 2016 during the first quarter.
• Building Fund expenditures through March of 2017 totaled $1.1 million, comparable to
those in 2016.
• The fund balance in the Building fund targets funding 18 months of permitting activity after the revenue is collected. The projected fund balance at the end of 2017 can cover only 12 months of permitting activity.
Parking Fund
• Fee and fine revenues in the first quarter of 2017 were $0.6 million, approximately $20 thousand above the comparable collections in 2016. The hourly parking rates were increased across the parking system in 2017. Additional revenue of $1.245 million is anticipated from the combination of increased fees and parking expansion into areas previously not generating any revenue.
• The fund is anticipated to become fully self-supporting beginning in 2017. No General Fund support has been budgeted.
• Operating expenses in the first quarter of 2017 totaled $0.5 million, approximately $70
thousand higher than those in 2016.
First Quarter 2017 Financial Report City of Vancouver 26
Utility Operations • Operating transfers between the Water, Sewer and Storm Water funds are included in
the accompanying report, Attachment A, per budget requirements. These transfers are generally eliminated when financial statements are prepared. Financial statements for utility funds are prepared on a quarterly basis. Please call (360) 487-8441 to receive a copy of the detailed financial statements for the utility funds.
Water
• Water sales revenues totaled $6.6 million through March, or 21% of the forecast. Collections were $0.6 million above the comparable 2016 collections, largely due to the impact of tax increases for Street Initiatives, effective in 2016, inflationary rate increases and the impact of the 3.4% utility tax increase to fund additional staffing in police effective April 1, 2017.
• Expenditures in the Water fund in the first quarter of 2017 totaled $6.9 million, or 16.0% of the budget.
Sewer
• Sewer charge revenues in the Sewer Fund were $10.2 million by March 2017, approximately $0.4 million above the comparable 2016 revenues. Sewer rates had inflationary increase in 2017 as well as an adjustment for a 3.4% utility tax increase to fund increased police staffing.
• Sewer expenditures in the first quarter of 2017 totaled $9.6 million, $1.3 million below the
2016 comparable expenditures, mostly due to the timing of the capital projects. Storm Water
• A total of $3.3 million in storm water fee revenue was received in the first quarter of 2017, approximately $0.3 million higher than the 2016 comparable revenues. In 2017, the rates had an inflationary increase as well as an adjustment for a 3.4% utility tax increase to fund increased police staffing.
• Overall, the expenditures in the Storm Water fund were $4.6 million by March of 2017, or 29% of the budget, approximately $1.8 million higher than those in the first quarter of 2016.
Internal Service Funds Equipment Services Operating and Capital Funds
• A total of $1.4 million was spent by the Equipment Services on operating activities, or 22% of the budget for the year. ER&R fund spent only $0.2 million by the end of March, or 7% of the budget for the year due to the timing of the vehicle purchases.
Technology ER&R Fund
• A total of $0.2 million, or 4% of the budget was spent on equipment replacement. A large portion of the budget for 2017 is earmarked for the replacement of the City’s 16-year old ERP System, Oracle. Negotiations are under way with the vendor and implementation partner of the future ERP system.
First Quarter 2017 Financial Report City of Vancouver 27
Internal Services Fund
• A total of $3.1 million was spent by the Internal Services departments (IT, Finance, HR and General Services) during the first quarter of 2017. This represents 21.9% of the budget for the year.
Risk Fund
• A total of $0.3 million was spent by March of 2017. The majority of the costs occur later during the year.
Benefits and Self Insured Health Insurance Funds
• A total of $3.9 million was spent by March of 2017 on employee benefits, including health insurance and payments to medical trusts. The amount spent represents 22.8% of the budget for the year.
IV. Outstanding Debt
• At the end of the first quarter of 2017, the City had about $82.9 million of general obligation
(G.O.) debt outstanding and approximately $21.3 million of revenue bond debt outstanding. General obligation debt is backed by the full faith and credit of the City and by general taxes. Revenue bond debt is supported by a pledge of specific revenues. All of the City’s revenue bond debt is supported by the City’s water and sewer utilities. The weighted average interest rate for the City’s general obligation debt is 3.21% while the average interest rate for the City’s revenue bond debt is 4.02%.
A complete list of the City’s outstanding debt is included in Attachment C.
V. Investments
Market Conditions • Information received since the Federal Open Market Committee met in February suggests
that economic activity is expanding at a moderate pace. Job gains remained solid and the unemployment rate was little changed in recent months. Household spending has continued to rise moderately while business fixed investment appears to have firmed somewhat. Inflation has increased in recent quarters, moving close to the Committee's 2 percent longer-run objective; excluding energy and food prices, inflation was little changed and continued to run somewhat below 2 percent. Market-based measures of inflation compensation remain low; survey-based measures of longer-term inflation expectations are little changed, on balance.
• The FOMC is maintaining its existing policy of reinvesting principal payments from its holdings of agency debt and agency mortgage-backed securities in agency mortgage-backed securities and of rolling over maturing Treasury securities at auction, and it anticipates doing so until normalization of the level of the federal funds rate is well under way. This policy, by keeping the Committee's holdings of longer-term securities at sizable levels, should help maintain accommodative financial conditions.
First Quarter 2017 Financial Report City of Vancouver 28
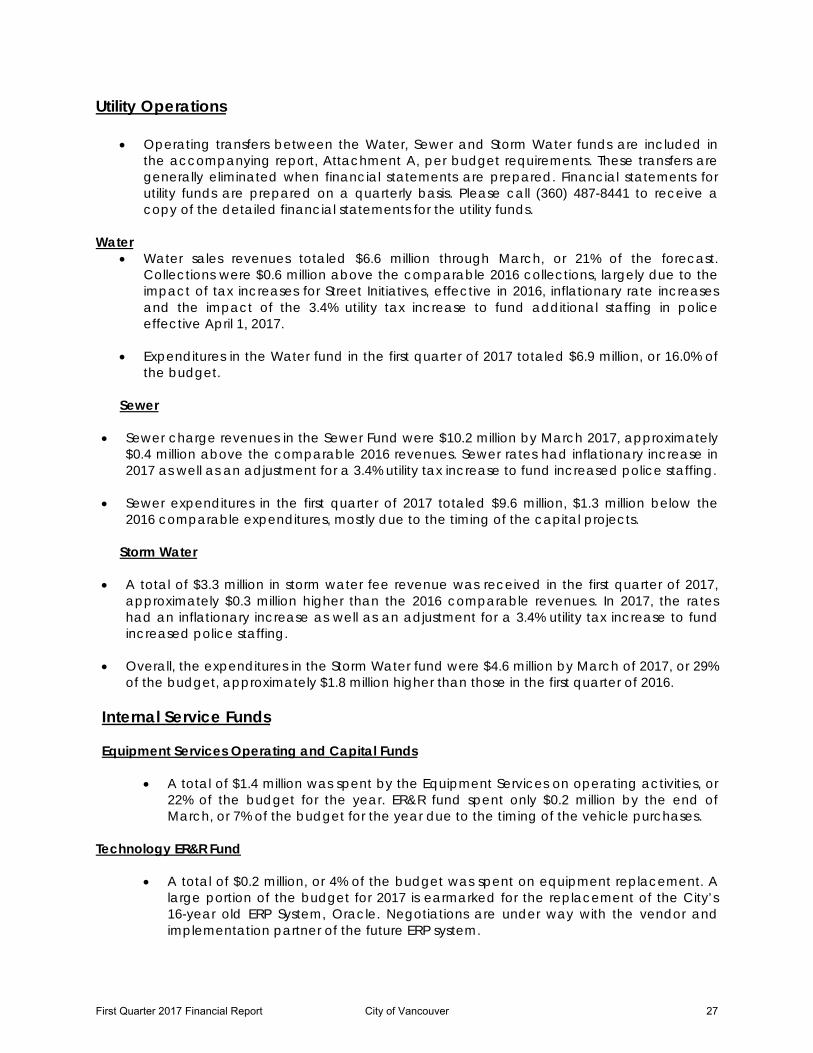
• The overall yield curve increased during the first quarter of 2017. The yield on the three-month Treasury has increased ending at 0.76% at the end of the first quarter. The six-month Treasury yield has increased to 0.91%. The yield on the two-year Treasury has increased to 1.27%. The thirty-year Treasury yield slightly decreased, ending the first quarter at 3.02% from 3.06%. Market risk of the City’s portfolio is low. The average maturity of the portfolio has been kept at one year. The investment maturities are expected to meet the cash flow needs of the city and it is unlikely that an investment would have to be liquidated before maturity to meet the city cash needs.
• The City complies with State statutory guidelines and the City’s investment policies that limit the types of securities purchased. These consist of U.S. Treasury securities, federally-backed agency securities, and other relatively risk-free investments. The City does not leverage its portfolio nor does it invest in derivatives.
Investment Performance The average amount invested during the first quarter of 2017 was $318.0 million compared to $296.0 million on March 31, 2016. The portfolio had a weighted average yield of 0.90% year to date, which is 10 basis points lower than the projected yield of 1.0% for 2017. The projected yield is based upon the blended yield between existing rates and expected market rates when new investments are purchased during the year. The year-to-date yield is 28 bps higher than the State Investment Pool, which had an average yield of 0.69%. The State Pool has a weighted average maturity of 36 days. The City’s investment portfolio weighted average maturity is approximately 12 months. Longer-term portfolio yields will outperform shorter-term portfolio yields in a falling interest rate environment. Interest revenue distributed through the first quarter of 2017 to all funds is approximately $711,132 compared to $450,580 during the same period of 2016.
First Quarter 2017 Financial Report City of Vancouver 29
The City’s investment portfolio profile is detailed in Attachment D.
VI. Interfund Loans In 2003, Council passed an ordinance giving the City Treasurer the authority to make interfund loans to meet the short term liquidity and cash flow needs of the City’s various funds. The ordinance requires the City Treasurer to provide a quarterly report to City Council showing the amount of all interfund loans outstanding and the repayment plan for those loans. Through the first quarter of 2017, there have not been any funds needing an interfund loan. City of Vancouver Outstanding Interfund LoansThrough First Quarter 2017
Balance InterestOutstanding Interest Expense
Fund Description 03/31/17 Lending Fund Rate Paid in 2017 Repayment Plan
Total Outstanding Interfund Loan Balance -$
First Quarter 2017 Financial Report City of Vancouver 30
Attachment A
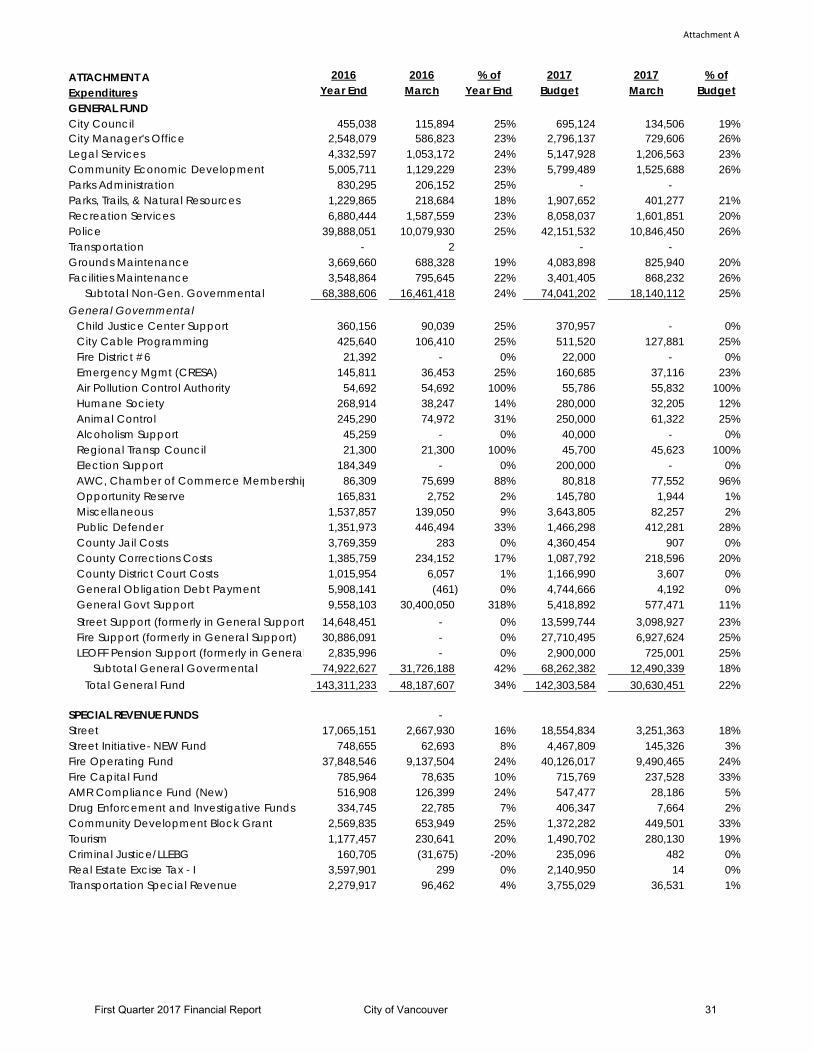
ATTACHMENT A 2016 2016 % of 2017 2017 % ofExpenditures Year End March Year End Budget March BudgetGENERAL FUNDCity Council 455,038 115,894 25% 695,124 134,506 19%City Manager's Office 2,548,079 586,823 23% 2,796,137 729,606 26%Legal Services 4,332,597 1,053,172 24% 5,147,928 1,206,563 23%Community Economic Development 5,005,711 1,129,229 23% 5,799,489 1,525,688 26%Parks Administration 830,295 206,152 25% - - Parks, Trails, & Natural Resources 1,229,865 218,684 18% 1,907,652 401,277 21%Recreation Services 6,880,444 1,587,559 23% 8,058,037 1,601,851 20%Police 39,888,051 10,079,930 25% 42,151,532 10,846,450 26%Transportation - 2 - - Grounds Maintenance 3,669,660 688,328 19% 4,083,898 825,940 20%Facilities Maintenance 3,548,864 795,645 22% 3,401,405 868,232 26%
Subtotal Non-Gen. Governmental 68,388,606 16,461,418 24% 74,041,202 18,140,112 25%General Governmental
Child Justice Center Support 360,156 90,039 25% 370,957 - 0%City Cable Programming 425,640 106,410 25% 511,520 127,881 25%Fire District #6 21,392 - 0% 22,000 - 0%Emergency Mgmt (CRESA) 145,811 36,453 25% 160,685 37,116 23%Air Pollution Control Authority 54,692 54,692 100% 55,786 55,832 100%Humane Society 268,914 38,247 14% 280,000 32,205 12%Animal Control 245,290 74,972 31% 250,000 61,322 25%Alcoholism Support 45,259 - 0% 40,000 - 0%Regional Transp Council 21,300 21,300 100% 45,700 45,623 100%Election Support 184,349 - 0% 200,000 - 0%AWC, Chamber of Commerce Membership 86,309 75,699 88% 80,818 77,552 96%Opportunity Reserve 165,831 2,752 2% 145,780 1,944 1%Miscellaneous 1,537,857 139,050 9% 3,643,805 82,257 2%Public Defender 1,351,973 446,494 33% 1,466,298 412,281 28%County Jail Costs 3,769,359 283 0% 4,360,454 907 0%County Corrections Costs 1,385,759 234,152 17% 1,087,792 218,596 20%County District Court Costs 1,015,954 6,057 1% 1,166,990 3,607 0%General Obligation Debt Payment 5,908,141 (461) 0% 4,744,666 4,192 0%General Govt Support 9,558,103 30,400,050 318% 5,418,892 577,471 11%Street Support (formerly in General Support 14,648,451 - 0% 13,599,744 3,098,927 23%Fire Support (formerly in General Support) 30,886,091 - 0% 27,710,495 6,927,624 25%LEOFF Pension Support (formerly in General 2,835,996 - 0% 2,900,000 725,001 25%
Subtotal General Govermental 74,922,627 31,726,188 42% 68,262,382 12,490,339 18%Total General Fund 143,311,233 48,187,607 34% 142,303,584 30,630,451 22%
SPECIAL REVENUE FUNDS - Street 17,065,151 2,667,930 16% 18,554,834 3,251,363 18%Street Initiative- NEW Fund 748,655 62,693 8% 4,467,809 145,326 3%Fire Operating Fund 37,848,546 9,137,504 24% 40,126,017 9,490,465 24%Fire Capital Fund 785,964 78,635 10% 715,769 237,528 33%AMR Compliance Fund (New) 516,908 126,399 24% 547,477 28,186 5%Drug Enforcement and Investigative Funds 334,745 22,785 7% 406,347 7,664 2%Community Development Block Grant 2,569,835 653,949 25% 1,372,282 449,501 33%Tourism 1,177,457 230,641 20% 1,490,702 280,130 19%Criminal Justice/LLEBG 160,705 (31,675) -20% 235,096 482 0%Real Estate Excise Tax - I 3,597,901 299 0% 2,140,950 14 0%Transportation Special Revenue 2,279,917 96,462 4% 3,755,029 36,531 1%
First Quarter 2017 Financial Report City of Vancouver 31
Attachment A
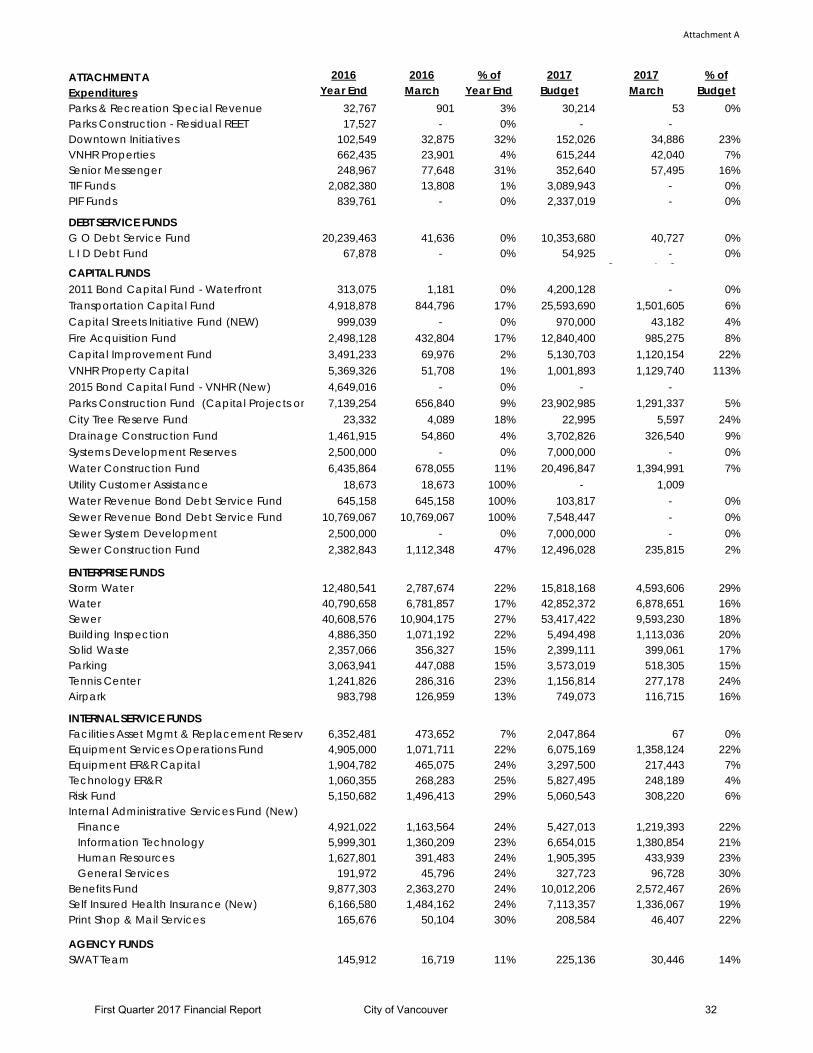
ATTACHMENT A 2016 2016 % of 2017 2017 % ofExpenditures Year End March Year End Budget March BudgetParks & Recreation Special Revenue 32,767 901 3% 30,214 53 0%Parks Construction - Residual REET 17,527 - 0% - - Downtown Initiatives 102,549 32,875 32% 152,026 34,886 23%VNHR Properties 662,435 23,901 4% 615,244 42,040 7%Senior Messenger 248,967 77,648 31% 352,640 57,495 16%TIF Funds 2,082,380 13,808 1% 3,089,943 - 0%PIF Funds 839,761 - 0% 2,337,019 - 0%
DEBT SERVICE FUNDSG O Debt Service Fund 20,239,463 41,636 0% 10,353,680 40,727 0%L I D Debt Fund 67,878 - 0% 54,925 - 0%g ( gCAPITAL FUNDS2011 Bond Capital Fund - Waterfront 313,075 1,181 0% 4,200,128 - 0%Transportation Capital Fund 4,918,878 844,796 17% 25,593,690 1,501,605 6%Capital Streets Initiative Fund (NEW) 999,039 - 0% 970,000 43,182 4%Fire Acquisition Fund 2,498,128 432,804 17% 12,840,400 985,275 8%Capital Improvement Fund 3,491,233 69,976 2% 5,130,703 1,120,154 22%VNHR Property Capital 5,369,326 51,708 1% 1,001,893 1,129,740 113%2015 Bond Capital Fund - VNHR (New) 4,649,016 - 0% - - Parks Construction Fund (Capital Projects on 7,139,254 656,840 9% 23,902,985 1,291,337 5%City Tree Reserve Fund 23,332 4,089 18% 22,995 5,597 24%Drainage Construction Fund 1,461,915 54,860 4% 3,702,826 326,540 9%Systems Development Reserves 2,500,000 - 0% 7,000,000 - 0%Water Construction Fund 6,435,864 678,055 11% 20,496,847 1,394,991 7%Utility Customer Assistance 18,673 18,673 100% - 1,009 Water Revenue Bond Debt Service Fund 645,158 645,158 100% 103,817 - 0%Sewer Revenue Bond Debt Service Fund 10,769,067 10,769,067 100% 7,548,447 - 0%Sewer System Development 2,500,000 - 0% 7,000,000 - 0%Sewer Construction Fund 2,382,843 1,112,348 47% 12,496,028 235,815 2%
ENTERPRISE FUNDSStorm Water 12,480,541 2,787,674 22% 15,818,168 4,593,606 29%Water 40,790,658 6,781,857 17% 42,852,372 6,878,651 16%Sewer 40,608,576 10,904,175 27% 53,417,422 9,593,230 18%Building Inspection 4,886,350 1,071,192 22% 5,494,498 1,113,036 20%Solid Waste 2,357,066 356,327 15% 2,399,111 399,061 17%Parking 3,063,941 447,088 15% 3,573,019 518,305 15%Tennis Center 1,241,826 286,316 23% 1,156,814 277,178 24%Airpark 983,798 126,959 13% 749,073 116,715 16%
INTERNAL SERVICE FUNDSFacilities Asset Mgmt & Replacement Reserv 6,352,481 473,652 7% 2,047,864 67 0%Equipment Services Operations Fund 4,905,000 1,071,711 22% 6,075,169 1,358,124 22%Equipment ER&R Capital 1,904,782 465,075 24% 3,297,500 217,443 7%Technology ER&R 1,060,355 268,283 25% 5,827,495 248,189 4%Risk Fund 5,150,682 1,496,413 29% 5,060,543 308,220 6%Internal Administrative Services Fund (New) Finance 4,921,022 1,163,564 24% 5,427,013 1,219,393 22% Information Technology 5,999,301 1,360,209 23% 6,654,015 1,380,854 21% Human Resources 1,627,801 391,483 24% 1,905,395 433,939 23% General Services 191,972 45,796 24% 327,723 96,728 30%Benefits Fund 9,877,303 2,363,270 24% 10,012,206 2,572,467 26%Self Insured Health Insurance (New) 6,166,580 1,484,162 24% 7,113,357 1,336,067 19%Print Shop & Mail Services 165,676 50,104 30% 208,584 46,407 22%
AGENCY FUNDSSWAT Team 145,912 16,719 11% 225,136 30,446 14%
First Quarter 2017 Financial Report City of Vancouver 32
Attachment A
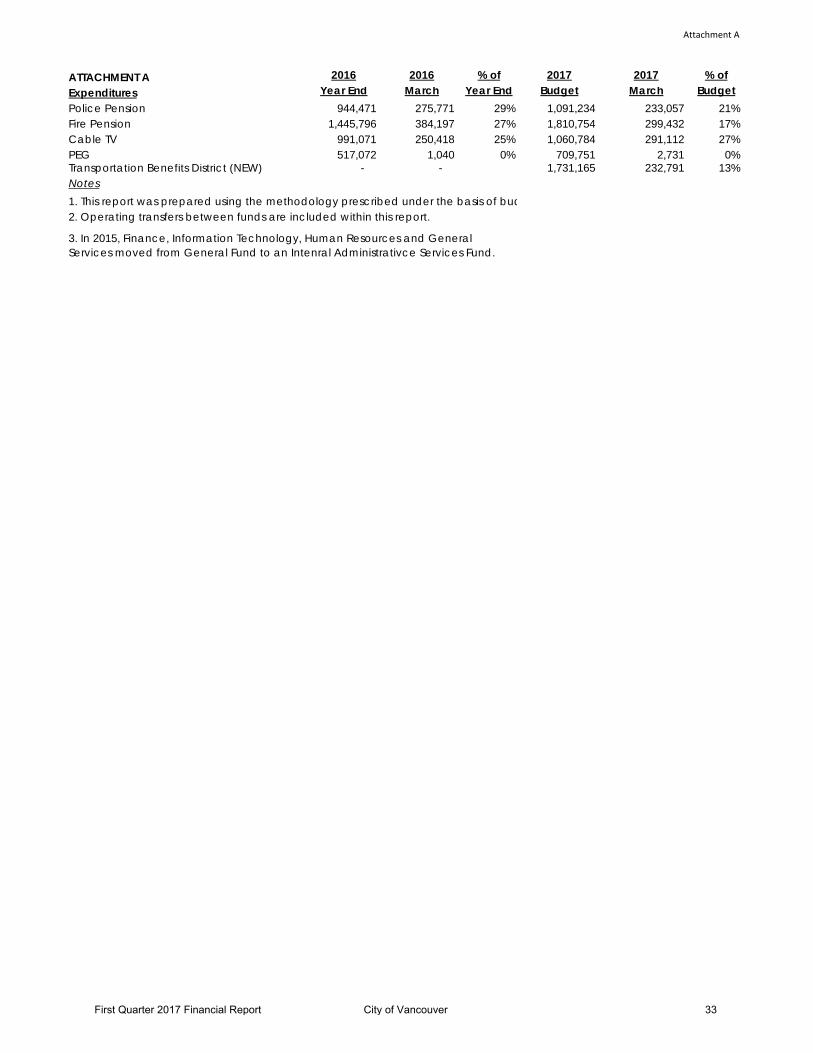
ATTACHMENT A 2016 2016 % of 2017 2017 % ofExpenditures Year End March Year End Budget March BudgetPolice Pension 944,471 275,771 29% 1,091,234 233,057 21%Fire Pension 1,445,796 384,197 27% 1,810,754 299,432 17%Cable TV 991,071 250,418 25% 1,060,784 291,112 27%PEG 517,072 1,040 0% 709,751 2,731 0%Transportation Benefits District (NEW) - - 1,731,165 232,791 13%Notes
2. Operating transfers between funds are included within this report.1. This report was prepared using the methodology prescribed under the basis of bud
3. In 2015, Finance, Information Technology, Human Resources and General Services moved from General Fund to an Intenral Administrativce Services Fund.
First Quarter 2017 Financial Report City of Vancouver 33

6/2/2017
MAR-16 MAR-17ATTACHMENT B ADJ-16 MAR-16 MAR-17 MAR-17Revenues 2016 2016 % of 2017 2017 % of
Year End March Year End Budget March BudgetGENERAL FUNDTax Revenue
Property Tax 44,917,701 3,527,414 8% 45,793,636 3,554,446 8%Sales Tax 36,737,708 8,762,599 24% 33,223,368 9,297,768 28%Electrical Tax 7,952,266 3,020,306 38% 8,172,775 3,192,728 39%Natural Gas 2,405,698 719,279 30% 2,781,475 685,529 25%Telephone 4,120,340 1,034,674 25% 3,853,824 978,848 25%Cable Franchise Fee 2,093,791 508,240 24% 1,862,190 566,121 30%Water/Sewer/Storm Water 18,456,731 4,018,898 22% 18,930,241 4,313,703 23%Solid Waste Utility Tax 4,403,448 1,049,721 24% 4,168,886 735,796 18%Gambling and Leasehold Taxes 683,387 97,445 14% 647,775 67,458 10%
Subtotal Tax Revenue 121,771,070 22,738,576 19% 119,434,170 23,392,398 20%Business Licenses 1,206,219 311,938 26% 1,161,733 320,969 28%Grants & Entitlements 682,623 20,505 3% 360,156 20,286 6%State Shared Revenues 4,058,159 746,040 18% 3,573,410 692,314 19%Parks Contract with Clark County 81,710 17,109 75,000 17,489 Charges for Services
Planning Permits 865,873 227,708 26% 560,000 274,002 49%Recreation Program Fees 4,166,722 987,970 24% 4,023,000 872,087 22%Interfund Service Charges 4,777,379 495,473 10% 5,117,305 1,073,992 21%Other Charges & Services 925,853 217,688 24% 860,000 259,278 30%
Subtotal Charges for Services 10,735,827 1,928,838 18% 10,560,305 2,479,359 23%District Court 1,629,866 393,789 24% 1,713,400 319,225 19%Miscellaneous 929,048 297,949 32% 624,321 337,961 54%Lease Revenue (short and long-term) 3,566,102 867,368 24% 2,442,907 773,823 32%Operating Transfers 744,765 (31,852) -4% 830,507 - 0%
Total General Fund 145,405,390 27,290,260 19% 140,775,909 28,353,823 20%SPECIAL REVENUE FUNDSStreet Fund
Real Estate Excise Tax 3,570,349 951,333 27% 2,327,600 953,243 41%Motor Vehicle Fuel Tax 3,556,557 851,159 24% 3,616,882 837,417 23%Permits and Misc. 1,333,673 143,029 11% 1,112,228 158,694 14%Operating Transfers 11,876,066 2,940,857 25% 10,988,177 2,747,044 25%
Total Street Fund 20,336,645 4,886,378 24% 18,044,887 4,696,399 Operating Street Initiative Fund (NEW) 1,494,477 467,980 31% 4,463,580 767,443 17%
Operating Fire FundService Charges-Fire Dist. #5 8,514,974 - 0% 9,735,412 - 0%Grant Revenue 17,045 - 0% - 44,187 n/aPermit/Other Fees and Misc 1,054,256 163,973 16% 1,902,252 364,399 19%Operating Transfers 25,916,940 25,886,091 100% 27,829,687 6,927,624 25%
Total Operating Fire Fund 35,503,214 26,050,064 73% 39,467,351 7,336,210 19% Fire Equipment Fund 1,310,702 283,732 22% 1,065,679 256,509 24%
AMR Compliance Fund (New) 681,844 227,326 33% 681,000 293,180 43%Other Special Revenue Funds
Drug Enforcement 295,815 49,847 17% 124,900 66,301 53%Community Development Block Grant 2,564,205 579,319 23% 2,959,757 398,188 13%Tourism 2,330,616 419,203 18% 1,869,689 456,149 24%Criminal Justice/LLEBG 250,435 61,289 24% 242,177 64,238 27%
Transportation Special Fund 2,642,083 623,930 24% 2,610,000 596,461 23%Real Estate Excise Tax - I 3,464,231 925,063 27% 2,196,944 928,286 42%Parks & Recreation Special Revenue Fund 21,807 340 2% 15,200 1,175 8%Downtown Initiatives 179,435 44,725 25% 175,733 45,349 26%VNHR Properties 566,481 46,884 8% 527,456 47,986 9%Senior Messenger 284,284 70,150 25% 287,000 46,452 16%TIF Funds 1,822,547 616,092 34% 1,794,796 557,241 31%PIF Funds 1,507,145 565,571 38% 1,227,900 667,578 54%
First Quarter 2017 Financial Report City of Vancouver 34
6/2/2017
ATTACHMENT B ADJ-16 MAR-16 MAR-17 MAR-17Revenues 2016 2016 % of 2017 2017 % of
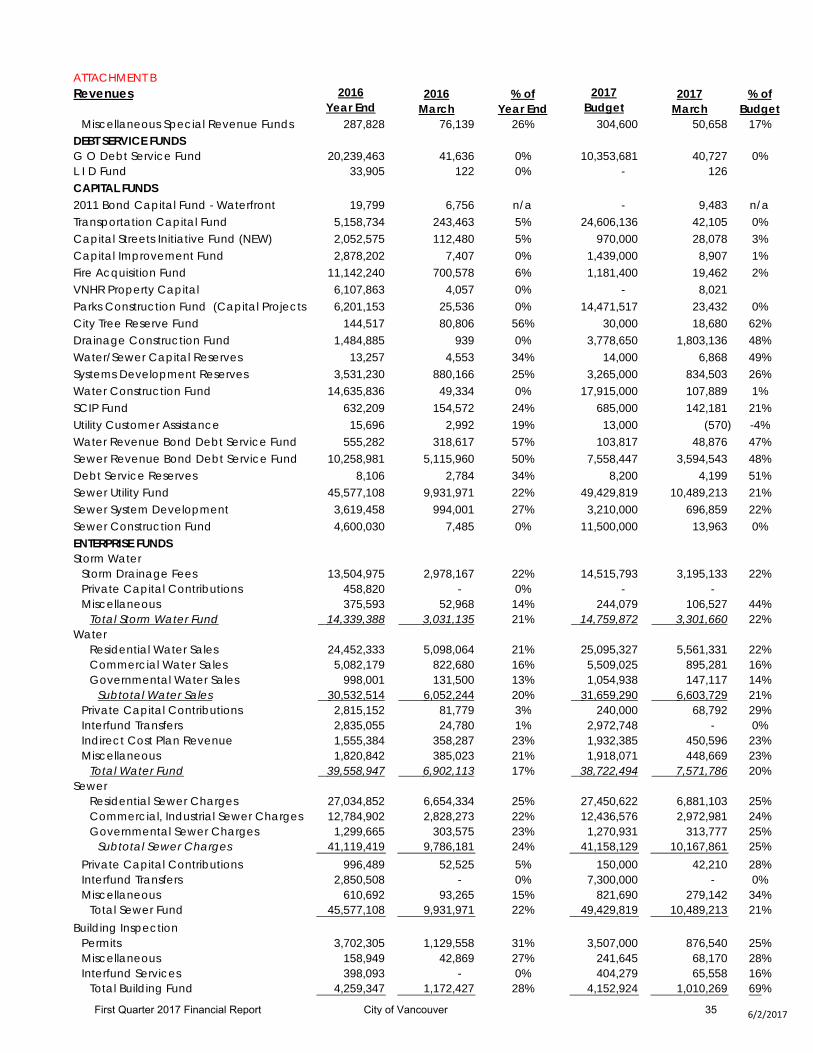
Year End March Year End Budget March BudgetMiscellaneous Special Revenue Funds 287,828 76,139 26% 304,600 50,658 17%
DEBT SERVICE FUNDSG O Debt Service Fund 20,239,463 41,636 0% 10,353,681 40,727 0%L I D Fund 33,905 122 0% - 126 CAPITAL FUNDS2011 Bond Capital Fund - Waterfront 19,799 6,756 n/a - 9,483 n/aTransportation Capital Fund 5,158,734 243,463 5% 24,606,136 42,105 0%Capital Streets Initiative Fund (NEW) 2,052,575 112,480 5% 970,000 28,078 3%Capital Improvement Fund 2,878,202 7,407 0% 1,439,000 8,907 1%Fire Acquisition Fund 11,142,240 700,578 6% 1,181,400 19,462 2%VNHR Property Capital 6,107,863 4,057 0% - 8,021 Parks Construction Fund (Capital Projects o 6,201,153 25,536 0% 14,471,517 23,432 0%City Tree Reserve Fund 144,517 80,806 56% 30,000 18,680 62%Drainage Construction Fund 1,484,885 939 0% 3,778,650 1,803,136 48%Water/Sewer Capital Reserves 13,257 4,553 34% 14,000 6,868 49%Systems Development Reserves 3,531,230 880,166 25% 3,265,000 834,503 26%Water Construction Fund 14,635,836 49,334 0% 17,915,000 107,889 1%SCIP Fund 632,209 154,572 24% 685,000 142,181 21%Utility Customer Assistance 15,696 2,992 19% 13,000 (570) -4%Water Revenue Bond Debt Service Fund 555,282 318,617 57% 103,817 48,876 47%Sewer Revenue Bond Debt Service Fund 10,258,981 5,115,960 50% 7,558,447 3,594,543 48%Debt Service Reserves 8,106 2,784 34% 8,200 4,199 51%Sewer Utility Fund 45,577,108 9,931,971 22% 49,429,819 10,489,213 21%Sewer System Development 3,619,458 994,001 27% 3,210,000 696,859 22%Sewer Construction Fund 4,600,030 7,485 0% 11,500,000 13,963 0%ENTERPRISE FUNDSStorm Water
Storm Drainage Fees 13,504,975 2,978,167 22% 14,515,793 3,195,133 22%Private Capital Contributions 458,820 - 0% - - Miscellaneous 375,593 52,968 14% 244,079 106,527 44%
Total Storm Water Fund 14,339,388 3,031,135 21% 14,759,872 3,301,660 22%Water
Residential Water Sales 24,452,333 5,098,064 21% 25,095,327 5,561,331 22%Commercial Water Sales 5,082,179 822,680 16% 5,509,025 895,281 16%Governmental Water Sales 998,001 131,500 13% 1,054,938 147,117 14%
Subtotal Water Sales 30,532,514 6,052,244 20% 31,659,290 6,603,729 21%Private Capital Contributions 2,815,152 81,779 3% 240,000 68,792 29%Interfund Transfers 2,835,055 24,780 1% 2,972,748 - 0%Indirect Cost Plan Revenue 1,555,384 358,287 23% 1,932,385 450,596 23%Miscellaneous 1,820,842 385,023 21% 1,918,071 448,669 23%
Total Water Fund 39,558,947 6,902,113 17% 38,722,494 7,571,786 20%Sewer
Residential Sewer Charges 27,034,852 6,654,334 25% 27,450,622 6,881,103 25%Commercial, Industrial Sewer Charges 12,784,902 2,828,273 22% 12,436,576 2,972,981 24%Governmental Sewer Charges 1,299,665 303,575 23% 1,270,931 313,777 25%
Subtotal Sewer Charges 41,119,419 9,786,181 24% 41,158,129 10,167,861 25%Private Capital Contributions 996,489 52,525 5% 150,000 42,210 28%Interfund Transfers 2,850,508 - 0% 7,300,000 - 0%Miscellaneous 610,692 93,265 15% 821,690 279,142 34%
Total Sewer Fund 45,577,108 9,931,971 22% 49,429,819 10,489,213 21%Building Inspection
Permits 3,702,305 1,129,558 31% 3,507,000 876,540 25%Miscellaneous 158,949 42,869 27% 241,645 68,170 28%Interfund Services 398,093 - 0% 404,279 65,558 16%
Total Building Fund 4,259,347 1,172,427 28% 4,152,924 1,010,269 69%
First Quarter 2017 Financial Report City of Vancouver 35
6/2/2017
ATTACHMENT B ADJ-16 MAR-16 MAR-17 MAR-17Revenues 2016 2016 % of 2017 2017 % of
Year End March Year End Budget March BudgetSolid Waste
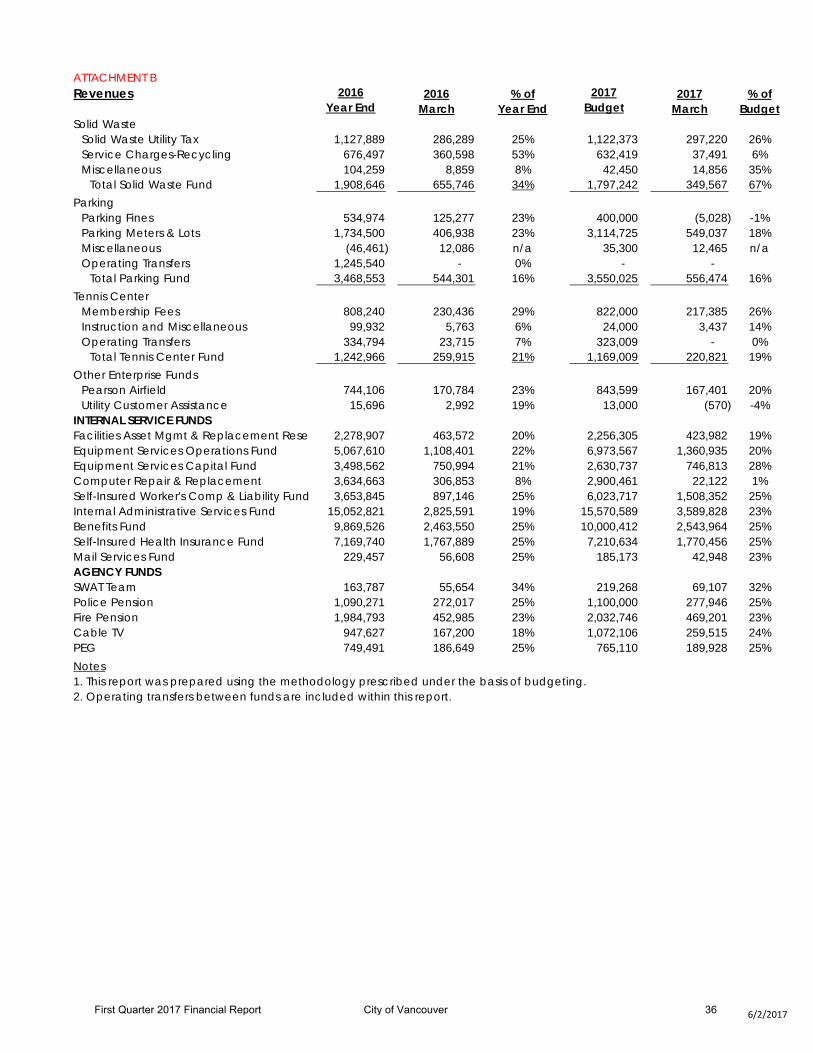
Solid Waste Utility Tax 1,127,889 286,289 25% 1,122,373 297,220 26%Service Charges-Recycling 676,497 360,598 53% 632,419 37,491 6%Miscellaneous 104,259 8,859 8% 42,450 14,856 35%
Total Solid Waste Fund 1,908,646 655,746 34% 1,797,242 349,567 67%Parking
Parking Fines 534,974 125,277 23% 400,000 (5,028) -1%Parking Meters & Lots 1,734,500 406,938 23% 3,114,725 549,037 18%Miscellaneous (46,461) 12,086 n/a 35,300 12,465 n/aOperating Transfers 1,245,540 - 0% - -
Total Parking Fund 3,468,553 544,301 16% 3,550,025 556,474 16%Tennis Center
Membership Fees 808,240 230,436 29% 822,000 217,385 26%Instruction and Miscellaneous 99,932 5,763 6% 24,000 3,437 14%Operating Transfers 334,794 23,715 7% 323,009 - 0%
Total Tennis Center Fund 1,242,966 259,915 21% 1,169,009 220,821 19%Other Enterprise Funds
Pearson Airfield 744,106 170,784 23% 843,599 167,401 20%Utility Customer Assistance 15,696 2,992 19% 13,000 (570) -4%
INTERNAL SERVICE FUNDSFacilities Asset Mgmt & Replacement Reser 2,278,907 463,572 20% 2,256,305 423,982 19%Equipment Services Operations Fund 5,067,610 1,108,401 22% 6,973,567 1,360,935 20%Equipment Services Capital Fund 3,498,562 750,994 21% 2,630,737 746,813 28%Computer Repair & Replacement 3,634,663 306,853 8% 2,900,461 22,122 1%Self-Insured Worker's Comp & Liability Fund 3,653,845 897,146 25% 6,023,717 1,508,352 25%Internal Administrative Services Fund 15,052,821 2,825,591 19% 15,570,589 3,589,828 23%Benefits Fund 9,869,526 2,463,550 25% 10,000,412 2,543,964 25%Self-Insured Health Insurance Fund 7,169,740 1,767,889 25% 7,210,634 1,770,456 25%Mail Services Fund 229,457 56,608 25% 185,173 42,948 23%AGENCY FUNDSSWAT Team 163,787 55,654 34% 219,268 69,107 32%Police Pension 1,090,271 272,017 25% 1,100,000 277,946 25%Fire Pension 1,984,793 452,985 23% 2,032,746 469,201 23%Cable TV 947,627 167,200 18% 1,072,106 259,515 24%PEG 749,491 186,649 25% 765,110 189,928 25%Notes1. This report was prepared using the methodology prescribed under the basis of budgeting.2. Operating transfers between funds are included within this report.
First Quarter 2017 Financial Report City of Vancouver 36
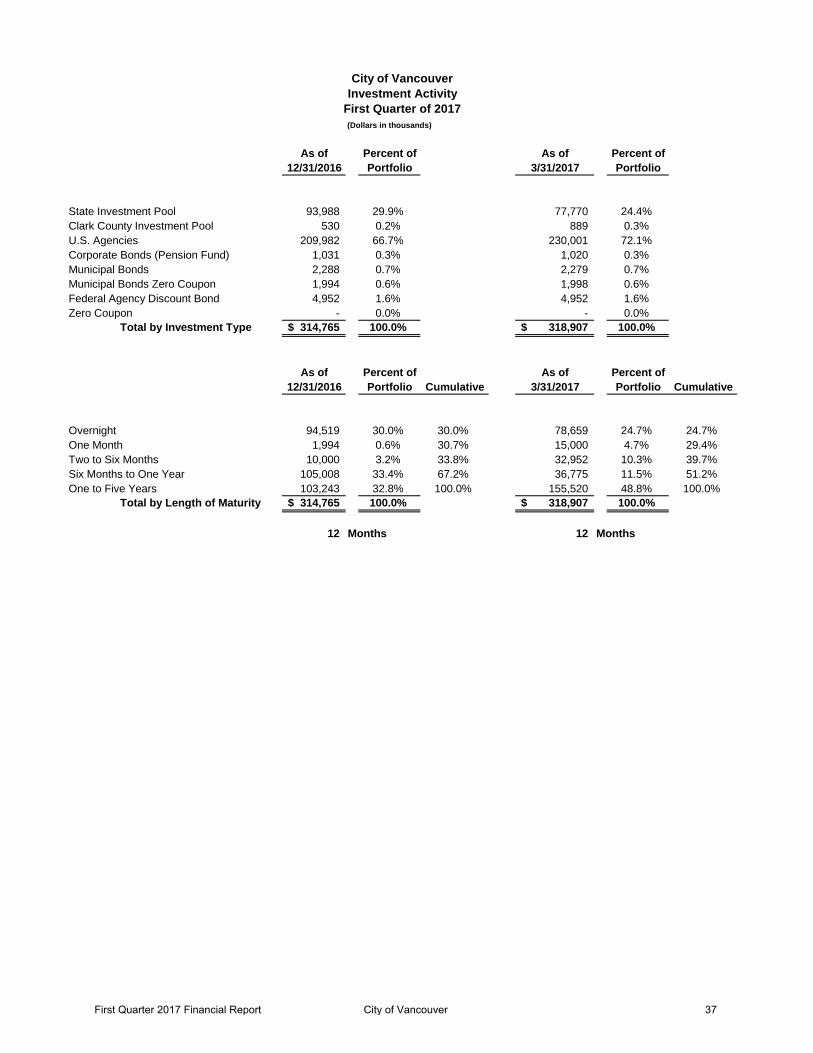
City of VancouverInvestment Activity
First Quarter of 2017(Dollars in thousands)
As of Percent of As of Percent of12/31/2016 Portfolio 3/31/2017 Portfolio
State Investment Pool 93,988 29.9% 77,770 24.4%Clark County Investment Pool 530 0.2% 889 0.3%U.S. Agencies 209,982 66.7% 230,001 72.1%Corporate Bonds (Pension Fund) 1,031 0.3% 1,020 0.3%Municipal Bonds 2,288 0.7% 2,279 0.7%Municipal Bonds Zero Coupon 1,994 0.6% 1,998 0.6%Federal Agency Discount Bond 4,952 1.6% 4,952 1.6%Zero Coupon - 0.0% - 0.0%
Total by Investment Type 314,765$ 100.0% 318,907$ 100.0%
As of Percent of As of Percent of12/31/2016 Portfolio Cumulative 3/31/2017 Portfolio Cumulative
Overnight 94,519 30.0% 30.0% 78,659 24.7% 24.7%One Month 1,994 0.6% 30.7% 15,000 4.7% 29.4%Two to Six Months 10,000 3.2% 33.8% 32,952 10.3% 39.7%Six Months to One Year 105,008 33.4% 67.2% 36,775 11.5% 51.2%One to Five Years 103,243 32.8% 100.0% 155,520 48.8% 100.0%
Total by Length of Maturity 314,765$ 100.0% 318,907$ 100.0%
12 Months 12 Months
First Quarter 2017 Financial Report City of Vancouver 37
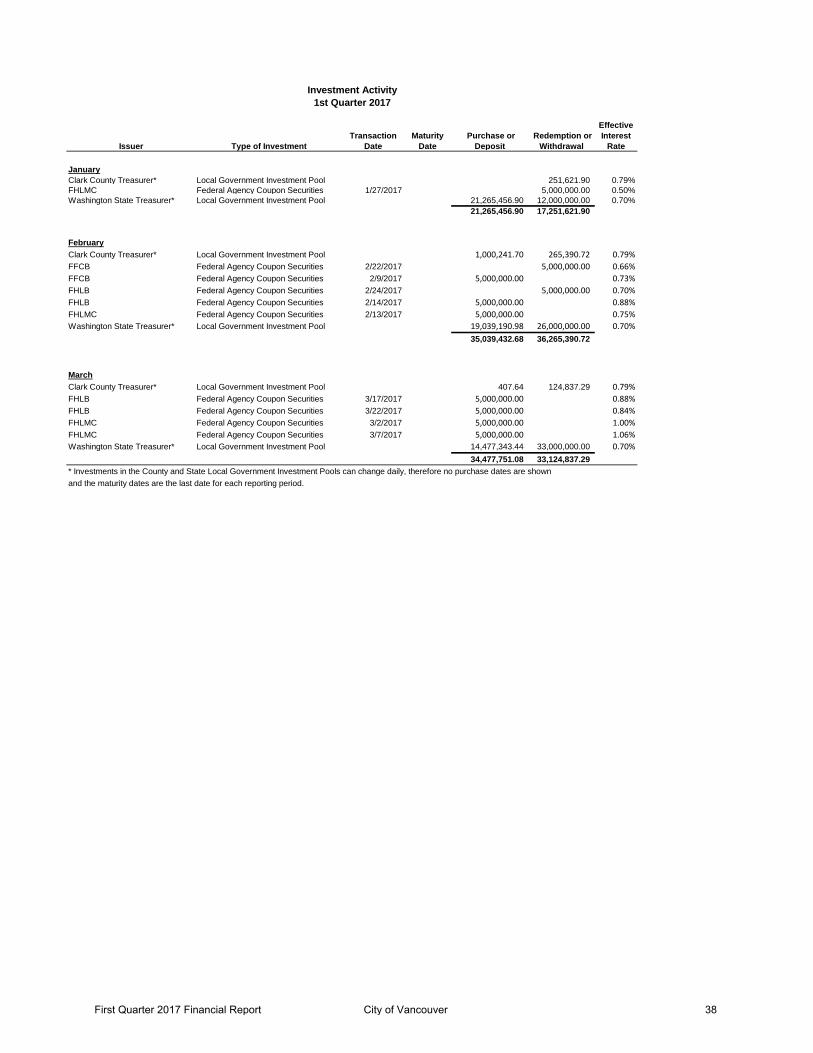
Investment Activity1st Quarter 2017
Issuer Type of InvestmentTransaction
DateMaturity
Date Purchase or
Deposit Redemption or
Withdrawal
Effective Interest
Rate
JanuaryClark County Treasurer* Local Government Investment Pool 251,621.90 0.79%FHLMC Federal Agency Coupon Securities 1/27/2017 5,000,000.00 0.50%Washington State Treasurer* Local Government Investment Pool 21,265,456.90 12,000,000.00 0.70%
21,265,456.90 17,251,621.90
FebruaryClark County Treasurer* Local Government Investment Pool 1,000,241.70 265,390.72 0.79%FFCB Federal Agency Coupon Securities 2/22/2017 5,000,000.00 0.66%FFCB Federal Agency Coupon Securities 2/9/2017 5,000,000.00 0.73%FHLB Federal Agency Coupon Securities 2/24/2017 5,000,000.00 0.70%FHLB Federal Agency Coupon Securities 2/14/2017 5,000,000.00 0.88%FHLMC Federal Agency Coupon Securities 2/13/2017 5,000,000.00 0.75%Washington State Treasurer* Local Government Investment Pool 19,039,190.98 26,000,000.00 0.70%
35,039,432.68 36,265,390.72
MarchClark County Treasurer* Local Government Investment Pool 407.64 124,837.29 0.79%FHLB Federal Agency Coupon Securities 3/17/2017 5,000,000.00 0.88%FHLB Federal Agency Coupon Securities 3/22/2017 5,000,000.00 0.84%FHLMC Federal Agency Coupon Securities 3/2/2017 5,000,000.00 1.00%FHLMC Federal Agency Coupon Securities 3/7/2017 5,000,000.00 1.06%Washington State Treasurer* Local Government Investment Pool 14,477,343.44 33,000,000.00 0.70%
34,477,751.08 33,124,837.29 * Investments in the County and State Local Government Investment Pools can change daily, therefore no purchase dates are shownand the maturity dates are the last date for each reporting period.
First Quarter 2017 Financial Report City of Vancouver 38
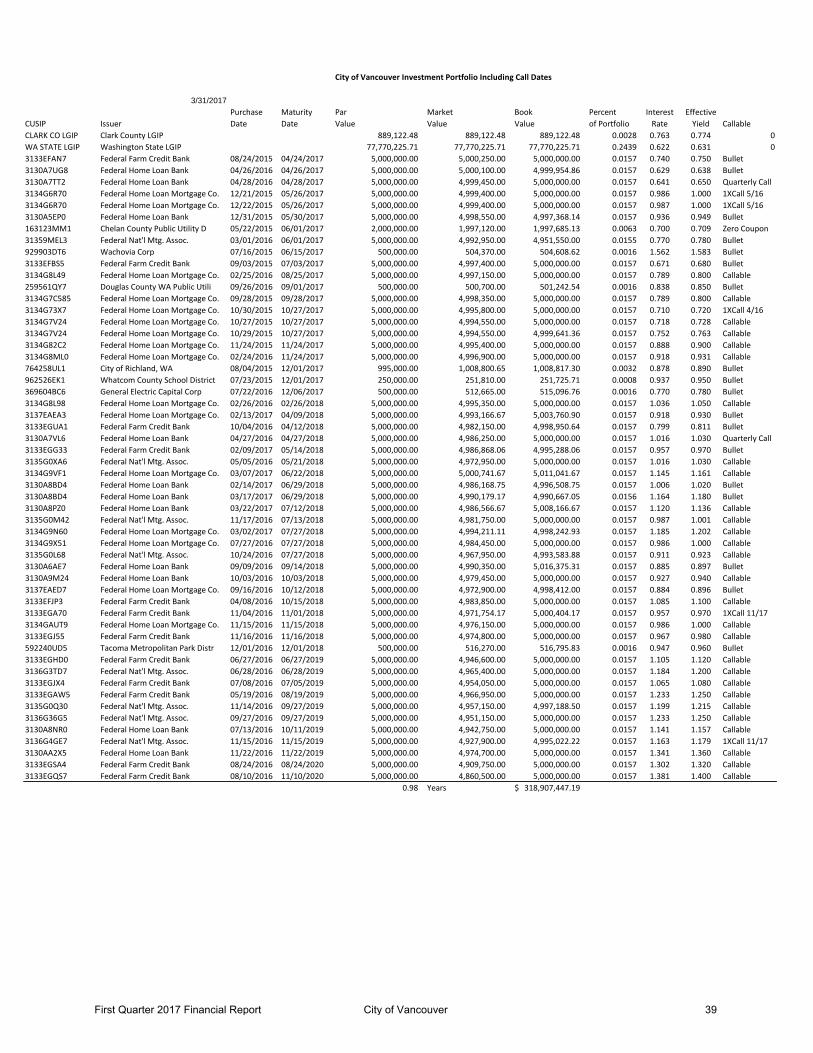
City of Vancouver Investment Portfolio Including Call Dates
3/31/2017Purchase Maturity Par Market Book Percent Interest Effective
CUSIP Issuer Date Date Value Value Value of Portfolio Rate Yield CallableCLARK CO LGIP Clark County LGIP 889,122.48 889,122.48 889,122.48 0.0028 0.763 0.774 0WA STATE LGIP Washington State LGIP 77,770,225.71 77,770,225.71 77,770,225.71 0.2439 0.622 0.631 03133EFAN7 Federal Farm Credit Bank 08/24/2015 04/24/2017 5,000,000.00 5,000,250.00 5,000,000.00 0.0157 0.740 0.750 Bullet3130A7UG8 Federal Home Loan Bank 04/26/2016 04/26/2017 5,000,000.00 5,000,100.00 4,999,954.86 0.0157 0.629 0.638 Bullet3130A7TT2 Federal Home Loan Bank 04/28/2016 04/28/2017 5,000,000.00 4,999,450.00 5,000,000.00 0.0157 0.641 0.650 Quarterly Call3134G6R70 Federal Home Loan Mortgage Co. 12/21/2015 05/26/2017 5,000,000.00 4,999,400.00 5,000,000.00 0.0157 0.986 1.000 1XCall 5/163134G6R70 Federal Home Loan Mortgage Co. 12/22/2015 05/26/2017 5,000,000.00 4,999,400.00 5,000,000.00 0.0157 0.987 1.000 1XCall 5/163130A5EP0 Federal Home Loan Bank 12/31/2015 05/30/2017 5,000,000.00 4,998,550.00 4,997,368.14 0.0157 0.936 0.949 Bullet163123MM1 Chelan County Public Utility D 05/22/2015 06/01/2017 2,000,000.00 1,997,120.00 1,997,685.13 0.0063 0.700 0.709 Zero Coupon31359MEL3 Federal Nat'l Mtg. Assoc. 03/01/2016 06/01/2017 5,000,000.00 4,992,950.00 4,951,550.00 0.0155 0.770 0.780 Bullet929903DT6 Wachovia Corp 07/16/2015 06/15/2017 500,000.00 504,370.00 504,608.62 0.0016 1.562 1.583 Bullet3133EFBS5 Federal Farm Credit Bank 09/03/2015 07/03/2017 5,000,000.00 4,997,400.00 5,000,000.00 0.0157 0.671 0.680 Bullet3134G8L49 Federal Home Loan Mortgage Co. 02/25/2016 08/25/2017 5,000,000.00 4,997,150.00 5,000,000.00 0.0157 0.789 0.800 Callable259561QY7 Douglas County WA Public Utili 09/26/2016 09/01/2017 500,000.00 500,700.00 501,242.54 0.0016 0.838 0.850 Bullet3134G7C585 Federal Home Loan Mortgage Co. 09/28/2015 09/28/2017 5,000,000.00 4,998,350.00 5,000,000.00 0.0157 0.789 0.800 Callable3134G73X7 Federal Home Loan Mortgage Co. 10/30/2015 10/27/2017 5,000,000.00 4,995,800.00 5,000,000.00 0.0157 0.710 0.720 1XCall 4/163134G7V24 Federal Home Loan Mortgage Co. 10/27/2015 10/27/2017 5,000,000.00 4,994,550.00 5,000,000.00 0.0157 0.718 0.728 Callable3134G7V24 Federal Home Loan Mortgage Co. 10/29/2015 10/27/2017 5,000,000.00 4,994,550.00 4,999,641.36 0.0157 0.752 0.763 Callable3134G82C2 Federal Home Loan Mortgage Co. 11/24/2015 11/24/2017 5,000,000.00 4,995,400.00 5,000,000.00 0.0157 0.888 0.900 Callable3134G8ML0 Federal Home Loan Mortgage Co. 02/24/2016 11/24/2017 5,000,000.00 4,996,900.00 5,000,000.00 0.0157 0.918 0.931 Callable764258UL1 City of Richland, WA 08/04/2015 12/01/2017 995,000.00 1,008,800.65 1,008,817.30 0.0032 0.878 0.890 Bullet962526EK1 Whatcom County School District 07/23/2015 12/01/2017 250,000.00 251,810.00 251,725.71 0.0008 0.937 0.950 Bullet369604BC6 General Electric Capital Corp 07/22/2016 12/06/2017 500,000.00 512,665.00 515,096.76 0.0016 0.770 0.780 Bullet3134G8L98 Federal Home Loan Mortgage Co. 02/26/2016 02/26/2018 5,000,000.00 4,995,350.00 5,000,000.00 0.0157 1.036 1.050 Callable3137EAEA3 Federal Home Loan Mortgage Co. 02/13/2017 04/09/2018 5,000,000.00 4,993,166.67 5,003,760.90 0.0157 0.918 0.930 Bullet3133EGUA1 Federal Farm Credit Bank 10/04/2016 04/12/2018 5,000,000.00 4,982,150.00 4,998,950.64 0.0157 0.799 0.811 Bullet3130A7VL6 Federal Home Loan Bank 04/27/2016 04/27/2018 5,000,000.00 4,986,250.00 5,000,000.00 0.0157 1.016 1.030 Quarterly Call3133EGG33 Federal Farm Credit Bank 02/09/2017 05/14/2018 5,000,000.00 4,986,868.06 4,995,288.06 0.0157 0.957 0.970 Bullet3135G0XA6 Federal Nat'l Mtg. Assoc. 05/05/2016 05/21/2018 5,000,000.00 4,972,950.00 5,000,000.00 0.0157 1.016 1.030 Callable3134G9VF1 Federal Home Loan Mortgage Co. 03/07/2017 06/22/2018 5,000,000.00 5,000,741.67 5,011,041.67 0.0157 1.145 1.161 Callable3130A8BD4 Federal Home Loan Bank 02/14/2017 06/29/2018 5,000,000.00 4,986,168.75 4,996,508.75 0.0157 1.006 1.020 Bullet3130A8BD4 Federal Home Loan Bank 03/17/2017 06/29/2018 5,000,000.00 4,990,179.17 4,990,667.05 0.0156 1.164 1.180 Bullet3130A8PZ0 Federal Home Loan Bank 03/22/2017 07/12/2018 5,000,000.00 4,986,566.67 5,008,166.67 0.0157 1.120 1.136 Callable3135G0M42 Federal Nat'l Mtg. Assoc. 11/17/2016 07/13/2018 5,000,000.00 4,981,750.00 5,000,000.00 0.0157 0.987 1.001 Callable3134G9N60 Federal Home Loan Mortgage Co. 03/02/2017 07/27/2018 5,000,000.00 4,994,211.11 4,998,242.93 0.0157 1.185 1.202 Callable3134G9X51 Federal Home Loan Mortgage Co. 07/27/2016 07/27/2018 5,000,000.00 4,984,450.00 5,000,000.00 0.0157 0.986 1.000 Callable3135G0L68 Federal Nat'l Mtg. Assoc. 10/24/2016 07/27/2018 5,000,000.00 4,967,950.00 4,993,583.88 0.0157 0.911 0.923 Callable3130A6AE7 Federal Home Loan Bank 09/09/2016 09/14/2018 5,000,000.00 4,990,350.00 5,016,375.31 0.0157 0.885 0.897 Bullet3130A9M24 Federal Home Loan Bank 10/03/2016 10/03/2018 5,000,000.00 4,979,450.00 5,000,000.00 0.0157 0.927 0.940 Callable3137EAED7 Federal Home Loan Mortgage Co. 09/16/2016 10/12/2018 5,000,000.00 4,972,900.00 4,998,412.00 0.0157 0.884 0.896 Bullet3133EFJP3 Federal Farm Credit Bank 04/08/2016 10/15/2018 5,000,000.00 4,983,850.00 5,000,000.00 0.0157 1.085 1.100 Callable3133EGA70 Federal Farm Credit Bank 11/04/2016 11/01/2018 5,000,000.00 4,971,754.17 5,000,404.17 0.0157 0.957 0.970 1XCall 11/173134GAUT9 Federal Home Loan Mortgage Co. 11/15/2016 11/15/2018 5,000,000.00 4,976,150.00 5,000,000.00 0.0157 0.986 1.000 Callable3133EGJ55 Federal Farm Credit Bank 11/16/2016 11/16/2018 5,000,000.00 4,974,800.00 5,000,000.00 0.0157 0.967 0.980 Callable592240UD5 Tacoma Metropolitan Park Distr 12/01/2016 12/01/2018 500,000.00 516,270.00 516,795.83 0.0016 0.947 0.960 Bullet3133EGHD0 Federal Farm Credit Bank 06/27/2016 06/27/2019 5,000,000.00 4,946,600.00 5,000,000.00 0.0157 1.105 1.120 Callable3136G3TD7 Federal Nat'l Mtg. Assoc. 06/28/2016 06/28/2019 5,000,000.00 4,965,400.00 5,000,000.00 0.0157 1.184 1.200 Callable3133EGJX4 Federal Farm Credit Bank 07/08/2016 07/05/2019 5,000,000.00 4,954,050.00 5,000,000.00 0.0157 1.065 1.080 Callable3133EGAW5 Federal Farm Credit Bank 05/19/2016 08/19/2019 5,000,000.00 4,966,950.00 5,000,000.00 0.0157 1.233 1.250 Callable3135G0Q30 Federal Nat'l Mtg. Assoc. 11/14/2016 09/27/2019 5,000,000.00 4,957,150.00 4,997,188.50 0.0157 1.199 1.215 Callable3136G36G5 Federal Nat'l Mtg. Assoc. 09/27/2016 09/27/2019 5,000,000.00 4,951,150.00 5,000,000.00 0.0157 1.233 1.250 Callable3130A8NR0 Federal Home Loan Bank 07/13/2016 10/11/2019 5,000,000.00 4,942,750.00 5,000,000.00 0.0157 1.141 1.157 Callable3136G4GE7 Federal Nat'l Mtg. Assoc. 11/15/2016 11/15/2019 5,000,000.00 4,927,900.00 4,995,022.22 0.0157 1.163 1.179 1XCall 11/173130AA2X5 Federal Home Loan Bank 11/22/2016 11/22/2019 5,000,000.00 4,974,700.00 5,000,000.00 0.0157 1.341 1.360 Callable3133EGSA4 Federal Farm Credit Bank 08/24/2016 08/24/2020 5,000,000.00 4,909,750.00 5,000,000.00 0.0157 1.302 1.320 Callable3133EGQS7 Federal Farm Credit Bank 08/10/2016 11/10/2020 5,000,000.00 4,860,500.00 5,000,000.00 0.0157 1.381 1.400 Callable
0.98 Years 318,907,447.19$
First Quarter 2017 Financial Report City of Vancouver 39
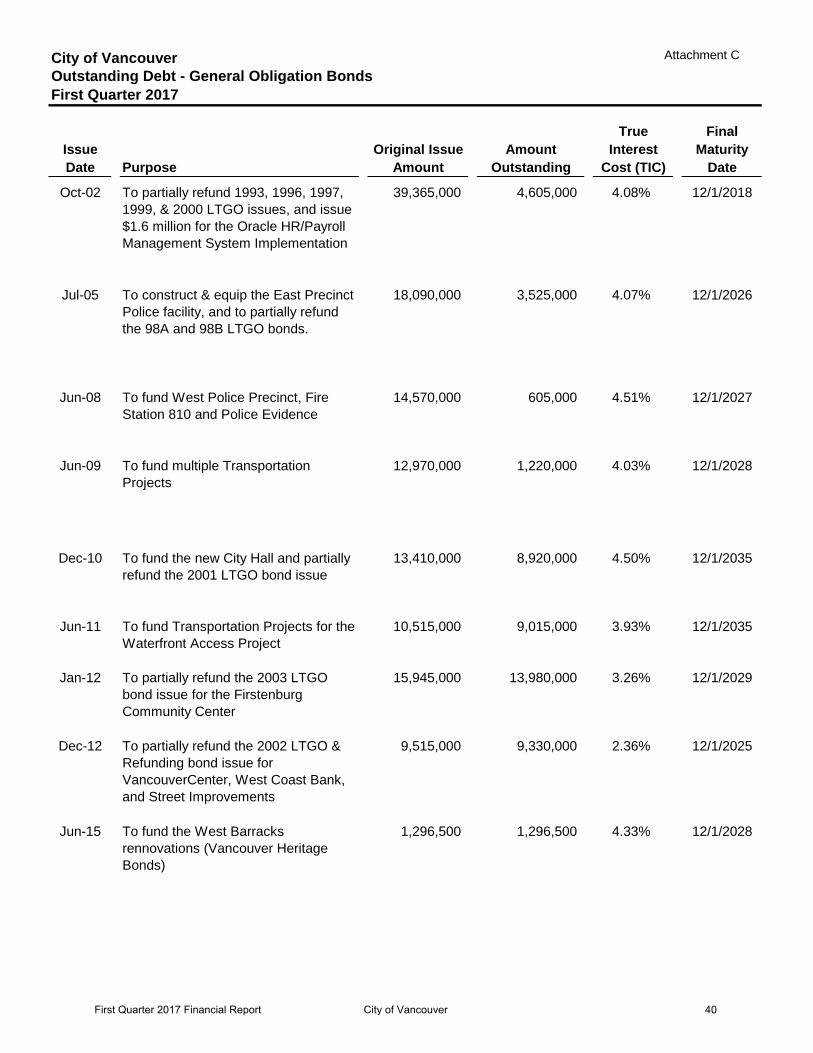
Attachment CCity of VancouverOutstanding Debt - General Obligation BondsFirst Quarter 2017
True FinalIssue Original Issue Amount Interest MaturityDate Purpose Amount Outstanding Cost (TIC) Date
Oct-02 To partially refund 1993, 1996, 1997, 1999, & 2000 LTGO issues, and issue $1.6 million for the Oracle HR/Payroll Management System Implementation
39,365,000 4,605,000 4.08% 12/1/2018
Jul-05 To construct & equip the East Precinct Police facility, and to partially refund the 98A and 98B LTGO bonds.
18,090,000 3,525,000 4.07% 12/1/2026
Jun-08 To fund West Police Precinct, Fire Station 810 and Police Evidence
14,570,000 605,000 4.51% 12/1/2027
Jun-09 To fund multiple Transportation Projects
12,970,000 1,220,000 4.03% 12/1/2028
Dec-10 To fund the new City Hall and partially refund the 2001 LTGO bond issue
13,410,000 8,920,000 4.50% 12/1/2035
Jun-11 To fund Transportation Projects for the Waterfront Access Project
10,515,000 9,015,000 3.93% 12/1/2035
Jan-12 To partially refund the 2003 LTGO bond issue for the Firstenburg Community Center
15,945,000 13,980,000 3.26% 12/1/2029
Dec-12 To partially refund the 2002 LTGO & Refunding bond issue for VancouverCenter, West Coast Bank, and Street Improvements
9,515,000 9,330,000 2.36% 12/1/2025
Jun-15 To fund the West Barracks rennovations (Vancouver Heritage Bonds)
1,296,500 1,296,500 4.33% 12/1/2028
First Quarter 2017 Financial Report City of Vancouver 40
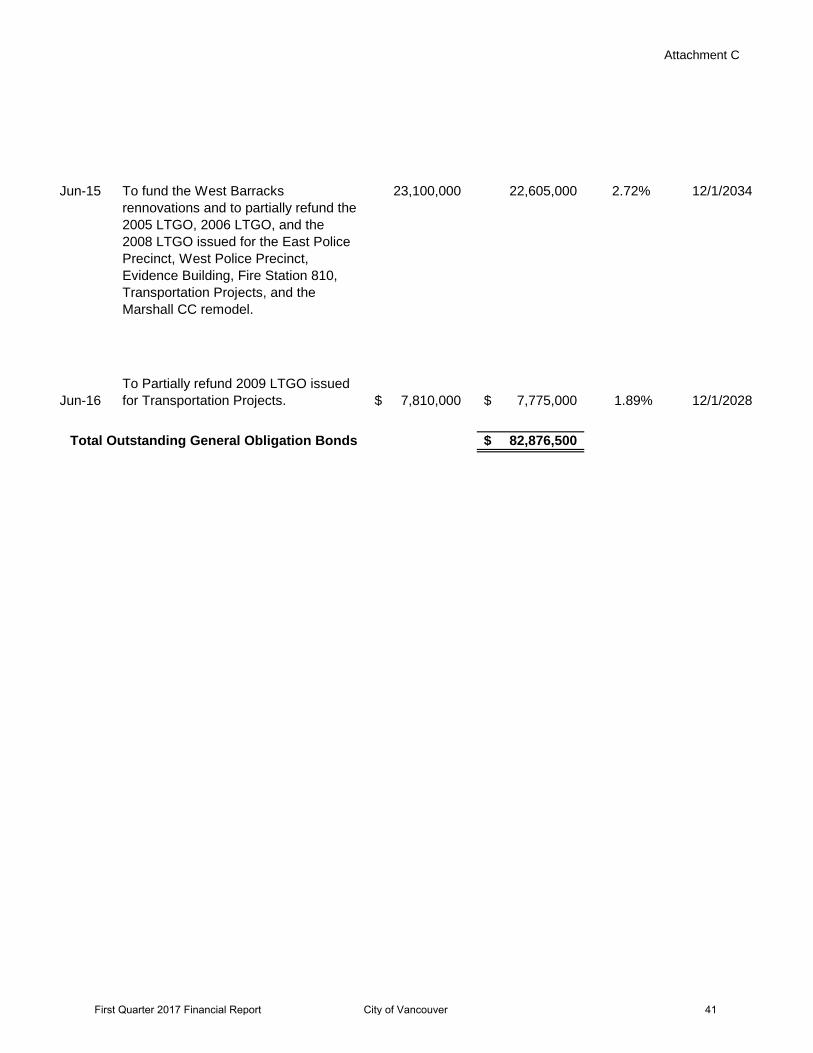
Attachment C
Jun-15 To fund the West Barracks rennovations and to partially refund the 2005 LTGO, 2006 LTGO, and the 2008 LTGO issued for the East Police Precinct, West Police Precinct, Evidence Building, Fire Station 810, Transportation Projects, and the Marshall CC remodel.
23,100,000 22,605,000 2.72% 12/1/2034
Jun-16To Partially refund 2009 LTGO issued for Transportation Projects. 7,810,000$ 7,775,000$ 1.89% 12/1/2028
Total Outstanding General Obligation Bonds 82,876,500$
First Quarter 2017 Financial Report City of Vancouver 41
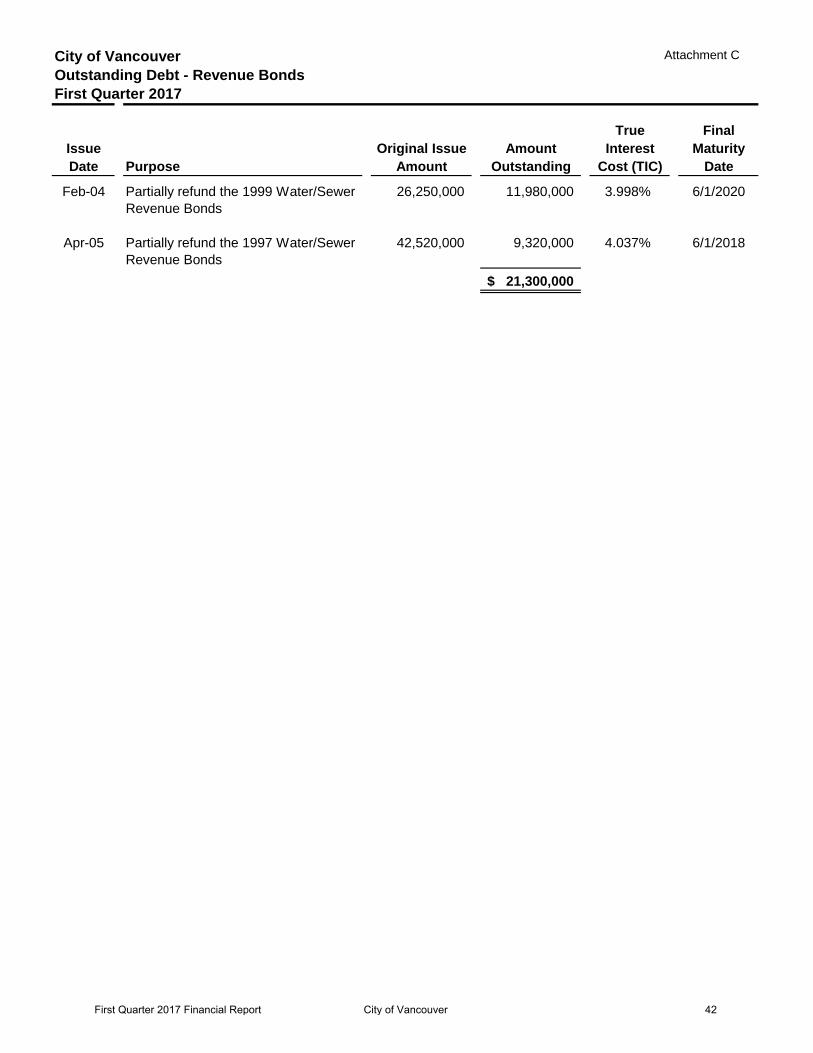
Attachment CCity of VancouverOutstanding Debt - Revenue BondsFirst Quarter 2017
True FinalIssue Original Issue Amount Interest MaturityDate Purpose Amount Outstanding Cost (TIC) Date
Feb-04 Partially refund the 1999 Water/Sewer Revenue Bonds
26,250,000 11,980,000 3.998% 6/1/2020
Apr-05 Partially refund the 1997 Water/Sewer Revenue Bonds
42,520,000 9,320,000 4.037% 6/1/2018
21,300,000$
First Quarter 2017 Financial Report City of Vancouver 42