rrtm in ncep gfs and cfs - ceres.larc.nasa.gov in ncep gfs and cfs shi-keng yang, yu-tai hou, peitao...
TRANSCRIPT
RRTM in NCEP GFS and CFS
Shi-Keng Yang, Yu-Tai Hou, Peitao Peng and Craig LongCERES Science Team MeetingNewport News, VA 4/24-26/07
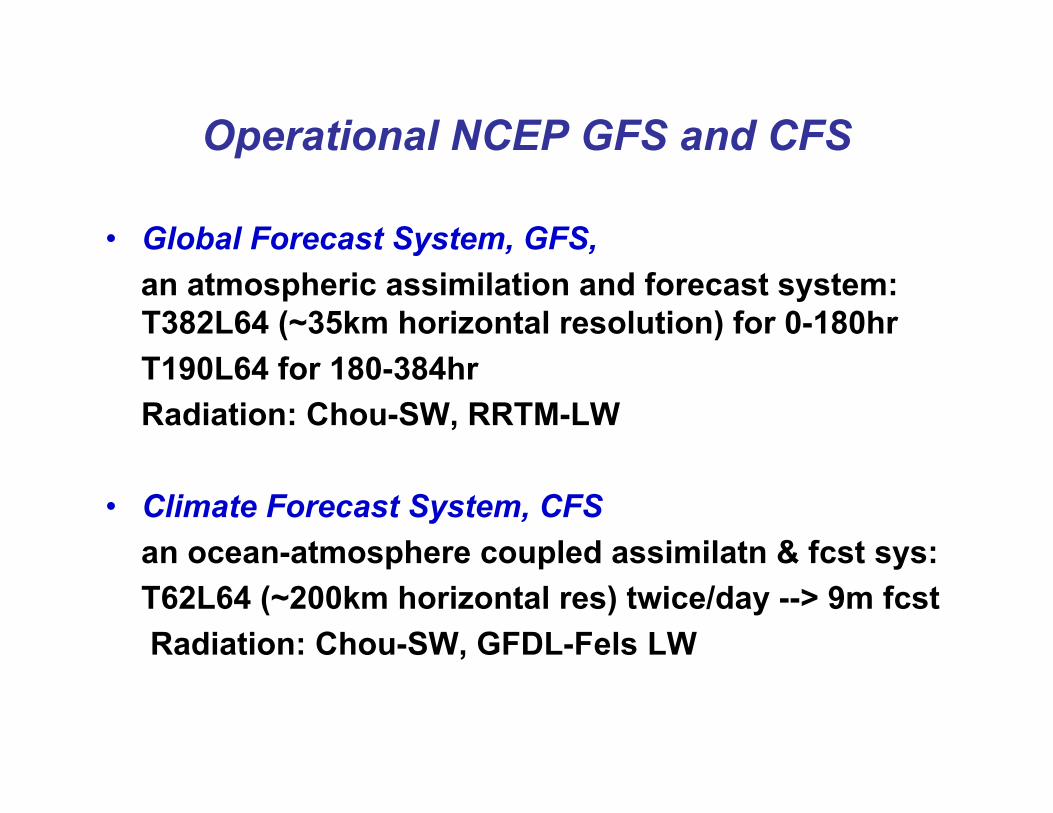
Operational NCEP GFS and CFS
• Global Forecast System, GFS, an atmospheric assimilation and forecast system:
T382L64 (~35km horizontal resolution) for 0-180hrT190L64 for 180-384hrRadiation: Chou-SW, RRTM-LW
• Climate Forecast System, CFSan ocean-atmosphere coupled assimilatn & fcst sys:T62L64 (~200km horizontal res) twice/day --> 9m fcst Radiation: Chou-SW, GFDL-Fels LW

Toward new CFS implementation2010
• Two main components:• CFS Reanalysis (1979-2007)• CFS Retrospective Forecasts (1981-
2007)
Saha and Pan, 2006

Components
1. Analysis Systems : GSI, GODAS, GLDAS
2. Atmospheric Model : GFS
3. Ocean Model : MOM4
Saha and Pan, 2006
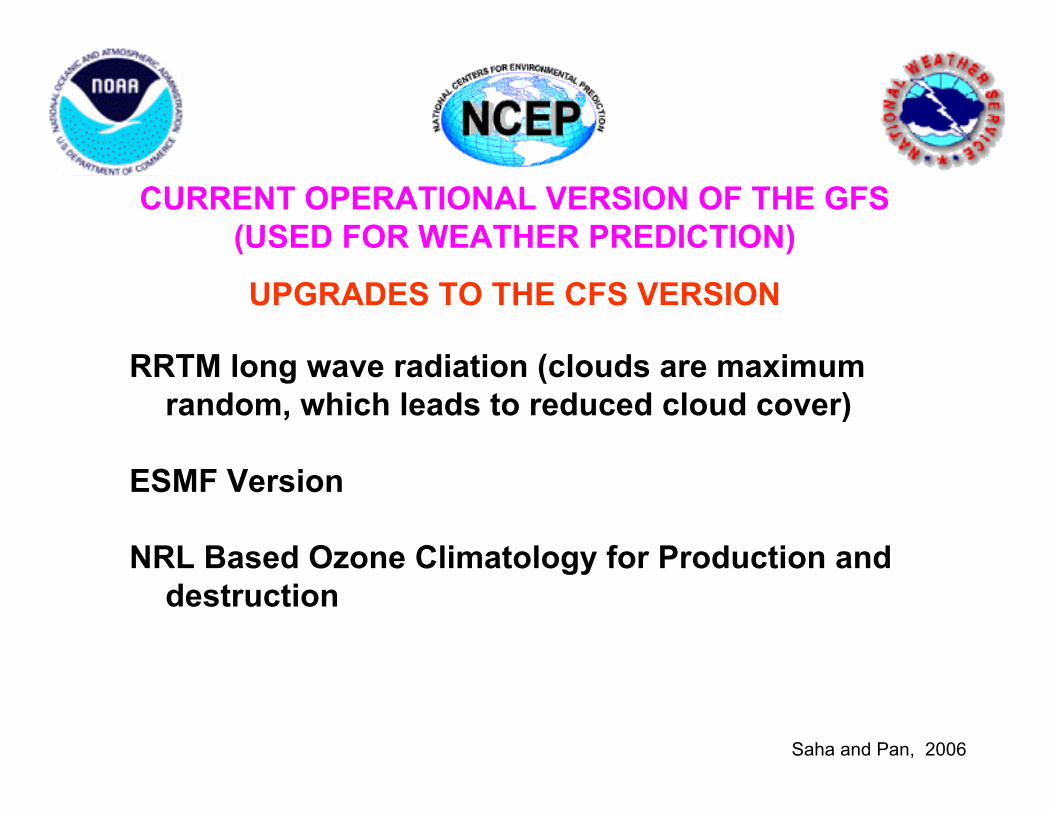
RRTM long wave radiation (clouds are maximumrandom, which leads to reduced cloud cover)
ESMF Version
NRL Based Ozone Climatology for Production anddestruction
CURRENT OPERATIONAL VERSION OF THE GFS(USED FOR WEATHER PREDICTION)
UPGRADES TO THE CFS VERSION
Saha and Pan, 2006
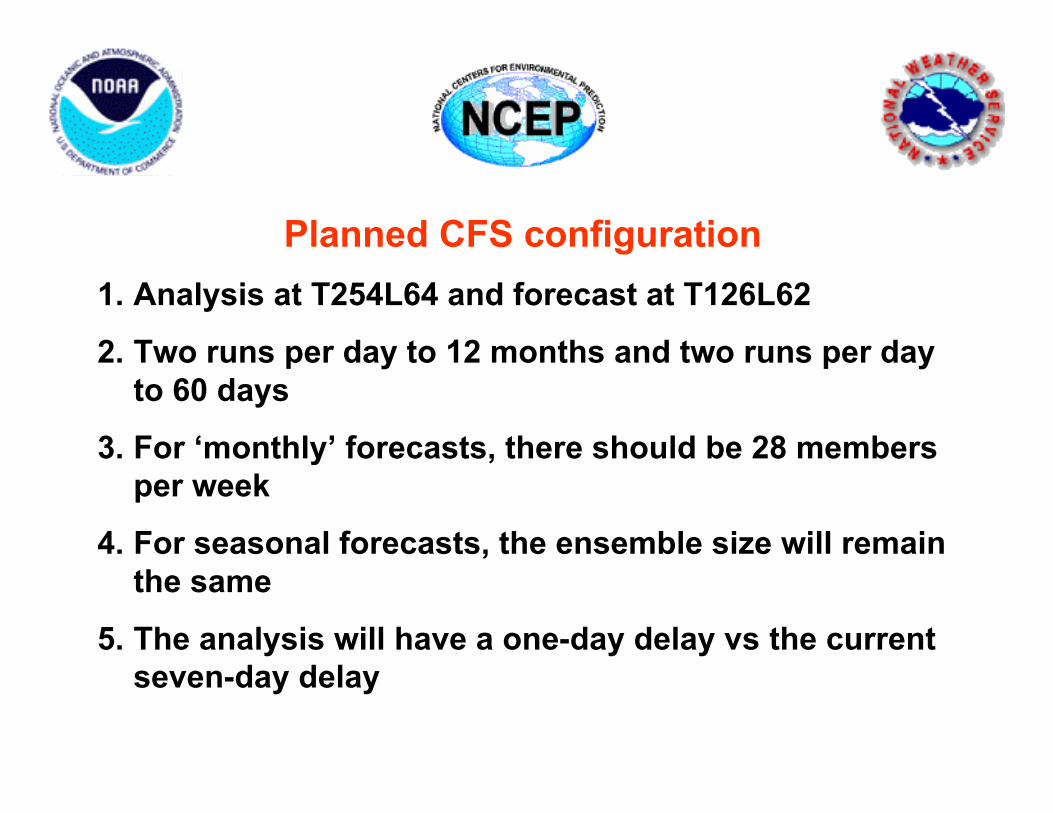
Planned CFS configuration1. Analysis at T254L64 and forecast at T126L62
2. Two runs per day to 12 months and two runs per dayto 60 days
3. For ‘monthly’ forecasts, there should be 28 membersper week
4. For seasonal forecasts, the ensemble size will remainthe same
5. The analysis will have a one-day delay vs the currentseven-day delay

RRTM & GFDL LW Computation EfficiencyTime used for 300-Column Computation, in sec.
.8801.538L64
.602.718L42
.412.369L28
RRTMGFDLNumber ofLayer
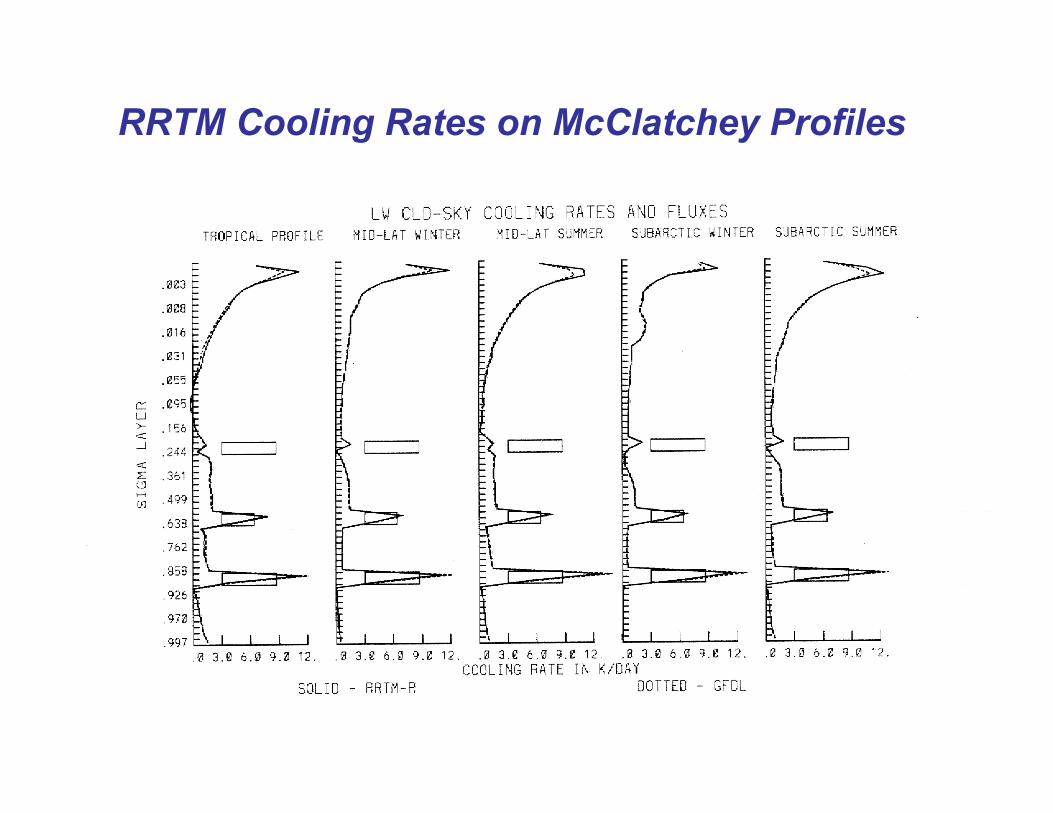
RRTM Cooling Rates on McClatchey Profiles
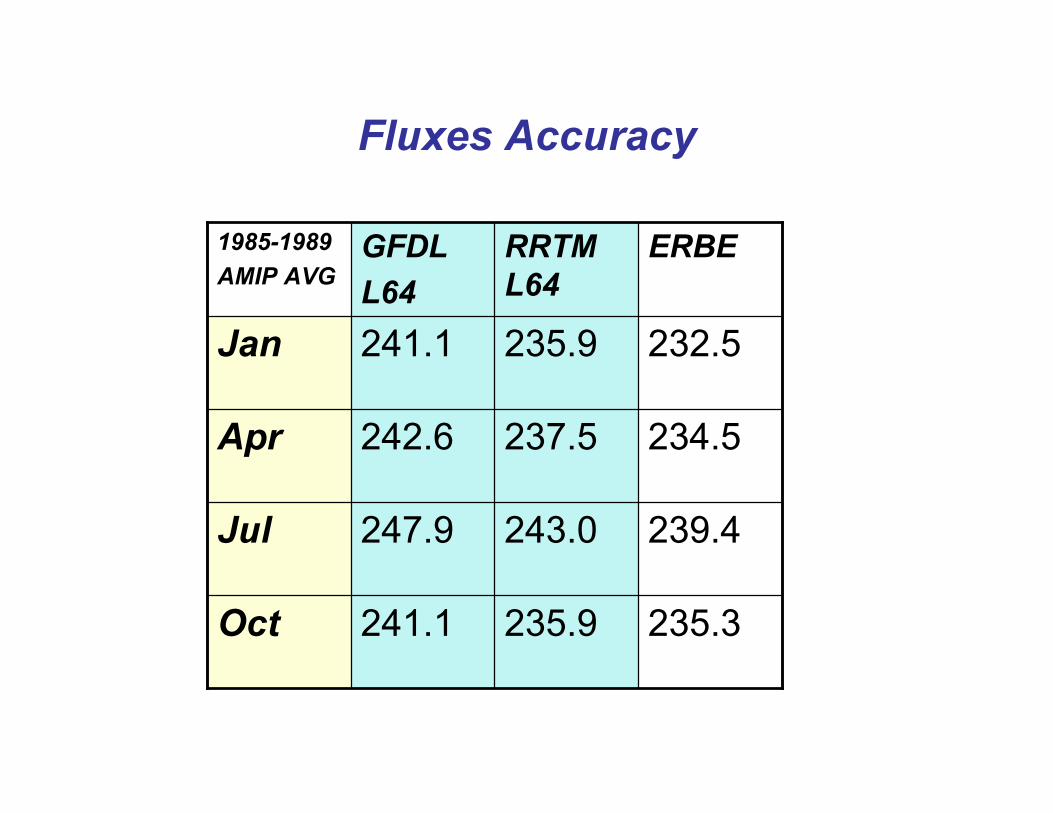
Fluxes Accuracy
235.3235.9241.1Oct
239.4243.0247.9Jul
234.5237.5242.6Apr
232.5235.9241.1Jan
ERBERRTML64
GFDLL64
1985-1989AMIP AVG
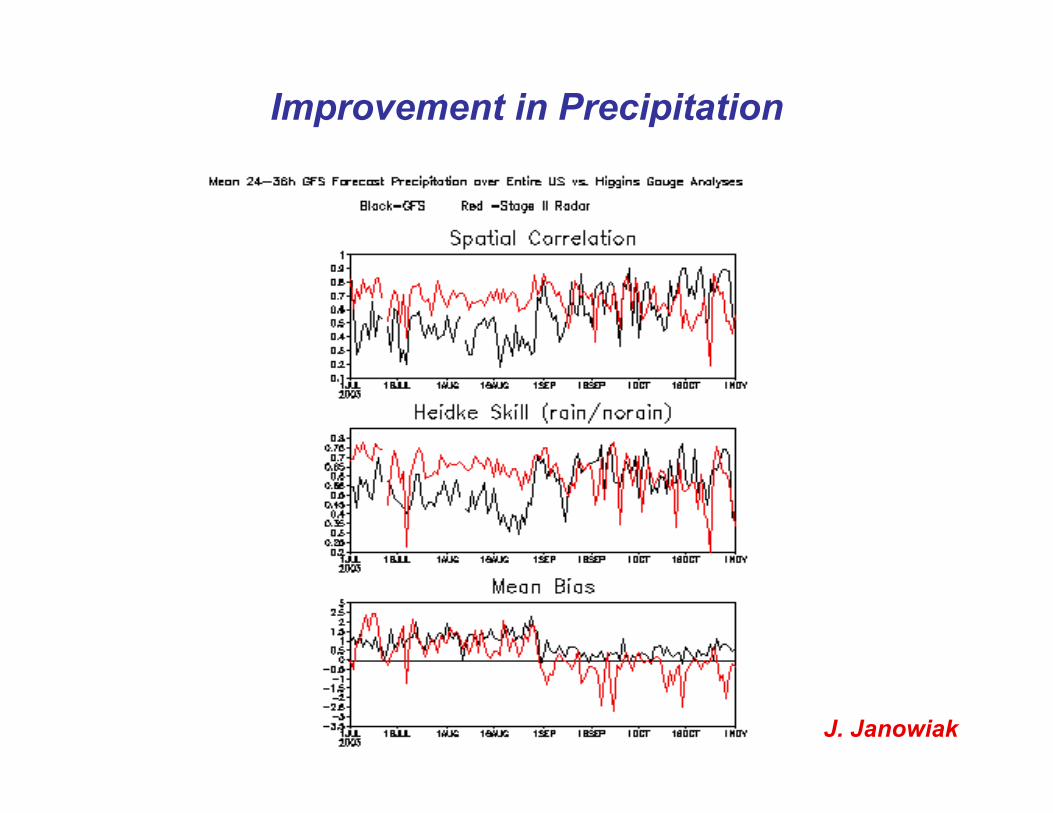
Improvement in Precipitation
J. Janowiak

Impacts of RRTM on GFS
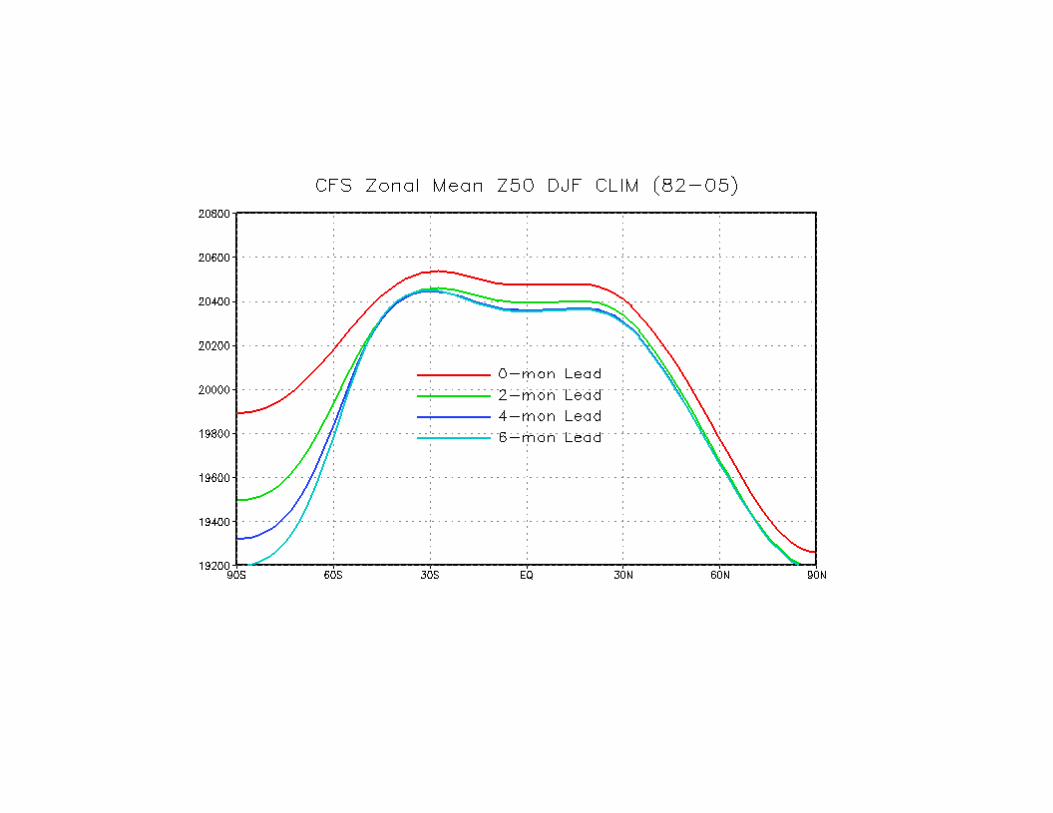
– Alleviate cold bias in the lower troposphere– Reduces TOA OLR bias– Improvement in GFS Precipitation– Colder stratosphere– Some satellite retrieval issues created
CFS Experiments
• T62 w/ RRTM LW – Climate Mode• T382 w/ RRTM LW – Hurricane Mode

CFS Experiments
• T62 w/ RRTM LW – Climate Mode• T382 w/ RRTM LW – Hurricane Mode
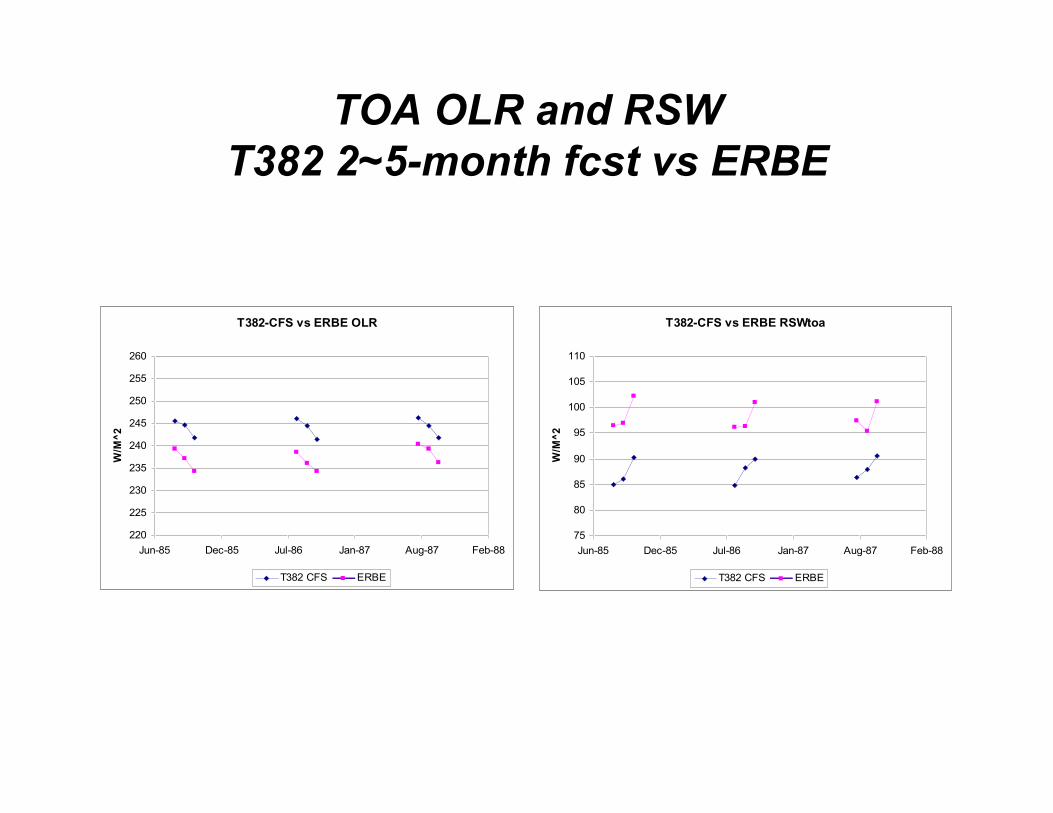
TOA OLR and RSWT382 2~5-month fcst vs ERBE
T382-CFS vs ERBE OLR
220
225
230
235
240
245
250
255
260
Jun-85 Dec-85 Jul-86 Jan-87 Aug-87 Feb-88
W/M
^2
T382 CFS ERBE
T382-CFS vs ERBE RSWtoa
75
80
85
90
95
100
105
110
Jun-85 Dec-85 Jul-86 Jan-87 Aug-87 Feb-88W
/M^
2
T382 CFS ERBE

T382-CFS vs LaRC SWDsfc
170
175
180
185
190
195
200
205
210
215
Jun-85 Dec-85 Jul-86 Jan-87 Aug-87 Feb-88W
/M^
2
T382 CFS LaRC-sfc
T382-CFS vs LaRC LWDsfc
310
320
330
340
350
360
370
Jun-85 Dec-85 Jul-86 Jan-87 Aug-87 Feb-88
W/M
^2
T382 CFS LaRC-sfc
Surface DLR and DSWT382 2~5-month fcst vs ERBE
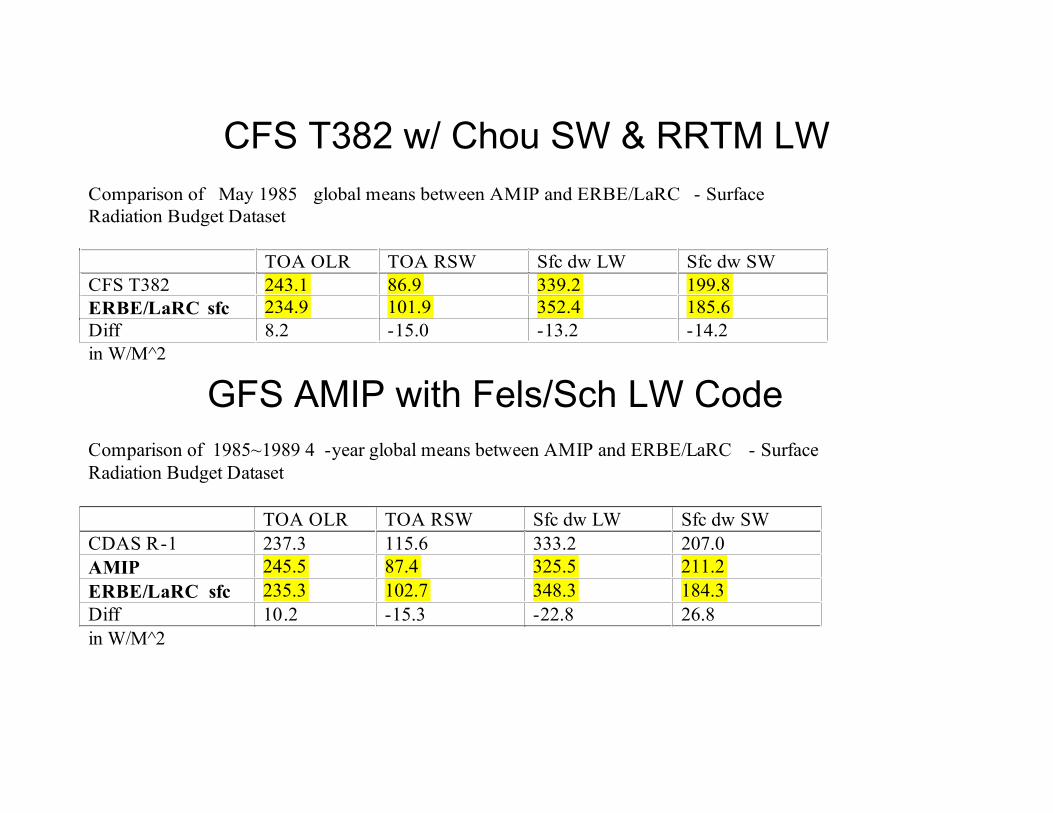
CFS T382 w/ Chou SW & RRTM LWComparison of May 1985 global means between AMIP and ERBE/LaRC - Surface
Radiation Budget Dataset
TOA OLR TOA RSW Sfc dw LW Sfc dw SW
CFS T382 243.1 86.9 339.2 199.8
ERBE/LaRC sfc 234.9 101.9 352.4 185.6
Diff 8.2 -15.0 -13.2 -14.2
in W/M^2
Comparison of 1985~1989 4 -year global means between AMIP and ERBE/LaRC - Surface
Radiation Budget Dataset
TOA OLR TOA RSW Sfc dw LW Sfc dw SW
CDAS R-1 237.3 115.6 333.2 207.0
AMIP 245.5 87.4 325.5 211.2
ERBE/LaRC sfc 235.3 102.7 348.3 184.3
Diff 10.2 -15.3 -22.8 26.8
in W/M^2
GFS AMIP with Fels/Sch LW Code

Toward CFS Reanalysis-Status
• At TOA: Darker and Warmer• At SFC: Brighter and Colder• Better Stratosphere in analysis, not forecast• T2M improved compared to the operationl• 5-member Ensemble T62 is as accurate