rtls trajectory options for a reusable booster without … without a secondary propulsion ... afrl...
TRANSCRIPT
American Institute of Aeronautics and Astronautics
1
Return to Launch Site Trajectory Options for a Reusable Booster without a Secondary Propulsion System
Dr. John Bradfordi
SpaceWorks Engineering, Inc., Atlanta, GA 30338
and
Barry Hellmanii AFRL Air Vehicles Directorate, WPAFB, OH 45433
This paper reports the findings of a continuing study to examine the capabilities, flight dynamics, and operability of a new launch system predicated on a Reusable Booster System. This effort is part of the ongoing U.S. Air Force Future-responsive Access to Space Technologies (FAST) program. The authors considered a multi-stage launch vehicle with a reusable wing-body first stage and two expendable upper stages. The baseline propellants were selected to be LOX/RP-2 for all stages. A complete, Level 1 multidisciplinary conceptual systems assessment was performed on a baseline launch vehicle design and numerous trade study configurations to determine the impact to key performance metrics such as size, empty mass, and gross mass. The trade study variables of interest were the staging flight path angle, staging dynamic pressure, staging Mach number, and post-staging RTLS pitch over direction. Findings indicate that while minimal impact was seen for the top-level vehicle metrics like size, gross weight, and dry weight, there were more significant impacts to the vehicle’s actual flight environment in terms of normal force loads, peak heat rate, and total heat load. Numerical results for all vehicle results from this effort are reported.
Nomenclature AFRL Air Force Research Lab AFSPC Air Force Space Command AFWAT Air Force Weight Assessment Tool BMI bismaleimide composite resin DPM development, procurement, and maintenance FAST Future-responsive Access to Space Technologies Gr graphite composite matrix HIVE hydrocarbon vision engine IVSHM Integrated Vehicle System Health Monitoring LEO low earth orbit LOX liquid oxygen q dynamic pressure (psf) RBS reusable booster system RLV reusable launch vehicle RP-2 rocket propellant type 2 RTLS return to launch site SMC Space and Missiles Center SPO System Program Office T/W thrust-to-weight
i President, SpaceWorks Engineering, Atlanta, GA, AIAA Senior Member ii Aerospace Engineer, AFRL/RBAA, 2130 Eighth St., AIAA Member
AIAA SPACE 2009 Conference & Exposition14 - 17 September 2009, Pasadena, California
AIAA 2009-6439
This material is declared a work of the U.S. Government and is not subject to copyright protection in the United States.

American Institute of Aeronautics and Astronautics
2
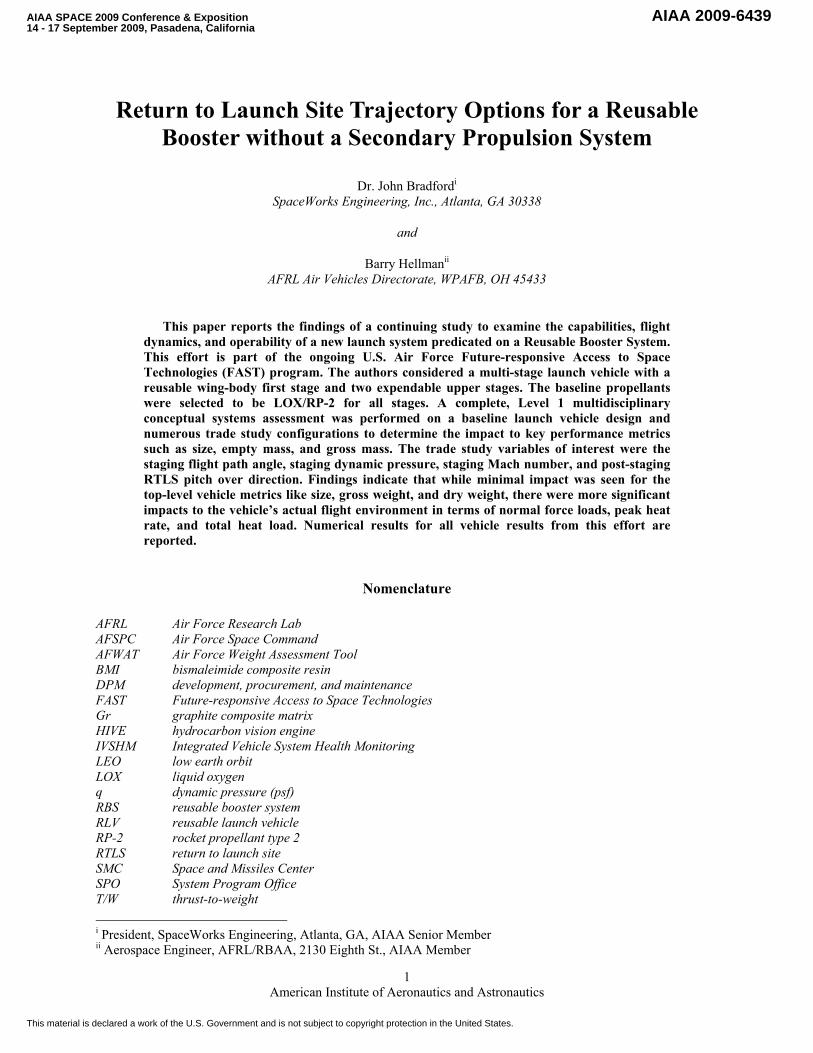
I. Introduction HE Air Force is pursuing a Reusable Booster System (RBS) to meet future responsive launch needs1. These needs include “within days” reconstitution, flexibility, adaptability, and assuredness. Future payload launch
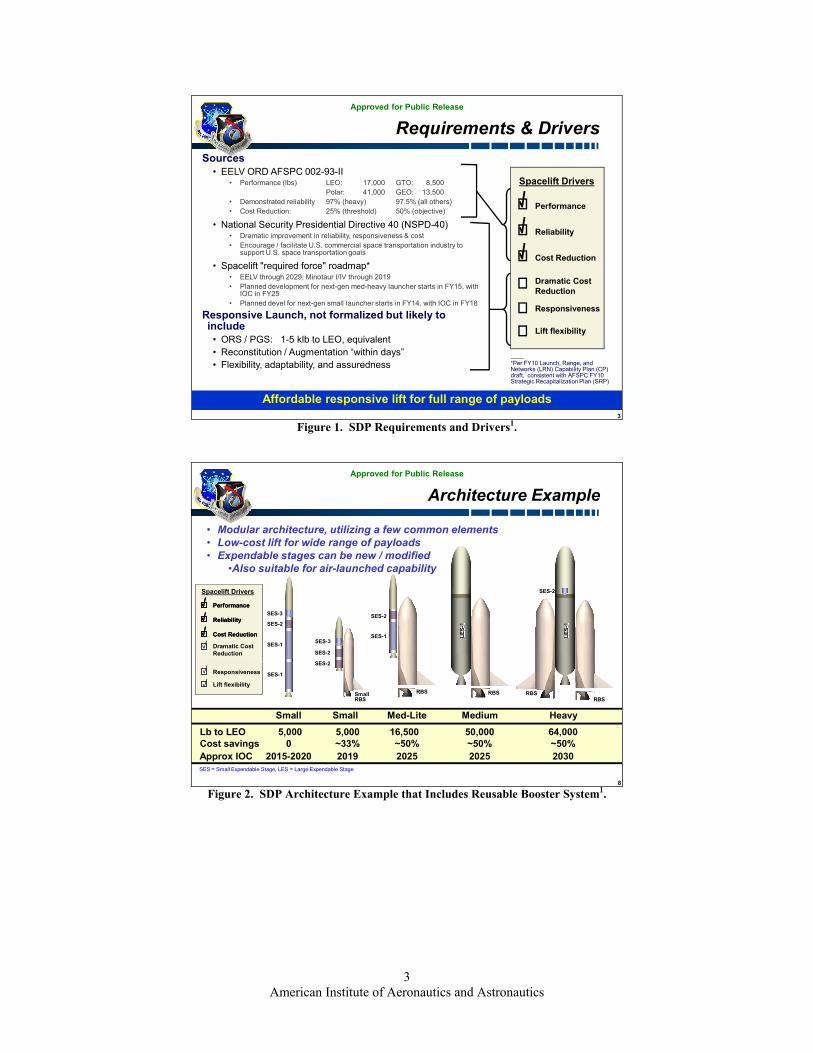
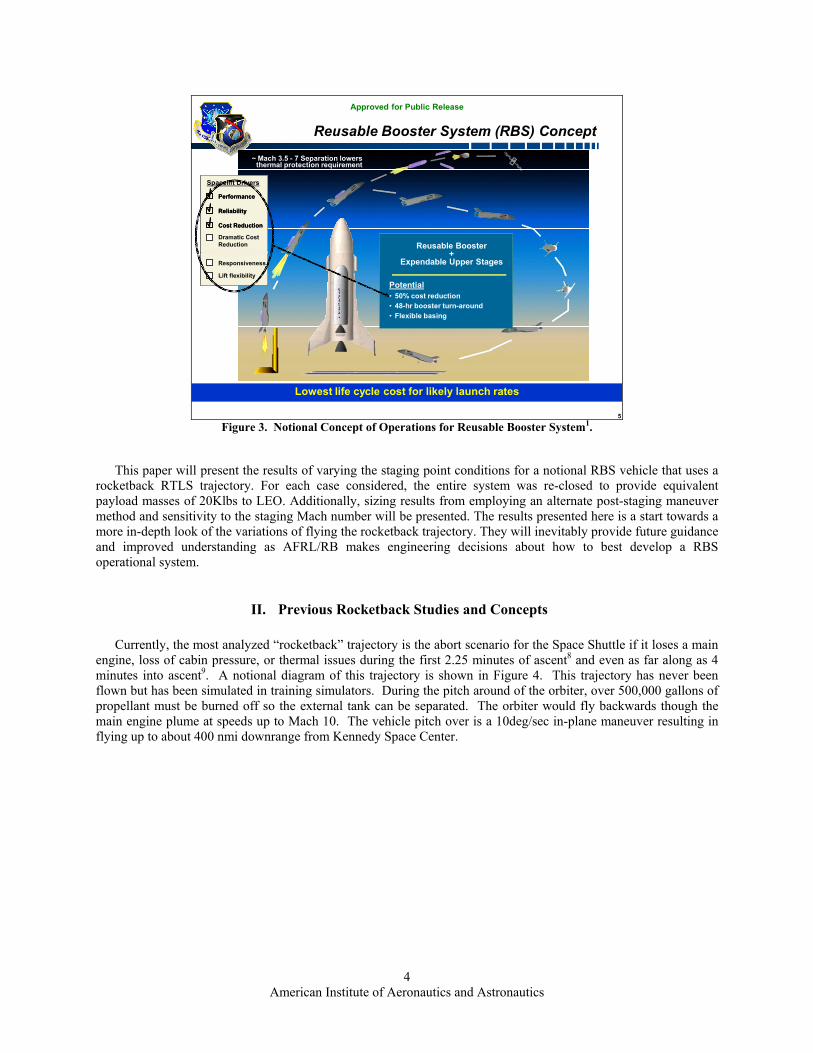
needs include 1 klbm up to 50 klbm, shown in Figure 1. A reusable booster is expected to provide at least a 50% cost reduction, 48 hour turnaround, and flexible basing. Different potential architectures for a reusable booster are shown in Figure 2. A reusable booster that is launched vertically and lands horizontally at the launch site is the current approach being pursued for these launch architectures. This type of booster is expected to be the most likely alternative studied that will provide responsive launch operations. A notional concept of operations is shown in Figure 3. A staging, the booster is traveling supersonically, significantly downrange, and flying away from its launch site. From the staging point, the booster can return to the launch site by either gliding, using its rocket engines to reverse its velocity, or carrying a secondary propulsion system (most likely a set of turbine engines) to provide the necessary energy for return. Previous analysis has shown that in order to glide back to the launch site with delta wings will limit the staging Mach number to about 32 assuming the vehicle is designed for a maximum subsonic L/D ratio of about 5. This approach requires an extremely large upper stage, increasing recurring costs. Staging from about Mach 5-7 provides a more optimal launch architecture but requires the booster to carry an additional energy source for returning to the launch site. The current baseline approach for the Air Force future plans is to carry extra propellant and use the main rocket engines on-board the booster to reverse its horizontal velocity and glide to a horizontal landing back at the launch site3. This return to launch site (RTLS) concept is referred to as rocketback. By executing a rocketback RTLS trajectory compared to using a turbine engine (referred to as jetback), the vehicle becomes simpler by flying in a more benign heating environment and eliminates a major secondary subsystem (i.e. the turbine engines)4,5. These two main advantages of a rocketback booster is to provide a simpler booster that can meet the turn-around requirement of 48 hours. In order to help Air Force Space Command (AFSPC) and its product center the Space and Missiles Center (SMC) decide how to proceed with future launch vehicle developments, the Air Vehicle Directorate of Air Force Research Laboratory (AFRL/RB) is pursuing a reusable booster technology demonstrator3. One of the critical technologies to be demonstrated is the rocketback trajectory from a simulated staging point that is representative of a likely operational staging point. These future demonstrations will bring the rocketback trajectory up to a technology readiness level of 6, demonstration in a relevant environment6. The TRL 6 definition is very similar to the technology requirements under Federal Acquisition Regulations to proceed to a Milestone B decision (i.e. an operational development program can begin)7. Understanding the aeromechanics, control system requirements, and designing a rocketback flight profile that will allow booster to remain a highly operable system are critical results needed to help a future Air Force System Program Office (SPO) make engineering decisions about how to best develop a RBS operational system.
T
American Institute of Aeronautics and Astronautics
3
Approved for Public Release
3
Requirements & Drivers
Performance
Reliability
Cost Reduction
Dramatic Cost Reduction
Spacelift Drivers
Lift flexibility
Responsiveness
Affordable responsive lift for full range of payloads
Sources• EELV ORD AFSPC 002-93-II
• Performance (lbs) LEO: 17,000 GTO: 8,500Polar: 41,000 GEO: 13,500
• Demonstrated reliability 97% (heavy) 97.5% (all others)• Cost Reduction: 25% (threshold) 50% (objective)
• National Security Presidential Directive 40 (NSPD-40)• Dramatic improvement in reliability, responsiveness & cost• Encourage / facilitate U.S. commercial space transportation industry to
support U.S. space transportation goals
• Spacelift "required force" roadmap*• EELV through 2029; Minotaur I/IV through 2019• Planned development for next-gen med-heavy launcher starts in FY15, with
IOC in FY25• Planned devel for next-gen small launcher starts in FY14, with IOC in FY18
Responsive Launch, not formalized but likely to include
• ORS / PGS: 1-5 klb to LEO, equivalent• Reconstitution / Augmentation “within days”• Flexibility, adaptability, and assuredness
____*Per FY10 Launch, Range, and Networks (LRN) Capability Plan (CP) draft, consistent with AFSPC FY10 Strategic Recapitalization Plan (SRP)
Figure 1. SDP Requirements and Drivers1.
Approved for Public Release
8
LE
S-1
Architecture Example
Small Small Med-Lite Medium Heavy
Lb to LEO 5,000 5,000 16,500 50,000 64,000Cost savings 0 ~33% ~50% ~50% ~50%Approx IOC 2015-2020 2019 2025 2025 2030
SES-2
SES-3
SES-2
SmallRBS
SES-1
SES-2
RBS RBS RBSRBS
SES-2
LE
S-1
SES-1
SES-1
SES-2
SES-3
• Modular architecture, utilizing a few common elements• Low-cost lift for wide range of payloads• Expendable stages can be new / modified
•Also suitable for air-launched capability
SES = Small Expendable Stage, LES = Large Expendable Stage
Performance
Reliability
Cost Reduction
Dramatic Cost Reduction
Spacelift Drivers
Lift flexibility
Responsiveness
PerformancePerformance
ReliabilityReliability
Cost Reduction Cost Reduction
Dramatic Cost Reduction
Spacelift Drivers
Lift flexibility
Responsiveness
Figure 2. SDP Architecture Example that Includes Reusable Booster System1.
American Institute of Aeronautics and Astronautics
4
Approved for Public Release
5
Reusable Booster System (RBS) Concept
Reusable Booster +
Expendable Upper Stages
Potential• 50% cost reduction • 48-hr booster turn-around• Flexible basing
~ Mach 3.5 - 7 Separation lowers thermal protection requirement
Lowest life cycle cost for likely launch rates
Performance
Reliability
Cost Reduction
Dramatic Cost Reduction
Spacelift Drivers
Lift flexibility
Responsiveness
PerformancePerformance
ReliabilityReliability
Cost Reduction Cost Reduction
Dramatic Cost Reduction
Spacelift Drivers
Lift flexibility
Responsiveness
Figure 3. Notional Concept of Operations for Reusable Booster System1.
This paper will present the results of varying the staging point conditions for a notional RBS vehicle that uses a rocketback RTLS trajectory. For each case considered, the entire system was re-closed to provide equivalent payload masses of 20Klbs to LEO. Additionally, sizing results from employing an alternate post-staging maneuver method and sensitivity to the staging Mach number will be presented. The results presented here is a start towards a more in-depth look of the variations of flying the rocketback trajectory. They will inevitably provide future guidance and improved understanding as AFRL/RB makes engineering decisions about how to best develop a RBS operational system.
II. Previous Rocketback Studies and Concepts Currently, the most analyzed “rocketback” trajectory is the abort scenario for the Space Shuttle if it loses a main
engine, loss of cabin pressure, or thermal issues during the first 2.25 minutes of ascent8 and even as far along as 4 minutes into ascent9. A notional diagram of this trajectory is shown in Figure 4. This trajectory has never been flown but has been simulated in training simulators. During the pitch around of the orbiter, over 500,000 gallons of propellant must be burned off so the external tank can be separated. The orbiter would fly backwards though the main engine plume at speeds up to Mach 10. The vehicle pitch over is a 10deg/sec in-plane maneuver resulting in flying up to about 400 nmi downrange from Kennedy Space Center.

American Institute of Aeronautics and Astronautics
5
Figure 4. Notional Diagram of Shuttle RTLS Abort9.
Another effort looking at rocketback was the design of a “tossback “booster at McDonnel Douglas where the
vehicle was pitched around10. The engines were then relit and the vehicle was thrown ballistically back to the launch site via is main propulsion system. A diagram of this trajectory is shown in Figure 5. This concept showed promise for a fully reusable two-stage-to-orbit (TSTO) launch vehicle to have good payload fractions compared to the Shuttle and other single-stage-to-orbit concepts being pursued at the time.
Figure 5. Trajectory of RTLS Maneuver for Tossback Booster10.
Kistler Aerospace was pursuing the K-1 fully reusable launch vehicle where the booster flew a rocketback
trajectory from a staging point of about Mach 4. This vehicle had to produce enough return energy to fly ballistically back for a horizontal landing on airbags. Figure 6 shows a notional diagram of the Kistler K-1 launch profile.

American Institute of Aeronautics and Astronautics
6
Figure 6. Notional Launch Diagram of the Kistler K-1 Fully Reusable Launch Vehicle2.
Previous reusable booster studies have shown that a rocketback trajectory can have significant advantages over a
jetback trajectory4,5. The upper stages for these studies were assumed to be expendable. These advantages include overall lower dry weight, DPM cost (estimated mostly as a function of system dry weight), lower heating, and lower downrange distances. Dry weight and cost comparisons versus staging Mach number are shown in Figure 7. These charts show, that a reusable booster designed for rocketback has a lower dry weight and cost for staging Mach numbers between 5 and 6.5.
From these trades, the trajectories from the staging Mach numbers resulting in the lowest cost (~6.5 for
rocketback and ~7.5 for jetback) are compared in Figure 8. The rocketback trajectory is shorter and flies a much shorter downrange flight path. It does however fly at significantly higher angles of attack. The maximum aeroheating temperature on the vehicle’s surface, shown in Figure 9, is also reduced for a rocketback trajectory since it “re-enters” at about half the speed of the staging point. The altitude vs. velocity comparison shows how the rocketback trajectory better avoids the higher heating flight conditions from that of a jetback re-entry.
Figure 7. Dry Weight and Cost vs. Staging Mach Number Comparison for Rocketback and Jetback ("Flyback")
Reusable Booster.
0
20,000
40,000
60,000
80,000
100,000
120,000
140,000
160,000
180,000
200,000
3 4 5 6 7 8 9
Staging Mach Number
Dry
Wei
gh
t (l
bm
)
Flyback Total SystemBoostback Total SystemFlyback BoosterBoostback BoosterUpper Stage
19.3%
Minimum DPM Cost Points
0
5
10
15
20
25
30
35
40
45
50
3 4 5 6 7 8 9
Staging Mach Number
Lif
etim
e D
PM
Co
st (
$B
FY
06)
Flyback $40M USBoostback $40M USFlyback $10M USBoostback $10M US
4.1
$40M Upper StageMinimum DPM Cost Points
$10M Upper StageMinimum DPM Cost Points

American Institute of Aeronautics and Astronautics
7
Figure 8. Trajectories of a Reusable Booster Comparing Rocketback and Jetback ("Flyback").
Figure 9. Maximum Re-Entry Adiabatic Aeroheating Surface Temperatures.
0
50,000
100,000
150,000
200,000
250,000
300,000
0 200 400 600 800 1000
Time (sec)
Alt
itu
de
(ft)
Boostback
Flyback
0
1,000
2,000
3,000
4,000
5,000
6,000
7,000
8,000
9,000
0 200 400 600 800 1000
Time (sec)
Ea
rth
Rel
ati
ve
Ve
loci
ty (
ft/s
ec)
BoostbackFlyback
0
2
4
6
8
10
12
14
16
18
20
0 200 400 600 800 1000
Time (sec)
Hea
t R
ate
Eq
uat
ion
fro
m P
OS
T
(BT
U /
ft2 *
se
c)
Boostback
Flyback
-20
0
20
40
60
80
100
120
140
160
180
0 200 400 600 800 1000
Time (sec)
An
gle
of
Att
ack
(deg
)
BoostbackFlyback
0
50,000
100,000
150,000
200,000
250,000
300,000
0 1,000 2,000 3,000 4,000 5,000 6,000 7,000 8,000 9,000
Earth Relative Velocity Magnitude (ft/sec)
Alt
itu
de
(ft)
Boostback
Flyback
100 psf
200 psf
400 psf
800 psf
100 kJ/lbm
200 kJ/lbm
300 kJ/lbm
400 kJ/lbm 1,000 kJ/lbm 1,400 kJ/lbm600 kJ/lbm2 BTU/ft2*sec
3 BTU/ft2*sec
4 BTU/ft2*sec
8 BTU/ft2*sec
12 BTU/ft2*sec
6 BTU/ft2*sec
0
50,000
100,000
150,000
200,000
250,000
300,000
350,000
400,000
0 10 20 30 40 50 60 70 80 90
Downrange (nmi)
Alt
itu
de
(ft)
Staging Point (151 sec)Mach: 6.43
Flight Path Angle: 18.2ºRelative Velocity: 6,962 ft/sec
Dynamic Pressure: 49 psf
Heat Rate: 8.1 BTU / ft2 * sec Overall Thrust: 0.25
Rotation Complete (164 sec)Mach: 6.64
Flight Path Angle: 19.2ºRelative Velocity: 6,917 ft/sec
Dynamic Pressure: 17 psf
Heat Rate: 4.67 BTU / ft2 * sec Overall Thrust: 0.5
MECO (212 sec)Mach: 1.87
Flight Path Angle: -1ºRelative Velocity: 1,773 ft/sec
Dynamic Pressure: 0.1 psfInterital Pitch Angle: 95º
(POST L-Frame)
Max q (341 sec)Mach: 2.26
Flight Path Angle: -20.8ºRelative Velocity: 2195 ft/secDynamic Pressure: 762 psf
Heat Rate: 2.67 BTU / ft2 * sec
Max Heat Rate (331 sec)Mach: 2.63
Flight Path Angle: -31.8ºRelative Velocity: 2,549 ft/sec
Dynamic Pressure: 618 psf
Heat Rate: 3.31 BTU / ft2 * sec
Rocketback Jetback

American Institute of Aeronautics and Astronautics
8
III. RBS Vehicle Concept
A. Baseline System Configuration For purposes of this study, a baseline vehicle was established as a point of reference for comparison. This
vehicle was based on previous work by the authors for a hybrid RBS design11. The overall configuration is a three-stage system: a fully-reusable, winged body booster that carries an expendable rocket. The “upperstage” actually consists of two separate expendable series burn stages. As previously discussed, the booster was designed to be capable of performing a rocketback RTLS maneuver post-staging. The upperstages deliver a 20Klbm payload to a 100 nmi. circular orbit due-East from a notional launch site at CCAFS. Figure 10 provides an external view of the vehicle.
Figure 10. Representative RBS Hybrid Launch Vehicle Configuration.
The RBS features a number of technologies that are under development within various Air Force technology development programs (e.g. FAST, Hydrocarbon Boost Engine). These technologies include: (1) four high thrust-to-weight ratio, oxidizer-rich staged combustion engines, (2) a composite, common bulkhead main propellant tank for the LOX and RP-2 oxidizer and fuel, (3) Adaptive Guidance Navigation and Control (AGN&C), (4) Gr/BMI wing and tail structures, and (5) extensive Integrated Vehicle Systems Health Monitoring (IVSHM).
Additional technologies on the booster include a pressure-fed LOX/Ethanol Attitude control (ACS) system, Li-Ion batteries with no other power sources (e.g. fuel cells or APUs), and electro-hydraulic systems (EHAs) for aerosurface and booster engine actuation (i.e. not a central hydraulic system). It should also be noted that due to the benign thermal environment experienced by the vehicle, no acreage thermal protection system is required. However, some TPS is allocated for the booster nose and wing/tail leading edges. A mass growth allowance (growth margin) of 20% is applied to all stage dry mass values. Figure 11 shows the internal packaging arrangement for the system. As shown in Figure 11, the expendable upperstage consists of two stages. Both stages use LOX and RP-2 propellants. The first stage has three (3) main engines and a vacuum T/W of 1.2. The second stage has a single engine and is designed for a vacuum T/W of 1.0 at ignition. Engines on both stages are scaled variants of the SpaceX Merlin 1-C. Based on information obtained from various public sources, the engine was estimated to have a vacuum Isp of 304 seconds, an operating mixture ratio of 2.17, and a vacuum T/W ratio of 102.0.

American Institute of Aeronautics and Astronautics
9
The delivered payload of 20,000 lbs is carried in a shroud with a volume based on a payload density of 8 pcf . Its construction is a composite shell over aluminum honeycomb core and its weight is estimated at 2,815 lbs. The payload shroud is released during the stage 1 and 2 separation.
Figure 11. Representative RBS Hybrid Launch Vehicle Internal Layout
For the nominal mission, the vehicle ascends in inverted (booster tails pointing to the ground). The maximum
allowable dynamic pressure was 1,000 psf and axial acceleration was limited to 5.5 g’s or less. The dynamic pressure at staging was constrained to be 25 psf at a flight path angle of 20 degrees.
At the specified staging point, the booster releases the upperstage and two of the four main engines are shut
down while the other two are throttled to 33% of their nominal power. The booster then pitches over 180 degrees with a negative angle-of-attack. The pitch over maneuver was specified at 12o per second. Note that the inverted ascent eliminates the need for any roll maneuver. During this period of the trajectory, the altitude and flight dynamic pressure continue to decrease. The booster engines continue to operate at the throttled condition until the horizontal ground velocity is reversed and the booster has obtained enough energy to enable it to return to the launch site. The booster’s terminal condition is specified as an altitude of 15,000 ft over the original launch site. During the rocketback, it is critical to monitor the entry dynamic pressure, G-load, and wing normal force. Similar to the ascent profile, the maximum dynamic pressure and Gs were limited to 1,000 psf and 5.5 during the rocketback RTLS respectively. The wing normal force was limited to a factor of 2.5 times the vehicle’s landed weight (consistent with structural load sizing).
Figure 12 shows the nominal mission profile for the baseline system. Each vehicle stage is highlighted in a different color during the ascent and the booster RTLS maneuver is shown in yellow.

American Institute of Aeronautics and Astronautics
10
Figure 12. Nominal Vision Vehicle Mission Profile.
B. Analysis Tools and Modeling In order to correctly size the point-of-departure configuration and perform the trade studies, SEI utilized the
Hero vehicle design framework. Hero is a joint development effort between SpaceWorks Engineering and the Air Force Research Lab’s propulsion directorate12. Hero is built within the commercially available design framework PHX ModelCenter© available from Phoenix Integration, Inc.13. See Figure 13 for a screen capture image of the FAST Vision Vehicle closure model in Hero.
Hero is an integration environment for coupling various engineering disciplines and analysis tools into an automated design framework. The system is flexible enough to allow for quick reconfiguration of the individual software tools and their respective input files, and is therefore capable of examining a variety of launch system performing a range of different missions (earth-to-orbit expendables, hybrids, single or multi-stage vehicles, high-speed cruisers, etc.).
Booster Ascent Booster RTLS S1 Upperstage Ascent S2 Upperstage Ascent

American Institute of Aeronautics and Astronautics
11
Figure 13. Hero Multidisciplinary Vehicle Concept Closure Model (in PHX ModelCenter).
In its default configuration, Hero incorporates propulsion analysis (REDTOP-Pro), aerodynamic and aeroheating
analysis (S/HABP), thermal protection system sizing and selection (Sentry), trajectory analysis (POST), geometry/CAD visualization via PHX ModelCenter© and trajectory visualization (TraGE-X) tools appropriate to the hybrid launch vehicle problem14,15,16. To this set, SEI added a parametric mass estimating tool that utilizes the AFWAT database for its mass estimating equations (SEI’s AFWAT-Sizer). Additionally, the engine performance analysis was performed using a database in lieu of actual analysis (e.g. REDTOP-Pro). For the booster main propulsion, current best-estimate performance metrics for the HIVE engine were used. A curve fit of engine thrust-to-weight (T/W) vs. thrust level was also used instead of assuming a constant engine T/W value. This data was also available from ongoing design work under the Hydrocarbon Boost Demo program.
For this study, the performance tools integrated into Hero represented a “Level-1” analysis fidelity, although
Hero can easily accommodate Level-2 disciplinary tools if needed. Once configured, Hero matches the propellant required to the propellant available in a configuration to within a fraction of a percent difference in approximately 30 minutes when all tools are included “in the sizing loop.”
C. Baseline System Results Using the vehicle model created in the Hero framework, a baseline vehicle was closed by resolving all of the coupling variables using a fixed point iteration technique with relaxation to accelerate convergence. For the baseline, staging conditions were specified at a dynamic pressure of 25 psf, flight path angle of 20 degrees, angle-of-attack of 0.0 degrees, and a flight Mach number of 5.5. Table 1 provides a summary of key vehicle mass and geometry parameters obtained from the sizing process for the baseline system. System gross weight obtained were inline with weights established from other studies using this vehicle configuration (i.e. a 3STO hybrid) and payload class. Tables 2 and 3 summarize results from various phases of the nominal mission for the ascent and booster RTLS trajectory simulations respectively. Note that the maximum allowable dynamic pressure of 1,000 psf is not reached (maximum of only 524.6 psf). Also note that the increasing

American Institute of Aeronautics and Astronautics
12
engine thrust level for the booster ascent are only due to reduction in back pressure as the vehicle climbs out of the atmosphere. The peak heat rate for the vehicle is encountered at the staging condition.
Table 1. Baseline System Sizing Results Metric Value
Booster Stage Dry Weight (lbs) 60,228 Length (ft) 99.6 Fuselage Diameter (ft) 14.2 Wing Span (ft) 49.4
Expendable Stage #1 Stage Gross Weight [w/ S#2+payload] (lbs) 270,509 Stage Dry Weight (lbs) 15,781 Length (ft) 64.6
Expendable Stage #2 Stage Gross Weight [w/payload] (lbs) 64,406 Stage Dry Weight (lbs) 5,023 Length (ft) 21.5 Payload (lbs) 20,000
Table 2. Ascent Trajectory Results Summary
Metric Liftoff @ Mach 1 Booster
Pre-Staging Expendable S1
Pre-Staging Orbital
Insertion Time (s) 0.0 71.5 158.3 331.1 510.3 Altitude (ft) 0.0 27,116 173,164 419,874 607,794 Velocity (ft) 0.0 1,007 5,915 16,000 24,202 Alpha (deg) 0.0 -2.8 0.0 8.9 0.0 Gamma (deg) 0.0 64.3 20.0 5.3 0.0 Downrange (nmi) 0.0 1.9 33.5 304.9 861.9 Max. Gs 1.20 1.56 3.7 3.8 3.8 Max. Dyn. Pres. (psf) 0.0 501.6 524.6 25.0 25.0 Max. Stag. Heat Rate
[to 1’ sphere] (BTU/ft2-s) 0.0 0.4 4.1 4.1 4.1
Table 3. RTLS Trajectory Results Summary
Metric Booster
Post-Staging Peak Altitude MECO RTLS Arrival
Time (s) 158.3 215.0 253.3 862.5 Altitude (ft) 173,164 245,950 225,761 15,000 Velocity (ft) 5,915 2,833 1,355 465 Alpha (deg) 0.0 174.4 52.6 5.0 Gamma (deg) 20.0 0.0 -32.9 -7.3 Downrange (nmi) 33.5 73.0 78.3 0.0 Max. Gs 1.74 2.4 3.5 3.5 Max. Dyn. Pressure (psf) 25.0 25.0 25.0 500.2 Max. Stag. Heat Rate
[to 1’ sphere] (BTU/ft2-s) 4.1 4.1 4.1 4.1
Max. [+]Normal Force Load Factor 0.01 1.01 1.01 1.01 Max. [-]Normal Force Load Factor 0.0 0.0 0.01 2.51
During the RTLS maneuver, it is interesting to note that the booster climbs another 72Kft before finally peaking in altitude and returning. The engines while deeply throttled are still providing a vehicle thrust-to-weight ratio from 1.75 to 3.5 and operate for approximately 95 seconds after staging. Similar to the ascent trajectory, the maximum dynamic pressure seen by the booster is only 500 psf during the RTLS phase. Additionally, note that the wing

American Institute of Aeronautics and Astronautics
13
normal force loads in the positive direction (downward) are a maximum pre-MECO and reach a maximum in the negative direction (upward) post-MECO as the vehicle re-enters and attempts to slow is downward descent.
IV. RBS Launch Vehicle Trade Studies Using the established baseline vehicle, a variety of trajectory-focused trades were conducted to examine the
vehicle-level impact and sensitivities. Unless specified otherwise, all vehicle design parameters were held at the values used for the baseline system. Each of the trades will be presented next.
A. Staging Gamma and Dynamic Pressure Sensitivity with Negative-Alpha RBS Maneuver The staging point is a major design parameter for the system. It is of interest therefore to examine the vehicle-
level impacts from the prescribed staging flight path angle (gamma) and flight dynamic pressure (q). As noted, the baseline system had specified staging conditions at a gamma of 20 degrees and q of 25.0 psf. For this study, a total of six different staging conditions were examined at gamma values of 20 and 30 degrees for q values of 25, 50, and 75 psf. Table 4 presents the summary results for each of the closed vehicles at these staging conditions. Note that the baseline case, 1A, is repeated here for quick reference. Note that the in general there was not a significant impact to overall system or stage gross weights due to staging flight path angle and/or dynamic pressure. Interestingly, opposing trends were seen for the two cases, with some reduction in system gross weight occurring with higher dynamic pressures for the 20o gamma cases, but increasing weights for the 30o gamma cases. For all cases, staging at higher dynamic pressures negatively impacted the upperstages and staging at the higher gamma values reduced the upperstage size.
Table 4. Staging Gamma and Dyn. Pressure Sensitivity Results [-Alpha RTLS]
CASE # 1A
Baseline 2A 3A 4A 5A 6A
Staging Gamma (deg) 20.0 30.0 Staging Dyn. Pressure (psf) 25.0 50.0 75.0 25.0 50.0 75.0
System GLOW Relative to Baseline 1.000 0.973 0.971 1.014 1.022 1.074 Booster
Dry Weight (lbs) 60,228 58,523 58,353 61,347 61,746 64,836 Length (ft) 99.6 98.3 98.1 100.3 100.6 102.8 Fuselage Diameter (ft) 14.2 14.0 14.0 14.3 14.4 14.7 Wing Span (ft) 49.4 48.7 48.6 49.8 49.9 50.9
Expendable Stage #1 Stage Gross Weight (lbs) 270,509 273,710 275,688 267,580 269,047 270,406 Dry Weight (lbs) 15,781 15,928 16,019 15,644 15,711 15,774 Length (ft) 64.6 65.1 65.5 64.3 64.5 64.7
Expendable Stage #2 Stage Gross Weight (lbs) 64,406 65,056 65,551 62,644 62,827 63,122 Dry Weight (lbs) 5,023 5,066 5,098 4,906 4,918 4,938 Length (ft) 21.5 21.6 21.7 21.3 21.3 21.4 Payload (lbs) 20,000
Table 5 provides a summary of the trajectory results obtained for each of the cases from Table 5. Upon further
examination, it can be seen that while the impacts to the system size appears minimal for these trades, a more detailed look reveals that the impact to other areas was not so minimal. Specifically, wing normal force loads in the positive direction increased dramatically with the staging dynamic pressure. While the higher staging gamma tended to offset these increases, they came at the expense of slightly increased heat rates and total heat loads.
It is noteworthy that in case 6A (and almost for 5A), the maximum dynamic pressure value of 1,000 psf was obtained and thus actively constrained the trajectory. This was also evidenced for a few cases examined at flight
American Institute of Aeronautics and Astronautics
14
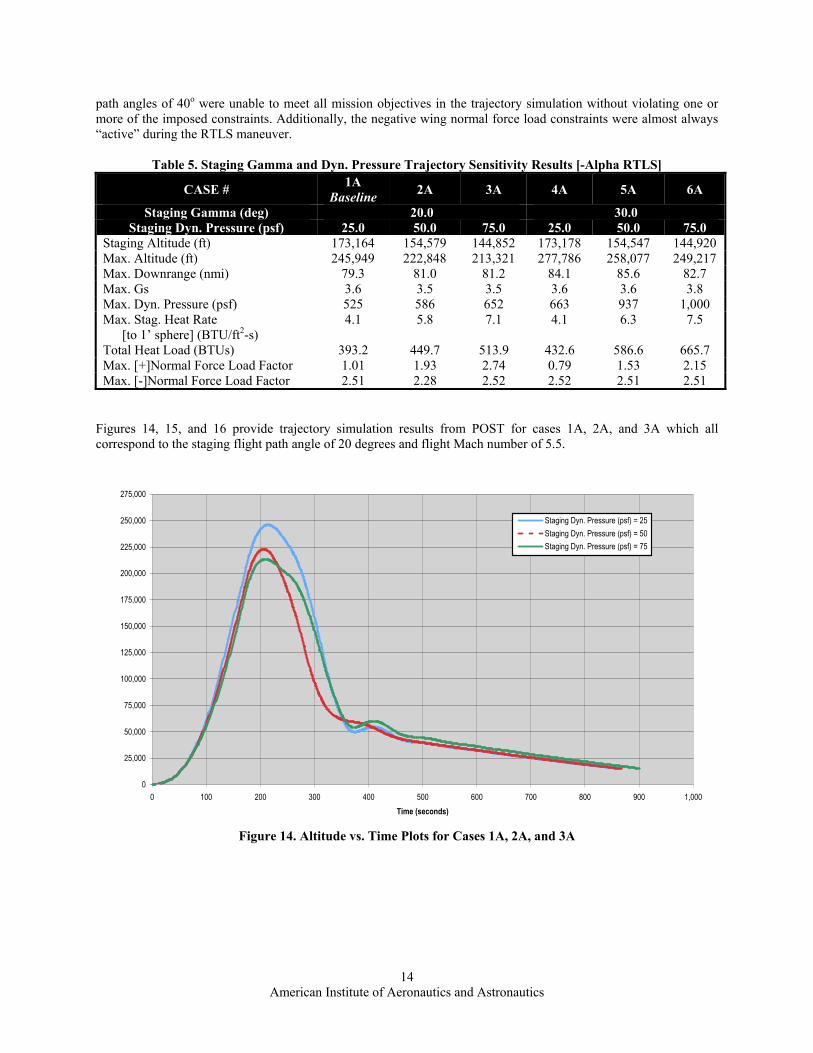
path angles of 40o were unable to meet all mission objectives in the trajectory simulation without violating one or more of the imposed constraints. Additionally, the negative wing normal force load constraints were almost always “active” during the RTLS maneuver.
Table 5. Staging Gamma and Dyn. Pressure Trajectory Sensitivity Results [-Alpha RTLS]
CASE # 1A
Baseline 2A 3A 4A 5A 6A
Staging Gamma (deg) 20.0 30.0 Staging Dyn. Pressure (psf) 25.0 50.0 75.0 25.0 50.0 75.0
Staging Altitude (ft) 173,164 154,579 144,852 173,178 154,547 144,920 Max. Altitude (ft) 245,949 222,848 213,321 277,786 258,077 249,217 Max. Downrange (nmi) 79.3 81.0 81.2 84.1 85.6 82.7 Max. Gs 3.6 3.5 3.5 3.6 3.6 3.8 Max. Dyn. Pressure (psf) 525 586 652 663 937 1,000 Max. Stag. Heat Rate
[to 1’ sphere] (BTU/ft2-s) 4.1 5.8 7.1 4.1 6.3 7.5
Total Heat Load (BTUs) 393.2 449.7 513.9 432.6 586.6 665.7 Max. [+]Normal Force Load Factor 1.01 1.93 2.74 0.79 1.53 2.15 Max. [-]Normal Force Load Factor 2.51 2.28 2.52 2.52 2.51 2.51
Figures 14, 15, and 16 provide trajectory simulation results from POST for cases 1A, 2A, and 3A which all correspond to the staging flight path angle of 20 degrees and flight Mach number of 5.5.
Figure 14. Altitude vs. Time Plots for Cases 1A, 2A, and 3A
0
25,000
50,000
75,000
100,000
125,000
150,000
175,000
200,000
225,000
250,000
275,000
0 100 200 300 400 500 600 700 800 900 1,000
Time (seconds)
Staging Dyn. Pressure (psf) = 25
Staging Dyn. Pressure (psf) = 50
Staging Dyn. Pressure (psf) = 75

American Institute of Aeronautics and Astronautics
15
Figure 15. Altitude vs. Downrange Distance Plots for Cases 1A, 2A, and 3A
Figure 16. Stagnation Heat Rate vs. Time Plots for Cases 1A, 2A, and 3A
0
25,000
50,000
75,000
100,000
125,000
150,000
175,000
200,000
225,000
250,000
275,000
0 10 20 30 40 50 60 70 80 90 100
Downrange (nmi)
Staging Dyn. Pressure (psf) = 25
Staging Dyn. Pressure (psf) = 50
Staging Dyn. Pressure (psf) = 75
0.0
1.0
2.0
3.0
4.0
5.0
6.0
7.0
8.0
0 100 200 300 400 500 600 700 800 900 1,000
Time (seconds)
Staging Dyn. Pressure (psf) = 25
Staging Dyn. Pressure (psf) = 50
Staging Dyn. Pressure (psf) = 75

American Institute of Aeronautics and Astronautics
16
B. Positive-Alpha RBS Maneuver Impacts For the baseline system and all cases for the staging dynamic pressure and flight path angle study in Section
IV.A, the booster performed a negative-alpha pitch maneuver at the initiation of the RTLS. In this case, since the booster is flying inverted, the nose pitches “upward” toward the sky as the booster rotates around to point back towards the launch site. Since the engines are operating (in a throttled-down capacity) still, the vehicle obtains some additional boost in altitude as the pitch over maneuver takes about 15 seconds to execute.
An alternative approach is to pitch the vehicle in a positive-alpha orientation during this maneuver. While this points the nose towards the ground and likely prevents the vehicle from gaining as much altitude compared to the negative-alpha maneuver, it may reduce the downrange distance and thereby result in propellant savings for the RTLS portion of the mission. The potential penalty for this may be in higher heat rates and/or loads. However, it may also relieve some normal force loading on the wings during reentry in the positive direction, thereby permitting some structural weight savings.
Figure 17 notionally illustrates the difference between these two maneuvers. Note that the booster stage is flying inverted prior to the pitchover. For this trade, all cases examined in Section IV.A were repeated and reclosed using the positive-alpha pitch maneuver. Tables 6 and 7 summarize the results for these cases.
Figure 17. Pitchover Direction Options for RTLS Initiation
Table 6. Staging Gamma and Dyn. Pressure Sensitivity Results for [+Alpha RTLS] CASE # 1B 2B 3B 4B 5B 6B
Staging Gamma (deg) 20.0 30.0 Staging Dyn. Pressure (psf) 25.0 50.0 75.0 25.0 50.0 75.0
System GLOW Relative to Baseline 1.007 0.973 0.970 0.989 1.008 1.074 Booster
Dry Weight (lbs) 60,700 58,496 58,317 59,652 60,806 64,856 Length (ft) 99.9 98.2 98.0 99.2 100.0 102.8 Fuselage Diameter (ft) 14.3 14.0 14.0 14.2 14.3 14.7 Wing Span (ft) 49.5 48.7 48.6 49.2 49.6 50.9
Expendable Stage #1 Stage Gross Weight (lbs) 270,517 273,710 275,688 267,581 269,055 270,404

American Institute of Aeronautics and Astronautics
17
Dry Weight (lbs) 15,782 15,928 16,019 15,644 15,712 15,774 Length (ft) 64.6 65.1 65.5 64.3 64.5 64.7
Expendable Stage #2 Stage Gross Weight (lbs) 64,407 65,056 65,551 62,644 62,827 63,122 Dry Weight (lbs) 5,023 5,066 5,098 4,906 4,918 4,938 Length (ft) 21.5 21.6 21.7 21.3 21.3 21.4 Payload (lbs) 20,000
Table 7. Staging Gamma and Dyn. Pressure Trajectory Sensitivity Results [+Alpha RTLS]
CASE # 1B 2B 3B 4B 5B 6B Staging Gamma (deg) 20.0 30.0
Staging Dyn. Pressure (psf) 25.0 50.0 75.0 25.0 50.0 75.0 Staging Altitude (ft) 173,173 155,868 144,852 173,158 154,576 144,880 Max. Altitude (ft) 217,951 200,268 188,659 246,532 231,893 230,223 Max. Downrange (nmi) 83.3 83.8 84.4 83.4 86.2 85.5 Max. Gs 3.6 3.5 3.5 3.6 3.6 3.8 Max. Dyn. Pressure (psf) 5245 586 652 663 936 1,000 Max. Stag. Heat Rate
[to 1’ sphere] (BTU/ft2-s) 4.1 5.8 7.1 4.1 6.3 7.5
Total Heat Load (BTUs) 355.6 435.2 507.6 429.8 584.8 659.0 Max. [+]Normal Force Load Factor 0.06 0.18 0.28 0.01 0.03 0.09 Max. [-]Normal Force Load Factor 2.51 2.50 2.96 2.51 2.50 2.50
Figure 18. Altitude vs. Time Plots for Cases 4A and 4B
As indicated in Tables 7 when compared to results from Table 5, there was not a significant impact to vehicle size or mass when performing the positive-Alpha RTLS maneuver. Unexpectedly, the impact to the maximum downrange distance was negligible compared to the negative-Alpha cases. The most significant impact is probably in the reduced loads for the positive wing normal forces. Note that any potential structural weight savings due to
0
25,000
50,000
75,000
100,000
125,000
150,000
175,000
200,000
225,000
250,000
275,000
300,000
0 100 200 300 400 500 600 700 800 900 1,000
Time (seconds)
4A - Negative-Alpha Pitchover
4B - Positive Alpha Pitchover
American Institute of Aeronautics and Astronautics
18
reduced loads were not reflected in the vehicle sizing; all cases were sized with the loads remaining at their maximum allowable value. Figures 18 shows the trajectory flight path results for cases 4A and 4B which have identical staging conditions, but differ in their pitchover maneuver direction after staging. As indicated by the data in Tables 6 and 7, the flight environment is very similar with the largest difference being the maximum altitude experienced. Note that at the lower flight path angle cases (1A and B, 2A and B, and 3A and B), some differences in the flight environment, namely the total heat load and positive normal force loads, did occur.
C. Staging Mach Number Sensitivity Previous studies have shown optimal staging Mach numbers for both hybrid and fully-reusable systems of this
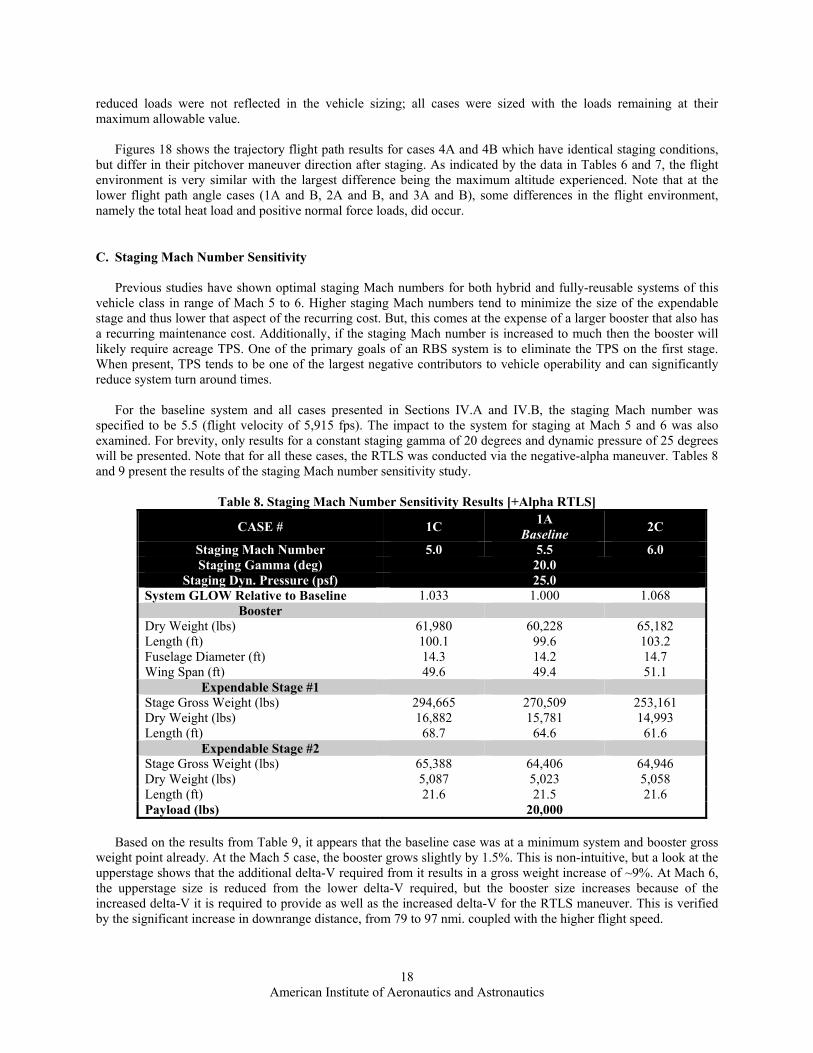
vehicle class in range of Mach 5 to 6. Higher staging Mach numbers tend to minimize the size of the expendable stage and thus lower that aspect of the recurring cost. But, this comes at the expense of a larger booster that also has a recurring maintenance cost. Additionally, if the staging Mach number is increased to much then the booster will likely require acreage TPS. One of the primary goals of an RBS system is to eliminate the TPS on the first stage. When present, TPS tends to be one of the largest negative contributors to vehicle operability and can significantly reduce system turn around times. For the baseline system and all cases presented in Sections IV.A and IV.B, the staging Mach number was specified to be 5.5 (flight velocity of 5,915 fps). The impact to the system for staging at Mach 5 and 6 was also examined. For brevity, only results for a constant staging gamma of 20 degrees and dynamic pressure of 25 degrees will be presented. Note that for all these cases, the RTLS was conducted via the negative-alpha maneuver. Tables 8 and 9 present the results of the staging Mach number sensitivity study.
Table 8. Staging Mach Number Sensitivity Results [+Alpha RTLS]
CASE # 1C 1A
Baseline 2C
Staging Mach Number 5.0 5.5 6.0 Staging Gamma (deg) 20.0
Staging Dyn. Pressure (psf) 25.0 System GLOW Relative to Baseline 1.033 1.000 1.068
Booster Dry Weight (lbs) 61,980 60,228 65,182 Length (ft) 100.1 99.6 103.2 Fuselage Diameter (ft) 14.3 14.2 14.7 Wing Span (ft) 49.6 49.4 51.1
Expendable Stage #1 Stage Gross Weight (lbs) 294,665 270,509 253,161 Dry Weight (lbs) 16,882 15,781 14,993 Length (ft) 68.7 64.6 61.6
Expendable Stage #2 Stage Gross Weight (lbs) 65,388 64,406 64,946 Dry Weight (lbs) 5,087 5,023 5,058 Length (ft) 21.6 21.5 21.6 Payload (lbs) 20,000
Based on the results from Table 9, it appears that the baseline case was at a minimum system and booster gross
weight point already. At the Mach 5 case, the booster grows slightly by 1.5%. This is non-intuitive, but a look at the upperstage shows that the additional delta-V required from it results in a gross weight increase of ~9%. At Mach 6, the upperstage size is reduced from the lower delta-V required, but the booster size increases because of the increased delta-V it is required to provide as well as the increased delta-V for the RTLS maneuver. This is verified by the significant increase in downrange distance, from 79 to 97 nmi. coupled with the higher flight speed.

American Institute of Aeronautics and Astronautics
19
Table 9. Staging Mach Number Trajectory Sensitivity Results [+Alpha RTLS]
CASE # 1C 1A
Baseline 2C
Staging Mach Number 5.0 5.5 6.0 Staging Gamma (deg) 20.0
Staging Dyn. Pressure (psf) 25.0 Staging Altitude (ft) 168,135 173,164 177,527 Max. Altitude (ft) 223,044 245,949 259,063 Max. Downrange (nmi) 70.6 79.3 96.7 Max. Gs 3.5 (ascent) 3.6 (ascent) 3.8 (ascent) Max. Dyn. Pressure (psf) 489 (ascent) 524 (ascent) 548 (ascent) Total Heat Load (BTUs) 292.5 393.2 470.3 Max. Stag. Heat Rate
[to 1’ sphere] (BTU/ft2-s) 3.4 (ascent) 4.1 (ascent) 4.8 (ascent)
Max. [+]Normal Force Load Factor 1.04 1.01 0.94 Max. [-]Normal Force Load Factor 2.19 2.51 2.48
V. Conclusion
For this effort, an automated, multidisciplinary closure environment was utilized to design and close multiple hybrid launch vehicles that are of current interest to AFRL and the U.S. Air Force. The baseline configuration was derived from previous hybrid vehicle concept development work. Using Hero, a variety of trajectory constraints were examined that pertained to the staging maneuver and RTLS rocketback trajectory. Specifically, the staging flight path angle, dynamic pressure, and Mach number sensitivities were quantified. Additionally, the impact of the post-staging pitchover direction (i.e. positive or negative alpha) was examined.
In general no single parameter appeared to significantly impact the overall vehicle size and weight relative to the baseline system. However, there were notable and significant impacts to the trajectory and flight conditions encountered for each case. As this paper shows, there are various trajectories for a rocketback maneuver that could be used in an operational manner. Thus, a rocketback demonstrator must focus on flying trajectories that match a range of rocketback flight conditions so as to reduce enough risk and bring the rocketback trajectory up to a TRL 6. The design of a future operational reusable booster can then be flexible enough to choose the rocketback trajectory that meets user requirements and other design constraints.

American Institute of Aeronautics and Astronautics
20
References 1 Hampsten, K. “Spacelift Development Plan.” www.acq.osd.mil/nsso/conference/briefs/HampstenSDP%20Public%20Release.ppt 2 Hellman, B.; Olds J. “Comparison of Return to Launch Site Options for a Reusable Booster Stage.” August 2005. www.ssdl.gatech.edu 3 Reusable Booster Integrated Demo-Concept Options Maturation Study Request for Information. Solicitation Number: RFI-PKV-09-01 4 Hellman, B. “Hybrid Launch Vehicle Staging Optimization for Minimum Cost.” AIAA 2006-7259 5 Hellman, B. “Return to Launch Site Trajectory Aeroheating for a Reusable Booster.” AIAA 2007-6151 6 Department of Defense Technology Readiness Assessment (TRA) Deskbook. May 2005. 7 Department of Defense Instruction (DoDI) 5000.2 Section 3.7.2.2. 8 Covault, C. “Surviving an RTLS.” Aviation Week and Space Technology. August 21/28, 2006. Pages 84-85. 9 O’Connor, B. “Safety and Rescue During STS Operations.” Proceeding of the Workshop on Crew Safety and Rescue in Space – an International Approach. La Bourget, France. 7 June 1989 10 McKinney, L.E. “Vehicle Sizing and Trajectory Optimization for a Reusable “Tossback” Booster. 11 Bradford, J., Hellman, B., Olds, J. R., "Vision Vehicle Concept Assessment for the FAST Program," JANNAF 2008, 6th Modeling and Simulation, 4th Liquid Propulsion, 3rd Spacecraft Propulsion Joint Subcommittee Meeting, Orlando, Florida, December 8-12, 2008. 12 Bradford, J.E., Wallace, J., Olds, J.R., “Hero: A Collaborative Multidisciplinary and Multifidelity Design Framework for Launch Systems”, JANNAF 6th Modeling and Simulation Subcommittee, 4th Liquid Propulsion Subcommittee, and 3rd Solid Propulsion Subcommittee Joint Meeting, Orlando, Florida, December 8-12, 2008. 13 ModelCenter 7.1, Phoenix Integration, 27 October 2008, http://www.phoenix-int.com. 14 Striepe, S.A., et al, “Program to Optimize Simulated Trajectories (POST II)”, Volume II, Version 1.1.6.G, NASA Langley Research Center, January 2004. 15 Rocket Engine Design Tool for Optimal Performance - Professional (REDTOP-Pro), 30 October 2008, http://www.sei.aero/sw/products/redtop-pro/index.html. 16 Bradford, J. E., Olds, J. R., "Thermal Protection System Sizing and Selection for RLVs Using the Sentry Code," AIAA-2006-4605, 42nd AIAA/ASME/SAE/ASEE Joint Propulsion Conference, Sacramento, California, July 9-12, 2006.