rtp/scs public outreach workshop summary...
TRANSCRIPT

Southern California Association of Governments
RTP/SCS PubliC ouTReaChwoRkShoP SummaRy RePoRT

introductionIn total, 18 Regional Transportation Plan and Sustainable Communities Strategy (RTP/SCS) Public Outreach Workshops were held in the SCAG region between July and August 2011, during the pre-Draft phase of the RTP/SCS. At each workshop, public participants were introduced to the RTP/SCS planning process and engaged in the following activities:
a. Viewed introductory video on the 2012 Regional Transportation Plan and Sustainable Communities Strategy
b. Participated in a presentation on Four Draft Scenarios for Southern California’s Future
c. Engaged in small group breakout discussions
d. Participated in a polling of RTP/SCS strategies and priorities
This report provides a snapshot of preferred primary objectives for the 2012 RTP/SCS as reported from the small group breakout sessions and a summary of responses to the poll-ing questions for all workshops. These results provide insight on participants’ attitudes on current transportation options as well as their desired transportation and land use priorities for the region. (Please note: The results for four questions, which did not pertain to RTP/SCS content and were for SCAG internal use, were omitted in this report.)
A complete report for each RTP/SCS Public Outreach Workshop, which includes the results of the priorities discussion, survey questions and public comments, is available for separate download from the SCAG website. A full listing of RTP/SCS Public Outreach Workshops, including their locations and dates is referenced in Table 2.2, Appendix – Public Participation and Consultation Report.
Polling Summary ReportThe following Figures 1–14 illustrate the views of participants from all 18 RTP/SCS public outreach workshops held throughout the SCAG region. Significant differences in opinion sometimes occurred between subregions/counties and are noted below each figure.
Figure 1 What is the first and most important priority in Southern California?
0
50
100
150
200
250
Economy Environment Housing Infrastructure Public Health Social Equity Transportation
Number of Votes
A majority of workshop attendees indicated their first priority in Southern California is the Economy, with the Environment and Transportation tied for second. Participants in subregions/counties whose majority votes differed substantially included:
� Westside COG – Participants’ votes were split evenly between the Environment, Public Health and Transportation
� Gateway COG – Participants’ votes were split between Transportation and the Economy
2 RTP/SCS Public Outreach Workshop Summary Report

Figure 2 What is the second most important priority in Southern California?
0
20
40
60
80
100
120
Economy Environment Housing Infrastructure Public Health Social Equity Transportation
Number of Votes
In this polling question, the Environment, Infrastructure and Transportation were closely tied for participants’ second most important priority for the region. Among those sub-regions/counties that had a majority of votes that were not transportation or a split as a second priority were:
� Western Riverside County and Gateway Cities – The Economy was the second most important priority
� Los Angeles, South Bay and North Los Angeles – Housing was the second most important priority
Figure 3 Which statement best describes your daily commute?
0
50
100
150
200
250
300
350
I primarily drive alone. I primarily walk or biketo common
destinations.
I primarily carpool. I primarily use publictransportation.
I do not commute.
Number of Votes
We asked the workshop attendees a series of questions about their mode choice and about their current ability to use public transportation. A majority of the attendees drive by themselves; however, there are some small differences regionally:
� About 1/3 of participants living in the Westside COG area indicated they primarily walk or bike to common destinations.
� About 1/3 of participants living in the City of Los Angeles indicated they primarily use public transportation.
� About 40 percent of participants living in the Gateway Cities COG area indicated they primarily use public transportation.
RTP/SCS Public Outreach Workshop Summary Report 3

Figure 4 Which statement best describes your access to transportation options?
0
50
100
150
200
250
I drive; little access totransit.
I have some access totransit but choose to drive.
I have adequate access totransit and do not drive.
I do not have adequateaccess to transit and do not
drive.
Number of Votes
This question focused on participants’ access to transportation. Over 200 participants responded that they drove and had little access to transit. However, slightly less than half of the attendees indicated they had some access to transit, but chose to drive. (Please note: The last option of not having adequate access to transit and not driving was not an original option. This option was added to later workshops after feedback from partici-pants). Of note:
� Participants in the City of Los Angeles had a higher percentage of voters that have adequate access to transit and do not drive.
� The following subregions/counties had either a higher percentage or were almost the highest percentage of votes in which voters have some access to transit but chose to drive: Orange County; Ventura County; San Bernardino; San Gabriel Valley; Westside Cities; South Bay Cities; and North Los Angeles
Figure 5 What is the biggest barrier to using public transportation?
0
20
40
60
80
100
120
140
Does not stopnear my home.
Does not gowhere I need.
Does not comefrequently
enough or runlate enough.
Too crowded, Ido not enjoy
riding.
Too expensivefor my budget.
None of theabove.
Takes too long.
Number of Votes
This question was intended to get a feel for what attendees felt about public transpor-tation. Responses by subregion/county varied as well. Some of the participants who responded “None of the above” indicated that public transportation takes too long, the question does not apply, or they do not commute. (Please note: The option of “Takes too long” was not an original option. This option was added later for the Santa Monica workshop only.)
4 RTP/SCS Public Outreach Workshop Summary Report

Figure 6 The RTP should invest most of its money into roads and highways.
0
20
40
60
80
100
120
140
Strongly Agree Agree Neither Agree orDisagree
Disagree Strongly Disagree
Number of Votes
This is the first in a series of questions that asked participants directly where the RTP/SCS should focus its investments. Over 230 participants, out of approximately 450, felt that the RTP should not invest heavily in roads and highways. However, this question also revealed major differences in opinions based on subregion/county. Of those who agreed with the statement:
� 30 percent of participants live in Orange County
� 98 percent of participants live in the High Desert/San Bernardino area
� 30 percent of participants live in North LA County
Figure 7 The RTP should invest in a mix of transportation options, including road, highway, rail transit, express bus, and bicycle/pedestrian.
0
50
100
150
200
250
Strongly Agree Agree Neither Agree orDisagree
Disagree Strongly Disagree
Number of Votes
This chart shows a general agreement among all participants that the RTP should invest in all modes of transit. There was general consensus among all regions.
RTP/SCS Public Outreach Workshop Summary Report 5

Figure 8 The RTP should invest most of its money into rail transit, express bus, and bicycle/pedestrian.
0
20
40
60
80
100
120
140
Strongly Agree Agree Neither Agree orDisagree
Disagree Strongly Disagree
Number of Votes
This polling question is a follow-up to what was asked in Figure 6. As a whole, the region is divided as to whether the RTP/SCS should invest heavily in transit and bicycle/pedestrian infrastructure. However, there are some stark regional differences. A higher percentage of participants living in the following subregions/counties indicated that they either strongly agreed/agreed with this statement:
� Over 30 percent of voters living in Orange County
� Over 40 percent of participants living in the Westside Cities
� Over 35 percent of participants living in the City of Los Angeles
Figure 9 The RTP should focus relatively more on expanding ways to travel more quickly, or reduce distances traveled?
0
50
100
150
200
250
Expand Mobility (expand roadsand transit).
Balance between 1 and 3. Focus most on reducingdistances traveled.
Number of Votes
This question gives a sense of attendees’ desires in the RTP/SCS. A majority of the attendees favored a balanced approach. However, over 30 percent of responses indicated they would like to focus on reducing distances traveled.
6 RTP/SCS Public Outreach Workshop Summary Report

Figure 10 Encourage more employment growth in or near residential communities
0
20
40
60
80
100
120
140
160
180
200
Strongly Agree Agree Neither Agree orDisagree
Disagree Strongly Disagree
Number of Votes
Figure 11 Encourage more residential growth in or near employment centers
0
20
40
60
80
100
120
140
160
180
200
Strongly Agree Agree Neither Agree orDisagree
Disagree Strongly Disagree
Number of Votes
This series of questions shows that a majority of attendees are in favor of encouraging more employment growth in or near residential communities and vice versa; and is inter-preted as a general preference towards shorter commutes.
RTP/SCS Public Outreach Workshop Summary Report 7

Figure 12 To accommodate the region’s future population, new housing development and housing types in the coming decades should be primarily . . .
0
20
40
60
80
100
120
140
160
180
Large Lot Detached Small Lot Detached Townhouse Multi-FamilyDevelopment
Number of Votes
The results of this polling question shows that even though a majority of the attendees are in favor of denser housing types like townhomes and multi-family type residential developments, there are still some who favor large and small lot detached residential. Participants who favored small lot detached housing were largely represented in the following subregions/counties: Western Riverside County; High Desert (San Bernardino); Imperial County; and South Bay Cities. Voters living in Orange County chose townhouses just slightly over small lot detached and multi-family development.
Figure 13 Future development of employment centers and commercial areas should mostly occur in . . .
0
50
100
150
200
250
Standard SuburbanAreas
Part Standard, PartMixed Use Walkable
Mixed Use Walkable Part Mixed UseWalkable, Part
Urban
Urban Areas
Number of VotesThis polling question reveals that a majority of attendees were in favor of incorporating employment and commercial centers in mixed-use developments, whether in suburban or urban environments. However, over 30 percent of participants from the High Desert (San Bernardino) area preferred that future employment and commercial development should mostly occur in standard suburban areas.
8 RTP/SCS Public Outreach Workshop Summary Report
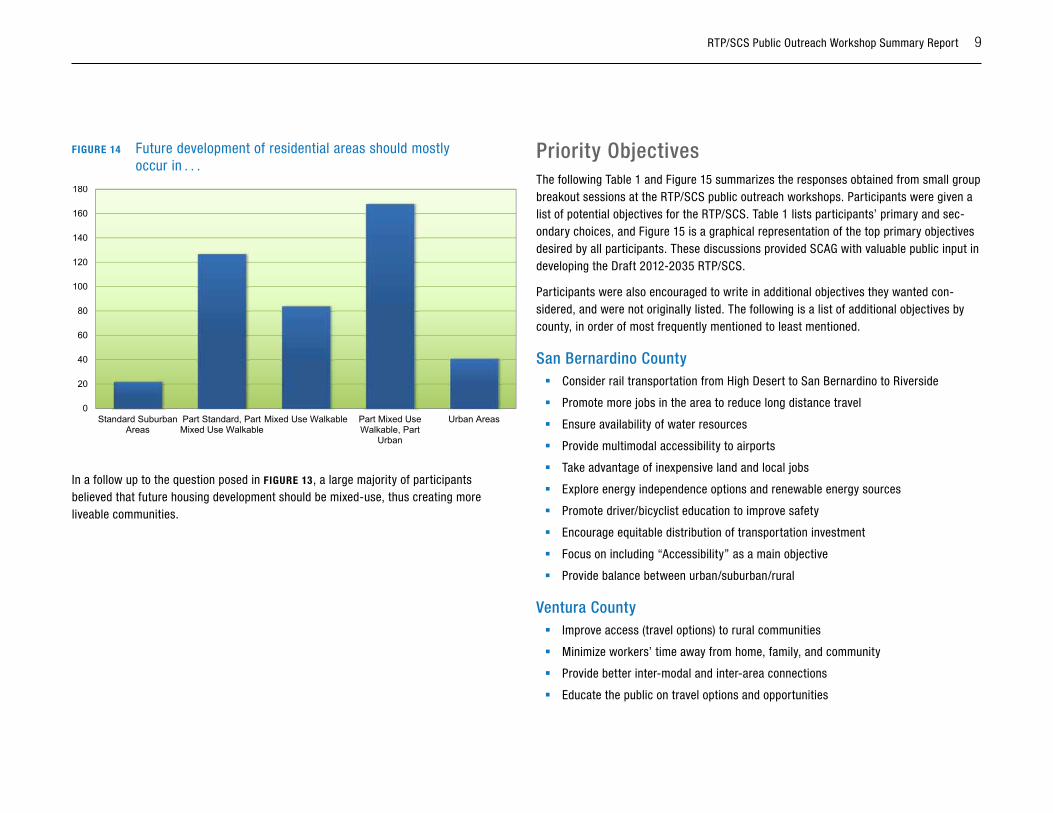
Figure 14 Future development of residential areas should mostly occur in . . .
0
20
40
60
80
100
120
140
160
180
Standard SuburbanAreas
Part Standard, PartMixed Use Walkable
Mixed Use Walkable Part Mixed UseWalkable, Part
Urban
Urban Areas
Number of Votes
In a follow up to the question posed in Figure 13, a large majority of participants believed that future housing development should be mixed-use, thus creating more liveable communities.
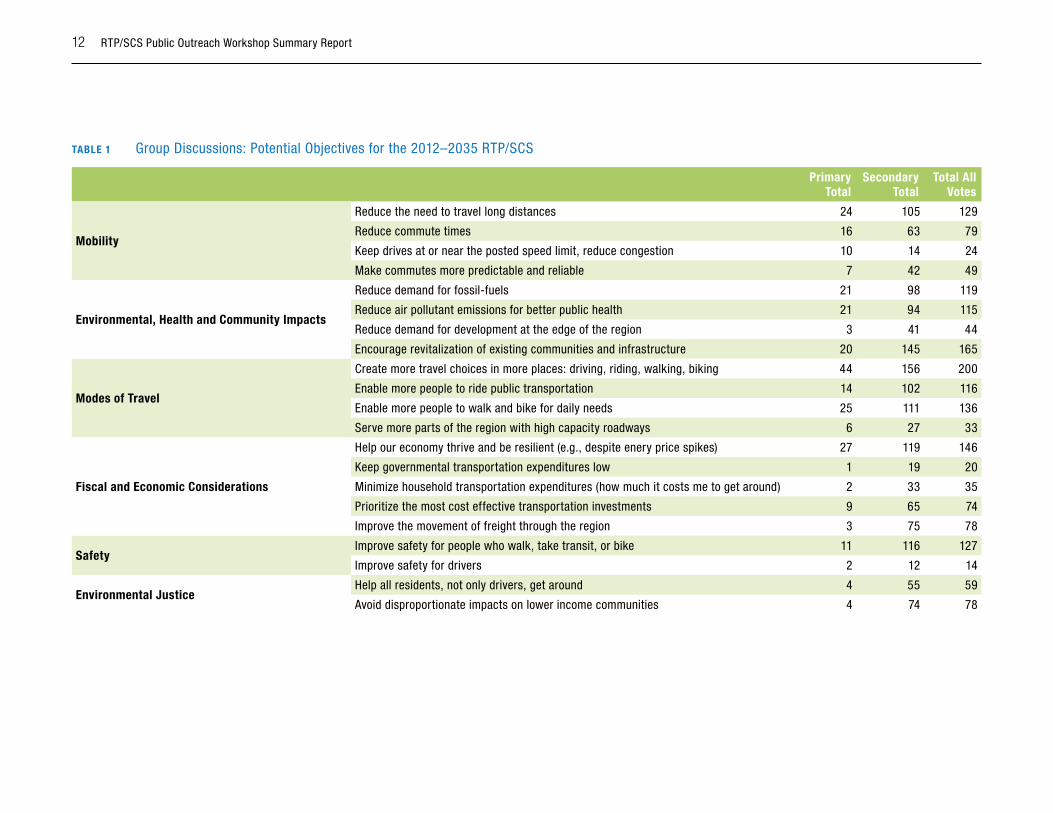
Priority objectivesThe following Table 1 and Figure 15 summarizes the responses obtained from small group breakout sessions at the RTP/SCS public outreach workshops. Participants were given a list of potential objectives for the RTP/SCS. Table 1 lists participants’ primary and sec-ondary choices, and Figure 15 is a graphical representation of the top primary objectives desired by all participants. These discussions provided SCAG with valuable public input in developing the Draft 2012-2035 RTP/SCS.
Participants were also encouraged to write in additional objectives they wanted con-sidered, and were not originally listed. The following is a list of additional objectives by county, in order of most frequently mentioned to least mentioned.
San bernardino County � Consider rail transportation from High Desert to San Bernardino to Riverside
� Promote more jobs in the area to reduce long distance travel
� Ensure availability of water resources
� Provide multimodal accessibility to airports
� Take advantage of inexpensive land and local jobs
� Explore energy independence options and renewable energy sources
� Promote driver/bicyclist education to improve safety
� Encourage equitable distribution of transportation investment
� Focus on including “Accessibility” as a main objective
� Provide balance between urban/suburban/rural
Ventura County � Improve access (travel options) to rural communities
� Minimize workers’ time away from home, family, and community
� Provide better inter-modal and inter-area connections
� Educate the public on travel options and opportunities
RTP/SCS Public Outreach Workshop Summary Report 9

10 RTP/SCS Public Outreach Workshop Summary Report
Riverside County � Improve jobs-housing balance
� Focus on improving all trips, not just commute
� Increase local accessibility and efficiency of public transportation
� Provide open space and recreational opportunities
� Encourage alternative fuel infrastructure
� Encourage development of NEV and other electric vehicles
� Provide more bike routes/facilities and off-road trails/paths
� Support employment centers to create jobs/overall job development
� Maintain housing affordability near transit
� Develop land use objectives
� Integrate land use planning for subregion and region-wide basis
� Ensure no “one-size-fits-all” planning
imperial County � Improve access to public transit
� Decrease border and check point wait times to reduce emissions
� Coordinate national and joint U.S.-Mexico efforts for air quality improvements
� Improve public transportation at international border with more intra-urban circulators
� Promote intermodal movement for freight
orange County � Reduce barriers to implementing Complete Streets concept
� Integrate transportation needs with housing needs
� Improve timetables and stop locations of public transportation for increased rider flexibility
� Improve connectivity of public transportation with other modes to focus on first mile/last mile
� Promote carshare (i.e. Zipcar), bikeshare programs, etc.
� Improve access to recreational spaces and facilities
� Increase diversity of housing options
� Promote active living through walkable neighborhood design, active transportation, etc.
� Improve alternative mode infrastructure
� Consider vulnerable populations in available transit services/costs/connectivity
� Decrease costs for taking transit
� Use market-based approaches/incentives
� Separate modes of travel
� Encourage Safe Routes to School program
� Focus on safety for seniors
� Increase education across the board on transportation/transit alternatives
� Improve jobs-housing balance

RTP/SCS Public Outreach Workshop Summary Report 11
los angeles County � Encourage connectivity in the existing and future freeway, transit and bikeway sys-
tems to integrate all modes of travel
� Focus on first mile/last mile connectivity
� Provide for interregional and inter-county travel for all modes
� Make transit more affordable
� Focus on improving all trips, not just commute
� Ensure higher density developments are being served by efficient transportation systems
� Encourage multiservice/multipurpose destinations
� Improve jobs-housing balance
� Consider different mobility measures for multiple modes
� Identify and preserve valuable characteristics in each community
� Preserve and increase affordable housing to avoid displacement around transit
� Promote active living through active transportation, walkability, parks/open space/recreation opportunities, and healthy communities design.
� Promote Complete Streets concept
� Incentivize development of jobs and housing near transit centers
� Maintain existing transportation infrastructure
� Consider land banking for affordable housing
� Prioritize bike/pedestrian safety
� Encourage cleaner transportation technology
� Provide land use link to transportation to ensure appropriateness to geographic area
� Improve public education and communication regarding the objectives of the RTP
� Include a range of housing opportunities
� Provide more rail opportunities throughout the region
12 RTP/SCS Public Outreach Workshop Summary Report
Table 1 Group Discussions: Potential Objectives for the 2012–2035 RTP/SCS
Primary Total
secondary Total
Total all Votes
Mobility
Reduce the need to travel long distances 24 105 129
Reduce commute times 16 63 79
Keep drives at or near the posted speed limit, reduce congestion 10 14 24
Make commutes more predictable and reliable 7 42 49
environmental, Health and Community impacts
Reduce demand for fossil-fuels 21 98 119
Reduce air pollutant emissions for better public health 21 94 115
Reduce demand for development at the edge of the region 3 41 44
Encourage revitalization of existing communities and infrastructure 20 145 165
Modes of Travel
Create more travel choices in more places: driving, riding, walking, biking 44 156 200
Enable more people to ride public transportation 14 102 116
Enable more people to walk and bike for daily needs 25 111 136
Serve more parts of the region with high capacity roadways 6 27 33
Fiscal and economic Considerations
Help our economy thrive and be resilient (e.g., despite enery price spikes) 27 119 146
Keep governmental transportation expenditures low 1 19 20
Minimize household transportation expenditures (how much it costs me to get around) 2 33 35
Prioritize the most cost effective transportation investments 9 65 74
Improve the movement of freight through the region 3 75 78
safetyImprove safety for people who walk, take transit, or bike 11 116 127
Improve safety for drivers 2 12 14
environmental JusticeHelp all residents, not only drivers, get around 4 55 59
Avoid disproportionate impacts on lower income communities 4 74 78

RTP/SCS Public Outreach Workshop Summary Report 13
0 5 10 15 20 25 30 35 40 45 50
Potential Objectives for the 2012 RTP
Reduce the need to travel long distances
Reduce commute times
Keep drives at or near the posted speed limit, reduce congestion
Make commutes more predictable and reliable
Reduce demand for fossil-fuels
Reduce air pollutant emissions for better public health
Reduce demand for development at the edge of the region
Encourage revitalization of existing communities and infrastructure
Create more travel choices in more places: driving, riding, walking, biking
Enable more people to ride public transportation
Enable more people to walk and bike for daily needs
Serve more parts of the region with high capacity roadways
Help our economy thrive and be resilient (e.g., despite enery price spikes)
Keep governmental transportation expenditures low
Minimize household transportation expenditures (how much it costs me to get around
Prioritize the most cost effective transportation investments
Improve the movement of freight through the region
Improve safety for people who walk, take transit, or bike
Improve safety for drivers
Help all residents, not only drivers, get around
Avoid disproportionate impacts on lower income communities
Mo
bili
tyE
nviro
nmen
tal,
Hea
lthan
d C
omm
unity
Imp
acts
Mo
des
of T
rave
lF
isca
l and
Eco
nom
icC
ons
ider
atio
nsS
afet
yE
nviro
nmen
tal
Jus
tice
Figure 15 Primary Objectives Desired by Participants in 2012–2035 RTP/SCS Public Outreach Workshops

Regional officesImperial County1405 North Imperial AvenueSuite 1 El Centro, CA 92243 Phone: (760) 353-7800 Fax: (760) 353-1877
Orange CountyOCTA Building 600 South Main Street9th Floor Orange, CA 92863 Phone: (714) 542-3687 Fax: (714) 560-5089
Riverside County3403 10th StreetSuite 805 Riverside, CA 92501 Phone: (951) 784-1513 Fax: (951) 784-3925
San Bernardino CountySanta Fe Depot 1170 West 3rd StreetSuite 140 San Bernardino, CA 92418 Phone: (909) 806-3556 Fax: (909) 806-3572
Ventura County950 County Square DriveSuite 101 Ventura, CA 93003 Phone: (805) 642-2800 Fax: (805) 642-2260
818 West 7th Street, 12th Floor Los Angeles, CA 90017 Phone: (213) 236-1800 Fax: (213) 236-1825www.scag.ca.gov
please recycle 2347 12.20.2011