2012-2035 rtp/scs highways and arterials
TRANSCRIPT
ADOPTED APRIL 2012
Southern California Association of Governments
hIghwAys AnD ARTERIALsAPPEnDIx

hIghwAys AnD ARTERIALs
Programmed Commitments 1
Additional County Commitments 3
System Preservation 9
Aging Infrastructure 9
Corridor System Management Plans 12
Express/High-Occupancy Toll (HOT) Lane Network 15
Arterials 17
Performance Results 21
Person Delay by Facility Type (Mixed Flow Freeways, HOV, Arterials) 21
Person Delay per Capita 22
Truck Delay by Facility Type (Highway, Arterials) 22
Non-Recurrent Delay 23
Appendix 26
Network Statistics 46
Trip Statistics 50
Mobility Statistics 51
Highways and Arterials 1
Southern California’s highway and arterial system extends for 12,630 miles and serves 62 million trips each day. This roadway system is the backbone of the region’s economic well-being, and facilitates the movement of people and goods via multiple modes of transportation, including public transit, and active
transportation. According to the Southern California Association of Governments’ (SCAG) Regional Travel Demand Model (RTDM), nine out of every ten trips relies either entirely or in part on the highway and arterial system.
Despite the importance of the system, improvements have not kept pace with the region’s increasing population and transportation demand. As a result, the region’s traffic conges-tion has increased dramatically, leading to a less productive transportation system with negative consequences such as wasted time and fuel and poor air quality.
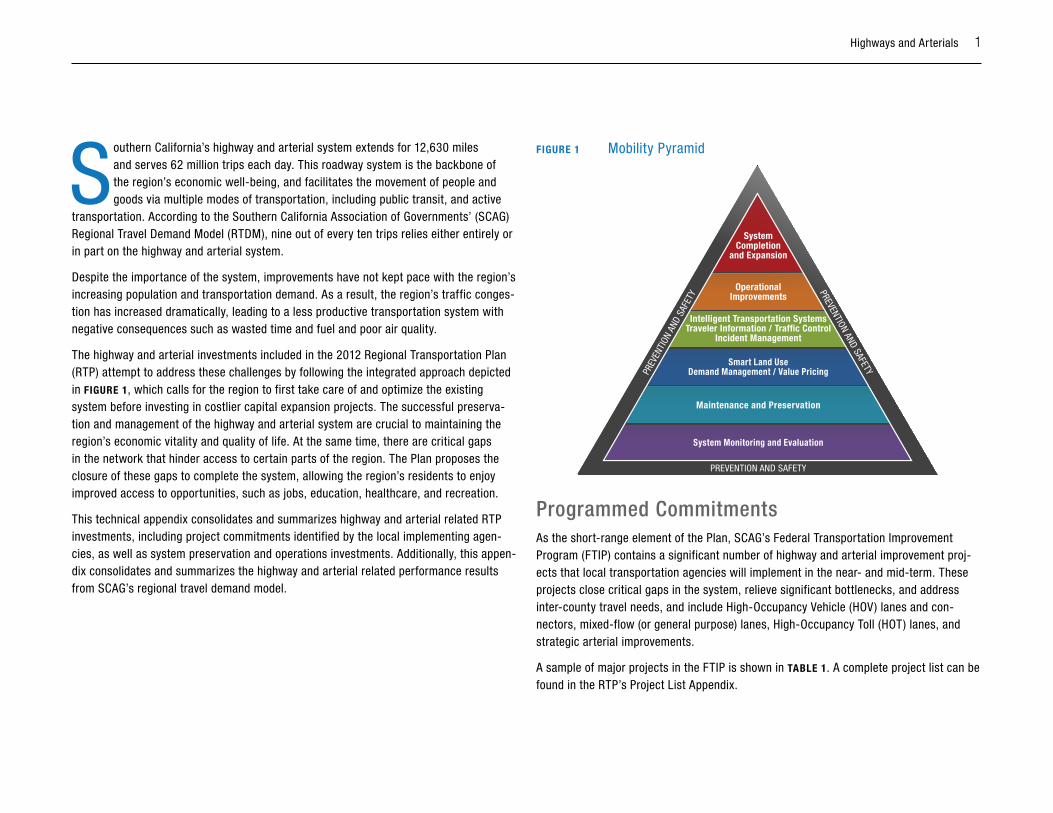
The highway and arterial investments included in the 2012 Regional Transportation Plan (RTP) attempt to address these challenges by following the integrated approach depicted in FiguRE 1, which calls for the region to first take care of and optimize the existing system before investing in costlier capital expansion projects. The successful preserva-tion and management of the highway and arterial system are crucial to maintaining the region’s economic vitality and quality of life. At the same time, there are critical gaps in the network that hinder access to certain parts of the region. The Plan proposes the closure of these gaps to complete the system, allowing the region’s residents to enjoy improved access to opportunities, such as jobs, education, healthcare, and recreation.
This technical appendix consolidates and summarizes highway and arterial related RTP investments, including project commitments identified by the local implementing agen-cies, as well as system preservation and operations investments. Additionally, this appen-dix consolidates and summarizes the highway and arterial related performance results from SCAG’s regional travel demand model.
FiguRE 1 Mobility Pyramid
SystemCompletion
and Expansion
Smart Land UseDemand Management / Value Pricing
Maintenance and Preservation
System Monitoring and Evaluation
OperationalImprovements
PREVENTION AND SAFETY
PREVENTION AND SAFETYPREV
ENTI
ON A
ND S
AFET
Y
Intelligent Transportation SystemsTraveler Information / Traffic Control
Incident Management
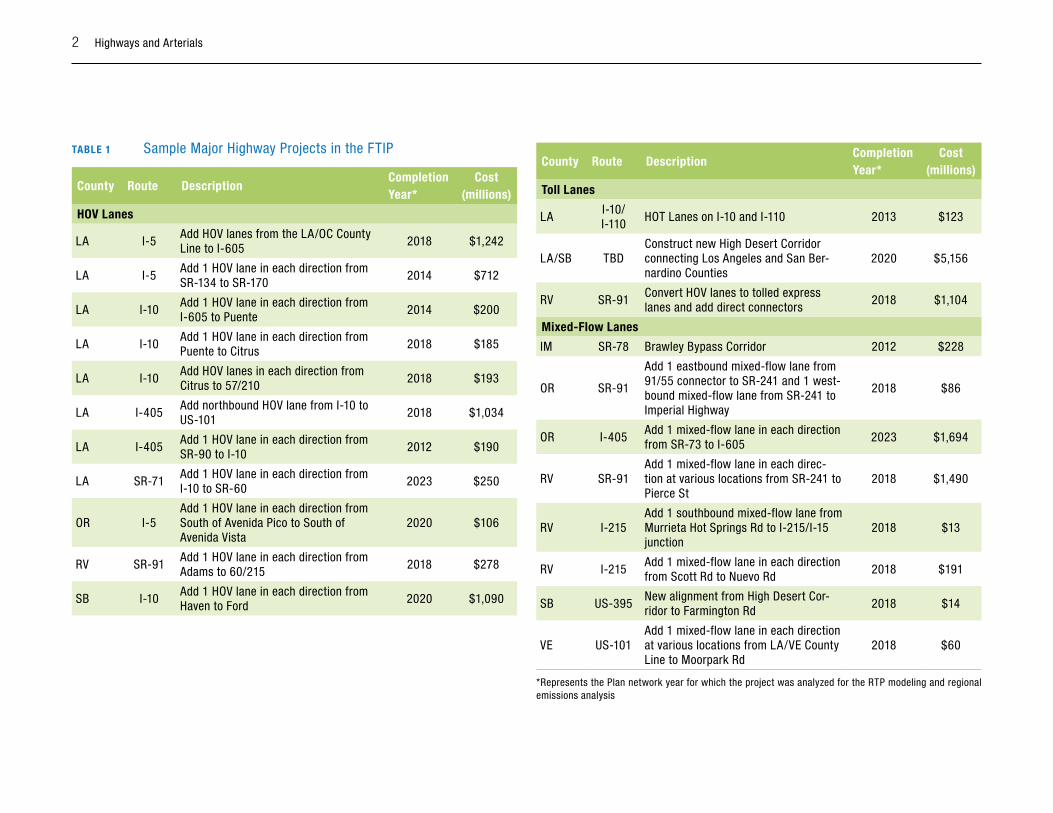
Programmed CommitmentsAs the short-range element of the Plan, SCAG’s Federal Transportation Improvement Program (FTIP) contains a significant number of highway and arterial improvement proj-ects that local transportation agencies will implement in the near- and mid-term. These projects close critical gaps in the system, relieve significant bottlenecks, and address inter-county travel needs, and include High-Occupancy Vehicle (HOV) lanes and con-nectors, mixed-flow (or general purpose) lanes, High-Occupancy Toll (HOT) lanes, and strategic arterial improvements.
A sample of major projects in the FTIP is shown in TAbLE 1. A complete project list can be found in the RTP’s Project List Appendix.
2 Highways and Arterials
TAbLE 1 Sample Major Highway Projects in the FTIP
County Route DescriptionCompletion Year*
Cost(millions)
HOV Lanes
LA I-5Add HOV lanes from the LA/OC County Line to I-605
2018 $1,242
LA I-5Add 1 HOV lane in each direction from SR-134 to SR-170
2014 $712
LA I-10Add 1 HOV lane in each direction from I-605 to Puente
2014 $200
LA I-10Add 1 HOV lane in each direction from Puente to Citrus
2018 $185
LA I-10Add HOV lanes in each direction from Citrus to 57/210
2018 $193
LA I-405Add northbound HOV lane from I-10 to US-101
2018 $1,034
LA I-405Add 1 HOV lane in each direction from SR-90 to I-10
2012 $190
LA SR-71Add 1 HOV lane in each direction from I-10 to SR-60
2023 $250
OR I-5Add 1 HOV lane in each direction from South of Avenida Pico to South of Avenida Vista
2020 $106
RV SR-91Add 1 HOV lane in each direction from Adams to 60/215
2018 $278
SB I-10Add 1 HOV lane in each direction from Haven to Ford
2020 $1,090
County Route DescriptionCompletion Year*
Cost(millions)
Toll Lanes
LAI-10/I-110
HOT Lanes on I-10 and I-110 2013 $123
LA/SB TBDConstruct new High Desert Corridor connecting Los Angeles and San Ber-nardino Counties
2020 $5,156
RV SR-91Convert HOV lanes to tolled express lanes and add direct connectors
2018 $1,104
Mixed-Flow Lanes
IM SR-78 Brawley Bypass Corridor 2012 $228
OR SR-91
Add 1 eastbound mixed-flow lane from 91/55 connector to SR-241 and 1 west-bound mixed-flow lane from SR-241 to Imperial Highway
2018 $86
OR I-405Add 1 mixed-flow lane in each direction from SR-73 to I-605
2023 $1,694
RV SR-91Add 1 mixed-flow lane in each direc-tion at various locations from SR-241 to Pierce St
2018 $1,490
RV I-215Add 1 southbound mixed-flow lane from Murrieta Hot Springs Rd to I-215/I-15 junction
2018 $13
RV I-215Add 1 mixed-flow lane in each direction from Scott Rd to Nuevo Rd
2018 $191
SB US-395New alignment from High Desert Cor-ridor to Farmington Rd
2018 $14
VE US-101Add 1 mixed-flow lane in each direction at various locations from LA/VE County Line to Moorpark Rd
2018 $60
*Represents the Plan network year for which the project was analyzed for the RTP modeling and regional emissions analysis
Highways and Arterials 3
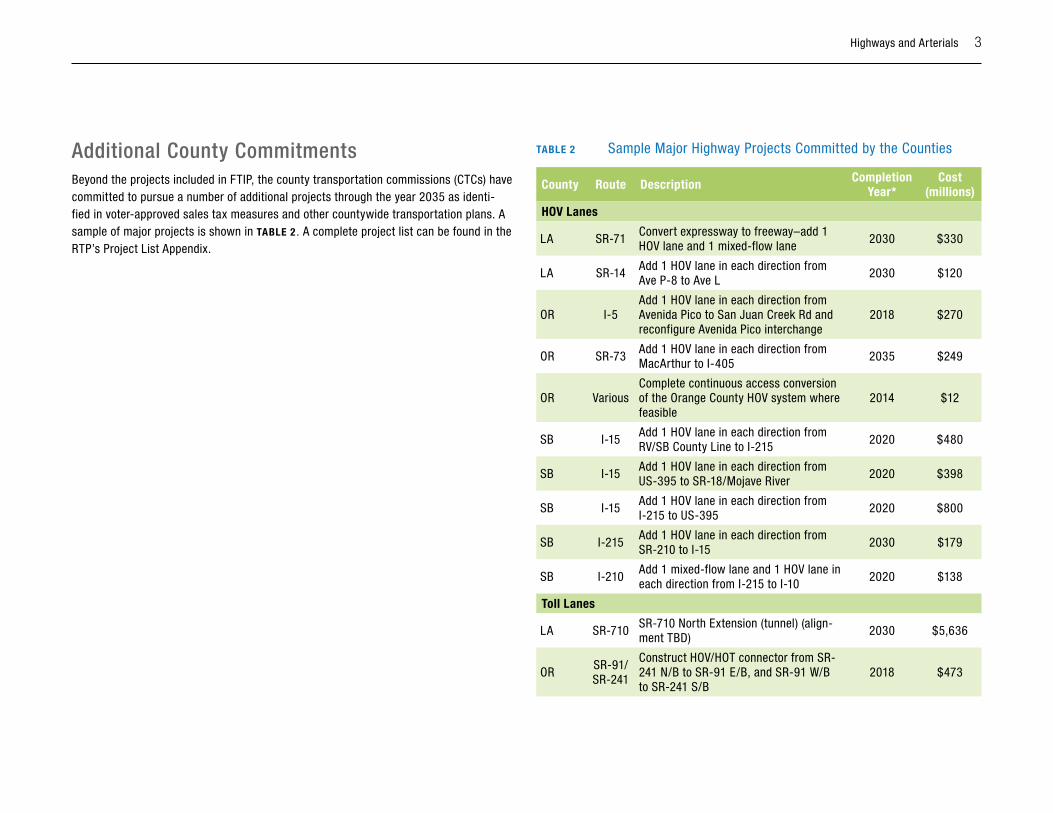
Additional County CommitmentsBeyond the projects included in FTIP, the county transportation commissions (CTCs) have committed to pursue a number of additional projects through the year 2035 as identi-fied in voter-approved sales tax measures and other countywide transportation plans. A sample of major projects is shown in TAbLE 2 . A complete project list can be found in the RTP’s Project List Appendix.
TAbLE 2 Sample Major Highway Projects Committed by the Counties
County Route Description Completion Year*
Cost(millions)
HOV Lanes
LA SR-71Convert expressway to freeway–add 1 HOV lane and 1 mixed-flow lane
2030 $330
LA SR-14Add 1 HOV lane in each direction from Ave P-8 to Ave L
2030 $120
OR I-5Add 1 HOV lane in each direction from Avenida Pico to San Juan Creek Rd and reconfigure Avenida Pico interchange
2018 $270
OR SR-73Add 1 HOV lane in each direction from MacArthur to I-405
2035 $249
OR VariousComplete continuous access conversion of the Orange County HOV system where feasible
2014 $12
SB I-15Add 1 HOV lane in each direction from RV/SB County Line to I-215
2020 $480
SB I-15Add 1 HOV lane in each direction from US-395 to SR-18/Mojave River
2020 $398
SB I-15Add 1 HOV lane in each direction from I-215 to US-395
2020 $800
SB I-215Add 1 HOV lane in each direction from SR-210 to I-15
2030 $179
SB I-210Add 1 mixed-flow lane and 1 HOV lane in each direction from I-215 to I-10
2020 $138
Toll Lanes
LA SR-710SR-710 North Extension (tunnel) (align-ment TBD)
2030 $5,636
ORSR-91/SR-241
Construct HOV/HOT connector from SR-241 N/B to SR-91 E/B, and SR-91 W/B to SR-241 S/B
2018 $473
4 Highways and Arterials
County Route Description Completion Year*
Cost(millions)
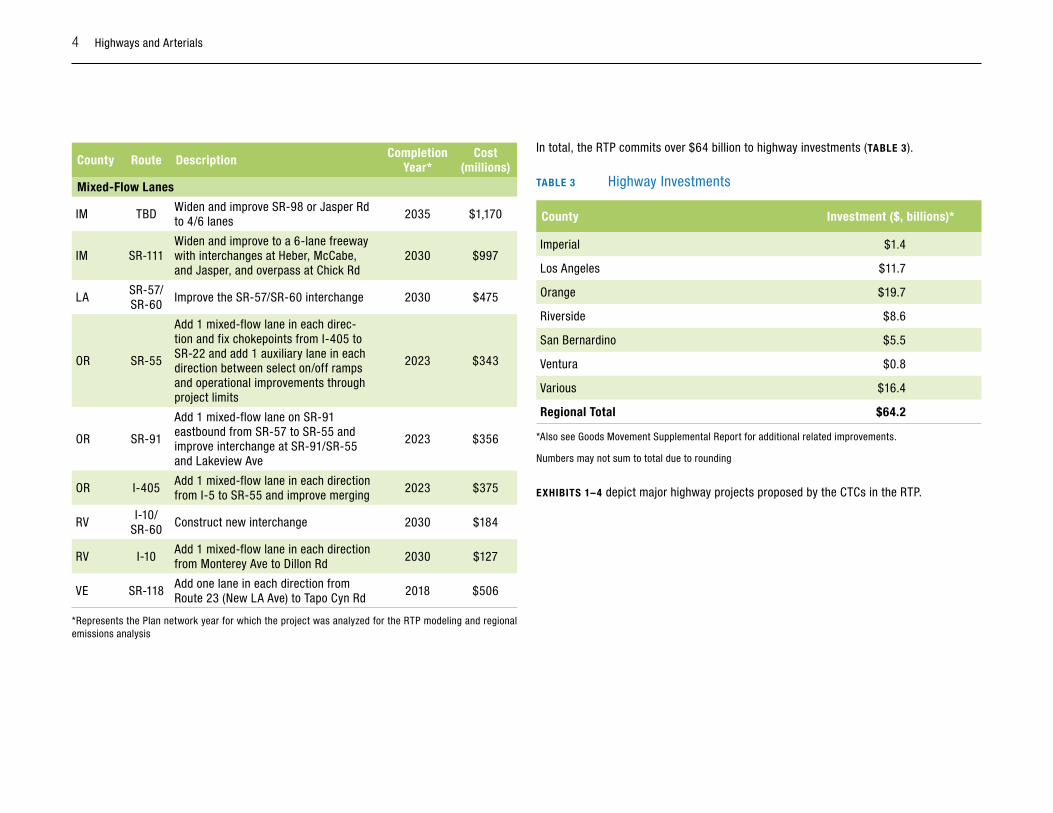
Mixed-Flow Lanes
IM TBDWiden and improve SR-98 or Jasper Rd to 4/6 lanes
2035 $1,170
IM SR-111Widen and improve to a 6-lane freeway with interchanges at Heber, McCabe, and Jasper, and overpass at Chick Rd
2030 $997
LASR-57/SR-60
Improve the SR-57/SR-60 interchange 2030 $475
OR SR-55
Add 1 mixed-flow lane in each direc-tion and fix chokepoints from I-405 to SR-22 and add 1 auxiliary lane in each direction between select on/off ramps and operational improvements through project limits
2023 $343
OR SR-91
Add 1 mixed-flow lane on SR-91 eastbound from SR-57 to SR-55 and improve interchange at SR-91/SR-55 and Lakeview Ave
2023 $356
OR I-405Add 1 mixed-flow lane in each direction from I-5 to SR-55 and improve merging
2023 $375
RVI-10/
SR-60Construct new interchange 2030 $184
RV I-10Add 1 mixed-flow lane in each direction from Monterey Ave to Dillon Rd
2030 $127
VE SR-118Add one lane in each direction from Route 23 (New LA Ave) to Tapo Cyn Rd
2018 $506
*Represents the Plan network year for which the project was analyzed for the RTP modeling and regional emissions analysis
In total, the RTP commits over $64 billion to highway investments (TAbLE 3).
TAbLE 3 Highway Investments
County investment ($, billions)*
Imperial $1.4
Los Angeles $11.7
Orange $19.7
Riverside $8.6
San Bernardino $5.5
Ventura $0.8
Various $16.4
Regional Total $64.2
*Also see Goods Movement Supplemental Report for additional related improvements.
Numbers may not sum to total due to rounding
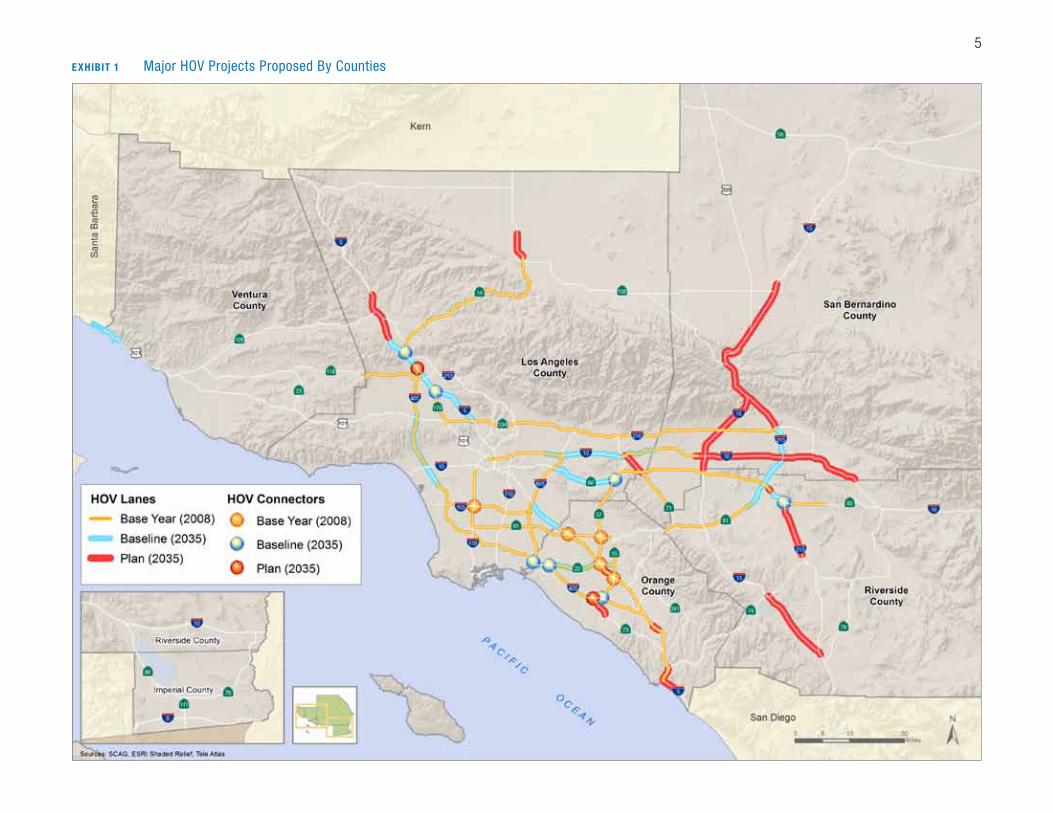
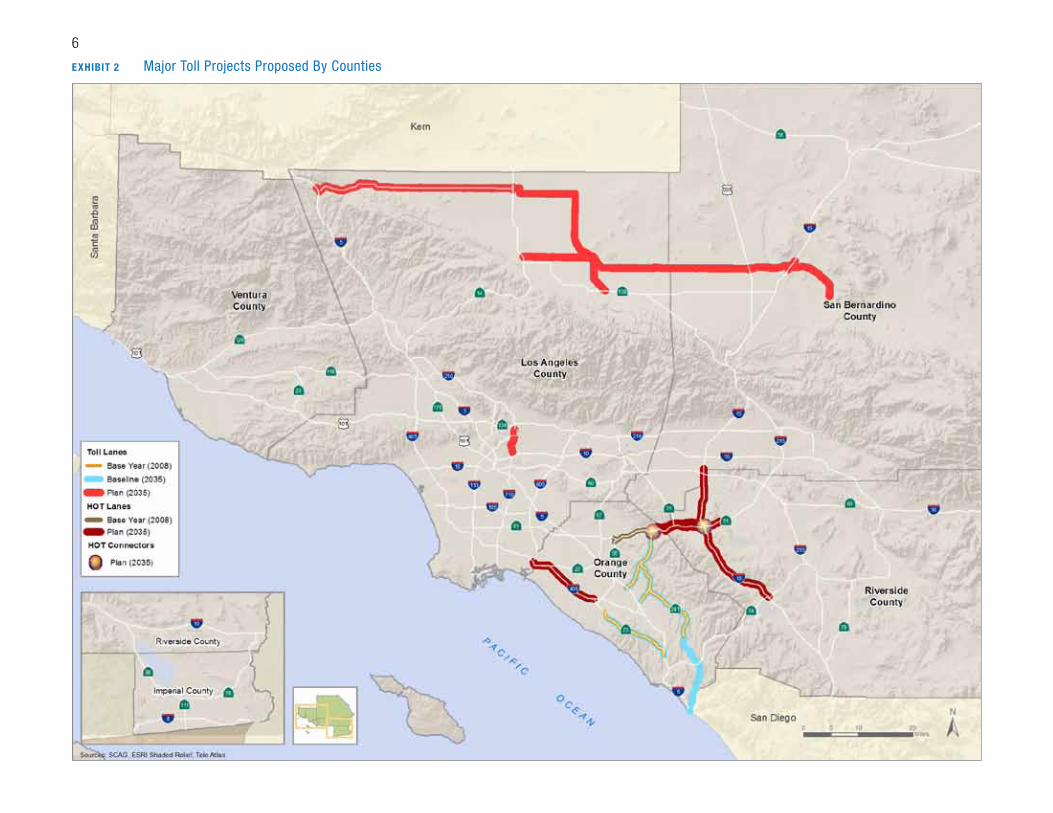
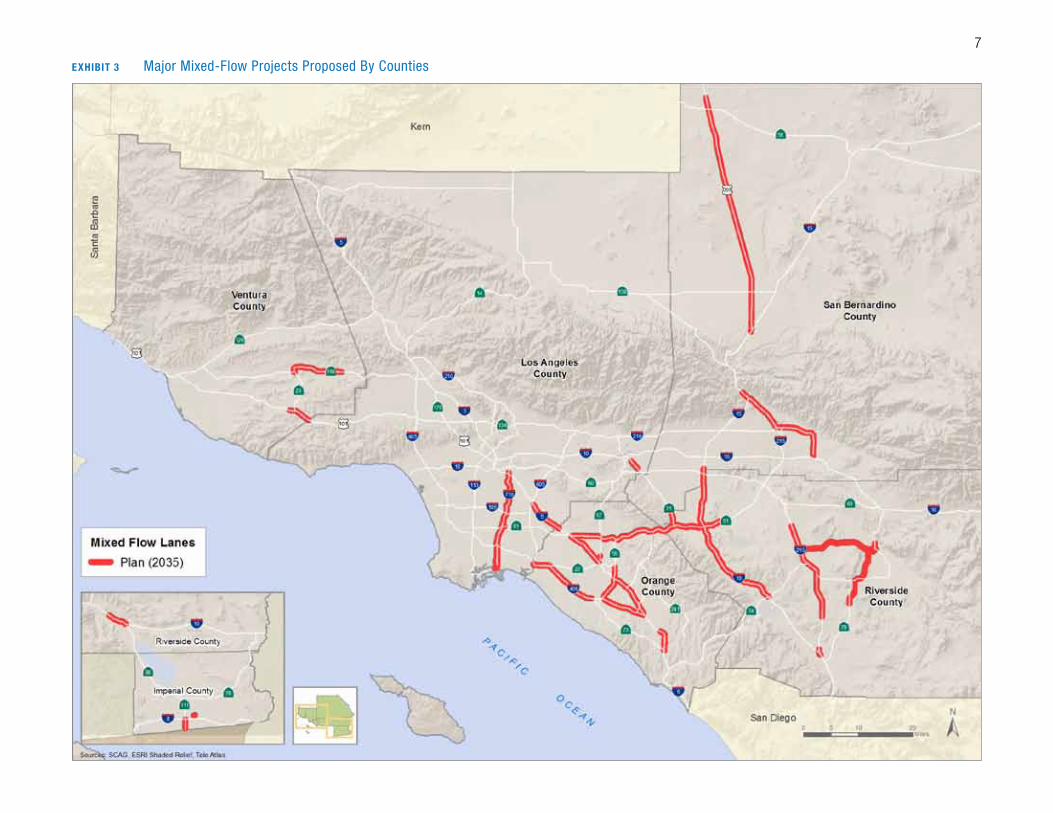
ExHibiTS 1–4 depict major highway projects proposed by the CTCs in the RTP.
5
ExHibiT 1 Major HOV Projects Proposed By Counties
6
ExHibiT 2 Major Toll Projects Proposed By Counties
7
ExHibiT 3 Major Mixed-Flow Projects Proposed By Counties
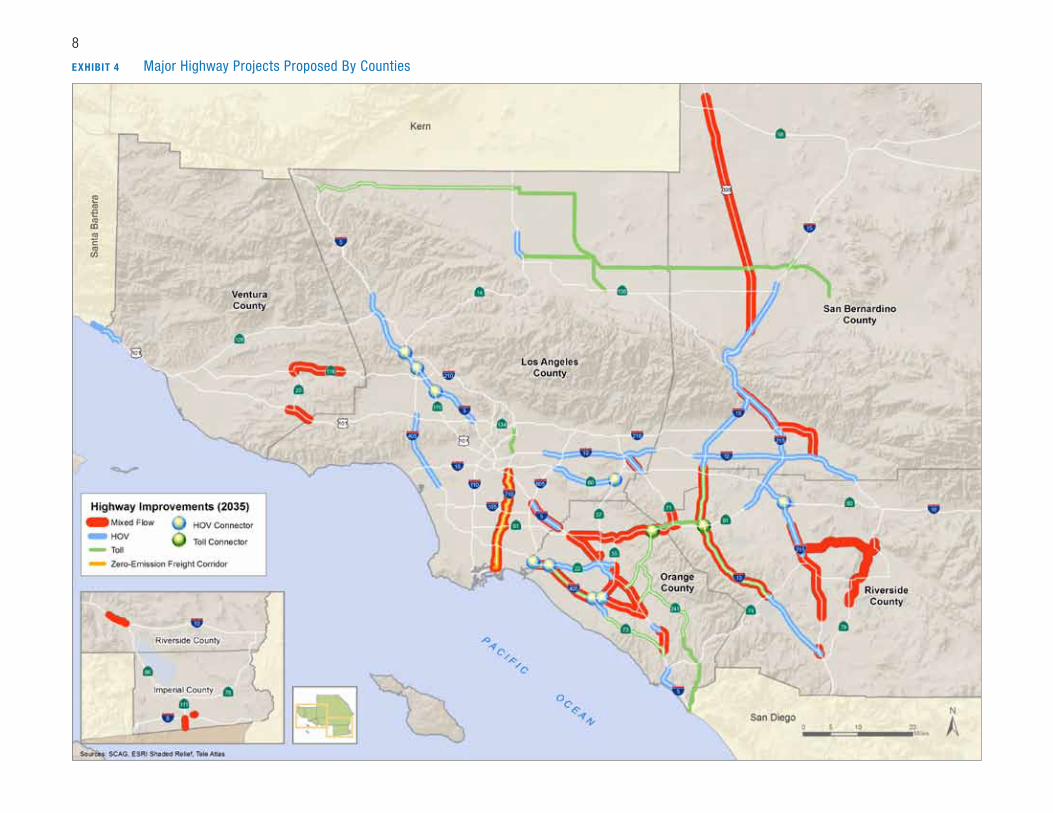
8
ExHibiT 4 Major Highway Projects Proposed By Counties
Highways and Arterials 9
system Preservation
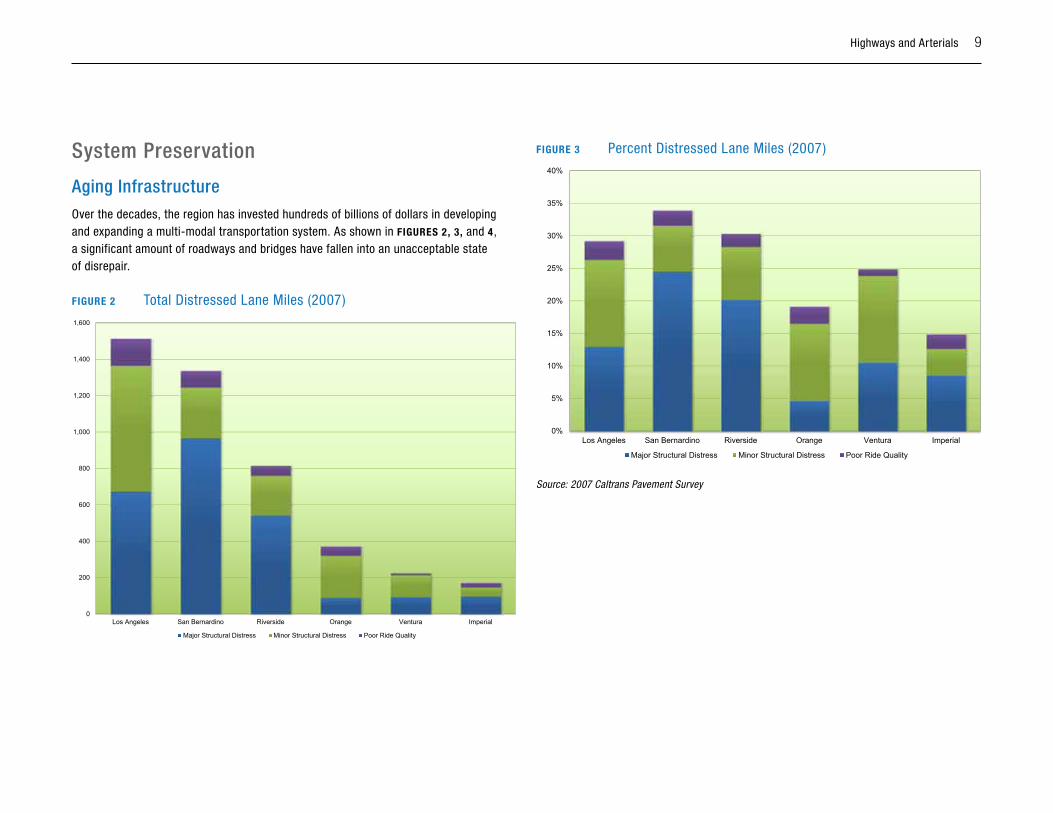
Aging InfrastructureOver the decades, the region has invested hundreds of billions of dollars in developing and expanding a multi-modal transportation system. As shown in FiguRES 2, 3, and 4, a significant amount of roadways and bridges have fallen into an unacceptable state of disrepair.
FiguRE 2 Total Distressed Lane Miles (2007)
0
200
400
600
800
1,000
1,200
1,400
1,600
Los Angeles San Bernardino Riverside Orange Ventura Imperial
Major Structural Distress Minor Structural Distress Poor Ride Quality
FiguRE 3 Percent Distressed Lane Miles (2007)
0%
5%
10%
15%
20%
25%
30%
35%
40%
Los Angeles San Bernardino Riverside Orange Ventura Imperial
Major Structural Distress Minor Structural Distress Poor Ride Quality
Source: 2007 Caltrans Pavement Survey
10 Highways and Arterials
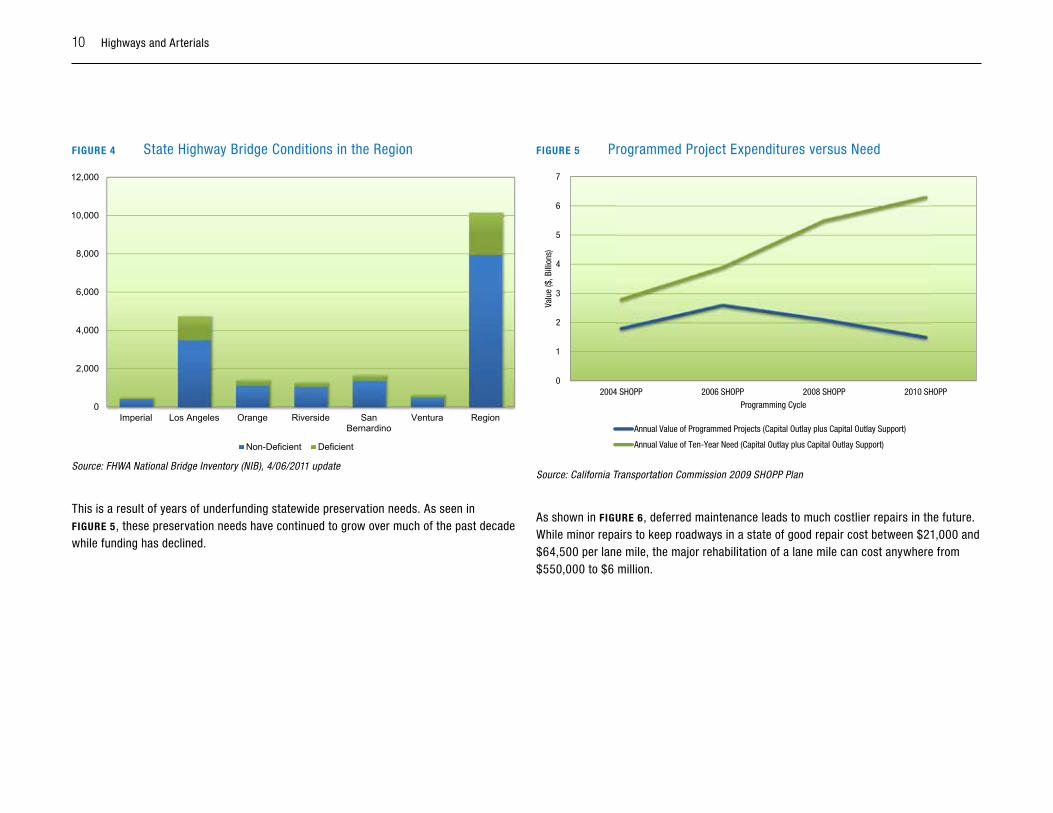
FiguRE 4 State Highway Bridge Conditions in the Region
0
2,000
4,000
6,000
8,000
10,000
12,000
Imperial Los Angeles Orange Riverside SanBernardino
Ventura Region
Non-Deficient Deficient
Source: FHWA National Bridge Inventory (NIB), 4/06/2011 update
This is a result of years of underfunding statewide preservation needs. As seen in FiguRE 5, these preservation needs have continued to grow over much of the past decade while funding has declined.
FiguRE 5 Programmed Project Expenditures versus Need
0
1
2
3
4
5
6
7
2004 SHOPP 2006 SHOPP 2008 SHOPP 2010 SHOPP
Valu
e ($
, Bill
ions
)
Programming Cycle
Annual Value of Programmed Projects (Capital Outlay plus Capital Outlay Support)
Annual Value of Ten-Year Need (Capital Outlay plus Capital Outlay Support)
Source: California Transportation Commission 2009 SHOPP Plan
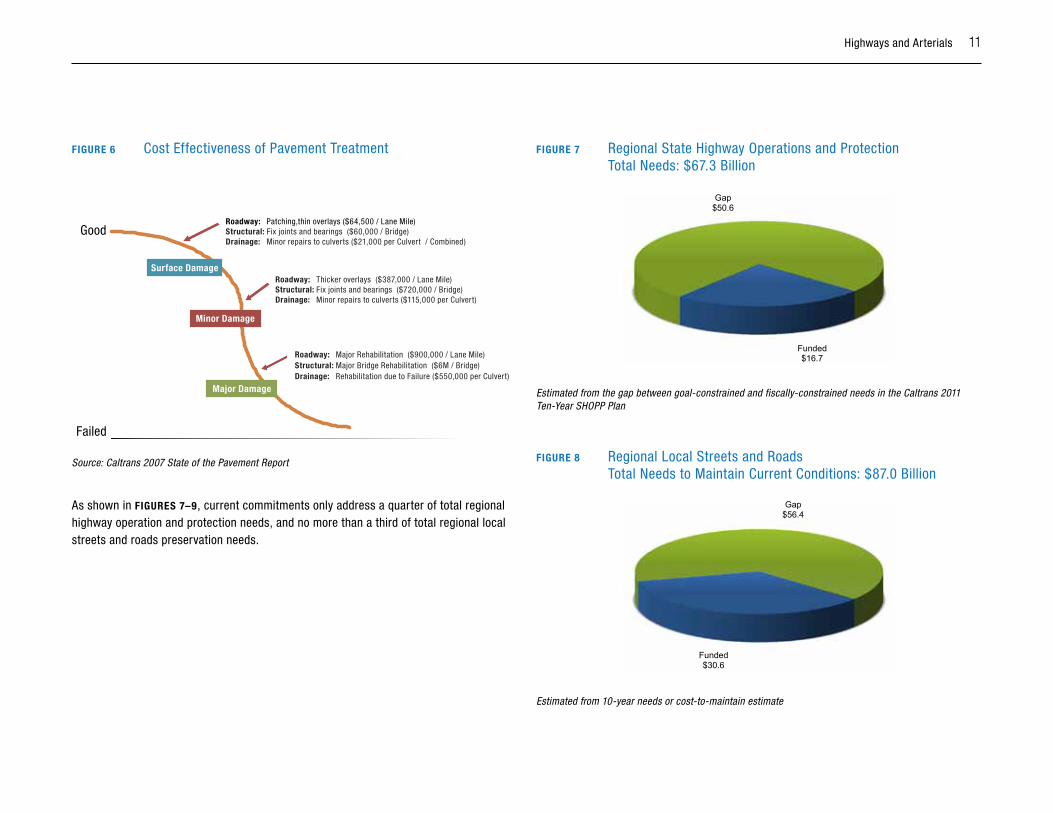
As shown in FiguRE 6, deferred maintenance leads to much costlier repairs in the future. While minor repairs to keep roadways in a state of good repair cost between $21,000 and $64,500 per lane mile, the major rehabilitation of a lane mile can cost anywhere from $550,000 to $6 million.
Highways and Arterials 11
FiguRE 6 Cost Effectiveness of Pavement Treatment
Good
Failed
Surface Damage
Minor Damage
Major Damage
Roadway: Patching,thin overlays ($64,500 / Lane Mile)Structural: Fix joints and bearings ($60,000 / Bridge)Drainage: Minor repairs to culverts ($21,000 per Culvert / Combined)
Roadway: Thicker overlays ($387,000 / Lane Mile)Structural: Fix joints and bearings ($720,000 / Bridge)Drainage: Minor repairs to culverts ($115,000 per Culvert)
Roadway: Major Rehabilitation ($900,000 / Lane Mile)Structural: Major Bridge Rehabilitation ($6M / Bridge)Drainage: Rehabilitation due to Failure ($550,000 per Culvert)
Source: Caltrans 2007 State of the Pavement Report
As shown in FiguRES 7–9, current commitments only address a quarter of total regional highway operation and protection needs, and no more than a third of total regional local streets and roads preservation needs.
FiguRE 7 Regional State Highway Operations and Protection Total Needs: $67.3 Billion
Funded$16.7
Gap$50.6
Estimated from the gap between goal-constrained and fiscally-constrained needs in the Caltrans 2011 Ten-Year SHOPP Plan
FiguRE 8 Regional Local Streets and Roads Total Needs to Maintain Current Conditions: $87.0 Billion
Funded$30.6
Gap$56.4
Estimated from 10-year needs or cost-to-maintain estimate

12 Highways and Arterials
FiguRE 9 Regional Local Streets and Roads Total Needs to Bring the System to a State of Good Repair: $101.4 Billion
Funded$30.6
Gap$70.8
Estimated from 10-year needs or cost-to-maintain estimate
As deferring maintenance will only increase this shortfall over time, preserving the region’s assets now is a critical priority of the 2012 RTP. The RTP commits $216.9 bil-lion (including $70 billion of new, reasonably available revenue) to system preservation to help achieve a state of good repair. As more funding becomes available, additional commitments may be made. These additional investments will ensure that over the next 25 years, the region’s transportation infrastructure will be in a better condition than it is today. This will also lower user costs in the future, such as vehicle maintenance costs.
SCAG will continue to work with its stakeholders, particularly the CTCs and Caltrans, to prioritize funding for preservation and maintenance.
Corridor system Management PlansAs discussed in the preceding section, the RTP identifies a comprehensive set of strate-gies that work in concert to optimize the performance of the transportation system. This set of strategies does not focus solely on expanding the system, but also considers how we operate the system; how we coordinate land use planning with transportation plan-ning; how we deal with incidents such as accidents or special events; how we provide information to the traveling public so they can make informed decisions about how, where, and when to travel; and how we maintain the system. All of these strategies are based on a foundation of comprehensive system monitoring so that we can understand how the transportation system is performing and where we need improvement. This approach is based in part on work that Caltrans has done for many years to optimize the performance of the state highway system.
With the passage of Proposition 1B by California voters in November 2006, a program of funding called the Corridor Mobility Improvement Account (CMIA) was created to improve the state highway system. The California Transportation Commission adopted guidelines for the CMIA program that required the development of Corridor System Management Plans (CSMPs) for those projects receiving CMIA funding, to ensure that mobility improve-ments would be maintained over time. The CSMPs developed in the SCAG region are identified in TAbLE 4 and ExHibiT 5. SCAG contributed funding towards the I-405 CSMP in Los Angeles County, as well as towards the I-210 CSMP undertaken as part of the Governor’s Go California initiative.
The intention of the CSMP effort is to continually monitor system performance and identify system improvements that are lower-cost, relatively quick to implement, and less capital-intensive than major corridor widening and expansion projects. In this manner, the CSMPs provide a framework for long-term corridor management, with a focus on operational improvements.
Highways and Arterials 13
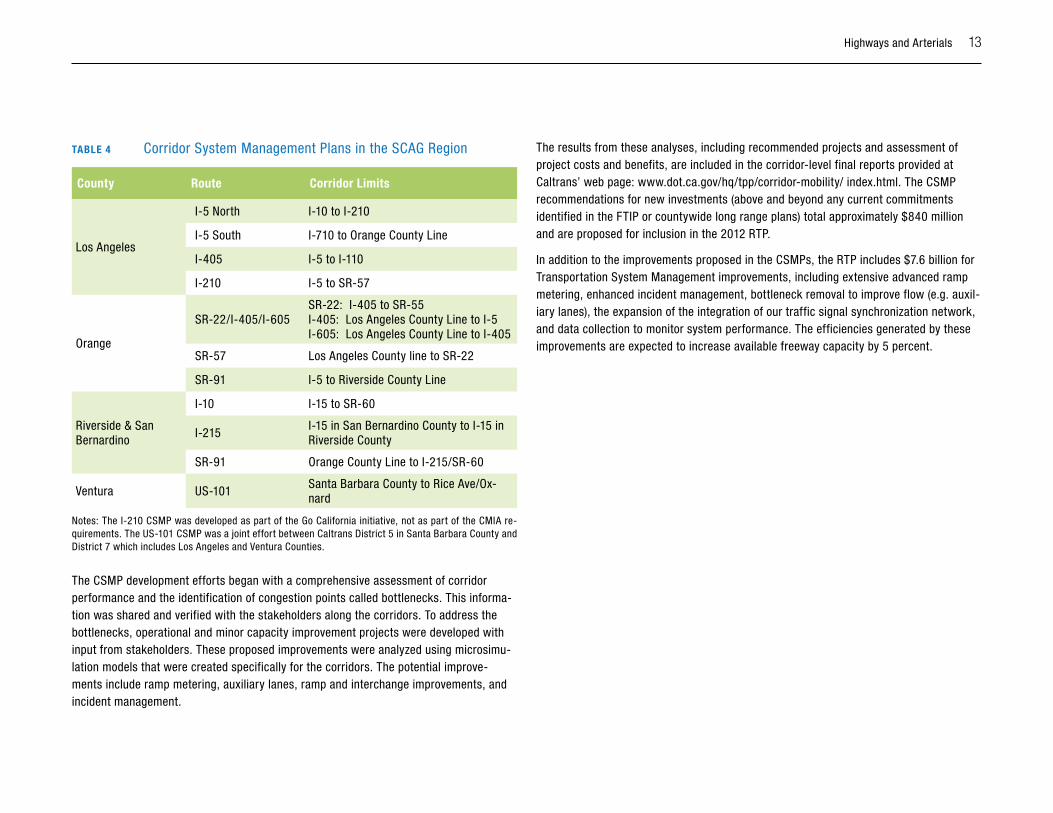
TAbLE 4 Corridor System Management Plans in the SCAG Region
County Route Corridor Limits
Los Angeles
I-5 North I-10 to I-210
I-5 South I-710 to Orange County Line
I-405 I-5 to I-110
I-210 I-5 to SR-57
Orange
SR-22/I-405/I-605SR-22: I-405 to SR-55 I-405: Los Angeles County Line to I-5 I-605: Los Angeles County Line to I-405
SR-57 Los Angeles County line to SR-22
SR-91 I-5 to Riverside County Line
Riverside & San Bernardino
I-10 I-15 to SR-60
I-215I-15 in San Bernardino County to I-15 in Riverside County
SR-91 Orange County Line to I-215/SR-60
Ventura US-101Santa Barbara County to Rice Ave/Ox-nard
Notes: The I-210 CSMP was developed as part of the Go California initiative, not as part of the CMIA re-quirements. The US-101 CSMP was a joint effort between Caltrans District 5 in Santa Barbara County and District 7 which includes Los Angeles and Ventura Counties.
The CSMP development efforts began with a comprehensive assessment of corridor performance and the identification of congestion points called bottlenecks. This informa-tion was shared and verified with the stakeholders along the corridors. To address the bottlenecks, operational and minor capacity improvement projects were developed with input from stakeholders. These proposed improvements were analyzed using microsimu-lation models that were created specifically for the corridors. The potential improve-ments include ramp metering, auxiliary lanes, ramp and interchange improvements, and incident management.
The results from these analyses, including recommended projects and assessment of project costs and benefits, are included in the corridor-level final reports provided at Caltrans’ web page: www.dot.ca.gov/hq/tpp/corridor-mobility/ index.html. The CSMP recommendations for new investments (above and beyond any current commitments identified in the FTIP or countywide long range plans) total approximately $840 million and are proposed for inclusion in the 2012 RTP.
In addition to the improvements proposed in the CSMPs, the RTP includes $7.6 billion for Transportation System Management improvements, including extensive advanced ramp metering, enhanced incident management, bottleneck removal to improve flow (e.g. auxil-iary lanes), the expansion of the integration of our traffic signal synchronization network, and data collection to monitor system performance. The efficiencies generated by these improvements are expected to increase available freeway capacity by 5 percent.
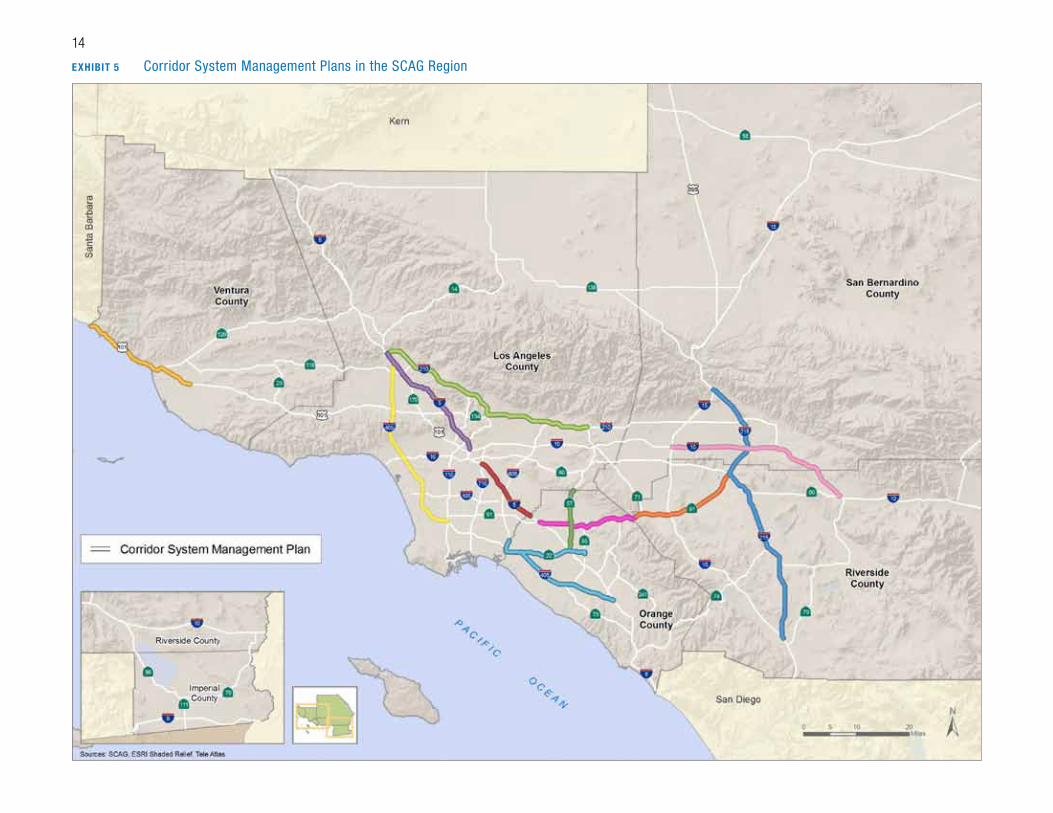
14
ExHibiT 5 Corridor System Management Plans in the SCAG Region
Highways and Arterials 15
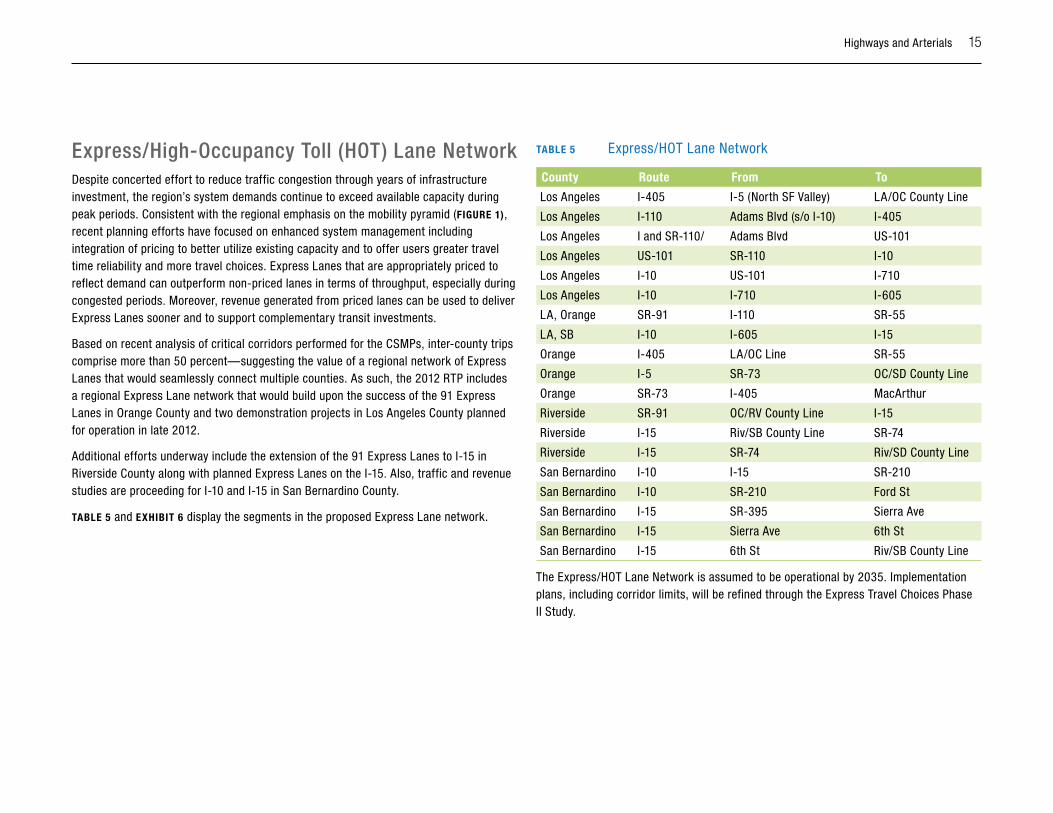
Express/high-Occupancy Toll (hOT) Lane networkDespite concerted effort to reduce traffic congestion through years of infrastructure investment, the region’s system demands continue to exceed available capacity during peak periods. Consistent with the regional emphasis on the mobility pyramid (FiguRE 1), recent planning efforts have focused on enhanced system management including integration of pricing to better utilize existing capacity and to offer users greater travel time reliability and more travel choices. Express Lanes that are appropriately priced to reflect demand can outperform non-priced lanes in terms of throughput, especially during congested periods. Moreover, revenue generated from priced lanes can be used to deliver Express Lanes sooner and to support complementary transit investments.
Based on recent analysis of critical corridors performed for the CSMPs, inter-county trips comprise more than 50 percent—suggesting the value of a regional network of Express Lanes that would seamlessly connect multiple counties. As such, the 2012 RTP includes a regional Express Lane network that would build upon the success of the 91 Express Lanes in Orange County and two demonstration projects in Los Angeles County planned for operation in late 2012.
Additional efforts underway include the extension of the 91 Express Lanes to I-15 in Riverside County along with planned Express Lanes on the I-15. Also, traffic and revenue studies are proceeding for I-10 and I-15 in San Bernardino County.
TAbLE 5 and ExHibiT 6 display the segments in the proposed Express Lane network.
TAbLE 5 Express/HOT Lane Network
County Route From To
Los Angeles I-405 I-5 (North SF Valley) LA/OC County Line
Los Angeles I-110 Adams Blvd (s/o I-10) I-405
Los Angeles I and SR-110/ Adams Blvd US-101
Los Angeles US-101 SR-110 I-10
Los Angeles I-10 US-101 I-710
Los Angeles I-10 I-710 I-605
LA, Orange SR-91 I-110 SR-55
LA, SB I-10 I-605 I-15
Orange I-405 LA/OC Line SR-55
Orange I-5 SR-73 OC/SD County Line
Orange SR-73 I-405 MacArthur
Riverside SR-91 OC/RV County Line I-15
Riverside I-15 Riv/SB County Line SR-74
Riverside I-15 SR-74 Riv/SD County Line
San Bernardino I-10 I-15 SR-210
San Bernardino I-10 SR-210 Ford St
San Bernardino I-15 SR-395 Sierra Ave
San Bernardino I-15 Sierra Ave 6th St
San Bernardino I-15 6th St Riv/SB County Line
The Express/HOT Lane Network is assumed to be operational by 2035. Implementation plans, including corridor limits, will be refined through the Express Travel Choices Phase II Study.

16
ExHibiT 6 Express/HOT Lane Network
Highways and Arterials 17
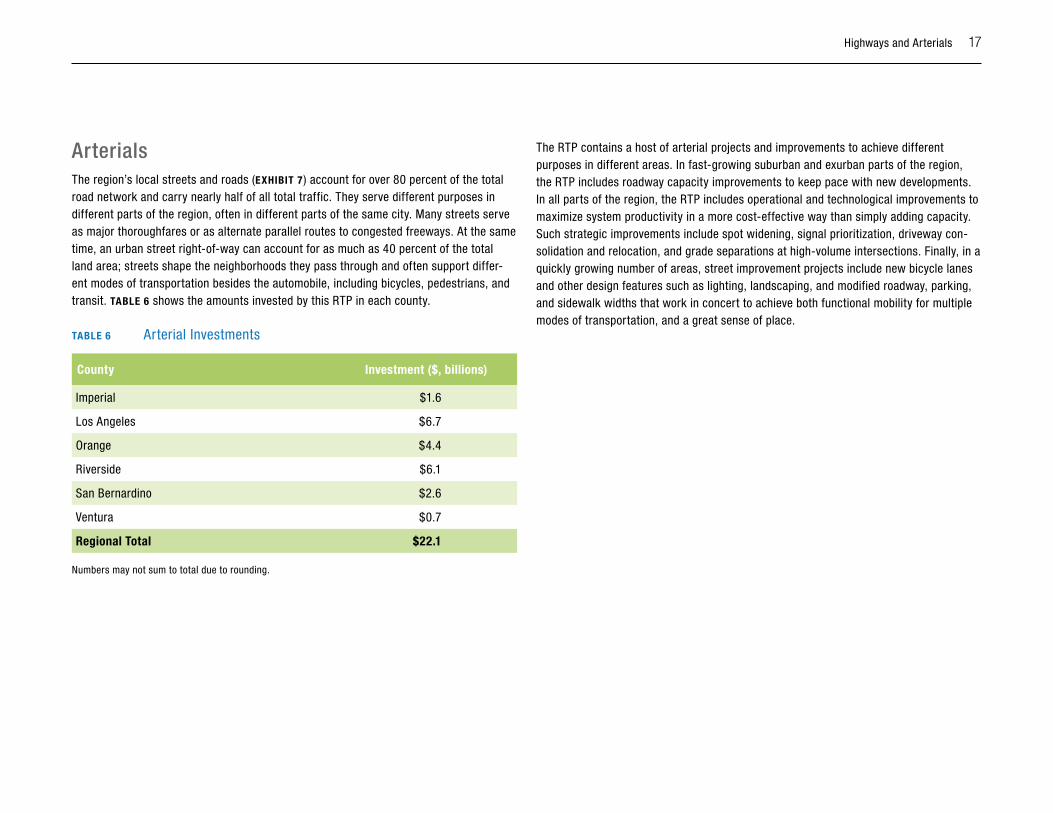
ArterialsThe region’s local streets and roads (ExHibiT 7) account for over 80 percent of the total road network and carry nearly half of all total traffic. They serve different purposes in different parts of the region, often in different parts of the same city. Many streets serve as major thoroughfares or as alternate parallel routes to congested freeways. At the same time, an urban street right-of-way can account for as much as 40 percent of the total land area; streets shape the neighborhoods they pass through and often support differ-ent modes of transportation besides the automobile, including bicycles, pedestrians, and transit. TAbLE 6 shows the amounts invested by this RTP in each county.
TAbLE 6 Arterial Investments
County investment ($, billions)
Imperial $1.6
Los Angeles $6.7
Orange $4.4
Riverside $6.1
San Bernardino $2.6
Ventura $0.7
Regional Total $22.1
Numbers may not sum to total due to rounding.
The RTP contains a host of arterial projects and improvements to achieve different purposes in different areas. In fast-growing suburban and exurban parts of the region, the RTP includes roadway capacity improvements to keep pace with new developments. In all parts of the region, the RTP includes operational and technological improvements to maximize system productivity in a more cost-effective way than simply adding capacity. Such strategic improvements include spot widening, signal prioritization, driveway con-solidation and relocation, and grade separations at high-volume intersections. Finally, in a quickly growing number of areas, street improvement projects include new bicycle lanes and other design features such as lighting, landscaping, and modified roadway, parking, and sidewalk widths that work in concert to achieve both functional mobility for multiple modes of transportation, and a great sense of place.
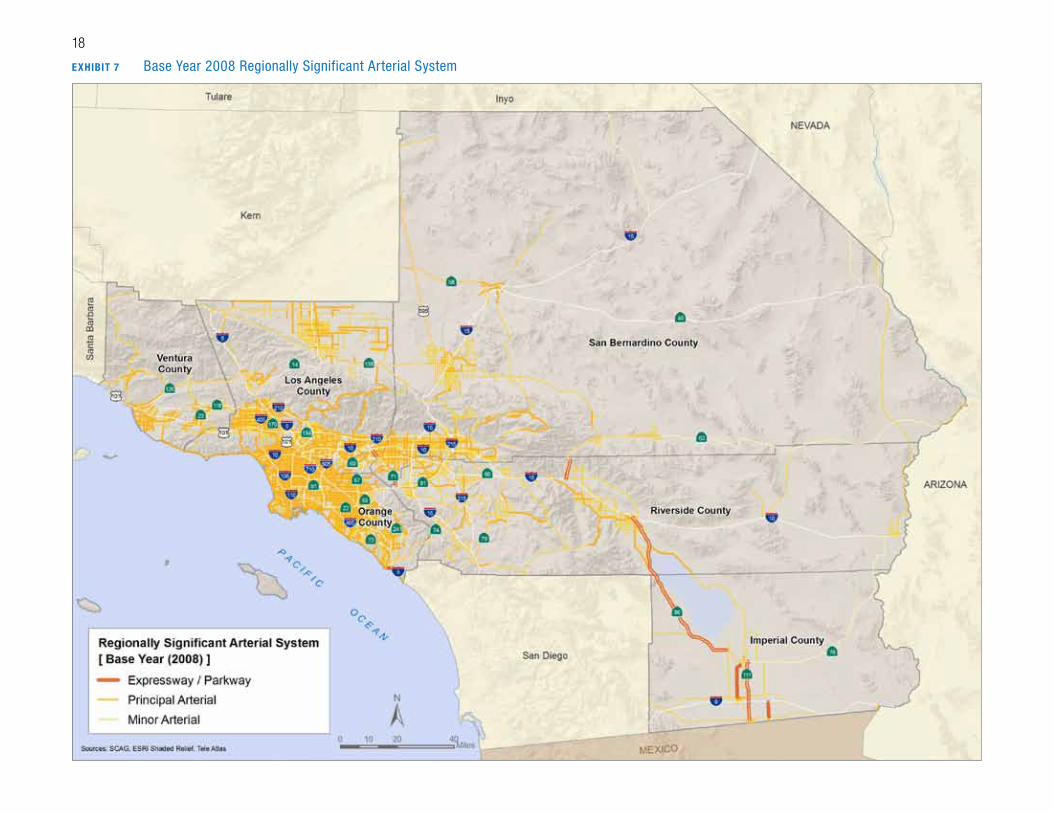
18
ExHibiT 7 Base Year 2008 Regionally Significant Arterial System

19
ExHibiT 8 Baseline 2035 Regionally Significant Arterial System
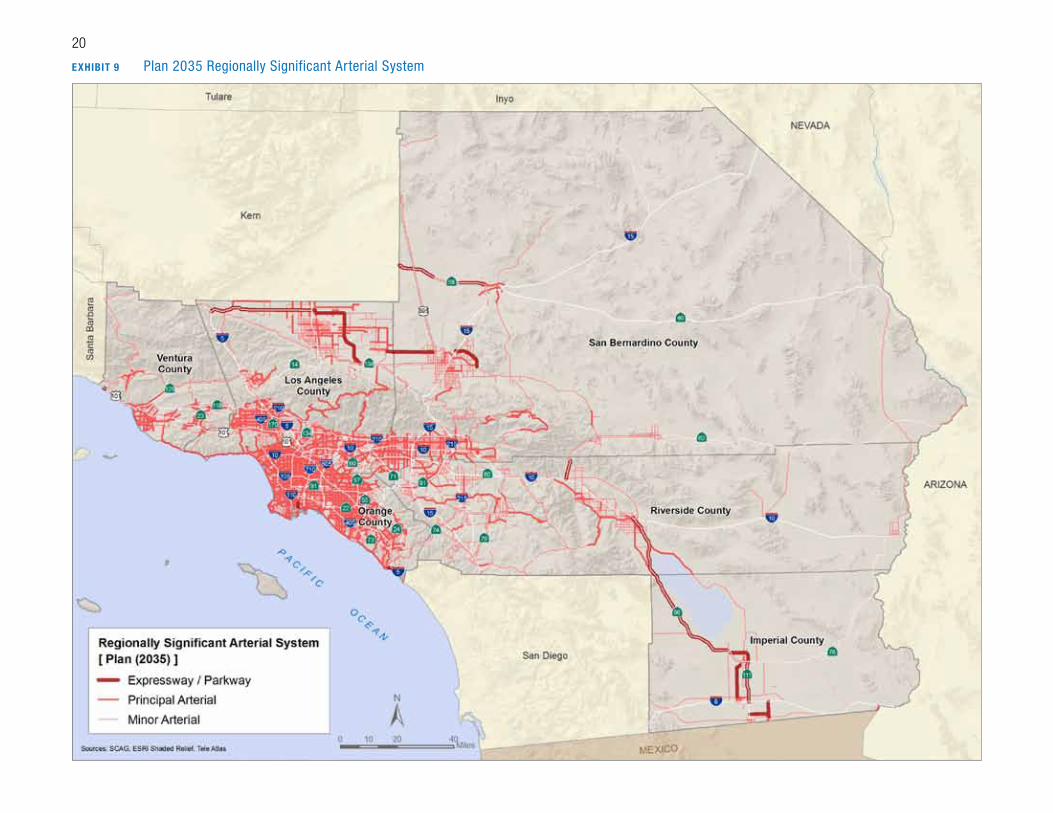
20
ExHibiT 9 Plan 2035 Regionally Significant Arterial System
Highways and Arterials 21
Performance ResultsThe RTP/SCS performance results for mobility are included in this report. A more com-plete discussion of all performance results for the RTP/SCS is contained in Chapter 5 of the main document and in the Performance Measures technical appendix.
The mobility performance measure relies on the commonly used measure of delay. Delay is the difference between the actual travel time and the travel time at some pre-defined reference or “optimal” speed for each mode alternative under analysis. It is measured in vehicle-hours of delay (VHD), which can then be used to derive person hours of delay.
The mobility measures used for this outcome are:
� Person Movement Delay by Facility Type (Mixed Flow, HOV, Arterials),
� Person Delay per Capita, and
� Truck delay by facility (Highway, Arterial).
One additional measure for delay that is readily available for on-going monitoring, but that cannot be readily forecast, is non-recurrent delay. Recurrent congestion is the day-to-day congestion that occurs because too many vehicles are on the road at the same time. Non-recurrent congestion is the congestion that is caused by accidents, weather, special events, or other atypical incidents.
Non-recurrent congestion can be mitigated or reduced by improving incident management strategies. Other smart uses of technologies such as traffic signal coordination and the provision of real-time information about unexpected delays allows travelers to make better decisions about available transit or other alternatives.
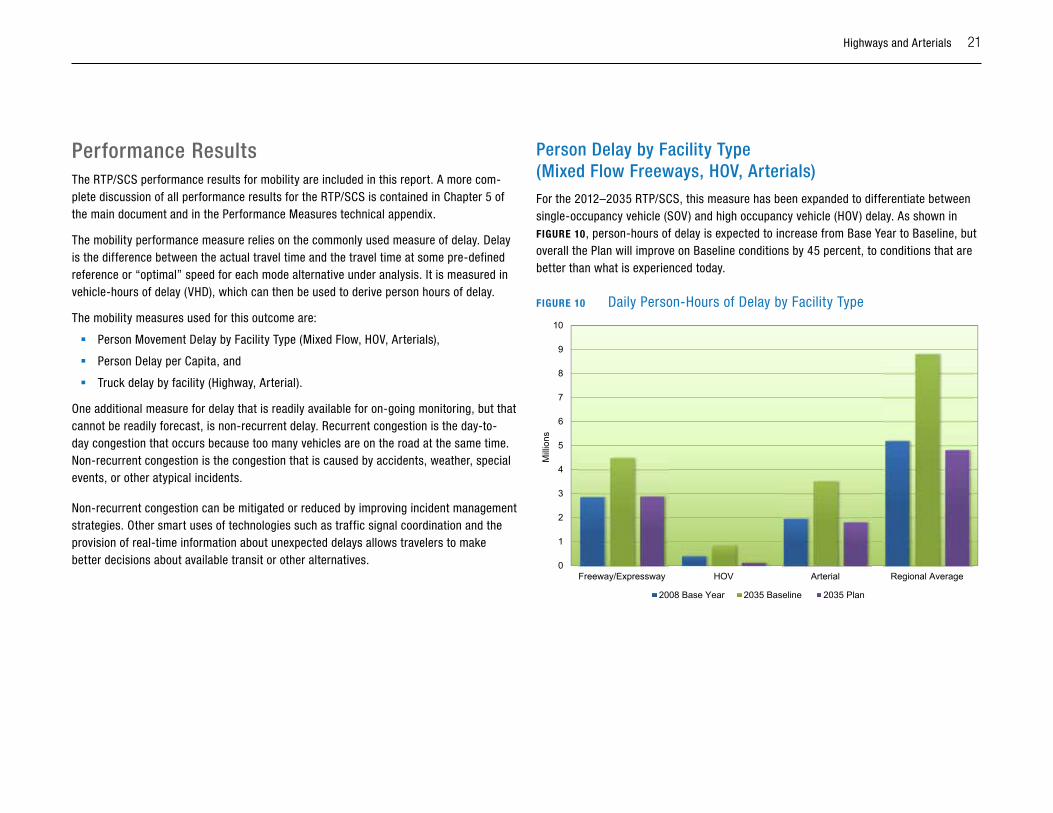
Person Delay by Facility Type (Mixed Flow Freeways, hOV, Arterials)For the 2012–2035 RTP/SCS, this measure has been expanded to differentiate between single-occupancy vehicle (SOV) and high occupancy vehicle (HOV) delay. As shown in FiguRE 10, person-hours of delay is expected to increase from Base Year to Baseline, but overall the Plan will improve on Baseline conditions by 45 percent, to conditions that are better than what is experienced today.
FiguRE 10 Daily Person-Hours of Delay by Facility Type
0
1
2
3
4
5
6
7
8
9
10
Freeway/Expressway HOV Arterial Regional Average
Mill
ions
2008 Base Year 2035 Baseline 2035 Plan
22 Highways and Arterials
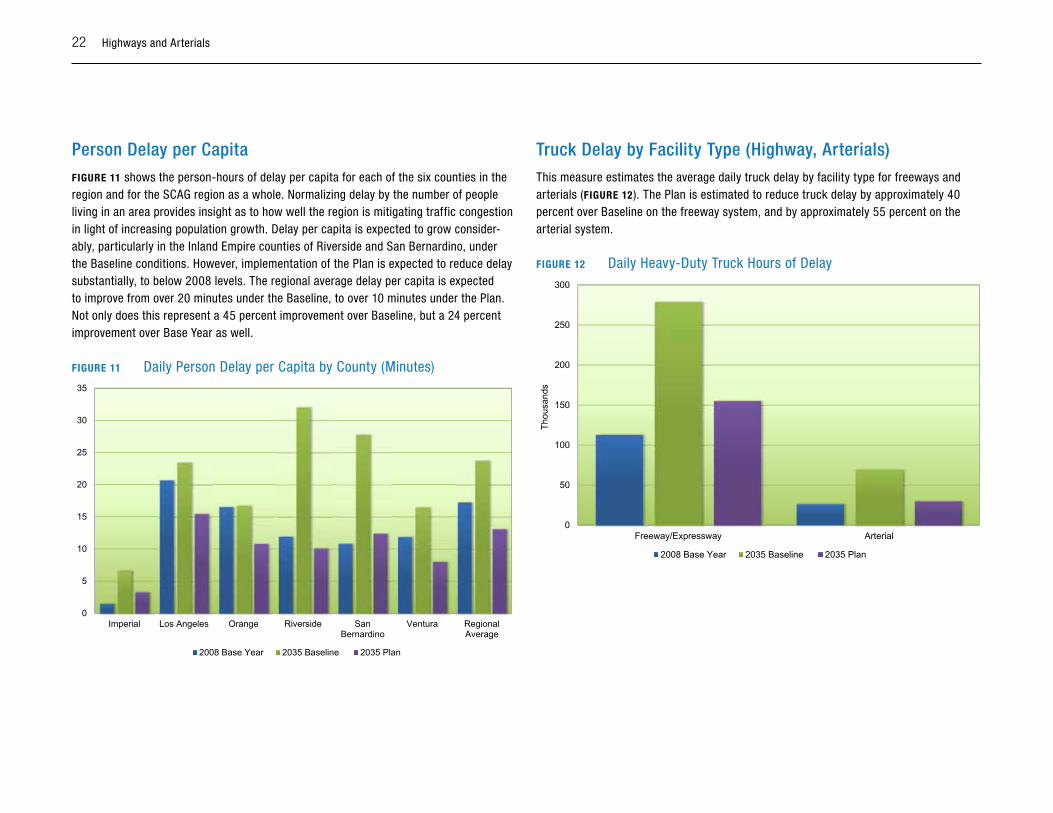
Person Delay per CapitaFiguRE 11 shows the person-hours of delay per capita for each of the six counties in the region and for the SCAG region as a whole. Normalizing delay by the number of people living in an area provides insight as to how well the region is mitigating traffic congestion in light of increasing population growth. Delay per capita is expected to grow consider-ably, particularly in the Inland Empire counties of Riverside and San Bernardino, under the Baseline conditions. However, implementation of the Plan is expected to reduce delay substantially, to below 2008 levels. The regional average delay per capita is expected to improve from over 20 minutes under the Baseline, to over 10 minutes under the Plan. Not only does this represent a 45 percent improvement over Baseline, but a 24 percent improvement over Base Year as well.
FiguRE 11 Daily Person Delay per Capita by County (Minutes)
0
5
10
15
20
25
30
35
Imperial Los Angeles Orange Riverside SanBernardino
Ventura RegionalAverage
2008 Base Year 2035 Baseline 2035 Plan
Truck Delay by Facility Type (highway, Arterials)This measure estimates the average daily truck delay by facility type for freeways and arterials (FiguRE 12). The Plan is estimated to reduce truck delay by approximately 40 percent over Baseline on the freeway system, and by approximately 55 percent on the arterial system.
FiguRE 12 Daily Heavy-Duty Truck Hours of Delay
0
50
100
150
200
250
300
Freeway/Expressway ArterialTh
ousa
nds
2008 Base Year 2035 Baseline 2035 Plan

Highways and Arterials 23
non-Recurrent DelayData from the Caltrans Performance Measurement System (PeMS) was used to assess the level of non-recurrent delay on regional freeways using the “congestion pie” feature of PeMS. This module breaks down congestion into recurrent and non-recurrent conges-tion, with recurrent congestion being that day-to-day delay that occurs when there are simply too many vehicles on the road at the same time. Non-recurrent congestion is congestion due to other causes such as accidents, special events, or weather.
The PeMS congestion pie module reports two types of recurrent congestion—“Excess Demand” and “Potential Reduction”. Excess demand is the congestion attributed to addi-tional vehicles on the road. Potential reduction also accounts for the “too many vehicles” type of congestion, but this congestion can potentially be mitigated by applying optimal operational strategies such as ramp metering.
For the 2012–2035 RTP/SCS, the mobility performance measure is non-recurrent congestion. This type of congestion also has two major components—“Accidents” and “Miscellaneous”. Accident-related congestion is estimated by using the Caltrans Traffic Accident Surveillance and Analysis System (TASAS) accident locations and compar-ing that to congestion levels reported by roadway sensors. If excess congestion beyond normal is reported at a location where TASAS reports that an accident occurred, then that extra congestion is put in the accident-related congestion bucket. If congestion being reported by a sensor is above normal and there was no accident report, then that conges-tion falls into the miscellaneous bucket.
The most recent PeMS congestion classification data is for the year 2009. FiguRE 13 shows the percentage of freeway congestion during a typical day (5:00 AM through 8:00 PM) for the year 2009. The data is reported for each county and for the region as a whole. In 2009, the estimated average percentage of congestion that was due to accidents or other incidents was around 45 percent. In San Bernardino County—with less congestion overall and more susceptible to incident-causing congestion—the data suggested that a majority of congestion was non-recurrent. (The actual percentage is likely exaggerated due to the manner in which PeMS handles some data; more research is needed to verify this assessment.) In the more urbanized Los Angeles County, the data reported that 40 percent of countywide congestion was non-recurrent.
FiguRE 13 Percent Non-Recurrent Congestion by County (2009)
0%
10%
20%
30%
40%
50%
60%
70%
80%
90%
Los Angeles Orange Riverside San Bernardino Ventura RegionalAverage
2009
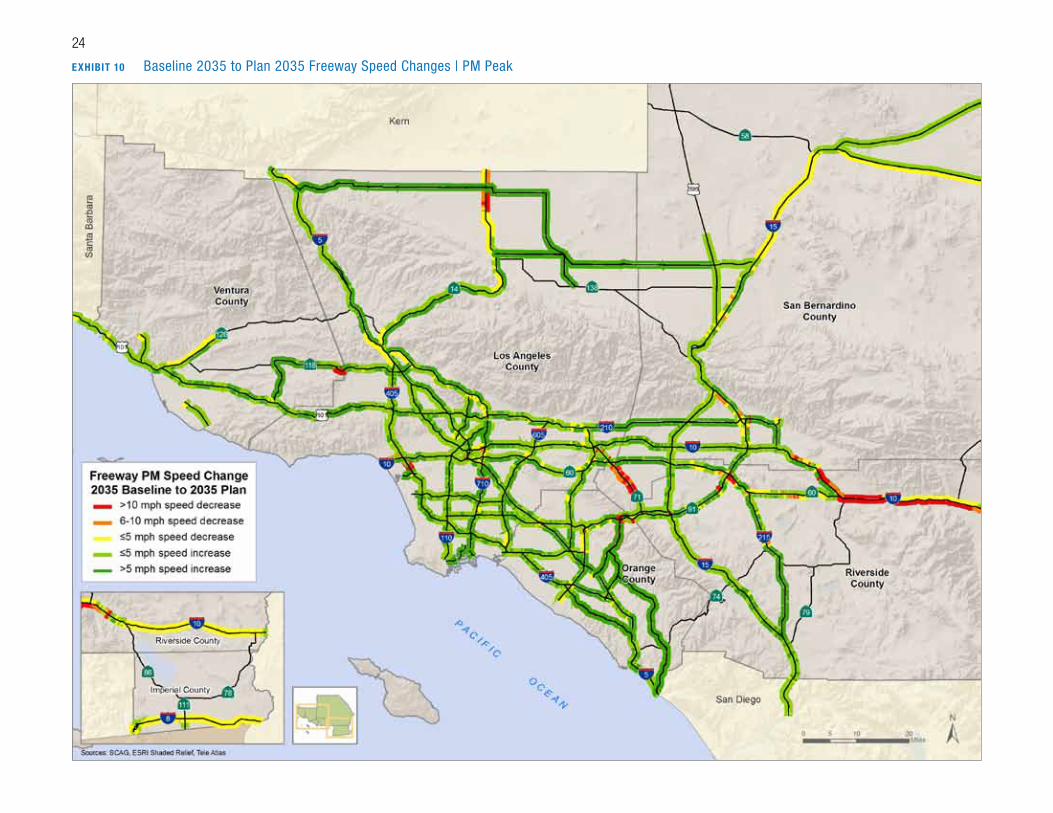
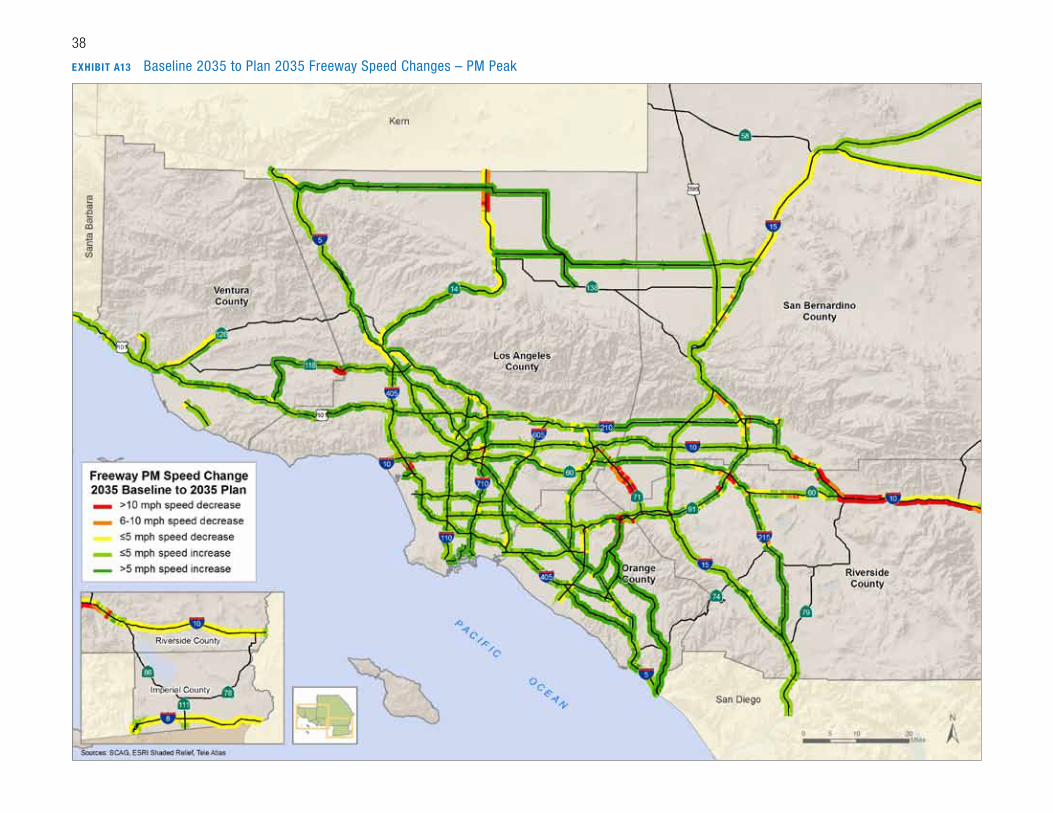
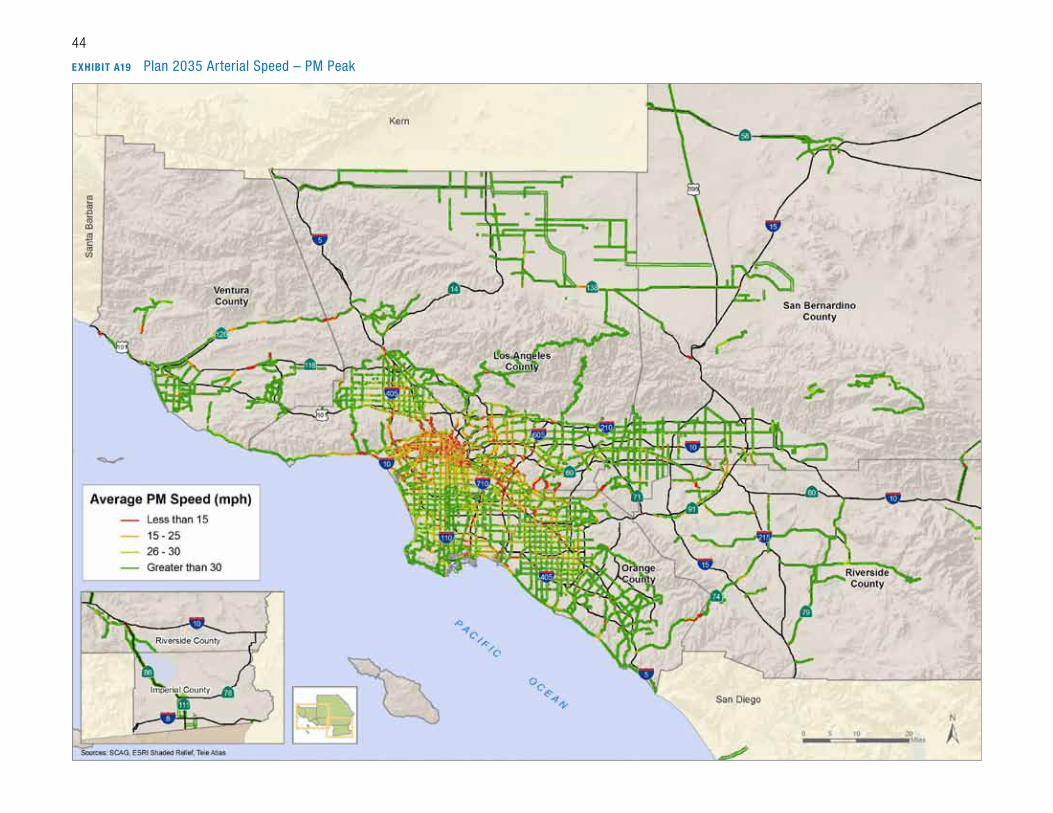
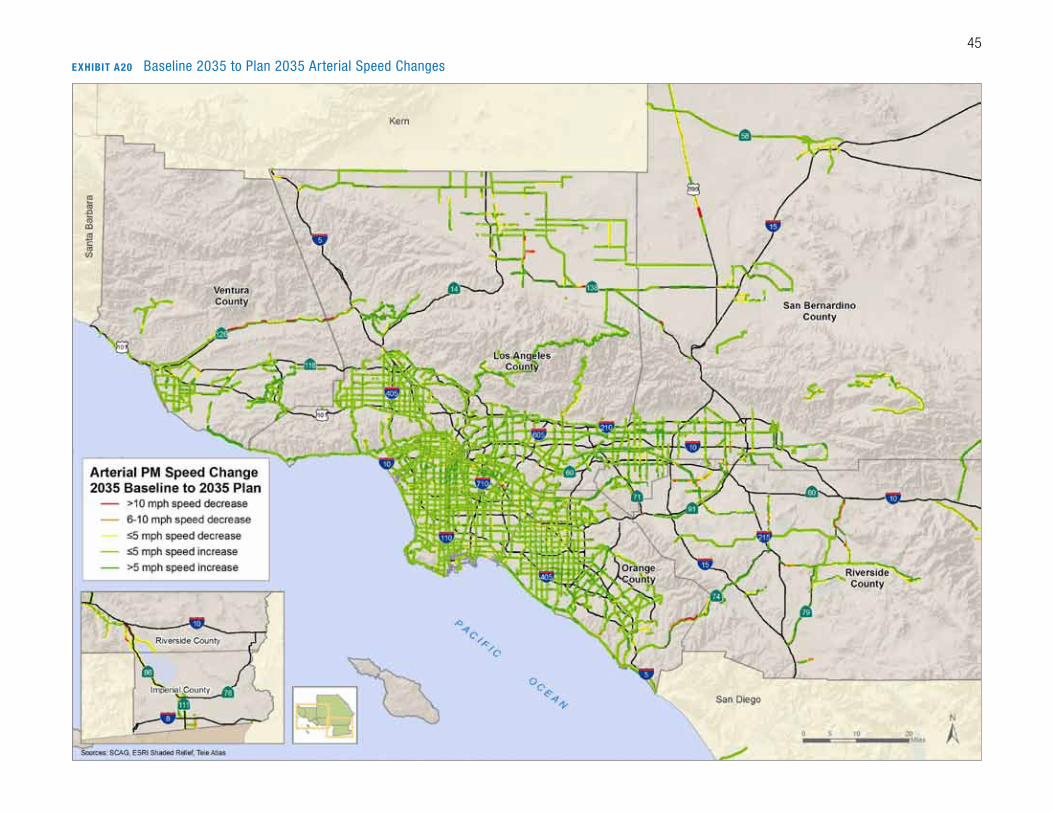
The following maps show the projected improvement in speed between the Baseline 2035 and Plan 2035 scenarios on our highway and arterial system in the PM peak. Additional speed maps can be found in the appendix of this document
24
ExHibiT 10 Baseline 2035 to Plan 2035 Freeway Speed Changes | PM Peak

25
ExHibiT 11 Baseline 2035 vs. Plan 2035 Arterial Speed – PM Peak
26
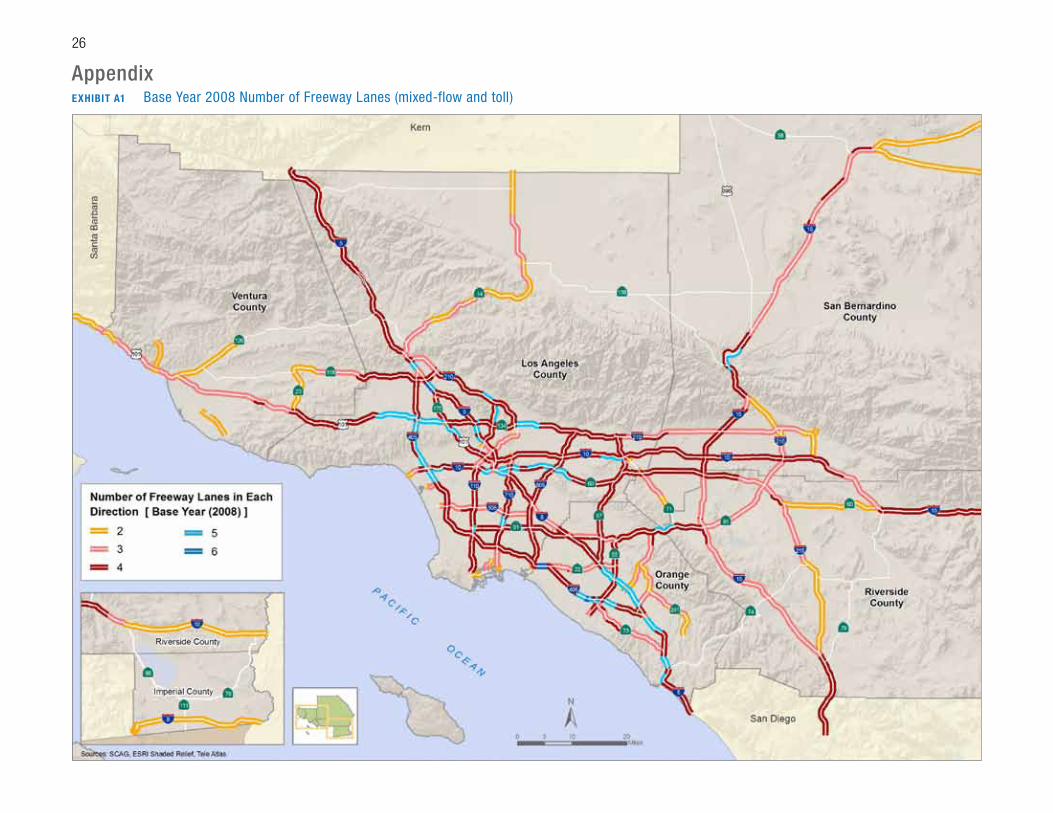
ExHibiT A1 Base Year 2008 Number of Freeway Lanes (mixed-flow and toll)
Appendix
27
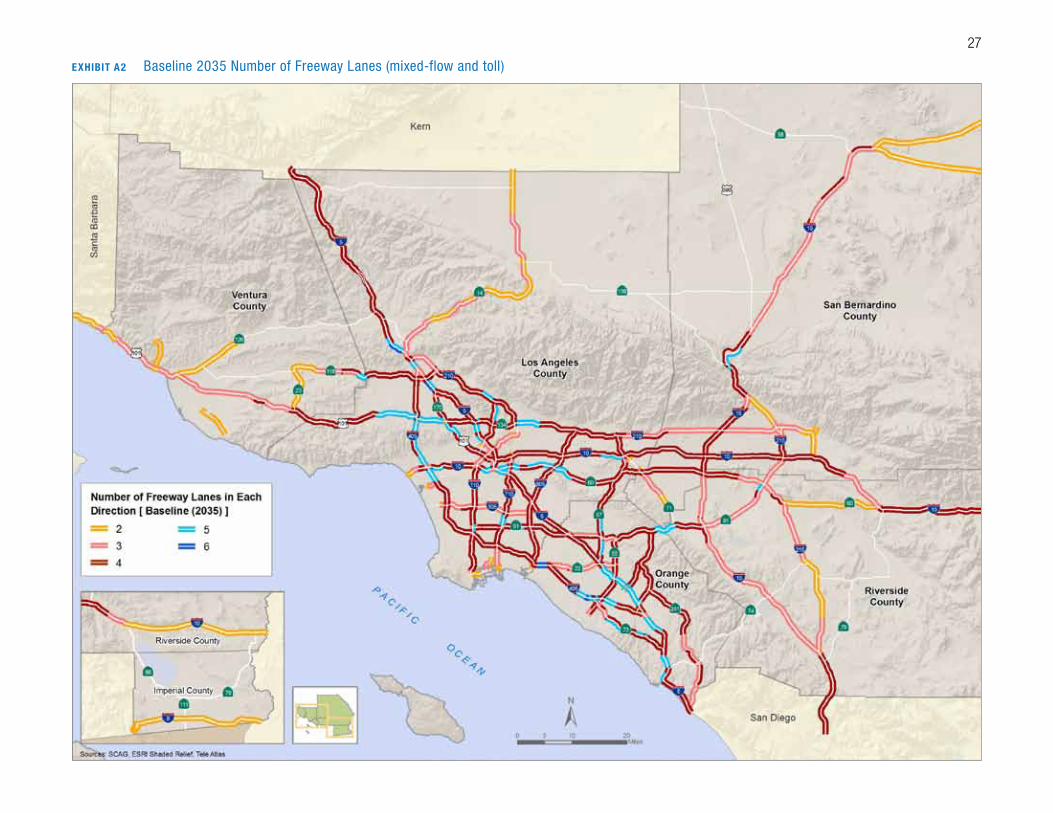
ExHibiT A2 Baseline 2035 Number of Freeway Lanes (mixed-flow and toll)
28
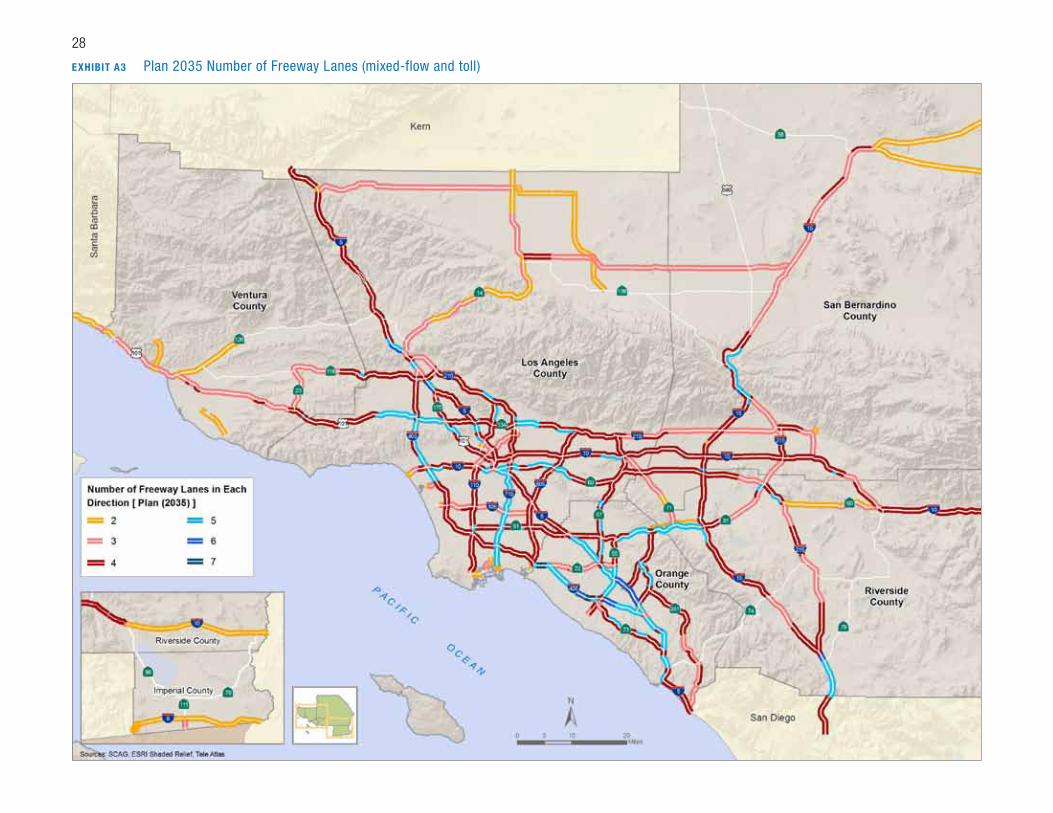
ExHibiT A3 Plan 2035 Number of Freeway Lanes (mixed-flow and toll)
29
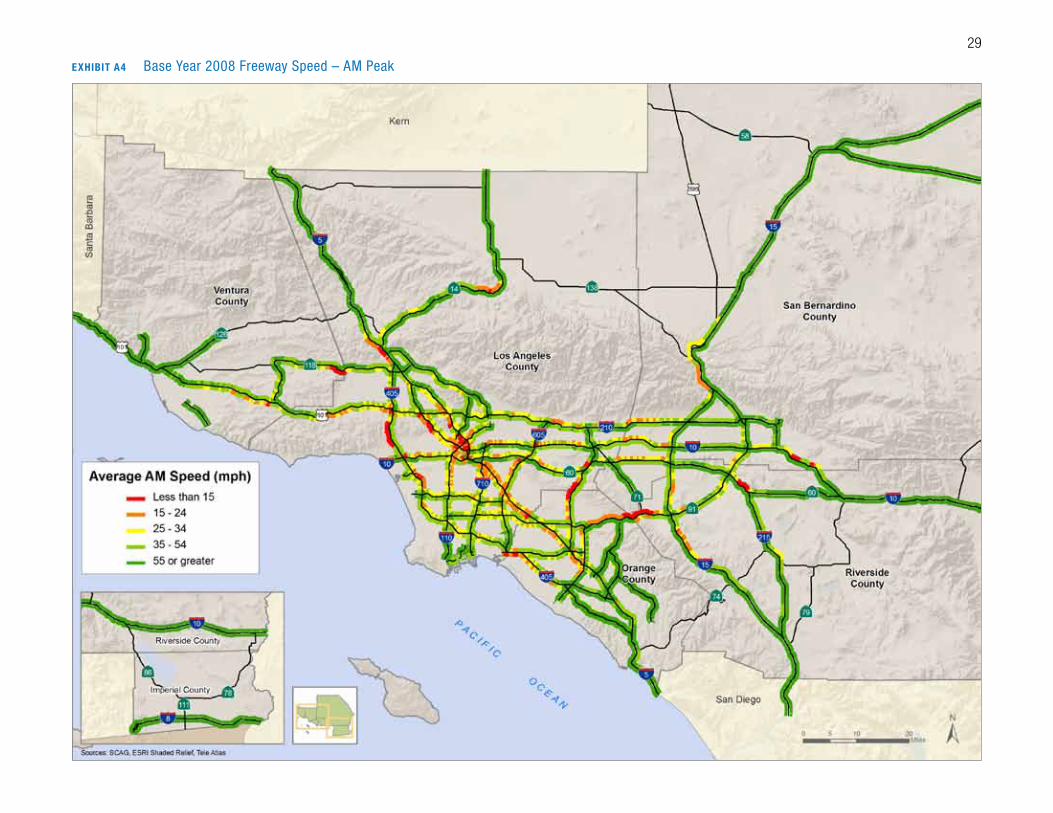
ExHibiT A4 Base Year 2008 Freeway Speed – AM Peak
30
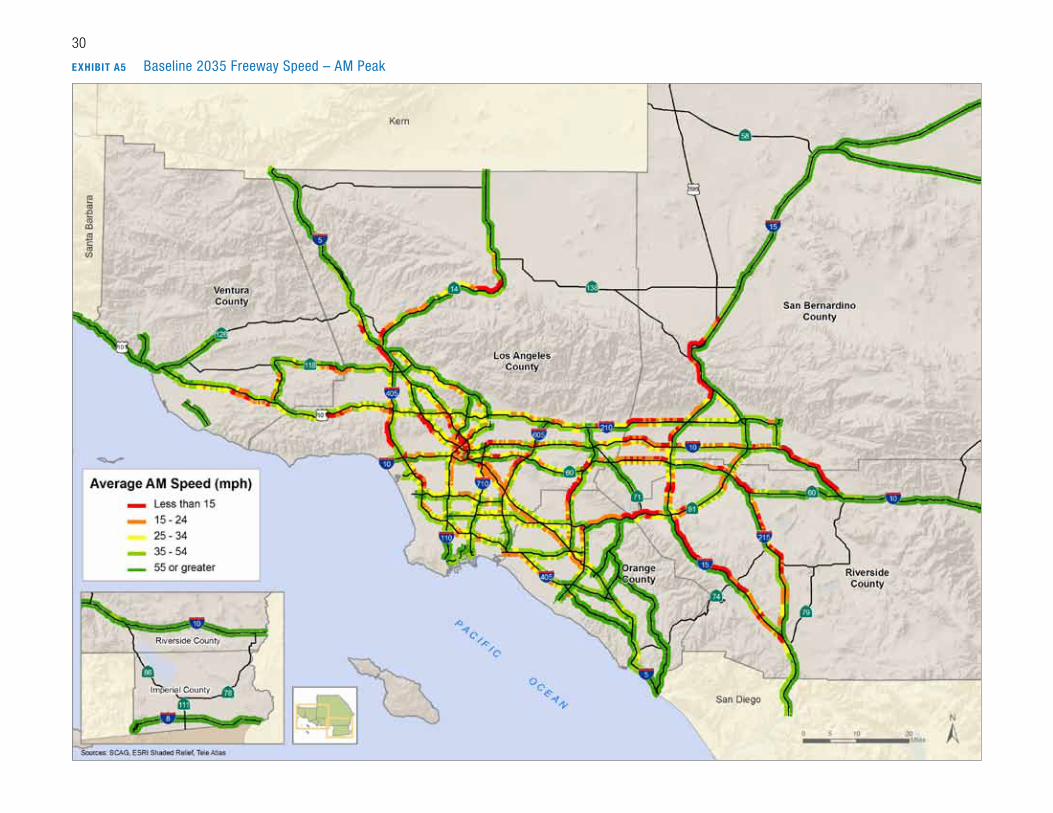
ExHibiT A5 Baseline 2035 Freeway Speed – AM Peak
31
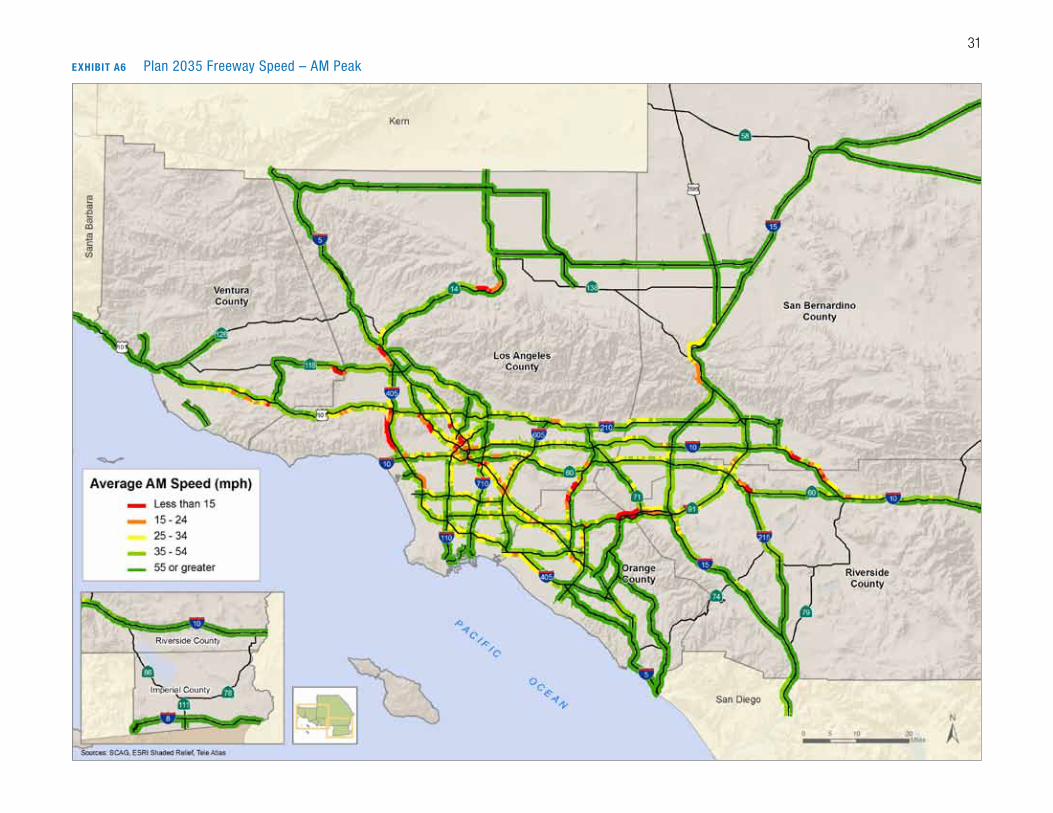
ExHibiT A6 Plan 2035 Freeway Speed – AM Peak
32
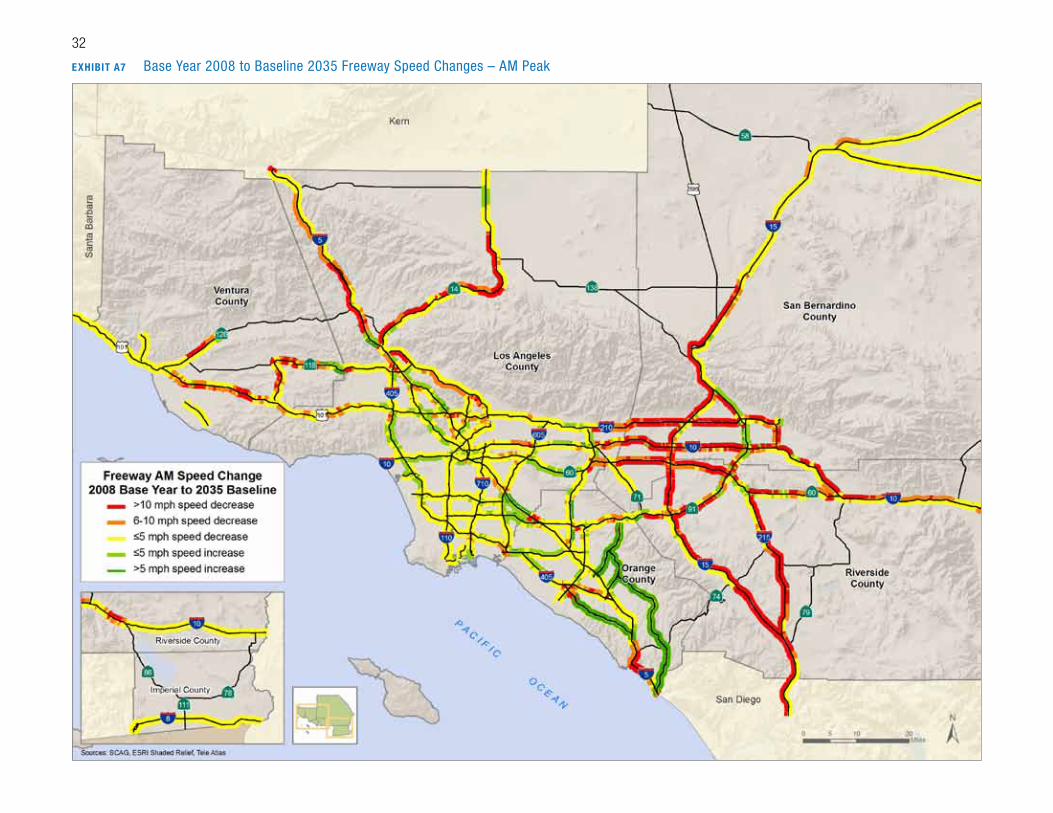
ExHibiT A7 Base Year 2008 to Baseline 2035 Freeway Speed Changes – AM Peak

33
ExHibiT A8 Baseline 2035 to Plan 2035 Freeway Speed Changes – AM Peak
34
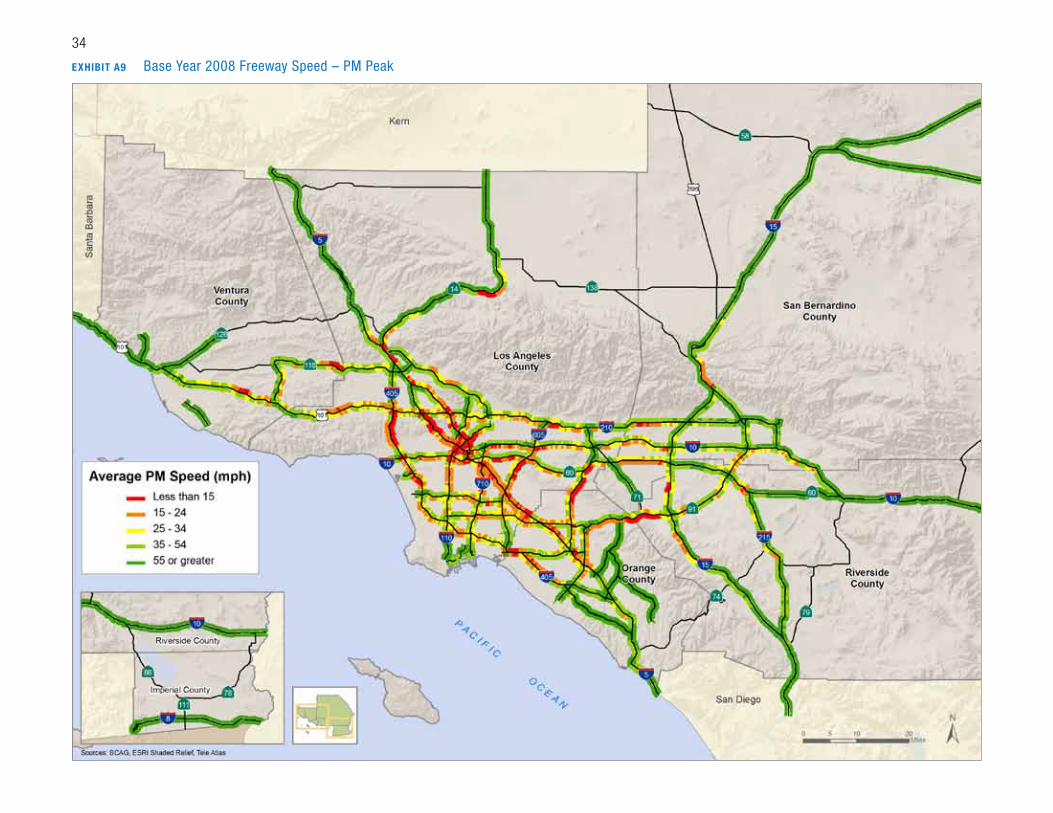
ExHibiT A9 Base Year 2008 Freeway Speed – PM Peak
35
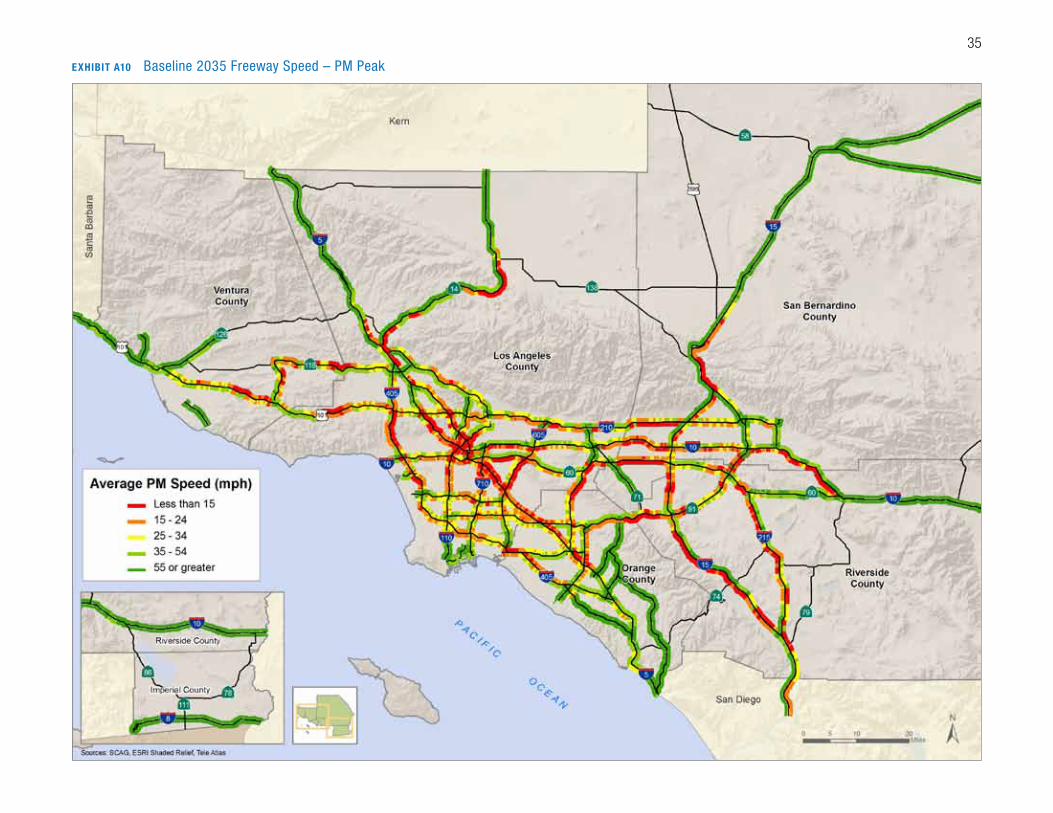
ExHibiT A10 Baseline 2035 Freeway Speed – PM Peak

36
ExHibiT A11 Plan 2035 Freeway Speed – PM Peak
37
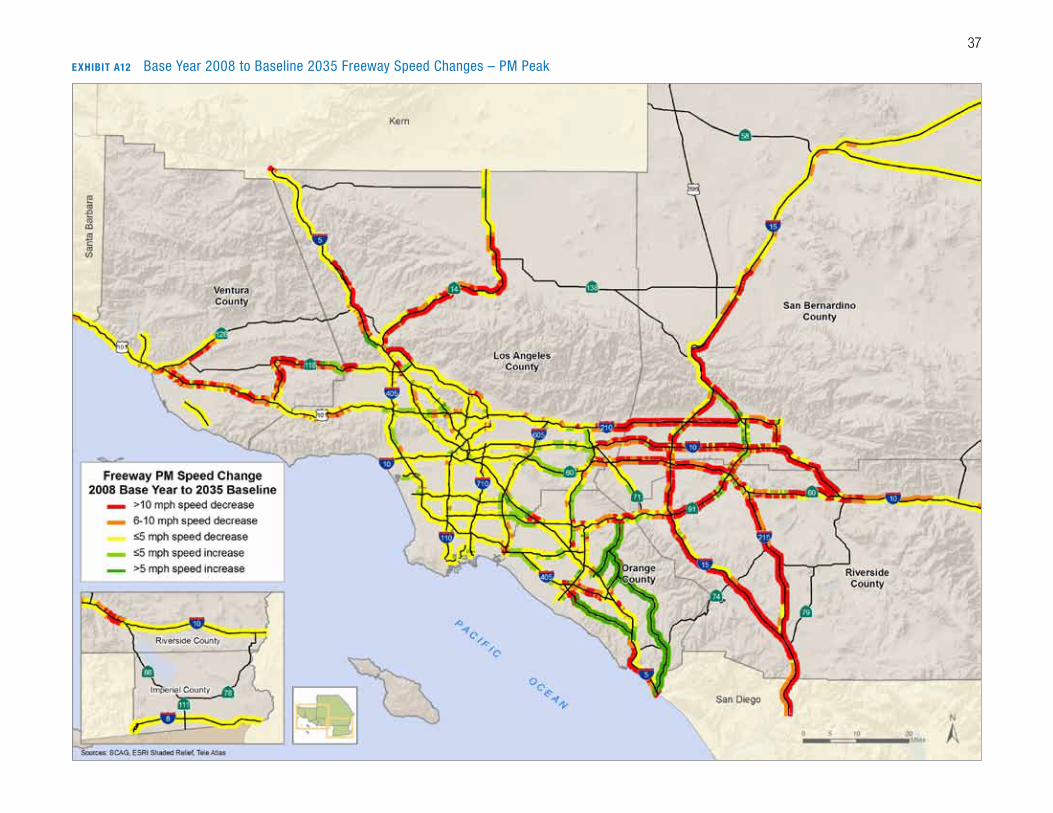
ExHibiT A12 Base Year 2008 to Baseline 2035 Freeway Speed Changes – PM Peak
38
ExHibiT A13 Baseline 2035 to Plan 2035 Freeway Speed Changes – PM Peak
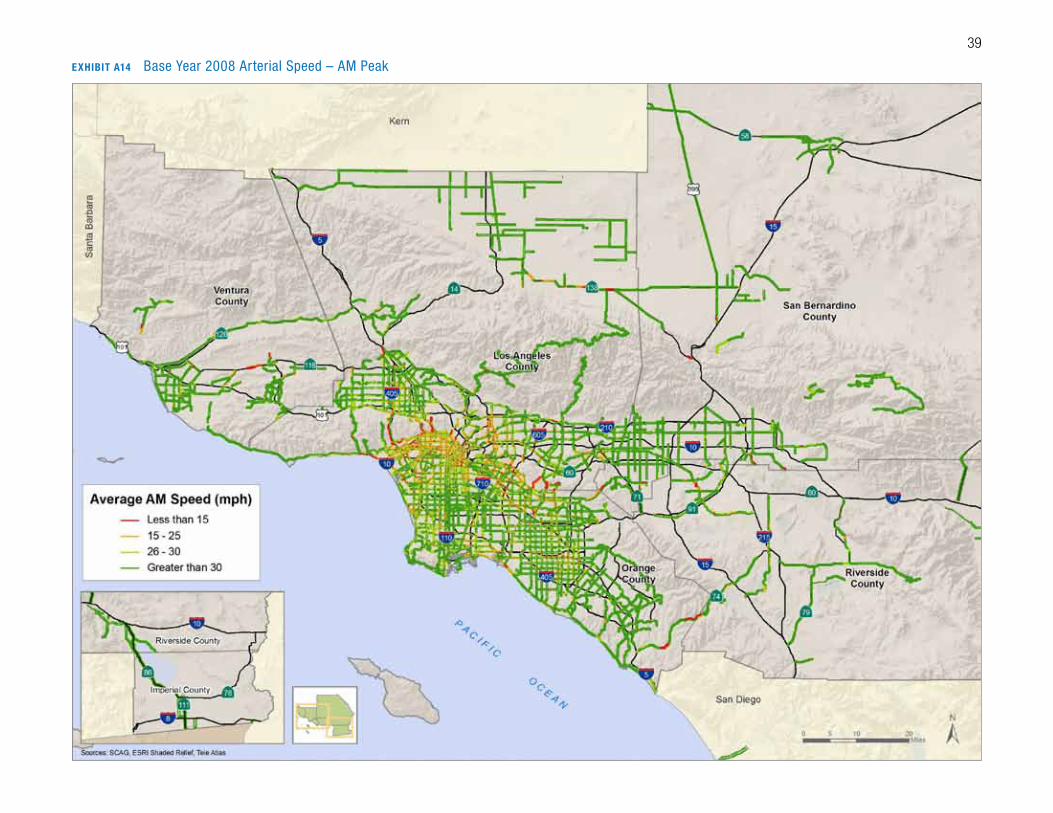
39
ExHibiT A14 Base Year 2008 Arterial Speed – AM Peak
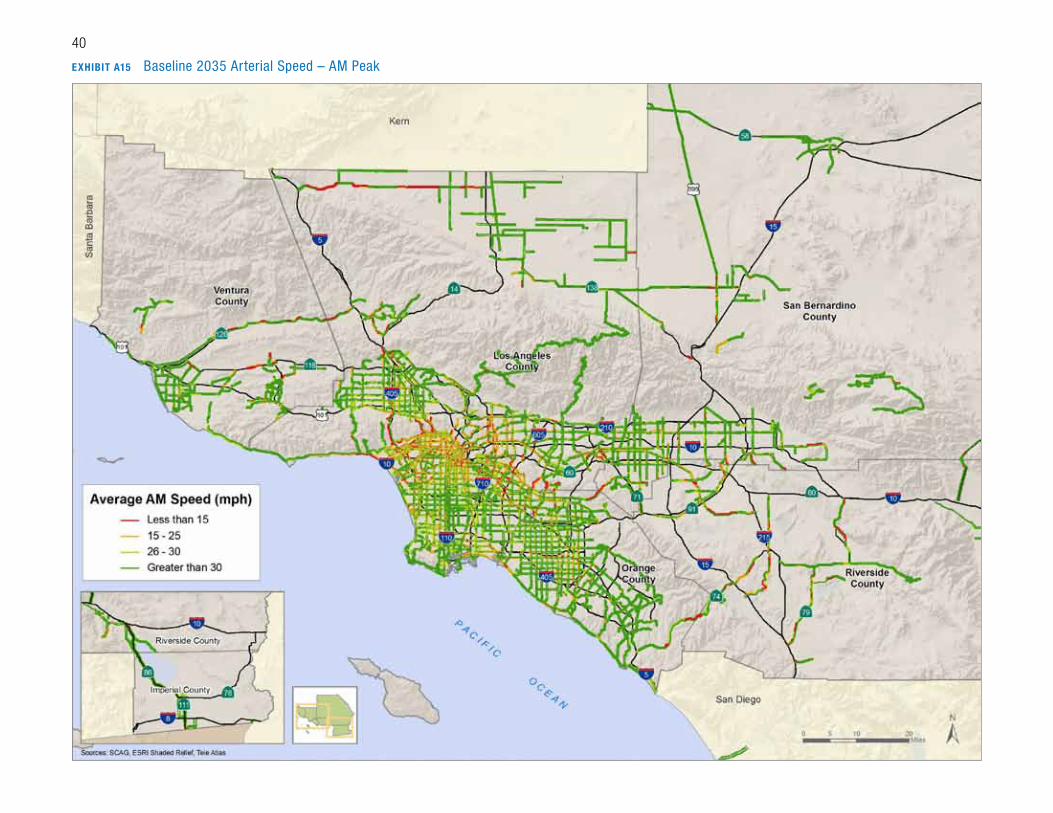
40
ExHibiT A15 Baseline 2035 Arterial Speed – AM Peak
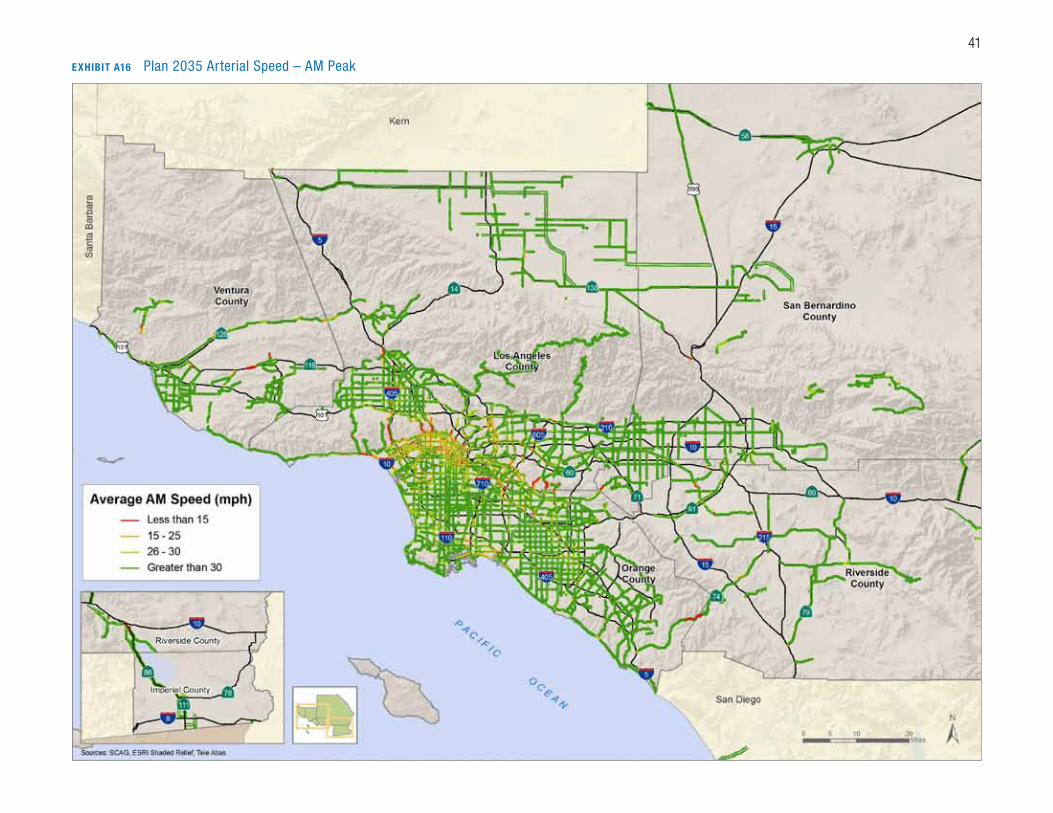
41
ExHibiT A16 Plan 2035 Arterial Speed – AM Peak
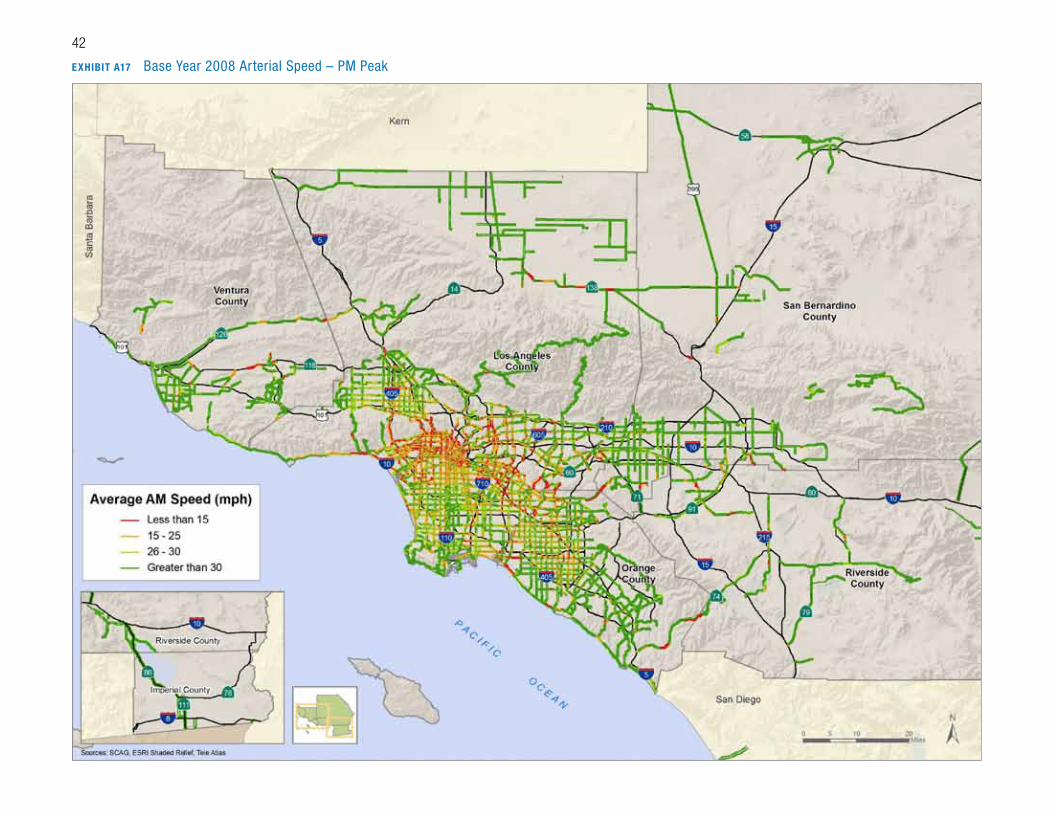
42
ExHibiT A17 Base Year 2008 Arterial Speed – PM Peak

43
ExHibiT A18 Baseline 2035 Arterial Speed – PM Peak
44
ExHibiT A19 Plan 2035 Arterial Speed – PM Peak
45
ExHibiT A20 Baseline 2035 to Plan 2035 Arterial Speed Changes
46 Highways and Arterials
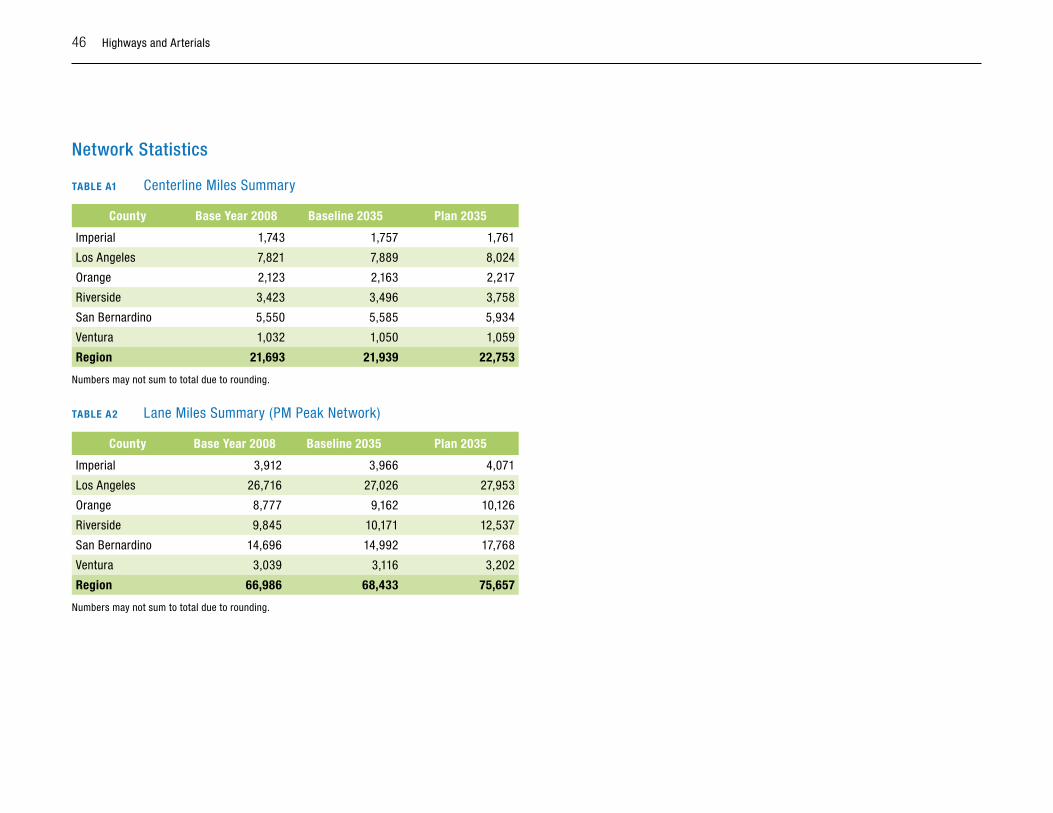
network statistics
TAbLE A1 Centerline Miles Summary
County base Year 2008 baseline 2035 Plan 2035
Imperial 1,743 1,757 1,761
Los Angeles 7,821 7,889 8,024
Orange 2,123 2,163 2,217
Riverside 3,423 3,496 3,758
San Bernardino 5,550 5,585 5,934
Ventura 1,032 1,050 1,059
Region 21,693 21,939 22,753
Numbers may not sum to total due to rounding.
TAbLE A2 Lane Miles Summary (PM Peak Network)
County base Year 2008 baseline 2035 Plan 2035
Imperial 3,912 3,966 4,071
Los Angeles 26,716 27,026 27,953
Orange 8,777 9,162 10,126
Riverside 9,845 10,171 12,537
San Bernardino 14,696 14,992 17,768
Ventura 3,039 3,116 3,202
Region 66,986 68,433 75,657
Numbers may not sum to total due to rounding.
Highways and Arterials 47
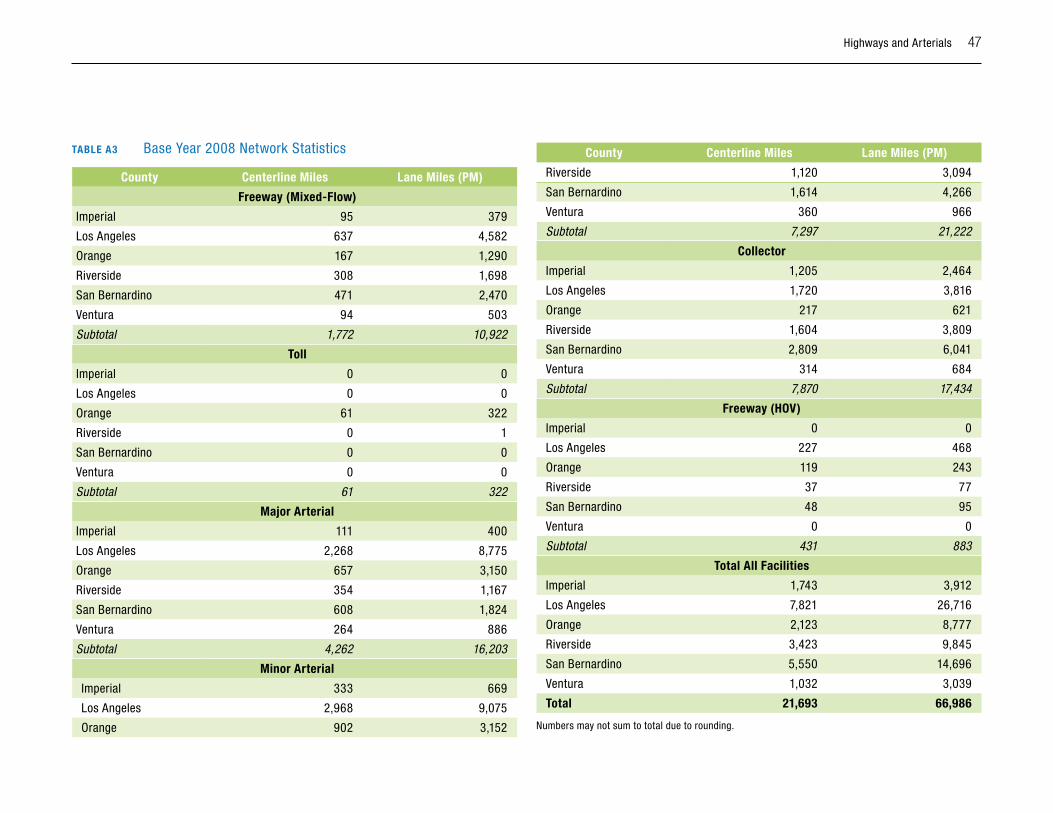
County Centerline Miles Lane Miles (PM)
Riverside 1,120 3,094
San Bernardino 1,614 4,266
Ventura 360 966
Subtotal 7,297 21,222
Collector
Imperial 1,205 2,464
Los Angeles 1,720 3,816
Orange 217 621
Riverside 1,604 3,809
San Bernardino 2,809 6,041
Ventura 314 684
Subtotal 7,870 17,434
Freeway (HOV)
Imperial 0 0
Los Angeles 227 468
Orange 119 243
Riverside 37 77
San Bernardino 48 95
Ventura 0 0
Subtotal 431 883
Total All Facilities
Imperial 1,743 3,912
Los Angeles 7,821 26,716
Orange 2,123 8,777
Riverside 3,423 9,845
San Bernardino 5,550 14,696
Ventura 1,032 3,039
Total 21,693 66,986
Numbers may not sum to total due to rounding.
TAbLE A3 Base Year 2008 Network Statistics
County Centerline Miles Lane Miles (PM)
Freeway (Mixed-Flow)
Imperial 95 379
Los Angeles 637 4,582
Orange 167 1,290
Riverside 308 1,698
San Bernardino 471 2,470
Ventura 94 503
Subtotal 1,772 10,922
Toll
Imperial 0 0
Los Angeles 0 0
Orange 61 322
Riverside 0 1
San Bernardino 0 0
Ventura 0 0
Subtotal 61 322
Major Arterial
Imperial 111 400
Los Angeles 2,268 8,775
Orange 657 3,150
Riverside 354 1,167
San Bernardino 608 1,824
Ventura 264 886
Subtotal 4,262 16,203
Minor Arterial
Imperial 333 669
Los Angeles 2,968 9,075
Orange 902 3,152
48 Highways and Arterials
County Centerline Miles Lane Miles (PM)
Riverside 1,137 3,200
San Bernardino 1,620 4,372
Ventura 369 993
Subtotal 7,332 21,526
Collector
Imperial 1,205 2,465
Los Angeles 1,724 3,840
Orange 222 633
Riverside 1,645 3,940
San Bernardino 2,825 6,106
Ventura 318 695
Subtotal 7,939 17,679
Freeway (HOV)
Imperial 0 0
Los Angeles 288 588
Orange 121 255
Riverside 49 102
San Bernardino 57 115
Ventura 4 8
Subtotal 520 1,067
Total All Facilities
Imperial 1,757 3,966
Los Angeles 7,889 27,026
Orange 2,163 9,162
Riverside 3,496 10,171
San Bernardino 5,585 14,992
Ventura 1,050 3,116
Total 21,939 68,433
Numbers may not sum to total due to rounding.
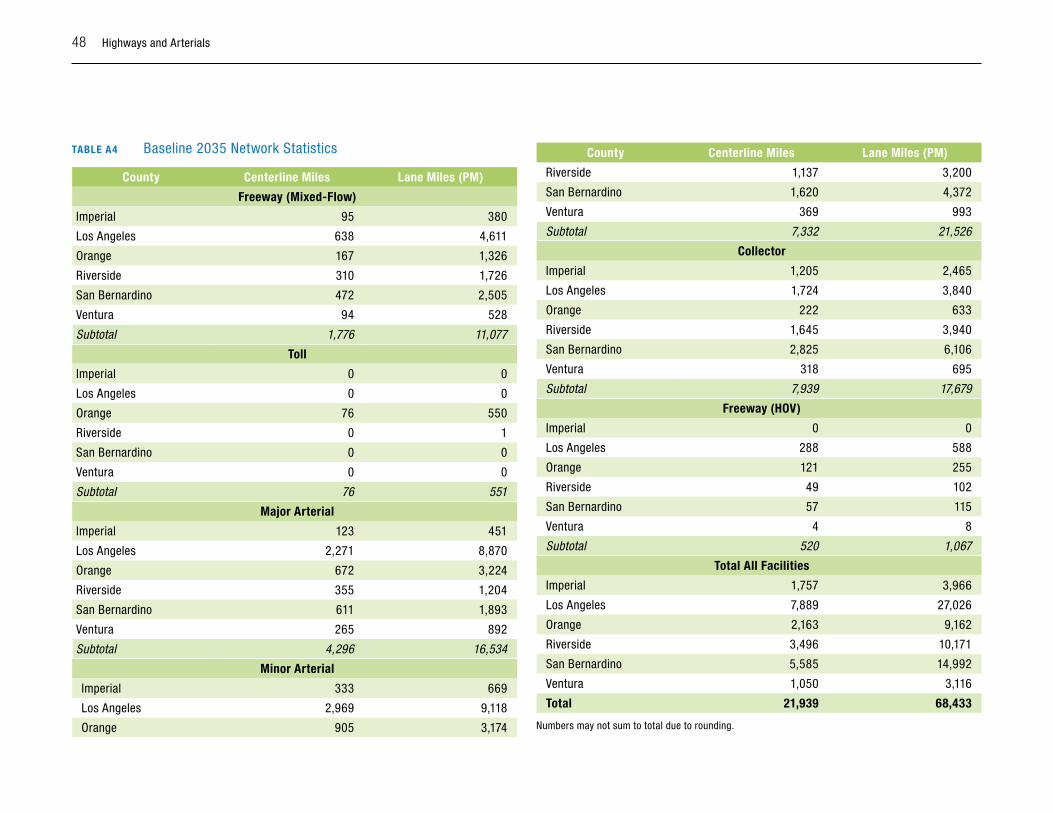
TAbLE A4 Baseline 2035 Network Statistics
County Centerline Miles Lane Miles (PM)
Freeway (Mixed-Flow)
Imperial 95 380
Los Angeles 638 4,611
Orange 167 1,326
Riverside 310 1,726
San Bernardino 472 2,505
Ventura 94 528
Subtotal 1,776 11,077
Toll
Imperial 0 0
Los Angeles 0 0
Orange 76 550
Riverside 0 1
San Bernardino 0 0
Ventura 0 0
Subtotal 76 551
Major Arterial
Imperial 123 451
Los Angeles 2,271 8,870
Orange 672 3,224
Riverside 355 1,204
San Bernardino 611 1,893
Ventura 265 892
Subtotal 4,296 16,534
Minor Arterial
Imperial 333 669
Los Angeles 2,969 9,118
Orange 905 3,174
Highways and Arterials 49
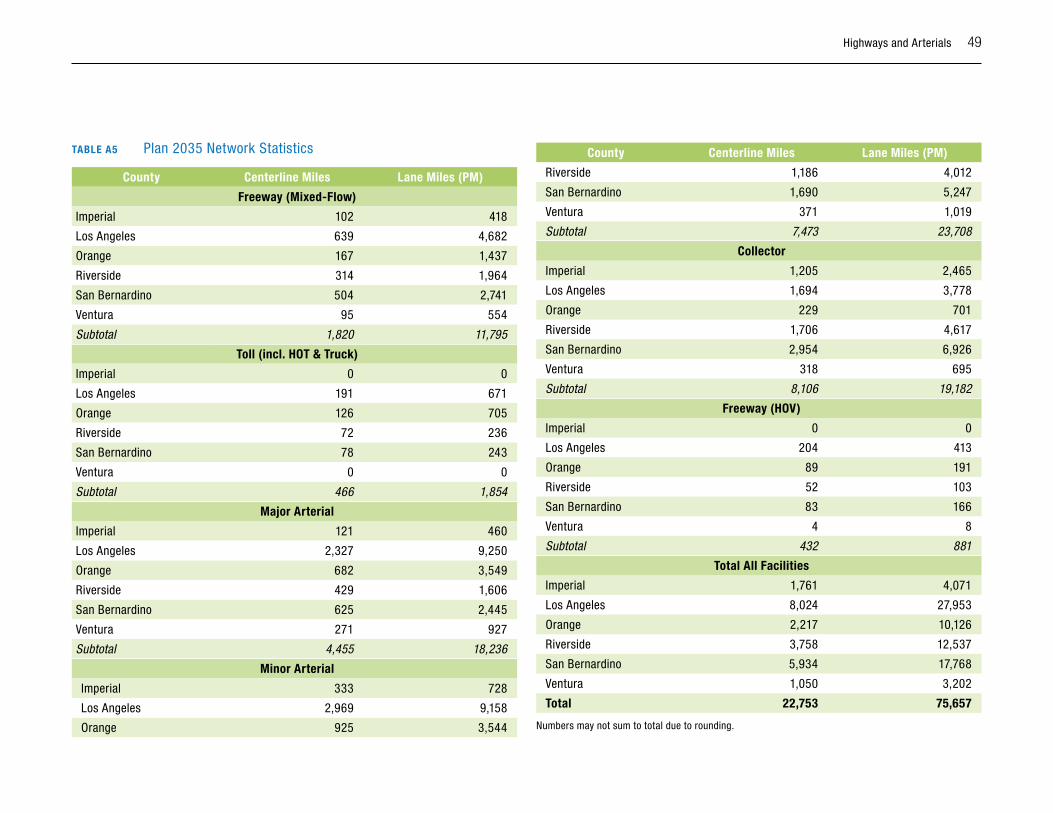
TAbLE A5 Plan 2035 Network Statistics
County Centerline Miles Lane Miles (PM)
Freeway (Mixed-Flow)
Imperial 102 418
Los Angeles 639 4,682
Orange 167 1,437
Riverside 314 1,964
San Bernardino 504 2,741
Ventura 95 554
Subtotal 1,820 11,795
Toll (incl. HOT & Truck)
Imperial 0 0
Los Angeles 191 671
Orange 126 705
Riverside 72 236
San Bernardino 78 243
Ventura 0 0
Subtotal 466 1,854
Major Arterial
Imperial 121 460
Los Angeles 2,327 9,250
Orange 682 3,549
Riverside 429 1,606
San Bernardino 625 2,445
Ventura 271 927
Subtotal 4,455 18,236
Minor Arterial
Imperial 333 728
Los Angeles 2,969 9,158
Orange 925 3,544
County Centerline Miles Lane Miles (PM)
Riverside 1,186 4,012
San Bernardino 1,690 5,247
Ventura 371 1,019
Subtotal 7,473 23,708
Collector
Imperial 1,205 2,465
Los Angeles 1,694 3,778
Orange 229 701
Riverside 1,706 4,617
San Bernardino 2,954 6,926
Ventura 318 695
Subtotal 8,106 19,182
Freeway (HOV)
Imperial 0 0
Los Angeles 204 413
Orange 89 191
Riverside 52 103
San Bernardino 83 166
Ventura 4 8
Subtotal 432 881
Total All Facilities
Imperial 1,761 4,071
Los Angeles 8,024 27,953
Orange 2,217 10,126
Riverside 3,758 12,537
San Bernardino 5,934 17,768
Ventura 1,050 3,202
Total 22,753 75,657
Numbers may not sum to total due to rounding.
50 Highways and Arterials
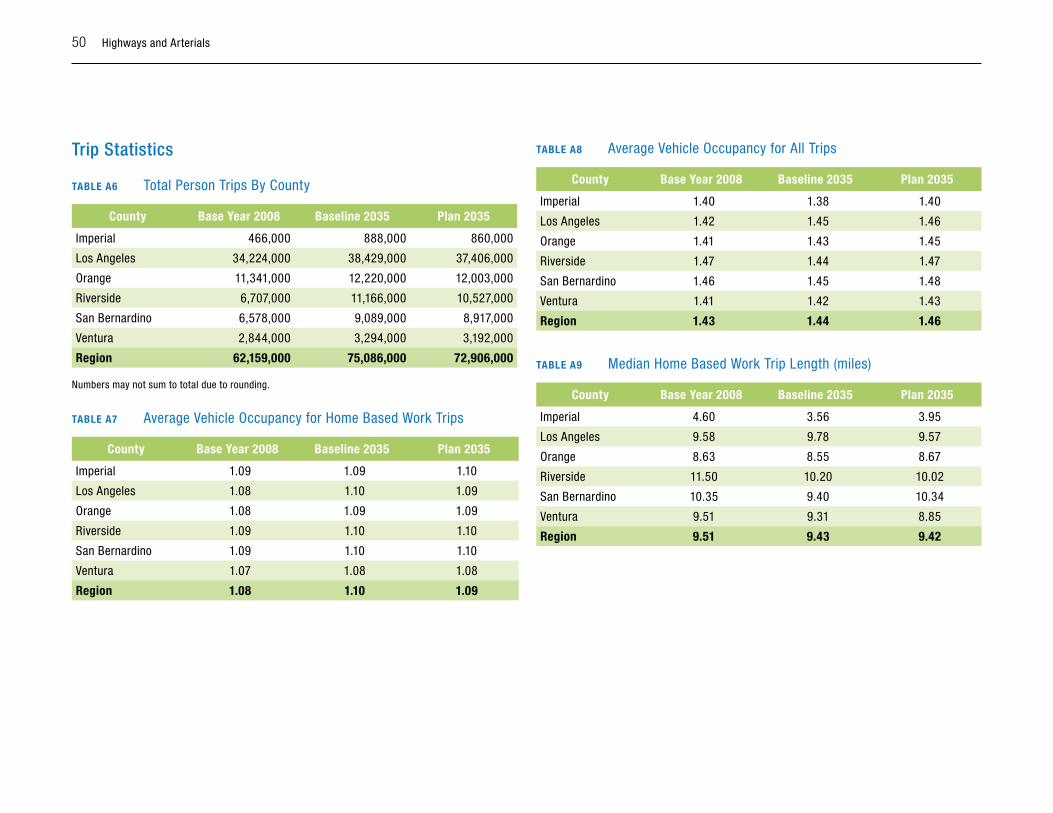
Trip statistics
TAbLE A6 Total Person Trips By County
County base Year 2008 baseline 2035 Plan 2035
Imperial 466,000 888,000 860,000
Los Angeles 34,224,000 38,429,000 37,406,000
Orange 11,341,000 12,220,000 12,003,000
Riverside 6,707,000 11,166,000 10,527,000
San Bernardino 6,578,000 9,089,000 8,917,000
Ventura 2,844,000 3,294,000 3,192,000
Region 62,159,000 75,086,000 72,906,000
Numbers may not sum to total due to rounding.
TAbLE A7 Average Vehicle Occupancy for Home Based Work Trips
County base Year 2008 baseline 2035 Plan 2035
Imperial 1.09 1.09 1.10
Los Angeles 1.08 1.10 1.09
Orange 1.08 1.09 1.09
Riverside 1.09 1.10 1.10
San Bernardino 1.09 1.10 1.10
Ventura 1.07 1.08 1.08
Region 1.08 1.10 1.09
TAbLE A8 Average Vehicle Occupancy for All Trips
County base Year 2008 baseline 2035 Plan 2035
Imperial 1.40 1.38 1.40
Los Angeles 1.42 1.45 1.46
Orange 1.41 1.43 1.45
Riverside 1.47 1.44 1.47
San Bernardino 1.46 1.45 1.48
Ventura 1.41 1.42 1.43
Region 1.43 1.44 1.46
TAbLE A9 Median Home Based Work Trip Length (miles)
County base Year 2008 baseline 2035 Plan 2035
Imperial 4.60 3.56 3.95
Los Angeles 9.58 9.78 9.57
Orange 8.63 8.55 8.67
Riverside 11.50 10.20 10.02
San Bernardino 10.35 9.40 10.34
Ventura 9.51 9.31 8.85
Region 9.51 9.43 9.42
Highways and Arterials 51
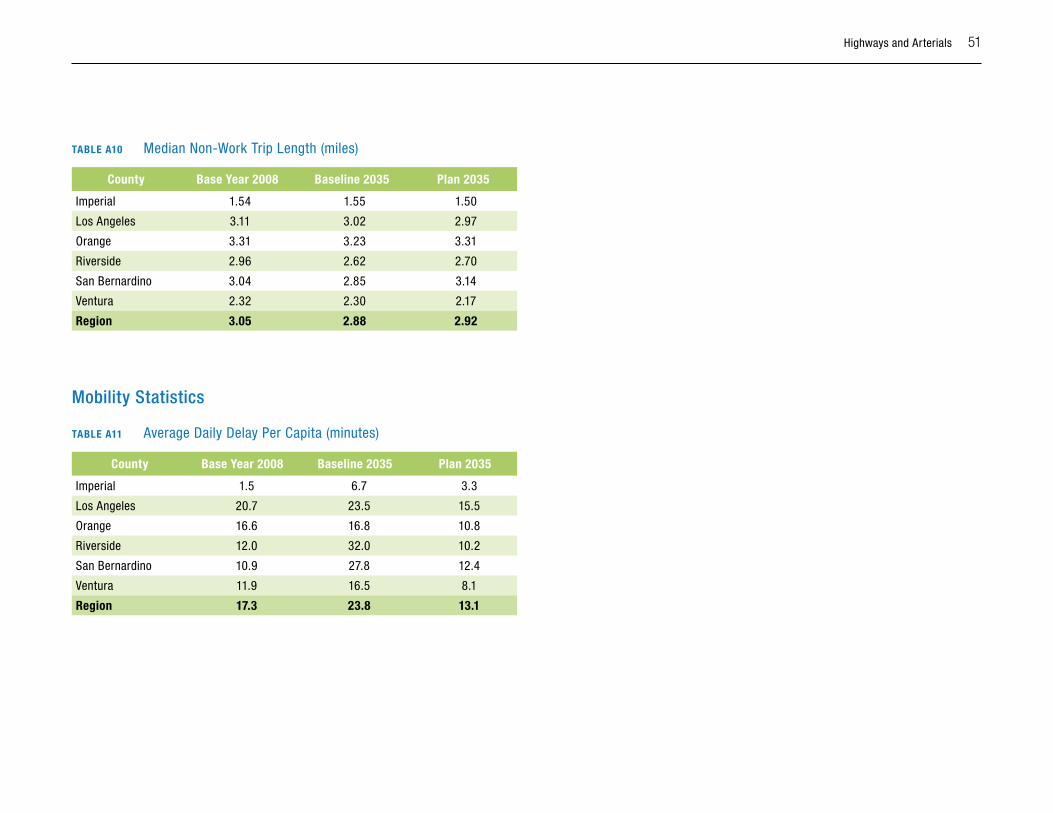
TAbLE A10 Median Non-Work Trip Length (miles)
County base Year 2008 baseline 2035 Plan 2035
Imperial 1.54 1.55 1.50
Los Angeles 3.11 3.02 2.97
Orange 3.31 3.23 3.31
Riverside 2.96 2.62 2.70
San Bernardino 3.04 2.85 3.14
Ventura 2.32 2.30 2.17
Region 3.05 2.88 2.92
Mobility statistics
TAbLE A11 Average Daily Delay Per Capita (minutes)
County base Year 2008 baseline 2035 Plan 2035
Imperial 1.5 6.7 3.3
Los Angeles 20.7 23.5 15.5
Orange 16.6 16.8 10.8
Riverside 12.0 32.0 10.2
San Bernardino 10.9 27.8 12.4
Ventura 11.9 16.5 8.1
Region 17.3 23.8 13.1
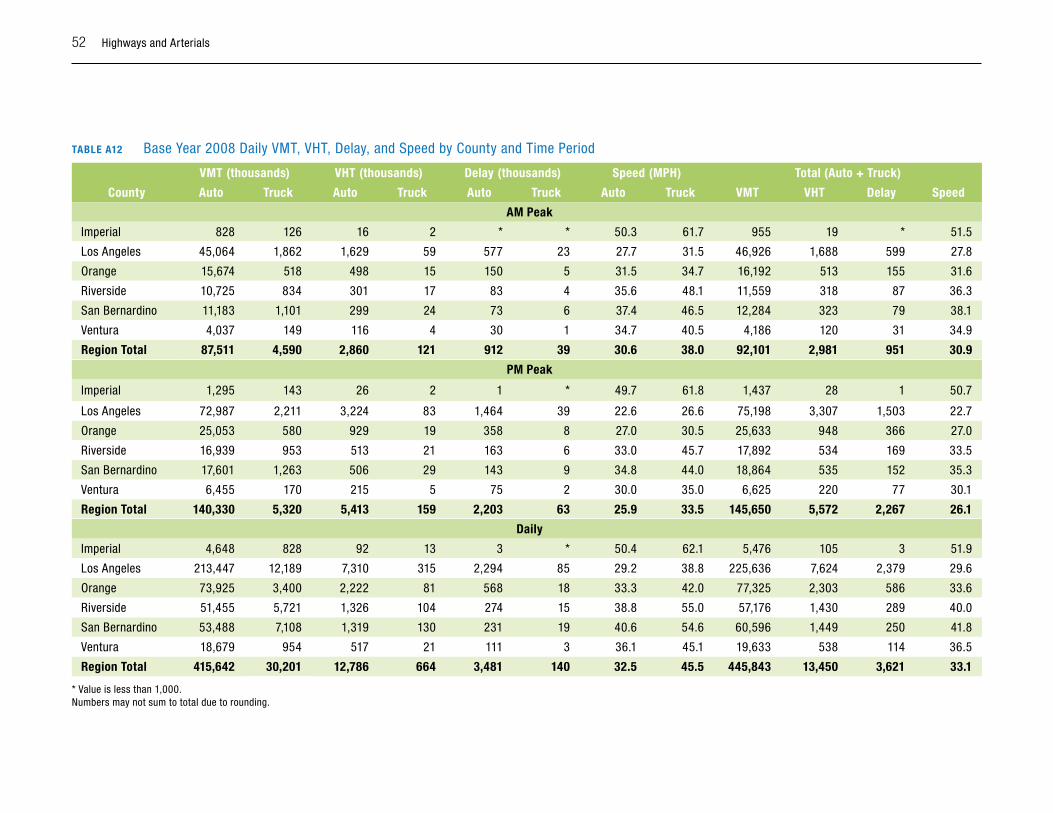
52 Highways and Arterials
TAbLE A12 Base Year 2008 Daily VMT, VHT, Delay, and Speed by County and Time Period
VMT (thousands) VHT (thousands) Delay (thousands) Speed (MPH) Total (Auto + Truck)
County Auto Truck Auto Truck Auto Truck Auto Truck VMT VHT Delay Speed
AM Peak
Imperial 828 126 16 2 * * 50.3 61.7 955 19 * 51.5
Los Angeles 45,064 1,862 1,629 59 577 23 27.7 31.5 46,926 1,688 599 27.8
Orange 15,674 518 498 15 150 5 31.5 34.7 16,192 513 155 31.6
Riverside 10,725 834 301 17 83 4 35.6 48.1 11,559 318 87 36.3
San Bernardino 11,183 1,101 299 24 73 6 37.4 46.5 12,284 323 79 38.1
Ventura 4,037 149 116 4 30 1 34.7 40.5 4,186 120 31 34.9
Region Total 87,511 4,590 2,860 121 912 39 30.6 38.0 92,101 2,981 951 30.9
PM Peak
Imperial 1,295 143 26 2 1 * 49.7 61.8 1,437 28 1 50.7
Los Angeles 72,987 2,211 3,224 83 1,464 39 22.6 26.6 75,198 3,307 1,503 22.7
Orange 25,053 580 929 19 358 8 27.0 30.5 25,633 948 366 27.0
Riverside 16,939 953 513 21 163 6 33.0 45.7 17,892 534 169 33.5
San Bernardino 17,601 1,263 506 29 143 9 34.8 44.0 18,864 535 152 35.3
Ventura 6,455 170 215 5 75 2 30.0 35.0 6,625 220 77 30.1
Region Total 140,330 5,320 5,413 159 2,203 63 25.9 33.5 145,650 5,572 2,267 26.1
Daily
Imperial 4,648 828 92 13 3 * 50.4 62.1 5,476 105 3 51.9
Los Angeles 213,447 12,189 7,310 315 2,294 85 29.2 38.8 225,636 7,624 2,379 29.6
Orange 73,925 3,400 2,222 81 568 18 33.3 42.0 77,325 2,303 586 33.6
Riverside 51,455 5,721 1,326 104 274 15 38.8 55.0 57,176 1,430 289 40.0
San Bernardino 53,488 7,108 1,319 130 231 19 40.6 54.6 60,596 1,449 250 41.8
Ventura 18,679 954 517 21 111 3 36.1 45.1 19,633 538 114 36.5
Region Total 415,642 30,201 12,786 664 3,481 140 32.5 45.5 445,843 13,450 3,621 33.1
* Value is less than 1,000.Numbers may not sum to total due to rounding.
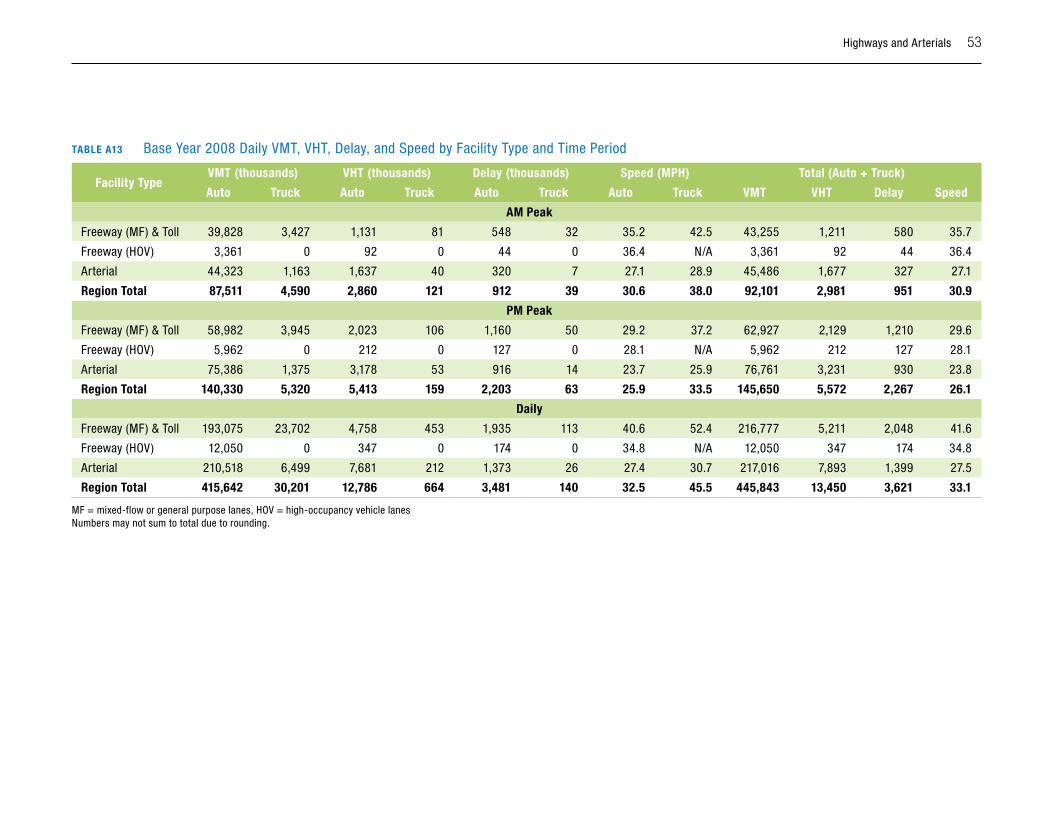
Highways and Arterials 53
TAbLE A13 Base Year 2008 Daily VMT, VHT, Delay, and Speed by Facility Type and Time Period
Facility TypeVMT (thousands) VHT (thousands) Delay (thousands) Speed (MPH) Total (Auto + Truck)
Auto Truck Auto Truck Auto Truck Auto Truck VMT VHT Delay Speed
AM Peak
Freeway (MF) & Toll 39,828 3,427 1,131 81 548 32 35.2 42.5 43,255 1,211 580 35.7
Freeway (HOV) 3,361 0 92 0 44 0 36.4 N/A 3,361 92 44 36.4
Arterial 44,323 1,163 1,637 40 320 7 27.1 28.9 45,486 1,677 327 27.1
Region Total 87,511 4,590 2,860 121 912 39 30.6 38.0 92,101 2,981 951 30.9
PM Peak
Freeway (MF) & Toll 58,982 3,945 2,023 106 1,160 50 29.2 37.2 62,927 2,129 1,210 29.6
Freeway (HOV) 5,962 0 212 0 127 0 28.1 N/A 5,962 212 127 28.1
Arterial 75,386 1,375 3,178 53 916 14 23.7 25.9 76,761 3,231 930 23.8
Region Total 140,330 5,320 5,413 159 2,203 63 25.9 33.5 145,650 5,572 2,267 26.1
Daily
Freeway (MF) & Toll 193,075 23,702 4,758 453 1,935 113 40.6 52.4 216,777 5,211 2,048 41.6
Freeway (HOV) 12,050 0 347 0 174 0 34.8 N/A 12,050 347 174 34.8
Arterial 210,518 6,499 7,681 212 1,373 26 27.4 30.7 217,016 7,893 1,399 27.5
Region Total 415,642 30,201 12,786 664 3,481 140 32.5 45.5 445,843 13,450 3,621 33.1
MF = mixed-flow or general purpose lanes, HOV = high-occupancy vehicle lanesNumbers may not sum to total due to rounding.
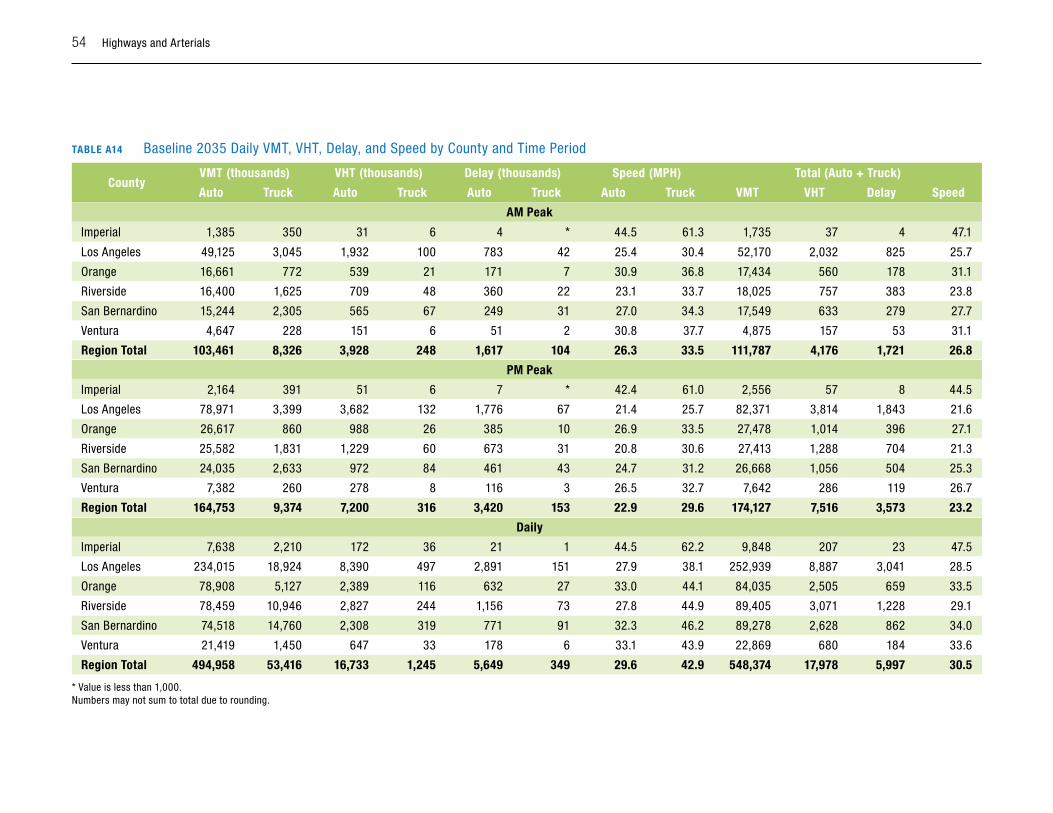
54 Highways and Arterials
TAbLE A14 Baseline 2035 Daily VMT, VHT, Delay, and Speed by County and Time Period
CountyVMT (thousands) VHT (thousands) Delay (thousands) Speed (MPH) Total (Auto + Truck)
Auto Truck Auto Truck Auto Truck Auto Truck VMT VHT Delay Speed
AM Peak
Imperial 1,385 350 31 6 4 * 44.5 61.3 1,735 37 4 47.1
Los Angeles 49,125 3,045 1,932 100 783 42 25.4 30.4 52,170 2,032 825 25.7
Orange 16,661 772 539 21 171 7 30.9 36.8 17,434 560 178 31.1
Riverside 16,400 1,625 709 48 360 22 23.1 33.7 18,025 757 383 23.8
San Bernardino 15,244 2,305 565 67 249 31 27.0 34.3 17,549 633 279 27.7
Ventura 4,647 228 151 6 51 2 30.8 37.7 4,875 157 53 31.1
Region Total 103,461 8,326 3,928 248 1,617 104 26.3 33.5 111,787 4,176 1,721 26.8
PM Peak
Imperial 2,164 391 51 6 7 * 42.4 61.0 2,556 57 8 44.5
Los Angeles 78,971 3,399 3,682 132 1,776 67 21.4 25.7 82,371 3,814 1,843 21.6
Orange 26,617 860 988 26 385 10 26.9 33.5 27,478 1,014 396 27.1
Riverside 25,582 1,831 1,229 60 673 31 20.8 30.6 27,413 1,288 704 21.3
San Bernardino 24,035 2,633 972 84 461 43 24.7 31.2 26,668 1,056 504 25.3
Ventura 7,382 260 278 8 116 3 26.5 32.7 7,642 286 119 26.7
Region Total 164,753 9,374 7,200 316 3,420 153 22.9 29.6 174,127 7,516 3,573 23.2
Daily
Imperial 7,638 2,210 172 36 21 1 44.5 62.2 9,848 207 23 47.5
Los Angeles 234,015 18,924 8,390 497 2,891 151 27.9 38.1 252,939 8,887 3,041 28.5
Orange 78,908 5,127 2,389 116 632 27 33.0 44.1 84,035 2,505 659 33.5
Riverside 78,459 10,946 2,827 244 1,156 73 27.8 44.9 89,405 3,071 1,228 29.1
San Bernardino 74,518 14,760 2,308 319 771 91 32.3 46.2 89,278 2,628 862 34.0
Ventura 21,419 1,450 647 33 178 6 33.1 43.9 22,869 680 184 33.6
Region Total 494,958 53,416 16,733 1,245 5,649 349 29.6 42.9 548,374 17,978 5,997 30.5
* Value is less than 1,000.Numbers may not sum to total due to rounding.
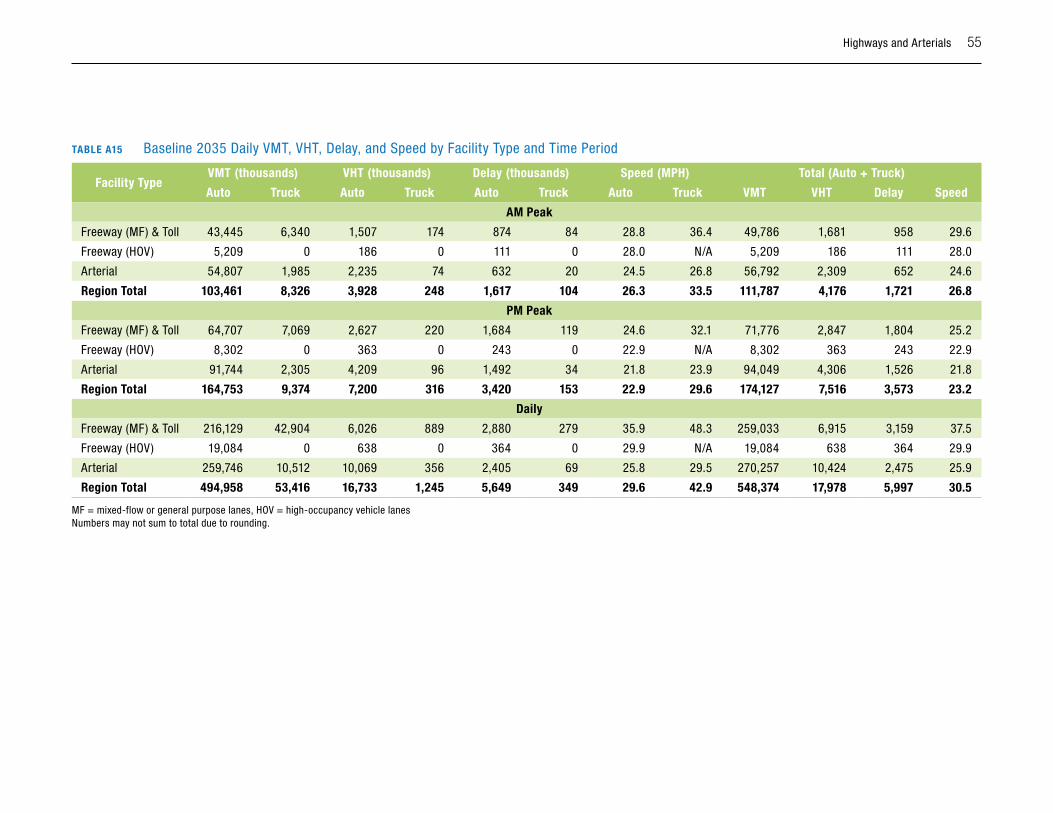
Highways and Arterials 55
TAbLE A15 Baseline 2035 Daily VMT, VHT, Delay, and Speed by Facility Type and Time Period
Facility TypeVMT (thousands) VHT (thousands) Delay (thousands) Speed (MPH) Total (Auto + Truck)
Auto Truck Auto Truck Auto Truck Auto Truck VMT VHT Delay Speed
AM Peak
Freeway (MF) & Toll 43,445 6,340 1,507 174 874 84 28.8 36.4 49,786 1,681 958 29.6
Freeway (HOV) 5,209 0 186 0 111 0 28.0 N/A 5,209 186 111 28.0
Arterial 54,807 1,985 2,235 74 632 20 24.5 26.8 56,792 2,309 652 24.6
Region Total 103,461 8,326 3,928 248 1,617 104 26.3 33.5 111,787 4,176 1,721 26.8
PM Peak
Freeway (MF) & Toll 64,707 7,069 2,627 220 1,684 119 24.6 32.1 71,776 2,847 1,804 25.2
Freeway (HOV) 8,302 0 363 0 243 0 22.9 N/A 8,302 363 243 22.9
Arterial 91,744 2,305 4,209 96 1,492 34 21.8 23.9 94,049 4,306 1,526 21.8
Region Total 164,753 9,374 7,200 316 3,420 153 22.9 29.6 174,127 7,516 3,573 23.2
Daily
Freeway (MF) & Toll 216,129 42,904 6,026 889 2,880 279 35.9 48.3 259,033 6,915 3,159 37.5
Freeway (HOV) 19,084 0 638 0 364 0 29.9 N/A 19,084 638 364 29.9
Arterial 259,746 10,512 10,069 356 2,405 69 25.8 29.5 270,257 10,424 2,475 25.9
Region Total 494,958 53,416 16,733 1,245 5,649 349 29.6 42.9 548,374 17,978 5,997 30.5
MF = mixed-flow or general purpose lanes, HOV = high-occupancy vehicle lanesNumbers may not sum to total due to rounding.
56 Highways and Arterials
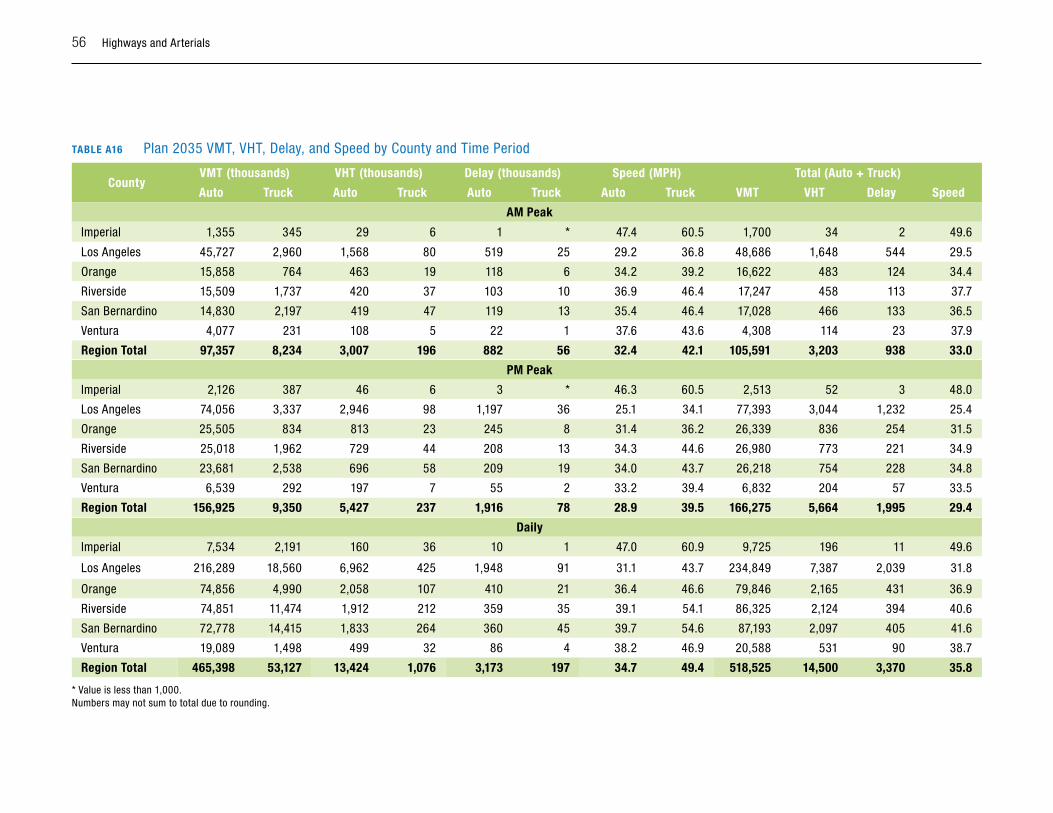
TAbLE A16 Plan 2035 VMT, VHT, Delay, and Speed by County and Time Period
CountyVMT (thousands) VHT (thousands) Delay (thousands) Speed (MPH) Total (Auto + Truck)
Auto Truck Auto Truck Auto Truck Auto Truck VMT VHT Delay Speed
AM Peak
Imperial 1,355 345 29 6 1 * 47.4 60.5 1,700 34 2 49.6
Los Angeles 45,727 2,960 1,568 80 519 25 29.2 36.8 48,686 1,648 544 29.5
Orange 15,858 764 463 19 118 6 34.2 39.2 16,622 483 124 34.4
Riverside 15,509 1,737 420 37 103 10 36.9 46.4 17,247 458 113 37.7
San Bernardino 14,830 2,197 419 47 119 13 35.4 46.4 17,028 466 133 36.5
Ventura 4,077 231 108 5 22 1 37.6 43.6 4,308 114 23 37.9
Region Total 97,357 8,234 3,007 196 882 56 32.4 42.1 105,591 3,203 938 33.0
PM Peak
Imperial 2,126 387 46 6 3 * 46.3 60.5 2,513 52 3 48.0
Los Angeles 74,056 3,337 2,946 98 1,197 36 25.1 34.1 77,393 3,044 1,232 25.4
Orange 25,505 834 813 23 245 8 31.4 36.2 26,339 836 254 31.5
Riverside 25,018 1,962 729 44 208 13 34.3 44.6 26,980 773 221 34.9
San Bernardino 23,681 2,538 696 58 209 19 34.0 43.7 26,218 754 228 34.8
Ventura 6,539 292 197 7 55 2 33.2 39.4 6,832 204 57 33.5
Region Total 156,925 9,350 5,427 237 1,916 78 28.9 39.5 166,275 5,664 1,995 29.4
Daily
Imperial 7,534 2,191 160 36 10 1 47.0 60.9 9,725 196 11 49.6
Los Angeles 216,289 18,560 6,962 425 1,948 91 31.1 43.7 234,849 7,387 2,039 31.8
Orange 74,856 4,990 2,058 107 410 21 36.4 46.6 79,846 2,165 431 36.9
Riverside 74,851 11,474 1,912 212 359 35 39.1 54.1 86,325 2,124 394 40.6
San Bernardino 72,778 14,415 1,833 264 360 45 39.7 54.6 87,193 2,097 405 41.6
Ventura 19,089 1,498 499 32 86 4 38.2 46.9 20,588 531 90 38.7
Region Total 465,398 53,127 13,424 1,076 3,173 197 34.7 49.4 518,525 14,500 3,370 35.8
* Value is less than 1,000.Numbers may not sum to total due to rounding.
Highways and Arterials 57
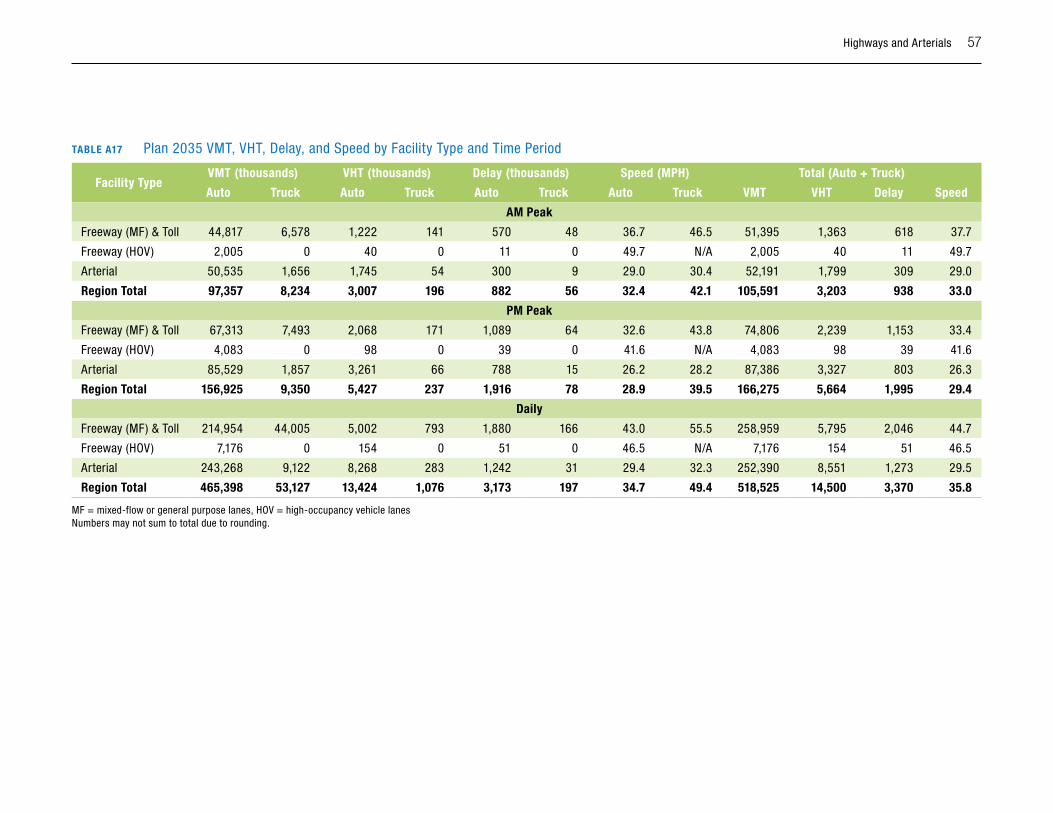
TAbLE A17 Plan 2035 VMT, VHT, Delay, and Speed by Facility Type and Time Period
Facility TypeVMT (thousands) VHT (thousands) Delay (thousands) Speed (MPH) Total (Auto + Truck)
Auto Truck Auto Truck Auto Truck Auto Truck VMT VHT Delay Speed
AM Peak
Freeway (MF) & Toll 44,817 6,578 1,222 141 570 48 36.7 46.5 51,395 1,363 618 37.7
Freeway (HOV) 2,005 0 40 0 11 0 49.7 N/A 2,005 40 11 49.7
Arterial 50,535 1,656 1,745 54 300 9 29.0 30.4 52,191 1,799 309 29.0
Region Total 97,357 8,234 3,007 196 882 56 32.4 42.1 105,591 3,203 938 33.0
PM Peak
Freeway (MF) & Toll 67,313 7,493 2,068 171 1,089 64 32.6 43.8 74,806 2,239 1,153 33.4
Freeway (HOV) 4,083 0 98 0 39 0 41.6 N/A 4,083 98 39 41.6
Arterial 85,529 1,857 3,261 66 788 15 26.2 28.2 87,386 3,327 803 26.3
Region Total 156,925 9,350 5,427 237 1,916 78 28.9 39.5 166,275 5,664 1,995 29.4
Daily
Freeway (MF) & Toll 214,954 44,005 5,002 793 1,880 166 43.0 55.5 258,959 5,795 2,046 44.7
Freeway (HOV) 7,176 0 154 0 51 0 46.5 N/A 7,176 154 51 46.5
Arterial 243,268 9,122 8,268 283 1,242 31 29.4 32.3 252,390 8,551 1,273 29.5
Region Total 465,398 53,127 13,424 1,076 3,173 197 34.7 49.4 518,525 14,500 3,370 35.8
MF = mixed-flow or general purpose lanes, HOV = high-occupancy vehicle lanesNumbers may not sum to total due to rounding.
Regional officesImperial County1405 North Imperial AvenueSuite 1 El Centro, CA 92243 Phone: (760) 353-7800 Fax: (760) 353-1877
Orange CountyOCTA Building 600 South Main StreetSuite 906 Orange, CA 92863 Phone: (714) 542-3687 Fax: (714) 560-5089
Riverside County3403 10th StreetSuite 805 Riverside, CA 92501 Phone: (951) 784-1513 Fax: (951) 784-3925
San Bernardino CountySanta Fe Depot 1170 West 3rd StreetSuite 140 San Bernardino, CA 92410 Phone: (909) 806-3556 Fax: (909) 806-3572
Ventura County950 County Square DriveSuite 101 Ventura, CA 93003 Phone: (805) 642-2800 Fax: (805) 642-2260
818 West 7th Street, 12th Floor Los Angeles, CA 90017 Phone: (213) 236-1800 Fax: (213) 236-1825www.scag.ca.gov
please recycle 2347 2012.04.12please recycle 2347 2012.04.12