rubie/renee comparative assessment - gov.uk
TRANSCRIPT

Rubie/ Renee – Decommissioning Comparative Assessment
A part of BMT in Energy and Environment
Reference: END.012
Client: Endeavour Energy UK Ltd
Date: November 2013
Confidential

Intentionally blank page

Rubie/ Renee – Decommissioning Comparative Assessment
BMT Cordah Limited November 2013
Document Control
Document Title Rubie/ Renee – Decommissioning Comparative Assessment
Client Project Title Comparative Assessment for buried Rubie/ Renee Facilities
Client Endeavour Energy UK Ltd.
BMT Cordah Document Ref. A.END.012
Client Document Ref. EEUK RR CA
Rev. 3.0
Terms This report is confidential. No part may be cited without the express permission of BMT Cordah Ltd or Endeavour Energy UK Ltd. It must not be published or made available in any publicly available form such as a website without written permission. Additionally, to minimise the risk of identity fraud, this page containing signatures must be removed.
Rev. Description Prepared Checked Approved Date
1.0 First Issue to client M Ferguson D Sell J Ferris 16/09/2013
2.0 Second Issue to client D McCormack D Sell D Murrison 19/09/2013
3.0 Issue for consultation D McCormack J Butler N DiPerno 14/11/2013
Broadfold House
Broadfold Road
Bridge of Don, Aberdeen
UK, AB23 8EE
Tel: +44(0)1224 414200
Fax: +44(0)1224 414250
Email: [email protected]
Website: www.bmtcordah.com

Rubie/ Renee – Decommissioning Comparative Assessment
BMT Cordah Limited November 2013
Intentionally blank page

Rubie/ Renee – Decommissioning Comparative Assessment
BMT Cordah Limited November 2013
Contents
0.0 NON-TECHNICAL SUMMARY ......................................................................... 1
1.0 INTRODUCTION ............................................................................................... 2
2.0 BACKGROUND ................................................................................................ 2
3.0 ENVIRONMENTAL AND SOCIETAL SETTING ............................................... 2
4.0 RUBIE/ RENEE INFRASTRUCTURE WITHIN THE CA SCOPE ...................... 4
4.1 INFRASTRUCTURE NOT WITHIN SCOPE ...................................................... 4
4.2 STUDY PARAMETERS AND CONSIDERATIONS .......................................... 4
5.0 METHODOLOGY .............................................................................................. 8
5.1 COMPARATIVE ASSESSMENT TEAM ........................................................... 8
5.2 ASSESSMENT CRITERIA ................................................................................ 9
5.3 ASSESSMENT SCORING ................................................................................ 9
6.0 DECOMMISSIONING OPTIONS ASSESSED IN THE CA .............................. 10
6.1 OPTION 1: LEAVE IN PLACE ........................................................................ 10
6.2 OPTION 2: RECOVER TO SHORE ................................................................ 10
7.0 RESULTS ....................................................................................................... 12
7.1 DIFFERENTIATION BETWEEN OPTIONS .................................................... 13
8.0 CONCLUSIONS .............................................................................................. 15
8.1 IN SUMMARY ................................................................................................. 15
9.0 REFERENCES ............................................................................................... 15
APPENDICES ................................................................................................................ 16
APPENDIX 1: ENVIRONMENTAL & SOCIOECONOMIC SENSITIVITIES .................... 17
APPENDIX 2: OPTIONS DISMISSED AFTER INITIAL SCREENING ............................ 21
APPENDIX 3: ASSESSMENT OF SAFETY RISKS ....................................................... 25
APPENDIX 4: ASSESSMENT OF ENVIRONMENTAL AND SOCIETAL RISKS ........... 31
APPENDIX 5: ENERGY USAGE AND EMISSIONS ESTIMATES ................................. 47
APPENDIX 6: COST ESTIMATES ................................................................................. 55

Rubie/ Renee – Decommissioning Comparative Assessment
BMT Cordah Limited November 2013
Intentionally blank page

Rubie/ Renee – Decommissioning Comparative Assessment
BMT Cordah Limited 1 November 2013
0.0 NON-TECHNICAL SUMMARY
Endeavour Energy UK Ltd (Endeavour), undertook a Comparative Assessment (CA) of
feasible decommissioning options for six redundant lines that remained trenched and
buried after the cessation of operations at the Rubie/ Renee field (Blocks 15/28b and
15/27, respectively) in the central North Sea.
Initially seven methods were considered for the decommissioning of buried pipelines at
the Rubie/ Renee field location. Based on technical feasibility and resource availability
these methods were narrowed down to the two most feasible, namely:
Option 1 Leave in Place where a relatively short offshore programme will render the pipelines overtrawlable with the pipelines remaining undisturbed below the sediment surface; and
Option 2: Recovery for Disposal Onshore where a more prolonged and complex offshore programme will be undertaken to uncover and remove pipelines and associated infrastructure from the seabed for transportation to shore for recycling and/or disposal.
The CA provided a framework for assessing and assigning scores to six performance
attributes and then ranking the two decommissioning options to enable a balanced
comparison to be used to identify the preferred option. The six attributes were:
Technical feasibility;
Safety;
Environmental impact;
Energy usage and emissions;
Societal impact; and
Cost.
The results of the CA revealed a strong differentiation between the two options on the
basis of the following criteria.
Option 1: Leave in Place scored higher in the assessments for: Technical feasibility, Safety, and Cost.
Option 2: Recovery for Disposal Onshore scored higher in the assessment of: Energy usage and emissions.
Both Environmental Impact and Societal impact provided a weak basis for differentiation.
From the CA it was concluded that Option 1: Leave in Place is Endeavour’s preferred
option for the decommissioning of the Rubie/ Renee trenched lines. During the
decommissioning programme controlled placement of rock dump will cover the exposed
cut ends of lines at trench transitions and pre-determined sections of line (estimated as
1.95 km out of a total line length of 64.9km) where surveys have found that burial depth
is considered inadequate (i.e. less than 0.6m).
A suitable monitoring programme appropriate to the final strategy and mitigation
procedure will be agreed with DECC in consultation with other departments. These
details are specified further in the decommissioning programme.

Rubie/ Renee – Decommissioning Comparative Assessment
BMT Cordah Limited 2 November 2013
1.0 INTRODUCTION
This report describes the Comparative Assessment (CA) of feasible decommissioning
options, for six redundant lines and associated umbilicals. These trenched and buried
lines formed part of the subsea infrastructure of the decommissioned Rubie/ Renee Field
Development, in Blocks 15/28b and 15/27, respectively of the central North Sea.
Endeavour undertook a CA in line with DECC’s ‘Guidance Notes: Decommissioning of
Offshore Installations under the Petroleum Act 1998’ (DECC, 2011).
The Rubie/ Renee Facilities are located in UK Continental Shelf (UKCS) Blocks 15/21,
15/26, 15/27 and 15/28 of the central North Sea, approximately 115 km east of the UK
coastline and approximately 60 km west of the UK/Norway median line (Figure 1). Water
depth at the Rubie/ Renee Facilities ranges between 113 to 150 m. The Rubie and
Renee fields are located in Blocks 15/28 and 15/27 respectively, and lie approximately
six kilometres apart.
2.0 BACKGROUND
The Rubie and Renee fields were developed as subsea wells tie-backs to the Hess
operated Floating Production Facility (FPF) AH001, located 21 km to the northwest of the
Renee field. Hess disconnected and removed the AH001 FPF as part of the Ivanhoe,
Rob Roy and Hamish (IVRRH) Decommissioning Programme in 2009.
Decommissioning preparatory work for Rubie/ Renee was completed by Hess in 2011
and involved the disconnection of the in-field pipelines and jumpers from the wells which
were laid on the seabed. Endeavour had anticipated redeveloping the Rubie/ Renee
fields once Endeavour’s Rochelle Development became operational. However, during
2012, it was determined by Endeavour that the redevelopment of the Rubie/ Renee fields
was no longer viable and as a result the decision was taken by Endeavour to
decommission the facilities and fields.
At the point of the removal of the AH001 FPF, the four 21.6 km pipelines and two 5.6 km
pipelines were pigged, flushed and capped, or remained connected to the closed
manifold valves and then filled with inhibited seawater prior to abandonment.
The lines (pipelines and umbilicals) to be decommissioned (Figure 2) lie buried within six
individual trenches containing:
PL1616, PL1617, and PL1618 along with its piggybacked line PL1620 within three 21.6 km trenches;
PL1619 within a single 21.6 km trench
PL1624 and the piggybacked line PL1625 within a single 5.6 km trench; and
PL1626 within a single 5.5 km trench.
3.0 ENVIRONMENTAL AND SOCIETAL SETTING
Appendix 1 provides an overview of the environmental and socioeconomic
characteristics and sensitivities in the sea area around the Rubie/ Renee Field
Development.

Rubie/ Renee – Decommissioning Comparative Assessment
BMT Cordah Limited 3 November 2013
Figure 1: Location of the suspended Rubie/ Renee facilities

Rubie/ Renee – Decommissioning Comparative Assessment
BMT Cordah Limited 4 November 2013
4.0 RUBIE/ RENEE INFRASTRUCTURE WITHIN THE CA SCOPE
In accordance with DECC’s Guidance Notes (DECC, 2011), the CA scope covers the
comparison of the decommissioning options for six redundant lines which are currently
trenched and buried. For a description and inventory of materials see Table 1.
Lines (pipelines and umbilicals) to be decommissioned include:
4 x 21.6km pipelines (production (x2), gas lift and water injection) and associated 21.6 km umbilicals.
2 x 5.6 km pipelines (production and gas lift) and associated 5.5 km umbilicals.
4.1 Infrastructure not within scope
The CA scope does not include:
Surface laid mattresses currently used to protect pipeline ends and crossings;
Surface laid spool pieces, production and gas lift jumpers and hydraulic line; and
On-seabed structures including: the Renee Manifold, Dynamic Umbilical Base, Crossover Structure, two production wellheads and one gas lift wellhead.
In line with DECC’s Guidance Notes (2011) a CA is not required as these redundant
structures will be decommissioned by recovery, leading to re-use, recycling or final
disposal onshore.
4.2 Study parameters and considerations
The starting assumption is that the work scope for decommissioning the six lines will be
discrete, and will not be combined with that for decommissioning the other Renee and
Rubie infrastructure or for the adjacent Ivanhoe and Rob Roy infrastructure which is the
responsibility of Hess. This simplification enables a clear boundary to be placed around
the assessments to be made under the scope of the CA.
During preparatory works for decommissioning, the ends of the static lines will be
exposed (excavation by jetting) and a section of the line and/or its flexible connecter will
be cut out to allow access to the ends of the lines. These preparatory activities will apply
to all options.
Two pre-existing characteristics of the pipelines affect decommissioning:
Pipeline integrity: Serious corrosion was detected at one location on PL1616. This was repaired by fitting a clamp which has remained in situ since its installation.
Exposure: There are areas where the lines have been uncovered due to natural movement of seabed sediments (Table 2).

Rubie/ Renee – Decommissioning Comparative Assessment
BMT Cordah Limited 5 November 2013
Figure 2: Schematic diagram of the Rubie/ Renee Facilities layout

Rubie/ Renee – Decommissioning Comparative Assessment
BMT Cordah Limited 6 November 2013
Table 1: Materials Inventory for infrastructure to be decommissioned
Pipeline* Description Length (km)
Location/Associated with Mass of individual metals (tonne) Mass for all metals
(tonne)
Mass for plastics (tonne)
Total mass of
materials (tonne)
Steel Aluminium Copper
PL1616 8” test pipeline 21.6 from the Renee Production Manifold (RPM) to the riser base manifold.
1,383.4 22.1 0.007 1,405.5 441.8 1,847.3
PL1617 8” oil pipeline 21.6 from RPM to the riser base manifold. 1,383.4 22.1 0.000 1,405.5 441.8 1,847.3
PL1618 4” gas lift pipeline 21.6 from the RPM to the riser base manifold (piggybacked to PL1620).
342.9 3.7 0.000 346.6 15.6 362.2
PL1619 Umbilicals 21.6 from the RPM to the riser base manifold. 347.27 0 10.87 358.14 185.13 543.27
PL1620 8” water injection pipeline 21.6 from WI 1 to the riser base manifold. 1,396.3 6.8 0.014 1,403.1 29.6 1,432.7
PL1624 8” oil pipeline 5.6 connects the Rubie production well to the RPM. 358.7 0 0 358.7 114.8 473.4
PL1625 3” gas lift pipeline 5.6 connects the RPM to the Rubie production well. This pipeline was piggybacked with the 8” production pipeline (PL1624).
55.4 0 0 55.4 3.2 58.5
PL1626 Umbilicals 5.6 line containing chemical umbilicals from the RPM to the Rubie wellhead.
92.4 0 2.89 95.3 49.3 144.68
Total 5,346.92 54.7 13.78 5,415.41 1,281.1 6,696.5
* The masses of pipeline materials have been adjusted to account for the removal during the preparatory work for decommissioning of a 200m length of line from PL1616, PL1617, PL1618 and PL1619 (160 m at the crossing and 10m at each of the two trench transitions) and 40m from PL1624, PL1625 and the umbilical PL1626.1 to PL1628 (20m at each end). Because the removal of these materials applies equally to each considered option, the CA does not consider implications of removal.

Rubie/ Renee – Decommissioning Comparative Assessment
BMT Cordah Limited 7 November 2013
Table 2: Flowline exposure status
Pipeline status (2013 survey)
Pipelines Totals for the three pipeline routes (km)
PL1616 PL1617 PL1618 / PL1620
Length buried (km) 13.436 15.399 19.581 48.416
Length covered by mattresses and/or rockdump (km)
7.52 5.583 1.432 14.535
Length exposed (km) 0.654 0.651 0.648 1.953
Spanned length included within length exposed (km)
0.309 0.216 0.283 0.808
Total length (km) 21.61 21.633 21.661 64.904
Source: Summary of pipeline inspections collated by Endeavour, 2013
The occurrence of NORM is not an issue with the R-Block pipelines (Endeavour pers.
comm, 28.06.13).

Rubie/ Renee – Decommissioning Comparative Assessment
BMT Cordah Limited 8 November 2013
5.0 METHODOLOGY
The following section details the CA process by which the most appropriate options for
decommissioning of the trenched pipelines will be assessed.
5.1 Comparative Assessment Team
This CA has been undertaken by the following personnel from both Endeavour and BMT
Cordah Ltd (BMT):
Endeavour Energy UK Ltd
o Nick Ritchie, Director – Facilities, Engineering & New Developments,
o Tom Milne, Asset Integrity Manager,
BMT Cordah Ltd
o Dr David Sell, Technical Associate,
o Dr Joe Ferris, Associate Director,
o Dr MacNeill Ferguson, Lead Senior Consultant, and
o Dr Deborah McCormack, Consultant.
5.1.1 Initial screening
The following seven decommissioning methods were initially considered for the
decommissioning of buried pipelines at the Rubie/ Renee field location:
1. Leave in place;
2. Recovery by reverse reel;
3. Recovery by reverse lay;
4. Long section recovery;
5. Towed recovery;
6. Short section recovery (cut-and-lift); and
7. J-lift recovery.
This screening exercise was undertaken to eliminate methods considered unsuitable for
the decommissioning based on technical feasibility and resource availability (Appendix 2
provides a description of options not selected). On the basis of this initial screening, the
CA will provide a comparison of:
Option 1: Leave in Place
Option 2: Removal by Reverse Reel for the majority of the lines, in combination with Option 6: Short Section Recovery for corroded sections unsuitable for reverse reeling. Short Section Recovery may also be used where lines have tight bends or other constrictions.
The remainder of this report focuses solely on the selected decommissioning options.

Rubie/ Renee – Decommissioning Comparative Assessment
BMT Cordah Limited 9 November 2013
5.2 Assessment Criteria
The individual decommissioning options were assessed against the following criteria
provided in DECC’s Guidance Notes (DECC, 2011).
Technical Feasibility
A qualitative assessment of Technical Feasibility and Recoverability from Major Project Failure. Section 7
provides the result of the assessment.
Safety
A quantitative assessment of Potential Loss of Life of personnel working on the decommissioning options
using the method given in Safetec (1995). Appendix 3 provides the methodology and detailed results.
Environmental Impact
(a) Qualitative assessment of Environmental Risks onshore and offshore using a risk assessment matrix;
and
(b) Quantitative estimation of Energy Usage and CO2 Emissions using the method given in Energy Institute
(2000). Appendix 4 provides the methodology and detailed results for the environmental risk assessment.
Appendix 5 provides the corresponding information on energy usage and emissions.
Societal Impact
A qualitative assessment of Societal Risks onshore and offshore using a risk assessment matrix. Appendix 4
provides the methodology and detailed results.
Cost
A quantitative estimation of Cost for each option. Appendix 6 provides the cost breakdown.
5.3 Assessment Scoring
Initially, the scores from each of the assessments were expressed in their respective
quantitative and qualitative units. Justification for the scores assigned during the
assessments, as well as assumptions and limitations was noted. To enable a
comparison to be made of the options, the results were then collated and compared
using a normalised scoring system where the results of each of the five assessments
were expressed in common units of: One (1) for the top (‘better’) option; and Zero (0) for
the bottom (‘poorer’) option.
An overall score was established by totalling the normalised scores of the six
assessments and comparing the totals. Endeavour used the output from the CA to select
its preferred decommissioning option, with the CA report documenting the justification for
their choice. DECC’s Guidance Notes (DECC, 2011) make provision for weightings to be
assigned to the scoring for the individual assessments to reflect the priorities or policies
of the operator or its stakeholders. Endeavour has weighted options as follows:
30% 20% 15 % 10%
Safety Cost Technical Feasibility Energy & Emissions
Environmental Impact Societal Impact

Rubie/ Renee – Decommissioning Comparative Assessment
BMT Cordah Limited 10 November 2013
6.0 DECOMMISSIONING OPTIONS ASSESSED IN THE CA
The following section details the scope of works (onshore and offshore) required for both
options considered as part of the CA process.
6.1 Option 1: Leave in place
The intended decommissioning outcome is for the pipelines to remain undisturbed and
adequately buried below seabed level over the long-term, thereby creating an
unobstructed seabed. If on completion of the survey, the depth of burial is not found to
be adequate then these materials will be recovered (as in Option 2). The following
section details the proposed work scope required to decommission the lines in place.
6.1.1 Proposed work scope for Option1: Leave in place
Offshore
A DSV with saturation dive spread and lifting equipment will be used to:
o prepare the seabed at pipeline trench transition for rockdumping.
A CSV or supply boat will be used for:
o jetting/excavation carried out remotely using an ROV.
A rockdump vessel will carry out the controlled placement of rockdump over the trench transitions and any other pre-determined vulnerable locations.
A guard vessel will be on station throughout these operations.
A fishing trawler with a ground beam will carry out a seabed clearance survey.
In accordance with Section 29 of the Petroleum Act 1998, Endeavour has an indefinite liability for pipeline materials left in situ. Therefore, post-decommissioning monitoring will be carried out to assess the physical, chemical and ecological condition of the seabed, ensure that lines remain adequately buried and the seabed remains free from obstruction to other sea users. For the assessment purposes, the CA nominally allows for two post-decommissioning surveys.
6.2 Option 2: Recover to shore
The intended decommissioning outcome is an unobstructed seabed, the reuse or
recycling of all possible pipeline materials and the long-term deposition of non-recyclable
materials to landfill. The following section details the proposed work scope to
decommission the lines via recovery to shore.

Rubie/ Renee – Decommissioning Comparative Assessment
BMT Cordah Limited 11 November 2013
6.2.1 Proposed work scope for Option 2: Recover to shore
Offshore
A DSV with saturation dive spread, cutting, jetting and lifting equipment will expose around 20m to 30m of the line, then cut and clamp on an abandonment recovery head, which will be pre-rigged for pick-up by an ROV deployed from the reel vessel.
The recovered line will pass through the tensioner system and on to the carousel on the reel vessel, which will then commence back-reeling.
A jetting vessel, trencher or other suitable vessel will travel along the pipeline route in advance of the reel vessel and will use remotely operated jetting equipment, trenching plough or other methods to displace seabed sediments and expose the pipeline to facilitate reel vessel recovery.
A dynamically positioned reel vessel (fitted with one or more carousels) will continuously recover the pipeline which will be spooled onto the carousel(s). Once the carousel(s) are full, the reel vessel will return to the spool base onshore to offload the pipelines. It will then redeploy and continue the work. The CA assumes three round trips between spool base and work location.
A DSV with saturation dive spread, cutting equipment (hydraulic bandsaw, shears or other type of equipment) and lifting equipment will cut and recover the sections of line designated for removal by the short section recovery method. These sections will be cut into manageable lengths and stored on the DSV's deck prior to return to shore or crane lift onto a supply vessel or CSV.
A CSV and/or supply vessel will:
o transport redundant sections of pipeline to port for recycling/disposal.
o carry out remotely operated jetting and excavation using an ROV
A jetting vessel, trencher or other suitable vessel will travel along the pipeline routes for a second pass using remotely operated jetting equipment, a backfill plough or other methods to fill in the trench and flatten mounds of displaced sediments created by the recovery of the 21.6 km and 5.6 km lines.
A guard vessel will be on station throughout these operations.
A fishing trawler with a ground beam will carry out a seabed clearance survey.
Post-decommissioning monitoring to assess the physical, chemical and ecological condition of the seabed. For the assessment purposes, the CA nominally allows for two post-decommissioning surveys.
Onshore
At the spool base, the lines will be unspooled on to the quayside, and then cut into lorry-load lengths for transport to the recycling and disposal facilities.
Disposal Options
The CA assumes that:
road haulage will be used, with an estimate of 600km for metal recycling (e.g. round trip from a spool base in Northern Scotland to a recycling facility in the Central Belt), and
all of the recovered pipeline materials will be recycled (actual figure may be around 95%).
Rubie/ Renee – Decommissioning Comparative Assessment
BMT Cordah Limited 12 November 2013
7.0 RESULTS
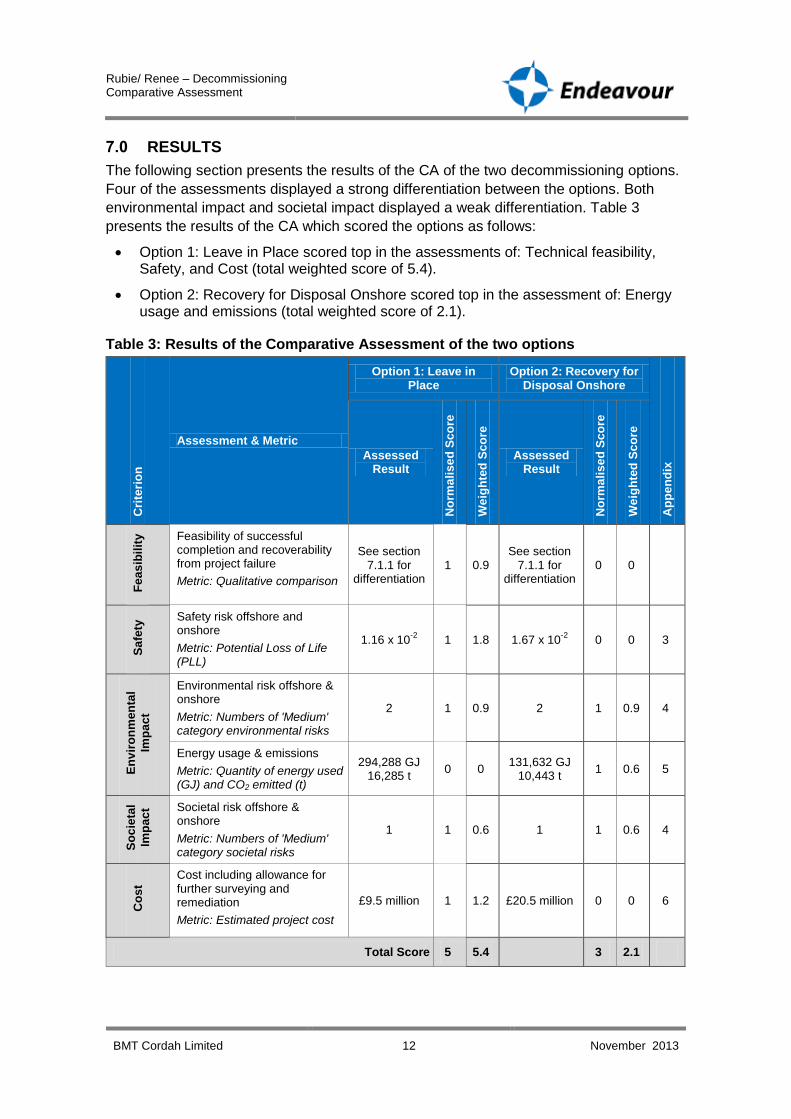
The following section presents the results of the CA of the two decommissioning options.
Four of the assessments displayed a strong differentiation between the options. Both
environmental impact and societal impact displayed a weak differentiation. Table 3
presents the results of the CA which scored the options as follows:
Option 1: Leave in Place scored top in the assessments of: Technical feasibility, Safety, and Cost (total weighted score of 5.4).
Option 2: Recovery for Disposal Onshore scored top in the assessment of: Energy usage and emissions (total weighted score of 2.1).
Table 3: Results of the Comparative Assessment of the two options
Cri
teri
on
Assessment & Metric
Option 1: Leave in Place
Option 2: Recovery for Disposal Onshore
Ap
pe
nd
ix Assessed
Result
No
rma
lis
ed
Sc
ore
We
igh
ted
Sc
ore
Assessed Result
No
rma
lis
ed
Sc
ore
We
igh
ted
Sc
ore
Fe
as
ibil
ity
Feasibility of successful completion and recoverability from project failure
Metric: Qualitative comparison
See section 7.1.1 for
differentiation 1 0.9
See section 7.1.1 for
differentiation 0 0
Sa
fety
Safety risk offshore and onshore
Metric: Potential Loss of Life (PLL)
1.16 x 10⁻²
1 1.8 1.67 x 10⁻²
0 0 3
En
vir
on
men
tal
Imp
ac
t
Environmental risk offshore & onshore
Metric: Numbers of 'Medium' category environmental risks
2 1 0.9 2 1 0.9 4
Energy usage & emissions
Metric: Quantity of energy used (GJ) and CO2 emitted (t)
294,288 GJ 16,285 t
0 0 131,632 GJ
10,443 t 1 0.6 5
So
cie
tal
Imp
ac
t Societal risk offshore & onshore
Metric: Numbers of 'Medium' category societal risks
1 1 0.6 1 1 0.6 4
Co
st
Cost including allowance for further surveying and remediation
Metric: Estimated project cost
£9.5 million 1 1.2 £20.5 million 0 0 6
Total Score 5 5.4 3 2.1

Rubie/ Renee – Decommissioning Comparative Assessment
BMT Cordah Limited 13 November 2013
7.1 Differentiation between options
This section highlights why the considered options were strongly or weakly differentiated
and provides a more detailed justification for the scores awarded to each option.
7.1.1 Feasibility differentiation
Both options were considered technically feasible and operationally proven. Vessels with
experienced crews routinely carry out pipeline repair, installation, maintenance, recovery,
jetting, trenching and rock dumping operations on the UKCS which are similar to those
outlined in the present CA.,
However, Option 1 is less technically complex, with a smaller vessel spread (six types of
vessel) and shorter work programme (totalling 82 vessel days) than Option 2 (eight types
of vessel, totalling 125 vessel days).
Option 2 requires a reel vessel which operates from a spool base; both the spool bases
and reel vessels tend to have a relatively limited availability and long lead times. Option 2
also has the greater potential for schedule delays arising, for example, from
complications during pipeline recovery.
For these reasons, Option 1 was assessed to have a higher degree of technical
feasibility and recoverability than Option 2.
Option 1: Leave in place Differentiation Score 0.9 Option 2: Recovery Differentiation Score 0
7.1.2 Safety differentiation
With a less prolonged work programme involving fewer people (reduced exposure hours)
working offshore, as well as less extensive onshore transport operations, the inherent
safety risk for Option 1 was assessed to be 69% of that for Option 2.
Option 1: Leave in place Differentiation Score 1.8 Option 2: Recovery Differentiation Score 0
7.1.3 Environmental Impact differentiation
There was a weak differentiation between the two options regarding their environmental
impact.
Option 1 was assessed to have two relatively benign long-term 'medium' environmental
risks relating to the presence rock dump altering structure and habitats within well-
defined localised areas of seabed habitat.
In contrast, Option 2 had one fairly disruptive short-term ‘medium’ impact associated with
seabed excavation, retrieval and backfilling operations, and one localised short-term
impact relating to emissions generated during pipeline recycling on air quality.
Option 1: Leave in place Differentiation Score 0.9 Option 2: Recovery Differentiation Score 0.9

Rubie/ Renee – Decommissioning Comparative Assessment
BMT Cordah Limited 14 November 2013
7.1.4 Energy & Emissions differentiation
Energy usage and emissions from Option 2 were estimated to be lower (45% for energy
and 64% for CO2) than for Option 1. This differential was created by the relatively large
component in Option 1 of energy and emissions corresponding to the hypothetical
manufacture of new raw materials to replace those lost to society by leaving the
decommissioned pipelines buried in situ in the seabed.
Option 1: Leave in place Differentiation Score 0 Option 2: Recovery Differentiation Score 0.6
7.1.5 Societal Impact differentiation
There was a weak differentiation between the options regarding their societal impact.
Option 1 was assessed to have one 'medium' long-term societal risk relating to the
possibility that the buried lines may at some point in the future become uncovered to
create a potential obstruction on the seabed. There is a history of the Rubie and Renee
lines becoming uncovered and spans forming due to seabed sediment movement.
Notwithstanding, Endeavour’s pipeline inspection programme has demonstrated that the
Renee Rubie lines have remained buried below seabed level over the majority of their
route length during the period since installation. These surveys have also identified
where exposed sections exist (Table 3). In mitigation, further survey work would be
required to confirm where burial depth is sufficient (minimum cover of 0.6m) to avoid
obstruction to demersal fishing gear. Exposed or inadequately buried lines would be
protected by remedial rockdump with an overtrawlable profile. Following
decommissioning, an appropriate monitoring programme would be agreed with DECC
and other stakeholders, with a commitment to remedial intervention should this be
required in future.
Option 2 was assessed to have one short-term societal risk relating to the transportation
of multiple lorry loads of pipeline on long journeys causing disruption to roads.
Option 1: Leave in place Differentiation Score 0.6 Option 2: Recovery Differentiation Score 0.6
7.1.6 Cost differentiation
Option 1’s estimated cost is 59% of that of Option 2. The cost of a more extensive vessel
spread with a more prolonged work programme, the recycling cost, and the higher
disposal cost for Option 2 create this differential between the decommissioning options.
Option 1: Leave in place Differentiation Score 1.2 Option 2: Recovery Differentiation Score 0
Rubie/ Renee – Decommissioning Comparative Assessment
BMT Cordah Limited 15 November 2013
8.0 CONCLUSIONS
Scoring distribution for individual assessments in the CA reflects the distinction between:
Option 1: Leave in Place, a short-duration programme, requiring short term disturbance caused by limited intervention, but a long term physical presence; and
Option 2: Recovery for Disposal Onshore, a more prolonged offshore programme involving divers in the uncovering and physical removal of materials from the seabed, followed by transportation and disposal onshore.
Option 1 is positively differentiated from Option 2 on the basis of 3 out of the 4 attributes
assessed where differentiation was observed:
Feasibility;
Safety risk ; and
Cost.
Option 2 positively differentiated only in Energy and Emissions. Both Environmental
Impact and Societal impact displayed weak differentiation.
8.1 In summary
Based on the scoring criteria, the CA concludes that Option 1: Leave in Place is the
preferred decommissioning option for the trenched lines.
The Leave in Place option meets the expectations of current DECC decommissioning
guidelines (DECC, 2011), for pipelines where:
Burial or trenching of exposed sections is undertaken to sufficient depth and is expected to be permanent.
Burial in this case will be achieved by controlled placement of rock dump to cover
exposed cut ends of lines at trench transitions and pre-determined sections of line
where burial depth is considered inadequate (i.e. less than 0.6m). A suitable monitoring
programme appropriate to the final strategy and mitigation procedure will be agreed
with DECC in consultation with other departments. These details are specified further in
the decommissioning programme.
9.0 REFERENCES
DECC (Department of Energy and Climate Change), 2011. Guidance Notes:
Decommissioning of Offshore Installations under the Petroleum Act 1998, Version
6, March 2011. Department of Energy & Climate Change, Offshore
Decommissioning Unit, Aberdeen, UK.
Endeavour, 2013. Rubie Renee Pipeline Survey, 2013.
Energy Institute, 2000. Guidelines for the Calculations of Estimates of Energy Use and
Gaseous Emissions in the Decommissioning of Offshore Structures, Energy
Institute, London.UK, ISBN 0 85293 255 3, 2000.
Safetec, 1995. Risk Analysis of Decommissioning Activities. Joint Industry Project No.
20447. Doc No. ST-20447-RA-1-Rev03. Safetec UK Ltd, Aberdeen, UK.

Rubie/ Renee – Decommissioning Comparative Assessment
BMT Cordah Limited 16 November 2013
APPENDICES

Rubie/ Renee – Decommissioning Comparative Assessment
BMT Cordah Limited 17 November 2013
APPENDIX 1: ENVIRONMENTAL & SOCIOECONOMIC SENSITIVITIES

Rubie/ Renee – Decommissioning Comparative Assessment
BMT Cordah Limited 18 November 2013
Table A1.1: Environmental Sensitivities Summary
Environmental Sensitivities Summary
UKBAP Priority species
Priority species (highlighted in blue) are those identified as being the most threatened and requiring conservation action under the UK Biodiversity Action Plan (UK BAP).
Finfish & Shellfish
Nursery Areas
The development coincides with nursery areas for 15 species:
Norway pout Nephrops Blue whiting Whiting Sprat Anglerfish Cod
Mackerel Herring Nephrops Sandeel Spotted ray Spurdog Ling European hake
Spawning grounds J F M A M J J A S O N D
Cod S S* S* S
Nephrops S S S S* S* S* S S S S S S
Norway Pout S S* S* S
S = spawning S* = peak spawning
Seabirds
Annual peaks in seabird vulnerability in 15/27, 15/28 and surrounding blocks (left). Species recorded in Blocks 15/27, 15/28 and surrounding
blocks (and their UK conservation status*):
Arctic Skua and Herring Gull
Gannet, Puffin, Fulmar, Great and Pomarine Skua, Greater Black-backed, Lesser Black-backed Gulls, Kittiwake, Storm Petrel, Guillemot and Razorbill.
Little Auk
*UK Birds of Conservation Concern categories are informed by UK, European and Global conservation status and based on the IUCN Red List of Threatened Species. This
informs criteria set for UK birds of conservation concern. Birds are split into three categories - Red is the highest conservation priority, with species needing urgent action. Amber is the next most critical group, followed by Green.
Marine
Mammals
The following marine mammals have been recorded in Quadrant 15: killer whale, minke whale, harbour porpoise, white-beaked and white-sided dolphin. In addition, Risso’s and common dolphin have been recorded in the surrounding area. Sightings were highest during April, May and July. The harbour porpoise is the only Annex II species to be sighted within Quadrant 15, with sightings recorded in every month except January and March.
Low L Medium M High H Very high VH No
data
J F M A M J J A S O N D
Minke whale L L L
Killer whale L
White-beaked dolphin M M M L H L M L M L
White-sided dolphin VH L H
Common dolphin L
Risso’s dolphin L
Harbour porpoise L M L VH L H M L L VH
Benthic Environment
Seabed Sediment / Benthic Fauna
Sediments and benthic fauna in the Rubie/ Renee area are typical of the central North Sea; therefore no specific issues are foreseen.
Pelagic Environment
Water Quality / Plankton
Plankton and water quality in the Rubie/ Renee area are likely to be typical of the central North Sea; no specific issues are foreseen.

Rubie/ Renee – Decommissioning Comparative Assessment
BMT Cordah Limited 19 November 2013
Socioeconomic Sensitivities Summary
Commercial Fisheries
The area of the Rubie/ Renee is fished throughout the year. During 2011, fishing effort peaked in July and August and during April to May. Demersal fishing methods (such as bottom otter trawls) dominated the fishing effort.
Fishing Effort (kw/days) Relative Value (£)
Whitefish gears L 20,000 – 100,000 Whitefish gears M 100,000 – 500,000
Pelagic gears no effort Pelagic gears no catch
Nephrops gears VH >300,000 Nephrops gears VH >1,000,000
Gillnets & Long lines no effort Gillnets & Long lines no catch
Pots/Creels no effort Pots/Creels no catch
Dredges no effort Dredges no catch
Other Users
Receptor Impact
Shipping Activity DECC category: Low
Oil & Gas The nearest infrastructure is the Nexen Scott JD production and drilling platform and the Scott JU Accommodation platform, 26 km to the N
Telecommunications No submarine cables transect the Rubie/ Renee area.
Aggregate extraction No designated aggregate extraction areas recorded in the vicinity.
Military Use There are no military operation zones in the immediate vicinity.
Wrecks There are no recorded wrecks in the immediate vicinity.
Carbon Capture No carbon capture schemes are found within the vicinity.
Windfarms No windfarms currently operate within the area.
Archaeology There are no sites of archaeological importance within the vicinity.
Tourism & Recreation None recorded.
Conservation Interests
Annex I
habitats
Sandbanks
The closest site to the Rubie/ Renee development is the Norwegian
Boundary Sediment Plain proposed MPA located approximately 77 km east,
near the UK/Norway median line, with offshore subtidal sands and gravel
and aggregations of protected bivalve Ocean quahog (Arctica islandica).
Pockmarks
Pockmarks are known to occur in this area of Central North Sea however
the majority of these are inactive. The closest designated sites are South-
east Fladen proposed MPA and Scanner Pockmark cSAC/SCI, located 20
km and 40 km east, respectively, of the Rubie/ Renee development.
Annex II
species
Harbour porpoise Harbour porpoise sightings have been recorded in the Rubie/ Renee area frequently throughout the year except March and November.
Bottlenose dolphin
The Rubie/ Renee area is located 140 km from shore; therefore the presence of these species is likely to be infrequent.
Common seal
Grey seal
Designated Sites
The “South-east Fladen” and “Western Fladen” are proposed MPAs located approximately 20 km east and 28 km north west, respectively, of the Rubie/ Renee development. The South-east Fladen MPA is designated for the conservation of burrowed mud habitat and seabed fluid and gas seep pockmarks. The Western Fladen is designated for the conservation of the burrowed mud habitat and Quarternary of Scotland – subglacial tunnel valley.
Key:
Seabird vulnerability Marine mammal sightings Commercial Effort & Value
VH Very high VH Very high (>= 0.50 animals/km) VH Very High
H High H High (0.20-0.49 animals/km) H High
M Moderate M Moderate (0.10-0.19 animals/km) M Moderate
L Low L Low (0.01-0.09 animals/km) L Low
No Data No data VL Very Low
No effort/No catch

Rubie/ Renee – Decommissioning Comparative Assessment
BMT Cordah Limited 20 November 2013
A1.2 Environmental & Socioeconomic Sensitivities References
Coull, K.A., Johnstone, R., and Rogers, S.I., 1998. Fisheries Sensitivity Maps in British
Waters. Published and distributed by UKOOA Ltd.
DTI (Department of Trade and Industry), 2002. Strategic Environmental Assessment of
the Mature Areas of the Offshore North Sea - SEA 3 Report to the Department of
Trade and Industry. Consultation Document, August, 2002.
DTI, 2004. Strategic Environmental Assessment of the Mature Areas of the Offshore
North Sea - SEA 5. Report to the Department of Trade and Industry. Consultation
Document, September 2004.
Ellis, J.R., Milligan, S., Ready, L., South, A., Taylor, N., and Brown, M., 2010. Mapping
the spawning and nursery grounds of selected fish for spatial planning. Report to
the Dept. of Environment, Food and Rural Affairs from Cefas. Defra Contract No.
MB5301
JNCC (Joint Nature Conservation Committee), 1999. Seabird vulnerability in UK waters:
Block specific vulnerability, 1999. Joint Nature Conservation Committee, Aberdeen.
JNCC, 2012. www.jncc.gov.uk/ Accessed December 2012.
Marine Scotland, 2011. Relative value and effort maps for demersal, pelagic and
shellfish fisheries based on all landings into the UK and all landings abroad by UK
vessels in 2010. Marine Scotland Science Division.
Natura 2000. Natura 2000 viewer. http://natura2000.eea.europa.eu Accessed December
2012.
Natural England, 2012. http://www.naturalengland.org.uk/ Accessed December 2012.
Protected Planet, 2012. www.protectedplanet.net/marine consultation areas/ Accessed
December 2012.
Reid, J.B., Evans, P.G.H. and Northridge, S.P. (Eds.), 2003. Atlas of cetacean
distribution in north-west European waters. JNCC, Peterborough.
SNH (Scottish Natural Heritage), 2012. Scottish Natural Heritage SiteLink.
http://gateway.snh.gov.uk/ Accessed December 2012.
Stone, C. J., Webb, A., Barton, C., Ratcliffe, N., Reed, T. C., Tasker, M. L.,
Camphuysen, C. J., & Pienkowski, M. W., 1995. An atlas of seabird distribution in
north-west European waters, 326 pages, A4 softback, ISBN 1 873701 94 2
UKDMAP (United Kingdom Digital Marine Atlas), 1998. United Kingdom Digital Marine
Atlas – An Atlas of the Sea around the British Isles. 3rd Ed. by the British
Oceanographic Data Centre, Birkenhead.
UNESCO (United Nations Educational, Scientific and Cultural Organization), 2012. World
Heritage List. http://whc.unesco.org/en/list Accessed December 2012.
Wetlands International, 2010. Wetland International Ramsar Sites Information Service
http://ramsar.wetlands.org/ Accessed December 2012

Rubie/ Renee – Decommissioning Comparative Assessment
BMT Cordah Limited 21 November 2013
APPENDIX 2: OPTIONS DISMISSED AFTER INITIAL SCREENING
Rubie/ Renee – Decommissioning Comparative Assessment
BMT Cordah Limited 22 November 2013
A2.1 Options dismissed during Initial screening
The following provides a description of the options considered along with the justification
for the selection or exclusion of the particular options from further consideration in the
CA. Selected Options (1) Leave in Place and (2) Recovery by Reverse Reel, are discussed
in detail in Section 6 in the main body of the report.
A2.1.1 Option 3: Recovery by Reverse Lay (Rejected)
Reverse lay effectively reverses the normal pipeline construction method where standard
lengths of pipe welded end to end on board the lay barge are then paid out from a hinged
ramp or stinger as the barge moves forward.
Initially, the route would be surveyed and the line would be picked up by a dynamically
positioned or anchored lay barge as in Option 2. The line would be winched over stinger
and through tensioners on board the lay barge which will then carry out the reverse lay.
These tensioners hold the weight of the suspended pipeline which takes up an "S" bend
configuration between the stinger and the seabed.
The barge will travel along pipeline route recovering the pipeline, which will then be cut
into manageable sections on the barge. These will be back-loaded either to a second
barge or to a supply vessel, then transported to shore and to recycling and disposal
facilities, as required. This method would be similar to that used for recovering a buckled
pipeline.
Again, the method would be suitable for sections of the lines which are sufficiently sound
to enable the lines to be recovered by reverse lay. It would not be suitable for sections
which are seriously corroded.
Removal by reverse lay was rejected for further consideration in the CA because it tends
to be more suited to larger diameter lines and would be less practicable for smaller
diameter lines, such those in the R Block, which are usually installed by reel barge.
Recovery rates could be slower and weather down time could be more significant than
with Option 2.
A2.1.2 Option 4: Long Section Recovery (Rejected)
With this option, the pipe is suspended from davits mounted on the side of the recovery
vessel. A jet sled, plough or other device deployed from a separate barge or vessel
moving ahead of the recovery barge would be used to uncover the pipe. As the recovery
vessel travels slowly along the pipeline route, the pipe would be lifted in a controlled S-
bend configuration to avoid buckling. The end of the recovered pipe is fed through a
cutting station near the vessel’s bow, where the pipe is cut into lengths for transport to
shore on a supply boat.
Long section recovery was rejected because this technique is not used in the northern
North Sea (NNS) and is more suitable for shallower and sheltered waters. Appropriate
vessels and experienced crews are not readily available. Relatively slow removal rates
and weather down time could also be significant disincentives.

Rubie/ Renee – Decommissioning Comparative Assessment
BMT Cordah Limited 23 November 2013
A2.1.3 Option 5: Removal by Tow Recovery (Rejected)
Following a survey of the line, a jet sled, plough or other device deployed from a
separate barge or vessel would be used to uncover the pipe during removal. The pipe
would then be suspended from davits aboard the recovery vessel which would carry
tensioners and stingers at both ends, with a cutting station mounted in the middle of the
vessel. As the pipeline is lifted and passed through to the aft stinger, a towing head and
flotation buoys would be attached to the pipeline.
A tug would pick up the towing head and maintain tension on the pipeline while the
recovery vessel picks up additional pipe. When the required length of pipeline is reached,
the pipeline would be severed on-board the recovery vessel and the freed length of
pipeline would be towed to shore. The process would then be repeated. The buoys are
intended to provide sufficient buoyancy for the pipeline to be towed on or close to the
seabed, close to the surface or at a mid-water level.
This method can be used to recover lengths of rigid pipeline, especially large diameter
steel line and concrete covered line. However, it was rejected from further consideration
in the CA because it has not been used in the NNS. Suitable vessels are readily
available but experienced crews are not, and because the technique is not widely used,
there would be a steep learning curve.
Navigational and handling issues to pull the pipe ashore, cut in to lengths and transport it
onwards would have to be addressed. Safety relating to two or more vessels working in
close proximity would also need to be addressed. Tow recovery would be expensive (i.e.
cost increases in proportion to length, water depth and weather) and removal rate would
be relatively slow. Fundamentally, a lot of things would have to go right every time for
this technique to succeed.
A2.1.4 Option 6: Short Section Recovery (Selected for use with Option 2)
Following a survey of the line, a jet sled, plough or other device operated from a separate
barge or vessel would be used to uncover the pipe during removal. The pipeline would
be cut into short lengths on the seabed using divers or an ROV. Lifting slings or lines
would be attached to the cut lengths of lines and the recovery vessel’s crane would lift
these onto the deck. Alternatively, the vessel’s davits would lift the pipeline and it would
be cut up further on the vessel.
The method is suitable for any size or type of pipeline. Technically, the method is robust,
well understood and can readily be achieved. It uses established and proven techniques
with minimal engineering requirement, and is undertaken frequently. Suitable vessels are
readily available.
Short section recovery has been selected for further consideration in the CA because it is
the only method that is suitable for the recovery of seriously corroded sections of buried
lines. However, it has not been chosen for a wider application for decommissioning the R
Block lines. Uncovering, cutting and removal of buried lines would be relatively slow,
labour intensive and costly. High cost diving or ROV operations, subsea cutting
equipment and prolonged use of vessels (more prolonged than any other option) and the
high risk of schedule delays provide strong disincentives.

Rubie/ Renee – Decommissioning Comparative Assessment
BMT Cordah Limited 24 November 2013
A2.1.5 Option 7: J-Lift Recovery (Rejected)
Following a survey of the line, a jet sled, plough or other device operated from a separate
barge or vessel would be used to uncover the pipe during removal. The J-lay barge is
designed primarily to lay the larger diameter pipelines in deep water. The tensioners and
stinger are mounted on a nearly vertical tower extending down into the sea. This method
avoids the excessive "S" bend stresses in pipelines that result from the pipeline’s extra
weight in very deep water. In other respects, J-lift recovery follows the same procedures
as the other lay barge methods described above.
J-lift can be used to recover both rigid and flexible pipeline and is suitable for longer
lengths of larger diameter pipe. However, it does require a dedicated vessel and
because the method is designed for deep-water installation, it is considered technically
inappropriate for the shallower water depth at R Block. In addition to technical risk and
potential for schedule delays, this option would be slow and expensive.

Rubie/ Renee – Decommissioning Comparative Assessment
BMT Cordah Limited 25 November 2013
APPENDIX 3: ASSESSMENT OF SAFETY RISKS

Rubie/ Renee – Decommissioning Comparative Assessment
BMT Cordah Limited 26 November 2013
A3.1 Method
The calculation of Potential Loss of Life (PLL) for each option was carried out in two
stages:
Individual PLLs for each activity during the work programme were calculated by multiplying worker exposure (expressed in hours) or the numbers of lifts by cranes or the number of take-off and landing events by helicopters by the corresponding Fatal Accident Rate (FAR) (expressed as the number fatalities per 100 million hours).
PLLs for all of the activities were summed to provide the total PLL for that option.
The report on the Joint Industry Project on the Risk Analysis of Decommissioning
Activities (Safetec 1995) provides the PLL calculation methodology and FAR values.
The CA outputs are quantitative PLL tables along with stated assumptions.
A3.2 Results
A3.2.1 Option 1: Leave in Place
The purpose of this work would be to monitor rockdump operations intended to cover the
pipelines and umbilicals that are being left in situ, and to carry out post-decommissioning
surveys.
A total of six vessels (Table A3.1) will be required for the rockdumping and monitoring
operations. In total, it is estimated worker expose hours will be 117,988 for Option 1.
Table A3.1: PLL calculation for Option 1: Leave in Place
Vessel or Vehicle
Activity
Number of Workers, Lifts by Crane or
Helicopter Take offs
& Landings
Working or Rest period
Exposure
Hours Per
Worker
Exposure
Hours for the Activity
FAR PLL
Dive Support Vessel
Mobilisation & demobilisation
75 Working 48 3,600 7.5 2.70x10
-4
Resting 48 3,600 0.2 7.20x10⁻⁶
Transit to and from site
75 Working 12 900 7.5 6.75x10
-5
Resting 12 900 0.2 1.80x10⁻⁶
Onsite: Working excluding divers
63 Working 156 9,828 7.5 7.37x10
-4
Resting 156 15,876 0.2 1.97x10⁻⁵
Onsite: Divers under compression
12 Working &
Resting 672 8064 97 7.82x10
-3
Onsite: Lifts by Crane
35 N/A N/A N/A 1.10x1
0-5
3.85x10
-4
CSV/ Supply Vessel
(CSV used in PLL
calculation)
Mobilisation & demobilisation
75 Working 48 3600 7.5 2.70x10
-4
Resting 48 3600 0.2 7.20x10⁻⁶
Transit to and from site
75 Working 12 900 7.5 6.75x10
-5
Resting 12 900 0.2 1.80x10⁻⁶
Onsite 75 Working 252 18,900 7.5 1.42x10⁻³

Rubie/ Renee – Decommissioning Comparative Assessment
BMT Cordah Limited 27 November 2013
Vessel or Vehicle
Activity
Number of Workers, Lifts by Crane or
Helicopter Take offs
& Landings
Working or Rest period
Exposure
Hours Per
Worker
Exposure
Hours for the Activity
FAR PLL
Resting 252 18,900 0.2 3.78x10⁻⁵
Rockdump Vessel
Mobilisation & demobilisation
30 Working 48 1440 7.5 1.08x10
-4
Resting 48 1440 0.2 2.88x10⁻⁶
Transit to and from site
30 Working 12 360 7.5 2.70x10
-5
Resting 12 360 0.2 7.20x10⁻⁷
Onsite 30 Working 48 1,440 7.5 1.08x10
-4
Resting 48 1,440 0.2 2.88x10⁻⁶
Guard Vessel
Mobilisation & demobilisation
8 Working N/A N/A 3.3 N/A
Resting N/A N/A 0.2 N/A
Transit to and from site
8 Working 12 96 3.3 3.17x10
-6
Resting 12 96 0.2 1.92x10⁻⁷
Onsite 8 Working 252 2,016 3.3 6.65x10
-5
Resting 252 2,016 0.2 4.03x10⁻⁶
Fishing Trawler
Mobilisation & demobilisation
18 Working N/A N/A 18.1 N/A
Resting N/A N/A 0.2 N/A
Transit to and from site
18 Working 12 216 18.1 3.91x10
-5
Resting 12 216 0.2 4.32x10⁻⁷
Onsite 18 Working 24 432 18.1 7.82 x10
-5
Resting 24 432 0.2 8.64 x10⁻⁷
Survey Vessel
Mobilisation & demobilisation
35 Working 96 3,360 5.5 1.85x10
-4
Resting 96 3,360 0.2 6.72x10⁻⁶
Transit to and from site
35 Working 24 840 5.5 4.62x10
-5
Resting 24 840 0.2 1.68x10⁻⁶
Onsite 35 Working 24 840 5.5 4.62 x10
-5
Resting 24 840 0.2 1.68 x10⁻⁶
Helicopter
Take offs & landing events*
216 N/A N/A N/A 32 6.91 x10⁻⁵
Transit to and from site
27 Travelling 8 216 97 2.1 x10⁻⁴
PLL for Option
1.16 x10⁻²
N/A – Not applicable
A3.2.2 Option 2: Recovery for Disposal Onshore
The purpose of this work would be to locate and recover the pipelines and umbilicals (as
in Option 1) associated with the Rubie and Renee Fields. The pipelines and umbilicals
would be removed from their current location on/ in the seabed and transported to shore
for disposal, re-use or recycling.
Rubie/ Renee – Decommissioning Comparative Assessment
BMT Cordah Limited 28 November 2013
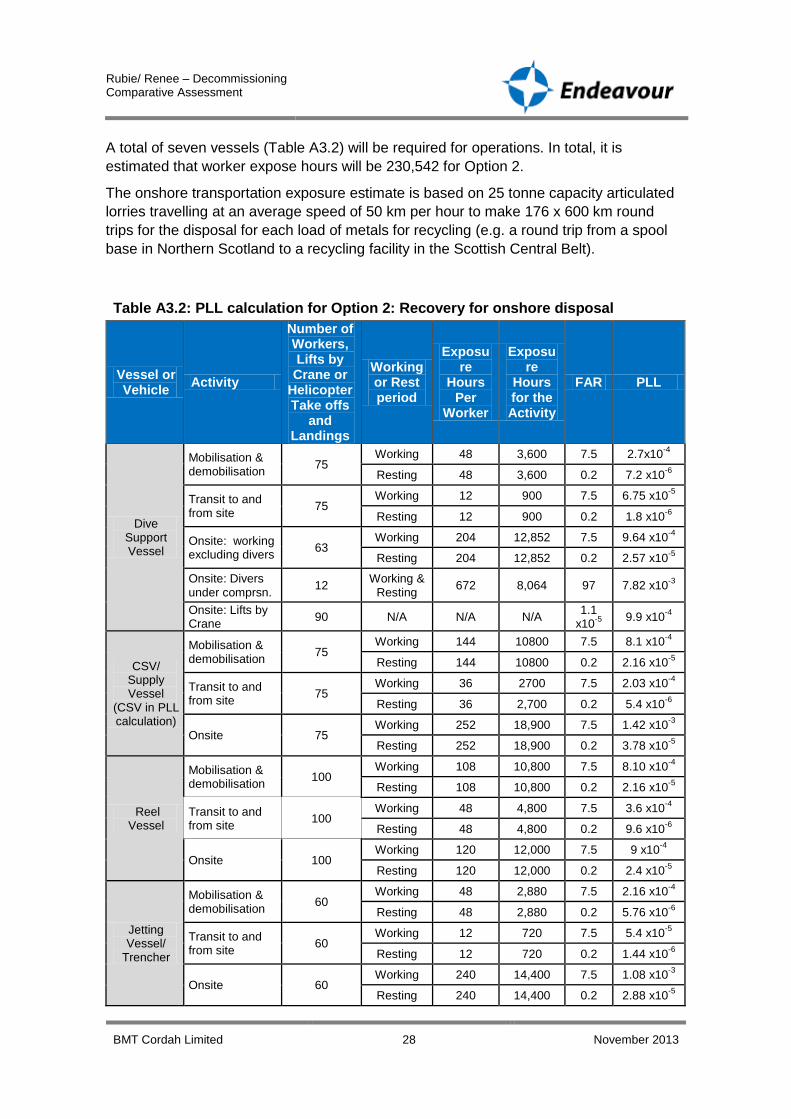
A total of seven vessels (Table A3.2) will be required for operations. In total, it is
estimated that worker expose hours will be 230,542 for Option 2.
The onshore transportation exposure estimate is based on 25 tonne capacity articulated
lorries travelling at an average speed of 50 km per hour to make 176 x 600 km round
trips for the disposal for each load of metals for recycling (e.g. a round trip from a spool
base in Northern Scotland to a recycling facility in the Scottish Central Belt).
Table A3.2: PLL calculation for Option 2: Recovery for onshore disposal
Vessel or Vehicle
Activity
Number of Workers, Lifts by Crane or
Helicopter Take offs
and Landings
Working or Rest period
Exposure
Hours Per
Worker
Exposure
Hours for the Activity
FAR PLL
Dive Support Vessel
Mobilisation & demobilisation
75 Working 48 3,600 7.5 2.7x10
-4
Resting 48 3,600 0.2 7.2 x10⁻⁶
Transit to and from site
75 Working 12 900 7.5 6.75 x10
-5
Resting 12 900 0.2 1.8 x10⁻⁶
Onsite: working excluding divers
63 Working 204 12,852 7.5 9.64 x10
-4
Resting 204 12,852 0.2 2.57 x10⁻⁵
Onsite: Divers under comprsn.
12 Working &
Resting 672 8,064 97 7.82 x10
-3
Onsite: Lifts by Crane
90 N/A N/A N/A 1.1
x10-5
9.9 x10
-4
CSV/ Supply Vessel
(CSV in PLL calculation)
Mobilisation & demobilisation
75 Working 144 10800 7.5 8.1 x10
-4
Resting 144 10800 0.2 2.16 x10⁻⁵
Transit to and from site
75 Working 36 2700 7.5 2.03 x10
-4
Resting 36 2,700 0.2 5.4 x10⁻⁶
Onsite 75 Working 252 18,900 7.5 1.42 x10
-3
Resting 252 18,900 0.2 3.78 x10⁻⁵
Reel Vessel
Mobilisation & demobilisation
100 Working 108 10,800 7.5 8.10 x10
-4
Resting 108 10,800 0.2 2.16 x10⁻⁵
Transit to and from site
100 Working 48 4,800 7.5 3.6 x10
-4
Resting 48 4,800 0.2 9.6 x10⁻⁶
Onsite 100 Working 120 12,000 7.5 9 x10
-4
Resting 120 12,000 0.2 2.4 x10⁻⁵
Jetting Vessel/
Trencher
Mobilisation & demobilisation
60 Working 48 2,880 7.5 2.16 x10
-4
Resting 48 2,880 0.2 5.76 x10⁻⁶
Transit to and from site
60 Working 12 720 7.5 5.4 x10
-5
Resting 12 720 0.2 1.44 x10⁻⁶
Onsite 60 Working 240 14,400 7.5 1.08 x10
-3
Resting 240 14,400 0.2 2.88 x10⁻⁵

Rubie/ Renee – Decommissioning Comparative Assessment
BMT Cordah Limited 29 November 2013
Vessel or Vehicle
Activity
Number of Workers, Lifts by Crane or
Helicopter Take offs
and Landings
Working or Rest period
Exposure
Hours Per
Worker
Exposure
Hours for the Activity
FAR PLL
Guard Vessel
Mobilisation & demobilisation
8 Working N/A N/A 3.3 N/A
Resting N/A N/A 0.2 N/A
Transit to and from site
8 Working 12 96 3.3 3.17 x10
-6
Resting 12 96 0.2 1.92 x10⁻⁷
Onsite 8 Working 300 2,400 3.3 7.92 x10
-5
Resting 300 2,400 0.2 4.8 x10⁻⁶
Fishing Trawler
Mobilisation & demobilisation
18 Working N/A N/A 18.1 N/A
Resting N/A N/A 0.2 N/A
Transit to and from site
18 Working 12 216 18.1 3.91 x10
-5
Resting 12 216 0.2 4.32 x10⁻⁷
Onsite 18 Working 24 432 18.1 7.82 x10
-5
Resting 24 432 0.2 8.64 x10⁻⁷
Survey Vessel
Mobilisation & demobilisation
35 Working 96 3,360 5.5 1.85 x10
-4
Resting 96 3,360 0.2 6.72 x10⁻⁶
Transit to and from site
35 Working 24 840 5.5 4.62 x10
-5
Resting 24 840 0.2 1.68 x10⁻⁶
Onsite 35 Working 24 840 5.5 4.62 x10
-5
Resting 24 840 0.2 1.68 x10⁻⁶
Helicopter
Take offs and landing events*
270 N/A N/A N/A 32 8.64 x10⁻⁵
Transit to and from site
27 Travelling 9 243 97 7.78 x10⁻⁵
Articulated Lorry**
Transport metals to Recycler
1 Working 2,119 2,119 12.3 2.61 x10⁻⁴
PLL for Option
1.67 x10⁻²
N/A – Not applicable
A3.3 Assumptions
It is assumed that:
The POBs on each vessel will equally be at risk during mobilisation, transit to site, transit to shore and demobilisation.
Time during mobilisation, transit and demobilisation will be equally divided into working and off-duty time.
Other than for divers when working on site and the truck driver, working and resting time for each of the activities has been equally apportioned.
The 12 saturation divers will be equally at risk during the entire time spent on site to which a FAR of 97 for saturation diving will apply.

Rubie/ Renee – Decommissioning Comparative Assessment
BMT Cordah Limited 30 November 2013
A FAR of 12.3 (FAR for onshore deconstruction operations; Safetec, 1995) will apply to the onshore collection and transport of the recovered metals to disposal sites.
FAR values for the CSV and rockdump vessel are based on those of a DSV FAR of 7.5 (working) and 0.2 (off-duty) hours
POB values for the duration of work programme and the number of helicopter journeys have been provided by Endeavour engineers.
A FAR of 1.1x10⁻⁵ will apply to each of the estimated 175 (Option 2) lifting operations by crane (Safetec, 1995).
A3.4 Comparison of Options
Table A3.3 ranks the two options in terms of safety risk. Note that the PLL value for
Option 1 is 74% that of Option 2. With a more prolonged work programme involving more
people working offshore (twice as many worker exposure hours), Option 2 has a higher
inherent safety risk than Option 1, which requires fewer vessels and a shorter work
programme.
Table A3.3: Ranking of the two options. Normalised Scores: 1 = lowest PLL; 0 = highest PLL
Option PLL Normalised
Score Weighted
Score
1. Leave in Place 1.16 x10⁻²
1 1.8
2. Total Removal 1.67 x10⁻²
0 0
A3.5 References
Safetec, 1995. Risk Analysis of Decommissioning Activities. Joint Industry Project No. P20447. Doc No. ST-20447-RA-1-Rev03. Safetec UK Ltd, Aberdeen, UK.

Rubie/ Renee – Decommissioning Comparative Assessment
BMT Cordah Limited 31 November 2013
APPENDIX 4: ASSESSMENT OF ENVIRONMENTAL AND SOCIETAL RISKS

Rubie/ Renee – Decommissioning Comparative Assessment
BMT Cordah Limited 32 November 2013
A4.1 Introduction
This appendix provides the methodology and results of the qualitative assessment of
environmental risk and societal risk. The assessment enabled a distinction to be made
between four categories of risk: High, Medium, Low and Negligible. Differentiation
between options was based on the total number and characteristics of High and Medium
category risks. The results of environmental and societal components of the risk
assessment were compared separately.
A4.2 Method
The assessment of each option:
1. Identified the activities/operations and end-points (final outcomes from the
decommissioning process, e.g. waste in landfill) occurring within each option;
2. Identified potential causes of environmental and societal impact and risk
associated with each activity/operation. Include operational and
accidental/emergency events;
3. Identified receptors (elements of environment or society offshore and onshore)
at risk from potential operational impacts and end-point impacts;
4. Assigned an index to the likelihood of occurrence using the criteria in Tables
A4.1 and A4.2. The assessment assumed that all planned and standard controls
were in place.
5. Assigned an index to the potential consequences using the criteria provided in
Table A4.3
6. Determined the risk rating from the intersection of the likelihood and
consequence indices in the risk matrix (Table A4.4). The risk rating is expressed
as an identifier (e.g. C2) which corresponds to a unique position on the matrix.
7. Documented the results on the environmental or societal risk assessment
worksheets and noted the reasons for the assessment made.
A4.3 Likelihood, Consequence and Risk Assessment Tables
The tables overleaf provide:
Likelihood criteria environmental and societal risk arising during planned (normal) operations and unplanned (accidental and emergency) events (Table A4.1 and A4.2)
Consequence criteria for environmental and societal risk (Table A4.3); and.
Risk Assessment Matrix to assign a risk rating on the basis of the assessed probability and consequence (Table A4.4).

Rubie/ Renee – Decommissioning Comparative Assessment
BMT Cordah Limited 33 November 2013
Table A4.1: Guidelines for assessing likelihood of occurrence of an impact upon a particular receptor resulting from the planned activities
← D
ec
rea
sin
g l
ike
lih
oo
d
Likelihood Frequency of planned activity impacting receptors during project lifetime
A Definite Impact observed every time; might occur once a year or more on site
B Likely Impact often observed; could happen several times in site life
C Possible Impact occasionally observed; might happen in site life
D Unlikely Impact rarely observed; has occurred only several times in industry
E Remote Impact almost never observed; few if any events in industry
Table A4.2: Guidelines for assessing likelihood of occurrence of an impact resulting from unplanned / accidental activities
← D
ec
rea
sin
g l
ike
lih
oo
d
Likelihood Frequency of an unplanned or accidental event occurring and impacting receptors during project lifetime
A Likely Might happen once a year on site; 1 per year
B Unlikely Could happen several times in site life; 1 per 10 years
C Very unlikely
Might happen in site life; 1 per 100 years
D Extremely unlikely
Has occurred several times in industry; 1 per 1,000 years
E Almost unheard of
Few if any events in industry; 1 per 10,000 years
Table A4.3: Guidelines for assessing the magnitude / consequence of environmental and societal impacts
← D
ec
rea
sin
g c
on
se
qu
en
ce
Magnitude / consequence
Characteristics
5 Catastrophic Adverse permanent impacts on key ecosystem functions in larger natural habitats or social and economic resources/assets, uses or activities. Scale typically widespread (national or greater level).
4 Severe Adverse long term impact on ecologically valuable natural habitats (e.g. restitution time >10 years), or social and economic resources, uses or activities. Scale typically regional to national level.
3 Major Adverse medium term impacts on a significant part of habitats (e.g. restitution time 1 to 10 years) or social and economic resources, uses or activities. Scale typically local to regional level.
2 Moderate Adverse short term impact on natural habitats or social and economic resources, uses or activities. Scale typically localised.
1 Minor Very limited adverse impact on natural habitats or social and economic resources, uses or activities. No impact on population, only on individual level. Typically transient and highly localised.

Rubie/ Renee – Decommissioning Comparative Assessment
BMT Cordah Limited 34 November 2013
Table A4.4: Environmental and societal risk assessment matrix
Planned Accidental
Magnitude/consequence of impact (Table 3)
1 2 3 4 5
Minor Moderate Major Severe Catastrophic
Lik
eli
ho
od
of
oc
cu
rren
ce
(T
ab
le 1
an
d 2
) A Definite Likely
Low Medium Medium High High
A1 A2 A3 A4 A5
B Likely Unlikely
Low Medium Medium High High
B1 B2 B3 B4 B5
C Possible Very
unlikely
Low Low Medium High High
C1 C2 C3 C4 C5
D Unlikely Extremely
unlikely
Negligible Low Low Medium Medium
D1 D2 D3 D4 D5
E Remote Almost
unheard of
Negligible Negligible Low Low Medium
E1 E2 E3 E4 E5
A4.4 Results of the Assessment
The results of the assessments are provided in:
Table A4.5: Option 1 – Leave in Place
Table A4.6: Option 2 - Recovery for Disposal Onshore

Rubie/ Renee – Decommissioning Comparative Assessment
BMT Cordah Limited 35 November 2013
Table A4.5: Environmental and Societal Risk Assessment for Option 1: Leave in Place
Operation or End-Point Potential Impact
Physical and Chemical Biological Societal
No of Physical,
Chemical and Biological
Risks
Number of Societal
Risks
Justification for Risk Ratings Assigned
Se
dim
en
t str
uctu
re /
ch
em
istr
y
Wa
ter
qu
alit
y
Air
qu
alit
y
La
nd
Fre
sh
-wate
r
Se
dim
en
t b
iolo
gy (
ben
thos)
Wa
ter
co
lum
n (
pla
nkto
n)
Fin
fish
an
d s
hellf
ish
Se
a m
am
ma
ls
Se
ab
irds
Inte
grity
of
ecosyste
ms/
co
nse
rva
tion
sites
Te
rre
str
ial flo
ra &
fau
na
Co
mm
erc
ial fishin
g
Sh
ipp
ing
Oth
er
use
rs o
f th
e s
ea
On
sh
ore
Co
mm
unitie
s
Natio
nal &
local govern
me
nt,
institu
tio
nal &
com
merc
ial
users
Infr
astr
uctu
re,
recre
atio
n a
nd
am
enity
Ne
glig
ible
Lo
w
Me
diu
m
Hig
h
Ne
glig
ible
Lo
w
Me
diu
m
Hig
h
Planned Operations
Physical presence of DSV, CSV, rockdump vessel, guard vessel and survey vessels during transit between port and the offshore site
Obstruction to fishing vessels and shipping
D1 D1 0 0 0 0 2 0 0 0
• Localised transient impact. Shipping/ fishing traffic can readily navigate round the individual vessels as they travel to and from the offshore site. • Industry standard controls involving route-planning, navigation aids, communications and good seamanship.
Physical presence of DSV, CSV, rockdump vessel, guard vessel, survey vessel, ROVs, divers, dive bell, jetting and other equipment during operations at the offshore site
Obstruction to fishing vessels and shipping
C1 C1 0 0 0 0 0 2 0 0
• Localised transient impact. Shipping/ fishing traffic can readily navigate round the vessel spread at any given stage during the work programme. • Industry standard controls involving project planning, design and operational procedures, Notices to Mariners, 500 m safety zones around the Rubie wellhead and the RPM, navigation aids, communications, good seamanship and presence onsite of a guard vessel.
Underwater noise associated with vessel's engines, DP thrusters and equipment
Injury or disturbance to marine mammals, fish and seabirds
D1 B1 D1 2 1 0 0 0 0 0 0
• Continuous (rather than impulsive) source mainly from vessel's generators and cavitation from the thrusters, with potential for localised disturbance to sea mammals (avoidance behaviour), fish and birds. • Responses of sea mammals vary sea mammal and seabird avoidance reactions and attraction to vessels can both occur (Jacques Whitford, 2007). Injury unlikely. Limited information on fish. • Also small scale contributor to background underwater noise levels from vessel traffic in the sea area. • Industry standard controls based on maintenance and power management systems.
Underwater noise associated with the use of sonar and other survey equipment
Injury or disturbance to marine mammals, fish and seabirds
D1 C1 D1 2 1 0 0 0 0 0 0
• Higher frequency emissions utilised during surveys of this type tend to be dissipated to safe levels over a relatively short distance (DEHLG, 2007)*. Additionally sound is not within frequency range of the Marine Strategy Framework Directive indicator for loud, low and mid-frequency sounds (Genesis, 2011).

Rubie/ Renee – Decommissioning Comparative Assessment
BMT Cordah Limited 36 November 2013
Operation or End-Point Potential Impact
Physical and Chemical Biological Societal
No of Physical,
Chemical and Biological
Risks
Number of Societal
Risks
Justification for Risk Ratings Assigned
Se
dim
en
t str
uctu
re /
ch
em
istr
y
Wa
ter
qu
alit
y
Air
qu
alit
y
La
nd
Fre
sh
-wate
r
Se
dim
en
t b
iolo
gy (
ben
thos)
Wa
ter
co
lum
n (
pla
nkto
n)
Fin
fish
an
d s
hellf
ish
Se
a m
am
ma
ls
Se
ab
irds
Inte
grity
of
ecosyste
ms/
co
nse
rva
tion
sites
Te
rre
str
ial flo
ra &
fau
na
Co
mm
erc
ial fishin
g
Sh
ipp
ing
Oth
er
use
rs o
f th
e s
ea
On
sh
ore
Co
mm
unitie
s
Natio
nal &
local govern
me
nt,
institu
tio
nal &
com
merc
ial
users
Infr
astr
uctu
re,
recre
atio
n a
nd
am
enity
Ne
glig
ible
Lo
w
Me
diu
m
Hig
h
Ne
glig
ible
Lo
w
Me
diu
m
Hig
h
Operational discharges of treated oily bilge
Deterioration in water quality
A1 D1 D1 2 1 0 0 0 0 0 0
• Localised transient impact from permitted discharge dissipating to background concentrations within relatively short distance. • Industry standard controls based on separation systems for oil recovery from bilge with discharges within permitted levels of 15ppm.
Sewage and grey water discharges
Deterioration in water quality
A1 D1 D1 2 1 0 0 0 0 0 0
• Localised transient impact around discharge point. • Discharged material disperses and degrades naturally. • Industry standard controls based on discharge of screened, materials as minimum requirement.
Macerated food waste discharge
Deterioration in water quality
A1 D1 D1 2 1 0 0 0 0 0 0
• Localised transient impact around the discharge point. • Discharged material disperses and degrades naturally. • Industry standard controls based on the maceration of organic food waste prior to discharge.
Ballast water uptake and discharge
Risk of transfer of non-native species (if vessels not routinely working in UK/ N. European waters)
E3 0 1 0 0 0 0 0 0
• Remote probability of introduction of non-native species as a result of ballasting of project vessels. • Project vessels will originate from northern European waters. • Ballasting operations will be managed in line with IMO guidelines.
Atmospheric emissions from generators and engines of project vessels
Deterioration in air quality and contribution to global atmospheric impacts
A1 0 1 0 0 0 0 0 0
• Small-scale contributor of GHGs and other global gases. • Localised transient impact in the vicinity of the exhausts. • Emissions disperse in exposed offshore environment. • Industry standard controls based on low sulphur diesel, power management systems, route planning and maintenance.
Atmospheric emissions from engines of helicopters for personnel transport
Deterioration in air quality and contribution to global atmospheric impacts
A1 0 1 0 0 0 0 0 0
• Small-scale contributor of GHGs and other global gases. • Localised transient impact in the vicinity of the exhausts. • Emissions disperse during flight and the exposed offshore environment. • Industry standard controls based on routine and planned maintenance.
Operational wastes from vessels
Use of waste disposal resources and landfill capacity
A1 0 0 0 0 0 1 0 0
• Small-scale use of landfill capacity for non-reusable and non-recyclable wastes. • Industry standard controls in classification, segregation, containment, permits and traceable chain of custody for waste management, shipment, treatment and disposal.

Rubie/ Renee – Decommissioning Comparative Assessment
BMT Cordah Limited 37 November 2013
Operation or End-Point Potential Impact
Physical and Chemical Biological Societal
No of Physical,
Chemical and Biological
Risks
Number of Societal
Risks
Justification for Risk Ratings Assigned
Se
dim
en
t str
uctu
re /
ch
em
istr
y
Wa
ter
qu
alit
y
Air
qu
alit
y
La
nd
Fre
sh
-wate
r
Se
dim
en
t b
iolo
gy (
ben
thos)
Wa
ter
co
lum
n (
pla
nkto
n)
Fin
fish
an
d s
hellf
ish
Se
a m
am
ma
ls
Se
ab
irds
Inte
grity
of
ecosyste
ms/
co
nse
rva
tion
sites
Te
rre
str
ial flo
ra &
fau
na
Co
mm
erc
ial fishin
g
Sh
ipp
ing
Oth
er
use
rs o
f th
e s
ea
On
sh
ore
Co
mm
unitie
s
Natio
nal &
local govern
me
nt,
institu
tio
nal &
com
merc
ial
users
Infr
astr
uctu
re,
recre
atio
n a
nd
am
enity
Ne
glig
ible
Lo
w
Me
diu
m
Hig
h
Ne
glig
ible
Lo
w
Me
diu
m
Hig
h
Discharge of treated linefill from pipelines
Deterioration of water quality
B1 B1 B1 0 3 0 0 0 0 0 0
•Planned discharge of permitted chemicals. E.g. Oxygen scavenger, biocide and corrosion inhibitor governed by a PON15C. •Localised deterioration in water quality around the discharge plume potentially causing localised impacts to benthic and planktonic organisms.
Displacement of seabed sediments during seabed jetting/ excavation and preparation of trench transitions
Seabed and water column impacts
A1 A1 A1 0 3 0 0 0 0 0
• Sediment displacement will occur in localised area of seabed around the trench transitions which will subsequently be covered by rock dump. • It is likely that mortality of a proportion of the benthic organisms in the affected area would occur during sediment displacement. • Resuspended sediments would cause a transient, localised turbidity in the water column.
Unplanned Operations
Vessel-to-vessel collision causing loss mainly of diesel fuel and lubricants
Marine pollution C2 E1 D2 D2 C2 E1 C2 D1 2 4 0 0 1 1 0 0
• Marine pollution (mainly on sea surface) caused by spilled diesel, a light refined product that would rapidly evaporate and dissipate. Impacts short-lived and unlikely to be widespread. • Industry standard controls based on vessel selection, route planning, communication, navigational aids, seamanship, maintaining condition of vessel and shipboard spill prevention and response measures. • Mitigation and response governed by Shipboard Oil Pollution Emergency Plan and Operator's Oil Pollution Emergency Plan.
Vessel-to-vessel collision causing vessel to sink
Seabed and societal impacts
D2 D2 D2 D2 0 2 0 0 0 2 0 0
• Given location and depth, it is possible that a wreck would be salvaged; other vessels would be able to replace the lost resource. • Marine pollution may occur (see above). • Industry standard controls based on vessel selection, route planning, simultaneous operations procedures, communication, navigational aids, seamanship, maintaining condition of vessel and having a guard vessel on station throughout the offshore operations.

Rubie/ Renee – Decommissioning Comparative Assessment
BMT Cordah Limited 38 November 2013
Planned End-Points
Long-term presence of c.16,830 tonnes of graded rockdump (typically granite) on the seabed
Changes in seabed habitat
A2 A2 E1 0 0 2 0 1 0 0 0
• Placement of the protective cover of rock dump over the pipeline ends and other vulnerable areas will create a long-term modification of the localised area of seabed (approx. 0.113 km
2). This material
will provide a habitat that will be colonised by organisms which occur in the North Sea but typically live on, around or within crevices in rocky, rather than sedimentary substrata. • The ecological impact would be limited to the relatively small (0.0113 km²) and well defined rock dumped area. The volume of rockdump will amount to a volume of approx. 9,388 m
3 and an
estimated mass of 16,898 tonnes. •The profile of the rockdump is likely to flatten over the long-term (hundreds of years) as a result of natural processes of erosion and sediment deposition. • Deposition of the material will be controlled by the rock dump vessel’s manoeuvrable fall-pipe and will be monitored by ROV.
Long-term presence of c.16,830 tonnes of graded rockdump (typically granite) on the seabed
Obstruction to fishing
C2 0 0 0 0 0 1 0 0
• The profile of the protective rockdump will have a 1:3 slope which will enable it to be overtrawlable and the quantity of rockdump will be consistent with the requirement for long-term protection of the pipelines. • This assessment is based on rock dump continuing to remain overtrawlable and provide effective protection, and effective monitoring and remedial intervention in the event of failure.
Long-term presence of six pipelines and two umbilicals, representing 6,709 tonnes of material
Changes in seabed chemistry and habitat
A 1 A1 A1 0 3 0 0 0 0 0 0
• The pipelines and umbilicals lie within six separate trenches, with a total length of approx. 98 km. These are buried to 0.6 m under a covering of natural seabed sediments with rockdump placed over line ends and rockdump placed over vulnerable areas. • The burial depth of the pipeline lies within an abiotic sediment zone, i.e. no infaunal species are found below c 30 cm burial depth. • The pipelines are likely to remain intact for a period spanning many decades (>60 years; HSE, 1997). • Structural degradation of the lines will be long-term process caused by corrosion of the steel and other metal components and break-down of plastics, leading initially to a release of residual content (line-fill and oily residues not removed during flushing). • The oil release, release of line-fill and dissolution of metals to the surrounding water column and sediment around the lines will occur so slowly that environmental impact is likely to be negligible. Corrosion of the structural steel will form ferric hydroxide (rust) which is relatively insoluble and environmentally benign. • Eventually the lines will collapse under their own weight and that of the overlying sediment and rock dump, leaving behind a residue of inert broken-up fragments and corrosion products, embedded within the seabed sediments.
Unplanned End-Points
Unrecoverable dropped object on seabed
Impacts to sea users benthic organisms
D1 D1 D1 2 0 0 0 1 0 0 0 • Unintentionally dropped objects will be recovered to the DSV or CSV prior to completion of the work and an as-left survey by ROV will confirm that the seabed is clear of obstructions.
Emergence of lines above seabed level
Snagging hazard for fishing gear
C3 0 0 0 0 0 0 1 0
• Unlikely to be an issue if the lines remain buried within seabed sediments and rockdump. However, pipeline exposure with significant spans has historically occurred as a result of seabed sediment movement on the Rubie/ Renee pipelines. • As-left surveys will ensure that the lines are adequately buried and protected. • Post-decommissioning monitoring programme. • Remedial intervention in the event of lines becoming exposed.
TOTAL NUMBER OF ENVIRONMENTAL AND SOCIETAL RISKS IN EACH CATEGORY 14
23
2 0 5 7 1 0

Rubie/ Renee – Decommissioning Comparative Assessment
BMT Cordah Limited 39 November 2013
Table A4.6: Environmental and Societal Risk Assessment for Option 2: Recovery for Disposal Onshore
Operation or End-Point
Potential Impact
Physical and Chemical Biological Societal
Number of Physical, Chemical
and Biological
Risks
Number of Societal
Risks
Justification for Risk Ratings Assigned
Se
dim
en
t str
uctu
re /
ch
em
istr
y
Wa
ter
qu
alit
y
Air
qu
alit
y
La
nd
Fre
sh
-wate
r
Se
dim
en
t b
iolo
gy (
ben
thos)
Wa
ter
co
lum
n (
pla
nkto
n)
Fin
fish
an
d s
hellf
ish
Se
a m
am
ma
ls
Se
ab
irds
Inte
grity
of
ecosyste
ms/
co
nse
rva
tion
sites
Te
rre
str
ial flo
ra &
fau
na
Co
mm
erc
ial fishin
g
Sh
ipp
ing
Oth
er
use
rs o
f th
e s
ea
On
sh
ore
Co
mm
unitie
s
Natio
nal &
local govern
me
nt,
institu
tio
nal &
com
merc
ial
users
Infr
astr
uctu
re,
recre
atio
n a
nd
am
enity
Ne
glig
ible
Lo
w
Me
diu
m
Hig
h
Ne
glig
ible
Lo
w
Me
diu
m
Hig
h
Planned Operations
Physical presence of DSV, CSV, rockdump vessel, guard vessel and survey vessels during transit between port and the offshore site
Obstruction to fishing vessels and shipping
D1 D1 0 0 0 0 2 0 0 0
• Localised transient impact. Shipping/ fishing traffic can readily navigate round the individual vessels as they travel to and from the offshore site. • Industry standard controls involving route-planning, navigation aids, communications and good seamanship.
Physical presence of DSV, CSV, rockdump vessel, guard vessel, survey vessel, ROVs, divers, dive bell, jetting and other equipment during operations at the offshore site
Obstruction to fishing vessels and shipping
C1 C1 0 0 0 0 0 2 0 0
• Localised transient impact. Shipping/ fishing traffic can readily navigate round the vessel spread at any given stage during the work programme. • Industry standard controls involving project planning, design and operational procedures, Notices to Mariners, 500 m safety zones around the Rubie wellhead and the RPM, navigation aids, communications, good seamanship and presence onsite of a guard vessel.
Underwater noise associated with vessel's engines, DP thrusters and equipment
Injury or disturbance to marine mammals, fish and seabirds
D1 B1 D1 2 1 0 0 0 0 0 0
• Continuous (rather than impulsive) source mainly from vessel's generators and cavitation from the thrusters, with potential for localised disturbance to sea mammals (avoidance behaviour), fish and birds. • Responses of sea mammals vary. Sea mammal and seabird avoidance reactions and attraction to vessels can both occur (Jacques Whitford, 2007). Injury unlikely. Limited information on fish. • Also small scale contributor to background underwater noise levels from vessel traffic in the sea area. • Industry standard controls based on maintenance and power management systems.
Underwater noise associated with the use of sonar and other survey equipment
Injury or disturbance to marine mammals, fish and seabirds
D1 C1 D1 2 1 0 0 0 0 0 0
• Higher frequency emissions utilised during surveys of this type tend to be dissipated to safe levels over a relatively short distance (DEHLG, 2007)*. Additionally sound is not within the frequency range of the Marine Strategy Framework Directive indicator for loud, low and mid-frequency sounds (Genesis, 2011).
Operational discharges of treated oily bilge
Deterioration in water quality
A1 D1 D1 2 1 0 0 0 0 0 0
• Localised transient impact from permitted discharge dissipating to background concentrations within relatively short distance. • Industry standard controls based on separation systems for oil recovery from bilge with discharges within permitted levels of 15ppm.

Rubie/ Renee – Decommissioning Comparative Assessment
BMT Cordah Limited 40 November 2013
Operation or End-Point
Potential Impact
Physical and Chemical Biological Societal
Number of Physical, Chemical
and Biological
Risks
Number of Societal
Risks
Justification for Risk Ratings Assigned
Se
dim
en
t str
uctu
re /
ch
em
istr
y
Wa
ter
qu
alit
y
Air
qu
alit
y
La
nd
Fre
sh
-wate
r
Se
dim
en
t b
iolo
gy (
ben
thos)
Wa
ter
co
lum
n (
pla
nkto
n)
Fin
fish
an
d s
hellf
ish
Se
a m
am
ma
ls
Se
ab
irds
Inte
grity
of
ecosyste
ms/
co
nse
rva
tion
sites
Te
rre
str
ial flo
ra &
fau
na
Co
mm
erc
ial fishin
g
Sh
ipp
ing
Oth
er
use
rs o
f th
e s
ea
On
sh
ore
Co
mm
unitie
s
Natio
nal &
local govern
me
nt,
institu
tio
nal &
com
merc
ial
users
Infr
astr
uctu
re,
recre
atio
n a
nd
am
enity
Ne
glig
ible
Lo
w
Me
diu
m
Hig
h
Ne
glig
ible
Lo
w
Me
diu
m
Hig
h
Sewage and grey water discharges
Deterioration in water quality
A1 D1 D1 2 1 0 0 0 0 0
• Localised transient impact around discharge point. • Discharged material disperses degrades naturally. • Industry standard controls based on discharge of screened, materials as minimum requirement.
Macerated food waste discharge
Deterioration in water quality
A1 D1 D1 2 1 0 0 0 0 0 0
• Localised transient impact around the discharge point. • Discharged material disperses and degrades naturally. • Industry standard controls based on the maceration of organic food waste prior to discharge.
Ballast water uptake and discharge
Risk of transfer of non-native species (if vessels not routinely working in UK/ N. European waters)
E3 0 1 0 0 0 0 0 0
• Remote probability of introduction of non-native species as a result of ballasting of project vessels. • Project vessels will originate from northern European waters. • Ballasting operations will be managed in line with IMO guidelines.
Atmospheric emissions from generators and engines of project vessels
Deterioration in air quality and contribution to global atmospheric impacts
A1 0 1 0 0 0 0 0 0
• Small-scale contributor of GHGs and other global gases. • Localised transient impact in the vicinity of the exhausts. • Emissions disperse in exposed offshore environment. • Industry standard controls based on low sulphur diesel, power management systems, route planning and maintenance.
Atmospheric emissions from engines of helicopters for personnel transport
Deterioration in air quality and contribution to global atmospheric impacts
A1 0 1 0 0 0 0 0 0
• Small-scale contributor of GHGs and other global gases. • Localised transient impact in the vicinity of the exhausts. • Emissions disperse during flight & the exposed offshore environment. • Industry standard controls based on routine & planned maintenance.
Operational wastes from vessels
Use of waste disposal resources and landfill capacity
A1 0 0 0 0 0 1 0 0
• Small-scale use of landfill capacity for non-reusable and non-recyclable wastes. • Industry standard controls in classification, segregation, containment, permits and traceable chain of custody for waste management, shipment, treatment and disposal.

Rubie/ Renee – Decommissioning Comparative Assessment
BMT Cordah Limited 41 November 2013
Operation or End-Point
Potential Impact
Physical and Chemical Biological Societal
Number of Physical, Chemical
and Biological
Risks
Number of Societal
Risks
Justification for Risk Ratings Assigned
Se
dim
en
t str
uctu
re /
ch
em
istr
y
Wa
ter
qu
alit
y
Air
qu
alit
y
La
nd
Fre
sh
-wate
r
Se
dim
en
t b
iolo
gy (
ben
thos)
Wa
ter
co
lum
n (
pla
nkto
n)
Fin
fish
an
d s
hellf
ish
Se
a m
am
ma
ls
Se
ab
irds
Inte
grity
of
ecosyste
ms/
co
nse
rva
tion
sites
Te
rre
str
ial flo
ra &
fau
na
Co
mm
erc
ial fishin
g
Sh
ipp
ing
Oth
er
use
rs o
f th
e s
ea
On
sh
ore
Co
mm
unitie
s
Natio
nal &
local govern
me
nt,
institu
tio
nal &
com
merc
ial
users
Infr
astr
uctu
re,
recre
atio
n a
nd
am
enity
Ne
glig
ible
Lo
w
Me
diu
m
Hig
h
Ne
glig
ible
Lo
w
Me
diu
m
Hig
h
Displacement of seabed sediments during: (a) excavation by divers or ROV using trenching or jetting methods to expose pipelines ends, (b) attachment of recovery heads by divers, (c) back-reeling of lines; (d) cut and lift operations and (e) backfilling of trenches
Seabed and water column impacts
A1 A1 A2 0 2 1 0 0 0 0 0
• Sediment displacement will occur in an area of approx. 3.904 km
2. Naturally occurring sediments will be displaced; although a
relatively small area of seabed may be contaminated with residues from low toxicity oil based drilling muds (no OBM was used) in the immediate vicinity of the two Renee and one Rubie wells. • It is likely that mortality of a proportion of the benthic organisms would occur during sediment displacement. However, sediment structure and composition would be unaffected and natural recolonisation would occur within a relatively short timescale following backfilling (OSPAR, 2009). • Resuspended sediments would cause a transient, localised turbidity in the water column. •No Annex I habitats or other conservation features occur within the vicinity of the pipelines.
Cutting using diamond wire or hydraulic scissor snips
Seabed and water column impacts
A1 A1 A1 0 3 0 0 0 0 0 0 •Release of relatively small quantities of metal and plastic particles, which will fall to the seabed and become incorporated into the seabed sediments. The effect will be highly localised.
Unspooling pipeline and cutting at quayside
Atmospheric emissions and noise
A1 A1 0 1 0 0 0 1 0 0
• Unspooling and cutting will be done at the spool base which is managed according to the site's integrated pollution prevention and control permit. The permit includes limits and controls relating to atmospheric emissions and noise. •Oxyacetylene cutting or hydraulic shears will be used to cut the unspooled pipeline into manageable sections. • Noise will be intermittent and will contribute to the background levels at the site which will be routinely monitored. • Exhaust gases from generators or engines powering cutting equipment will cause a localised deterioration in air quality around the exhaust outlet and will be a small-scale contributor to GHGs and other global gases. • Mitigation is by adherence to permit limits and maintenance of the equipment and plant.
Transportation of recovered material from the quayside to landfill site for disposal onshore
Deterioration in air quality and contribution to global atmospheric impacts
A1 0 1 0 0 0 0 0 0
• Small-scale contributor of GHGs and other global gases. • Localised transient impact in the vicinity of the exhausts. • Emissions disperse during transit. • Industry standard controls based on routine & planned maintenance.

Rubie/ Renee – Decommissioning Comparative Assessment
BMT Cordah Limited 42 November 2013
Operation or End-Point
Potential Impact
Physical and Chemical Biological Societal
Number of Physical, Chemical
and Biological
Risks
Number of Societal
Risks
Justification for Risk Ratings Assigned
Se
dim
en
t str
uctu
re /
ch
em
istr
y
Wa
ter
qu
alit
y
Air
qu
alit
y
La
nd
Fre
sh
-wate
r
Se
dim
en
t b
iolo
gy (
ben
thos)
Wa
ter
co
lum
n (
pla
nkto
n)
Fin
fish
an
d s
hellf
ish
Se
a m
am
ma
ls
Se
ab
irds
Inte
grity
of
ecosyste
ms/
co
nse
rva
tion
sites
Te
rre
str
ial flo
ra &
fau
na
Co
mm
erc
ial fishin
g
Sh
ipp
ing
Oth
er
use
rs o
f th
e s
ea
On
sh
ore
Co
mm
unitie
s
Natio
nal &
local govern
me
nt,
institu
tio
nal &
com
merc
ial
users
Infr
astr
uctu
re,
recre
atio
n a
nd
am
enity
Ne
glig
ible
Lo
w
Me
diu
m
Hig
h
Ne
glig
ible
Lo
w
Me
diu
m
Hig
h
Transportation of recovered material from the quayside to landfill site for disposal onshore
Contribution to congestion/ traffic nuisance
B1 B2 0 0 0 0 0 1 1 0
• An estimated 6,709 tonnes of redundant pipeline will require to be transported to suitable recycling/ waste disposal sites. • Road haulage by articulated lorries is standard practice on the UK transport network. • Wide loads are not anticipated. • Route planning is carried out and the majority of journeys. Long journeys would be required for the transport of pipeline materials between, for example, a spool base located in northern Scotland and a suitable recycling facility in the .central-belt (round trip c. 600 km). • This assessment accounts for the increased likelihood of traffic congestion and other nuisance occurring during the transportation of relatively large quantities of material over long distances on routes which pass through a few rural communities.
Unplanned Operations
Vessel-to-vessel collision causing loss mainly of diesel fuel and lubricants
Marine pollution C2 E1 D2 D2 C2 E1 C2 D1 2 4 0 0 1 1 0 0
• Marine pollution (mainly on sea surface) caused by spilt diesel, a light refined product that would rapidly evaporate and dissipate. Impacts short-lived and unlikely to be widespread. • Industry standard controls based on vessel selection, route planning, communication, navigational aids, seamanship, maintaining condition of vessel and shipboard spill prevention and response measures. • Mitigation and response governed by Shipboard Oil Pollution Emergency Plan and Operator's Oil Pollution Emergency Plan.
Vessel-to-vessel collision causing vessel to sink
Seabed and societal impacts
D2 D2 D2 D2 0 2 0 0 0 2 0 0
• Given the location and depth, it is possible that the wreck would be salvaged. Other vessels would be available to replace the lost resource. • Marine pollution may occur (see above). •Industry standard controls based on vessel selection, route planning, simultaneous operations procedures, communication, navigational aids, seamanship, maintaining condition of vessel and having a guard vessel on station throughout the offshore onsite operations.

Rubie/ Renee – Decommissioning Comparative Assessment
BMT Cordah Limited 43 November 2013
Planned End-Points
Recycling of pipeline components
Atmospheric emissions
A2 0 0 1 0 0 0 0 0
•Materials would be re-used or recycled where possible, thereby minimising landfill requirements. •Compliance with UK waste legislation and Duty of Care. •Use of designated licensed sites only. •Strict compliance with legislation on wastes and emissions. •Environmental limits and controls specified in the UK Pollution Prevention and Control (PPC) Permit/ Integrated Pollution Prevention and Control (IPPC). •Permit for the processes occurring at the site. Other European states have similar permitting requirements.
Unplanned End-Points
Unrecoverable dropped object on seabed
Obstruction to sea users and impacts to benthic organisms
D1 D1 D1 2 0 0 0 1 0 0 0 • Unintentionally dropped objects will be recovered to the DSV or CSV prior to completion of the work and an as-left survey by ROV will confirm that the seabed is clear of obstructions.
TOTAL NUMBER OF ENVIRONMENTAL AND SOCIETAL RISKS IN EACH CATEGORY 14
21
2 0 4 8 1 0

Rubie/ Renee – Decommissioning Comparative Assessment
BMT Cordah Limited 44 November 2013
Intentionally blank page
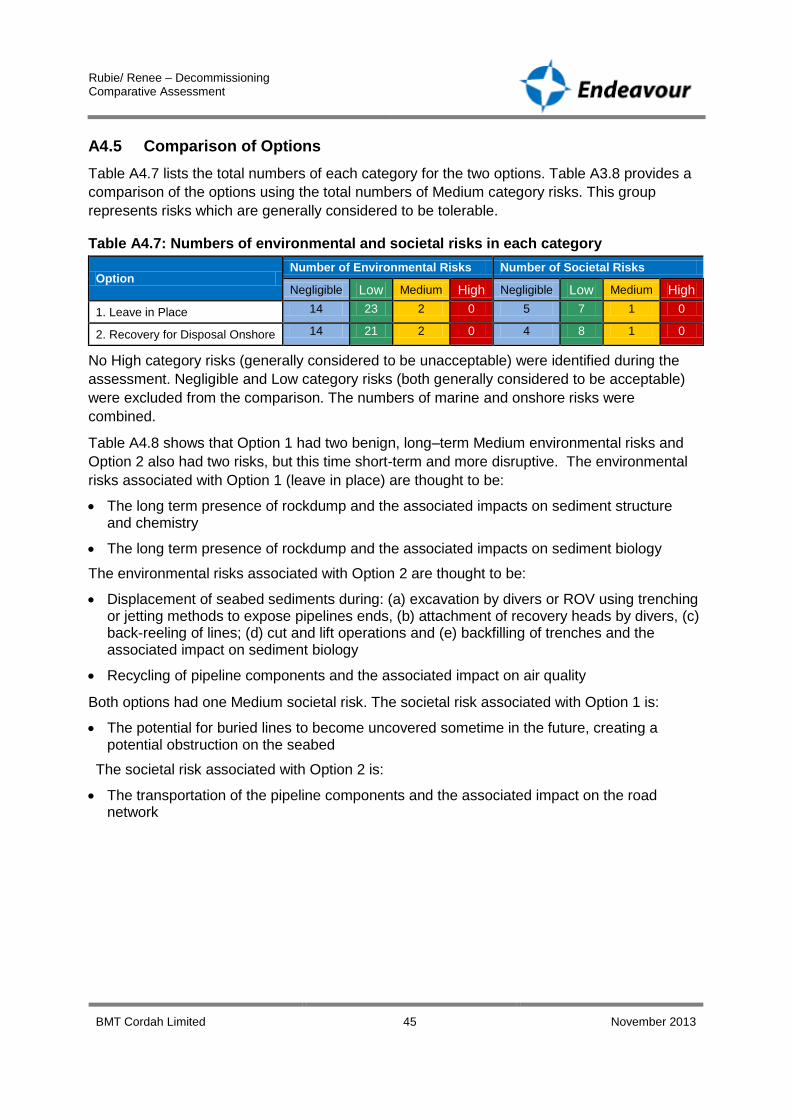
Rubie/ Renee – Decommissioning Comparative Assessment
BMT Cordah Limited 45 November 2013
A4.5 Comparison of Options
Table A4.7 lists the total numbers of each category for the two options. Table A3.8 provides a
comparison of the options using the total numbers of Medium category risks. This group
represents risks which are generally considered to be tolerable.
Table A4.7: Numbers of environmental and societal risks in each category
Option Number of Environmental Risks Number of Societal Risks
Negligible Low Medium High Negligible Low Medium High
1. Leave in Place 14 23 2 0 5 7 1 0
2. Recovery for Disposal Onshore 14 21 2 0 4 8 1 0
No High category risks (generally considered to be unacceptable) were identified during the
assessment. Negligible and Low category risks (both generally considered to be acceptable)
were excluded from the comparison. The numbers of marine and onshore risks were
combined.
Table A4.8 shows that Option 1 had two benign, long–term Medium environmental risks and
Option 2 also had two risks, but this time short-term and more disruptive. The environmental
risks associated with Option 1 (leave in place) are thought to be:
The long term presence of rockdump and the associated impacts on sediment structure and chemistry
The long term presence of rockdump and the associated impacts on sediment biology
The environmental risks associated with Option 2 are thought to be:
Displacement of seabed sediments during: (a) excavation by divers or ROV using trenching or jetting methods to expose pipelines ends, (b) attachment of recovery heads by divers, (c) back-reeling of lines; (d) cut and lift operations and (e) backfilling of trenches and the associated impact on sediment biology
Recycling of pipeline components and the associated impact on air quality
Both options had one Medium societal risk. The societal risk associated with Option 1 is:
The potential for buried lines to become uncovered sometime in the future, creating a potential obstruction on the seabed
The societal risk associated with Option 2 is:
The transportation of the pipeline components and the associated impact on the road network

Rubie/ Renee – Decommissioning Comparative Assessment
BMT Cordah Limited 46 November 2013
Table A4.8: Ranking of the options in order of the total numbers of Medium category risks (Normalised score: 1 = fewest risks; 0 = most risks)
Option
Environmental Risks Societal Risks
Total Number
Normalised Score
Weighted Score
Total Number
Normalised Score
Weighted Score
1 Leave in Place 2 1 0.9 1 1 0.6
2 Recovery for Disposal Onshore
2 1 0.9 1 1 0.6
A4.6 References
DEHLG, 2007. Code of Practice for the Protection of Marine Mammals during Acoustic Seafloor Surveys in Irish Waters. Version 1.1. August 2007. Department of the Environment, Heritage and Local Government, Dublin, Ireland. http://www.npws.ie/media/npws/publications/marine/media,5176,en.pdf
Genesis, 2011. Review and Assessment of Underwater Sound Produced from Oil and Gas Sound Activities and Potential Reporting Requirements under the Marine Strategy Framework Directive. 2011. Genesis Oil and Gas Consultants report for the Department of Energy and Climate Change. Genesis Oil and Gas Consultants, Aberdeen, UK.
HSE, 1997. The Abandonment of Offshore Pipelines. Report for the Health and Safety Executive by John Brown Engineers and Constructors Ltd. Offshore Technology Report OTH 535. HSE Books, Norwich, UK. ISBN 0-7176-1421-2.
Jacques Whitford, 2007. Sydney Basin Strategic Environmental Assessment, Report JWL 1014038 January 2007. Jacques Whitford AXYS Ltd, Sidney, British Columbia, Canada. http://www.cnlopb.nl.ca/pdfs/sea_sb/sbchap5.pdf
OSPAR, 2009. Assessment of impacts of offshore oil and gas activities in the North-East Atlantic. OSPAR Commission, London, 39 pages, Publication Number: 453/2009. ISBN 978-1-906840-93-8.

Rubie/ Renee – Decommissioning Comparative Assessment
BMT Cordah Limited 47 November 2013
APPENDIX 5: ENERGY USAGE AND EMISSIONS ESTIMATES

Rubie/ Renee – Decommissioning Comparative Assessment
BMT Cordah Limited 48 November 2013
A5.1 Introduction
This section presents the quantitative estimates of energy usage emissions that provide the
basis for differentiating between the two options for decommissioning the Rubie/ Renee
subsea infrastructure. The method follows that given in the Guidelines for Calculation of
Energy Use and Gaseous Emissions in Decommissioning (IoP, 2000).
A5.2 Assessment Method
The total quantities of energy usage and CO2 emissions were calculated by:
a) Estimating quantities of diesel fuel consumed by vessels involved in the work
programmes offshore (Options 1 and 2);
b) Estimating quantities of diesel consumed during the haulage onshore of the redundant
materials to landfill or recycling facilities (Option 1 and 2);
c) Estimating quantities of aviation fuel used for helicopter operations (Options 1 and 2)
d) Estimating quantities of materials required hypothetically for the manufacture of new
materials equivalent to the materials lost to society by leaving material in situ in the
seabed (Option 1 only) or by disposal to landfill (Options 1 and 2).
e) Estimating the energy required for the recycling of pipeline materials (Option 2 only)
f) Multiplying these quantities by energy content and emissions factors which are
provided in tables A5.1 and A5.2:
Table A5.1: Conversion factors for fuels
Fuel type Energy consumption (GJ/tonne)
CO2 Emissions (tonne CO2/ tonne)
Source*
Marine diesel fuel 43.1 3.2 IoP (2000)
Aviation fuel 46.1 3.2 IoP (2000)
DERV 44.0 3.2 DEFRA/DECC 2011

Rubie Renee – Decommissioning Comparative Assessment
BMT Cordah Limited 49 November 2013
Table A5.2: Conversion factors for recycling and manufacture of replacement materials
Material Recycling New Manufacture Source*
Energy consumption (GJ/tonne)
CO2
Emissions (tonne CO2/tonne)
Energy consumption (GJ/tonne)
CO2
Emissions (tonne CO2/tonne)
Standard steel
9 0.96 25 1.889 IoP (2000)
Aluminium 15 1.080 215 3.589 IoP (2000)
Copper 25 0.300 100 7.175 IoP (2000)
Zinc 10 0.480 65 0.024 University of Bath (2008)
Plastics* 20 0.693 105 3.179 Harvey (2010); DEFRA/DECC(2011)
* Mid-range energy consumption for 'Plastics' from Harvey (2010); CO2 expressed as CO2 equivalent emissions from open loop manufacture of plastics from recycled and raw materials from DEFRA/DECC 2011
A5.3 Results of the Assessment
A5.3.1 Option 1: Leave in Place
Table A5.3 provides the results of the assessment. It is assumed that:
Energy usage and emissions would originate principally from two sources: (1) combustion of diesel fuel by the six vessels involved in rock dump and survey operations and (2) the hypothetical manufacture of new materials to replace those lost to society because the pipelines have been left in place buried in seabed sediments;
Total time spent mobilising, transiting, onsite and demobilising by the vessels would be a maximum of 233 days;
Fuel consumption rates have been taken from IoP (2000) guidelines
Table A5.3 provides the results to the energy usage and emissions calculations for
Option 1. In line with DECC Decommissioning Guidance (DEFRA/ DECC, 2011), energy
usage is expressed as GJ and gaseous emissions are expressed as tonnes of CO2.
Table A5.3: Energy Usage and Emissions for Option 1: Leave in Place
Activity Duration (day)
Fuel Consumption Rate (tonne/day)
Fuel Consumed (tonne)
Energy Usage (GJ)
CO2 (tonne)
Calculation 1: DSV Operation
Mobilisation and demobilisation
4 3 12 517 38
Transit to and from Site 1 22 22 948 70
Working on Site 13 18 234 10,085 749
Subtotal 11,551 858

Rubie Renee – Decommissioning Comparative Assessment
BMT Cordah Limited 50 November 2013
Calculation 2: CSV Operation
Mobilisation and demobilisation
4 3 12 517 38
Transit to and from Site 1 27 27 1,164 86
Working on Site 13 12 156 6,724 499
Subtotal 8,405 624
Calculation 3: Rock Dump Vessel Operation
Mobilisation and demobilisation
4 2 8 345 26
Transit to and from Site 1 8 8 345 26
Working on Site 4 15 60 2,586 192
Subtotal 3,276 243
Calculation 4: Guard Vessel Operation
Mobilisation and demobilisation
N/A N/A N/A N/A N/A
Transit to and from Site 1 12 12 517 38
Working on Site 21 4 84 3,620 269
Subtotal 4,138 307
Calculation 5: Fishing Trawler Operation
Mobilisation and demobilisation
N/A N/A N/A N/A N/A
Transit to and from Site 1 5 5 216 16
Working on Site 2 5 10 431 32
Subtotal 647 48
Calculation 6: Survey Vessel Operation
Mobilisation and demobilisation
8 2 16 690 51
Transit to and from Site 2 24 48 2,069 154
Working on Site 2 15 30 1,293 96
Subtotal 4,051 301
Calculation 7: Helicopter Operations**
Activity Duration (hours)
Fuel Consumption Rate (tonne/hour
Fuel Consumed (tonne)
Energy Usage (GJ)
CO2 (tonne)
Transport of personnel to and from the vessels at the offshore location
8 0.800 0.064 3 0.20
Subtotal 3 0.20

Rubie Renee – Decommissioning Comparative Assessment
BMT Cordah Limited 51 November 2013
Calculation 8: Manufacture of Replacement Materials
Replacement by new materials equivalent to:
Materials Total Weight of Materials (tonne)
Energy Usage (GJ)
CO2 (tonne)
Pipelines remaining in situ Steel 5,359.8 133,996 10,125
Aluminium 54.7 11,765 196
Copper 13.8 1,378 98.872
Plastics 1,096.0 115,080 3,484
Subtotal 262,218 13,904
TOTAL FOR OPTION 294,288 16,285
* The CA assumes that road haulage will be used, where a 33 tonne capacity articulated lorry with a 46 litres/100km fuel consumption (DECC/DEFRA, 2011) makes a 600km round trip for each load of pipeline materials for recycling (e.g. a round trip from a spool base in Northern Scotland to a recycling facility in the Scottish Central Belt).
** Assumes 24 (Option 1) and 28 (Option 2) flights of 150 km distance in a helicopter with a cruise speed of 250 km/hr (Eurocopter, 2013) and a fuel consumption of 0.8 tonne per hour (IoP, 2000)
A5.3.2 Option 2: Recovery for Disposal Onshore
Table A5.4 provides the results of the assessment. It is assumed that:
Energy usage and emissions would originate principally from four sources: combustion of fuel (1) by the vessels (2) by the lorry used to transport the material to the landfill site (3) from the energy use and emissions generated during the recycling of the pipeline component materials; and (4) from the hypothetical manufacture of new materials to replace those lost to society if resources are sent to landfill.
Total time spent mobilising, transiting, onsite and demobilising by the vessels would be a maximum of 214 days;
Fuel consumption rates have been taken form IoP (2000) guidelines
Table A5.4 provides the results to the energy usage and emissions calculations for
Option 2.
Table A5.4: Energy Usage and Emissions for Option 2: Recovery for Disposal Onshore
Activity Duration (day)
Fuel Consumption
Rate (tonne/day)
Fuel Consumed
(tonne)
Energy Usage (GJ)
CO2 (tonne)
Calculation 1: DSV Operation
Mobilisation and demobilisation 4 3 12 517 38
Transit to and from Site 1 22 22 948 70
Working on Site 17 18 306 13,189 979
Subtotal 14,654 1,088

Rubie Renee – Decommissioning Comparative Assessment
BMT Cordah Limited 52 November 2013
Calculation 2: CSV Operation
Mobilisation and demobilisation 4 3 12 517 38
Transit to and from Site 1 27 27 1,164 86
Working on Site 13 12 156 6,724 499
Subtotal 8,405 624
Calculation 3: Reel Vessel Operation
Mobilisation and demobilisation 9 3 27 1,164 86
Transit to and from Site 4 19 76 3,276 243
Working on Site 10 19 190 8,189 608
Subtotal 12,628 938
Calculation 4: Jetting Vessel/Trencher Operation
Mobilisation and demobilisation 4 2 8 345 26
Transit to and from Site 1 8 8 345 26
Working on Site 20 15 300 12,930 960
Subtotal 13,620 1,011
Calculation 5: Guard Vessel Operation
Mobilisation and demobilisation N/A N/A N/A N/A N/A
Transit to and from Site 1 12 12 517 38
Working on Site 25 4 100 4,310 320
Subtotal 4,827 358
Calculation 6: Fishing Trawler Operation
Mobilisation and demobilisation N/A N/A N/A N/A N/A
Transit to and from Site 1 5 5 216 16
Working on Site 2 5 10 431 32
Subtotal 647 48
Calculation 7: Survey Vessel Operation
Mobilisation and demobilisation 4 2 8 345 26
Transit to and from Site 2 24 48 2,069 154
Working on Site 2 15 30 1,293 96
Subtotal 3,707 275
Calculation 8: Road Haulage Vehicle Operation
Activity Distance (km)
Fuel Consumption
Rate (tonne/100km)
Fuel Consumed
(tonne)
Energy Usage (GJ)
CO2 (tonne)
Transport of 6,166.2 tonne of redundant pipelines*
105,938 0.039 41.32 1,818 132
Subtotal 1,818 132

Rubie Renee – Decommissioning Comparative Assessment
BMT Cordah Limited 53 November 2013
Calculation 9: Helicopter Operations
Activity Duration (hours)
Fuel Consumption
Rate (tonne/hour)
Fuel Consumed
(tonne)
Energy Usage (GJ)
CO2 (tonne)
Transport of personnel to & from vessels at offshore location
10 0.800 0.08 4 0.26
Subtotal 4 0.26
Calculation 10: Recycling of Pipeline Materials
Materials Recycled Total Weight of Materials (tonne)
Total Weight of Materials (tonne)
Energy Usage (GJ)
CO2 (tonne)
All of the material from the four recovered lines (100% recycling provides worst case scenario for energy usage and emissions)
Steel 5,359.8 48,239 5,145
Aluminium 54.7 821 59
Copper 13.8 345 4
Plastics 1,096.0 21,920 760
Subtotal 71,324 5,968
TOTAL FOR OPTION 131,632 10,443
A5.4 Comparison of Options
Table A5.5 provides a comparison of the two options. The results indicate that energy
usage for Option2 is 47% that of Option 1, and that CO2 emissions for Option 2 represent
69% of those for Option 1.
Table A5.5 Comparison of energy usage and CO2 emissions (Normalised Score: 1= lowest energy usage and emissions; 0 = highest values)
Option Energy Usage (GJ) CO2 (tonne) Normalised Score
1. Leave in Place 294,288 16,285 0
2. Total Removal 131,632 10,443 1
A3.5 References
DEFRA/DECC, 2011. Guidelines to DERFA/DECC's Greenhouse Gas Conversion factors for Company Reporting. Produced by AEA for the Department of Energy and Climate Change (DECC) and the Department for Environment, Food and Rural Affairs (Defra). www.gov.uk/government/uploads/system/aggachment data/file/69544/pb13773-ghg-conversion-factors-2012.pdf
Harvey, L.D.D. (2010). Energy Efficiency and Demand for Energy Services. Energy and the New Reality 1. Earthscan Ltd. Cromwell Press, London, UK. ISBN: 978-1-84971-912-5
Eurocopter (2013). Profile for Superpuma helicopter. http://www.eurocopter.com/site/en/ ref/ Characteristics111.html (accessed Aug 2013)
Institute of Petroleum (2000). Guidelines for the calculation of estimates of energy use and emissions in the decommissioning of offshore structures.

Rubie Renee – Decommissioning Comparative Assessment
BMT Cordah Limited 54 November 2013
Intentionally blank page

Rubie Renee – Decommissioning Comparative Assessment
BMT Cordah Limited 55 November 2013
APPENDIX 6: COST ESTIMATES
Note that this appendix contains commercially sensitive, confidential data which
Endeavour will only make available to DECC. Costs are therefore omitted from this
version of and are submitted to DECC under cover of a separate letter.

Rubie Renee – Decommissioning Comparative Assessment
BMT Cordah Limited 56 November 2013
A6.1 Introduction
This appendix provides cost estimates for the two options which were mainly based on
Endeavour’s knowledge for the current (August 2013) market rates for specialist vessels.
A6.2 Estimated Costs
Tables A6.1 and A6.2 respectively provide cost estimates for Options 1 and 2.
Table A6.1 Cost estimate for Option 1: Leave in Place
Item Number Rate Cost
DSV: Days chartered
CSV/supply boat: Days chartered
Rockdump vessel: Days chartered
Guard vessel: Days chartered
Fishing trawler: Days chartered
Survey vessel: Days chartered
Helicopter: Hours chartered
MCAA licence fee(DEFRA, 2011)
Contingency for future surveys and seabed remediation
TOTAL
Table A6.2: Cost estimate for Option 2: Recovery for Disposal Onshore
Item Number Rate Cost
DSV: Days chartered
CSV/supply boat: Days chartered
Reel vessel: Days chartered
Jetting vessel/trencher: Days chartered
Guard vessel: Days chartered
Fishing trawler: Days chartered
Survey vessel: Days chartered
Helicopter: Hours chartered
Spool base: Mobilisation charge
Recycling/disposal of pipelines: tonne
MCAA licence fee (DEFRA, 2011)
Contingency for future surveys and seabed remediation
TOTAL

Rubie Renee – Decommissioning Comparative Assessment
BMT Cordah Limited 57 November 2013
A6.3 Comparison of Options
Table A6.3 provides a cost comparison for the two options.
Table A6.3: Comparison of costs (Normalised Scores: 1 = lowest cost; 0 = highest cost)
Option Estimated Cost Normalised
Score Weighted
Score
1. Leave in Place
2. Total Removal
A6.4 References
DEFRA, 2011. Guidance on Marine Licensing under Part 4 of the Marine and Coastal Access Act 2009. March 2011. Department for Environment, Food and Rural Affairs, London, UK. http://archive.defra.gov.uk/environment/marine /documents/interim2/mcaa-licensing-guide.pdf (Downloaded 31 March 2013).