rumo logística operadora multimodal s.a.ri.rumolog.com/ptb/7275/rumo - itr e release 3t15.pdf · 3...
TRANSCRIPT
Rumo Logística Operadora Multimodal S.A.
Interim Financial Statements
September 30, 2015
and review report of the independent auditors thereon

(A free translation of the original in Portuguese)
Rumo Logística Operadora Multimodal S.A.
Interim Financial Statements
September 30, 2015
Contents
Independent auditor’s report on review of interim financial
statements 3
Balance sheets 5
Statements of income 8
Statements of comprehensive income 10
Statements of changes in equity 11
Statements of cash flows – indirect method 14
Statements of value added 17
Notes to the interim financial statements 19
3
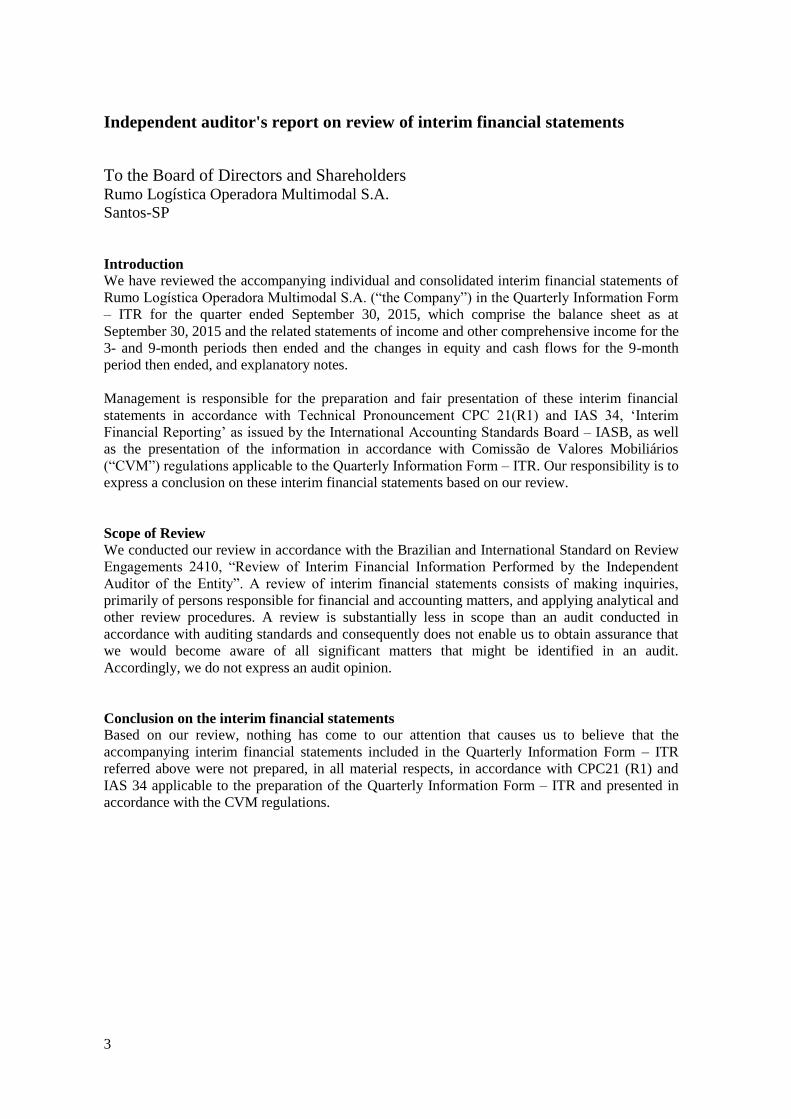
Independent auditor's report on review of interim financial statements
To the Board of Directors and Shareholders Rumo Logística Operadora Multimodal S.A.
Santos-SP
Introduction
We have reviewed the accompanying individual and consolidated interim financial statements of
Rumo Logística Operadora Multimodal S.A. (“the Company”) in the Quarterly Information Form
– ITR for the quarter ended September 30, 2015, which comprise the balance sheet as at
September 30, 2015 and the related statements of income and other comprehensive income for the
3- and 9-month periods then ended and the changes in equity and cash flows for the 9-month
period then ended, and explanatory notes.
Management is responsible for the preparation and fair presentation of these interim financial
statements in accordance with Technical Pronouncement CPC 21(R1) and IAS 34, ‘Interim
Financial Reporting’ as issued by the International Accounting Standards Board – IASB, as well
as the presentation of the information in accordance with Comissão de Valores Mobiliários
(“CVM”) regulations applicable to the Quarterly Information Form – ITR. Our responsibility is to
express a conclusion on these interim financial statements based on our review.
Scope of Review
We conducted our review in accordance with the Brazilian and International Standard on Review
Engagements 2410, “Review of Interim Financial Information Performed by the Independent
Auditor of the Entity”. A review of interim financial statements consists of making inquiries,
primarily of persons responsible for financial and accounting matters, and applying analytical and
other review procedures. A review is substantially less in scope than an audit conducted in
accordance with auditing standards and consequently does not enable us to obtain assurance that
we would become aware of all significant matters that might be identified in an audit.
Accordingly, we do not express an audit opinion.
Conclusion on the interim financial statements
Based on our review, nothing has come to our attention that causes us to believe that the
accompanying interim financial statements included in the Quarterly Information Form – ITR
referred above were not prepared, in all material respects, in accordance with CPC21 (R1) and
IAS 34 applicable to the preparation of the Quarterly Information Form – ITR and presented in
accordance with the CVM regulations.

4
Other matters
Statement of value added
We have also reviewed the Statements of value added (DVA), individual and consolidated, for
the 9-month period ended September 30, 2015, prepared by Management, whose presentation in
interim financial information is required by CVM regulation applicable to the Quarterly
Information Form – ITR and is considered supplementary information by IFRS, that does not
required the DVA presentation. These statements were subject to the same review procedures
previously described and, based on our review, nothing has come to our attention that causes us to
believe that they were not prepared, in all material respects, consistently with the individual and
consolidated interim financial statements as a whole.
Corresponding figures
The corresponding figures, individual and consolidated, for the balance sheet as at December 31,
2014 were audited by another auditor who issued an unmodified report on March 3, 2015 and the
statements, individual and consolidated, of income and other comprehensive income for the 3-
and 9-month periods ended September 30, 2014 and changes in equity and cash flows for the 9-
month period ended September 30, 2014 were reviewed by another auditor who issued an
unmodified report on November 5, 2014. The corresponding figures related to the statement of
value added (DVA), individual and consolidated, for the 9-month period ended September 30,
2014, were subject to the same review procedures by those auditors and, based on their review,
those auditors issued a report stating that nothing has come to their attention that causes them to
believe that the DVA were not prepared, in all material respects, consistently with the individual
and consolidated interim financial statements as a whole.
Curitiba, November 5, 2015.
KPMG Auditores Independentes
CRC SP-014428/O-6
Original in Portuguese signed by
João Alberto Dias Panceri
Accountant CRC PR048555/O-2
5
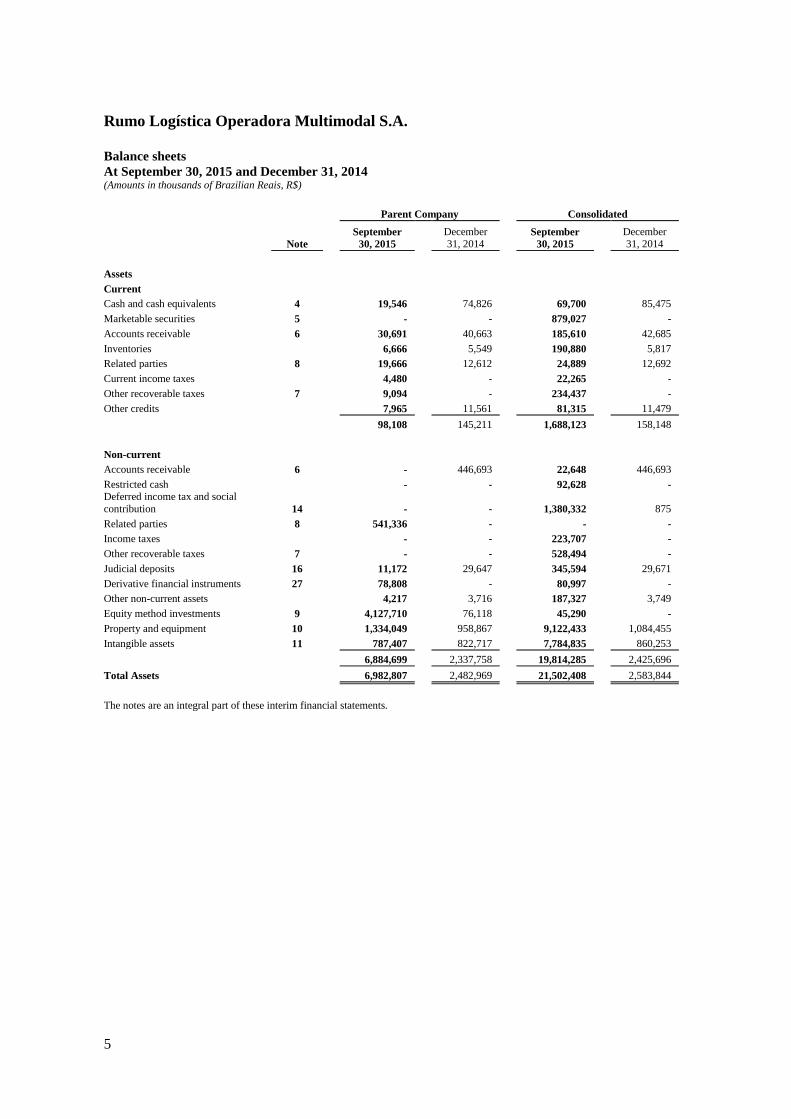
Rumo Logística Operadora Multimodal S.A.
Balance sheets
At September 30, 2015 and December 31, 2014 (Amounts in thousands of Brazilian Reais, R$)
Parent Company Consolidated
Note
September
30, 2015
December 31, 2014
September
30, 2015
December 31, 2014
Assets
Current
Cash and cash equivalents 4 19,546 74,826 69,700 85,475
Marketable securities 5 - - 879,027 -
Accounts receivable 6 30,691 40,663 185,610 42,685
Inventories 6,666 5,549 190,880 5,817
Related parties 8 19,666 12,612 24,889 12,692
Current income taxes 4,480 - 22,265 -
Other recoverable taxes 7 9,094 - 234,437 -
Other credits 7,965 11,561 81,315 11,479
98,108 145,211 1,688,123 158,148
Non-current
Accounts receivable 6 - 446,693 22,648 446,693
Restricted cash - - 92,628 - Deferred income tax and social
contribution 14 - - 1,380,332 875
Related parties 8 541,336 - - -
Income taxes - - 223,707 -
Other recoverable taxes 7 - - 528,494 -
Judicial deposits 16 11,172 29,647 345,594 29,671
Derivative financial instruments 27 78,808 - 80,997 -
Other non-current assets 4,217 3,716 187,327 3,749
Equity method investments 9 4,127,710 76,118 45,290 -
Property and equipment 10 1,334,049 958,867 9,122,433 1,084,455
Intangible assets 11 787,407 822,717 7,784,835 860,253
6,884,699 2,337,758 19,814,285 2,425,696
Total Assets 6,982,807 2,482,969 21,502,408 2,583,844
The notes are an integral part of these interim financial statements.
6
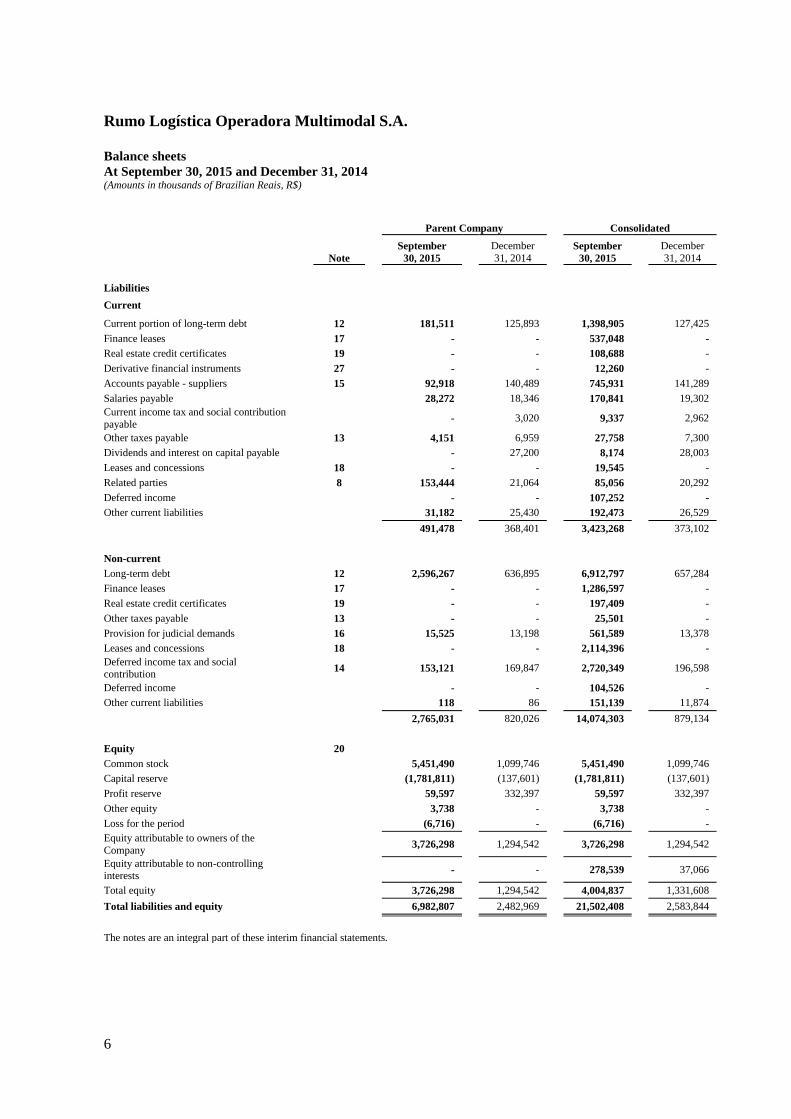
Rumo Logística Operadora Multimodal S.A.
Balance sheets
At September 30, 2015 and December 31, 2014 (Amounts in thousands of Brazilian Reais, R$)
Parent Company Consolidated
Note
September
30, 2015
December
31, 2014 September
30, 2015
December
31, 2014
Liabilities
Current
Current portion of long-term debt 12 181,511 125,893 1,398,905 127,425
Finance leases 17 - - 537,048 -
Real estate credit certificates 19 - - 108,688 -
Derivative financial instruments 27 - - 12,260 -
Accounts payable - suppliers 15 92,918 140,489 745,931 141,289
Salaries payable 28,272 18,346 170,841 19,302
Current income tax and social contribution
payable - 3,020 9,337 2,962
Other taxes payable 13 4,151 6,959 27,758 7,300
Dividends and interest on capital payable - 27,200 8,174 28,003
Leases and concessions 18 - - 19,545 -
Related parties 8 153,444 21,064 85,056 20,292
Deferred income - - 107,252 -
Other current liabilities 31,182 25,430 192,473 26,529
491,478 368,401 3,423,268 373,102
Non-current
Long-term debt 12 2,596,267 636,895 6,912,797 657,284
Finance leases 17 - - 1,286,597 -
Real estate credit certificates 19 - - 197,409 -
Other taxes payable 13 - - 25,501 -
Provision for judicial demands 16 15,525 13,198 561,589 13,378
Leases and concessions 18 - - 2,114,396 -
Deferred income tax and social contribution
14 153,121 169,847 2,720,349 196,598
Deferred income - - 104,526 -
Other current liabilities 118 86 151,139 11,874
2,765,031 820,026 14,074,303 879,134
Equity 20
Common stock 5,451,490 1,099,746 5,451,490 1,099,746
Capital reserve (1,781,811) (137,601) (1,781,811) (137,601)
Profit reserve 59,597 332,397 59,597 332,397
Other equity 3,738 - 3,738 -
Loss for the period (6,716) - (6,716) -
Equity attributable to owners of the
Company 3,726,298 1,294,542 3,726,298 1,294,542
Equity attributable to non-controlling interests
- - 278,539 37,066
Total equity 3,726,298 1,294,542 4,004,837 1,331,608
Total liabilities and equity 6,982,807 2,482,969 21,502,408 2,583,844
The notes are an integral part of these interim financial statements.
7
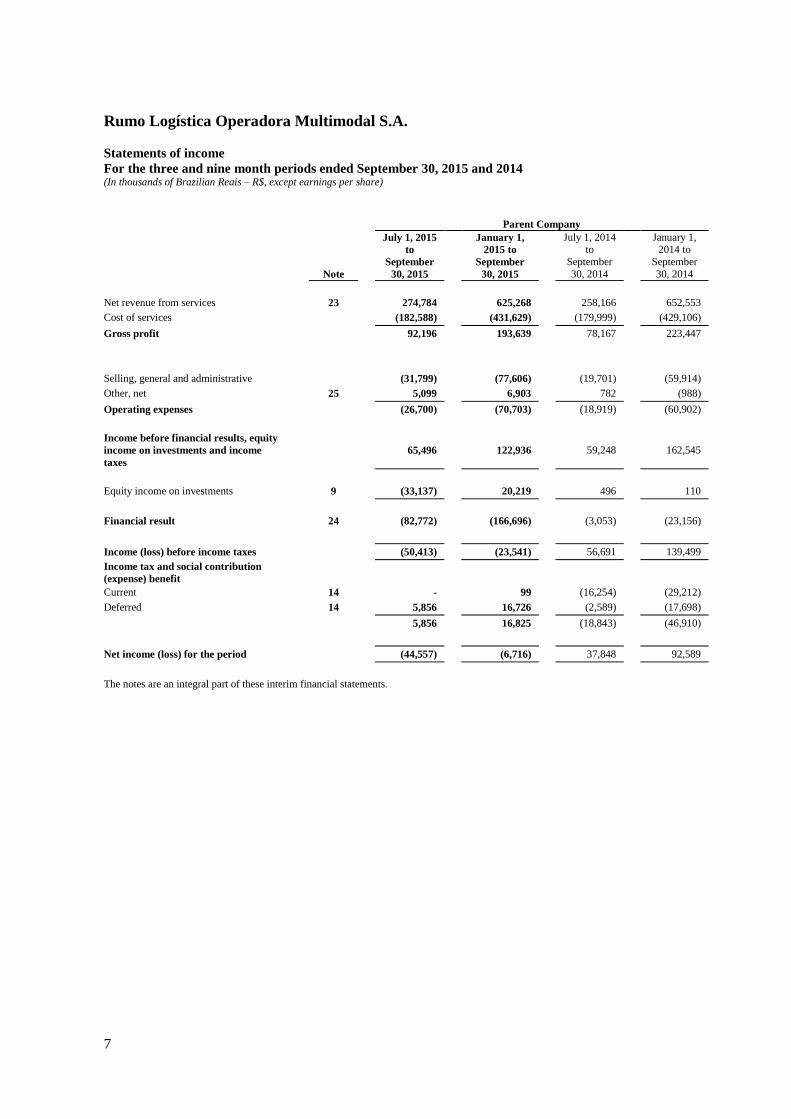
Rumo Logística Operadora Multimodal S.A.
Statements of income
For the three and nine month periods ended September 30, 2015 and 2014 (In thousands of Brazilian Reais – R$, except earnings per share)
Parent Company
Note
July 1, 2015
to
September
30, 2015
January 1,
2015 to
September
30, 2015
July 1, 2014 to
September
30, 2014
January 1, 2014 to
September
30, 2014
Net revenue from services 23 274,784 625,268 258,166 652,553
Cost of services (182,588) (431,629) (179,999) (429,106)
Gross profit 92,196 193,639 78,167 223,447
Selling, general and administrative (31,799) (77,606) (19,701) (59,914)
Other, net 25 5,099 6,903 782 (988)
Operating expenses (26,700) (70,703) (18,919) (60,902)
Income before financial results, equity
income on investments and income
taxes
65,496 122,936 59,248 162,545
Equity income on investments 9 (33,137) 20,219 496 110
Financial result 24 (82,772) (166,696) (3,053) (23,156)
Income (loss) before income taxes (50,413) (23,541) 56,691 139,499
Income tax and social contribution
(expense) benefit
Current 14 - 99 (16,254) (29,212)
Deferred 14 5,856 16,726 (2,589) (17,698)
5,856 16,825 (18,843) (46,910)
Net income (loss) for the period (44,557) (6,716) 37,848 92,589
The notes are an integral part of these interim financial statements.
8
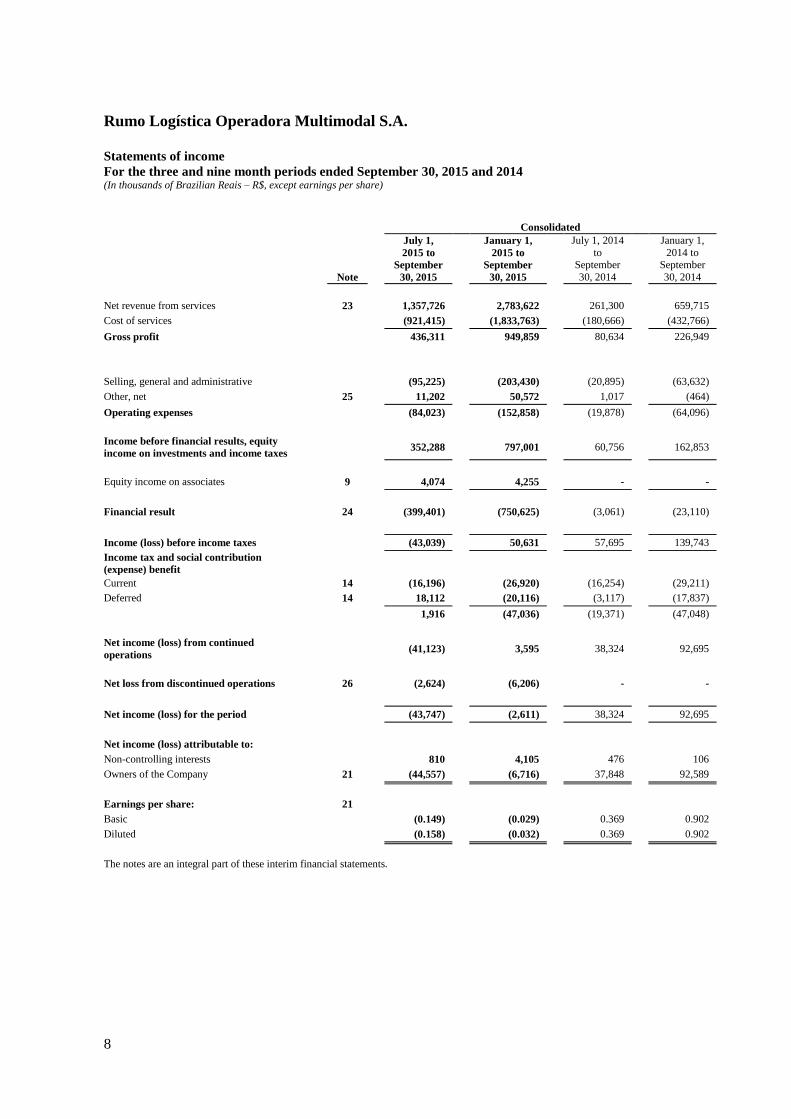
Rumo Logística Operadora Multimodal S.A.
Statements of income
For the three and nine month periods ended September 30, 2015 and 2014 (In thousands of Brazilian Reais – R$, except earnings per share)
Consolidated
Note
July 1,
2015 to
September
30, 2015
January 1,
2015 to
September
30, 2015
July 1, 2014
to September
30, 2014
January 1,
2014 to September
30, 2014
Net revenue from services 23 1,357,726 2,783,622 261,300 659,715
Cost of services (921,415) (1,833,763) (180,666) (432,766)
Gross profit 436,311 949,859 80,634 226,949
Selling, general and administrative (95,225) (203,430) (20,895) (63,632)
Other, net 25 11,202 50,572 1,017 (464)
Operating expenses (84,023) (152,858) (19,878) (64,096)
Income before financial results, equity
income on investments and income taxes 352,288 797,001 60,756 162,853
Equity income on associates 9 4,074 4,255 - -
Financial result 24 (399,401) (750,625) (3,061) (23,110)
Income (loss) before income taxes (43,039) 50,631 57,695 139,743
Income tax and social contribution
(expense) benefit
Current 14 (16,196) (26,920) (16,254) (29,211)
Deferred 14 18,112 (20,116) (3,117) (17,837)
1,916 (47,036) (19,371) (47,048)
Net income (loss) from continued
operations (41,123) 3,595 38,324 92,695
Net loss from discontinued operations 26 (2,624) (6,206) - -
Net income (loss) for the period (43,747) (2,611) 38,324 92,695
Net income (loss) attributable to:
Non-controlling interests 810 4,105 476 106
Owners of the Company 21 (44,557) (6,716) 37,848 92,589
Earnings per share: 21
Basic (0.149) (0.029) 0.369 0.902
Diluted (0.158) (0.032) 0.369 0.902
The notes are an integral part of these interim financial statements.
9
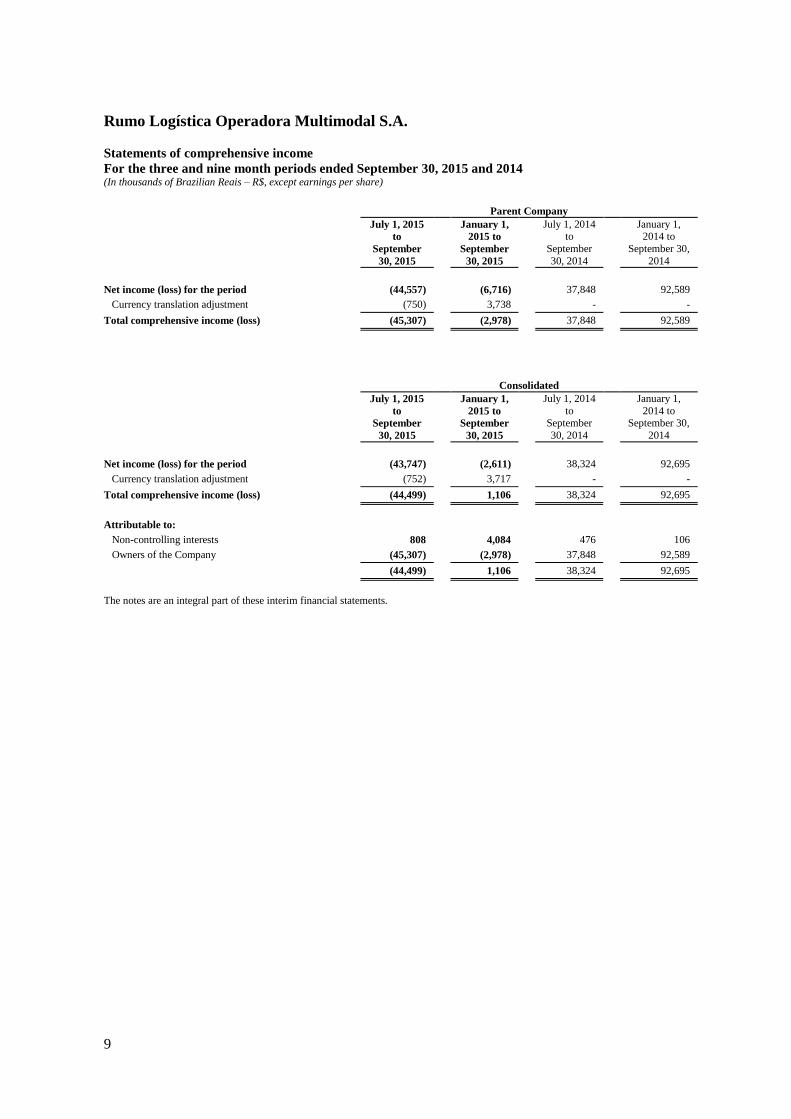
Rumo Logística Operadora Multimodal S.A.
Statements of comprehensive income
For the three and nine month periods ended September 30, 2015 and 2014 (In thousands of Brazilian Reais – R$, except earnings per share)
Parent Company
July 1, 2015
to
September
30, 2015
January 1,
2015 to
September
30, 2015
July 1, 2014 to
September
30, 2014
January 1, 2014 to
September 30,
2014
Net income (loss) for the period (44,557) (6,716) 37,848 92,589
Currency translation adjustment (750) 3,738 - -
Total comprehensive income (loss) (45,307) (2,978) 37,848 92,589
Consolidated
July 1, 2015
to
September
30, 2015
January 1,
2015 to
September
30, 2015
July 1, 2014
to September
30, 2014
January 1,
2014 to September 30,
2014
Net income (loss) for the period (43,747) (2,611) 38,324 92,695
Currency translation adjustment (752) 3,717 - -
Total comprehensive income (loss) (44,499) 1,106 38,324 92,695
Attributable to:
Non-controlling interests 808 4,084 476 106
Owners of the Company (45,307) (2,978) 37,848 92,589
(44,499) 1,106 38,324 92,695
The notes are an integral part of these interim financial statements.

10
Rumo Logística Operadora Multimodal S.A.
Statements of changes in equity
For the nine month periods ended September 30, 2015 and 2014
(Amounts in thousands of Brazilian Reais, R$)
Attributable to shareholders of Company
Profit reserve
Common
stock
Capital
reserve Legal
Retained
earnings
Profit for the
period Total
Non-
controlling
interest Total equity
Balance at January 1, 2014 1,099,746
(137,601) 24,486 372,250 - 1,358,881 37,013 1,395,894
Income for the period - - - - 92,589 92,589 106 92,695
Total comprehensive income for the
period - - - - 92,589 92,589 106 92,695
Reserve from write-off of dividends - - - 98,334 - 98,334 - 98,334
Interim dividends - - - (250,000) - (250,000) 65 (249,935)
Total contributions or distributions
to shareholders, recognized directly
in equity - - - (151,666) - (151,666) 65 (151,601)
Balance at September 30, 2014 1,099,746 (137,601) 24,486 220,584 92,589 1,299,804 37,184 1,336,988
The notes are an integral part of these interim financial statements.

11
Rumo Logística Operadora Multimodal S.A.
Statements of changes in equity
For the nine month periods ended September 30, 2015 and 2014
(Amounts in thousands of Brazilian Reais, R$)
Attributable to shareholders of Company
Profit reserve
Common
stock
Capital
reserve Legal
Retained
earnings
Loss for the
period Other equity Total
Non-
controlling
interest Total equity
Balance at January 1,
2015 1,099,746 (137,601) 30,212 302,185 - - 1,294,542 37,066 1,331,608
Loss for the period - - - - (6,716) - (6,716) 4,105 (2,611)
Currency translation
adjustment - - - - - 3,738 3,738 (21) 3,717
Total comprehensive
income for the period - - - - (6,716) 3,738 (2,978) 4,084 1,106
Capital increase (ALL
acquisition) 4,351,744 (1,644,210) - - - - 2,707,534 240,900 2,948,434
Dividends (Note 20 c) - - - (272,800) - - (272,800) (3,511) (276,311)
Total contributions or
distributions to
shareholders,
recognized directly in
equity 4,351,744 (1,644,210) - (272,800) - - 2,434,734 237,389 2,672,123
Balance at September
30, 2015 5,451,490 (1,781,811) 30,212 29,385 (6,716) 3,738 3,726,298 278,539 4,004,837
The notes are an integral part of these interim financial statements.
12
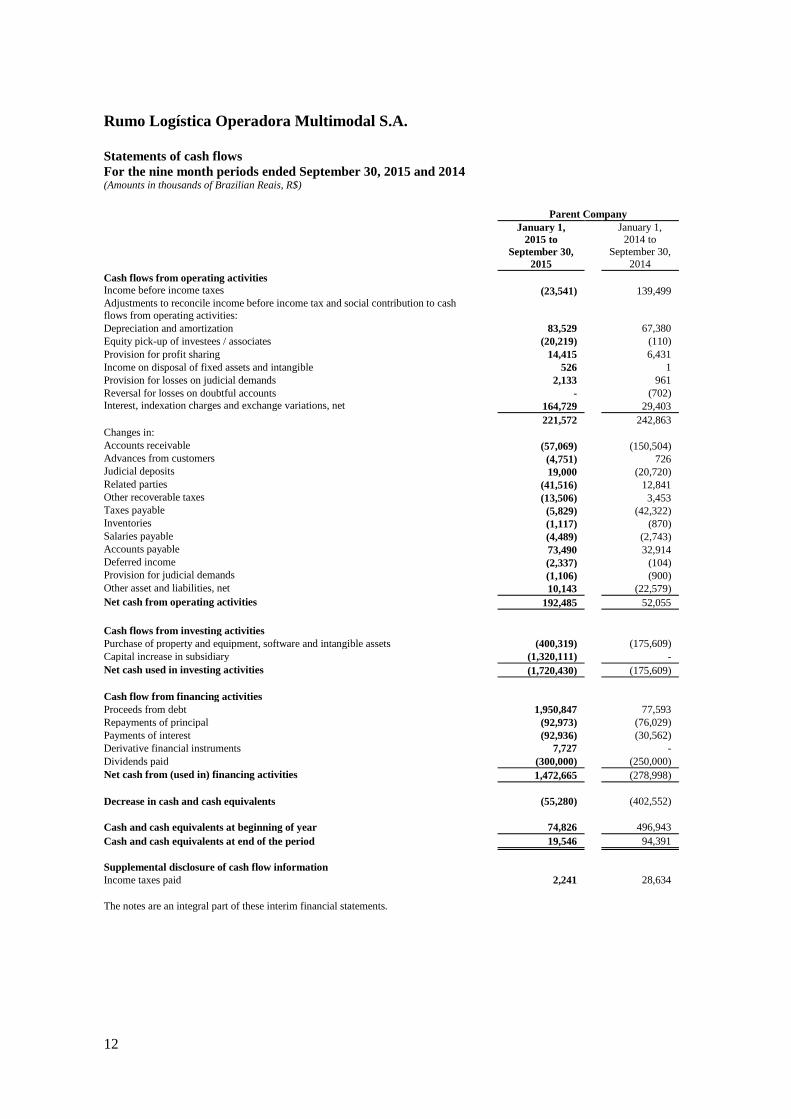
Rumo Logística Operadora Multimodal S.A.
Statements of cash flows
For the nine month periods ended September 30, 2015 and 2014 (Amounts in thousands of Brazilian Reais, R$)
Parent Company
January 1,
2015 to
September 30,
2015
January 1, 2014 to
September 30,
2014
Cash flows from operating activities
Income before income taxes (23,541) 139,499 Adjustments to reconcile income before income tax and social contribution to cash
flows from operating activities:
Depreciation and amortization 83,529 67,380
Equity pick-up of investees / associates (20,219) (110)
Provision for profit sharing 14,415 6,431
Income on disposal of fixed assets and intangible 526 1
Provision for losses on judicial demands 2,133 961
Reversal for losses on doubtful accounts - (702)
Interest, indexation charges and exchange variations, net 164,729 29,403
221,572 242,863
Changes in: Accounts receivable (57,069) (150,504) Advances from customers (4,751) 726 Judicial deposits 19,000 (20,720)
Related parties (41,516) 12,841
Other recoverable taxes (13,506) 3,453 Taxes payable (5,829) (42,322) Inventories (1,117) (870)
Salaries payable (4,489) (2,743)
Accounts payable 73,490 32,914 Deferred income (2,337) (104) Provision for judicial demands (1,106) (900)
Other asset and liabilities, net 10,143 (22,579)
Net cash from operating activities 192,485 52,055
Cash flows from investing activities
Purchase of property and equipment, software and intangible assets (400,319) (175,609)
Capital increase in subsidiary (1,320,111) -
Net cash used in investing activities (1,720,430) (175,609)
Cash flow from financing activities
Proceeds from debt 1,950,847 77,593
Repayments of principal (92,973) (76,029)
Payments of interest (92,936) (30,562)
Derivative financial instruments 7,727 -
Dividends paid (300,000) (250,000)
Net cash from (used in) financing activities 1,472,665 (278,998)
Decrease in cash and cash equivalents (55,280) (402,552)
Cash and cash equivalents at beginning of year 74,826 496,943
Cash and cash equivalents at end of the period 19,546 94,391
Supplemental disclosure of cash flow information
Income taxes paid 2,241 28,634
The notes are an integral part of these interim financial statements.

13
Rumo Logística Operadora Multimodal S.A.
Statements of cash flows
For the nine month periods ended September 30, 2015 and 2014 (Amounts in thousands of Brazilian Reais, R$)
Consolidated
January 1,
2015 to
September
30, 2015
January 1, 2014 to
September 30,
2014
Cash flow from operating activities
Income before income taxes 50,631 139,743 Adjustments to reconcile net income before income tax and social contribution to cash flows
from operating activities:
Depreciation and amortization 398,871 70,378
Equity pick-up of investees / associates (4,255) -
Provision for profit sharing 44,993 6,631
Income on disposal of fixed assets and intangible 3,463 1
Provision for losses on judicial demands 4,801 971
Provision (reversal) for losses on doubtful accounts 386 (702)
Other 52,102 - Interest, indexation charges and exchange variations, net 767,889 29,810
1,318,881 246,832
Changes in: Accounts receivable (39,676) (150,804) Advances from customers (13,745) (89)
Judicial deposits (2,687) (20,736)
Related parties 14,029 11,349 Other recoverable taxes 656 3,428 Taxes payable (43,309) (42,614)
Inventories (81,068) (862)
Salaries payable 7,817 (2,785) Accounts payable 54,568 31,908 Deferred income (34,116) (80)
Judicial demands (13,855) (892)
Other asset and liabilities, net (68,948) (22,261)
Net cash from operating activities 1,098,547 52,394
Cash flow from investing activities
Purchase of property, plant and equipment, software and intangible assets (890,184) (183,280)
Marketable securities (161,405) -
Restricted cash 130,440 -
Net cash acquired in business acquisition 169,703 -
Net cash used in investing activities (751,446) (183,280)
Cash flow from financing activities
Proceeds from debt 2,537,908 87,576
Repayments of principal (2,053,608) (76,840)
Payments of interest (553,403) (30,839)
Derivative financial instruments 7,727 -
Dividends paid (301,500) (250,000)
Net cash used in financing activities (362,876) (270,103)
Decrease in cash and cash equivalents (15,775) (400,989)
Cash and cash equivalents at beginning of year 85,475 497,753
Cash and cash equivalents at end of the period 69,700 96,764
Supplemental disclosure of cash flow information
Income taxes paid 6,431 28,922
The notes are an integral part of these interim financial statements.
14
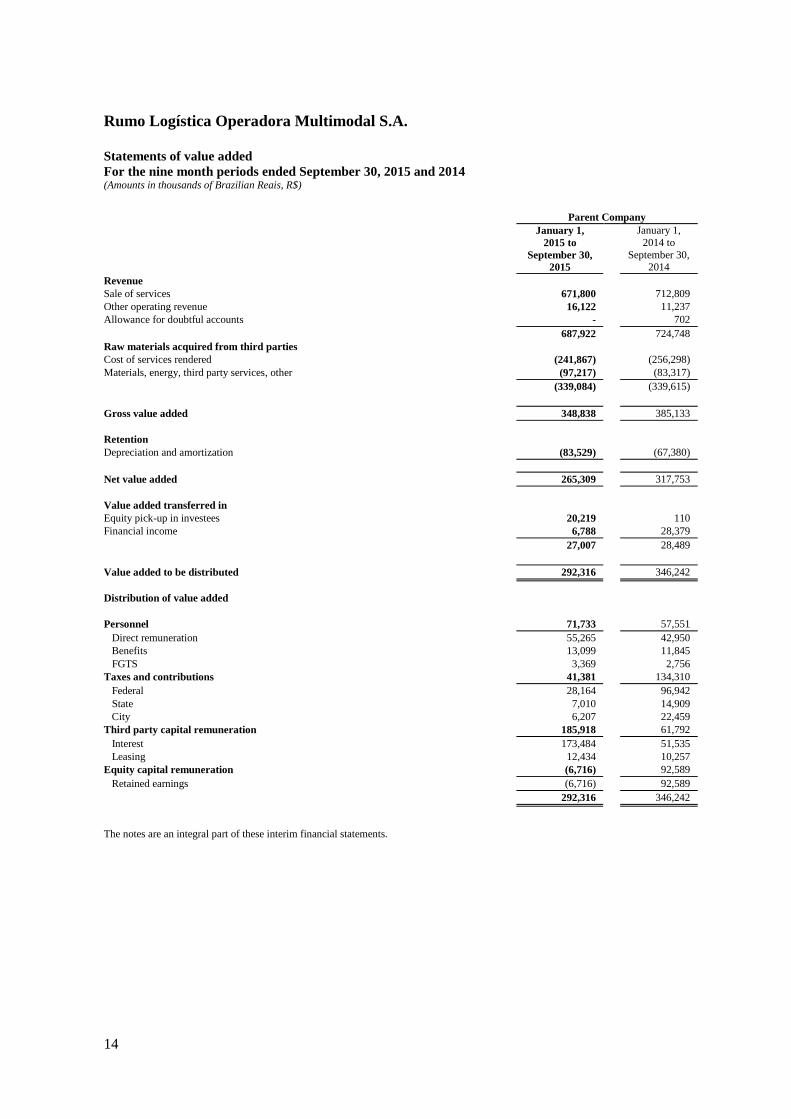
Rumo Logística Operadora Multimodal S.A.
Statements of value added
For the nine month periods ended September 30, 2015 and 2014 (Amounts in thousands of Brazilian Reais, R$)
Parent Company
January 1,
2015 to
September 30,
2015
January 1,
2014 to
September 30, 2014
Revenue
Sale of services 671,800 712,809
Other operating revenue 16,122 11,237
Allowance for doubtful accounts - 702
687,922 724,748
Raw materials acquired from third parties
Cost of services rendered (241,867) (256,298)
Materials, energy, third party services, other (97,217) (83,317)
(339,084) (339,615)
Gross value added 348,838 385,133
Retention
Depreciation and amortization (83,529) (67,380)
Net value added 265,309 317,753
Value added transferred in
Equity pick-up in investees 20,219 110
Financial income 6,788 28,379
27,007 28,489
Value added to be distributed 292,316 346,242
Distribution of value added
Personnel 71,733 57,551
Direct remuneration 55,265 42,950
Benefits 13,099 11,845
FGTS 3,369 2,756
Taxes and contributions 41,381 134,310
Federal 28,164 96,942
State 7,010 14,909
City 6,207 22,459
Third party capital remuneration 185,918 61,792
Interest 173,484 51,535
Leasing 12,434 10,257
Equity capital remuneration (6,716) 92,589
Retained earnings (6,716) 92,589
292,316 346,242
The notes are an integral part of these interim financial statements.
15
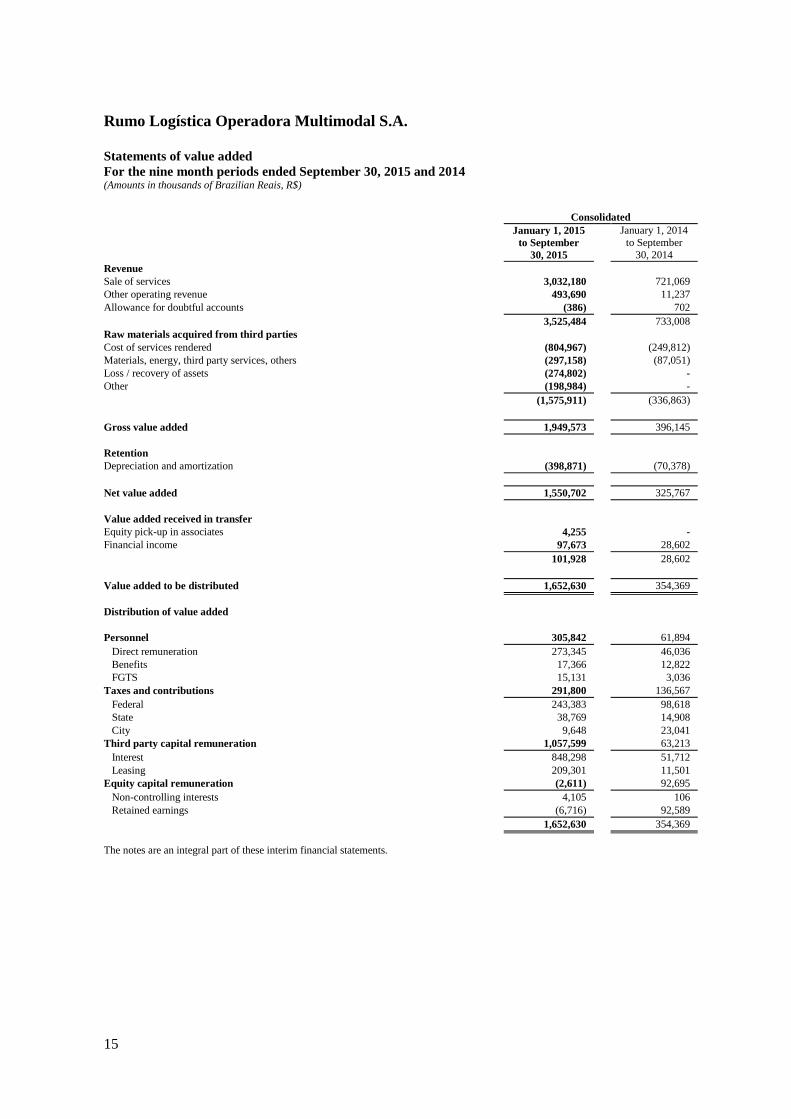
Rumo Logística Operadora Multimodal S.A.
Statements of value added
For the nine month periods ended September 30, 2015 and 2014 (Amounts in thousands of Brazilian Reais, R$)
Consolidated
January 1, 2015
to September
30, 2015
January 1, 2014
to September
30, 2014
Revenue
Sale of services 3,032,180 721,069
Other operating revenue 493,690 11,237
Allowance for doubtful accounts (386) 702
3,525,484 733,008
Raw materials acquired from third parties
Cost of services rendered (804,967) (249,812)
Materials, energy, third party services, others (297,158) (87,051)
Loss / recovery of assets (274,802) -
Other (198,984) -
(1,575,911) (336,863)
Gross value added 1,949,573 396,145
Retention
Depreciation and amortization (398,871) (70,378)
Net value added 1,550,702 325,767
Value added received in transfer
Equity pick-up in associates 4,255 -
Financial income 97,673 28,602
101,928 28,602
Value added to be distributed 1,652,630 354,369
Distribution of value added
Personnel 305,842 61,894
Direct remuneration 273,345 46,036
Benefits 17,366 12,822
FGTS 15,131 3,036
Taxes and contributions 291,800 136,567
Federal 243,383 98,618
State 38,769 14,908
City 9,648 23,041
Third party capital remuneration 1,057,599 63,213
Interest 848,298 51,712
Leasing 209,301 11,501
Equity capital remuneration (2,611) 92,695
Non-controlling interests 4,105 106
Retained earnings (6,716) 92,589
1,652,630 354,369
The notes are an integral part of these interim financial statements.

Rumo Logística Operadora Multimodal S.A.
Notes to the interim financial statements
September 30, 2015 and 2014 (In thousands of Brazilian Reais – R$, unless otherwise stated)
16
1. Operations
Rumo Logística Operadora Multimodal S.A. ("The Company" or "Rumo"), is a publicly traded
company with its shares traded on the São Paulo stock exchange (“BM&FBOVESPA) under
the ticker RUMO3, and has its headquarters in the city of Santos, State of São Paulo, Brazil. The
Company is a direct subsidiary of Cosan Logística S.A. ("Cosan Logística") which owns 26.26%
of its capital, and its Parent Company is Cosan Ltd. ("CZZ"). On April 1, 2015 the Company
acquired full control over the capital of ALL - América Latina Logística S.A. ("ALL").
The Company is a service provider in the logistics sector (transport and elevation), principally for
export commodities, providing an integrated transport solution, handling, storage and shipment
from the production centers to the main southern and southeast ports, and also holds interests in
other companies, ventures and consortia related to infrastructure.
The Company also operates in the rail transportation segment in Southern Brazil through its
subsidiary ALL - América Latina Logística Malha Sul S.A. ("ALL Malha Sul"), and the Central
West region and State of São Paulo through subsidiaries ALL - América Latina Logística Malha
Paulista S.A. ("ALL Malha Paulista"), ALL - America Latina Logística Malha Norte S.A. ("ALL
Malha Norte") and ALL - América Latina Logística Malha Oeste S.A. ("ALL Malha Oeste"). In
addition, the subsidiary Brado Logística e Participações S.A. ("Brado") operates in the container
segment.
Additionally, the Company has terminals for transshipment and terminals for export of sugar and
grains at the Port of Santos.
On September 30, 2015, the Company had a negative consolidated working capital of R$
1,735,145. On the other hand, it generated consolidated operating cash flows of R$ 1,098,547 and
made investments in modernizing its rolling stock and improving the railway network in the
amount of R$ 890,184, in line with its business plan. Management has been working on measures
that will enable the Company to present a balanced structure of debt, in order to fully meet its
business plan. Thus, management believes the use of the going concern assumption in the
preparation of these interim financial statements is appropriate.
a) ALL Acquisition
On May 8, 2014, the shareholders approved at the Extraordinary General Meeting the
acquisition of ALL’s shares by the Company, effectively suspended until obtaining the approval
of the Merger of Shares by Conselho Administrativo de Defesa Econômica ("CADE"), by
Agência Nacional de Transportes Terrestres ("ANTT") as well as from any other public
administration bodies from which prior authorizations are necessary and verification (or waiver
by the applicable part) of any other conditions precedent set forth in the proposal sent by the
Company to ALL on 24 February, 2014, to the effectiveness of the acquisition.

Rumo Logística Operadora Multimodal S.A.
Notes to the interim financial statements
September 30, 2015 and 2014 (In thousands of Brazilian Reais – R$, unless otherwise stated)
17
On February 11, 2015, in response to the provisions of article 2 of CVM Instruction 358/2002,
the Company announced the unanimous approval by CADE, pursuant to art. 61 of Law No.
12,529 / 2011, the concentration acts on the merger of ALL shares issued by the Company upon
the conclusion of an Agreement in concentration control ("ACC").
As required by ACC, the new company started to adopt certain behaviors aimed to eliminate the
competition concerns identified in the opinion of the General Superintendence of the CADE.
These behavioral obligations remain in force for a period of seven (7) years (from the publication
of its approval in the Diário Oficial da União) and are meant primarily to ensure isonomic
attendance by the users of railway services charges, primarily through strengthening the
governance rules, the adoption of transparent mechanisms in pricing parameters, service
attendance control and limitation of the use of rail transport by related parties.
On March 19, 2015 Agência Nacional de Transportes Aquaviários ("ANTAQ") approved the
change of control, which was the last condition precedent to the effectiveness of the merger.
On March 23, 2015 ALL's Board of Directors approved the merger, and from April 1, 2015, the
Company's shares, already reflecting the effects of the Share Exchange, began trading on the
BM&FBOVESPA. As a result of this process the ALL's shares (Bovespa: ALLL3) ceased to be
traded on the BM&FBOVESPA on March 31, 2015. As a result, on April 1, 2015, ALL has
become a wholly owned subsidiary of the Company.
The accounting effects of the acquisition of ALL are presented in note 3 and the financial position
and consolidated results of operations for the periods subsequent to the acquisition are not
necessarily comparable with information presented in prior periods.
b) The concession of railway operation and port terminal
The Company holds, through subsidiaries or affiliates, concessions of railway services and port
terminals, whose scope and completion are as follows:
Companies Concession end Coverage area
Subsidiaries
Terminais Portuários Rumo e Teaçú December 2036 Port of Santos-SP
ALL Malha Sul February 2027 Southern Brazil and Sao Paulo State
ALL Malha Paulista December 2028 Sao Paulo State
ALL Malha Oeste June 2026 Midwest and State of São Paulo
ALL Malha Norte May 2079 Midwest and State of São Paulo
Portofer June 2025 Port of Santos-SP
Associates
Terminal XXXIX October 2025 Port of Santos-SP
TGG - Terminal de Granéis do Guarujá August 2027 Port of Santos-SP
Termag - Terminal Marítimo de Guarujá August 2027 Port of Santos-SP
Rumo Logística Operadora Multimodal S.A.
Notes to the interim financial statements
September 30, 2015 and 2014 (In thousands of Brazilian Reais – R$, unless otherwise stated)
18
The subsidiaries and associates above are subject to compliance with certain conditions set out in
the privatization bids and the concession contracts for railway networks and port terminals.
The concession agreements of these subsidiaries and associates shall be terminated by: expiration
of the contractual term; expropriation; forfeiture; termination; annulment and bankruptcy; or
termination of the dealership.
In the event of the termination of any of the concessions, the main effects would be as follows:
Return to the government all the rights and privileges transferred to the subsidiaries,
together with leased assets and those resulting from investments that are considered
reversible by the Federal Government as being necessary to the continuous provision of
the granted service.
The reversible assets would be indemnified by the Federal Government at the residual
cost, calculated based on the accounting records of the subsidiaries, considering
depreciation; such costs would be subject to technical and financial analysis by the
Federal Government. Any and all improvements made to the permanent track
superstructure would not be considered as investments for indemnification purposes.
c) Liquidity rights exercised at Brado
On June 3, 2015 the Company, through its direct subsidiary ALL, informed that Brado’s non-
controlling shareholders exercised their liquidity right provided in the shareholders’ agreement,
which enables the exit of Brado’s original shareholders via a share exchange. As a result, the
Company and the Brado’s original shareholders prepared appraisal reports, based on the
economic value of the companies, to establish an exchange ratio, which has not yet been
concluded.
2. Presentation of interim financial statements and significant accounting policies
2.1. Basis of preparation
The interim financial statements have been prepared in accordance with CPC 21 (R1) and IAS 34
- Interim Financial Reporting issued by the International Accounting Standards Board (IASB),
and presented in accordance with the standards issued by the Brazilian Securities and Exchange
Commission (CVM) applicable to the Quarterly Information (ITR) and do not include all of the
information required in complete, annual financial statements.
These interim financial statements were prepared following the basis of preparation and
accounting policies consistent with those adopted in preparing the financial statements as of
December 31, 2014 and should be read together. New applicable accounting policies due to the
acquisition of ALL are described below. The notes that have not changed significantly or had
irrelevant changes compared to December 31, 2014 were not repeated in full in these interim
financial statements.

Rumo Logística Operadora Multimodal S.A.
Notes to the interim financial statements
September 30, 2015 and 2014 (In thousands of Brazilian Reais – R$, unless otherwise stated)
19
However, selected information has been included to explain the main events and transactions that
occurred to enable the understanding of changes in financial position and performance of
operations since the issuance of the annual financial statements for the year ended December 31,
2014.
In preparing these interim financial statements, management used judgments, estimates and
assumptions that affect the application of the Company's accounting policies and the reported
amounts of assets, liabilities, income and expenses. Actual results may differ from these
estimates. Estimates and assumptions are reviewed on an ongoing basis and have not changed in
relation to the financial statements of December 31, 2014.
The presentation of the Statement of Value Added (“DVA”) is required by Brazilian corporate
law and the accounting practices adopted in Brazil applicable to publicly traded companies. IFRS
does not require the presentation of such statement. As a result, under IFRS, such statement is
presented as supplementary information.
On November 5, 2015, the Company’s management approved and authorized the issuance of
these interim financial statements.
Presentation of segment information
Operating segment information is presented consistently with the internal reporting provided to
the chief operating decision maker. The chief operating decision maker, responsible for allocating
resources and assessing performance of the operating segments is the Executive Board, also
responsible for making the strategic decisions of the Company and its subsidiaries.
With the acquisition of ALL, management initiated an internal restructuring that led to the
creation of two vice-presidencies, the first focused on South operations (comprised of railway and
transshipment in the concession area of ALL Malha Sul and ALL Malha Oeste) and the second
focused on the North Operations (composed by railway operations, transshipment and port
elevation in the areas of the Company's concession, ALL Malha Norte and ALL Malha Paulista).
A third segment includes Brado, the Company's indirect subsidiary focused on container
operations and the container operations of other group companies. Therefore, the Company now
discloses three segments: (i) North Operations, (ii) South Operations, and (iii) Container
Operations.

Rumo Logística Operadora Multimodal S.A.
Notes to the interim financial statements
September 30, 2015 and 2014 (In thousands of Brazilian Reais – R$, unless otherwise stated)
20
2.2. Basis of consolidation
The consolidated interim financial statements include the financial statements of the Company
and its subsidiaries, listed below:
Directly and indirectly controlled
September 30, 2015 December 31, 2014
Subsidiaries
Direct
Logispot Armazéns Gerais S.A. 51.00% 51.00%
Rumo Um S.A. - 100.00%
Rumo Dois S.A. - 100.00%
ALL – América Latina Logística S.A. 100.00% -
Indirect
ALL Intermodal S.A. 100.00% - ALL Malha Oeste S.A. 100.00% - ALL Malha Paulista S.A. 100.00% - ALL Malha Sul S.A. 100.00% - ALL Malha Norte S.A. 99.24% - ALL Participações S.A. 100.00% - ALL Armazéns Gerais Ltda. 100.00% - Portofer Ltda. 100.00% - Boswells S.A. 100.00% - Brado Holding S.A. 100.00% - Brado Logística e Participações S.A. 62.22% - Brado Logística S.A. 62.22% - Tezza Consultoria de Negócios Ltda. 99.99% - ALL Equipamentos Ltda. 99.99% - ALL Argentina S.A. 90.96% - ALL Mesopotâmica S.A. 70.56% -
ALL Central S.A. 73.55% -
Paranaguá S.A. 99.83% - ALL Rail Management Ltda. 50.01% - PGT S.A. 100.00% -
Associates (Equity)
Rhall Terminais Ltda. 30.00% -
Termag S.A. 19.85% -
TGG S.A. 9.92% -
Terminal XXXIX S.A. 49.62% -
2.3. Hedge
The Company entered into bilateral loans denominated in US Dollars through Resolution
4,131/62 denominated in US$ equivalent to R$ 409,271. The currency exposure in US$ of these
operations was protected with SWAP transactions exchanging indexes and eliminating the risk of
currency fluctuations. The fair value changes of the contracted derivative are recognized through
profit or loss.
Rumo Logística Operadora Multimodal S.A.
Notes to the interim financial statements
September 30, 2015 and 2014 (In thousands of Brazilian Reais – R$, unless otherwise stated)
21
The Company has designated these loan agreements as liabilities measured at fair value through
profit or loss in order to eliminate or at least significantly reduce the measurement inconsistency
that would otherwise arise from measurement and recognition of gains and losses on loans and
derivatives on different bases. As a result, the fair value fluctuations on these loans are recognized
through profit or loss.
2.4. Business combination
Business combinations are recognized using the acquisition method. The transferred
consideration for the acquisition is generally measured at fair value, as well as the identifiable net
assets acquired and liabilities assumed. Any resulting goodwill is tested annually for impairment.
Transaction costs are charged to income as incurred, except costs related to the issuance of debt
instruments or equity.
The consideration transferred does not include amounts related to pre-existing relationships
payments. These amounts are generally recognized in the income statement.
2.5. Non-current assets held for sale and discontinued operations
The Company classifies non-current assets as held for sale if their carrying amounts are
recoverable mainly through sale rather than through continued use. Non-current assets classified
as held for sale are measured at the lower of their carrying amount and fair value less selling
costs.
Classification criteria as held for sale are considered met only when the sale is highly probable
and the asset is available for immediate sale. Management must be committed to the completion
of the sale within one year from the date of classification.
Discontinued operations are excluded from the results from continuing operations and are
presented as a single line item in the income statement.
Additional disclosures are presented in note 26. All other notes to the financial statements include
amounts for continuing operations, unless otherwise stated.
2.6. Deferred income
Substantially comprised of amounts received from clients for investment in fixed assets in return
of a rail service contract requiring future performance of services by the Company.
2.7. New standards and interpretations not yet adopted
The following new standards and interpretations were issued by the IASB but are not effective for
the year 2015. Early adoption of standards, although encouraged by the IASB, is not permitted in
Brazil by the Brazilian Accounting Pronouncements Committee (CPC), which has not yet issued
its version of these standards.

Rumo Logística Operadora Multimodal S.A.
Notes to the interim financial statements
September 30, 2015 and 2014 (In thousands of Brazilian Reais – R$, unless otherwise stated)
22
IFRS 9 - "Financial instruments" addresses the classification, measurement and recognition of
financial assets and liabilities. The full version of IFRS 9 was published in July 2014, effective as
of January 1, 2018. Management is evaluating the full impact of its adoption.
IFRS 15 - "Contract Revenue from Customers" - This new standard provides the principles that
an entity applies to determine the measurement of revenue and when it is recognized. It is
effective on January 1, 2018 and supersedes IAS 11 - "Construction Contracts", IAS 18 -
"Income" and their related interpretations. Management is evaluating the impact of its adoption.
There are no other IFRS or IFRIC interpretations that are not yet effective and that are expected
to have a significant impact on the Company.
2.8. Cash flow – non cash transactions
During the nine-month period ended September 30, 2015, the Company made the following non
cash transactions that are not reflected in the statement of consolidated cash flows:
Acquisition of net assets of ALL in the amount of R$ 2,567,669 through the issuance of
equity instruments, except for the cash acquired in the transaction of R$ 169,703 (Note
3).
Finance lease of locomotives and rail cars in the amount of R$ 262,759.

Rumo Logística Operadora Multimodal S.A.
Notes to the interim financial statements
September 30, 2015 and 2014 (In thousands of Brazilian Reais – R$, unless otherwise stated)
23
3. Business combination
As described in note 1, on April 1, 2015, after the necessary approvals of the competent bodies,
the Company acquired 100% of the common shares of ALL and through the shareholders'
agreement, obtained its control and consolidated its results.
The acquisition took place by an exchange of shares, with the issuance by the Company of
1,963,670,770 registered common shares with no par value, representing 65.67% of its equity in
exchange for 100% of the share capital of ALL, represented by 681,995,165 common shares.
As a result of the acquisition, the Company consolidates its participation strategy in the logistics
and infrastructure business in Brazil, by adding approximately 12,000 km of existing rail tracks in
ALL concessions.
a) Consideration transferred
As a basis for measuring the fair value of the consideration transferred, the share price of ALL
("ALLL3") on the BM&FBOVESPA at the close of business on March 31, 2015 was used, at the
price of R$ 3.97 per share. Additionally, the value was adjusted for the settlement of pre-existing
relationship, as follows:
Acquired common shares (681,995,165) at R$ 3.97 2,707,534
Pre-existing relationship settlement 29,838
Total consideration transferred 2,737,372
Settlement of pre-existing relationship
In March 2009, the Company and ALL signed an operating agreement (pre-existing relationship)
for the supply of sugar and other grains transportation logistics from the western state of São
Paulo to the Port of Santos, in which the Company has port concessions for elevation services.
According to the terms of the existing agreement, the Company invested in the construction and
improvement of permanent tracks under concession of ALL and acquired rolling stock for use in
the transport of products in ALL’s rail network, in order to increase ALL’s rail freight transport
capacity. In exchange for the Company's investments, the agreement stipulated that ALL would
provide a certain capacity of rail transport services, as well as compensate the Company through
the payment of a contractually fixed fee per ton of product transported by ALL using the rail
network and / or by the use of the rolling stock provided by the Company to ALL.
This preexisting relationship was settled when the Company acquired ALL. The Company
recognized a gain of R$ 29,838 as a result of this settlement and this amount was recognized in
the income statement as "other operating income".
Rumo Logística Operadora Multimodal S.A.
Notes to the interim financial statements
September 30, 2015 and 2014 (In thousands of Brazilian Reais – R$, unless otherwise stated)
24
The fair value measurement of the pre-existing relationship was based on the difference between
the value of the investment made by the Company and the discounted cash flow return on this
investment, considering the contractually agreed volume and rate.
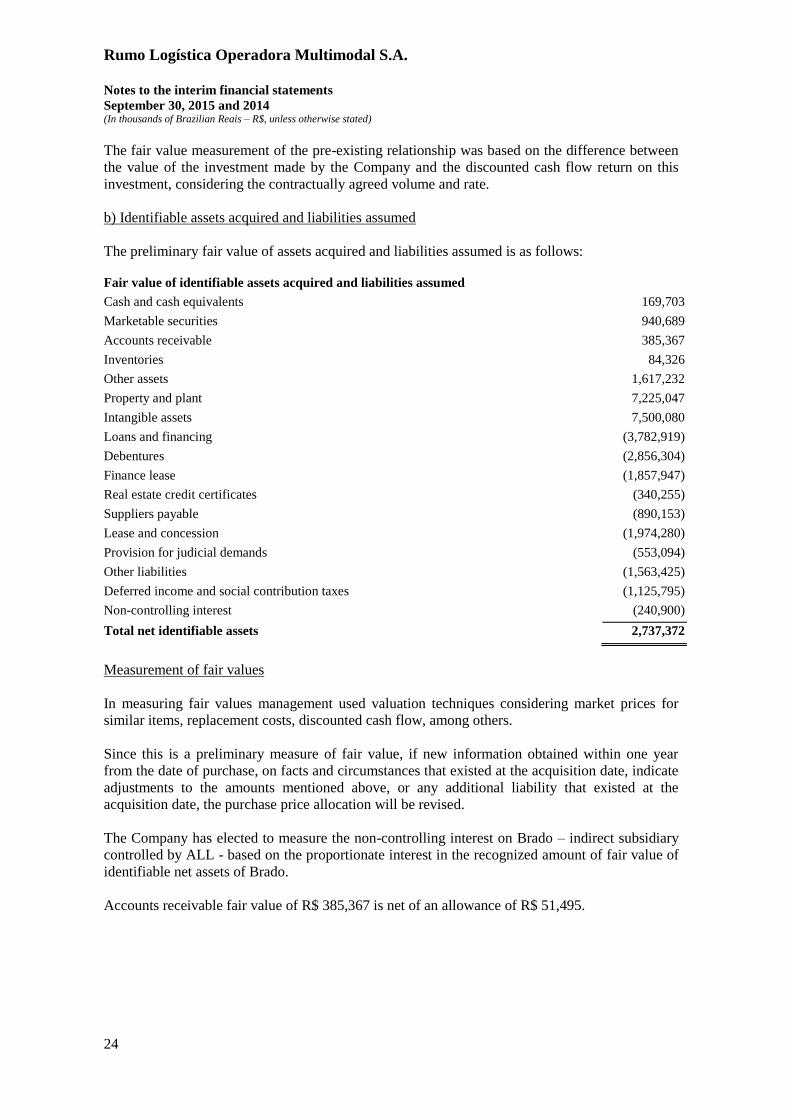
b) Identifiable assets acquired and liabilities assumed
The preliminary fair value of assets acquired and liabilities assumed is as follows: Fair value of identifiable assets acquired and liabilities assumed
Cash and cash equivalents 169,703
Marketable securities 940,689
Accounts receivable 385,367
Inventories 84,326
Other assets 1,617,232
Property and plant 7,225,047
Intangible assets 7,500,080
Loans and financing (3,782,919)
Debentures (2,856,304)
Finance lease (1,857,947)
Real estate credit certificates (340,255)
Suppliers payable (890,153)
Lease and concession (1,974,280)
Provision for judicial demands (553,094)
Other liabilities (1,563,425)
Deferred income and social contribution taxes (1,125,795)
Non-controlling interest (240,900)
Total net identifiable assets 2,737,372
Measurement of fair values
In measuring fair values management used valuation techniques considering market prices for
similar items, replacement costs, discounted cash flow, among others.
Since this is a preliminary measure of fair value, if new information obtained within one year
from the date of purchase, on facts and circumstances that existed at the acquisition date, indicate
adjustments to the amounts mentioned above, or any additional liability that existed at the
acquisition date, the purchase price allocation will be revised.
The Company has elected to measure the non-controlling interest on Brado – indirect subsidiary
controlled by ALL - based on the proportionate interest in the recognized amount of fair value of
identifiable net assets of Brado.
Accounts receivable fair value of R$ 385,367 is net of an allowance of R$ 51,495.
Rumo Logística Operadora Multimodal S.A.
Notes to the interim financial statements
September 30, 2015 and 2014 (In thousands of Brazilian Reais – R$, unless otherwise stated)
25
The acquisition-related costs were recorded in "other operating expenses" in the income statement
in the amount of R$ 5,295.
The consolidated income statement includes, from the acquisition date - April 1, 2015, revenue
and profit of R$ 2,277,132 and R$ 21,021, respectively, generated by ALL and its subsidiaries.
If ALL had been consolidated from January 1, 2015, the consolidated income statement for the 9
month period ended September 30, 2015 would present revenue of R$ 3,548,149 and a loss of R$
237,536.
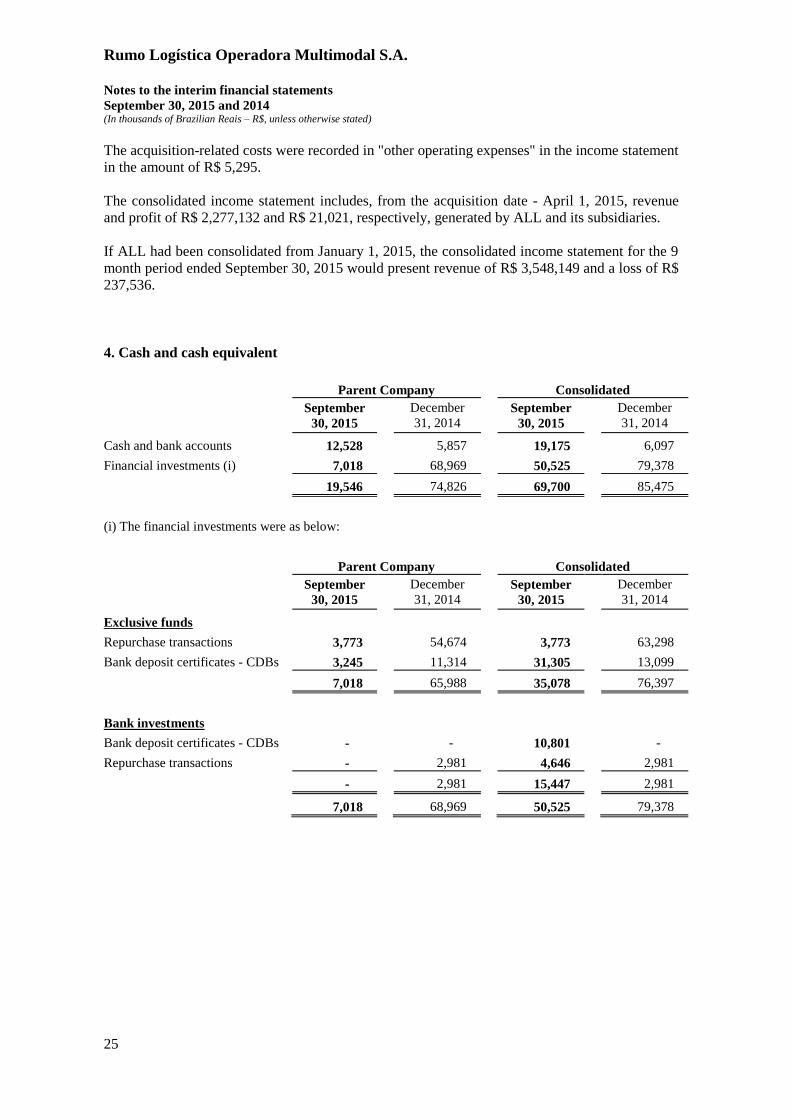
4. Cash and cash equivalent
Parent Company Consolidated
September
30, 2015
December
31, 2014
September
30, 2015
December
31, 2014
Cash and bank accounts 12,528 5,857 19,175 6,097
Financial investments (i) 7,018 68,969 50,525 79,378
19,546 74,826 69,700 85,475
(i) The financial investments were as below:
Parent Company Consolidated
September
30, 2015
December
31, 2014
September
30, 2015
December
31, 2014
Exclusive funds
Repurchase transactions 3,773 54,674 3,773 63,298
Bank deposit certificates - CDBs 3,245 11,314 31,305 13,099
7,018 65,988 35,078 76,397
Bank investments
Bank deposit certificates - CDBs - - 10,801 -
Repurchase transactions - 2,981 4,646 2,981
- 2,981 15,447 2,981
7,018 68,969 50,525 79,378

Rumo Logística Operadora Multimodal S.A.
Notes to the interim financial statements
September 30, 2015 and 2014 (In thousands of Brazilian Reais – R$, unless otherwise stated)
26
5. Marketable securities
Consolidated
September 30,
2015
December 31,
2014
Current assets
CDB investments linked to BNDES loans 196,059 -
Government bonds 682,968 -
879,027 -
6. Accounts receivable
Parent Company Consolidated
September 30,
2015
December 31,
2014
September 30,
2015
December 31,
2014
Domestic and foreign 31,806 509,421 238,023 511,500
Allowance for doubtful
accounts (1,115) (22,065) (29,765) (22,122)
30,691 487,356 208,258 489,378
Current 30,691 40,663 185,610 42,685
Non-current - 446,693 22,648 446,693
The reduction in the consolidated balance refers mainly to the elimination of accounts receivable from ALL due to its
consolidation with the acquisition of control on April 1, 2015. Regarding the Parent Company, balances receivable
from ALL were reclassified to related parties.
7. Other recoverable taxes Parent Company Consolidated
September
30, 2015
December
31, 2014
September
30, 2015
December
31, 2014
Contribution to social security financing
(“COFINS”) 7,469 - 238,383 -
Social integration program (“PIS”) 1,625 - 71,303 -
Tax on circulation of goods, transport services
and communication (“ICMS”) (i) - - 217,062 -
ICMS - CIAP (ii) - - 222,569 -
Other - - 13,614 -
9,094 - 762,931 -
Current 9,094 - 234,437 -
Non-current - - 528,494 -
(i) ICMS credit on the acquisition of inputs and diesel used in transport services.
(ii) ICMS credit arising from acquisitions of fixed assets.
Rumo Logística Operadora Multimodal S.A.
Notes to the interim financial statements
September 30, 2015 and 2014 (In thousands of Brazilian Reais – R$, unless otherwise stated)
27
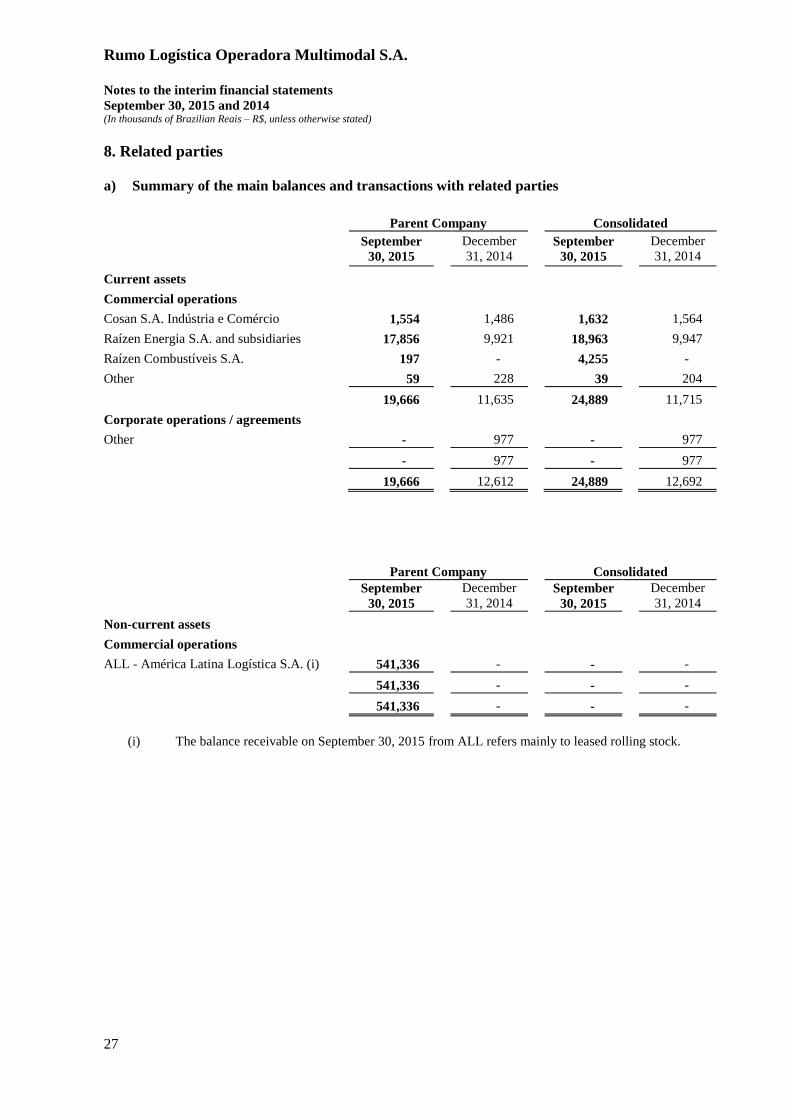
8. Related parties
a) Summary of the main balances and transactions with related parties
Parent Company Consolidated
September
30, 2015
December
31, 2014
September
30, 2015
December
31, 2014
Current assets
Commercial operations
Cosan S.A. Indústria e Comércio 1,554 1,486 1,632 1,564
Raízen Energia S.A. and subsidiaries 17,856 9,921 18,963 9,947
Raízen Combustíveis S.A. 197 - 4,255 -
Other 59 228 39 204
19,666 11,635 24,889 11,715
Corporate operations / agreements
Other - 977 - 977
- 977 - 977
19,666 12,612 24,889 12,692
Parent Company Consolidated
September
30, 2015
December
31, 2014 September
30, 2015
December
31, 2014
Non-current assets
Commercial operations
ALL - América Latina Logística S.A. (i) 541,336 - - -
541,336 - - -
541,336 - - -
(i) The balance receivable on September 30, 2015 from ALL refers mainly to leased rolling stock.

Rumo Logística Operadora Multimodal S.A.
Notes to the interim financial statements
September 30, 2015 and 2014 (In thousands of Brazilian Reais – R$, unless otherwise stated)
28
Parent Company Consolidated
September
30, 2015
December
31, 2014
September
30, 2015
December
31, 2014
Current liabilities
Commercial operations
Cosan S.A. Indústria e Comércio 5,049 3,342 5,049 3,342
ALL - América Latina Logística S.A. (i) 134,791 - - -
Raízen Energia S.A. and subsidiaries 12,116 16,441 12,406 16,542
Cosan Lubrificantes e Especialidades S.A. 377 363 4,983 363
Raízen Combustíveis S.A. (ii) 1 - 62,618 -
Logispot Armazéns Gerais S.A. 1,110 - - -
Other - 918 - 45
153,444 21,064 85,056 20,292
(i) The balance payable on September 30, 2015 to ALL refers to rail transport services provided.
(ii) The balance payable on September 30, 2015 to Raízen Combustíveis refers to purchases of fuel.
b) Summary of transactions with related parties
Parent Company
July 1, 2015
to
September
30, 2015
January 1,
2015 to
September
30, 2015
July 1,
2014 to
September
30, 2014
January 1,
2014 to
September
30, 2014
Services
Raízen Energia S.A. and subsidiaries (i) 98,094 224,140 75,037 208,899
ALL - América Latina Logística S.A. 67,441 110,578 - -
Other - - 315 1,387
165,535 334,718 75,352 210,286
Shared expenses
Cosan S.A. Indústria e Comércio (3,908) (6,621) (2,440) (7,221)
Raízen Energia S.A. (1,229) (3,571) (1,090) (3,869)
(5,137) (10,192) (3,530) (11,090)
Purchases
Raízen Combustíveis S.A. - (12) (11) (729)
Logispot Armazéns Gerais S.A. (1,572) (6,444) (4,861) (10,650)
ALL - América Latina Logística S.A. (59,342) (63,318) - -
Brado Logística S.A - (14,682) - -
Cosan Cayman Finance Lim (3) (3) - -
Cosan Lubrificantes e Especialidades (51) (154) - -
(60,968) (84,613) (4,872) (11,379)
Financial result
Rezende Barbosa S.A. Administração e
Participações - 10 85 378
Other - (9) 15 15
- 1 100 393
(i) The balances in the three- and nine-month periods ended September 30, 2015 with Raizen Energia and its
subsidiaries refer mainly to transport storage and port elevation services.

Rumo Logística Operadora Multimodal S.A.
Notes to the interim financial statements
September 30, 2015 and 2014 (In thousands of Brazilian Reais – R$, unless otherwise stated)
29
Consolidated
July 1, 2015
to
September
30, 2015
January 1,
2015 to
September
30, 2015
July 1,
2014 to
September
30, 2014
January 1,
2014 to
September
30, 2014
Services
Raízen Energia S.A. and subsidiaries (i) 99,658 229,998 77,617 211,478
Raízen Combustíveis S.A. (ii) 28,155 55,518 - -
Other - - 315 1,387
127,813 285,516 77,932 212,865
Shared expenses
Cosan S.A. Indústria e Comércio (3,908) (6,621) (2,440) (7,221)
Raízen Energia S.A. (2,313) (4,857) (1,189) (4,190)
(6,221) (11,478) (3,629) (11,411)
Purchases
Raízen Combustíveis S.A. (iii) (200,570) (202,334) (11) (729)
Cosan Cayman Finance Lim (3) (3) - -
Cosan Lubrificantes e Especialidades (11,793) (20,546) - -
(212,366) (222,883) (11) (729)
Financial result
Rezende Barbosa S.A. Administração e
Participações - 10 85 378
Raízen Energia S.A. (9) (9) - -
Outros - - 15 15
(9) 1 100 393
(i) The balances in the three- and nine-month periods ended September 30, 2015 with Raizen Energia and its
subsidiaries refer mainly to transport, storage and port elevation services.
(ii) The balances in the three-and nine-month periods ended September 30, 2015 with Raizen Combustíveis refer
to fuel transportation services.
(iii) The balances in the three- and nine-month periods ended September 30, 2015 with Raizen Combustíveis
refer to acquisition of fuel.
Officers and directors remuneration
Fixed and variable remuneration of the statutory officers, board of directors and fiscal board
amounts to R$ 5,546 during the nine-month period ended September 30, 2015 (2014: R$ 2,282),
and the entire amount is classified as short-term benefits.

Rumo Logística Operadora Multimodal S.A.
Notes to the interim financial statements
September 30, 2015 and 2014 (In thousands of Brazilian Reais – R$, unless otherwise stated)
30
9. Equity method investments (Parent Company)
Direct
subsidiaries
Total
shares of
the investee
Shares held
by the
Company
Percentage
of interest
(%)
Balance at
December
31, 2014
Equity
pick-up
Business
Combination
Capital
increase
Comprehensive
income Other
Balance at
September
30, 2015
Logispot
Armazéns
Gerais S.A.
("Logispot") 2,040,816 1,040,816 51% 76,108 (650) - - - - 75,458
ALL 681,995,165 681,995,165 100% - 20,869 2,707,534 1,320,111 3,738 - 4,052,252
Rumo Um
S.A. - - - 5 - - - - (5) -
Rumo Dois
S.A. - - - 5 - - - - (5) -
76,118 20,219 2,707,534 1,320,111 3,738 (10) 4,127,710
(Consolidated)
Indirect associates
Total
shares of
the
investee
Shares
held by
the
Company
Percentage
of interest
(%)
Balance at
December
31, 2014
Equity
pick-
up
Business
combination Other
Balance at
September
30, 2015
Rhall Terminais 28,580 8,574 30.00% - 122 3,492 - 3,614
Termag S.A. 500,000 99,246 19.85% - (1,732) 6,175 - 4,443
TGG S.A. 79,747,000 7,914,609 9.92% - 3,256 16,275 - 19,531
Terminal XXXIX 200,000 99,246 49.62% - 2,609 15,343 (250) 17,702
- 4,255 41,285 (250) 45,290
Rumo Logística Operadora Multimodal S.A.
Notes to the interim financial statements
September 30, 2015 and 2014 (In thousands of Brazilian Reais – R$, unless otherwise stated)
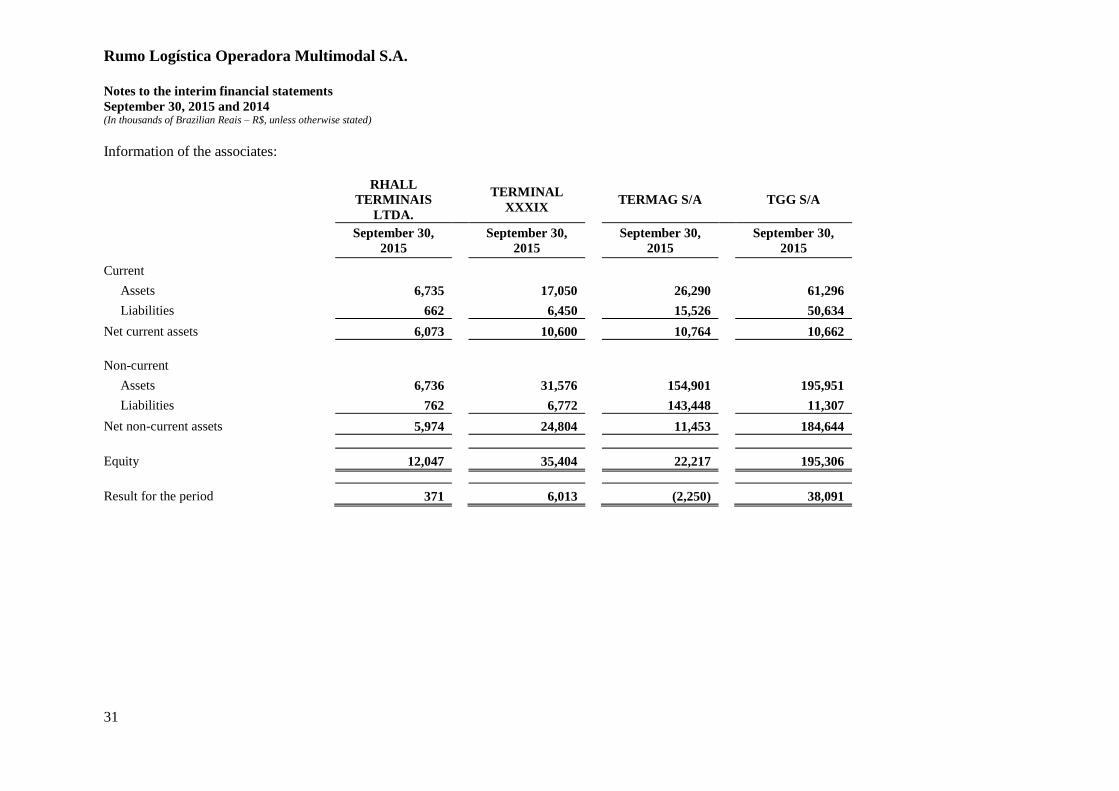
31
Information of the associates:
RHALL
TERMINAIS
LTDA.
TERMINAL
XXXIX
TERMAG S/A TGG S/A
September 30,
2015
September 30,
2015
September 30,
2015
September 30,
2015
Current
Assets 6,735 17,050 26,290 61,296
Liabilities 662 6,450 15,526 50,634
Net current assets 6,073 10,600 10,764 10,662
Non-current
Assets 6,736 31,576 154,901 195,951
Liabilities 762 6,772 143,448 11,307
Net non-current assets 5,974 24,804 11,453 184,644
Equity 12,047 35,404 22,217 195,306
Result for the period 371 6,013 (2,250) 38,091
Rumo Logística Operadora Multimodal S.A.
Notes to the interim financial statements
September 30, 2015 and 2014 (In thousands of Brazilian Reais – R$, unless otherwise stated)
32
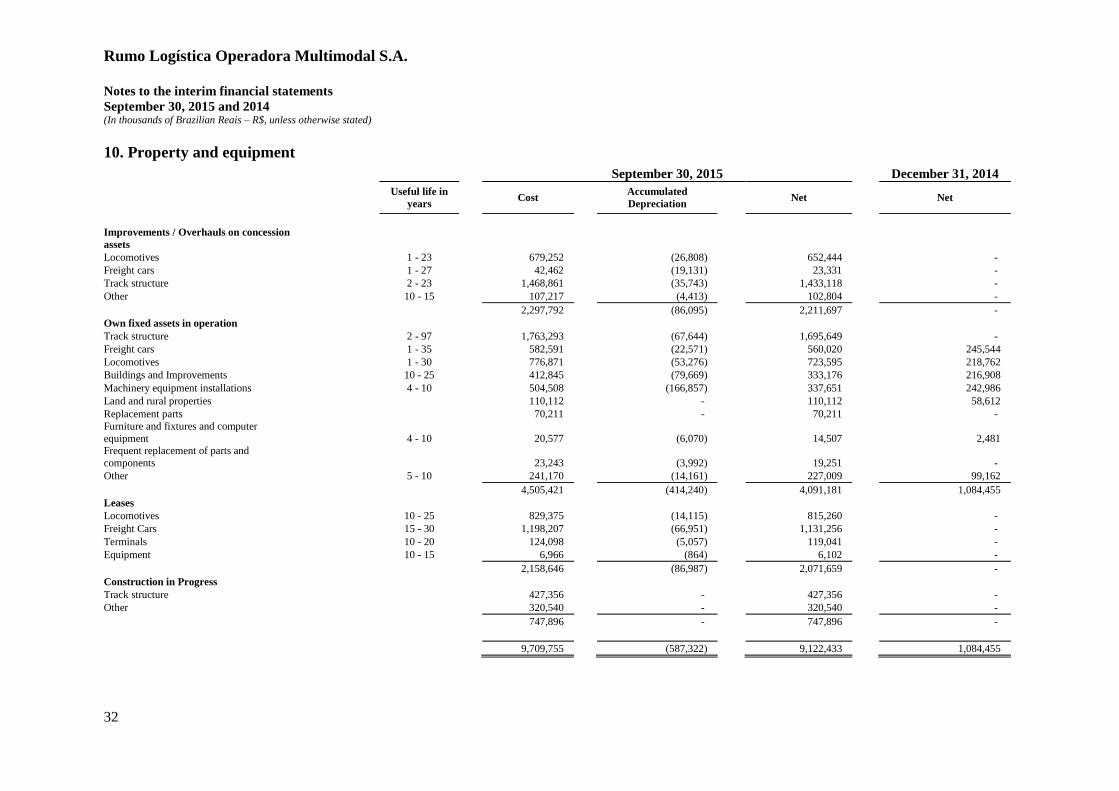
10. Property and equipment
September 30, 2015 December 31, 2014
Useful life in
years Cost
Accumulated
Depreciation Net Net
Improvements / Overhauls on concession
assets
Locomotives 1 - 23 679,252 (26,808) 652,444 -
Freight cars 1 - 27 42,462 (19,131) 23,331 -
Track structure 2 - 23 1,468,861 (35,743) 1,433,118 -
Other 10 - 15 107,217 (4,413) 102,804 -
2,297,792 (86,095) 2,211,697 -
Own fixed assets in operation
Track structure 2 - 97 1,763,293 (67,644) 1,695,649 -
Freight cars 1 - 35 582,591 (22,571) 560,020 245,544
Locomotives 1 - 30 776,871 (53,276) 723,595 218,762
Buildings and Improvements 10 - 25 412,845 (79,669) 333,176 216,908
Machinery equipment installations 4 - 10 504,508 (166,857) 337,651 242,986
Land and rural properties 110,112 - 110,112 58,612
Replacement parts 70,211 - 70,211 -
Furniture and fixtures and computer
equipment 4 - 10 20,577 (6,070) 14,507 2,481 Frequent replacement of parts and
components 23,243 (3,992) 19,251 -
Other 5 - 10 241,170 (14,161) 227,009 99,162
4,505,421 (414,240) 4,091,181 1,084,455
Leases
Locomotives 10 - 25 829,375 (14,115) 815,260 -
Freight Cars 15 - 30 1,198,207 (66,951) 1,131,256 -
Terminals 10 - 20 124,098 (5,057) 119,041 -
Equipment 10 - 15 6,966 (864) 6,102 -
2,158,646 (86,987) 2,071,659 -
Construction in Progress
Track structure 427,356 - 427,356 -
Other 320,540 - 320,540 -
747,896 - 747,896 -
9,709,755 (587,322) 9,122,433 1,084,455
Rumo Logística Operadora Multimodal S.A.
Notes to the interim financial statements
September 30, 2015 and 2014 (In thousands of Brazilian Reais – R$, unless otherwise stated)
33
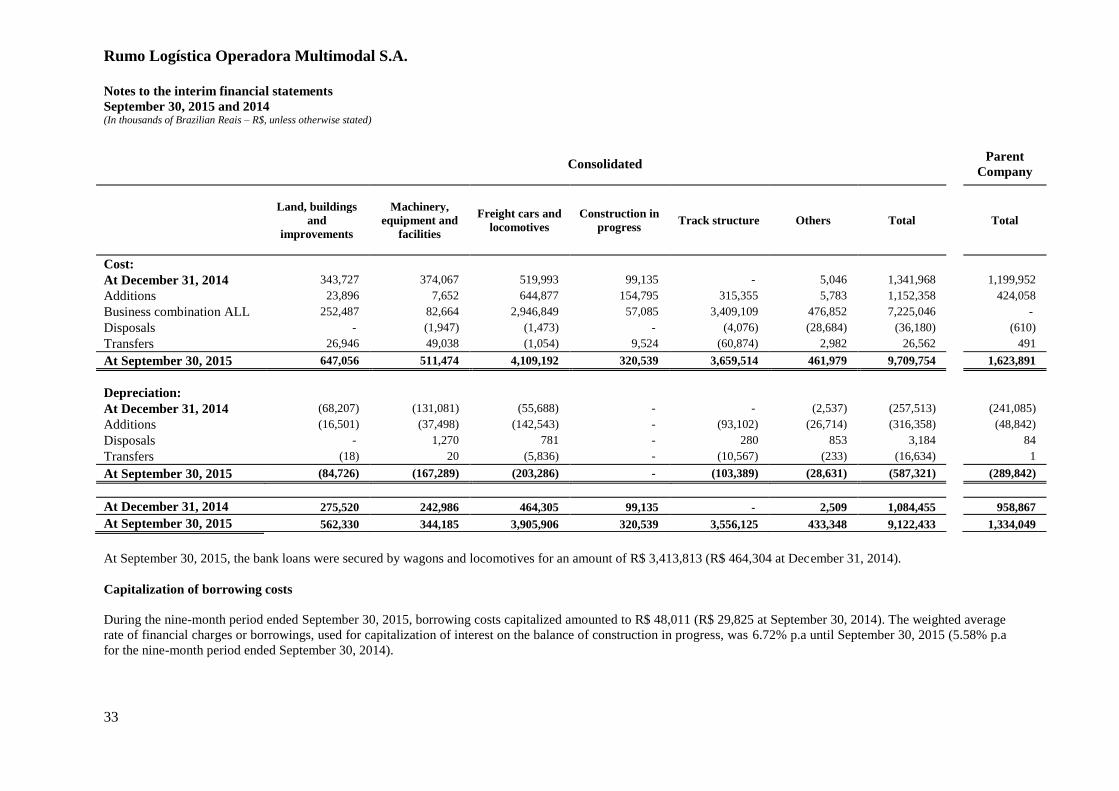
Consolidated
Parent
Company
Land, buildings
and
improvements
Machinery,
equipment and
facilities
Freight cars and
locomotives
Construction in
progress Track structure Others Total Total
Cost:
At December 31, 2014 343,727 374,067 519,993 99,135 - 5,046 1,341,968 1,199,952
Additions 23,896 7,652 644,877 154,795 315,355 5,783 1,152,358 424,058
Business combination ALL 252,487 82,664 2,946,849 57,085 3,409,109 476,852 7,225,046 -
Disposals - (1,947) (1,473) - (4,076) (28,684) (36,180) (610)
Transfers 26,946 49,038 (1,054) 9,524 (60,874) 2,982 26,562 491
At September 30, 2015 647,056 511,474 4,109,192 320,539 3,659,514 461,979 9,709,754 1,623,891
Depreciation:
At December 31, 2014 (68,207) (131,081) (55,688) - - (2,537) (257,513) (241,085)
Additions (16,501) (37,498) (142,543) - (93,102) (26,714) (316,358) (48,842)
Disposals - 1,270 781 - 280 853 3,184 84
Transfers (18) 20 (5,836) - (10,567) (233) (16,634) 1
At September 30, 2015 (84,726) (167,289) (203,286) - (103,389) (28,631) (587,321) (289,842)
At December 31, 2014 275,520 242,986 464,305 99,135 - 2,509 1,084,455 958,867
At September 30, 2015 562,330 344,185 3,905,906 320,539 3,556,125 433,348 9,122,433 1,334,049
At September 30, 2015, the bank loans were secured by wagons and locomotives for an amount of R$ 3,413,813 (R$ 464,304 at December 31, 2014).
Capitalization of borrowing costs
During the nine-month period ended September 30, 2015, borrowing costs capitalized amounted to R$ 48,011 (R$ 29,825 at September 30, 2014). The weighted average
rate of financial charges or borrowings, used for capitalization of interest on the balance of construction in progress, was 6.72% p.a until September 30, 2015 (5.58% p.a
for the nine-month period ended September 30, 2014).
Rumo Logística Operadora Multimodal S.A.
Notes to the interim financial statements
September 30, 2015 and 2014 (In thousands of Brazilian Reais – R$, unless otherwise stated)
34
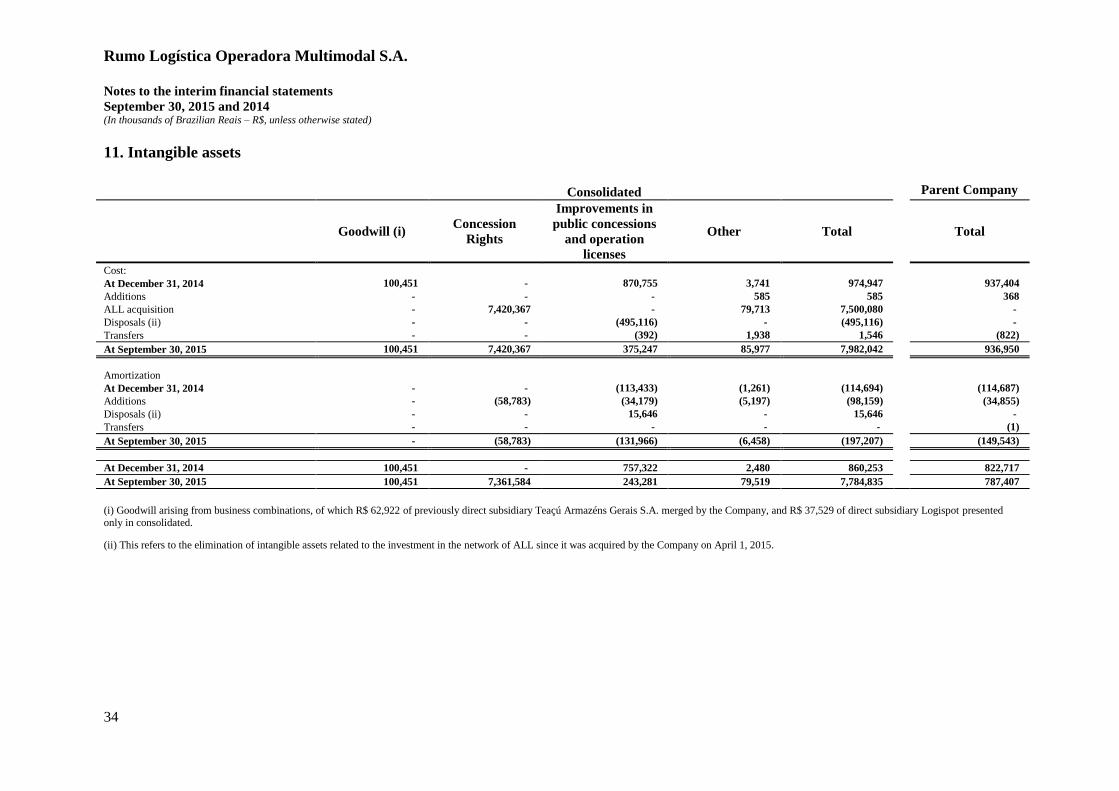
11. Intangible assets
Consolidated Parent Company
Goodwill (i) Concession
Rights
Improvements in
public concessions
and operation
licenses
Other Total Total
Cost:
At December 31, 2014 100,451 - 870,755 3,741 974,947 937,404
Additions - - - 585 585 368
ALL acquisition - 7,420,367 - 79,713 7,500,080 -
Disposals (ii) - - (495,116) - (495,116) -
Transfers - - (392) 1,938 1,546 (822)
At September 30, 2015 100,451 7,420,367 375,247 85,977 7,982,042 936,950
Amortization
At December 31, 2014 - - (113,433) (1,261) (114,694) (114,687)
Additions - (58,783) (34,179) (5,197) (98,159) (34,855)
Disposals (ii) - - 15,646 - 15,646 -
Transfers - - - - - (1)
At September 30, 2015 - (58,783) (131,966) (6,458) (197,207) (149,543)
At December 31, 2014 100,451 - 757,322 2,480 860,253 822,717
At September 30, 2015 100,451 7,361,584 243,281 79,519 7,784,835 787,407
(i) Goodwill arising from business combinations, of which R$ 62,922 of previously direct subsidiary Teaçú Armazéns Gerais S.A. merged by the Company, and R$ 37,529 of direct subsidiary Logispot presented
only in consolidated.
(ii) This refers to the elimination of intangible assets related to the investment in the network of ALL since it was acquired by the Company on April 1, 2015.

Rumo Logística Operadora Multimodal S.A.
Notes to the interim financial statements
September 30, 2015 and 2014 (In thousands of Brazilian Reais – R$, unless otherwise stated)
35
Intangibles (other than goodwill) Annual rate of
amortization September 30, 2015 December 31, 2014
Software (a) 20% 14,623 2,480
Operating license and customer base (b) 3.7% 243,281 250,825
Right of way on public concessions (c ) 5.93% - 506,497
Public concession rights (d) 1.56% 7,361,584 -
Other 64,896 -
Total 7,684,384 759,802
a) Refers mainly to the business management system - ERP of the Company
b) Port operation license and relationships with the Company's customers, from the Teaçú business combination.
c) Refers to the improvements made to the railways under concession and operated by ALL until March 31, 2015, when ALL was acquired by the Company.
d) Refers to the concession rights acquired, allocated to Malha Norte concession upon the business combination of ALL, which will be amortized the term of this concession
by 2079.
The Company annually tests the recoverable amount of goodwill arising from expected future results of business combinations. The assets subject to
depreciation and amortization are tested only if there are indicators that the carrying amount is not recoverable.

Rumo Logística Operadora Multimodal S.A.
Notes to the interim financial statements
September 30, 2015 and 2014 (In thousands of Brazilian Reais – R$, unless otherwise stated)
36
12. Loans and borrowings
Financial charges (a) Parent Company Consolidated
Description Index Average
interest
rate
September
30, 2015
December
31, 2014
September
30, 2015
December
31, 2014
Maturity
date
Finame Pré-fixed 4.27% 504,125 305,218 843,788 307,005 2025
Long-term
interest rate
reference
unit(“URTJ
LP”)
8.47%
432,846 457,570 433,112 457,570 2022
Finem Pré-fixed 4.02% - - 4,717 3,420 2024
URTJLP 8.25% - - 2,404,349 13,231 2029
Consumer
price index
(“IPCA”)
17.95%
- - 3,965 3,483 2021
SELIC 15.85% - - 5,984 - 2020
UMBNDES 10.16% - - 1,189 - 2022
FRN Dollar (US$) 2.63% 200,439 - 200,439 - 2017
Loan 4131 Dollar (US$) 3.13% 208,832 - 300,538 - 2017
Commercial
banks % of CDI 14.13% - - 1,450 - 2015
CDI +
spread 17.87% - - 304,711 - 2016
Pré-fixed 20.98% - - 4,860 - 2016
Debentures URTJLP 8,00% - - 2,539 - 2016
Non-
convertible
debentures % of CDI 15.26% - - 506,980 - 2018
Pré-fixed 10.1% - - 164,909 - 2020
% Net
revenue - - - 27,488 - 2016
CDI +
spread 16.16% 1,431,536 - 2,233,286 - 2018
FCO Pré-fixed 4.12% - - 3,010 - 2024
NCE Dollar (US$) 3.4% - - 127,800 - 2016
% of CDI 15.70% - - 736,588 - 2019
2,777,778 762,788 8,311,702 784,709
Current 181,511 125,893 1,398,905 127,425
Non-current 2,596,267 636,895 6,912,797 657,284
a) Financial charges at September 30, 2015, unless otherwise indicated.
Rumo Logística Operadora Multimodal S.A.
Notes to the interim financial statements
September 30, 2015 and 2014 (In thousands of Brazilian Reais – R$, unless otherwise stated)
37
All loans and borrowings are secured by guarantees of the Company and its subsidiaries, in the
same amounts and conditions of the debt funded. For financing of locomotives and freight cars,
the financed assets are pledged as collateral.
Some financing agreements with the BNDES are also guaranteed, according to each contract, by
a bank guarantee, with the average cost of 1.55% p.a. or by collateral (assets) and an escrow
account.
To calculate the average rates, average annual CDI of 14.13% and TJLP of 6.5% were used.
Unused credit lines
At September 30, 2015, the Company and its subsidiaries had lines of credit for financing from
BNDES, which were unused, totaling R$ 1,455,461. These credit lines are directed to support
investment in infrastructure and modernization of rolling stock (freight cars and locomotives)
until 2017.
Financial covenants
The Company and its subsidiaries are subject to certain financial covenants in most loans and
financing agreements, based on certain financial and non-financial rations. Financial ratios are: (i)
consolidated net debt / EBITDA; (ii) EBITDA / consolidated financial result (considers only
interest on debentures, loans / financing and derivative activities); (iii) equity / net assets, being
item (iii) applicable only to BNDES. Except for BNDES, whose measurement is required
annually, a quarterly measurement is required on the date of the financial statements, using the
consolidated financial statements.
On December 31, 2014, ALL failed to meet certain covenants for which waivers were later
obtained from creditors releasing ALL from early call of the debt.
Except for BNDES, whose new net debt indicators (EBITDA and ICD) are yet to be set, all other
creditors have agreed to a ratio of up to 5.5x net debt / EBITDA. If the negotiations with BNDES
require a lower leverage ratio, such ratio will be extended to all other creditors with equivalent
covenants conditions. On September 30, 2015, quarterly financial covenants were met within the
new established standards.
Debentures have covenants in similar conditions to those described and also had their covenant
net debt / EBITDA ratio adjusted to 5.5x.

Rumo Logística Operadora Multimodal S.A.
Notes to the interim financial statements
September 30, 2015 and 2014 (In thousands of Brazilian Reais – R$, unless otherwise stated)
38
The installments on long-term, net of amortization of issuing costs have the following scheduled
maturities:
Parent Company Consolidated
September 30,
2015
December 31,
2014 September 30,
2015
December 31,
2014
13 to 24 months 561,268 136,234 1,429,839 140,050
25 to 36 months 1,555,033 136,234 3,082,251 139,336
37 to 48 months 157,961 136,224 824,239 139,326
49 to 60 months 111,333 125,531 468,845 128,633
61 to 72 months 83,587 60,520 515,877 63,622
73 to 84 months 50,459 35,505 179,773 38,607
85 to 96 months 37,970 6,647 96,491 7,247
Thereafter 38,656 - 315,482 463
2,596,267 636,895 6,912,797 657,284
On September 30, 2015 and December 31, 2014, carrying value approximates fair value of debt.
13. Other taxes payable
Parent Company Consolidated
September
30, 2015
December
31, 2014
September
30, 2015
December
31, 2014
Description
Contribution to social security financing
(“COFINS”) - 1,846 1,901 1,919
Social integration program (“PIS”) - 375 408 390
National social security institute (“INSS”) 1,635 1,508 4,460 1,687
Tax on circulation of goods, transport services
and communication (“ICMS”) 53 1,025 4,134 1,025
Recovery program (“Refis”) 902 902 30,899 902
Other 1,561 1,303 11,457 1,377
4,151 6,959 53,259 7,300
Current 4,151 6,959 27,758 7,300
Non-current - - 25,501 -
Rumo Logística Operadora Multimodal S.A.
Notes to the interim financial statements
September 30, 2015 and 2014 (In thousands of Brazilian Reais – R$, unless otherwise stated)
39
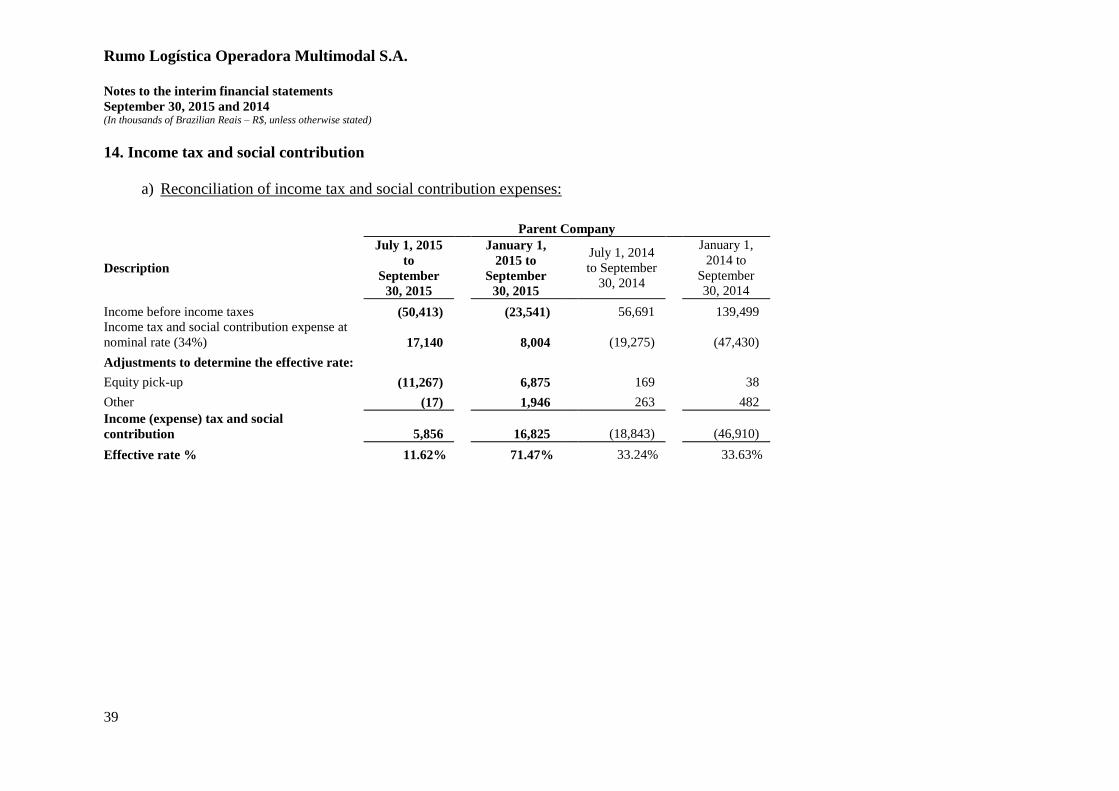
14. Income tax and social contribution
a) Reconciliation of income tax and social contribution expenses:
Parent Company
Description
July 1, 2015
to
September
30, 2015
January 1,
2015 to
September
30, 2015
July 1, 2014
to September
30, 2014
January 1,
2014 to
September
30, 2014
Income before income taxes (50,413) (23,541) 56,691 139,499
Income tax and social contribution expense at
nominal rate (34%) 17,140 8,004 (19,275) (47,430)
Adjustments to determine the effective rate:
Equity pick-up (11,267) 6,875 169 38
Other (17) 1,946 263 482
Income (expense) tax and social
contribution 5,856 16,825 (18,843) (46,910)
Effective rate % 11.62% 71.47% 33.24% 33.63%

Rumo Logística Operadora Multimodal S.A.
Notes to the interim financial statements
September 30, 2015 and 2014 (In thousands of Brazilian Reais – R$, unless otherwise stated)
40
Consolidated
Description
July 1, 2015
to
September
30, 2015
January 1,
2015 to
September
30, 2015
July 1, 2014
to September
30, 2014
January 1,
2014 to
September
30, 2014
Income before income taxes (43,039) 50,631 57,695 139,743
Income tax and social contribution expense at nominal rate (34%) 14,633 (17,215) (19,616) (47,513)
Adjustments to determine the effective rate:
Equity pick-up 1,385 1,446 - -
Rate difference on deemed profit taxation method (156) 383 - -
Goodwill amortization tax (realization) 463 927 - -
Unrecognized NOLs and temporary differences (26,618) (53,903) - -
Exploration profit - tax incentive 11,850 20,946 - -
Other 359 380 245 465
Income (expense) tax and social contribution 1,916 (47,036) (19,371) (47,048)
Effective rate % 4.45% 92.90% 33.58% 33.67%

Rumo Logística Operadora Multimodal S.A.
Notes to the interim financial statements
September 30, 2015 and 2014 (In thousands of Brazilian Reais – R$, unless otherwise stated)
41
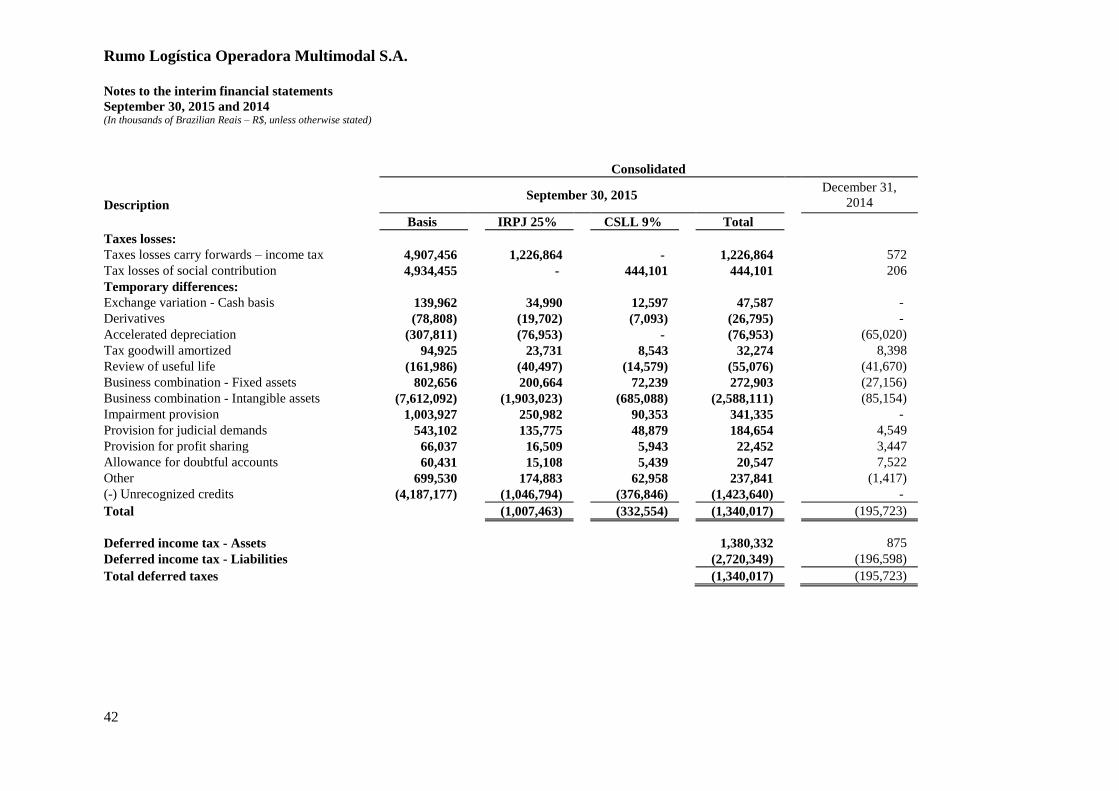
b) Deferred corporate income tax (IRPJ) and social contribution (CSLL) assets and liabilities:
Parent Company
Description September 30, 2015
December 31,
2014
Basis IRPJ 25% CSLL 9% Total
Tax losses:
Tax losses carry forwards – income tax 78,952 19,738 - 19,738 -
Tax losses of social contribution 104,035 - 9,363 9,363 -
Temporary differences:
Exchange variation - Cash basis 140,382 35,096 12,634 47,730 -
Derivatives (78,809) (19,702) (7,093) (26,795) -
Accelerated depreciation (234,995) (58,749) - (58,749) (65,020)
Tax goodwill amortized (13,786) (3,447) (1,241) (4,688) 8,398
Review of useful life (161,986) (40,497) (14,579) (55,076) (41,669)
Business combination - Fixed assets (137) (34) (12) (46) (405)
Business combination - Intangible assets (241,645) (60,411) (21,748) (82,159) (85,154)
Provision for judicial demands 15,525 3,881 1,397 5,278 4,488
Provision for profit sharing 14,517 3,629 1,307 4,936 3,348
Allowance for doubtful accounts 1,115 279 100 379 7,502
Other (38,332) (9,583) (3,449) (13,032) (1,335)
Total (129,800) (23,321) (153,121) (169,847)
Rumo Logística Operadora Multimodal S.A.
Notes to the interim financial statements
September 30, 2015 and 2014 (In thousands of Brazilian Reais – R$, unless otherwise stated)
42
Consolidated
Description September 30, 2015
December 31,
2014
Basis IRPJ 25% CSLL 9% Total
Taxes losses:
Taxes losses carry forwards – income tax 4,907,456 1,226,864 - 1,226,864 572
Tax losses of social contribution 4,934,455 - 444,101 444,101 206
Temporary differences:
Exchange variation - Cash basis 139,962 34,990 12,597 47,587 -
Derivatives (78,808) (19,702) (7,093) (26,795) -
Accelerated depreciation (307,811) (76,953) - (76,953) (65,020)
Tax goodwill amortized 94,925 23,731 8,543 32,274 8,398
Review of useful life (161,986) (40,497) (14,579) (55,076) (41,670)
Business combination - Fixed assets 802,656 200,664 72,239 272,903 (27,156)
Business combination - Intangible assets (7,612,092) (1,903,023) (685,088) (2,588,111) (85,154)
Impairment provision 1,003,927 250,982 90,353 341,335 -
Provision for judicial demands 543,102 135,775 48,879 184,654 4,549
Provision for profit sharing 66,037 16,509 5,943 22,452 3,447
Allowance for doubtful accounts 60,431 15,108 5,439 20,547 7,522
Other 699,530 174,883 62,958 237,841 (1,417)
(-) Unrecognized credits (4,187,177) (1,046,794) (376,846) (1,423,640) -
Total (1,007,463) (332,554) (1,340,017) (195,723)
Deferred income tax - Assets 1,380,332 875
Deferred income tax - Liabilities (2,720,349) (196,598)
Total deferred taxes (1,340,017) (195,723)

Rumo Logística Operadora Multimodal S.A.
Notes to the interim financial statements
September 30, 2015 and 2014 (In thousands of Brazilian Reais – R$, unless otherwise stated)
43
c) Changes in deferred taxes (net):
Parent Company Consolidated
January 1, 2015 to
September 30, 2015
January 1, 2015 to
September 30, 2015
Deferred tax at the beginning of the year (169,847) (195,723)
Income statement 16,726 (20,116)
Business combination ALL - (1,125,795)
Other - 1,617
Deferred tax at the end of the period (153,121) (1,340,017)
15. Accounts payable - suppliers
The balance of the Company and its subsidiaries’ account payable consists of:
Parent Company Consolidated
September 30,
2015
December 31,
2014
September 30,
2015
December 31,
2014
Material - - 127,375 -
Service 92,918 140,489 269,312 141,289
Fuels and lubricants - - 249,575 -
Other - - 101,060 -
Total 92,918 140,489 747,322 141,289
Current liabilities 92,918 140,489 745,931 141,289
Non-current liabilities (i) - - 1,391 -
(i) Presented in the balance sheet under "other accounts payable" in noncurrent liabilities.
16. Provision for judicial demands
Parent Company Consolidated
September
30, 2015
December
31, 2014
September
30, 2015
December
31, 2014
Tax 2,961 1,765 65,549 1,825
Civil, regulatory and environmental - 12 115,113 12
Labor 12,564 11,421 380,927 11,541
15,525 13,198 561,589 13,378

Rumo Logística Operadora Multimodal S.A.
Notes to the interim financial statements
September 30, 2015 and 2014 (In thousands of Brazilian Reais – R$, unless otherwise stated)
44
Judicial deposits at September 30, 2015 and December 31, 2014, were as follows:
Parent Company Consolidated
September
30, 2015
December
31, 2014
September
30, 2015
December
31, 2014
Tax 5,178 5,123 21,764 5,123
Civil, regulatory and environmental 536 20,321 162,815 20,321
Labor 5,458 4,203 161,015 4,227
11,172 29,647 345,594 29,671
Changes in the provision were:
Parent Company
Tax
Civil,
regulatory and
environmental
Labor Total
Balance at December 31, 2014 1,765 12 11,421 13,198
Write-offs (503) (12) (886) (1,401)
Additions 1,134 - 1,290 2,424
Monetary restatement 565 - 739 1,304
Balance at September 30, 2015 2,961 - 12,564 15,525
Consolidated
Tax
Civil,
regulatory and
environmental
Labor Total
Balance at December 31, 2014 1,825 12 11,541 13,378
Others movements (6,406) 468 - (5,938)
Installment - (2,392) (13,928) (16,320)
Write-offs (10,801) (713) (4,890) (16,404)
Business combination ALL 66,460 107,713 378,921 553,094
Additions 10,458 5,352 5,237 21,047
Monetary restatement 4,013 4,673 4,046 12,732
Balance at September 30, 2015 65,549 115,113 380,927 561,589
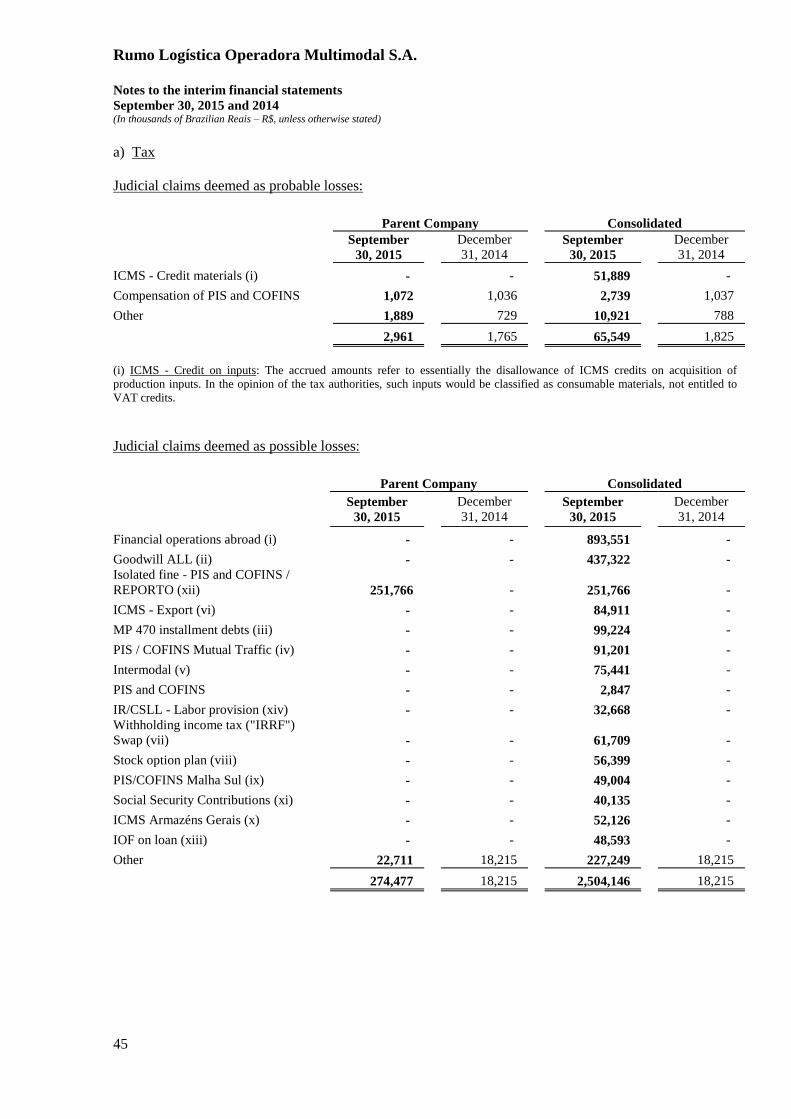
Rumo Logística Operadora Multimodal S.A.
Notes to the interim financial statements
September 30, 2015 and 2014 (In thousands of Brazilian Reais – R$, unless otherwise stated)
45
a) Tax
Judicial claims deemed as probable losses:
Parent Company Consolidated
September
30, 2015
December
31, 2014
September
30, 2015
December
31, 2014
ICMS - Credit materials (i) - - 51,889 -
Compensation of PIS and COFINS 1,072 1,036 2,739 1,037
Other 1,889 729 10,921 788
2,961 1,765 65,549 1,825
(i) ICMS - Credit on inputs: The accrued amounts refer to essentially the disallowance of ICMS credits on acquisition of
production inputs. In the opinion of the tax authorities, such inputs would be classified as consumable materials, not entitled to
VAT credits.
Judicial claims deemed as possible losses:
Parent Company Consolidated
September
30, 2015
December
31, 2014
September
30, 2015
December
31, 2014
Financial operations abroad (i) - - 893,551 -
Goodwill ALL (ii) - - 437,322 -
Isolated fine - PIS and COFINS /
REPORTO (xii) 251,766 - 251,766 -
ICMS - Export (vi) - - 84,911 -
MP 470 installment debts (iii) - - 99,224 -
PIS / COFINS Mutual Traffic (iv) - - 91,201 -
Intermodal (v) - - 75,441 -
PIS and COFINS - - 2,847 -
IR/CSLL - Labor provision (xiv) - - 32,668 -
Withholding income tax ("IRRF")
Swap (vii) - - 61,709 -
Stock option plan (viii) - - 56,399 -
PIS/COFINS Malha Sul (ix) - - 49,004 -
Social Security Contributions (xi) - - 40,135 -
ICMS Armazéns Gerais (x) - - 52,126 -
IOF on loan (xiii) - - 48,593 -
Other 22,711 18,215 227,249 18,215
274,477 18,215 2,504,146 18,215
Rumo Logística Operadora Multimodal S.A.
Notes to the interim financial statements
September 30, 2015 and 2014 (In thousands of Brazilian Reais – R$, unless otherwise stated)
46
(i) Financial operations abroad: Tax assessment notices issued to require differences in income tax, social contribution, PIS and
COFINS, for the calendar years 2005 to 2008 as a result of the following alleged violations: (a) improper deduction from taxable
income and CSL calculation basis of financial costs arising from loans with foreign financial institutions, (b) improper exclusion
from taxable income and CSL calculation basis of financial income from securities issued by the Government of Austria and the
Government of Spain, (c) no inclusion, in the income tax and CSL calculation basis, of gains earned in swap operations, and non-
taxation of financial income resulting from these contracts by PIS and COFINS, (d) improper exclusion from taxable income and
the CSLL calculation basis, using PIS and COFINS credits, (e) improper exclusion from taxable income and CSL calculation
using deferred CSL.
(ii) Goodwill ALL S.A.: Tax assessment notices issued by the tax authorities in 2011 and 2013 against ALL Holding concerning:
a) disallowance of amortization expense deduction based on future profitability as well as financial expenses; b) non-taxation of
supposed capital gain on disposal of equity interest in a company of the group.
(iii) MP 470 installment payment of debts: The tax authorities partially rejected the installment requests for federal tax debts
made by Malha Sul and Intermodal, arguing that the NOLs offered by the companies were not sufficient to discharge their
existing debts. The probability of loss is considered possible, since the NOLs existed and were available for such use.
(iv) PIS / COFINS Mutual Traffic: Tax authorities assessed ALL Malha Paulista under non-taxation by PIS and COFINS by
revenues from mutual traffic and rite of passage billed against ALL Malha Norte. The chance of loss is considered possible as tax
already has been collected by the concessionaire responsible for transporting from origin.
(v) Intermodal: Tax assessment against ALL Intermodal issued by the tax authorities concerning the disallowance of expenses
relating to the payment of variable lease installments. The chance of loss is considered possible, since the expense is ordinary and
necessary to the company's operations.
(vi) ICMS - Export: The state tax authorities assessed the rail concessions by non-taxation of VAT (ICMS) on invoices for the
provision of rail freight services for export. All assessments were contested, since there is a favorable position to taxpayers in the
higher courts, based on the Federal Constitution and Complementary Law 87/1996.
(vii) IRRF Swap: ALL Malha Paulista had part of its credit balance used to offset income tax partially disallowed by the tax
authorities on the grounds that the Company would not be entitled to offset withholding tax on swap operations.
(viii) Stock Option Plan: Tax assessment notice issued by the federal tax authorities due to no taxation by social security
contribution of the Company's stock option plans offered to its employees, based on the understanding that they had
compensation nature for services rendered.
(ix) PIS / COFINS Malha Sul: In 2012, ALL filed an application for refund of PIS / COFINS on fuels on the grounds that the
amounts charged in the price exceeded the value of the actual credit. It turns out that tax authorities did not recognize the request
for refund and imposed a fine for what they consider an improper request. ALL appealed and is awaiting an administrative
decision on the issue.
(x) ICMS Armazéns Gerais: In 2013, ALL Armazéns Gerais São Paulo branch received a tax assessment from State of São Paulo
tax authorities on the grounds that the company was not authorized to operate as a general warehouse in that state. The company
appealed at the administrative level. The company is duly registered with the commercial registry with the corporate purpose of
general warehouse, as well as it has the same object registered in the Federal Revenue Service and state tax authorities. At the
time of the release of the state registration, the tax authorities allowed the company's activities, including issuance of invoices.
(xi) Social Security Contributions: The federal tax authorities assessed ALL Malha Paulista for the nonpayment of social security
contributions on certain indemnification labor payments. The probability of loss is considered possible cud to the nature of the
funds and their eventuality characteristic.
(xii) Isolated fine - PIS / COFINS / REPORTO: The Company was assessed due to the disregard of the tax benefits of REPORTO
(PIS and COFINS suspension), on the grounds that the locomotives and freight cars purchased in 2010 were used outside the
limit area of the port. Therefore, the Company was assessed to pay PIS and COFINS, as well as an isolated fine corresponding to
50% of the value of acquired assets.
(xiii) IOF on loan: Federal tax authorities intends to enforce the incidence of IOF on current accounts held by the parent company
with subsidiaries / affiliates (most of the assessment amount). In the opinion of the tax authorities, the use of an general ledger
account named advances to related parties without formal agreement characterizes the existence of a current account, that should
be charged IOF due according to revolving credit operations regulations. The tax assessments are still being challenged at the
administrative level.

Rumo Logística Operadora Multimodal S.A.
Notes to the interim financial statements
September 30, 2015 and 2014 (In thousands of Brazilian Reais – R$, unless otherwise stated)
47
(xiv) Income tax / social contribution - Labor provisions: Notice of violation requiring income tax and social contribution for the
year 2009 on the grounds of the ALL would have excluded from taxable income labor provisions. Tax authorities understand
labor provisions charges were made by ALL without individualization processes (provisions and reversals), which would impact
the tax calculation. The loss is possible, considering the statute of limitations and that ALL complied with all tax rules relating to
the addition and exclusion of provisions in the calculation of income tax and social contribution.
b) Civil, regulatory and environmental
Judicial claims deemed as probable loss:
Parent Company Consolidated
September
30, 2015
December
31, 2014
September
30, 2015
December
31, 2014
Civil (i), regulatory (ii) and environmental (iii) - 12 115,113 12
- 12 115,113 12
Judicial claims deemed as possible losses:
Parent Company Consolidated
September
30, 2015
December
31, 2014
September
30, 2015
December
31, 2014
Civil (i) 19,535 17,539 1,128,836 17,539
Regulatory (ii) - - 296,564 -
Environmental (iii) - - 292,188 -
19,535 17,539 1,717,588 17,539
(i) Civil: The subsidiaries are parties to various civil lawsuits involving discussions for damages in general, such as
collisions in passages levels, rail running over, traffic accidents, possessory actions, extrajudicial collection and
contractual rights and obligations with customers. For the civil claims, management based on the opinion of its legal
counsel, assessed the circumstances and recognized provisions for probable losses in amounts deemed sufficient and
appropriate, representing at the reporting date, its best estimate of the disbursement that may be required to settle the
disputes.
(ii) Regulatory: Refers mainly to fines and discussions with ANTT.
(iii) Environmental: These amounts arise from assessments made by CETESB (SP), IBAMA and Municipal
Environmental authorities mostly due to soil and water contamination due to the overflow of products and non-
compliance with conditions imposed by operation licenses. Measures are being adopted to reduce the existing
liabilities, as well as repairing and prevention measures related to the environment.
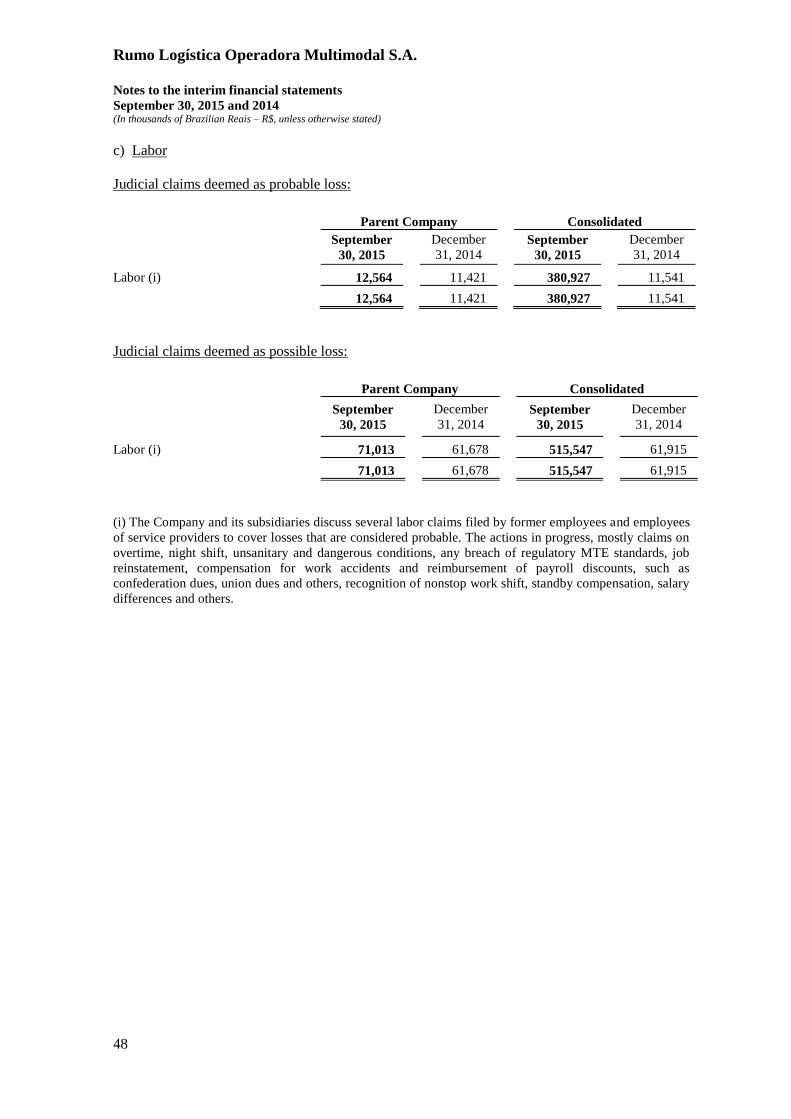
Rumo Logística Operadora Multimodal S.A.
Notes to the interim financial statements
September 30, 2015 and 2014 (In thousands of Brazilian Reais – R$, unless otherwise stated)
48
c) Labor
Judicial claims deemed as probable loss:
Parent Company Consolidated
September
30, 2015
December
31, 2014
September
30, 2015
December
31, 2014
Labor (i) 12,564 11,421 380,927 11,541
12,564 11,421 380,927 11,541
Judicial claims deemed as possible loss:
Parent Company Consolidated
September
30, 2015
December
31, 2014
September
30, 2015
December
31, 2014
Labor (i) 71,013 61,678 515,547 61,915
71,013 61,678 515,547 61,915
(i) The Company and its subsidiaries discuss several labor claims filed by former employees and employees
of service providers to cover losses that are considered probable. The actions in progress, mostly claims on
overtime, night shift, unsanitary and dangerous conditions, any breach of regulatory MTE standards, job
reinstatement, compensation for work accidents and reimbursement of payroll discounts, such as
confederation dues, union dues and others, recognition of nonstop work shift, standby compensation, salary
differences and others.

Rumo Logística Operadora Multimodal S.A.
Notes to the interim financial statements
September 30, 2015 and 2014 (In thousands of Brazilian Reais – R$, unless otherwise stated)
49
17. Leases
Finance leases
The Company and its subsidiaries have lease agreements, mainly of railcars and locomotives,
classified as finance leases.
The balances of liabilities related to finance lease agreements are:
Consolidated
Less than
a year
Between
one and five
years
More
than five
years
Total
Future minimum lease payments 767,975 1,323,001 314,772 2,405,748
Rolling stock 743,779 1,234,039 189,726 2,167,544
Terminal
24,197 88,962 125,045 238,204
Interest in the parcel 230,928 294,637 56,538 582,103
Rolling stock 214,154 244,883 22,715 481,752
Terminal
16,774 49,754 33,823 100,351
Present value of minimum payments 537,047 1,028,364 258,234 1,823,645
Current liabilities 537,048
Non-current liabilities 1,286,597
Leases have various terms, the latter due to end in June 2022. The amounts are adjusted
annually for inflation (IGP-M and IPCA) or may incur interest calculated based on the TJLP
or CDI.
Operating lease
Total future minimum lease payments
Assets Up to 1 year From 1 to 5 years Over 5 years Total
Locomotives 12,898 3,115 - 16,013
Rail cars 6,396 19,469 14,768 40,633
Total 19,294 22,584 14,768 56,646
Operating leases payments (rentals) are recognized as expenses on a straight line basis over the term of the contracts.

Rumo Logística Operadora Multimodal S.A.
Notes to the interim financial statements
September 30, 2015 and 2014 (In thousands of Brazilian Reais – R$, unless otherwise stated)
50
18. Lease and Concessions
The Company and its subsidiaries recognize expenses related to operating leases arising from
the concession and concession liabilities on a straight line basis over the term of the contracts.
The lease and concession liabilities represent the updated value of the grants acquired, net of
payments made by the reporting date, as follows:
Leases Concessions Total
Amounts payable:
Malha Sul 39,125 26,017 65,142
Malha Paulista - 24,201 24,201
39,125 50,218 89,343
Amounts under judicial discussion:
Malha Paulista 1,125,209 1,559 1,126,768
Malha Oeste 861,762 56,068 917,830
1,986,971 57,627 2,044,598
Total 2,026,096 107,845 2,133,941
Current liabilities 19,545
Non-current liabilities 2,114,396
2,133,941
Amounts under judicial discussion
The Company is challenging in court the economic and financial unbalance of certain Lease
and Concession Agreements.
In May 2005, ALL Malha Paulista filed a Declaratory Action in the 20th Federal Court of Rio
de Janeiro questioning the economic and financial unbalance of its Lease and Concession
Agreements, due to the high disbursement incurred by ALL Malha Paulista for the payment
of labor judicial proceedings and other costs involved, which are the responsibility of Rede
Ferroviária Federal S.A. (predecessor owned by the federal government).
ALL Malha Paulista required an expert new value calculation for the lease and concession
installments, as well as suspension of the payment of due and falling due installments until the
effective expert inspection for determination of the adequate value. In July 2005, an
injunction was granted. In September 2005, the said injunction was revoked by the Federal
Court of Rio de Janeiro. The value related to the lease installments was being deposited in
court until September 2007, when the Company obtained a judicial authorization to replace
the judicial deposits with a bank guarantee letter. In October 2015 a judgment was issued that
partially upheld the action recognizing the occurrence of economic and financial imbalance of
the agreements, allowing the Company to compensate part of the amounts claimed against the
debt. Nevertheless, the Company believes that all amounts discussed in the process could be
compensated, due to the provision of clause 7 of the bidding documents. Management,
supported by the opinion of its legal counsel assesses the chances of success as probable for

Rumo Logística Operadora Multimodal S.A.
Notes to the interim financial statements
September 30, 2015 and 2014 (In thousands of Brazilian Reais – R$, unless otherwise stated)
51
the value awarded in the decision and as possible regarding severance pay, but continues to
recognize the financial liability as it is a contractual obligation not yet removed from the
Company.
ALL Malha Oeste is claiming the reestablishment of the economic-financial balance of its
concession, lost by the cancellation of transportation agreements existing at the time of
privatization, which then set a change in the regulatory environment and conditions that were
set forth in the Notice of Privatization - growth forecasts used to value the concession deal
never materialized. The lawsuit is filed in the 16th Federal Court of Rio de Janeiro. The
amounts related to overdue installments were being secured by government bonds (Treasury
Bills - LFT). In March 2008, the Company was authorized to replace the collateral by a bank
guarantee and, in May 2008, the Company was able to redeem the bonds. In December 2014,
a decision recognized the occurrence of economic and financial imbalance of contracts, now
remaining the definition from an expert to determine the amount of the imbalance and related
aspects.
Management, based on the opinion of its lawyers, assesses the chances of success as probable,
but continues to recognize the financial liability as it is a contractual obligation not yet
removed from the Company.
Judicial deposits on September 30, 2015 concerning the above claims total:
September 30, 2015
Malha Paulista 116,038
Malha Oeste 17,690
133,728
Judicial deposits are recorded in the line "regulatory" under note 16.
19. Real estate credit certificates
The Company and its subsidiaries entered into contracts for rent of terminals that have been
securitized and resulted in the transfer of the rights of these credits, the balance of which is:
Consolidated
Terminal Rate Maturity Start date
September 30,
2015
Terminal Intermodal Tatuí-SP 12.38% p.a.
March 31,
2018
February
29, 2008 61,342
Terminal Alto Araguaia-MT CDI + 2.6% p.a.
November
30, 2018
November
28, 2008 244,755
Total 306,097
Current liabilities 108,688
Non-current liabilities 197,409
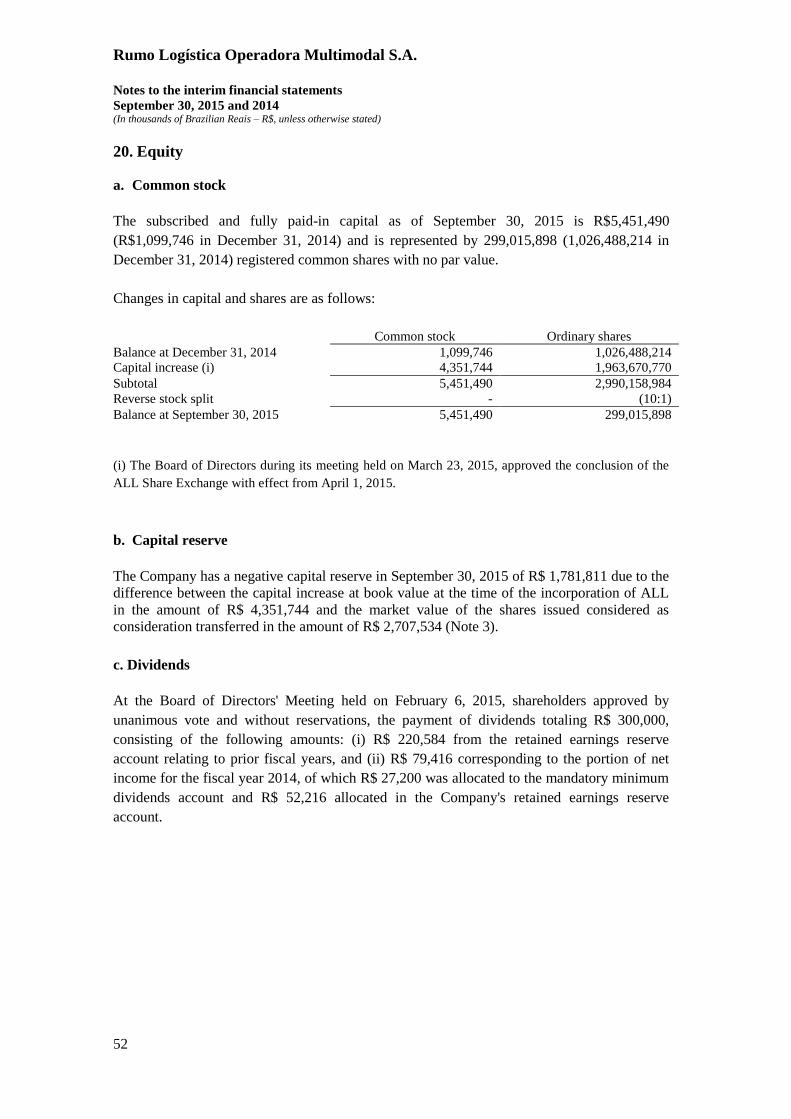
Rumo Logística Operadora Multimodal S.A.
Notes to the interim financial statements
September 30, 2015 and 2014 (In thousands of Brazilian Reais – R$, unless otherwise stated)
52
20. Equity
a. Common stock
The subscribed and fully paid-in capital as of September 30, 2015 is R$5,451,490
(R$1,099,746 in December 31, 2014) and is represented by 299,015,898 (1,026,488,214 in
December 31, 2014) registered common shares with no par value.
Changes in capital and shares are as follows:
Common stock Ordinary shares
Balance at December 31, 2014 1,099,746 1,026,488,214
Capital increase (i) 4,351,744 1,963,670,770
Subtotal 5,451,490 2,990,158,984
Reverse stock split - (10:1)
Balance at September 30, 2015 5,451,490 299,015,898
(i) The Board of Directors during its meeting held on March 23, 2015, approved the conclusion of the
ALL Share Exchange with effect from April 1, 2015.
b. Capital reserve
The Company has a negative capital reserve in September 30, 2015 of R$ 1,781,811 due to the
difference between the capital increase at book value at the time of the incorporation of ALL
in the amount of R$ 4,351,744 and the market value of the shares issued considered as
consideration transferred in the amount of R$ 2,707,534 (Note 3).
c. Dividends
At the Board of Directors' Meeting held on February 6, 2015, shareholders approved by
unanimous vote and without reservations, the payment of dividends totaling R$ 300,000,
consisting of the following amounts: (i) R$ 220,584 from the retained earnings reserve
account relating to prior fiscal years, and (ii) R$ 79,416 corresponding to the portion of net
income for the fiscal year 2014, of which R$ 27,200 was allocated to the mandatory minimum
dividends account and R$ 52,216 allocated in the Company's retained earnings reserve
account.

Rumo Logística Operadora Multimodal S.A.
Notes to the interim financial statements
September 30, 2015 and 2014 (In thousands of Brazilian Reais – R$, unless otherwise stated)
53
21. Earnings per share
Earnings per share are calculated by dividing net income by the weighted average number of ordinary shares outstanding during the period. Diluted
earnings per share are calculated by adjusting the result and the number of shares by the impact of potentially dilutive instruments. The following table
sets forth the computation of earnings per share (in thousands, except per share amounts) for the quarter and nine-month period ended September 30,
2015 and 2014:
Basic and diluted
July 1, 2015 to
September 30,
2015
January 1, 2015
to September 30,
2015
July 1, 2014 to
September 30,
2014
January 1, 2014 to
September 30,
2014
Numerator Income from operations attributable to controlling shareholders (44,557) (6,716) 37,848 92,589
Denominator Weighted average number of common share - considers reverse stock split 299,015,898 233,560,206 102,648,821 102,648,821
Basic earnings per share R$ (0.149) R$ (0.029) R$ 0.369 R$ 0.902
Dilutive effect Brado Logística (R$ 0.009) - - -
Dilutive effect BNDES Participações (R$ 0.000) (R$ 0.003) - -
Diluted earnings per share R$ (0.158) R$ (0.032) R$ 0.369 R$ 0.902
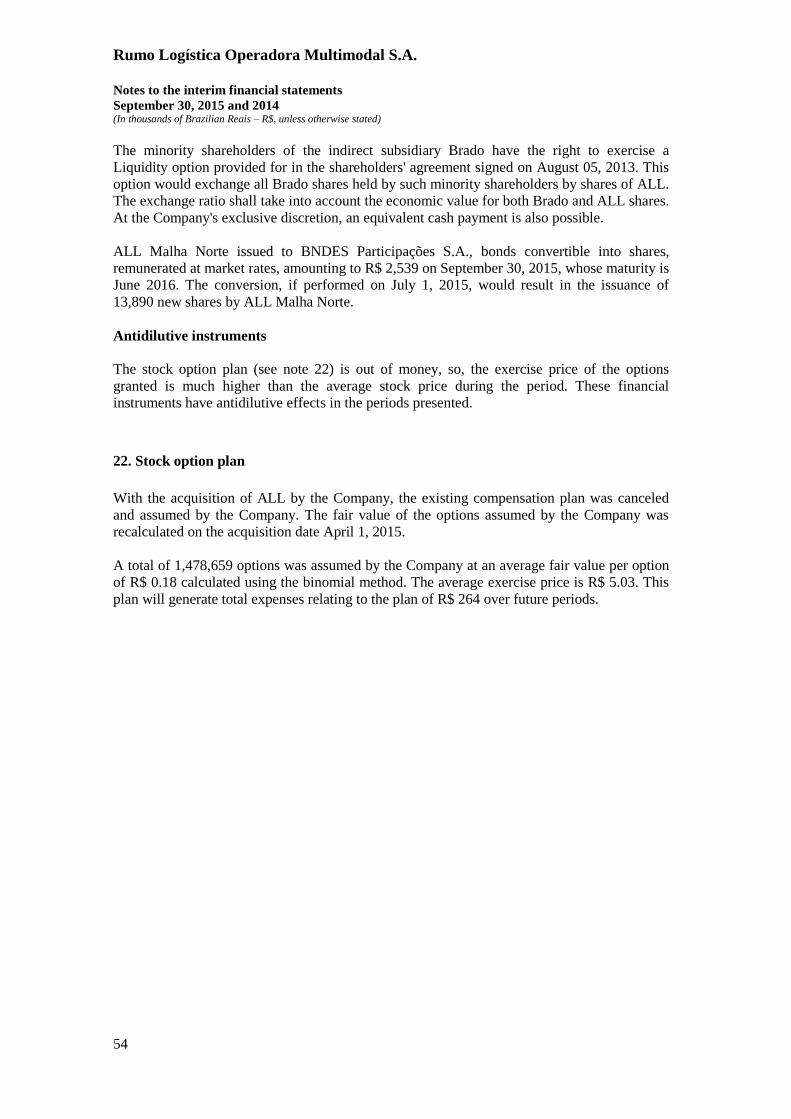
Rumo Logística Operadora Multimodal S.A.
Notes to the interim financial statements
September 30, 2015 and 2014 (In thousands of Brazilian Reais – R$, unless otherwise stated)
54
The minority shareholders of the indirect subsidiary Brado have the right to exercise a
Liquidity option provided for in the shareholders' agreement signed on August 05, 2013. This
option would exchange all Brado shares held by such minority shareholders by shares of ALL.
The exchange ratio shall take into account the economic value for both Brado and ALL shares.
At the Company's exclusive discretion, an equivalent cash payment is also possible.
ALL Malha Norte issued to BNDES Participações S.A., bonds convertible into shares,
remunerated at market rates, amounting to R$ 2,539 on September 30, 2015, whose maturity is
June 2016. The conversion, if performed on July 1, 2015, would result in the issuance of
13,890 new shares by ALL Malha Norte.
Antidilutive instruments
The stock option plan (see note 22) is out of money, so, the exercise price of the options
granted is much higher than the average stock price during the period. These financial
instruments have antidilutive effects in the periods presented.
22. Stock option plan
With the acquisition of ALL by the Company, the existing compensation plan was canceled
and assumed by the Company. The fair value of the options assumed by the Company was
recalculated on the acquisition date April 1, 2015.
A total of 1,478,659 options was assumed by the Company at an average fair value per option
of R$ 0.18 calculated using the binomial method. The average exercise price is R$ 5.03. This
plan will generate total expenses relating to the plan of R$ 264 over future periods.

Rumo Logística Operadora Multimodal S.A.
Notes to the interim financial statements
September 30, 2015 and 2014 (In thousands of Brazilian Reais – R$, unless otherwise stated)
55
23. Gross revenues
Parent Company Consolidated
July 1, 2015
to
September
30, 2015
January 1,
2015 to
September
30, 2015
July 1,
2014 to
September
30, 2014
January 1,
2014 to
September
30, 2014
July 1,
2015 to
September
30, 2015
January 1,
2015 to
September
30, 2015
July 1,
2014 to
September
30, 2014
January 1,
2014 to
September
30, 2014
Gross revenue from services 292,753 671,800 281,444 712,809 1,485,239 3,042,264 285,162 721,069
Taxes and deduction over sales (17,969) (46,532) (23,278) (60,256) (127,513) (258,642) (23,861) (61,354)
Net revenue 274,784 625,268 258,166 652,553 1,357,726 2,783,622 261,300 659,715
Breakdown of net revenue by service:
Consolidated
July 1, 2015
to
September
30, 2015
January 1,
2015 to
September
30, 2015
July 1,
2014 to
September
30, 2014
January 1,
2014 to
September
30, 2014
Elevation 77,799 165,319 65,159 158,467
Transport 1,061,011 2,384,783 190,658 483,397
Other 218,916 233,520 5,483 17,851
1,357,726 2,783,622 261,300 659,715
Breakdown of net revenue by region:
Consolidated
July 1, 2015
to
September
30, 2015
January 1,
2015 to
September
30, 2015
July 1,
2014 to
September
30, 2014
January 1,
2014 to
September
30, 2014
Domestic 1,301,546 2,664,499 215,166 548,735
Foreign 56,180 119,123 46,134 110,980
1,357,726 2,783,622 261,300 659,715

Rumo Logística Operadora Multimodal S.A.
Notes to the interim financial statements
September 30, 2015 and 2014 (In thousands of Brazilian Reais – R$, unless otherwise stated)
56
24. Financial result
Parent Company Consolidated
July 1,
2015 to
September
30, 2015
January 1,
2015 to
September
30, 2015
July 1, 2014 to
September
30, 2014
January 1, 2014 to
September
30, 2014
July 1, 2015
to
September
30, 2015
January 1,
2015 to
September
30, 2015
July 1, 2014 to
September
30, 2014
January 1, 2014 to
September
30, 2014
Gross debt charges (46,413) (109,627) (9,868) (29,431) (194,015) (408,954) (10,033) (29,825)
Income from financial investments 1,409 6,012 6,154 27,244 32,060 68,347 6,221 27,468
(=) Subtotal: Net debt interest (45,004) (103,615) (3,714) (2,187) (161,955) (340,607) (3,812) (2,357)
Other charges and monetary restatement asset 285 776 247 1,137 19,887 29,327 248 1,133
Other charges and monetary restatement liability (3,862) (11,291) 128 (22,674) (83,931) (158,377) 213 (22,458)
Gains (losses) on derivatives 60,623 86,535 - - 71,733 96,350 - -
Foreign exchange differences (94,814) (139,101) 286 568 (139,032) (195,307) 290 572
Monetary restatement on the concession and lease
agreements - - - - (62,498) (116,189) - -
Interest and monetary restatement of finance leases - - - - (43,605) (65,822) - -
(=) Finance, net (82,772) (166,696) (3,053) (23,156) (399,401) (750,625) (3,061) (23,110)
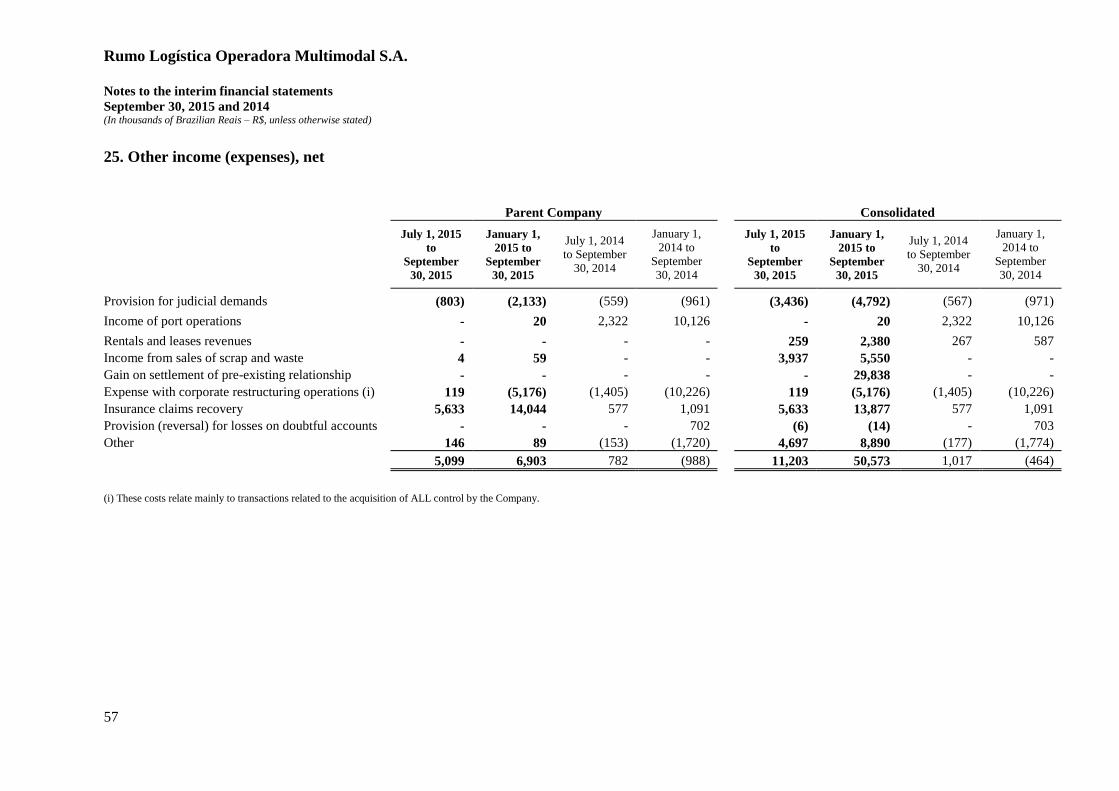
Rumo Logística Operadora Multimodal S.A.
Notes to the interim financial statements
September 30, 2015 and 2014 (In thousands of Brazilian Reais – R$, unless otherwise stated)
57
25. Other income (expenses), net
Parent Company Consolidated
July 1, 2015
to
September
30, 2015
January 1,
2015 to
September
30, 2015
July 1, 2014
to September
30, 2014
January 1,
2014 to
September
30, 2014
July 1, 2015
to
September
30, 2015
January 1,
2015 to
September
30, 2015
July 1, 2014
to September
30, 2014
January 1,
2014 to
September
30, 2014
Provision for judicial demands (803) (2,133) (559) (961) (3,436) (4,792) (567) (971)
Income of port operations - 20 2,322 10,126 - 20 2,322 10,126
Rentals and leases revenues - - - - 259 2,380 267 587
Income from sales of scrap and waste 4 59 - - 3,937 5,550 - -
Gain on settlement of pre-existing relationship - - - - - 29,838 - -
Expense with corporate restructuring operations (i) 119 (5,176) (1,405) (10,226) 119 (5,176) (1,405) (10,226)
Insurance claims recovery 5,633 14,044 577 1,091 5,633 13,877 577 1,091
Provision (reversal) for losses on doubtful accounts - - - 702 (6) (14) - 703
Other 146 89 (153) (1,720) 4,697 8,890 (177) (1,774)
5,099 6,903 782 (988) 11,203 50,573 1,017 (464)
(i) These costs relate mainly to transactions related to the acquisition of ALL control by the Company.
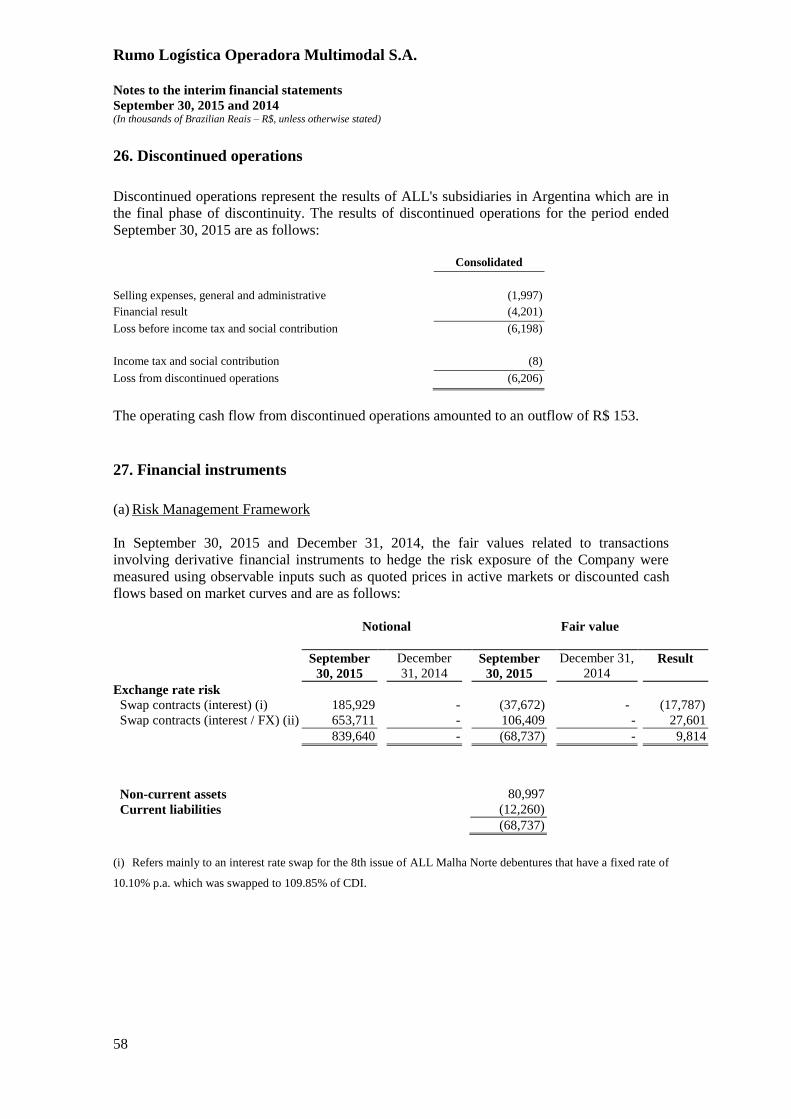
Rumo Logística Operadora Multimodal S.A.
Notes to the interim financial statements
September 30, 2015 and 2014 (In thousands of Brazilian Reais – R$, unless otherwise stated)
58
26. Discontinued operations
Discontinued operations represent the results of ALL's subsidiaries in Argentina which are in
the final phase of discontinuity. The results of discontinued operations for the period ended
September 30, 2015 are as follows:
Consolidated
Selling expenses, general and administrative (1,997)
Financial result (4,201)
Loss before income tax and social contribution (6,198)
Income tax and social contribution (8)
Loss from discontinued operations (6,206)
The operating cash flow from discontinued operations amounted to an outflow of R$ 153.
27. Financial instruments
(a) Risk Management Framework
In September 30, 2015 and December 31, 2014, the fair values related to transactions
involving derivative financial instruments to hedge the risk exposure of the Company were
measured using observable inputs such as quoted prices in active markets or discounted cash
flows based on market curves and are as follows:
Notional Fair value
September
30, 2015
December
31, 2014
September
30, 2015
December 31,
2014
Result
Exchange rate risk
Swap contracts (interest) (i) 185,929 - (37,672) - (17,787)
Swap contracts (interest / FX) (ii) 653,711 - 106,409 - 27,601
839,640 - (68,737) - 9,814
Non-current assets 80,997
Current liabilities (12,260)
(68,737)
(i) Refers mainly to an interest rate swap for the 8th issue of ALL Malha Norte debentures that have a fixed rate of
10.10% p.a. which was swapped to 109.85% of CDI.
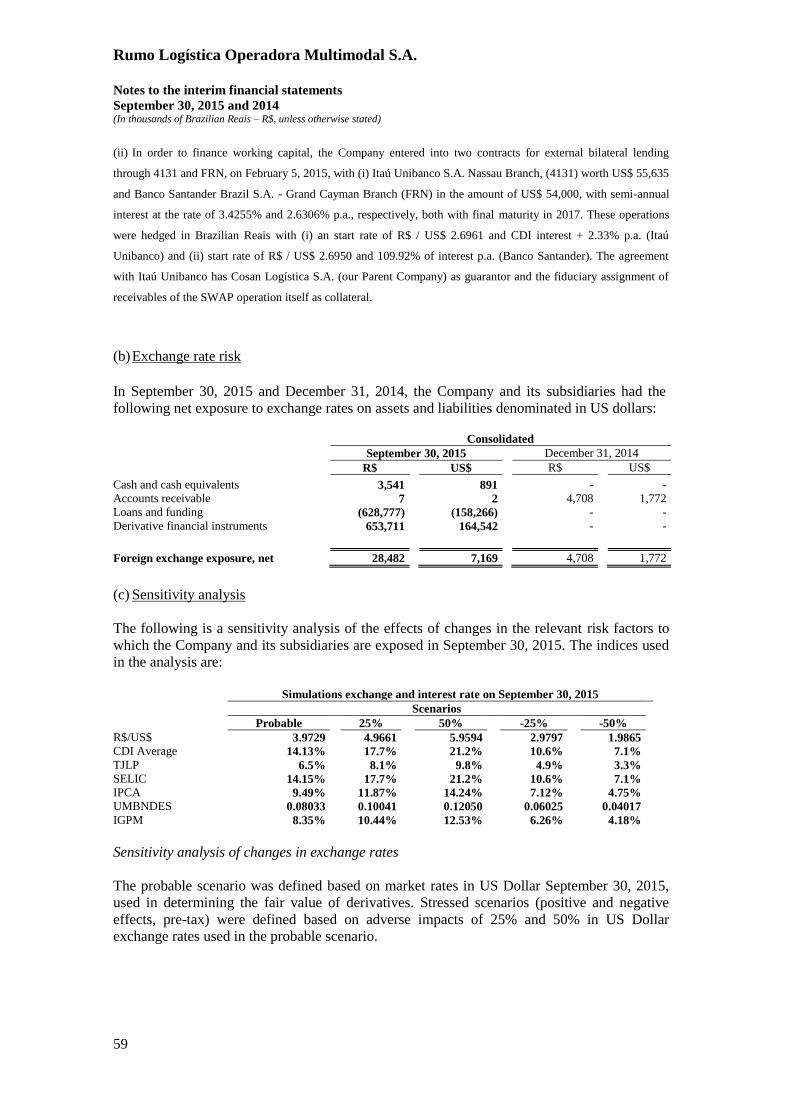
Rumo Logística Operadora Multimodal S.A.
Notes to the interim financial statements
September 30, 2015 and 2014 (In thousands of Brazilian Reais – R$, unless otherwise stated)
59
(ii) In order to finance working capital, the Company entered into two contracts for external bilateral lending
through 4131 and FRN, on February 5, 2015, with (i) Itaú Unibanco S.A. Nassau Branch, (4131) worth US$ 55,635
and Banco Santander Brazil S.A. - Grand Cayman Branch (FRN) in the amount of US$ 54,000, with semi-annual
interest at the rate of 3.4255% and 2.6306% p.a., respectively, both with final maturity in 2017. These operations
were hedged in Brazilian Reais with (i) an start rate of R$ / US$ 2.6961 and CDI interest + 2.33% p.a. (Itaú
Unibanco) and (ii) start rate of R$ / US$ 2.6950 and 109.92% of interest p.a. (Banco Santander). The agreement
with Itaú Unibanco has Cosan Logística S.A. (our Parent Company) as guarantor and the fiduciary assignment of
receivables of the SWAP operation itself as collateral.
(b) Exchange rate risk
In September 30, 2015 and December 31, 2014, the Company and its subsidiaries had the
following net exposure to exchange rates on assets and liabilities denominated in US dollars:
Consolidated
September 30, 2015
December 31, 2014
R$
US$
R$
US$
Cash and cash equivalents
3,541
891
-
-
Accounts receivable
7
2
4,708
1,772
Loans and funding
(628,777)
(158,266)
-
-
Derivative financial instruments
653,711
164,542
-
-
Foreign exchange exposure, net
28,482
7,169
4,708
1,772
(c) Sensitivity analysis
The following is a sensitivity analysis of the effects of changes in the relevant risk factors to
which the Company and its subsidiaries are exposed in September 30, 2015. The indices used
in the analysis are:
Simulations exchange and interest rate on September 30, 2015
Scenarios
Probable
25%
50%
-25%
-50%
R$/US$
3.9729
4.9661
5.9594
2.9797
1.9865
CDI Average
14.13%
17.7%
21.2%
10.6%
7.1%
TJLP
6.5%
8.1%
9.8%
4.9%
3.3%
SELIC
14.15%
17.7%
21.2%
10.6%
7.1%
IPCA
9.49%
11.87%
14.24%
7.12%
4.75%
UMBNDES
0.08033
0.10041
0.12050
0.06025
0.04017
IGPM
8.35%
10.44%
12.53%
6.26%
4.18%
Sensitivity analysis of changes in exchange rates
The probable scenario was defined based on market rates in US Dollar September 30, 2015,
used in determining the fair value of derivatives. Stressed scenarios (positive and negative
effects, pre-tax) were defined based on adverse impacts of 25% and 50% in US Dollar
exchange rates used in the probable scenario.

Rumo Logística Operadora Multimodal S.A.
Notes to the interim financial statements
September 30, 2015 and 2014 (In thousands of Brazilian Reais – R$, unless otherwise stated)
60
Sensitivity table
Based on the assets and liabilities denominated in US Dollars, September 30, 2015, the
Company conducted simulations with an increase and decrease in exchange rate (R$ / US$) of
25% and 50%.
Given the above scenario, the gains and losses would be affected as follows:
September 30, 2015
Balances
25%
50%
-25%
-50%
Cash and cash equivalents 3,541 885 1,771 (885) (1,771)
Accounts receivable 7 2 3 (2) (3)
Derivative financial instruments 653,711
163,428
326,855
(163,428)
(326,855)
Loans and financing (628,777)
(157,194)
(314,389)
157,194
314,389
7,121 14,240 (7,121) (14,240)
The Company performed a sensitivity analysis on interest rates on loans and financing and
remuneration for CDI of financial investments considering increases and decreases of 25%
and 50%, the results are as follows:
September 30, 2015
Interest rate exposure Balances on
September 30,
2015
Probable future
balance in 1
year
25% 50% -25% -50%
Financial investments 50.525 57,664 7,571 15,141 (7,571) (15,141)
Marketable securities 879,027 1,003,233 31,052 62,103 (31,052) (62,103)
Loans and financing (5,408,036) (6,172,191) (190,721) (381,441) 190,721 381,441
Debentures (2,903,667) (3,313,955) (102,572) (205,144) 102,572 205,144
Derivative interest rate (37,672) (42,995) (1,244) (2,488) 1,244 2,488
Advance of real estate credits (306,098) (325,994) (10,813) (21,626) 10,813 21,626
Leases (1,823,645) (2,081,326) (64,420) (128,840) 64,420 128,840
Impact on income for the period (331,147) (662,295) 331,147 662,295
The categories of financial instruments are presented as follows:
Measured at fair
value through
profit or loss
Other financial
assets and
liabilities (*)
Total
Assets
Marketable securities - 879,027 879,027
Accounts receivable - 208,258 208,258
Restricted cash - 92,628 92,628
Derivative financial instruments 80,997 - 80,997
Related parties - 24,889 24,889
80,997 1,204,802 1,285,799

Rumo Logística Operadora Multimodal S.A.
Notes to the interim financial statements
September 30, 2015 and 2014 (In thousands of Brazilian Reais – R$, unless otherwise stated)
61
Liabilities
Long-term debt (628,777) (7,682,925) (8,311,702)
Finance leases - (1,823,645) (1,823,645)
Real estate credit certificates - (306,097) (306,097)
Lease and concessions - (2,133,941) (2,133,941)
Derivatives financial instruments (12,260) - (12,260)
Related parties - (85,221) (85,221)
Accounts payable - (745,949) (745,949)
(641,037) (12,777,778) (13,418,815)
(*)Except for marketable securities and restricted cash, classified as financial assets available for sale.
(d) Capital management
Management monitors returns on capital, which the Company defines as result from operating
activities divided by total equity and financial leverage ratios, involving cash generation
(EBITDA), short-term debt and total debt.
For more information see note 20 of the financial statements of December 31, 2014.
(e) Fair value hierarchy
Financial assets of R$ 80,997 and liabilities of R$ 641,037 are measured at fair value using
Level 2 inputs. Other financial instruments are measured at amortized cost which
approximates fair values at the reporting date.
(f) Liquidity risk
September 30, 2015
Up to 1 year 1 to 2 years From 2 to 5
years
Over 5 years Total
Accounts payable - suppliers (745,931) - - - (745,931)
Leases (1,232,995) (1,118,432) (384,896) (343,885) (3,080,208)
Loans and financing (1,926,576) (5,641,953) (2,085,155) (1,845,937) (11,499,621)
Advance of real estate credits (138,869) (251,183) (27,225) - (417,277)
Derivatives (34,205) 98,600 (30,833) (5,052) 28,510
Total (4,078,577) (6,912,968) (2,528,109) (2,194,874) (15,714,528)
The long term liability regarding lease and concessions are not considered in the liquidity analysis due to the legal
discussion on those amounts presented in note 18.

Rumo Logística Operadora Multimodal S.A.
Notes to the interim financial statements
September 30, 2015 and 2014 (In thousands of Brazilian Reais – R$, unless otherwise stated)
62
28. Operating segment information
Management evaluates the performance of its operating segments based on EBITDA (earnings
before income tax and social contribution, interest, depreciation and amortization).
As mentioned in Note 2.1, with the acquisition of ALL, operating segments have been revised
and became defined as follows:
Operational segments
(i) North Operations: comprised of the railway operations, transshipment and port
elevation in the areas of the Company's concession, ALL Malha Norte and ALL Malha
Paulista.
(ii) South Operations: comprised of the railway and transshipment in the concession area
of ALL Malha Sul and ALL Malha Oeste.
(iii) Container Operations: comprised by Group Company this focuses on container
logistics either by rail or road transport and other container operations results.
The segment information has been prepared in accordance with the same accounting policies
used in preparing the consolidated information.
As the acquisition of ALL occurred on April 1, 2015, the result of information with new
segments are presented only for 2015, as for all prior periods, the Company had only one
reportable segment, coinciding with the results consolidated, as shown below.
Quarter ended and nine months period ended September 30, 2015 and 2014:
July 1, 2015 to September 30, 2015
Results by Segment North
Operations
South
Operations
Container
Operations Consolidated
Net revenue 972,369 317,885 67,472 1,357,726
Cost of services (558,499) (272,570) (90,346) (921,415)
Gross profit 413,870 45,315 (22,874) 436,311
Gross margin (%) 42.6% 14.3% -33.9% 32.1%
Selling, general and administrative (65,722) (14,323) (15,181) (95,225)
Other income (expenses) and equity 11,652 3,588 35 15,276
Depreciation and amortization 130,429 50,429 14,474 195,332
EBITDA 490,230 85,010 (23,546) 551,694
Margin EBITDA (%) 50.4% 26.7% -34.9% 40,6%
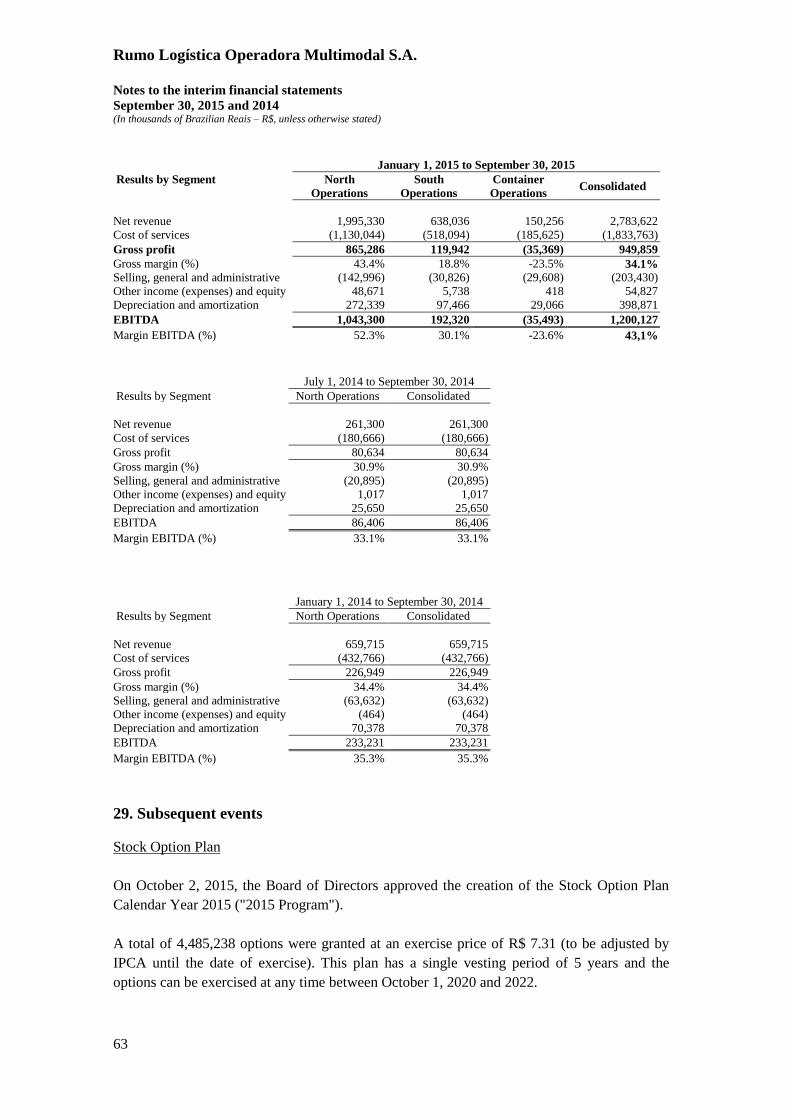
Rumo Logística Operadora Multimodal S.A.
Notes to the interim financial statements
September 30, 2015 and 2014 (In thousands of Brazilian Reais – R$, unless otherwise stated)
63
January 1, 2015 to September 30, 2015
Results by Segment North
Operations
South
Operations
Container
Operations Consolidated
Net revenue 1,995,330 638,036 150,256 2,783,622
Cost of services (1,130,044) (518,094) (185,625) (1,833,763)
Gross profit 865,286 119,942 (35,369) 949,859
Gross margin (%) 43.4% 18.8% -23.5% 34.1%
Selling, general and administrative (142,996) (30,826) (29,608) (203,430)
Other income (expenses) and equity 48,671 5,738 418 54,827
Depreciation and amortization 272,339 97,466 29,066 398,871
EBITDA 1,043,300 192,320 (35,493) 1,200,127
Margin EBITDA (%) 52.3% 30.1% -23.6% 43,1%
July 1, 2014 to September 30, 2014
Results by Segment North Operations Consolidated
Net revenue 261,300 261,300
Cost of services (180,666) (180,666)
Gross profit 80,634 80,634
Gross margin (%) 30.9% 30.9%
Selling, general and administrative (20,895) (20,895)
Other income (expenses) and equity 1,017 1,017
Depreciation and amortization 25,650 25,650
EBITDA 86,406 86,406
Margin EBITDA (%) 33.1% 33.1%
January 1, 2014 to September 30, 2014
Results by Segment North Operations Consolidated
Net revenue 659,715 659,715
Cost of services (432,766) (432,766)
Gross profit 226,949 226,949
Gross margin (%) 34.4% 34.4%
Selling, general and administrative (63,632) (63,632)
Other income (expenses) and equity (464) (464)
Depreciation and amortization 70,378 70,378
EBITDA 233,231 233,231
Margin EBITDA (%) 35.3% 35.3%
29. Subsequent events
Stock Option Plan
On October 2, 2015, the Board of Directors approved the creation of the Stock Option Plan
Calendar Year 2015 ("2015 Program").
A total of 4,485,238 options were granted at an exercise price of R$ 7.31 (to be adjusted by
IPCA until the date of exercise). This plan has a single vesting period of 5 years and the
options can be exercised at any time between October 1, 2020 and 2022.
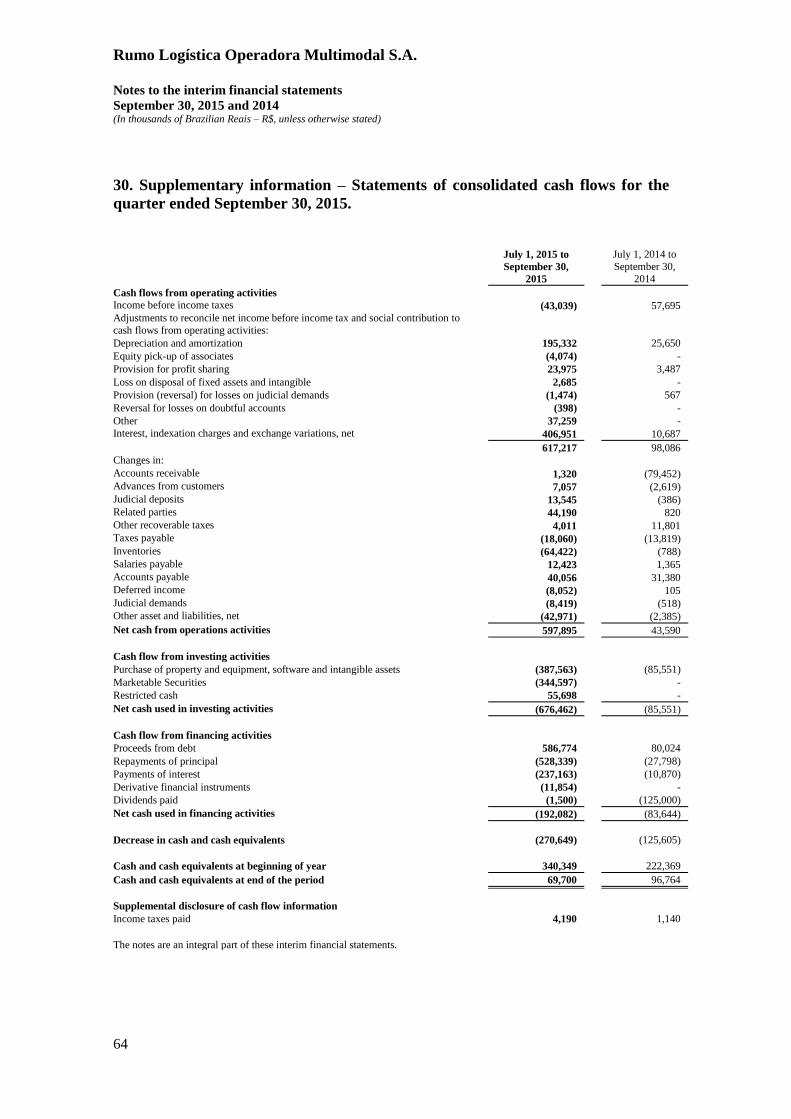
Rumo Logística Operadora Multimodal S.A.
Notes to the interim financial statements
September 30, 2015 and 2014 (In thousands of Brazilian Reais – R$, unless otherwise stated)
64
30. Supplementary information – Statements of consolidated cash flows for the
quarter ended September 30, 2015.
July 1, 2015 to
September 30,
2015
July 1, 2014 to
September 30,
2014
Cash flows from operating activities
Income before income taxes (43,039) 57,695
Adjustments to reconcile net income before income tax and social contribution to
cash flows from operating activities:
Depreciation and amortization 195,332 25,650
Equity pick-up of associates (4,074) -
Provision for profit sharing 23,975 3,487
Loss on disposal of fixed assets and intangible 2,685 -
Provision (reversal) for losses on judicial demands (1,474) 567
Reversal for losses on doubtful accounts (398) -
Other 37,259 -
Interest, indexation charges and exchange variations, net 406,951 10,687
617,217 98,086
Changes in:
Accounts receivable 1,320 (79,452) Advances from customers 7,057 (2,619)
Judicial deposits 13,545 (386)
Related parties 44,190 820
Other recoverable taxes 4,011 11,801 Taxes payable (18,060) (13,819)
Inventories (64,422) (788)
Salaries payable 12,423 1,365
Accounts payable 40,056 31,380 Deferred income (8,052) 105
Judicial demands (8,419) (518)
Other asset and liabilities, net (42,971) (2,385)
Net cash from operations activities 597,895 43,590
Cash flow from investing activities
Purchase of property and equipment, software and intangible assets (387,563) (85,551)
Marketable Securities (344,597) -
Restricted cash 55,698 -
Net cash used in investing activities (676,462) (85,551)
Cash flow from financing activities
Proceeds from debt 586,774 80,024
Repayments of principal (528,339) (27,798)
Payments of interest (237,163) (10,870)
Derivative financial instruments (11,854) -
Dividends paid (1,500) (125,000)
Net cash used in financing activities (192,082) (83,644)
Decrease in cash and cash equivalents (270,649) (125,605)
Cash and cash equivalents at beginning of year 340,349 222,369
Cash and cash equivalents at end of the period 69,700 96,764
Supplemental disclosure of cash flow information
Income taxes paid 4,190 1,140
The notes are an integral part of these interim financial statements.

65 of 85
EARNINGS RELEASE 3Q15
São Paulo, November 5, 2015 – RUMO LOGÍSTICA OPERADORA MULTIMODAL S.A. (BM&FBovespa: RUMO3)
(“Rumo ALL”) and COSAN LOGÍSTICA S.A. (BM&FBovespa: RLOG3) (“Cosan Logística”) announce today their
results for the third quarter of 2015 (3Q15) comprising the months of July, August and September 2015. The results are
consolidated in accordance with the accounting practices adopted in Brazil and the International Financial Reporting
Standards (IFRS) applied to the interim financial statements.
Rumo ALL Highlights in 3Q15
Consolidated EBITDA of Rumo ALL grew 3% to R$551 million, despite higher costs and expenses resulting from the reclassification of maintenance expenses (parts, services and personnel)
Total volume transported reached 12.5 billion RTK (up 6% from 3Q14), mainly due to the 14% increase in the transportation of agricultural products
North Operations presented 16% volume growth and R$490 million of EBITDA (18% up from 3Q14)
Port loading of 3.7 million tons: up 20% from 3Q14 due to the sugar crop peak season, as well as additional corn volumes in the quarter
3Q15 3Q14 Chg. % Summary of Financial Information - Rumo ALL 9M15 9M14 Chg. %
Combined
(Amounts in R$ MM) Combined Combined
1,357.7 1,111.1 22.2% Net Revenue 3,548.2 3,247.8 9.2%
436.3 401.3 8.7% Gross Profit 1,158.1 1,230.8 -5.9%
551.6 536.0 2.9% EBITDA 1,450.0 1,554.9 -6.7%
40.6% 48.2% -7.6 p.p. EBITDA Margin (%) 40.9% 47.9% -7.0 p.p.
(43.7) 68.2 n/a Net Income (Loss) (237.5) 167.6 n/a
-3.2% 6.1% -9.4 p.p. Net Margin (%) -6.7% 5.2% -2.3 p.p.
479.3 406.6 17.9% Capex 1,435.3 1,115.8 28.6%
Note 1: The combined results refer to the sum of Rumo and ALL consolidated with the appropriate eliminations of transactions with related parties, not
necessarily fulfilling all the requirements of OCPC 06 - Presentation of Financial Pro Forma.
Investor Relations
E-mail: [email protected]
Phones: +55 41 2141-7459
+55 11 3897-9797
Website: ir.rumoall.com
Portuguese – 11:00 a.m. (EST)
November 6, 2015 (Friday)
Phone: + 55 11 3193 1001
+ 55 11 2820 4001
Code: RUMO
English – 12:00 p.m. (EST)
November 6, 2015 (Friday)
Phone (BR): + 55 11 3193 1001
+ 55 11 2820 4001
Phone (USA): +1 786 924 6977
Code: RUMO
Conference Call

66 of 85
Earnings Release 3rd Quarter of 2015
1. Executive Summary 3Q15
In October 2015, Brazil’s National Supply Company (CONAB) concluded its analysis of total grain
production in Brazil in the 2014/15 crop year, which reached an all-time high of 210 million tons.
Soybean and corn grew 11.8% and 8.4%, respectively, from the 2013/14 crop year. The key drivers of
this improved performance were productivity gains and expansion of the planting area in almost all
producing states, mainly in the Midwest region and in Paraná State. In this scenario, our business
benefitted significantly, since 80% of our transportation volumes consist of agricultural products bound for
exports.
Volume transported in 3Q15 grew 6.3% to 12.5 billion RTK. This increase reflects the 14.1% growth in
the volume of agricultural products transported, driven by corn in the second crop. Operational
improvements implemented during the quarter also boosted our productivity. Our fleet renovation plan,
which remains on schedule, has expanded capacity while reducing transit time in the main corridor of the
North Operations. We also made great progress in operational safety aspects.
Consolidated EBITDA in the quarter totaled R$551.6 million, up 2.9% from 3Q14. The increases on
volume and average yield were the key drivers of EBITDA growth. Meanwhile, EBITDA margin decreased
7.6 p.p. (40.6% in 3Q15 vs. 48.2% in 3Q14), impacted by increases in costs and expenses due to the
reallocation of maintenance costs and personnel expenses in accordance with the new criteria adopted by
the company as from 2Q15.
EBITDA in 9M15 reached R$1,450 million, nearly 80% of the midpoint of our guidance for 2015.
Market data (CONAB) point to significant growth in corn production in the second crop. Moreover, the
depreciation of the Brazilian real continues to drive up domestic corn prices, even after the record harvest
in the 2014/15 crop and the bumper grain production in the U.S., which should maintain the brisk pace of
exports in 4Q15. Brazil has been consolidating its position as an important corn exporter and this trend
should continue in 2016. Another significant aspect of freight supply and demand is the accumulated data
from FENABRAVE until September 2015. Note that truck sales fell by 44%, which could boost demand for
railroad transportation in the coming months.
Capex increased by 17.9% from 3Q14, which totaled R$479.3 million. Maintenance Capex
decreased from the year-ago period due to the allocation of part of the expenditure as operating costs in
3Q15. Whereas expansion Capex grew focused on the acquisition of rolling stock (locomotives and
freight cars) and materials and services for renovation of the rail structure (tracks and steel sleepers), in
accordance with the guidelines of our investment plan.
In 3Q15 the company registered net loss of R$43.7 million and leverage of 4.85 times the net
debt/LTM EBITDA. Net income (loss) was affected by: (i) higher operating costs and expenses due to
the adoption of new accounting policies; and (ii) higher financial expenses due to the increase in the
average balance and debt costs in line with the increase in average interest rates (CDI and TJLP)
between periods. Leverage decreased by 2.3% compared to 2Q15 due to the improvement in EBITDA
LTM.
All the comments in this report refer to the integrated operations of Rumo ALL, but all the 3Q15
financial information related to Cosan Logística is available in the appendices. We also provide all
the financial information published herein in our Investor Relations website (ir.rumoall.com) to facilitate the
analysis of our results going forward.

67 of 85
Earnings Release 3rd Quarter of 2015
2. Consolidated Operating and Financial Indicators
3Q15 3Q14
Chg. % Operational na Financial Indicators 9M15 9M14
Chg. %
Combined (Amounts in R$ MM) Combined Combined
12,494 11,757 6.3% Transported Volume (millions RTK) 32,778 31,835 3.0%
10,240 8,978 14.1% Agricultural Products 25,974 24,126 7.7%
2,254 2,779 -18.9% Industrial Products 6,804 7,709 -11.7%
90.1 76.0 18.6% Average Transportation Yield (R$/000 RTK) 92.8 86.3 7.5%
3,747 3,124 19.9% Volume Loaded (TU '000) 8,168 8,059 1.4%
1,357.7 1,111.1 22.2% Net Operating Revenue 3,548.2 3,247.8 9.2%
1,058.6 818.9 29.3% Rail Operations 2,804 2,536 10.6%
77.8 65.2 19.4% Port Elevation 165.3 158.5 4.3%
221.3 227.0 -2.5% Other Net Revenue² 579.0 553.0 4.7%
551.6 536.0 2.9% EBITDA 1,450.0 1,554.9 -6.7%
40.6% 48.2% -7.6 p.p. EBITDA Margin (%) 40.9% 47.9% -7.0 p.p.
Note 2: Includes income for the right of way of other railways, the sugar transportation revenues using other railways as well as using road transportation.
Transported Volume (millions RTK) and Average Transportation Yield (R$/000 RTK)
Rumo ALL Consolidated Transported Volumes
3Q15 3Q14 Chg. %
Operational Figures 9M15 9M14 Chg. %
Combined Combined Combined
12,494 11,757 6.3% Transported Volume (millions RTK) 32,778 31,835 3.0%
10,240 8,978 14.1% Agricultural Products 25,974 24,126 7.7%
1,079 1,067 1.1% Soybean 10,631 10,688 -0.5%
1,326 1,383 -4.1% Soybean meal 4,091 3,751 9.1%
6,342 4,688 35.3% Corn 7,372 5,319 38.6%
1,225 1,377 -11.0% Sugar 2,913 3,214 -9.4%
236 322 -26.7% Fertilizers 612 826 -25.9%
- 70 -100.0% Wheat 203 146 38.9%
32 72 -56.0% Rice 155 182 -15.1%
2,254 2,779 -18.9% Industrial Products 6,804 7,709 -11.7%
1,202 1,281 -6.2% Fuels 3,296 3,468 -5.0%
264 506 -47.9% Pulp and Paper 1,038 1,367 -24.1%
524 584 -10.2% Containers 1,631 1,615 1.0%
178 226 -21.1% Construction 533 674 -21.0%
35 100 -65.3% Steel and Mining 141 305 -53.6%
51 82 -38.5% Others 165 280 -41.0%

68 of 85
Earnings Release 3rd Quarter of 2015
3. Market Scenario
Calendar of Brazilian Crops
The four railroad concessions we operate cover approximately 12,000 kilometers of railroads
located in the South, Southeast and Midwest regions of Brazil, where approximately 80% of the
country's GDP is concentrated. Our railroads transport agricultural commodities and industrial products,
and are connected to the country's four main ports. Those four ports concentrate most of the country's
agricultural commodity exports. Exported agricultural commodities account for 70% to 80% of the volume
transported in this segment. The following table highlights the calendar of the main agricultural
commodities transported by Rumo ALL.
Aug Sep Oct Nov Dec Jan Feb Mar Apr May Jun Jul Aug Sep Oct Nov Dec
1.6% 1.8% 8.1% 13.7% 15.0% 14.3% 13.2% 11.3% 9.5% 5.9% 3.1% 2.4%
8.1% 7.5% 6.5% 4.6% 5.3% 4.9% 5.7% 9.6% 12.7% 11.9% 11.5% 11.6%
5.7% 5.1% 5.2% 4.1% 7.0% 9.0% 11.1% 12.5% 11.5% 11.8% 9.4% 7.5%
Note: Exports*: 5-year average according to Brazilian Trade Balance
Source: SLC Agrícola, Raízen, Sã Martinho, SECEX, Embrapa, BofA Merrill Lynch Global Research
35% of sales
Exports*
Planting 2nd Crop
Planting 1st Crop
Handling 2nd Crop
Harvest 1st Crop
Harvest 2nd Crop
Handling 1st Crop
Corn
10% of sales 15% of sales 40% of sales
Exports*
Handling
Harvest
30% of sales 40% of sales 20% of sales 10% of sales
Soybean
Previous Fiscal Year Fiscal Year
3Q 4Q 1Q 2Q 3Q 4Q
Planting
Exports*
Sugar
Planting
Harvest
30% of sales 15% of sales 30% of sales 25% of sales
Handling
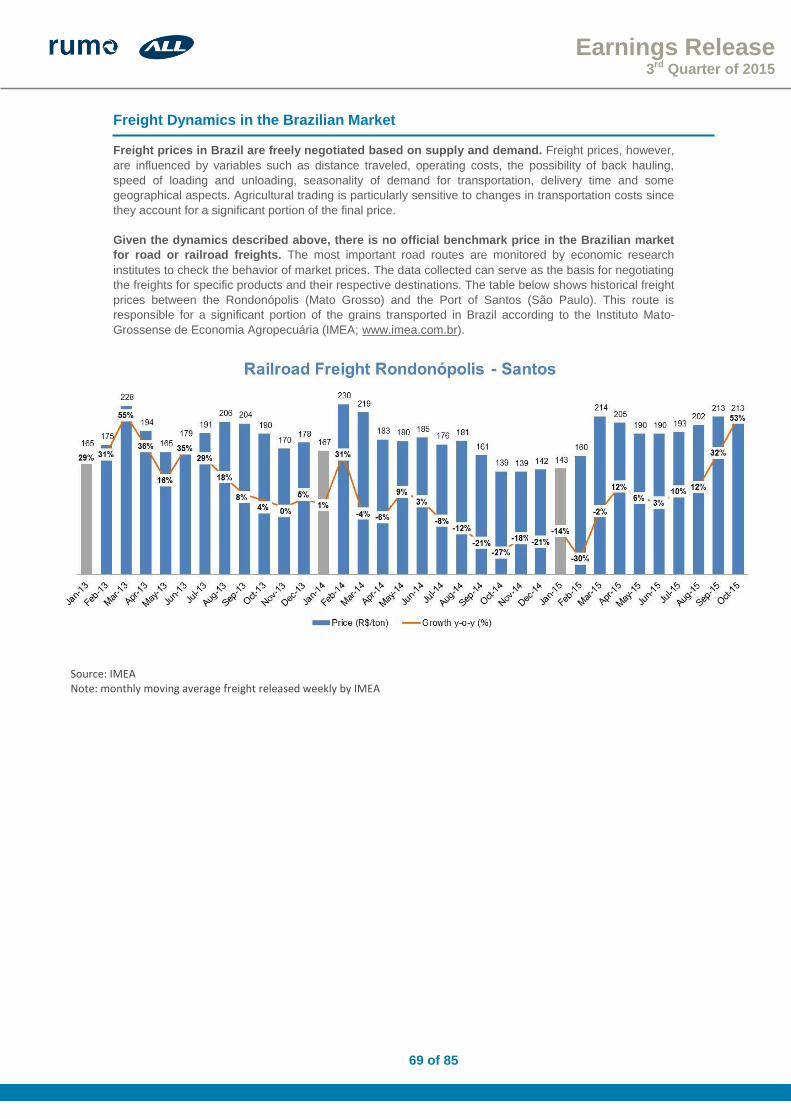
69 of 85
Earnings Release 3rd Quarter of 2015
Freight Dynamics in the Brazilian Market
Freight prices in Brazil are freely negotiated based on supply and demand. Freight prices, however,
are influenced by variables such as distance traveled, operating costs, the possibility of back hauling,
speed of loading and unloading, seasonality of demand for transportation, delivery time and some
geographical aspects. Agricultural trading is particularly sensitive to changes in transportation costs since
they account for a significant portion of the final price.
Given the dynamics described above, there is no official benchmark price in the Brazilian market
for road or railroad freights. The most important road routes are monitored by economic research
institutes to check the behavior of market prices. The data collected can serve as the basis for negotiating
the freights for specific products and their respective destinations. The table below shows historical freight
prices between the Rondonópolis (Mato Grosso) and the Port of Santos (São Paulo). This route is
responsible for a significant portion of the grains transported in Brazil according to the Instituto Mato-
Grossense de Economia Agropecuária (IMEA; www.imea.com.br).
Source: IMEA Note: monthly moving average freight released weekly by IMEA
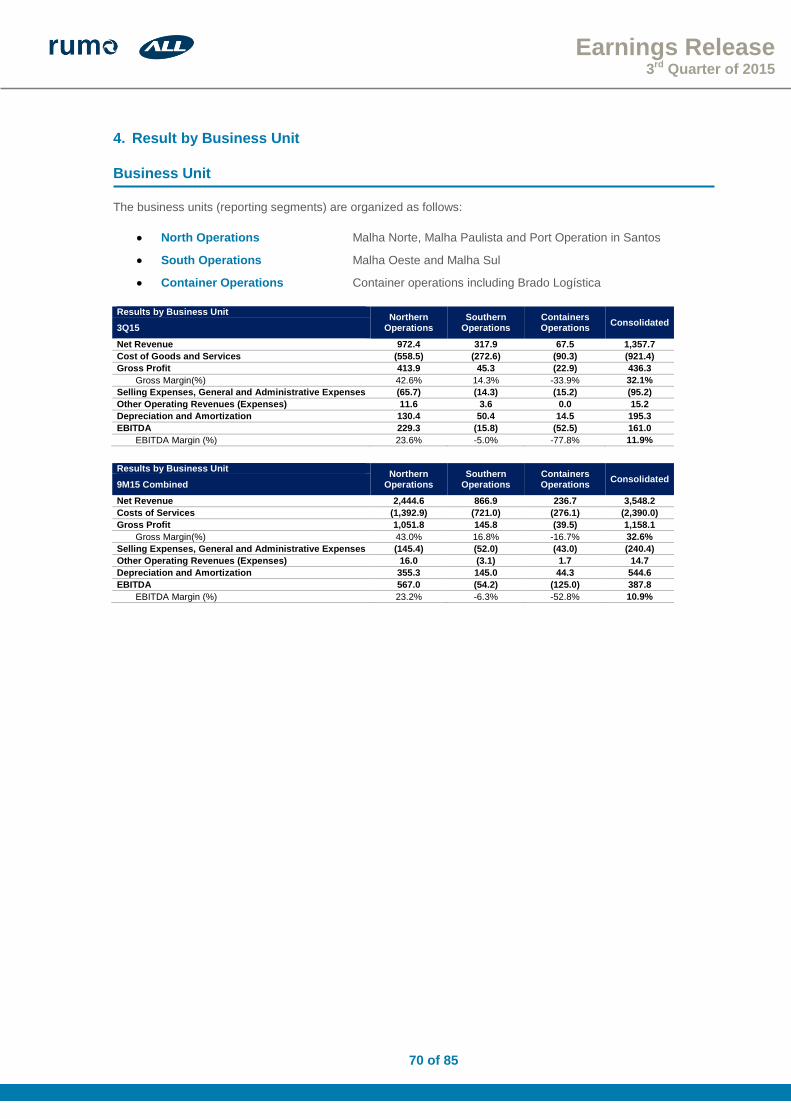
70 of 85
Earnings Release 3rd Quarter of 2015
4. Result by Business Unit
Business Unit
The business units (reporting segments) are organized as follows:
North Operations Malha Norte, Malha Paulista and Port Operation in Santos
South Operations Malha Oeste and Malha Sul
Container Operations Container operations including Brado Logística
Results by Business Unit
Northern Operations
Southern Operations
Containers Operations
Consolidated 3Q15
Net Revenue 972.4 317.9 67.5 1,357.7
Cost of Goods and Services (558.5) (272.6) (90.3) (921.4)
Gross Profit 413.9 45.3 (22.9) 436.3
Gross Margin(%) 42.6% 14.3% -33.9% 32.1%
Selling Expenses, General and Administrative Expenses (65.7) (14.3) (15.2) (95.2)
Other Operating Revenues (Expenses) 11.6 3.6 0.0 15.2
Depreciation and Amortization 130.4 50.4 14.5 195.3
EBITDA 229.3 (15.8) (52.5) 161.0
EBITDA Margin (%) 23.6% -5.0% -77.8% 11.9%
Results by Business Unit
Northern Operations
Southern Operations
Containers Operations
Consolidated 9M15 Combined
Net Revenue 2,444.6 866.9 236.7 3,548.2
Costs of Services (1,392.9) (721.0) (276.1) (2,390.0)
Gross Profit 1,051.8 145.8 (39.5) 1,158.1
Gross Margin(%) 43.0% 16.8% -16.7% 32.6%
Selling Expenses, General and Administrative Expenses (145.4) (52.0) (43.0) (240.4)
Other Operating Revenues (Expenses) 16.0 (3.1) 1.7 14.7
Depreciation and Amortization 355.3 145.0 44.3 544.6
EBITDA 567.0 (54.2) (125.0) 387.8
EBITDA Margin (%) 23.2% -6.3% -52.8% 10.9%
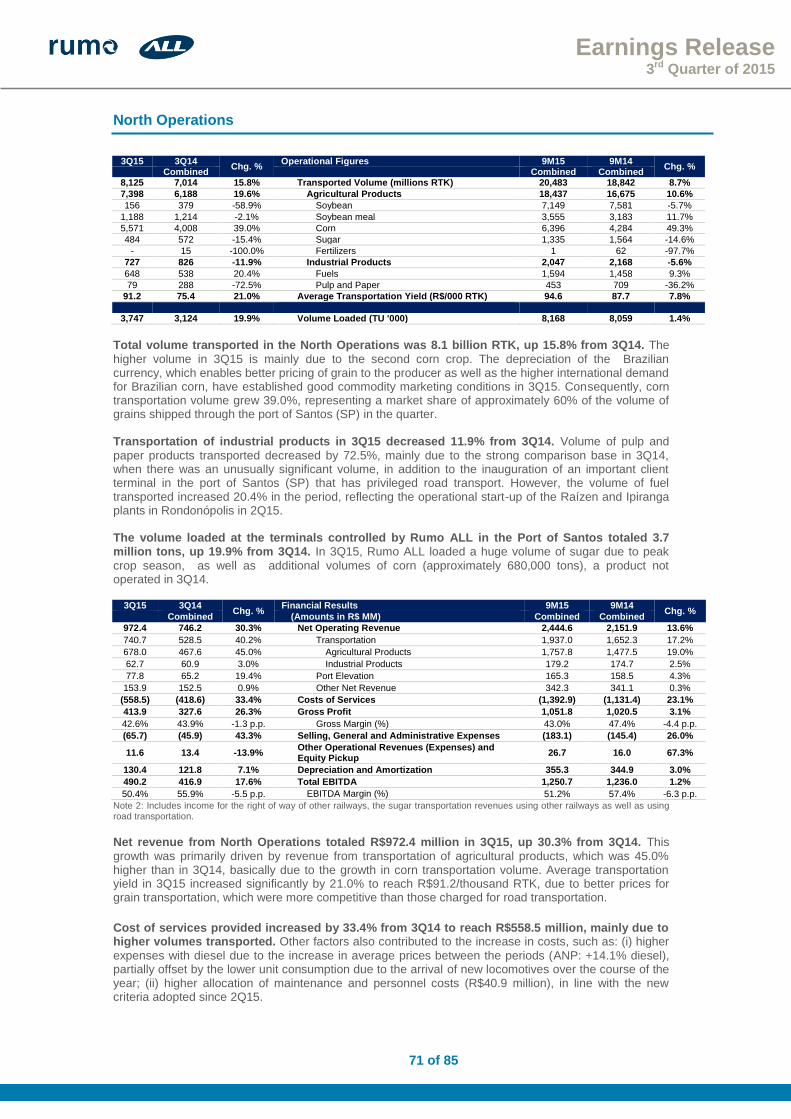
71 of 85
Earnings Release 3rd Quarter of 2015
North Operations
3Q15 3Q14 Chg. %
Operational Figures 9M15 9M14 Chg. %
Combined Combined Combined
8,125 7,014 15.8% Transported Volume (millions RTK) 20,483 18,842 8.7%
7,398 6,188 19.6% Agricultural Products 18,437 16,675 10.6%
156 379 -58.9% Soybean 7,149 7,581 -5.7%
1,188 1,214 -2.1% Soybean meal 3,555 3,183 11.7%
5,571 4,008 39.0% Corn 6,396 4,284 49.3%
484 572 -15.4% Sugar 1,335 1,564 -14.6%
- 15 -100.0% Fertilizers 1 62 -97.7%
727 826 -11.9% Industrial Products 2,047 2,168 -5.6%
648 538 20.4% Fuels 1,594 1,458 9.3%
79 288 -72.5% Pulp and Paper 453 709 -36.2%
91.2 75.4 21.0% Average Transportation Yield (R$/000 RTK) 94.6 87.7 7.8%
3,747 3,124 19.9% Volume Loaded (TU '000) 8,168 8,059 1.4%
Total volume transported in the North Operations was 8.1 billion RTK, up 15.8% from 3Q14. The
higher volume in 3Q15 is mainly due to the second corn crop. The depreciation of the Brazilian currency, which enables better pricing of grain to the producer as well as the higher international demand for Brazilian corn, have established good commodity marketing conditions in 3Q15. Consequently, corn transportation volume grew 39.0%, representing a market share of approximately 60% of the volume of grains shipped through the port of Santos (SP) in the quarter. Transportation of industrial products in 3Q15 decreased 11.9% from 3Q14. Volume of pulp and
paper products transported decreased by 72.5%, mainly due to the strong comparison base in 3Q14, when there was an unusually significant volume, in addition to the inauguration of an important client terminal in the port of Santos (SP) that has privileged road transport. However, the volume of fuel transported increased 20.4% in the period, reflecting the operational start-up of the Raízen and Ipiranga plants in Rondonópolis in 2Q15. The volume loaded at the terminals controlled by Rumo ALL in the Port of Santos totaled 3.7 million tons, up 19.9% from 3Q14. In 3Q15, Rumo ALL loaded a huge volume of sugar due to peak
crop season, as well as additional volumes of corn (approximately 680,000 tons), a product not operated in 3Q14.
3Q15 3Q14 Chg. %
Financial Results 9M15 9M14 Chg. %
Combined (Amounts in R$ MM) Combined Combined
972.4 746.2 30.3% Net Operating Revenue 2,444.6 2,151.9 13.6%
740.7 528.5 40.2% Transportation 1,937.0 1,652.3 17.2%
678.0 467.6 45.0% Agricultural Products 1,757.8 1,477.5 19.0%
62.7 60.9 3.0% Industrial Products 179.2 174.7 2.5%
77.8 65.2 19.4% Port Elevation 165.3 158.5 4.3%
153.9 152.5 0.9% Other Net Revenue 342.3 341.1 0.3%
(558.5) (418.6) 33.4% Costs of Services (1,392.9) (1,131.4) 23.1%
413.9 327.6 26.3% Gross Profit 1,051.8 1,020.5 3.1%
42.6% 43.9% -1.3 p.p. Gross Margin (%) 43.0% 47.4% -4.4 p.p.
(65.7) (45.9) 43.3% Selling, General and Administrative Expenses (183.1) (145.4) 26.0%
11.6 13.4 -13.9% Other Operational Revenues (Expenses) and Equity Pickup
26.7 16.0 67.3%
130.4 121.8 7.1% Depreciation and Amortization 355.3 344.9 3.0%
490.2 416.9 17.6% Total EBITDA 1,250.7 1,236.0 1.2%
50.4% 55.9% -5.5 p.p. EBITDA Margin (%) 51.2% 57.4% -6.3 p.p.
Note 2: Includes income for the right of way of other railways, the sugar transportation revenues using other railways as well as using road transportation.
Net revenue from North Operations totaled R$972.4 million in 3Q15, up 30.3% from 3Q14. This
growth was primarily driven by revenue from transportation of agricultural products, which was 45.0% higher than in 3Q14, basically due to the growth in corn transportation volume. Average transportation yield in 3Q15 increased significantly by 21.0% to reach R$91.2/thousand RTK, due to better prices for grain transportation, which were more competitive than those charged for road transportation.
Cost of services provided increased by 33.4% from 3Q14 to reach R$558.5 million, mainly due to higher volumes transported. Other factors also contributed to the increase in costs, such as: (i) higher
expenses with diesel due to the increase in average prices between the periods (ANP: +14.1% diesel), partially offset by the lower unit consumption due to the arrival of new locomotives over the course of the year; (ii) higher allocation of maintenance and personnel costs (R$40.9 million), in line with the new criteria adopted since 2Q15.

72 of 85
Earnings Release 3rd Quarter of 2015
EBITDA from North Operations reached R$490.2 million, up 17.6% from 3Q14. The growth in
volumes transported and increase in average yield, combined with the operational improvements implemented, were the key drivers of this growth.
South Operations
3Q15 3Q14 Chg. %
Operational Figures 9M15 9M14 Chg. %
Combined Combined Combined
3,844 4,159 -7.6% Transported Volume (millions RTK) 10,664 11,378 -6.3%
2,842 2,790 1.9% Agricultural Products 7,538 7,452 1.2%
923 688 34.1% Soybean 3,482 3,106 12.1%
138 169 -18.1% Soybean meal 536 568 -5.8%
772 680 13.5% Corn 976 1,035 -5.7%
742 804 -7.8% Sugar 1,577 1,650 -4.4%
236 307 -23.2% Fertilizers 610 764 -20.1%
- 70 -100.0% Wheat 203 146 38.9%
32 72 -56.0% Rice 155 182 -15.1%
1,002 1,370 -26.8% Industrial Products 3,126 3,926 -20.4%
554 743 -25.4% Fuels 1,702 2,010 -15.3%
185 219 -15.5% Pulp and Paper 585 657 -11.0%
178 226 -21.1% Construction 533 674 -21.0%
35 100 -65.3% Steel and Mining 141 305 -53.6%
51 82 -38.5% Others 165 280 -41.0%
82.7 69.8 18.4% Average Transportation Yield (R$/000 RTK) 81.3 77.7 4.6%
The South Operations transported 3.8 billion RTK in 3Q15, a decrease of 7.6%. Volume of
agricultural products grew 1.9% in the quarter. Soybean transported volume increased by 34.1% due to
the shipment of the crop, which lasted until mid-3Q15 on account of heavy rainfall during the period,
which delayed harvest. Crop transported volume grew 13.5%, due to higher exports on account of
favorable price and demand conditions. Sugar transported volumes decreased by 7.8%, due to adverse
price and demand conditions for the commodity in the beginning of the crop season.
Volume of industrial products decreased by 26.8% due to: (i) lower demand for fuels, reflecting the
slowdown in economic activity and the fuel transportation stoppage of Malha Oeste; (ii) the 15.5% drop in
the volume of forest products caused by the interruption of certain flows and the temporary shutdown of a
plant of an important client; (iii) operational problems in Rio Grande do Sul and Paraná, which restricted
circulation in a few stretches, reducing the availability of routes; and (iv) heavy rainfall in the beginning of
the quarter, which affected our port operations in the South region.
3Q15 3Q14 Chg. %
Financial Results 9M15 9M14 Chg. %
Combined (Amounts in R$ MM) Combined Combined
317.9 290.4 9.5% Net Operating Revenue 866.9 884.0 -1.9%
317.9 290.4 9.5% Transportation 866.9 884.0 -1.9%
224.5 182.6 22.9% Agricultural Products 597.9 557.7 7.2%
93.4 107.8 -13.3% Industrial Products 269.0 326.3 -17.6%
(272.6) (210.5) 29.5% Costs of Services (721.0) (661.8) 8.9%
45.3 79.9 -43.3% Gross Profit 145.8 222.2 -34.4%
14.3% 27.5% -13.3 p.p. Gross Margin (%) 16.8% 25.1% -8.3 p.p.
(14.3) (12.0) 19.2% Selling, General and Administrative Expenses (52.0) (43.6) 19.1%
3.6 5.8 -37.8% Other Operational Revenues (Expenses) and Equity Pickup
(3.1) 4.6 n/a
50.4 45.2 11.5% Depreciation and Amortization 145.0 137.8 5.2%
85.0 118.9 -28.5% Total EBITDA 235.8 321.0 -26.6%
26.7% 40.9% -14.2 p.p. EBITDA Margin (%) 27.2% 36.3% -9.1 p.p.
Net revenues from South Operations totaled R$317.9 million in 3Q15, up 9.5% from 3Q14. This
growth reflects the 18.4% increase in average yield, which reached R$82.7/thousand RTK due to the increase in the price for transporting agricultural products in the Central Corridor of Paraná, which connects the North of Paraná to the Port of Paranaguá. Note that in 3Q14, the Company reduced yields to gain market share due to a scenario of weak demand and low road freight prices. Cost of services provided increased by 29.5% to R$272.6 million in 3Q15. This increase mainly
reflects the hike in maintenance and personnel costs (R$47.9 million) resulting from changes in the criteria adopted by the Company since 2Q15. The decrease of 28.5% in EBITDA from South Operations, which totaled R$85.0 million, is mainly
due to lower transported volumes of industrial goods (24.9%) and higher costs, particularly because of higher maintenance and personnel costs.

73 of 85
Earnings Release 3rd Quarter of 2015
Container Operations
3Q15 3Q14
Chg. % Operational Figures 9M15 9M14
Chg. %
Combined Combined Combined
19,285 20,678 -6.7% Total Volume (Containers '000) 59,845 55,538 7.8%
3.5 3.6 -2.9% Average Yield (R$ '000/containers) 4.0 3.8 3.6%
524 584 -10.2% Total Volume (millions RTK) 1,631 1,615 1.0%
The volume of transported containers decreased by 6.7% in 3Q15, equivalent to a 10.2% drop in RTK (60 million RTK). This decrease is due to lower transported volumes in the Rio Grande do Sul and
Mercosur corridors, as well as the loss of a major client in the refrigerated container segment in 2Q15.
3Q15 3Q14 Chg. % Financial Results 9M15 9M14 Chg. %
Combined
(Amounts in R$ MM) Combined Combined
67.5 74.5 -9.5% Net Operating Revenue 236.7 211.9 11.7%
(90.3) (80.7) 12.0% Costs of Services (276.1) (223.8) 23.4%
(22.9) (6.2) n/a Gross Profit (39.5) (11.9) n/a
-33.9% -8.3% -25.6 p.p. Gross Margin (%) -16.7% -5.6% -11.1 p.p.
(15.2) (9.3) 62.4% Selling, General and Administrative Expenses (43.0) (37.0) 16.2%
0.0 2.8 -98.7% Other Operational Revenues (Expenses) and Equity Pickup
1.7 8.1 -78.4%
14.5 12.9 12.2% Depreciation and Amortization 44.3 38.7 14.4%
(23.5) 0.2 n/a Total EBITDA (36.5) (2.1) n/a
-34.9% 0.2% -35.1 p.p. EBITDA Margin (%) -15.4% -1.0% -14.4 p.p.
Net revenues reached R$67.5 million in 3Q15, due to the lower volume of containers handled and the
2.9% decrease in average yield. Cost of services provided increased 12.0% compared to 3Q14, reaching R$90.3 million. This
increase is primarily due to the increase in variable costs at some ports operated by Brado, and to the higher fixed cost when compared to 3Q14. EBITDA from Container Operations was a loss of R$23.5 million, impacted by the increase in costs
and expenses in the period.

74 of 85
Earnings Release 3rd Quarter of 2015
5. Other Result Items
Breakdown of Costs of Services Provided
3Q15 3Q14 Chg. %
Consolidated Costs 9M15 9M14 Chg. %
Combined (Amounts in R$ MM) Combined Combined
(921.4) (709.8) 29.8% Costs of Services (2,390.0) (2,017.0) 18.5%
(202.8) (191.3) 6.0% Fuels and Lubricants (539.8) (473.5) 14.0%
(193.0) (173.5) 11.3% Depreciation and Amortization (538.1) (510.9) 5.3%
(170.6) (146.0) 16.8% Logistics Cost (358.9) (323.4) 11.0%
(70.7) (6.7) n/a Maintenance (parts and services) (148.4) (25.5) n/a
(112.1) (89.2) 25.7% Payroll Expenses (324.3) (270.9) 19.7%
(47.5) (43.5) 9.1% Leasing and Concession (141.0) (136.3) 3.4%
(14.6) (15.2) -3.7% Operational Leasing (40.2) (49.8) -19.2%
(29.6) (16.9) 75.6% Third Paties Services (65.1) (67.0) -2.9%
(80.5) (27.5) n/a Other Operational Costs (234.3) (159.7) 46.7%
Consolidated cost of services provided increased by 29.8% in 3Q15 to R$921.4 million, due to: (i)
higher spending on diesel and lubricants due to the increase in average prices between the periods (ANP: +14.1% diesel), as well as higher volumes consumed, which were partially offset by lower unit consumption of diesel of the new locomotives; (ii) higher depreciation and amortization costs due to the revision of the useful life of assets; (iii) higher logistics costs due to the use of road transportation and other railroads to transport certain cargo; and (ii) higher maintenance and personnel costs (+R$88.9 million) following the new criteria adopted by the Company in 2Q15.
Financial Result
3Q15 3Q14 Chg. %
Financial Results 9M15 9M14 Chg. %
Combined (Amounts in R$ MM) Combined Combined
(194.0) (188.2) 3.1% Gross Banking Debt Charges (589.3) (524.5) 12.4%
71.7 0.9 n/a Gain (loss) with derivatives 109.4 6.9 n/a
(139.0) (6.9) n/a Exchange Rate Variation (222.6) (19.7) n/a
32.0 89.1 -64.1% Income from Financial Investments 112.2 208.8 -46.3%
(229.3) (105.1) n/a (=) Subtotal: Net Banking Debt Interests (590.3) (328.5) 79.7%
(62.5) (42.9) 45.7% Monetary variation on lease and concession agreements (166.2) (81.2) n/a
(107.7) (118.2) -8.9% Lease interest and other monetary variation (307.5) (416.0) -26.1%
(399.5) (266.2) 50.1% (=) Financial, Net (1,064.0) (825.7) 28.9%
The financial result in 3Q15 reflects a 50.0% increase in expenses compared to 3Q14, due to: (i)
the increase in gross debt charges following the increase in the outstanding balance and the hike in interest rates (CDI and TJLP) between the periods; (ii) lower returns from financial investments caused by the reduction in the average balance of financial investments, despite the hike in interest rates (CDI); and (iii) the negative impact of approximately R$ 70 million (non-cash) from fixed to floating interest rate swap due to the increase of CDI future curve. Monetary variation on leasing and concession agreements reflects the update (SELIC) of the unpaid concession amounts of the Malha Oeste and Malha Paulista, which are currently under litigation.
Income Tax and Social Contribution
3Q15 3Q14 Chg. %
Income Tax and Social Contribution 9M15 9M14 Chg. %
Combined (Amounts in R$ MM) Combined Combined
(43.0) 89.6 n/a Income (loss) before income tax (158.7) 207.5 n/a
34% 34% n/a Theoretical rate - income tax 34% 34% n/a
14.6 (30.5) n/a Income Theoretical Tax Expenses -
Adjustments to calculate the effective rate
(26.6) (20.9) 27.4% Tax losses not recognized³ (153.4) (67.1) n/a
- 28.9 n/a Recognition of fiscal credits from previous years
- 74.3 n/a
11.9 2.8 n/a The operating profit of North Network4 29.4 32.4 -9.4%
2.1 2.1 -2.4% Other effects 0.7 (10.7) n/a
1.9 (17.6) n/a Income Tax Expenses (69.4) (41.7) 66.6%
-4.5% -19.6% 15.2 p.p. Effective rate - current (%) 0.4 (0.2) 63.8 p.p.
Note 3: We did not constitute IR / CS deferred tax losses from specific companies due to the lack of future taxable income to compensate them. Note 4: On May 30, 2014, the North Network was granted with the extension of the right to a 75% reduction of income tax and surcharges until 2023 (SUDAM benefit).

75 of 85
Earnings Release 3rd Quarter of 2015
6. Loans and financing
Total gross bank debt at the end of 3Q15 was R$8.3 billion, up 4.3% from 2Q15 and implying a net debt/EBITDA of 4.85x considering an EBITDA of R$1,503.8 million in the last 12 months.
The main transactions during the quarter were the raising of (i) R$196.8 million through a bank credit
note (CCB); (ii) R$72 million (USD 23 million) of Loan Operation 4131; (iii) R$100 million through Export
Credit Note (NCE); and (iv) R$218 million under the FINAME facility. In addition we had total
amortizations of R$384.2 million in FINEM, FINAME, NCE, Debentures and working capital lines.
The 3.0% increase in the net debt balance is due to the net funding in the quarter, as described
above, as well as provision for interest and payments made. All the foreign currency-denominated
debt of Rumo ALL is hedged against exchange variations.
Total Banking Indebtness 3Q15 2Q15 Chg. %
(Amounts in R$ MM)
Commercial Banks 821.7 539.7 52.3%
NCE 864.4 832.1 3.9%
BNDES 3,690.4 3,624.1 1.8%
Debentures 2,935.2 2,970.0 -1.2%
Total Banking Debt 8,311.7 7,965.9 4.3%
Cash and Cash Equivalents and Secutities (948.7) (874.8) 8.5%
Net Derivatives Instruments (68.7) (12.5) n/a
Net Banking Debt 7,294.2 7,078.6 3.0%
EBITDA LTM 1,503.8 1,425.6 5.5%
Leverage (Net Banking Debt / EBITDA LTM) 4.85x 4.97x
The following table is a breakdown of the items that impacted the cash position and consolidated debt transactions of Rumo ALL.
Indebtedness (Amounts in R$ MM)
3Q15
Opening Balance of Gross Debt Rumo ALL (2Q15) 7,965.9
Cash and cash equivalents and marketable securities (2Q15) (874.8)
Bank Net Indebtedness (Net of MTM) (2Q15) 7,091.1
0.0%
Items with impact on cash 11.1
Funding 586.8
Amortization of principal (384.2)
Amortization of interest rates (191.5)
Items without impact on cash 334.7
Provision for interest rates (accrual) 194.0
Monetary variation 1.6
Exchange rate variation 139.0
Closing balance of gross indebtedness (3Q15) 8,311.7
Cash and cash equivalents and marketable securities (3Q15) (948.7)
Closing Balance of Bank Net Debt Rumo ALL (3Q15) 7,363.0
Rumo ALL has covenants in most of its loans and financing agreements, based on specific
financial and non-financial indicators. The financial indicators are: (i) consolidated net bank
debt/EBITDA; (ii) EBITDA/consolidated financial result (considering only interest on debentures,
loans/financing and hedge operations); (iii) shareholders' equity/net assets. We note that item (iii) is
exclusive for BNDES. For all our loans and financing agreements with the exception of BNDES, that
requires annual measurements, we have to calculate all those indicators every quarter as of the date of
the financial statements, using the consolidated results.
As mentioned in ALL's earnings results of December 2014, the net debt/EBITDA covenants were
renegotiated to 5.5 times with all creditors, except with the BNDES. The bank, however, which has until
now only granted consent to the non-compliance with covenants on December 31, 2014 thus far. We are
discussing those covenants with the BNDES, applying to the fiscal year ending on December 31, 2015.
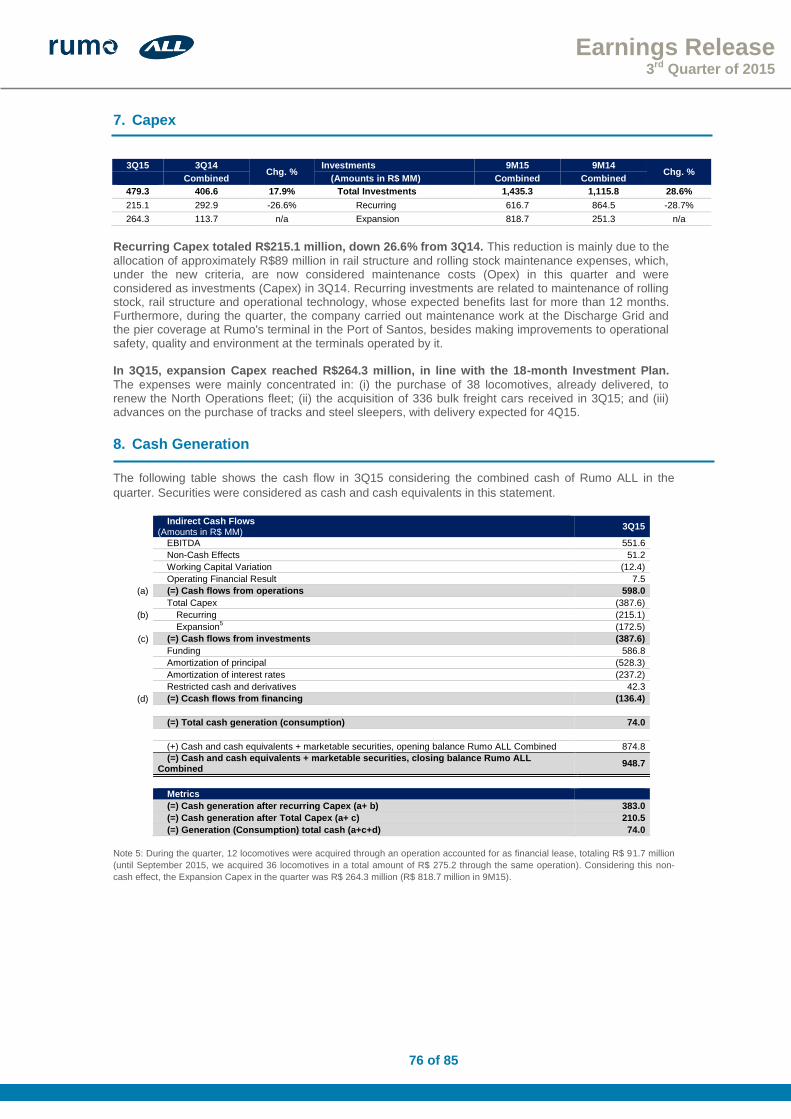
76 of 85
Earnings Release 3rd Quarter of 2015
7. Capex
3Q15 3Q14 Chg. %
Investments 9M15 9M14 Chg. %
Combined (Amounts in R$ MM) Combined Combined
479.3 406.6 17.9% Total Investments 1,435.3 1,115.8 28.6%
215.1 292.9 -26.6% Recurring 616.7 864.5 -28.7%
264.3 113.7 n/a Expansion 818.7 251.3 n/a
Recurring Capex totaled R$215.1 million, down 26.6% from 3Q14. This reduction is mainly due to the
allocation of approximately R$89 million in rail structure and rolling stock maintenance expenses, which, under the new criteria, are now considered maintenance costs (Opex) in this quarter and were considered as investments (Capex) in 3Q14. Recurring investments are related to maintenance of rolling stock, rail structure and operational technology, whose expected benefits last for more than 12 months. Furthermore, during the quarter, the company carried out maintenance work at the Discharge Grid and the pier coverage at Rumo's terminal in the Port of Santos, besides making improvements to operational safety, quality and environment at the terminals operated by it. In 3Q15, expansion Capex reached R$264.3 million, in line with the 18-month Investment Plan.
The expenses were mainly concentrated in: (i) the purchase of 38 locomotives, already delivered, to renew the North Operations fleet; (ii) the acquisition of 336 bulk freight cars received in 3Q15; and (iii) advances on the purchase of tracks and steel sleepers, with delivery expected for 4Q15.
8. Cash Generation
The following table shows the cash flow in 3Q15 considering the combined cash of Rumo ALL in the
quarter. Securities were considered as cash and cash equivalents in this statement.
Indirect Cash Flows (Amounts in R$ MM)
3Q15
EBITDA 551.6
Non-Cash Effects 51.2
Working Capital Variation (12.4)
Operating Financial Result 7.5
(a) (=) Cash flows from operations 598.0
Total Capex (387.6)
(b) Recurring (215.1)
Expansion
5 (172.5)
(c) (=) Cash flows from investments (387.6)
Funding 586.8
Amortization of principal (528.3)
Amortization of interest rates (237.2)
Restricted cash and derivatives 42.3
(d) (=) Ccash flows from financing (136.4)
(=) Total cash generation (consumption) 74.0
(+) Cash and cash equivalents + marketable securities, opening balance Rumo ALL Combined 874.8
(=) Cash and cash equivalents + marketable securities, closing balance Rumo ALL Combined
948.7
Metrics
(=) Cash generation after recurring Capex (a+ b) 383.0
(=) Cash generation after Total Capex (a+ c) 210.5
(=) Generation (Consumption) total cash (a+c+d) 74.0
Note 5: During the quarter, 12 locomotives were acquired through an operation accounted for as financial lease, totaling R$ 91.7 million
(until September 2015, we acquired 36 locomotives in a total amount of R$ 275.2 through the same operation). Considering this non-
cash effect, the Expansion Capex in the quarter was R$ 264.3 million (R$ 818.7 million in 9M15).
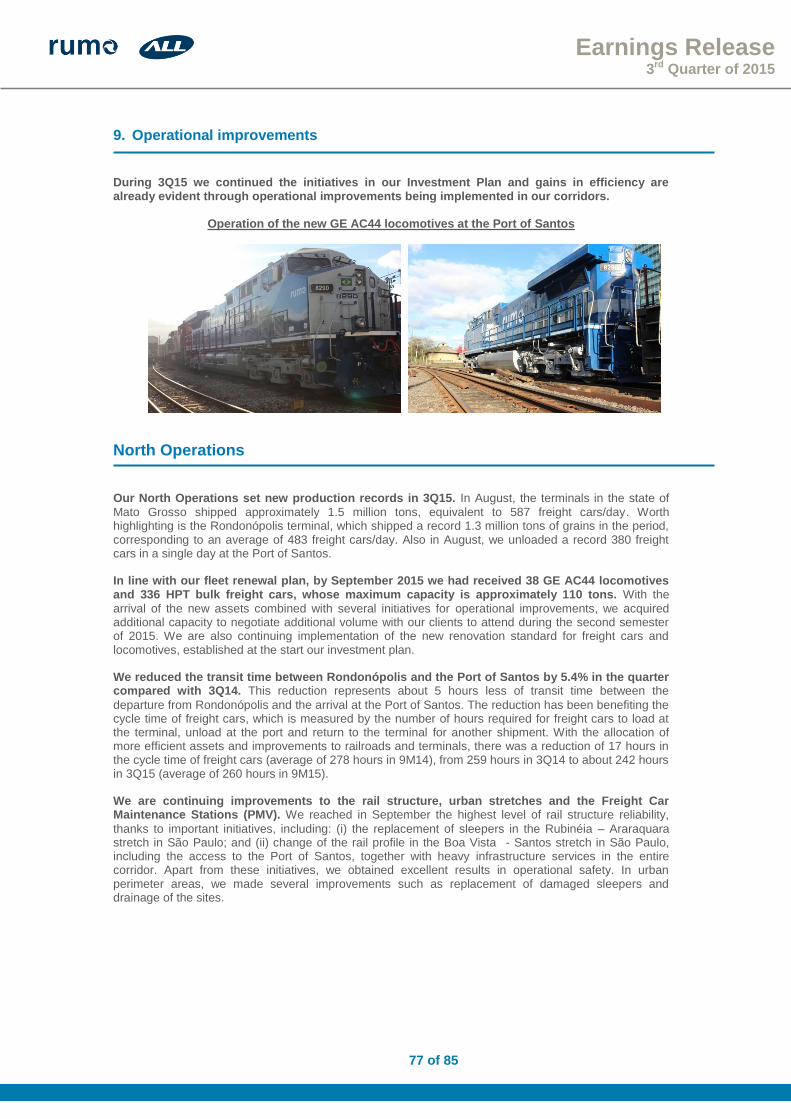
77 of 85
Earnings Release 3rd Quarter of 2015
9. Operational improvements
During 3Q15 we continued the initiatives in our Investment Plan and gains in efficiency are already evident through operational improvements being implemented in our corridors.
Operation of the new GE AC44 locomotives at the Port of Santos
North Operations Our North Operations set new production records in 3Q15. In August, the terminals in the state of
Mato Grosso shipped approximately 1.5 million tons, equivalent to 587 freight cars/day. Worth highlighting is the Rondonópolis terminal, which shipped a record 1.3 million tons of grains in the period, corresponding to an average of 483 freight cars/day. Also in August, we unloaded a record 380 freight cars in a single day at the Port of Santos. In line with our fleet renewal plan, by September 2015 we had received 38 GE AC44 locomotives and 336 HPT bulk freight cars, whose maximum capacity is approximately 110 tons. With the
arrival of the new assets combined with several initiatives for operational improvements, we acquired additional capacity to negotiate additional volume with our clients to attend during the second semester of 2015. We are also continuing implementation of the new renovation standard for freight cars and locomotives, established at the start our investment plan. We reduced the transit time between Rondonópolis and the Port of Santos by 5.4% in the quarter compared with 3Q14. This reduction represents about 5 hours less of transit time between the
departure from Rondonópolis and the arrival at the Port of Santos. The reduction has been benefiting the cycle time of freight cars, which is measured by the number of hours required for freight cars to load at the terminal, unload at the port and return to the terminal for another shipment. With the allocation of more efficient assets and improvements to railroads and terminals, there was a reduction of 17 hours in the cycle time of freight cars (average of 278 hours in 9M14), from 259 hours in 3Q14 to about 242 hours in 3Q15 (average of 260 hours in 9M15). We are continuing improvements to the rail structure, urban stretches and the Freight Car Maintenance Stations (PMV). We reached in September the highest level of rail structure reliability,
thanks to important initiatives, including: (i) the replacement of sleepers in the Rubinéia – Araraquara stretch in São Paulo; and (ii) change of the rail profile in the Boa Vista - Santos stretch in São Paulo, including the access to the Port of Santos, together with heavy infrastructure services in the entire corridor. Apart from these initiatives, we obtained excellent results in operational safety. In urban perimeter areas, we made several improvements such as replacement of damaged sleepers and drainage of the sites.
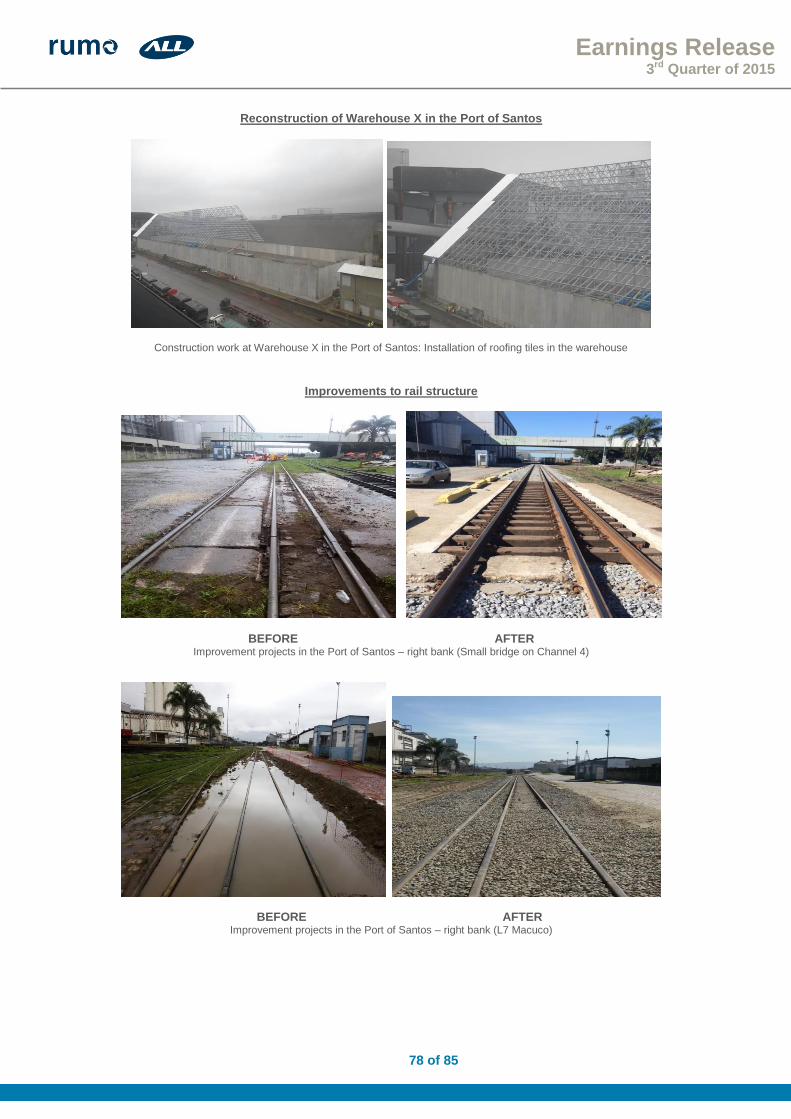
78 of 85
Earnings Release 3rd Quarter of 2015
Reconstruction of Warehouse X in the Port of Santos
Construction work at Warehouse X in the Port of Santos: Installation of roofing tiles in the warehouse
Improvements to rail structure
BEFORE AFTER Improvement projects in the Port of Santos – right bank (Small bridge on Channel 4)
BEFORE AFTER Improvement projects in the Port of Santos – right bank (L7 Macuco)
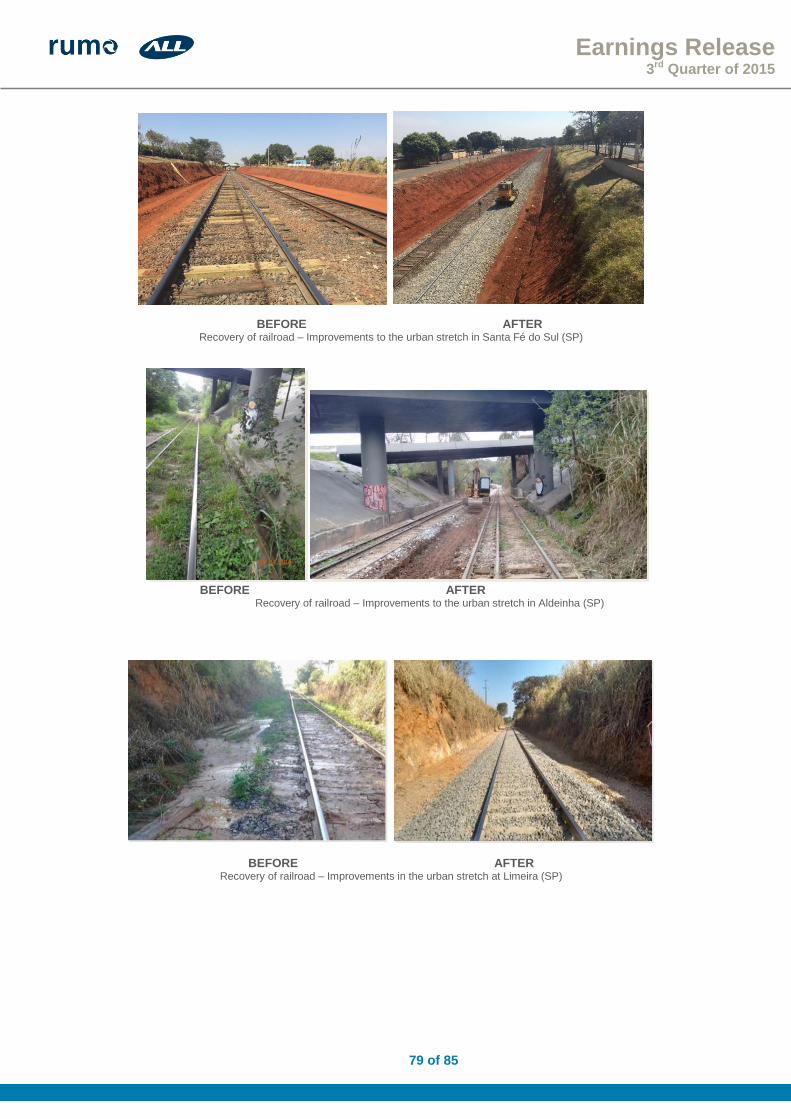
79 of 85
Earnings Release 3rd Quarter of 2015
BEFORE AFTER Recovery of railroad – Improvements to the urban stretch in Santa Fé do Sul (SP)
BEFORE AFTER Recovery of railroad – Improvements to the urban stretch in Aldeinha (SP)
BEFORE AFTER Recovery of railroad – Improvements in the urban stretch at Limeira (SP)

80 of 85
Earnings Release 3rd Quarter of 2015
South Operations
Continuing with our fleet renewal plan, in September we received 86 HPE bulk freight cars (of a total of 377 freight cars acquired in the beginning of the year). Each freight car has maximum cargo
capacity of 78 tons, while the previous average per freight car was 66 tons. The cars are already transporting sugar on the stretch connecting the North of Paraná to the Port of Paranaguá, the main corridor of our South Operations. We should begin the operation of the new ES43 BBi locomotive in early 2016. This model was
designed for the meter gauge and is the first locomotive with 8 axles, making it powerful and resistant to steep inclines, narrow tunnels and sharp bends. Already in 2015 we should start tests and training on this asset for drivers and maintenance crews. The model was designed by GE exclusively for the South Corridor, where most of the stretches have narrow gauges. At the Port of Paranaguá, we resumed operations in a major bulk terminal. Work on renovation of
the lines at the terminal, starting from km 5 to the railway loop at the Port and the public silo line, is expected to be completed by the beginning of 2016. These initiatives will increase our unloading capacity to up to 300 freight cars/day, of the terminal’s total capacity of 450 of freight cars/day. The renovation work in progress also includes extension of lines and replacement of tracks and sleepers in the urban perimeter areas of Maringá and Londrina, in order to improve circulation in these stretches.
Improvements in the Port of Paranaguá
BEFORE AFTER
BEFORE AFTER Remodeling of railroads in an important bulk terminal in the Port of Paranaguá
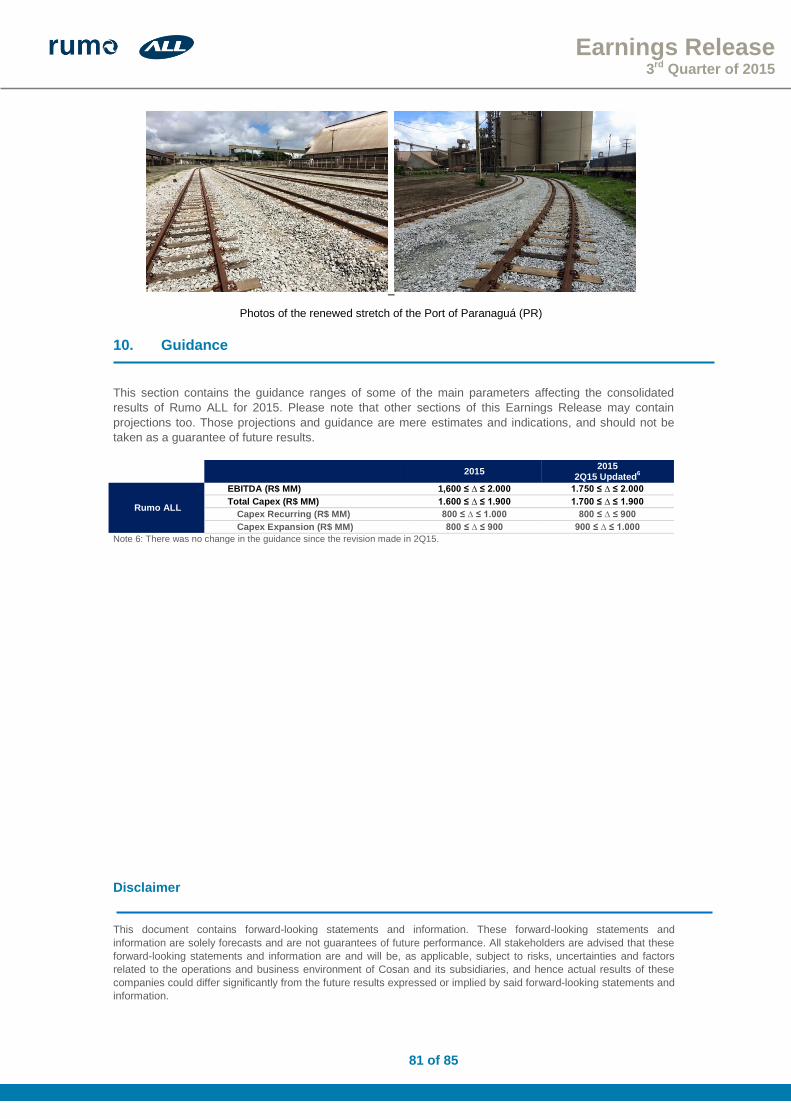
81 of 85
Earnings Release 3rd Quarter of 2015
Photos of the renewed stretch of the Port of Paranaguá (PR)
10. Guidance
This section contains the guidance ranges of some of the main parameters affecting the consolidated
results of Rumo ALL for 2015. Please note that other sections of this Earnings Release may contain
projections too. Those projections and guidance are mere estimates and indications, and should not be
taken as a guarantee of future results.
2015
2015 2Q15 Updated
6
Rumo ALL
EBITDA (R$ MM) 1,600 ≤ ∆ ≤ 2.000 1.750 ≤ ∆ ≤ 2.000
Total Capex (R$ MM) 1.600 ≤ ∆ ≤ 1.900 1.700 ≤ ∆ ≤ 1.900
Capex Recurring (R$ MM) 800 ≤ ∆ ≤ 1.000 800 ≤ ∆ ≤ 900
Capex Expansion (R$ MM) 800 ≤ ∆ ≤ 900 900 ≤ ∆ ≤ 1.000
Note 6: There was no change in the guidance since the revision made in 2Q15.
Disclaimer
This document contains forward-looking statements and information. These forward-looking statements and
information are solely forecasts and are not guarantees of future performance. All stakeholders are advised that these
forward-looking statements and information are and will be, as applicable, subject to risks, uncertainties and factors
related to the operations and business environment of Cosan and its subsidiaries, and hence actual results of these
companies could differ significantly from the future results expressed or implied by said forward-looking statements and
information.

82 of 85
Earnings Release 3rd Quarter of 2015
11. Appendices 11.1 Financial Statements of Rumo ALL
11.1.1 Balance Sheet Balance Sheet 06.30.2015 09.30.2015
(Amounts in R$ MM) Rumo ALL Rumo ALL
Current
Cash and cash equivalents 340.3 69.7
Securities 534.4 879.0
Trade receivables 157.0 185.6
Inventories 106.8 190.9
Peer company receivables 20.2 24.9
Income tax and social contribution 42.4 22.3
Other taxes recoverable 312.0 234.4
Dividends and interest on capital - -
Other assets 86.2 81.3
1,599.3 1,688.1
Non-current
Trade receivables 83.9 22.6
Restricted cash 148.3 92.6
Deferred income tax and social contribution 1,344.7 1,380.3
Income tax and social contribution 166.3 223.7
Other taxes recoverable 473.1 528.5
Judicial deposits 357.5 345.6
Derivative financial instruments 13.9 81.0
Other assets 141.3 187.3
Investments 41.1 45.3
Property and equipment 8,813.9 9,122.4
Intangible 7,801.4 7,784.8
19,385.4 19,814.3
Total Assets 20,984.7 21,502.4
Current
Borrowings 1,094.3 1,398.9
Leases 443.4 537.0
Advances on real estate credits 143.3 108.7
Derivative financial instruments 1.4 12.3
Trade accounts payable 701.8 745.9
Labor and social security obligations 134.4 170.8
Taxes and social security contributions payable 11.8 9.3
Other payable taxes 25.8 27.8
Leases and concessions 19.3 19.5
Dividends and interest on capital 8.3 8.2
Related parts 16.7 85.1
Tax installments - -
Deferred revenue 107.3 107.3
Other payables 195.4 192.5
2,903.2 3,423.3
Non - current
Borrowings 6,871.5 6,912.8
Leases 1,350.3 1,286.6
Advances on real estate credits 177.1 197.4
Derivative financial instruments 24.3 -
Leases and concessions 2,030.2 2,114.4
Provision for lawsuits 569.4 561.6
Taxes and social security contributions payable 2,714.8 2,720.3
Deferred income tax and social contribution 19.6 -
Deferred revenue 108.2 104.5
Other payables 162.2 176.6
14,027.6 14,074.3
Equity 4,053.8 4,004.8
Total Liabilities 20,984.6 21,502.4

83 of 85
Earnings Release 3rd Quarter of 2015
11.1.2 Income Statement 3Q15 3Q14
Chg. % Consolidated 9M15 9M14
Chg. %
Combined (Amounts in R$ MM) Combined Combined 1,357.7 1,111.1 22,2% Net Operating Revenue 3,548.2 3,247.8 9.2%
436.3 401.3 8.7% Gross profit 1,158.1 1,230.8 -5.9%
(95.2) (67.2) 41.6% Sales, General and Administrative Expenses (278.1) (226.0) 23.0%
11.1 16.4 -31.9% Other Operating Income (Expenses), Net 21.1 18.1 16.4%
(399.4) (266.3) 50.0% Net financial result (1,064.1) (825,8) 28.9%
4.1 5.5 -25.7% Equity Pickup 3.6 10.5 -65.5%
1.9 (17.6) n/a Income Tax and Social Contribution (69.4) (31.1) n/a
(2.6) (3.9) -33.6% Discontinued Operations (8.7) (8.8) -0.6%
(43.7) 68.2 n/a Net Profit (losses) (237.5) 167.6 n/a
11.1.3 Cash Flow Cash Flow (Accounting) Rumo ALL
(Amounts in R$ MM) 3Q15 3Q14 9M15 9M14
Cash flow from operating activities
Profit before income tax and social contribution (43.0) 57.7 50.6 139.7
Adjustments:
Depreciation and amortization 195.3 25.7 398.9 70.4
Equity (4.1) - (4.3) -
Provision for interest in the results of investees 24.0 3.5 45.0 6.6
Gain on disposal of declared dividends 2.7 - 3.5 0.0
Loss (gaing) on disposal of permanent assets (46.4) 0.6 (40.1) 1.0
Provision (reversal) for losses on doubtful accounts (0.4) - 0.4 (0.7)
Others 82.2 - 97.0 -
Interest, monetary and exchange variations, net 407.0 10.7 767.9 29.8
617.2 98.1 1,318.9 246.8
Variation in:
Accounts receivable 1.3 (79.5) (39.7) (150.8)
Advances from customers 7.1 (2.6) (13.7) (0.1)
Judicial deposits 13.5 (0.4) (2.7) (20.7)
Related parties 181.0 0.8 150.8 11.3
Taxes and contributions recoverable 4.0 11.8 0.7 3.4
Taxes and contributions payable (18.1) (13.8) (43.3) (42.6)
Inventories (64.4) (0.8) (81.1) (0.9)
Labor and social security obligations 12.4 1.4 7.8 (2.8)
Trade accounts payable (96.7) 31.4 (82.2) 31.9
Advances to suppliers (8.1) 0.1 (34.1) (0.1)
Contingencies (8.4) (0.5) (13.9) (0.9)
Other assets and liabilities, net (43.0) (2.4) (68.9) (22.3)
(19.3) (54.5) (220.3) (194.4)
Cash generated by (used in) operations 597.9 43.6 1,098.5 52.4
Cash flow from investing activities
Addition to property, software and other intangibles (387.6) (85.6) (890.2) (183.3)
Securities (344.6) - (161.4) -
Restricted cash 55.7 - 130.4 -
Net cash acquired in business acquisition - - 169.7 -
Cash generated by (used in) investing activities (676.5) (85.6) (751.4) (183.3)
Cash flow from financing activities
Borrowings 586.8 80.0 2,537.9 87.6
Payment of borrowings (528.3) (27.8) (2,053.6) (76.8)
Payment of interest on borrowings (237.2) (10.9) (553.4) (30.8)
Derivative financial instruments (11.9) - 7.7 -
Dividends payable (1.5) (125.0) (301.5) (250.0)
Cash generated by (used in) financing activities (192.1) (83.6) (362.9) (270.1)
Increase (decrease) in cash and cash equivalents (270.6) (125.6) (15.8) (401.0)
Beginning balance of cash and cash equivalents 340.3 222.4 85.5 497.8
Final balance of cash and cash equivalents 69.7 96.8 69.7 96.8
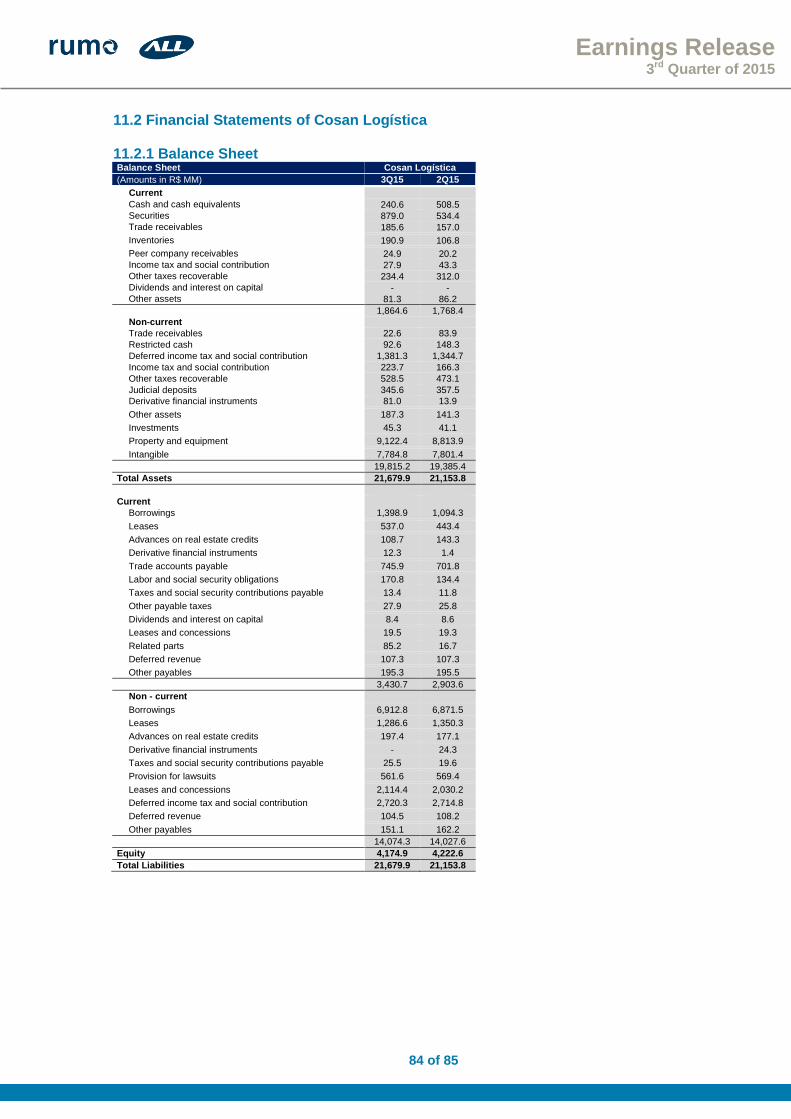
84 of 85
Earnings Release 3rd Quarter of 2015
11.2 Financial Statements of Cosan Logística 11.2.1 Balance Sheet Balance Sheet Cosan Logística
(Amounts in R$ MM) 3Q15 2Q15
Current
Cash and cash equivalents 240.6 508.5
Securities 879.0 534.4
Trade receivables 185.6 157.0
Inventories 190.9 106.8
Peer company receivables 24.9 20.2
Income tax and social contribution 27.9 43.3
Other taxes recoverable 234.4 312.0
Dividends and interest on capital - -
Other assets 81.3 86.2
1,864.6 1,768.4
Non-current
Trade receivables 22.6 83.9
Restricted cash 92.6 148.3
Deferred income tax and social contribution 1,381.3 1,344.7
Income tax and social contribution 223.7 166.3
Other taxes recoverable 528.5 473.1
Judicial deposits 345.6 357.5
Derivative financial instruments 81.0 13.9
Other assets 187.3 141.3
Investments 45.3 41.1
Property and equipment 9,122.4 8,813.9
Intangible 7,784.8 7,801.4
19,815.2 19,385.4
Total Assets 21,679.9 21,153.8
Current
Borrowings 1,398.9 1,094.3
Leases 537.0 443.4
Advances on real estate credits 108.7 143.3
Derivative financial instruments 12.3 1.4
Trade accounts payable 745.9 701.8
Labor and social security obligations 170.8 134.4
Taxes and social security contributions payable 13.4 11.8
Other payable taxes 27.9 25.8
Dividends and interest on capital 8.4 8.6
Leases and concessions 19.5 19.3
Related parts 85.2 16.7
Deferred revenue 107.3 107.3
Other payables 195.3 195.5
3,430.7 2,903.6
Non - current
Borrowings 6,912.8 6,871.5
Leases 1,286.6 1,350.3
Advances on real estate credits 197.4 177.1
Derivative financial instruments - 24.3
Taxes and social security contributions payable 25.5 19.6
Provision for lawsuits 561.6 569.4
Leases and concessions 2,114.4 2,030.2
Deferred income tax and social contribution 2,720.3 2,714.8
Deferred revenue 104.5 108.2
Other payables 151.1 162.2
14,074.3 14,027.6
Equity 4,174.9 4,222.6
Total Liabilities 21,679.9 21,153.8
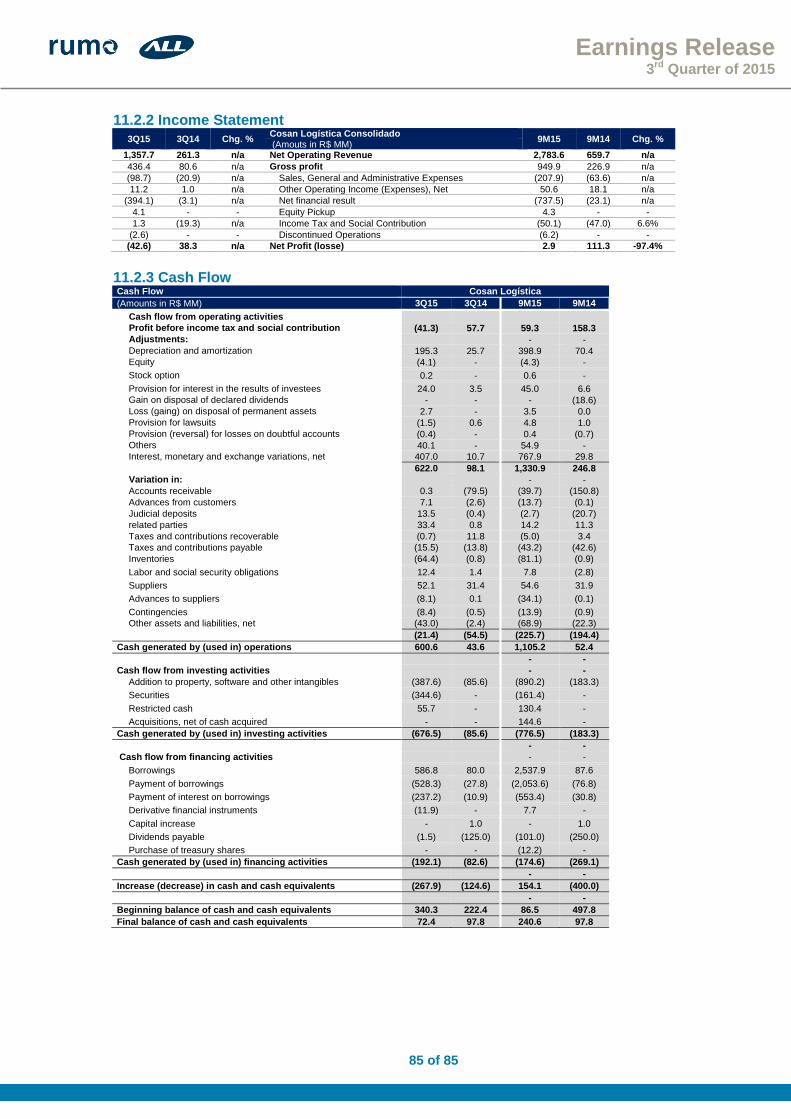
85 of 85
Earnings Release 3rd Quarter of 2015
11.2.2 Income Statement
3Q15 3Q14 Chg. % Cosan Logística Consolidado
9M15 9M14 Chg. % (Amouts in R$ MM)
1,357.7 261.3 n/a Net Operating Revenue 2,783.6 659.7 n/a
436.4 80.6 n/a Gross profit 949.9 226.9 n/a
(98.7) (20.9) n/a Sales, General and Administrative Expenses (207.9) (63.6) n/a
11.2 1.0 n/a Other Operating Income (Expenses), Net 50.6 18.1 n/a
(394.1) (3.1) n/a Net financial result (737.5) (23.1) n/a
4.1 - - Equity Pickup 4.3 - -
1.3 (19.3) n/a Income Tax and Social Contribution (50.1) (47.0) 6.6%
(2.6) - - Discontinued Operations (6.2) - -
(42.6) 38.3 n/a Net Profit (losse) 2.9 111.3 -97.4%
11.2.3 Cash Flow Cash Flow Cosan Logística
(Amounts in R$ MM) 3Q15 3Q14 9M15 9M14
Cash flow from operating activities
Profit before income tax and social contribution (41.3) 57.7 59.3 158.3
Adjustments:
- -
Depreciation and amortization 195.3 25.7 398.9 70.4
Equity (4.1) - (4.3) -
Stock option 0.2 - 0.6 -
Provision for interest in the results of investees 24.0 3.5 45.0 6.6
Gain on disposal of declared dividends - - - (18.6)
Loss (gaing) on disposal of permanent assets 2.7 - 3.5 0.0
Provision for lawsuits (1.5) 0.6 4.8 1.0
Provision (reversal) for losses on doubtful accounts (0.4) - 0.4 (0.7)
Others 40.1 - 54.9 -
Interest, monetary and exchange variations, net 407.0 10.7 767.9 29.8
622.0 98.1 1,330.9 246.8
Variation in:
- -
Accounts receivable 0.3 (79.5) (39.7) (150.8)
Advances from customers 7.1 (2.6) (13.7) (0.1)
Judicial deposits 13.5 (0.4) (2.7) (20.7)
related parties 33.4 0.8 14.2 11.3
Taxes and contributions recoverable (0.7) 11.8 (5.0) 3.4
Taxes and contributions payable (15.5) (13.8) (43.2) (42.6)
Inventories (64.4) (0.8) (81.1) (0.9)
Labor and social security obligations 12.4 1.4 7.8 (2.8)
Suppliers 52.1 31.4 54.6 31.9
Advances to suppliers (8.1) 0.1 (34.1) (0.1)
Contingencies (8.4) (0.5) (13.9) (0.9)
Other assets and liabilities, net (43.0) (2.4) (68.9) (22.3)
(21.4) (54.5) (225.7) (194.4)
Cash generated by (used in) operations 600.6 43.6 1,105.2 52.4
- -
Cash flow from investing activities
- -
Addition to property, software and other intangibles (387.6) (85.6) (890.2) (183.3)
Securities (344.6) - (161.4) -
Restricted cash 55.7 - 130.4 -
Acquisitions, net of cash acquired - - 144.6 -
Cash generated by (used in) investing activities (676.5) (85.6) (776.5) (183.3)
- -
Cash flow from financing activities
- -
Borrowings 586.8 80.0 2,537.9 87.6
Payment of borrowings (528.3) (27.8) (2,053.6) (76.8)
Payment of interest on borrowings (237.2) (10.9) (553.4) (30.8)
Derivative financial instruments (11.9) - 7.7 -
Capital increase - 1.0 - 1.0
Dividends payable (1.5) (125.0) (101.0) (250.0)
Purchase of treasury shares - - (12.2) -
Cash generated by (used in) financing activities (192.1) (82.6) (174.6) (269.1)
- -
Increase (decrease) in cash and cash equivalents (267.9) (124.6) 154.1 (400.0)
- -
Beginning balance of cash and cash equivalents 340.3 222.4 86.5 497.8
Final balance of cash and cash equivalents 72.4 97.8 240.6 97.8