russians and the putin-medvedev … did russians expect and want during the 2007–08 election cycle...
TRANSCRIPT

RUSSIANS AND THE PUTIN-MEDVEDEV
“TANDEMOCRACY”
A SURVEY-BASED PORTRAIT OF THE 2007-08 ELECTION
SEASON
Henry E. Hale George Washington University
Timothy J. Colton Harvard University
The National Council for Eurasian and East European Research
University of Washington Box 353650
Seattle, WA 98195
TITLE VIII PROGRAM

Project Information* Principal Investigator: Henry Hale NCEEER Contract Number: 823-03
Date: September 8, 2009 Copyright Information Individual researchers retain the copyright on their work products derived from research funded through a contract or grant from the National Council for Eurasian and East European Research (NCEEER). However, the NCEEER and the United States Government have the right to duplicate and disseminate, in written and electronic form, reports submitted to NCEEER to fulfill Contract or Grant Agreements either (a) for NCEEER’s own internal use, or (b) for use by the United States Government, and as follows: (1) for further dissemination to domestic, international, and foreign governments, entities and/or individuals to serve official United States Government purposes or (2) for dissemination in accordance with the Freedom of Information Act or other law or policy of the United States Government granting the public access to documents held by the United States Government. Neither NCEEER nor the United States Government nor any recipient of this Report may use it for commercial sale.
* The work leading to this report was supported in part by contract or grant funds provided by the National Council for Eurasian and East European Research, funds which were made available by the U.S. Department of State under Title VIII (The Soviet-East European Research and Training Act of 1983, as amended).The analysis and interpretations contained herein are those of the authors.
Executive Summary
What did Russians expect and want during the 2007–08 election cycle that produced the
current “tandemocracy”, joint rule by Dmitry Medvedev (as president) and Vladimir Putin (as
prime minister)? The 2008 wave of the long-running Russian Election Studies (RES) series of
surveys sheds light on this question. Russians supported the United Russia Party and
subsequently Medvedev in significant part because they pledged to persevere with the course set
by Putin, and there is compelling evidence that citizens did not do so blindly and that
Medvedev’s and United Russia’s policy stands are meaningful parts of the story. In fact, more
Russians than not hoped that sooner or later it would be Medvedev rather than Putin at the helm
of Russia’s ship of state, though they did not generally expect this to occur. Because the Russian
leadership has not yet dared to run roughshod over public opinion, close monitoring of the public
mood may provide important clues as to how Russia will behave—and how far it will go to
challenge Western ideals and norms—at home and abroad.

Introduction
The Russian parliamentary and presidential elections of 2007–08 produced what local
pundits dub the “tandemocracy” (tandemokratiia), joint rule by Dmitry Medvedev as president,
or head of state, and Vladimir Putin as prime minister, or head of government. Putin, the
incumbent president since 2000, did honor the Constitution and left office upon the expiration of
his second term. But he also personally led the candidate list of the ruling United Russia party to
a landslide win in the 2007 parliamentary elections, orchestrated the election of his younger
protégé Medvedev as presidential successor, and then assumed the formal leadership of United
Russia. Medvedev closed the circle by nominating Putin to be prime minister, a choice quickly
ratified by the comfortable United Russia majority in parliament. Most observers contend that
Putin continues to call the shots in Russian politics but acknowledge that Medvedev wields
important powers which may enable him eventually to move out from under the shadow of his
patron. The result has been an injection of political uncertainty and, in the interpretation of some,
latent instability.
Is this what Russians expected or wanted during the 2007–08 election cycle? For those
who cast ballots, is this what they voted for, and if so, why? As part of the long-running Russian
Election Studies (RES) series, the authors designed a set of survey questions relevant to these
issues and put them put to a representative sample of the electorate immediately after the cycle
was concluded in 2008.1 In this article, we present an overview of some main results from the
1 Specifically, 1,130 adult Russian citizens were interviewed during the period March 18–May 8. Also participating in the design of the survey were Michael McFaul of Stanford University and our team of Russian experts, led by Mikhail Kosolapov and Polina Kozyreva of the Demoscope group at the Russian Academy of Sciences’ Institute of Sociology. Kosolapov and Kozyreva are academic experts on survey methodology with a long history working with Western political scientists and with publications in leading journals of the American Political Science Association. Their work is thus up to high methodological standards. The RES originated with a joint study by Colton and William Zimmerman of the 1995–96 election cycle.
1

poll, supplemented by our close observation of the campaign.2 We find that although Russians
supported United Russia and subsequently Medvedev in significant part because they pledged to
persevere with the course set by Putin, there is compelling evidence that citizens did not do so
blindly and that Medvedev’s and United Russia’s policy stands are meaningful parts of the story.
In fact, more Russians than not hoped that sooner or later it would be Medvedev rather than
Putin at the helm of Russia’s ship of state, though they did not generally expect this to occur.3
This has implications for foreign policy that we discuss in our conclusion.
Asymmetrical Political Information
During 2007–08, parties and candidates representing the Kremlin establishment won
crushing victories in the official returns. In the December 2, 2007, parliamentary (State Duma)
election, the United Russia Party, with Putin himself as number one on its list of candidates,
captured 64 percent of the popular vote, far more than the Communist Party of the Russian
Federation (KPRF), which came in second with 12 percent. Vladimir Zhirinovsky’s nationalist
Liberal Democratic Party of Russia (LDPR), purportedly an opposition force but one that votes
consistently with the government on make-or-break issues, finished third with 8 percent. The
only other party to clear the 7 percent threshold was A Just Russia (Spravedlivaia Rossiia), a
new entity that claimed to have a socialist agenda but was headed by a longtime Putin associate,
2 For statistical analysis of voting patterns in Russian presidential elections from 1996 to 2008, see Timothy J. Colton and Henry E. Hale, “The Putin Vote: Presidential Electorates in a Hybrid Regime,” Slavic Review, v.68, no.3, Fall 2009, pp.473-503. On previous elections, see Timothy J. Colton, Transitional Citizens: Voters and What Influences Them in the New Russia (Cambridge, MA: Harvard University Press, 2000); Timothy J. Colton and Michael McFaul, Popular Choice and Managed Democracy: The Russian Elections of 1999 and 2000 (Washington, DC: Brookings Institution Press, 2003); Henry E. Hale, Why Not Parties in Russia? Democracy, Federalism, and the State (New York: Cambridge University Press, 2006); Richard Rose and Neil Munro, Elections Without Order (New York: Cambridge University Press, 2002); and Richard Rose, William Mishler, and Neil Munro, Russia Transformed: Development of Popular Support for a New Regime (New York: Cambridge University Press, 2006). 3 The precise questions asked and the basic distribution of responses are available at the website http://hehale5.googlepages.com/ or from the authors.
2

Sergei Mironov, the chairman of the upper chamber of parliament (Federation Council). It netted
just less than 8 percent of the official tally. No other opposition party, including the liberal
Yabloko and Union of Right Forces (SPS), got so much as 3 percent of the vote. The field of
contenders was even tighter in the run-up to the presidential election held on March 2, 2008, as
Medvedev faced only KPRF leader Gennady Zyuganov (the sole true oppositionist in the
contest), the LDPR’s Zhirinovsky, and the obscure Andrei Bogdanov. In the end, Medvedev won
with 70 percent of the officially counted ballots, far ahead of Zyuganov’s 18 percent,
Zhirinovsky’s 9 percent, and Bogdanov’s 1 percent.
Our survey found that Russian citizens as of 2008 were attentive to this and other
political processes, though most did not apply much energy to the enterprise. Over three-quarters
of our poll respondents said they followed politics either all the time (39 percent) or sometimes
(37 percent), but only about half reported having had a conversation about politics with family,
friends, or acquaintances in the seven days prior to the interview.4 Accordingly, only one-fifth of
the adult population reported that they tried to talk someone else into voting for a particular
candidate during the presidential election season. This did not represent a major change from
past practice, however, as the figure was roughly the same in 2000, when Putin first ran for
president. Citizens also had little personal contact with representatives of the contenders, with
only 13 percent reporting that they were approached. This was actually an increase relative to
2000, however, when the RES found that only 5 percent were approached.
Although fairly objective coverage of the campaign could be found here and there in
Russia’s large array of mass media, including on television, people relied mainly on state-
controlled television to obtain their political information. It is certainly true that the media space
3

in Russia during 2007–08 was asymmetrical, heavily tilted in favor of the authorities’ political
views. All three of the big television networks (First Channel, Rossiia, and NTV), as well as
prominent newspapers like Izvestiia and leading magazines like Profil’, gave disproportionate
and positive coverage to Putin, Medvedev, and the United Russia Party during the campaign
cycle. That said, it would be an exaggeration to claim that viewers had no alternatives
whatsoever. Newspapers available for subscription (including Kommersant, Vedomosti, and
Novaia gazeta), political magazines (such as Novoe vremia and Kommersant-Vlast’), and a
multitude of Internet websites (including gazeta.ru and various foreign-run Russian-language
services) all provided reasonably critical coverage of the authorities and their campaigns as well
as information on opposition parties and movements. The freewheeling radio station Ekho
Moskvy (“Echo of Moscow”) broadcast in many large cities beyond the capital and featured
lively debates among both pro- and anti-regime commentators and politicians.5 Even on
television, a large share of Russia’s urban viewers could watch the news programming on the
REN-TV channel,6 which presented a balanced view of the campaign and regularly reported on
hard-core opposition figures such as Garry Kasparov.7
Nonetheless, when asked which of the mass media (television, radio, newspapers, the
Internet) is their basic source of information on politics, an overwhelming 89 percent of our
survey respondents identified television, and by that they generally meant state-controlled
television. Eighty-four percent of our respondents reported that they watched the daily television
4 The figures reported in this paper are weighted estimates produced using the procedure developed by Leslie Kish to adjust for the tendency for this sort of survey to oversample individuals in small households. 5 There were not debates among the candidates themselves on this station, however. 6 By one estimate, its potential audience was about 113 million. See Polit.Ru, April 10, 2007, 12:33. 7 For example, the following broadcasts during the campaign periods on REN-TV: “24,” November 29, 2007, 23:30; “Nedel’ia s Marianoi Maksimovskoi,” November 24, 2007, 19:00; and “24,” REN-TV, February 26, 2008, 19:30. Media monitoring confirming REN-TV’s exceptionalism comes from the Center for Journalism in Extreme Situations, as reported by RFE/RL Newsline, February 8, 2008.
4
news either every day or almost every day, with only 1 percent not having seen a single TV news
show in the week before the interview. When we inquired as to which particular news programs
they were watching, 22 percent affirmed REN-TV while 88 and 83 percent mentioned one of the
main state-run channels, the First Channel and the Rossiia Channel, respectively, and 60 percent
mentioned the privately held but Kremlin-loyal NTV. Three in five people reported reading
newspapers and about one in five said they listened to the radio, though only between 1 and 2
percent of our sample listened to Ekho Moskvy.
The Internet provided its surfers with a wide range of quality news sources, but no more
than 29 percent of the population reported making any use of the Internet at all and just one in
ten said they read any political commentary on it. A tiny handful (between 1 and 2 percent)
visited the website of a political party or politician or discussed politics on an Internet forum.
And only 9 percent reported relying primarily on conversations with family, friends, and
acquaintances instead of the mass media for their political information.
Russians, then, depended heavily on easily accessible and familiar state-run television
outlets for their political information despite the existence of alternatives, including low-cost
television and radio. This may be partly because they did not see any particular problem with
doing so: 53 percent averred that they sensed no bias toward any of the presidential candidates
during the campaign on the main three state-controlled channels (First Channel, the Rossiia
Channel, and NTV), a belief belied by systematic and objective analysis.8 Just under a third of
the population, though, did detect a bias toward Medvedev.
Hamstrung on fundraising, organization, and spending, opposition campaigners were able
to do little to break through this near-monopoly during the election season. Only half of the
8 RFE/RL Newsline, February 8, 2008.
5

population said they received any mailings from presidential candidates, and only about a third
got them from Communist Party nominee Zyuganov, the only credible opposition candidate in
the race.9 The share of the population who said they saw flyers or posters from the Zyuganov
campaign was about the same.10 About a fifth of the electors were made aware that their
employer supported one or other presidential candidate. In almost every case, this candidate was
Medvedev.
The most effective way for an opposition candidate to reach the electorate under these
circumstances, our survey indicates, was to try to use the limited opportunities that television
afforded them. Every candidate was allocated a set amount of free air time during certain parts of
the day that they could use to place ads. They were also able to purchase ad time, but the per-
minute rate during prime time was very expensive given campaign spending limits. Some two-
thirds of the potentially voting public did report that they saw television campaign spots for
Zyuganov.11
Table 1 provides some leverage on how the 2008 stacks up against previous presidential
elections in terms of how the electorate has experienced the campaign. As seen through the lens
of the RES over the years, we see that Kremlin candidates every since Yeltsin have enjoyed large
campaign advantages and that the changes over time since 1996 have not been dramatic. The
primary exception is that far more workers reported in 2004 and 2008 that their bosses supported
Medvedev than claimed in 1996 and 2000 and that their bosses tried to influence their vote,
although the difference may also reflect a change in the wording of the question.
9 Thirty percent reported receiving such materials from Vladimir Zhirinovsky, 13 percent from Andrei Bogdanov, and 25 percent from Medvedev. 10 Forty percent saw them from Zhirinovsky, 17 percent from Bogdanov, and 35 percent from Medvedev. 11 Seventy-one percent for Zhirinovsky, 56 percent for Bogdanov, and 60 percent for Medvedev.
6

Table 1. Comparison of Responses about Campaign Process for 1996, 2000, 2004, and 2008 Presidential Elections (Percent)
Criterion
1996 (1st
round) 2000 2004 2008 Received electoral materials in mailbox 49 42 36 52 Of which from Kremlin candidate 45 20 19 49 Rank of Kremlin candidate 1 3 5 4 Came across electoral materials outdoors 56 46 36 57 Of which materials of Kremlin candidate 60 31 28 61 Rank of Kremlin candidate 1 4 4 2 Contacted in person 5 5 — 13 Of which by representative of Kremlin candidate 30 15 — — Rank of Kremlin candidate 2 3 — — Watched advertising clips on television 93 72 67 79 Of which watched clips of Kremlin candidate — — — 60 Rank of Kremlin candidate — — — 3 Management of workplace supported a candidate(workers only)a 8 6 51 49
Of which supported Kremlin candidate 76 — 86 93 Rank of Kremlin candidate 1 — 1 1 Regional governor/president supported a candidate 57 38 49 61 Of which supported Kremlin candidate 92 82 94 98 Rank of Kremlin candidate 1 1 1 1 a. Note that question wording changed after 2000. In 1996 and 2000, it read, “Did the management of the enterprise or organization where you work try to influence your decision about which candidate for President of Russia to vote for?” In 2004 and 2008, the formulation was broader: “Did the leadership of the enterprise or organization where you work support any candidate for President?”
Public Opinion on the Issues
Russians displayed a variety of views on important issues of the day. On the whole,
however, we found strong support for Putin and his policies as well as a general preference for a
market economy with strong state guidance and cautiously cooperative relations with the West.
To begin, we asked people whether they regarded themselves as closer to the political left
or the political right. While 38 percent found it too hard to say or just refused to answer, the rest
tended to fall mainly at the center, with a tad more of the non-centrists falling to the right rather
7
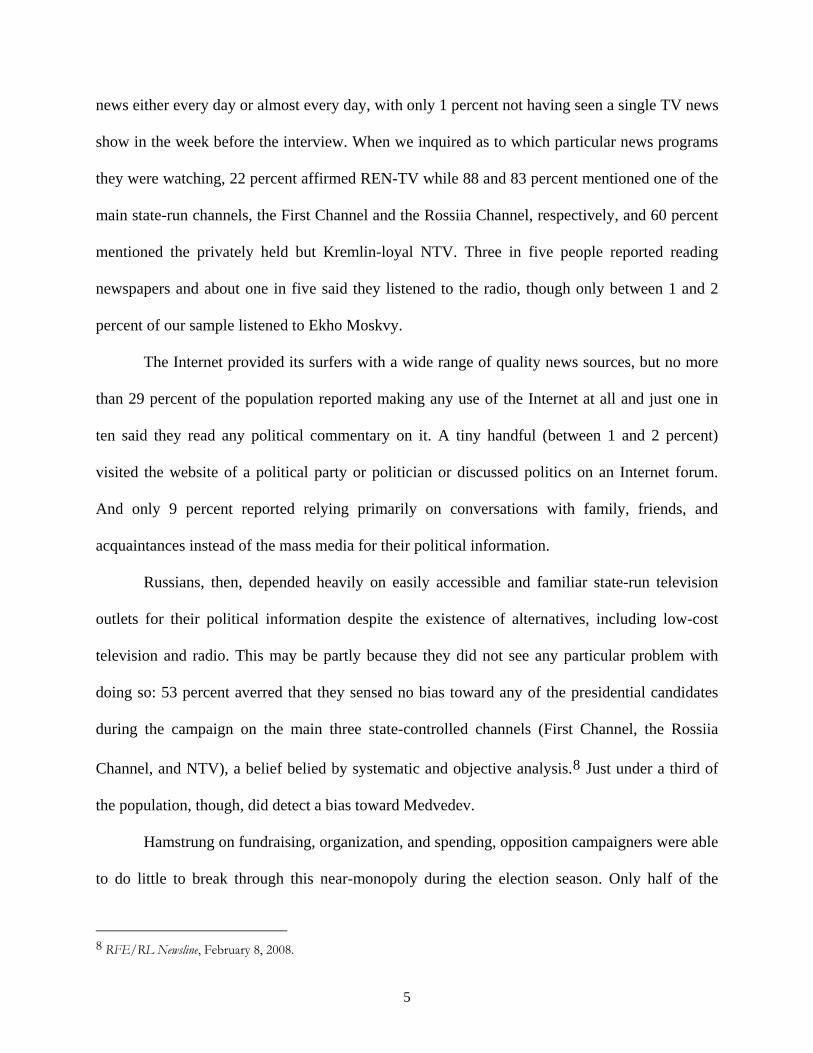
than to the political left, as can be seen in Figure 1. On an 11-point scale from 0 (the extreme
left) to 10 (the extreme right), the mean score was 5.7 and the most frequently given response by
far was the dead-center 5. Despite the general rejection of leftist views, a majority strongly (21
percent) or more or less (32 percent) agreed with the proposition that “the rule of the Communist
Party of the Soviet Union, from 1917 to 1991, did our country more good than harm.”
We also posed a question designed to capture broad nationalist orientations in society,
whether respondents thought Russia should relate to the West as to a friend, ally, rival, or enemy.
As Figure 2 illustrates, a large majority (61 percent) favored treating the West as an ally, with 22
percent replying rival, 10 percent friend, and just 3 percent thinking that it should be treated as
an enemy.12 We also found Russians to be moderate in their beliefs on federalism and the
centralization of authority: 58 percent thought that the regions and the center should have more
or less equal spheres of authority, while only 18 percent thought that most or all questions should
be decided by the central government and 21 percent that most or all questions should be decided
in the regions.
Figure 1. Distribution of Political Left-Right Self-Placement (0 = far left, 10 = far right)
2.4 1.5 2.4 3.21.9
23.4
6.7 7.36
2.84.8
0
5
10
15
20
25
0 1 2 3 4 5 6 7 8 9 10
% o
f E
lect
ora
te
12 We found a similar distribution of views vis-à-vis China: 61 percent wanted to relate to it as to an ally, 15 percent as to a rival, 13 percent as to a friend, and 3 percent as to an enemy.
8

Figure 2. Distribution of Views on How Russia Should Relate to the West
2.5
21.5
5.79.7
60.6
0
10
20
30
40
50
60
70
Enemy Rival Ally Friend H/S, Ref
% o
f E
lect
ora
te
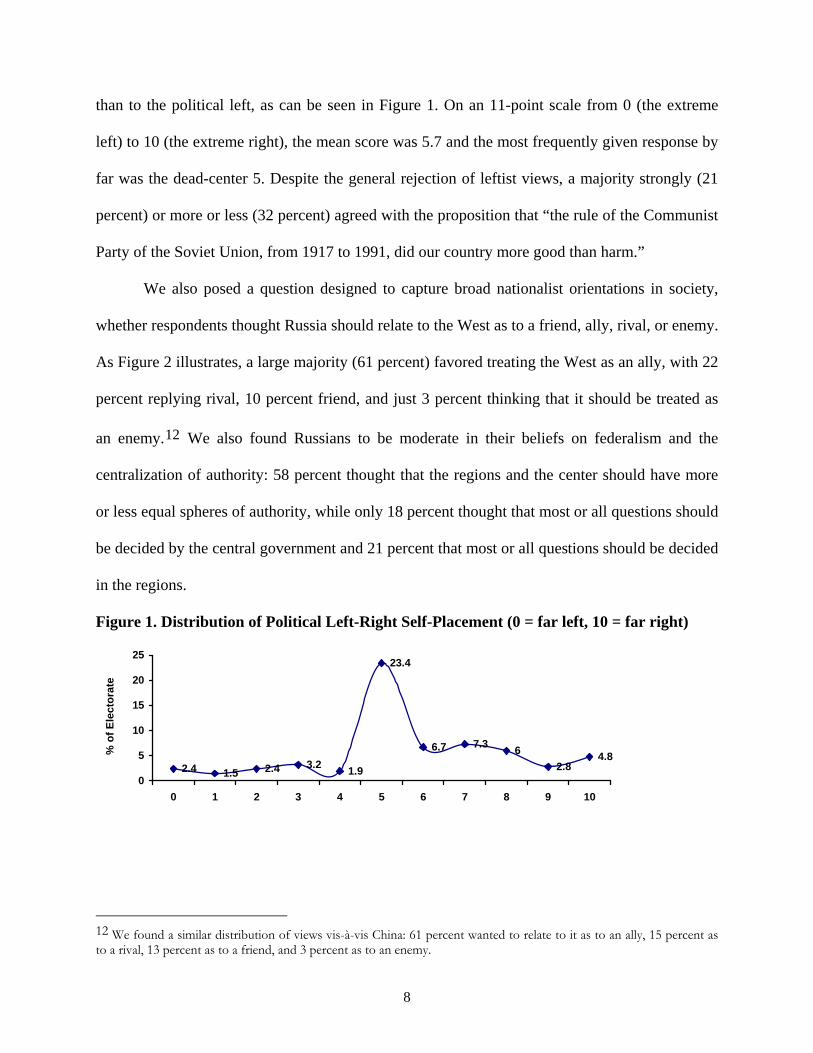
When we probed economic issues specifically, as Figure 3 shows, we found that Russians
generally preferred to press ahead with market reforms instead of returning to socialism or
preserving the status quo, although significant numbers of supporters could also be found for the
latter two positions. This does not mean that Russians rejected any state role in the economy, of
course. Almost all respondents averred that the state should fully (78 percent) or partly (19
percent) own “oil, gas, and other extractive companies.”
At the same time, they did not want the state to go on a spending spree with these
resources, even to improve popular welfare. Sixty-nine percent were for expending energy
income gradually so as to prepare for possible future crises, as against 20 percent for spending
the money on social needs right away. Some 88 percent either agreed or more or less agreed that
the state should play a bigger role in the economy than it does now, but 76 percent affirmed faith
in the core market principle that “competition among various enterprises, organizations, and
firms benefits our society.” While different parties could hope to find support for either more
left- or more right-leaning economic policies, the majority of Russians appear to prefer a market
economy to socialism but desire the state to play a large role in developing this market and
managing the country’s most important strategic assets.
9
Figure 3. Distribution of Views on Economic Reform
16.711.1
57.9
14.4
0
10
20
30
40
50
60
70
Return to socialism Keep as is Continue, deepen marketreforms
H/S, Ref
% o
f E
lect
ora
te
When it comes to narrower public policies, our survey returned evidence of broad support
for Putin initiatives. Just as many surveys have consistently reported high approval ratings for
Putin throughout the 2000s, so ours estimates that 59 percent of the population either approved
or fully approved of his activities as president, with another 34 percent mixing approval and
disapproval and only 5 percent reporting outright disapproval.13 In 2003–04 our election polls
had found that Putin’s personal popularity far outpaced support for his actual policies; by 2008
these quantities seemed broadly in line.14
As Figure 4 illustrates, there was at least a plurality of support for a broad range of Putin
policies, including putting an end to gubernatorial elections; launching “priority national
projects” on housing, education, agriculture, and health care; arresting Yukos magnate Mikhail
Khodorkovsky; introducing jury trials; and imposing economic sanctions on Georgia.15 A clear
majority by 2008 even supported the partial replacement of social benefits with cash payments, a
policy that in early 2005 generated massive street protests across the country. Not all policies
13 On trends, see in particular Rose, Mishler, and Munro, Russia Transformed; and Daniel S. Treisman, “The Popularity of Russian Presidents,” draft paper presented at the international conference “Frontiers of Political Economy,” Higher School of Economics/New Economic School, Moscow, May 30–31, 2008, http://www.hse.ru/data/396/226/1237/paper%20-%20Treisman.pdf, access date December 8, 2008. 14 On our 2003–04 findings, see Henry E. Hale, Michael McFaul, and Timothy J. Colton, “Putin and the ‘Delegative Democracy’ Trap: Evidence from Russia’s 2003–04 Elections,” Post-Soviet Affairs, v.20, no.4, October-December 2004, pp.285-319. 15 The remainder expressed indifference, found it hard to say, or refused to answer.
10
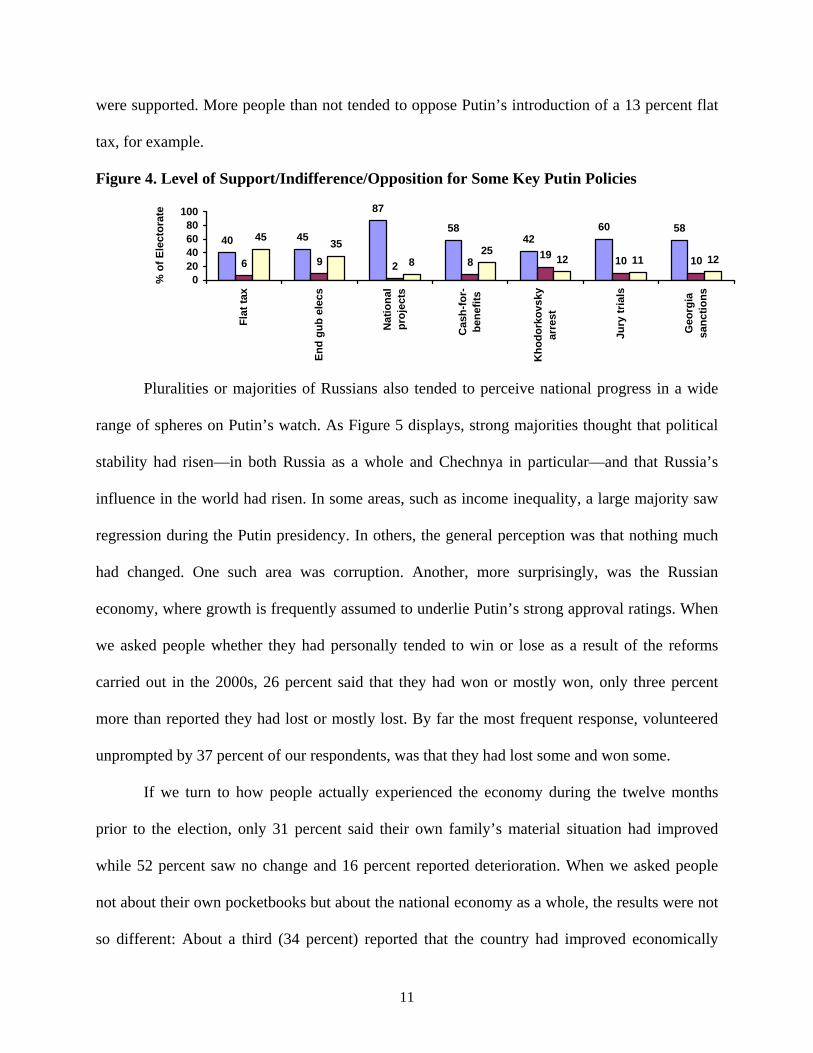
were supported. More people than not tended to oppose Putin’s introduction of a 13 percent flat
tax, for example.
Figure 4. Level of Support/Indifference/Opposition for Some Key Putin Policies
40 45
87
5842
60 58
6 9 2 819
10 10
4535
825
12 11 12
020406080
100
Fla
t ta
x
En
d g
ub
ele
cs
Nat
ion
alp
roje
cts
Cas
h-f
or-
ben
efit
s
Kh
od
ork
ovs
kyar
rest
Jury
tri
als
Geo
rgia
san
ctio
ns
% o
f E
lect
ora
te
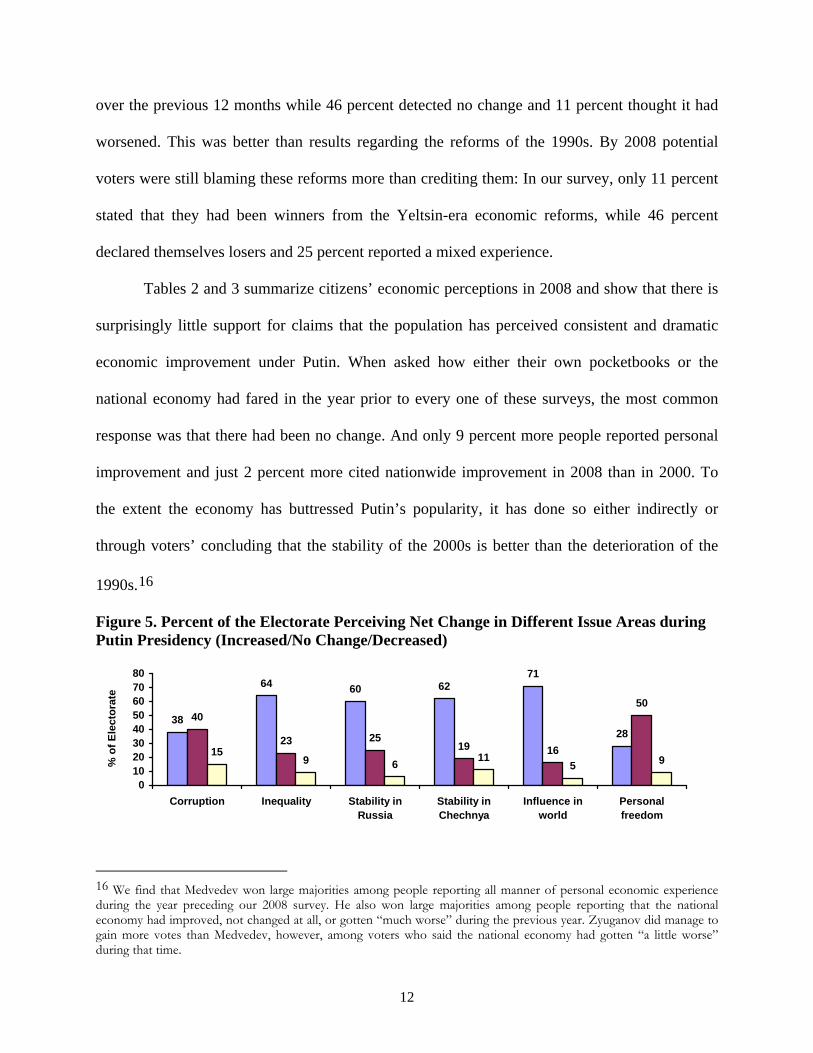
Pluralities or majorities of Russians also tended to perceive national progress in a wide
range of spheres on Putin’s watch. As Figure 5 displays, strong majorities thought that political
stability had risen—in both Russia as a whole and Chechnya in particular—and that Russia’s
influence in the world had risen. In some areas, such as income inequality, a large majority saw
regression during the Putin presidency. In others, the general perception was that nothing much
had changed. One such area was corruption. Another, more surprisingly, was the Russian
economy, where growth is frequently assumed to underlie Putin’s strong approval ratings. When
we asked people whether they had personally tended to win or lose as a result of the reforms
carried out in the 2000s, 26 percent said that they had won or mostly won, only three percent
more than reported they had lost or mostly lost. By far the most frequent response, volunteered
unprompted by 37 percent of our respondents, was that they had lost some and won some.
If we turn to how people actually experienced the economy during the twelve months
prior to the election, only 31 percent said their own family’s material situation had improved
while 52 percent saw no change and 16 percent reported deterioration. When we asked people
not about their own pocketbooks but about the national economy as a whole, the results were not
so different: About a third (34 percent) reported that the country had improved economically
11
over the previous 12 months while 46 percent detected no change and 11 percent thought it had
worsened. This was better than results regarding the reforms of the 1990s. By 2008 potential
voters were still blaming these reforms more than crediting them: In our survey, only 11 percent
stated that they had been winners from the Yeltsin-era economic reforms, while 46 percent
declared themselves losers and 25 percent reported a mixed experience.
Tables 2 and 3 summarize citizens’ economic perceptions in 2008 and show that there is
surprisingly little support for claims that the population has perceived consistent and dramatic
economic improvement under Putin. When asked how either their own pocketbooks or the
national economy had fared in the year prior to every one of these surveys, the most common
response was that there had been no change. And only 9 percent more people reported personal
improvement and just 2 percent more cited nationwide improvement in 2008 than in 2000. To
the extent the economy has buttressed Putin’s popularity, it has done so either indirectly or
through voters’ concluding that the stability of the 2000s is better than the deterioration of the
1990s.16
Figure 5. Percent of the Electorate Perceiving Net Change in Different Issue Areas during Putin Presidency (Increased/No Change/Decreased)
38
64 60 6271
28
40
23 2519 16
50
159 6
115 9
01020304050607080
Corruption Inequality Stability inRussia
Stability inChechnya
Influence inworld
Personalfreedom
% o
f E
lect
ora
te
16 We find that Medvedev won large majorities among people reporting all manner of personal economic experience during the year preceding our 2008 survey. He also won large majorities among people reporting that the national economy had improved, not changed at all, or gotten “much worse” during the previous year. Zyuganov did manage to gain more votes than Medvedev, however, among voters who said the national economy had gotten “a little worse” during that time.
12
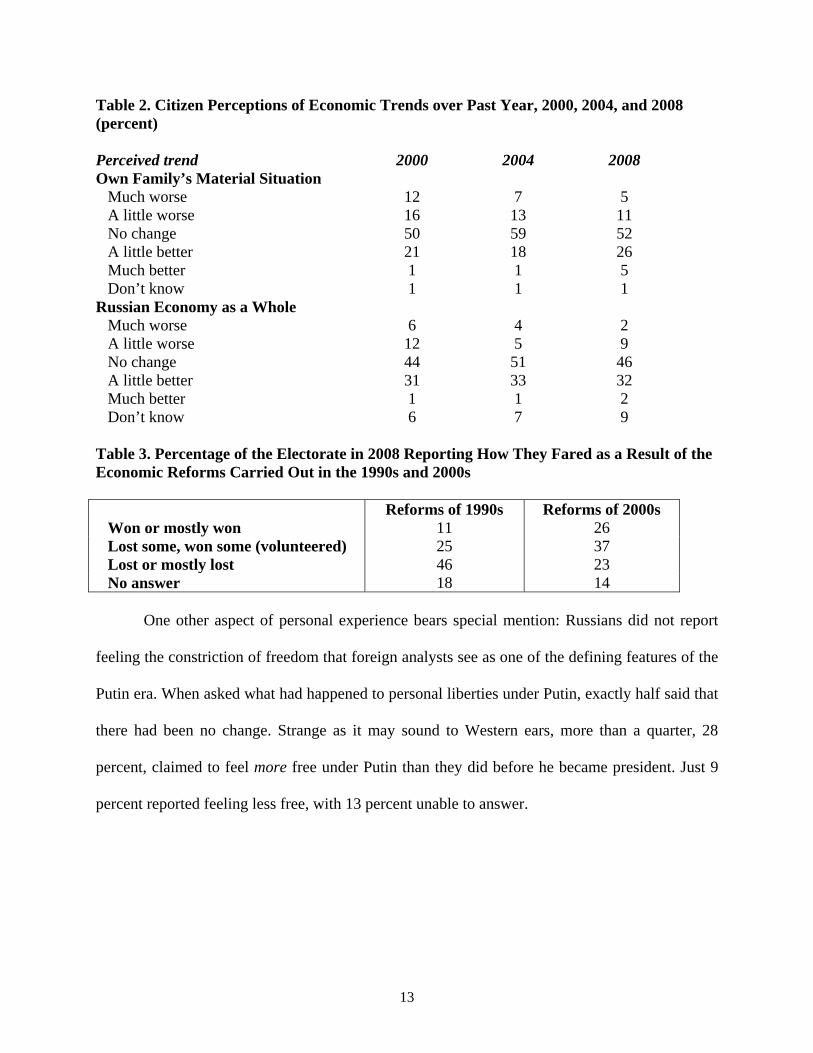
Table 2. Citizen Perceptions of Economic Trends over Past Year, 2000, 2004, and 2008 (percent) Perceived trend 2000 2004 2008 Own Family’s Material Situation Much worse 12 7 5 A little worse 16 13 11 No change 50 59 52 A little better 21 18 26 Much better 1 1 5 Don’t know 1 1 1 Russian Economy as a Whole Much worse 6 4 2 A little worse 12 5 9 No change 44 51 46 A little better 31 33 32 Much better 1 1 2 Don’t know 6 7 9 Table 3. Percentage of the Electorate in 2008 Reporting How They Fared as a Result of the Economic Reforms Carried Out in the 1990s and 2000s Reforms of 1990s Reforms of 2000s Won or mostly won 11 26 Lost some, won some (volunteered) 25 37 Lost or mostly lost 46 23 No answer 18 14
One other aspect of personal experience bears special mention: Russians did not report
feeling the constriction of freedom that foreign analysts see as one of the defining features of the
Putin era. When asked what had happened to personal liberties under Putin, exactly half said that
there had been no change. Strange as it may sound to Western ears, more than a quarter, 28
percent, claimed to feel more free under Putin than they did before he became president. Just 9
percent reported feeling less free, with 13 percent unable to answer.
13
The Duma Race and the Political Parties
Despite rampant accusations that the United Russia Party’s victory was primarily
produced by fraud, our survey indicates robustly that outright falsification of the results was not
necessary to produce a landslide victory. It also suggests it would be a mistake to dismiss United
Russia as nothing but a club of bureaucrats oriented to their boss, Vladimir Putin. The reality is
that pro-incumbent media bias, the constriction of mobilization opportunities for the opposition,
and relatively favorable state performance under Putin all combined to generate growing support
for—and even identification with—United Russia, based on general policy orientations that the
electorate understood quite well.
While the overall scope of partisan attachment in Russia has remained fairly stable at just
under half of the electorate since the 1995–96 election cycle, this aggregate continuity masks a
surge in loyalty to United Russia at the expense of other parties.17 Our survey primarily
estimates party loyalty as what Colton has labeled transitional partisanship, an instrument
appropriate for societies new to party competition where one would not expect to find affinities
as deep and time-tested as those in the United States but where emerging attachments might
exist. Respondents are asked whether there is any party they would call “my party” and then
asked to name that party without being presented a list of party names. Those saying they do not
have a “my party” are asked whether there is nevertheless a party that more than the others
reflects their “interests, views, and concerns” and then asked to name that party without being
presented a list of party names. Those naming a real party in response to either of those questions
are coded as that party’s “transitional partisans.”
14

Under Putin, the share of the voting-age population that we identify as partisans of
United Russia (or its predecessor, the Unity bloc) has risen from 11 percent just after the 2000
presidential election to 26 percent after the 2004 contest and 30 percent in 2008.18 As Table 4
illustrates, United Russia towers over the partisan scene in Russia by 2008. It far outstrips the
second-place KPRF, which can claim only 8 percent of the electorate as its devotees, and all
other parties, none of which could muster even 5 percent of our respondents by the time Putin
officially assumed the United Russia leadership and stepped down as president.
Table 4. Transitional Partisanship in Russia 2008, Percent of the Electorate by Party United Russia 30 Communist Party of the Russian Federation 8 LDPR 4 A Just Russia 2 All others combined 2 Total transitional partisans 46 Nonpartisans 56
Our survey also tends to confirm United Russia’s claims to have recruited a large number
of citizens as party members: 4 percent of our respondents described themselves as members.
While this may be small compared to leading parties in Western democracies, one must keep in
mind that party membership in Russia traditionally involves an elaborate application and
approval process, sometimes including a probationary period, as well as expectations for dues
payments and active participation in party events. Moreover, United Russia and some other
parties have been selective in an effort to preserve ideological consistency and to avoid dilution
of the spoils of office. Even so, no other party could muster as much as one half of one percent of
the population as members, according to our research.
17 For an analysis of trends in partisanship over time, see Hale 2006 and Timothy J. Colton and Henry E. Hale, “The Macro-Micro Puzzle of Partisan Development in Post-Soviet Russia,” paper presented at the Annual Meeting of the Midwest Political Science Association, Chicago, April 2–5, 2009. 18 Colton and Hale 2009.
15
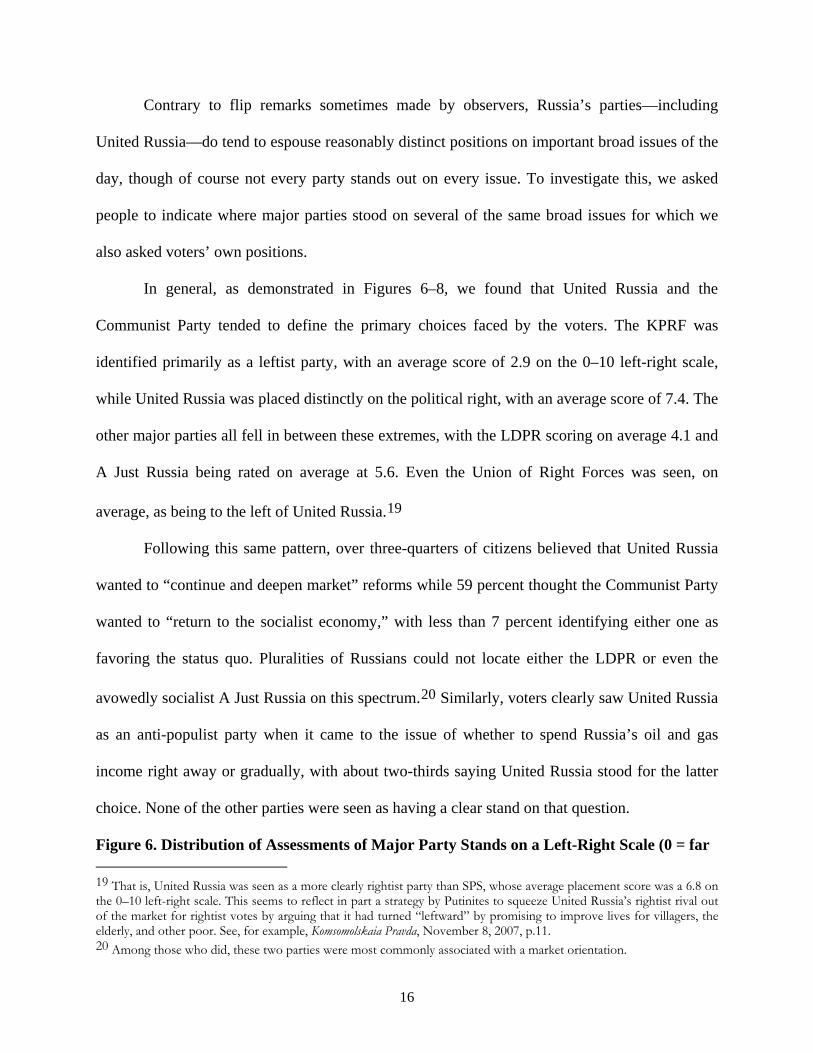
Contrary to flip remarks sometimes made by observers, Russia’s parties—including
United Russia—do tend to espouse reasonably distinct positions on important broad issues of the
day, though of course not every party stands out on every issue. To investigate this, we asked
people to indicate where major parties stood on several of the same broad issues for which we
also asked voters’ own positions.
In general, as demonstrated in Figures 6–8, we found that United Russia and the
Communist Party tended to define the primary choices faced by the voters. The KPRF was
identified primarily as a leftist party, with an average score of 2.9 on the 0–10 left-right scale,
while United Russia was placed distinctly on the political right, with an average score of 7.4. The
other major parties all fell in between these extremes, with the LDPR scoring on average 4.1 and
A Just Russia being rated on average at 5.6. Even the Union of Right Forces was seen, on
average, as being to the left of United Russia.19
Following this same pattern, over three-quarters of citizens believed that United Russia
wanted to “continue and deepen market” reforms while 59 percent thought the Communist Party
wanted to “return to the socialist economy,” with less than 7 percent identifying either one as
favoring the status quo. Pluralities of Russians could not locate either the LDPR or even the
avowedly socialist A Just Russia on this spectrum.20 Similarly, voters clearly saw United Russia
as an anti-populist party when it came to the issue of whether to spend Russia’s oil and gas
income right away or gradually, with about two-thirds saying United Russia stood for the latter
choice. None of the other parties were seen as having a clear stand on that question.
Figure 6. Distribution of Assessments of Major Party Stands on a Left-Right Scale (0 = far 19 That is, United Russia was seen as a more clearly rightist party than SPS, whose average placement score was a 6.8 on the 0–10 left-right scale. This seems to reflect in part a strategy by Putinites to squeeze United Russia’s rightist rival out of the market for rightist votes by arguing that it had turned “leftward” by promising to improve lives for villagers, the elderly, and other poor. See, for example, Komsomolskaia Pravda, November 8, 2007, p.11. 20 Among those who did, these two parties were most commonly associated with a market orientation.
16

left, 10 = far right)
0
5
10
15
20
25
30
0 1 2 3 4 5 6 7 8 9 10
% o
f E
lect
ora
te
United Russia
KPRF
LDPR
A Just Russia
Figure 7. Distribution of Perceptions of Major Party Stands on Economic Reform
17
77
16
59
612
22
618
3341
411
38 40
0102030405060708090
Return to socialism Keep as is Continue, deepenmarket reforms
H/S, Ref
% o
f E
lect
ora
te United Russia
KPRF
LDPR
A Just Russia
Contrary to some observers’ impressions, the Russian electorate generally saw United
Russia as the relatively pro-Western option when it came to foreign policy, as can be seen in
Figure 8. An impressive 73 percent understood United Russia as advocating treating the West as
either an ally or friend. The Communist Party and the LDPR were clearly placed in the more
hostile camp. Twenty-three percent and 29 percent (respectively) could not discern their stands
on this issue; pluralities of 39 percent and 41 percent believed they stood for treating the West
either as an enemy or as a rival. Thirty-five percent could not identify the orientation of A Just
Russia on this question; a plurality of 43 percent saw it as in favor of a relationship of either ally
or friend to the West.
Figure 8. Distribution of Perceptions of Major Party Stands on How Russia Should Relate
17
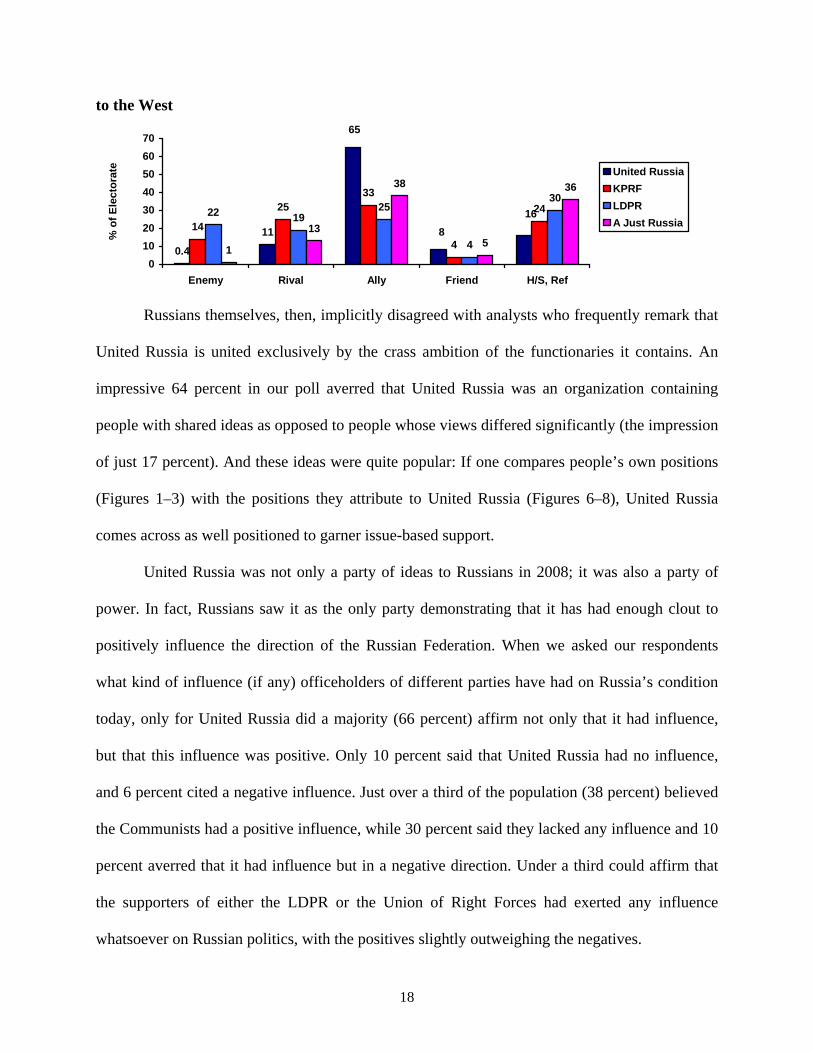
to the West
0.4
1114
2533
4
2422 1925
4
30
1
13
38
5
36
65
8
16
0
10
20
30
40
50
60
70
Enemy Rival Ally Friend H/S, Ref
% o
f E
lect
ora
te United Russia
KPRF
LDPR
A Just Russia
Russians themselves, then, implicitly disagreed with analysts who frequently remark that
United Russia is united exclusively by the crass ambition of the functionaries it contains. An
impressive 64 percent in our poll averred that United Russia was an organization containing
people with shared ideas as opposed to people whose views differed significantly (the impression
of just 17 percent). And these ideas were quite popular: If one compares people’s own positions
(Figures 1–3) with the positions they attribute to United Russia (Figures 6–8), United Russia
comes across as well positioned to garner issue-based support.
United Russia was not only a party of ideas to Russians in 2008; it was also a party of
power. In fact, Russians saw it as the only party demonstrating that it has had enough clout to
positively influence the direction of the Russian Federation. When we asked our respondents
what kind of influence (if any) officeholders of different parties have had on Russia’s condition
today, only for United Russia did a majority (66 percent) affirm not only that it had influence,
but that this influence was positive. Only 10 percent said that United Russia had no influence,
and 6 percent cited a negative influence. Just over a third of the population (38 percent) believed
the Communists had a positive influence, while 30 percent said they lacked any influence and 10
percent averred that it had influence but in a negative direction. Under a third could affirm that
the supporters of either the LDPR or the Union of Right Forces had exerted any influence
whatsoever on Russian politics, with the positives slightly outweighing the negatives.
18

Naturally, the lion’s share of United Russia’s influence was associated with Putin, who
led the party list in the 2007 Duma election and then formally assumed the party chairmanship in
the spring of 2008. Asked what this party’s relationship was to Putin, 95 percent said that it fully
(84 percent) or more or less (11 percent) supports him, as Figure 9 shows. Although a majority
of 56 percent also saw A Just Russia as being broadly pro-Putin, 16 percent saw it as in
opposition to him.
United Russia was the only party on whose relationship to Putin Russians agreed. This
was true even of the Communist Party: Fifty-five percent said that it stood against Putin; a
sizable 34 percent averred that the party supported him. The picture was more muddled still for
the LDPR, SPS, and Yabloko. A strong plurality of respondents (45 percent) thought that
Zhirinovsky’s LDPR supported Putin, though 39 percent believed it opposed him. As for the
liberal parties, 35 percent and 44 percent thought that SPS and Yabloko (respectively) held anti-
Putin positions, 30 percent asserted that SPS was a pro-Putin force, and 22 percent said the same
of Yabloko.
Figure 9. Distribution of Perceptions of Major Party Support for Putin
84
114
3039
16 117
3829
10 1414
42
133
195
25 2411
26
319
2816
28
0.3 0.1 4
0
20
40
60
80
100
FullySupports
More orless
supports
More orless does
not support
Does notsupport at
all
H/D, ref
% o
f E
lect
ora
te
United Russia
KPRF
LDPR
A Just Russia
SPS
Yabloko
These differing perceptions of the parties all showed up when we asked people to say
why they cast their ballots the way they did in the 2007 Duma race, requesting that they choose
the most important reason from a list. To judge by the citizens themselves, Putin was a
19

formidable factor in United Russia’s victory. As Table 5 indicates, 26 percent of the party’s
voters cited Putin’s support for the party, 10 percent referred to the need to support the
authorities no matter what, and 9 percent emphasized the party leader’s personality.21 No other
party benefited significantly from the Putin aura, according to our data. When asked directly how
important it was to their vote that Putin headed the party list, 91 percent of United Russia’s
voters replied that it was important or very important.
Table 5. Top Reason Given for Voting for a Given Party from a Given List of Possible Reasons, Percentage of that Party’s Voters
Among Voters for the Following Parties Reason United
Russia
KPRF
LDPR A Just Russia
Other
Work in Duma 20 5 3 4 3 Like program 14 38 20 36 28 Leader personality 9 2 30 4 11 Party loyalty 5 8 6 6 5 Obey authorities 10 0 0 3 0 Pork barrel 10 20 11 24 16 Putin supports it 26 0 0 3 0 Protest vote 1 24 24 15 32
There were, to be sure, variables at work other than the outgoing president’s electoral
coattails. For one thing, our respondents told us, United Russia drew support based on attributes
other than Putin’s leadership. Significant quantities of United Russia voters purported to like its
program (14 percent), its work in the preceding Duma (20 percent), its ability to bring patronage
benefits (“pork,” in the parlance of American politics) to their region (10 percent), or sheer party
loyalty (5 percent). For another, most voters did not express willingness to vote mechanically for
whichever party Putin told them. A majority, 54 percent, said that they would still have voted for
United Russia if Putin had remained neutral in the campaign, and only 17 percent said they
would have changed their mind in that case. To further probe the Putin factor, we also asked
21 Putin was formally leader of the party during the time the survey was in the field, though not during the Duma
20

voters whether they would have supported different parties had Putin endorsed them instead of
United Russia. To hear voters tell it, A Just Russia (already widely seen as pro-Putin) would
have mustered only about 25 percent of the vote had Putin backed it exclusively and SPS, which
at the time featured a significant pro-Putin wing, would have received no more than 6 percent
despite a Putin endorsement. Had Putin for some reason backed the opposition Communist Party,
that party would only have netted 26 percent.
The opposition, shut out of positions of true influence, was able to attract votes primarily
on the basis of program and patronage, according to the picture our respondents paint. The KPRF
drew votes primarily from ideological adherents and protest voters, though it did manage to
convince some that it could bring material benefits to individual regions. The LDPR,
unsurprisingly, gained heavily from the appeal of its charismatic leader, Vladimir Zhirinovsky,
and the wooly nationalist ideas he spouts, though many considered the party primarily a vehicle
to express their dissatisfaction with the whole political system. Voters also pointed to pork,
program, and protest in explaining their support for A Just Russia.
The Presidential Election and Succession Politics
The ultimate prize in Russian electoral politics is the presidency, and the 2008 contest
was distinguished by Putin’s successful attempt to get his anointed successor, Dmitry Medvedev,
elected to this office. Ever since Putin’s reelection in 2004, speculation had swirled about
whether he would seek to amend the Constitution, which stipulates that no one person could
serve more than two presidential terms in a row. Putin consistently ruled out such a change in the
basic law, and he and his colleagues dropped strong hints that his political heir would be one of
campaign, when Boris Gryzlov was its nominal leader. Putin, however, headed the party list during the campaign. Thus it is likely, though not certain, that some and perhaps many respondents had Putin in mind when citing party leadership.
21
two longtime associates whom he named as deputy prime ministers on November 14, 2005:
Medvedev, previously the head of Putin’s executive office, and Sergei Ivanov, who had been
serving as minister of defense.
Medvedev was initially considered to have the upper hand, having been made first deputy
prime minister instead of a run-of-the mill deputy prime minister like Ivanov and having been
handed stewardship of the four “priority national projects” for development that allowed him
rich opportunities to appear in a positive light as he handed out funds. Indeed, our survey (as
noted above) found that these projects were broadly approved by the population.
If Medvedev, from an intelligentsia family, was portrayed as the more liberal and socially
oriented candidate, Ivanov with his FSB and KGB background was frequently portrayed as the
silovik, the hard-line candidate representing the security structures in the country. After
Medvedev’s standing in the polls seemed about to leave Ivanov in the proverbial dust, in
February 2007 Putin promoted Ivanov to first deputy prime minister (and hence Medvedev’s
equal in the formal hierarchy) and the mass media started lavishing attention on him. Already by
April, the most reliable presidential polls recorded that Ivanov had taken a slim lead in public
opinion.22
As the Duma election loomed, one newspaper (in a report picked up by several others)
even averred that Putin had decided to appoint Ivanov prime minister and thereby make him his
chosen successor.23 A week after the December Duma election, however, Putin unambiguously
endorsed Medvedev in a move that television portrayed as responding to the proposal of United
22 For example, the surveys of the Levada Center. On the trends around this time, see RFE/RL Newsline, April 30, 2007. 23 Nezavisimaia Gazeta, April 20, 2007, http://www.ng.ru/editorial/2007-04-20/2_red.html, access date August 30, 2009.
22
Russia, A Just Russia, and two minor parties (the Agrarian Party of Russia and Civic Force).24
Medvedev then ran for the presidency as United Russia’s nominee, the first time that a
Kremlin presidential candidate had brandished a formal party nomination, though he also made
much of his endorsement by additional parties representing other parts of the political spectrum
he hoped to enlist. The only other major parties successfully placing a candidate on the ballot
were the Communist Party and the LDPR, each of which nominated their perennial leaders
(Zyuganov and Zhirinovsky) for the third time since 1996. A fourth candidate, the virtually
unknown Andrei Bogdanov, represented the minuscule Democratic Party of Russia and was
widely regarded as a shill designed to give the appearance of a liberal alternative in the race.25
That was desirable because candidates with more credible claims to liberalism, as well as any
candidate other than Zyuganov who vigorously criticized the Kremlin, either declined to run in
an election they regarded as a farce (as with Yabloko’s Grigory Yavlinsky) or ran into too many
procedural obstacles to get on the ballot (as with chess champion Garry Kasparov or Putin’s own
former Prime Minister and newly minted opposition standard-bearer Mikhail Kasianov).
How did the Russian public perceive the options that the political establishment presented
them, especially by the man that they ultimately elected president? To answer such questions, we
asked our respondents to gauge the political stands of each of the main candidates for successor
(Medvedev and Ivanov) as well of Putin himself. The pattern is striking: Voters saw these
leading members of team Putin as having virtually identical stands on major issues, stands that
were associated not only with United Russia but with large segments of the electorate itself.
24 All primary evening news broadcasts on the state-controlled First Channel, the Rossiia Channel, and NTV on December 10, 2007, as witnessed live by Henry Hale. 25 His Democratic Party got under 1 percent of the vote in the Duma race, and during the Duma campaign his party spent much of its time attacking others in the liberal camp, especially SPS and its leaders. See, for example, the DPR campaign advertisement shown during the official campaign debate broadcast on the Rossiia Channel, November 28, 2007, 22:50.
23

Figure 10 reports that Putin, Medvedev, and Ivanov were all seen as decidedly right-of-
center politicians, with voters placing them on average at 7.6 on a scale of 0–10 where 0 is the
far left and 10 the far right. On economic reform, as Figure 11 testifies, all three were understood
as advocates of continuing and deepening market reform instead of preserving the status quo or
returning to socialism. None of them were viewed widely as a populist, as strong majorities
thought each of them stood for spending Russia’s oil and gas wealth gradually rather than right
away on social needs. And Figure 12 shows that despite the media’s juxtaposition of the
supposedly more Western-oriented Medvedev with the silovik Ivanov, voters identified both of
them (as well as Putin) with a cautiously pro-Western foreign policy stance that stood out from
the more antagonistic stance of the KPRF and LDPR mentioned earlier.
The primary difference between the three leaders is that slightly more people could not
place Ivanov on these issues compared with Putin and Medvedev, though in each case this meant
less than a third of our respondents. Accordingly, it appears that voters did understand something
concrete when Medvedev and others talked about his desire to continue along “Putin’s path” or
“Putin’s plan,” and comparison with Figures 2-3 reveals that this something resonated with broad
public opinion on key issues even though voters on average regarded all of the Putinites as being
further to the political right than they themselves were.
24

Figure 10. Distribution of Population’s Assessments of Putin’s, Medvedev’s, and Ivanov’s Stands on Left-Right Scale (0 = far left, 10 = far right)
0
5
10
15
20
25
30
35
0 1 2 3 4 5 6 7 8 9 10
% o
f E
lect
ora
te
Putin
Medvedev
Ivanov
Figure 11. Distribution of Perceptions of Putin’s, Medvedev’s, and Ivanov’s Stands on Economic Reform
1 5
84
111 4
81
14
0.457
63
26
0102030405060708090
Return to socialism Keep as is Continue, deepenmarket reforms
H/S, Ref
% o
f E
lect
ora
te
Putin
Medvedev
Ivanov
Figure 12. Distribution of Perceptions of Putin’s, Medvedev’s, and Ivanov’s Stands on How Russia Should Relate to the West
0.4
12
0.4
11
65
815
1
11
57
5
23
68
911
0
10
20
30
40
50
60
70
80
Enemy Rival Ally Friend H/S, Ref
% o
f E
lect
ora
te
Putin
Medvedev
Ivanov
Where people did see strong differences between Putin and Medvedev was in the realm
of personal leadership qualities. This is evident from Figure 13, which reports results when we
asked our respondents whether they thought Putin and Medvedev possessed certain qualities that
25

people frequently want in a leader. One important observation is that while Medvedev generally
got good scores on leadership, Putin was the beneficiary of far stronger ratings. This did not
mean that Medvedev was given negative ratings: Very few of our respondents asserted that he
lacked or even probably lacked any given trait. Instead, this Putin-Medvedev gap reflects another
difference between the two leaders: People were much less sure of what kind of leader
Medvedev would turn out to be. While only a scattered few were unable to rate Putin on any
given trait, about two-fifths of the population could not assess Medvedev on such qualities as
strength, honesty, and concern for ordinary people. People more readily sized up Medvedev on
intelligence, with only a fifth feeling incapable of doing so.
Furthermore, if we break down the figures reported in Figure 13, which combine people
who assert unambiguously that a leader has these traits with those who say he “probably” has
them, we find that even those who positively evaluate Medvedev were somewhat hesitant.
Majorities stated unequivocally (not “probably”) that Putin was “intelligent and knowledgeable”
(81 percent), “a strong leader” (71 percent), and “an honest and trustworthy person” (52 percent),
whereas for Medvedev the share of people who did not attach a “probably” to their answer never
reached a majority, coming in at 49 percent, 25 percent, and 24 percent on these three traits,
respectively. And while only 40 percent unambiguously found that Putin “really cares about the
interests of people like you,” this figure was just 19 percent for Medvedev. In fact, the plurality
response (among those who could rate Medvedev) was generally that he “probably” had these
traits.
26

Figure 13. Percentage of the Electorate Attributing Different Leadership Traits to Different Russian Politicians (possesses or “probably” possesses)
98 9377
52 5748
75
5039 35
61
43
18 18
8572
0
20
40
60
80
100
120
Intelligence Strength Honesty,trustworthiness
Really cares
% o
f E
lect
ora
te Putin
Medvedev
Zyuganov
Zhirinovsky
As something of a pale leadership shadow of Putin, Medvedev’s primary advantage over
his opponents in the presidential race in terms of reputation appears to have been his lack of
negatives. The percentages of the population attributing positive leadership traits to Medvedev
were not very different from Zyuganov’s ratings on all of the leadership qualities about which
we asked. The primary difference was that Zyuganov had significant shares of the population
giving him negative assessments along with the percentages giving him positive ones, while
Medvedev had low negatives but high unknowns. Even Zhirinovsky scored close to Medvedev in
terms of the share of the population describing him has intelligent and strong, though the LDPR
leader could not find even a fifth of the population willing to call him honest and caring. Perhaps
for these reasons, when people were asked which of the four presidential candidates were most
competent to accomplish crucial tasks (provide social guarantees, improve the economy,
safeguard human rights and freedoms, combat terrorism, promote Russia’s international
interests, and battle crime and corruption), huge pluralities identified Medvedev in every
instance, as Table 6 lays out.
27
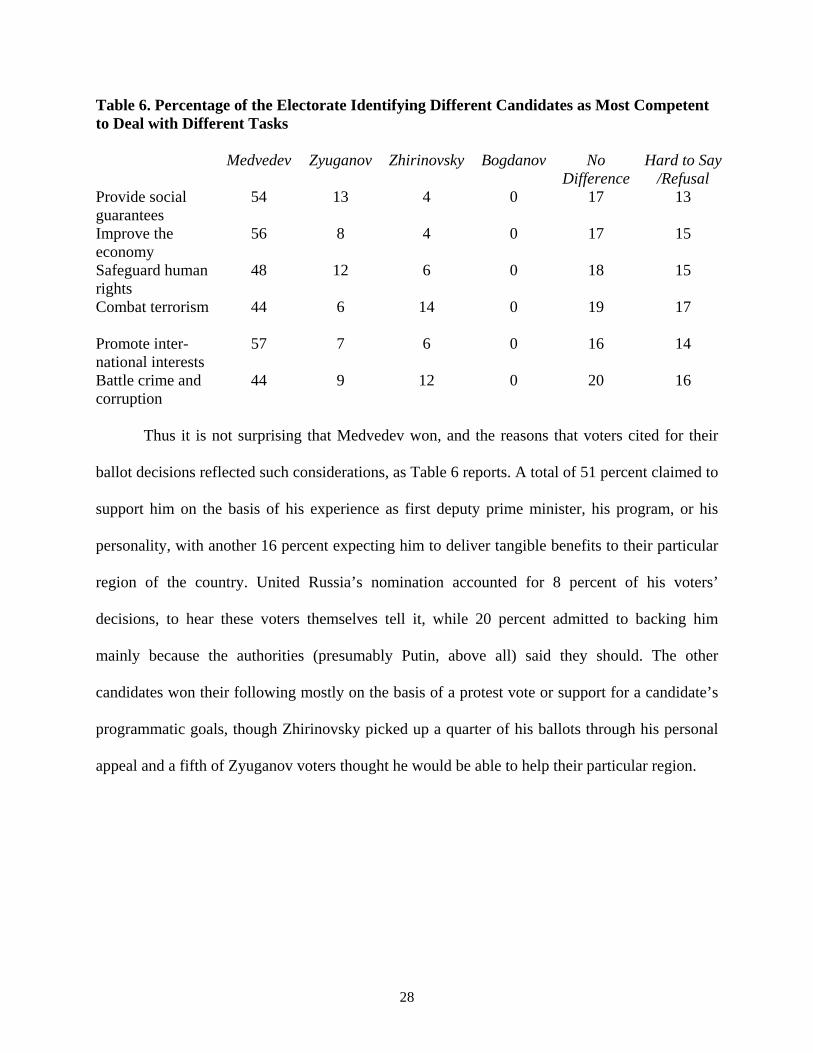
Table 6. Percentage of the Electorate Identifying Different Candidates as Most Competent to Deal with Different Tasks Medvedev Zyuganov Zhirinovsky Bogdanov No
Difference Hard to Say
/Refusal Provide social guarantees
54 13 4 0 17 13
Improve the economy
56 8 4 0 17 15
Safeguard human rights
48 12 6 0 18 15
Combat terrorism
44 6 14 0 19 17
Promote inter-national interests
57 7 6 0 16 14
Battle crime and corruption
44 9 12 0 20 16
Thus it is not surprising that Medvedev won, and the reasons that voters cited for their
ballot decisions reflected such considerations, as Table 6 reports. A total of 51 percent claimed to
support him on the basis of his experience as first deputy prime minister, his program, or his
personality, with another 16 percent expecting him to deliver tangible benefits to their particular
region of the country. United Russia’s nomination accounted for 8 percent of his voters’
decisions, to hear these voters themselves tell it, while 20 percent admitted to backing him
mainly because the authorities (presumably Putin, above all) said they should. The other
candidates won their following mostly on the basis of a protest vote or support for a candidate’s
programmatic goals, though Zhirinovsky picked up a quarter of his ballots through his personal
appeal and a fifth of Zyuganov voters thought he would be able to help their particular region.
28

Table 7. Top Reason Given for Voting for a Given Presidential Candidate from a Given List of Possible Reasons, Percentage of that Candidate’s Voters
Among Voters for the Following Candidates Reason
Medvedev
Zyuganov
Zhirinovsky
Bogdanov Work in last post 23 4 1 0 Like program 18 38 23 0 Like personality 10 4 24 0 Party nomination 8 0 0 0 Obey authorities 20 1 0 0 Pork barrel 16 20 11 38 Protest vote 1 31 31 62
Clearly, however, as Table 8 indicates, the Putin factor was critical as well. When asked
how important Putin’s endorsement was for their decisions, nine-tenths of the Medvedev voters
in our sample replied either important (48 percent) or very important (42 percent). While close to
two-thirds said that the United Russia Party’s nomination was also important (47 percent) or very
important (16 percent) in this same regard, when asked which was more important, most of
Medvedev’s electorate (59 percent) said Putin’s support was more important. That said, 32
percent averred that Putin’s and United Russia’s support were equally important, which would
reinforce the signs presented above that United Russia has become something not entirely
reducible to the person of Vladimir Putin. In any case, voters did not indicate that the decision on
how to cast their ballots was a close one: 62 percent said that they had already decided on their
choice more than a month before the election, with only 4 percent doing so on Election Day.
Accordingly, we find that Medvedev won majority votes even among the transitional partisans of
every single major party, including the Communists, as reported in Table 9.
29
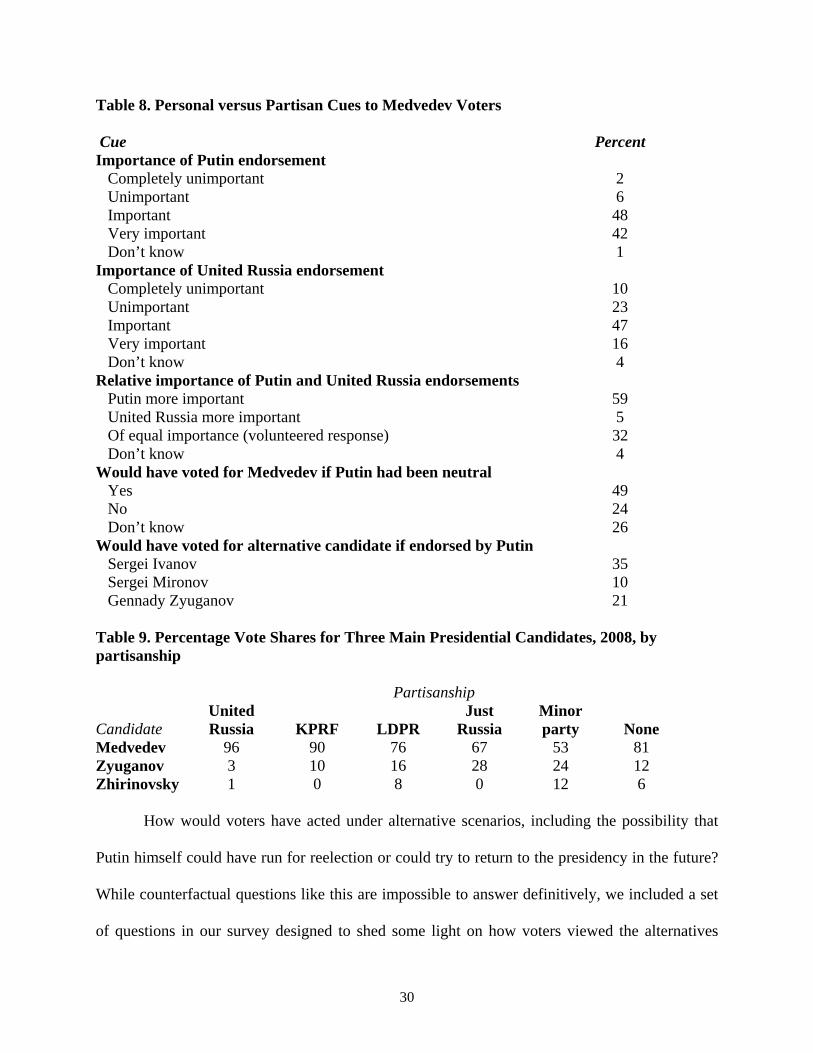
Table 8. Personal versus Partisan Cues to Medvedev Voters Cue Percent Importance of Putin endorsement Completely unimportant 2 Unimportant 6 Important 48 Very important 42 Don’t know 1 Importance of United Russia endorsement Completely unimportant 10 Unimportant 23 Important 47 Very important 16 Don’t know 4 Relative importance of Putin and United Russia endorsements Putin more important 59 United Russia more important 5 Of equal importance (volunteered response) 32 Don’t know 4 Would have voted for Medvedev if Putin had been neutral Yes 49 No 24 Don’t know 26 Would have voted for alternative candidate if endorsed by Putin Sergei Ivanov 35 Sergei Mironov 10 Gennady Zyuganov 21 Table 9. Percentage Vote Shares for Three Main Presidential Candidates, 2008, by partisanship
Partisanship
Candidate United Russia KPRF LDPR
Just Russia
Minor party None
Medvedev 96 90 76 67 53 81 Zyuganov 3 10 16 28 24 12 Zhirinovsky 1 0 8 0 12 6
How would voters have acted under alternative scenarios, including the possibility that
Putin himself could have run for reelection or could try to return to the presidency in the future?
While counterfactual questions like this are impossible to answer definitively, we included a set
of questions in our survey designed to shed some light on how voters viewed the alternatives
30

Putin faced as his second presidential term drew to a close.
Interestingly, we find spotty support at best for the idea that Putin should have remained
in the Kremlin. Russians on balance, by 49 percent to 40 percent, thought that the constitution
should not have been amended to let him run for a third term, and fewer than half (48 percent)
agreed that Putin should ever return to the presidency now that he had left it.26 The numbers
were strongly against the idea that Putin might become president for life if he returns, a
proposition rejected by 67 percent of our respondents and supported only by 16 percent. All this
said, Russians did not want Putin to withdraw from politics completely once Medvedev assumed
office: Only 10 percent thought this appropriate and 77 percent were opposed.
And what about the possibility that Putin could have endorsed someone else, like Sergei
Ivanov? While such a move would have altered the campaign and media coverage that had
influenced our voters by spring 2008, asking about it gives us some insight into how much of
Medvedev’s support was his own and how much was purely a reflection of his association with
Putin. As Table 8 shows, it turns out that only half of Medvedev’s voters (49 percent) said they
would have cast a ballot for him had Putin taken a neutral position instead of endorsing him, and
about a quarter (24 percent) said they would not have done so, with 26 percent finding it hard to
say.
We then posed to our Russian respondents a series of counterfactual possibilities in
which Medvedev was not in the race and Putin endorsed someone else. These hypothetical
“someone elses” would all get far fewer votes than Medvedev actually did, at least as voters
viewed things in spring 2008. Had Putin endorsed the silovik Ivanov, Table 8 reports that only
35 percent of our respondents said they would have voted for Ivanov, significantly fewer than
26 Twenty-nine percent said he should not return to the presidency while 23 percent found it hard to say.
31

said they would vote against him.
This was still far better than how A Just Russia leader Sergei Mironov would have
performed as Putin’s favored one: only a puny 10 percent in our survey would have voted for
him in this situation and 61 percent said they would not. Had Putin decided to endorse the
Communist Zyuganov, a possibility no one seriously contemplated, 63 percent of our
respondents said they would not have voted for him and only 21 percent said that they would
have. The numbers could have come out quite differently had the state-controlled media buffed
up any one of these alternatives’ image in preference to Medvedev’s. All the same, the data
reinforce the conclusion that Russian voters do not support Putin reflexively and that the potency
of his endorsement varies with who it is that he is endorsing and whether they think that he is
blessing a confederate who shares his goals and views.
This impression is reinforced when we look at what Russians as of spring 2008 expected
to result from Medvedev’s election. On the one hand, they almost uniformly believed that Putin
and Medvedev in the coming years “will have similar views on fundamental questions” (80
percent), not that “significant differences will exist between them” (9 percent). On the other
hand, they were split on exactly which member of the tandem would wield the most impact on
policy over the coming three or four years: 37 percent anticipated that Putin would, but almost
the same amount (36 percent) felt they would have equal influence and 18 percent expected
Medvedev to emerge on top. Even more strikingly, we found that a goodly plurality (42 percent)
believed that Medvedev should have the most policy influence in Russia, with only 18 percent
thinking that Putin should be dominant and 30 percent wanting to see them rule equally. There
may, in other words, be limits to the allure of Vladimir Putin.
Conclusion
32
That Russian voters displayed some autonomous thinking and had sincere reasons to vote
for Medvedev does not, of course, negate the fact that the 2007–08 campaign season was
managed by the authorities and was, by most disinterested accounts, the most meticulously
engineered since the Soviet ballots of the mid-1980s. Unwanted candidates were effectively
weeded out, alternative candidates had no opportunity to debate Putin or Medvedev face-to-face
during the campaign period, news coverage on the most influential media was skewed toward the
authorities, both formal and off-the-books party finances were tightly controlled through a single
Kremlin-connected bank,27 the Central Election Commission was headed by a longtime Putin
associate without a law degree and with little prior experience running national elections, and the
OSCE’s observer team was thwarted in its effort to fully monitor things. Others found strong
evidence of fraud, with one striking indicator being the large number of precincts reporting
Duma election turnout percentages with round numbers, with “spikes at 60, 70, 80, 90, and even
100 percent.”28
At the same time, there is no denying that the typical Russian voter had to be persuaded
in order to cast a ballot for Medvedev and was amenable to persuasion in part because of
agreement with the policies Medvedev was believed to offer and because of the widespread
perception that there had been a great deal of progress under the same policies during the Putin
era. There was, in short, real content to Medvedev’s and United Russia’s central campaign
message that they would continue along the path blazed by Putin.
Broad agreement with policy stands and strongly positive performance appraisals tend to
generate strong votes for incumbents even in model democracies, not to mention countries like
Russia where media and a large network of other levers can reinforce a campaign message along
27 On this, see Natalia Morar’, “Chernaia kassa Kremlia,” Novoe Vremia (The New Times), December 10, 2007, pp.18-22.
33
34
these lines. Our survey findings, then, do not void the argument that abuses took place during the
Russian national elections of 2007–08. They do strongly suggest that this was far from the full
story. It remains to be seen what would happen if Putin’s team were ever to face an election in a
time of grave crisis when they were unable to win the support of voters regardless of their
attempts to manipulate popular opinion.
In light of these realities, policymakers would do well to avoid two pitfalls. For one thing,
they should not to put too many eggs in the Putin basket and rule out the possibility that
Medvedev will eventually build up a power base of his own, perhaps even one rooted in public
attitudes. Russian voters as of 2008 seemed open to such a possibility. For another, policymakers
would do well to understand that the ruling duumvirate’s appeal to the population is not based
primarily on anti-Westernism or an anti-market animus but instead on guardedly pro-Western
sentiment (with an emphasis on “guardedly”) and a broadly pro-market (if selectively so)
economic orientation. While they may yet shift stance, to date they have not been willing to run
roughshod over public opinion. As we go ahead, therefore, close monitoring of the public mood
will provide important clues as to how Russia will behave—and how far it will go to challenge
Western ideals and norms—at home and abroad.
28 RFE/RL Newsline, February 29, 2008.