rwandaʼs changing environment - unep/grid-sioux falls
TRANSCRIPT

Rwandaʼs Changing EnvironmentAtlas of
Implications for Climate Change Resilience
This Atlas is a visual account of Rwanda’s state of natural resources revealed through maps, current and historical satellite images, aerial and ground photographs as well as narrative based on extensive scienti� c evidence. The Atlas serves as a re� ection on the progress made towards mitigating environmental degradation and climate change that were recognized as some of the main barriers to realizing medium term Millennium Development Goals and the development aspirations of the Rwanda Vision 2020.
These visual elements provide Rwandan decision makers and stakeholders in production sectors with compelling illustrations of how human activities have altered their surroundings resulting in adverse impacts on the environment. The information provided will not only be useful in the context of the selected locations, but will also underscore the intrinsic value of the harnessing, visualizing and communicating technologies to gain a deeper understanding of the dynamics and impacts of Rwanda’s environmental changes.
Atlas of Rw
andaʼs Changing Environm
ent Implications for C
limate C
hange Resilience


Atlas of
Implicat ions for Cl imate Change Resi l ience
Rwanda's Changing Environment
REPUBLIC OF RWANDA

Copyright ©2011, Rwanda Environment Management Authority
This publication may be produced in whole or in part and in any form for educational or nonprofit purposes without special permission from the copyright holder, provided acknowledgement of the source is made. Rwanda Environment Management Authority (REMA) would appreciate receiving a copy of any publication that uses this report as a source.
No use of this publication may be made for resale or for any other commercial purpose whatsoever without prior permission in writing of the Rwanda Environment Management Authority.
This is a Government of Rwanda Publication.For bibliographic and reference purposes this publication should be referred to as :“REMA (2011) - ATLAS OF RWANDA’S CHANGING ENVIRONMENT: Implications for Climate Change Resilience”Rwanda Environment Management AuthorityP.O. Box 7436 Kigali, Rwanda
To obtain copies of this publication, please contact:
REMAP.O. Box 7436 KigaliTel +250252580101Fax +250252580017E-mail : [email protected]: www.rema.gov.rw.
Printed by Progress Press co Ltd, Malta
Cover Photos (left to right): REMA 2011, REMA 2011, REMA 2010, REMA 2011, REMA 2010, Giles Tordjeman 2004, REMA 2006, REMA 2011
This report was prepared using funds provided by the Government of Rwanda with financial support from the United Nations Development Programme (UNDP), Rwanda. Technical support and capacity building was provided by the United Nations Environment Programme (UNEP)
The views expressed in this publication are not necessarily those of the agencies cooperating in this project. The designations employed and the presentations do not imply the expression of any opinion whatsoever on the part of REMA or cooperating agencies. Mention of a commercial company or product in this report does not imply endorsement by REMA.
The use of information from this publication for publicity or advertising is not permitted. Trademark names and symbols are used in an editorial fashion with no intention of infringement on trademark or copyright laws.
We regret any errors or omissions that may have been unwittingly made.
UNEP promotes environmentally sound
practices globally and in its own activities. This publication is printed on 100 per cent chlorine free paper
from sustainably managed forests. Our distribution policy aims to reduce UNEP’s carbon footprint.

Table of ContentsForeword ...................................................................................................................................................... i
Preface ......................................................................................................................................................... ii
Production and Editorial Teams .................................................................................................................. iv
Acronyms ..................................................................................................................................................... v
List of Figures and Tables ............................................................................................................................ vi
Background and Introduction .................................................................................................................... vii
CHAPTER 1: ENVIRONMENTAL PROFILE .......................................................................1Introduction .................................................................................................................................................1Topography .................................................................................................................................................3Biodiversity .................................................................................................................................................3Climate ........................................................................................................................................................4Hydrology ....................................................................................................................................................5Forests .........................................................................................................................................................8Administrative Structure ...........................................................................................................................10Primary Policy Framework .........................................................................................................................13Landmark Accomplishments and Challenges ............................................................................................17Conclusion .................................................................................................................................................20References .................................................................................................................................................21
CHAPTER 2: ENVIRONMENTAL CHANGES OF SELECTED HOTSPOTS .............23Introduction ...............................................................................................................................................23Population Pressure and Shrinking Land Base ...........................................................................................24Urban Health with a Focus on Kigali City ...................................................................................................26Integrated Settlement, Land, Water and Energy Husbandry .....................................................................32Wetlands ...................................................................................................................................................36Forests .......................................................................................................................................................44Mining .......................................................................................................................................................52References .................................................................................................................................................54
CHAPTER 3: ENVIRONMENTAL CHANGES OF TRANSBOUNDARY NATURAL RESOURCES AND ISSUES ...............................................................................57Introduction ...............................................................................................................................................57Transboundary Water Resources ...............................................................................................................58Protected Areas .........................................................................................................................................59Transboundary Movement of People ........................................................................................................70Conclusion .................................................................................................................................................74References .................................................................................................................................................75
CHAPTER 4: SCENARIO ANALYSIS AND ENVIRONMENTAL GOVERNANCE ...................................................................................77Introduction ...............................................................................................................................................77Demographic Changes and Environment ..................................................................................................78Realizing Vision 2020: The Challenge and Lessons from Future Scenarios ...............................................78Future Changes in Selected Environmental Issues ....................................................................................80References ...............................................................................................................................................87
CHAPTER 5: CONCLUSIONS AND RECOMMENDATIONS .....................................89Introduction ..............................................................................................................................................89Population Pressure and Shrinking Land Base ...........................................................................................90Urban Health with a Focus on Kigali City ...................................................................................................90Forests .......................................................................................................................................................91Wetlands ...................................................................................................................................................91Mining .......................................................................................................................................................91Transboundary Natural Resources and Issues ...........................................................................................92Scenario Analysis and Environmental Governance ...................................................................................92

Two rare Angolan colobus monkeys (Colobus angolensis) in Nyungwe Forest National Park. RE
MA
2011

i
Rwanda’s State of the Environment report for 2011 titled ‘Atlas of Rwanda’s changing environment: Implications for climate change resilience’ has taken on an exciting pictorial form. It draws the attention of decision makers to environmental hotspots where human activity has led to environmental degradation. The Atlas also showcases the results of successful policy interventions that have mitigated and reversed some of the negative environmental impacts.
Rwanda has recorded an impressive annual economic growth rate that has averaged 8 per cent per annum over the last five years and sustained a relatively low, single digit inflation rate. The Country has also successfully integrated components of environmental sustainability in the various policies such as Vision 2020, the Country’s long term development blueprint which was finalized at the turn of the millennium. These have set the stage for steering the economy to a low carbon development pathway that is essential to building a green economy.
As an economy still dependent on ecosystem services supplied by natural resources for the majority of the population, implementation of policies on ecosystem rehabilitation were prioritized. Success in restoring degraded wetlands, riverbanks and lakes won Rwanda the prestigious Global Environmental Award. The Country was also awarded the 2010 Green Globe Award for successfully restoring the ecological functioning of the Rugezi-Burera-Ruhondo network, an inland freshwater lake-wetland ecosystem.
Reforestation programmes in all parts of the Country have increased Rwanda’s forest cover to 10 per cent in the past decade. The 2004 National Forest Policy which provided an innovative policy framework for these reforestation efforts, as well as Law N° 57/2008 relating to the prohibition of manufacturing, importation, use and sale of plastic bags won Rwanda the prestigious Future Policy Award in 2011.
Rwanda is implementing complementary policies of land use reorganisation including gradual conversion of unplanned and scattered rural settlements into space optimized, utility serviced and environmentally friendly villages known as Imidugudu. This will facilitate efficient land use and enable consolidation of fragmented land parcels into commercially viable farms where large scale agriculture which is associated with several economies of scale, can be practised.
In order to lower carbon emissions and attain energy security, the Country is proactively exploring the opportunities that tap the abundant reserves of methane gas in Lake Kivu. The potential for harnessing geothermal energy in the Country is also very promising and under serious consideration. It is envisaged that these initiatives will reduce Rwanda’s overreliance on fossil fuels that are emitters of greenhouse gases (GHGs).
Our consistent efforts to transition Rwanda to a low carbon, climate resilient development path earned the Country the coveted Energy Globe Honorary Award in 2010. The Country was also privileged to host the 2010 World Environment Day global celebrations.
The Government is also committed to ensuring equitable utilization of the Country’s domestic and transboundary natural resources for the benefit of present and future generations. For example, by virtue of its unique position at the headwaters of the Nile, Rwanda is acknowledged as an important ‘water tower’ of the Nile Basin Countries (NBCs) and actively participates in the river’s management. Indeed in 2010, Rwanda, along with Kenya, Uganda, Tanzania, Burundi and Ethiopia, signed the Nile Basin Cooperative Framework Agreement that is a cooperative and coordinated mechanism for managing the Nile water resources.
Despite these commendable achievements, there are also many vivid reminders that our natural resources’ heritage is becoming increasingly scarce as the Country’s population grows. This is threatening livelihoods and a range of development goals enshrined in Vision 2020 and the MDG-based Economic Development and Poverty Reduction Strategy (EDPRS).The Atlas’ chapter on environmental change highlights these changes using before and after satellite images, aerial and ground photographs, statistical analyses, spatial trends and trend graphs. Future scenarios are also presented and accompanied by a number of policy recommendations.
It is my hope that this Atlas will serve as a useful tool in our collective effort to continue building a low-carbon, climate resilient economy that will deliver Rwandans out of the grip of poverty and one that can be proudly handed over to future generations.
Hon. Stanislas KamanziMinister of Natural ResourcesRepublic of Rwanda
Foreword

ii
Preface
The State of the Environment Report is a biennial mechanism laid out in the law to provide decision-makers with an articulate view of the nature and extent of environmental degradation and climate change as well as recommended corrective actions.
The first State of the Environment Report was published in 2009. It measured environmental performance at the national level against the targets set out in Vision 2020 and its Millennium Development Goals (MDGs) based implementation framework, the Economic Development and Poverty Reduction Strategy (EDPRS).
The 2009 State of the Environment (SoE) Report highlighted successful environment management measures and focussed on erosion control efforts and conservation of biological diversity as key areas of interest. Thus, it demonstrated commendable environmental management progress in the post-genocide era.
This report titled ‘Atlas of Rwanda’s changing environment: Implications for climate change resilience’ is the second edition in the SoE Report series. It presents a visual account of the country’s environment based on extensive scientific evidence identified and supplied by stakeholders from the various sectoral institutions and implementation agencies. The maps, current and historical satellite images, aerial and ground photographs and storylines provide compelling evidence of human and climate change induced environmental degradation.
This Atlas reflects briefly on the progress made to mitigate environmental degradation and climate change in relation to the recommendations of the 2009 State of the Environment Report. Recent monitoring through the EDPRS shows progress of sectoral targets specified in Vision 2020 to be generally on track.
The key hotspots of environmental change featured in the Atlas include issues of land use pressure, rapid urban expansion and associated environmental health problems. The Atlas illustrates exponential population growth over the last four decades using the City of Kigali as an environmental hotspot. Issues of urban sprawl, solid waste management and industrial zoning are discussed using compelling images.
It is encouraging to witness the corrective policy measures in progress, illustrated in the Atlas as positive changes. Some of the successful policy interventions featured in the Atlas show model integrated livelihood activities based on complementary policy actions bringing together planned and serviced rural resettlements locally known as Imidugudu. These model settlements enable land consolidation and crop intensification, simple rainwater harvesting for domestic use and irrigation of high value food crops for improved nutrition and export, and livestock biogas production for domestic energy, diary and fertilizer requirements.
Tea plantation bordering the Nyungwe rainforest.
Rac
hel
Str
ohm
2007

iii
Wetland degradation mainly due to construction encroachment and conversion into agricultural use are illustrated by hotspots in urban and rural areas. Similar techniques are applied to show the significant loss of the fragile afro montane forest of Albertine Rift in the western part of the country. Effects of successful rehabilitation efforts including those of the Rugezi Wetland which is now designated as a Ramsar site are also displayed in image change pairs.
The Atlas provides an alarming picture of land degradation and water pollution due to inappropriate mining practices. The graphic evidence of severe degradation calls for urgent action from proprietors as well as sectoral policy implementation agencies.
Transboundary natural resources are highlighted in maps and images depicting collaborative potential with Rwanda’s neighbours at bilateral and community levels. Our water resources and protected areas are generally contiguous with those of our neighbours including the Nyungwe Forest National Park and the Volcanoes National Park which is world famous as a habitat for the critically endangered mountain gorilla. Recent ecological changes are illustrated in the Akagera National Park, the main host of wetland complexes and lakes that contribute to Lake Victoria and the Nile River.
Involuntary transboundary movement of people mainly from the neighbouring Democratic Republic of Congo have presented serious environmental impacts for Rwanda. These are depicted by large refugee camps whose adverse environmental impacts are shown in image change pairs.
The Atlas also provides a review of the alternative scenarios discussed in the 2009 State of the Environment Report for different environmental policy approaches projected into possible socio-economic development outcomes in the future. It concludes by briefly presenting a range of recommendations.
I wish to record my appreciation to the representatives of the various institutions, partners and stakeholders for their invaluable support in the production of this Atlas. In particular, I wish to express my gratitude to the Hon. Minister of Natural Resources, Ambassador Stanislas Kamanzi, the Honourable Minister of State in Charge of Water and Energy, Ms. Coletha Ruhamya, and the Mayor of the City of Kigali, His Worship Fidele Ndayisaba for personally providing policy insights on the various themes featured in this Atlas.
I am also indebted to the United Nations Environment Programme (UNEP) for its assistance in training our staff and technical backstopping the Atlas preparation and production processes. I am also immensely thankful to the UNDP Rwanda Country Office which provided us funding for the preparation and the production of this Atlas.
I wish to record my sincere appreciation to the sectoral stakeholders from the central and local government institutions, academia, national utility institutions, development partners and NGOs, as well as private environmental practitioners. Their dedication and contribution towards the preparation and validation of this Atlas are commendable. I do not forget my colleagues in REMA who have played a key to see this Atlas produced.
I hope that this Atlas will inspire various levels of decision makers and all Rwandans to take individual and collective action to firmly position our Country on a low carbon, climate resilient development path. The ultimate goal is to encourage behavioural change among the Rwandan society towards livelihood activities that promote environmental sustainability and greening the economy for the benefit of present and future generations.
Dr. Rose MukankomejeDirector GeneralRwanda Environment Management Authority

iv
Production & Editorial Teams
Policy Advisory TeamGovernment of RwandaHon Amb Stanislas Kamanzi - Minister of Natural ResourcesHon. Eng. Coletha U. Ruhamya - Minister of State for Water and EnergyHW Fidele Ndayisaba - Mayor, City of KigaliJean Baptiste Nduwayezu - Chairman, Board of Directors, REMARose Mukankomeje – Director General, REMA
UNEPIbrahim ThiawMounkaila GoumandakoyeFrank TuryatungaDavid Smith
Technical Coordination REMAMarie Laetitia BusokeyeAlex MulisaFabrice MugaboAlphonse Mutabazi
UNEPAshbindu SinghCharles SebukeeraChristopher O. AmbalaAngela Lusigi
Arshia Chander (SGT, Inc)
UNDP Rwanda Country Office Auke Lootsma
ProductionAuthorsDenis Rugege - Team LeaderAlex MulisaWashington Ocholla
Illustrations & Satellite Image AnalysisDenis Rugege Eugene Apindi Ochieng Bruce Pengra (ARTS)Rudi Drigo
EditorsMonday S. Businge (Coordinating Lead Author and Principal Editor)Elizabeth Gowa (Editor)
Design and LayoutKim Giese (SGT, Inc)ContiNet Designs
PhotographsREMA acquisition
Sectoral ContributorsCentral Government InstitutionsVincent Rwigamba (MINEAC)Jean Bosco Hagwirineza (MININFRA)Isaac Mitali Mutabazi (MINISANTE)Francois Xavier Uwitonze (MININFRA)Philbert Kabanda (MININFRA/Energy)Eric Ntagegerwa (MININFRA/Transport sector)Thaddee Munyaneza (MININFRA/Transport sector)Marcellin Habimana (MININFRA/Rwanda Meteorology Service)Floribert Vuguziga (MININFRA/Rwanda Meteorological Service)Josiane Umutoni (MIDIMAR)Theogene Ntaribi (MIDIMAR)Daniel Ntawimenya (MINAGRI)Emmanuel Mugabo (MINALOC)Jackson Mugisha (MINALOC)Theoneste Niyonzima (MINEDUC)Denise Uwera (MINEDUC)Theoneste Niyonzima (MINEDUC)Olivier Gasore (MINICOM)Mediatrice Nyiranzeyimana (MINIFOM)Theogene Hakubaho (MINIRENA)Achille Ngombwa (MINIRENA)Donatha Nkundimana (NISR)Jean Claude Mwizerwa (NISR)Sophie Mukasitoni (RNRB)Jean Marie Vianey Kuradusenge (RNRB)Francois Bizimungu (RDB)Abel Musana (RDB/Volcanoes National Park)Rachael Tushabe (REMA)Juma Nsenzimana (REMA)Rita Umurerwa (REMA)Euphrasie Uwingabire (REMA)Venuste Ntaganda (REMA)Juliet Kabera (REMA)David Bucakara (REMA)Canisius Kayitera (REMA)Emmanuel Kabera (REMA)Fred Sabiti (REMA)Jean Ntazinda (REMA)Raphael Mpayana (REMA)Janvier Kabananiye (REMA)Gisele Umuhumuza (REMA)Faustin Munyazikwiye (REMA)Remy Norbert Duhuza (REMA)Laetitia K. Umuhoza (REMA)
Local Government InstitutionsGeofrey Kyatuka (Kigali City)Julius (Kigali City)Toshikazu Mito (Kigali City)Come Nkezabera (Burera District)Dorothee Batumuriza (Gicumbi District)Eric Habyarimana (Karongi District)Sylvain Mutabaruka (Kirehe District)Theoneste Bateho (Muhanga District)Sematabaro Mutabaruka (Ngoma District)Bustani Sebitereko (Ngororero District)Aline Nshyimyabarezi (Nyagatare District)Ancille Karangwayire (Nyamagabe District)Aimable Nsengimana (Nyanza District)Jean Pierre Ndagijimana (Musanze District)Julius Andrew Ayebale (Gisagara District)Ernest Hazabumuhanga (Kayonza District)Valens Kabalisa (Kamonyi District)Augustin Nyonga Murenzi (Gakenke District)Innocent Harerimana (Rubavu District)Emmanuel Rwakayigamba (Rwamagana District)
Higher Learning and Research InstitutionsRachel Murekatete (NUR)Francois Xavier Naramabuye (NUR)Jean Gapusi (LAB/ISAR)Rachel M. Mahuku (KIE)Innocent Nkurunziza (LAB/ISAR)Felix Ndagijimana (DFGFI-KRC)
National Utility InstitutionsDanny Rwagasana (EWSA)Bruce Uwonkunda (EWSA)Philbert Tuyisenge (EWSA)Jean Baptist Nkurikiyimana (EWSA)Francine Aimée Umuhoza (EWSA)
Development PartnersRudi Drigo (FAO/WISDOM Rwanda)Vital Nzabanita (FAO/WISDOM Rwanda)Yoko Watanabe (GEF)
Non Governmental OrganizationsEugenie Umulisa (RENGOF)Johnson Nkusi (RENGOF)Francoise Kayigamba (NELSAP)Madeleine Nyiratuza (Great Ape Trust)Sylvain Nyandwi (Great Ape Trust)Serge Nsengimana (ACNR)

v
Acronyms
ADF African Development Fund
AEO African Environmental Outlook
AfDB African Development Bank
AIDS Acquired Immune Deficiency Syndrome
AME Ameliorated Scenario
BAU Business as Usual
BCC Budget Call Circular
CBD Convention on Biological Diversity
CCLCD Green Growth and Climate Resilience: National Strategy for Climate Change and Low Carbon Development
CDP Community Development Policy
CER Carbon Emission Reduction units
DDPs District Development Plans
DRC Democratic Republic of Congo
EAC East African Community
EDPRS Economic Development and Poverty Reduction Strategy
EIAs Environmental Impact Assessments
EWSA Energy, Water and Sanitation Authority
FAO Food and Agriculture Organization of the United Nations
FONERWA National Fund for the Environment in Rwanda
GACP Gishwati Area Conservation Programme
GDP Gross Domestic Product
GEF Global Environment Facility
GEO Global Environmental Outlook
GHGs Greenhouse gases
GSR Green Schools Rwanda
GWh Gigawatt Hour
HIV Human immunodeficiency virus
ICT Information and Communications Technology
IDPs Internally Displaced Persons
IIED International Institute for Environment and Development
ILEG Institute for Law and Environmental Governance
IPCC Intergovernmental Panel on Climate Change
IRWR Internal Renewable Water Resources
ISAR Agricultural Research Institute of Rwanda
IWRM Integrated Water Resource Management
KCC Kigali City Council
LVBC Lake Victoria Basin Commission
LVEMP II Lake Victoria Environmental Management Project II
MDGs Millennium Development Goals
MEAs Multilateral Environmental Agreements
MGNP Mgahinga Gorilla National Park
MIFOTRA Ministry of Public Service and Labour
MINAGRI Ministry of Agriculture and Animal Resources
MINALOC Ministry of Local Government
MINASANTE Ministry of Health
MINECOFIN Ministry of Finance and Economic Planning
MINEDUC Ministry of Education
MINICOM Ministry of Trade and Industry
MINIJUST Ministry of Justice
MININFRA Ministry of Infrastructure
MINIRENA Ministry of Natural Resources
MINITERE Ministry of Lands, Environment, Forests, Water and Mines
MoU Memorandum of Understanding
MTEF Medium Term Expenditure Framework
MW Megawatts
NAPA National Adaptation Programme of Action
NBI Nile Basin Initiative
NES National Export Strategy
NISR National Institute of Statistics of Rwanda
NUR National University of Rwanda
OLPC One Laptop Per Child
PAREF Projet d'appui à la reforestation
PEI Poverty Environment Initiative
PES Payments for Ecosystem Services
PNV Volcanoes National Park
PNVi Virunga National Park
PRSP1 Poverty Reduction Strategy Paper
REMA Rwanda Environment Management Authority
RoR Republic of Rwanda
SEA Strategic Environmental Assessment
SEI Stockholm Environment Institute
SOE State of the Environment
TBNRM Transboundary Natural Resource Management
UN United Nations
UNDP United National Development Programme
UNEP United Nations Environment Programme
USAID United States Agency for International Development
VUP Vision 2020 Umurenge Programme
WAIPA World Association of Investment Promotion Agencies

vi
List of Figures and Tables
FiguresFigure 1.1: Location of Rwanda. ................................................................................................................................................ 2
Figure 1.2: A three dimensional visualization of Rwanda’s relief showing the major topographic subdivisions. ...................... 3
Figure 1.3: Average annual precipitation (mm). ........................................................................................................................ 4
Figure 1.4: Mean annual temperatures in Kigali and Kamembe (1971 – 2009). ....................................................................... 4
Figure 1.5: Rwanda’s hydrological network. .............................................................................................................................. 5
Figure 1.6: The course of the Akagera River until it empties into Lake Victoria. ....................................................................... 6
Figure 1.7: Rwanda’s forest cover. ............................................................................................................................................. 8
Figure 1.8: Trends in natural forest cover. ................................................................................................................................. 9
Figure 1.9: Rwanda’s government hierarchy. .......................................................................................................................... 10
Figure 1.10: Rwanda’s provinces and districts. ........................................................................................................................ 11
Figure 1.11: Thematic overview of Vision 2020. ..................................................................................................................... 13
Figure 1.12: Trade balance trends 2005-2009. ........................................................................................................................ 19
Figure 1.13: Major contributors to Rwanda’s GDP, 2005-2009. .............................................................................................. 19
Figure 1.14: Overall performance of EDPRS targets for the achievement of MDGs and Vision 2020. .................................... 20
Figure 2.1: Population growth since 1960... .............................................................................................................................. 24
Figure 2.2: Map depicting the Kigali City’s districts and sectors. ............................................................................................. 26
Figure 2.3: Population growth trends of Kigali City. ............................................................................................................... 27
Figure 2.4: Location of Rwanda’s wetlands. ........................................................................................................................... 36
Figure 2.5: Rwanda’s wetland protection levels. .................................................................................................................... 37
Figure 2.6: Proportion of upstream area under agriculture. ................................................................................................... 39
Figure 2.7: Location of Rwanda’s key forests, including Gishwati Forest Reserve. .................................................................. 45
Figure 2.8: Mineral distribution by district in Rwanda. ........................................................................................................... 52
Figure 3.1: Map showing Rwanda’s transboundary resources consisting of water resources protected areas. ..................... 58
Figure 3.2: Map depicting the historical and transboundary nature of Volcanoes National Park. .......................................... 60
Figure 3.3: Proposed transnational railway line from Dar es Salaam, Tanzania to Kigali, Rwanda and Musongati, Burundi. ............................................................................................................... 73
Figure 4.1: Annualized costs of adaptation. ............................................................................................................................ 80
Figure 4.2: Adaptations for water and flood risk to infrastructure. ......................................................................................... 82
Figure 4.3: Rwanda land cover map merging ISAR-NUR forest cover map and Africover map. .............................................. 83
Figure 4.4: Spatial distribution of future woody biomass consumption. ................................................................................ 83
Figure 4.5: Balance between sustainable woody biomass production and wood fuel demand with assumptions similar to the Rwanda Environment Outlook Scenarios. ........................................... 84
Figure 4.6: Available woody biomass based on scenarios similar to Market Forces and Policy Reform Scenarios. ................ 84
Figure 4.7: Projected future distribution of land use types under the four scenarios compared with the 2007 baseline. ..... 85
Figure 4.8: GHG emissions by GHG (excluding LUCF). ............................................................................................................. 86
Figure 4.9: Historic and projected estimates of electricity generation (GWh) in Rwanda, 2005-2020. .................................. 86
TablesTable 1.1: Addressing the environmental challenges of the Vision 2020 pillars. ..................................................................... 14
Table 1.2: Progress in meeting the environment-related EDPRS targets. ................................................................................ 16
Table 1.3: Recommendations of the Rwanda State of Environment Report 2009. ................................................................. 18
Table 1.4: 2010 Mid-term review of the progress towards achieving Vision 2020 goals and the MDGs. ............................... 19
Table 4.1: Recommendations for addressing specific climate change adaptation challenges. ............................................... 81
vii
IntroductionArticle 3(3) of law N° 16/2006 of 03/04/2006 determining the organization, functioning and responsibilities of the Rwanda Environment Management Authority (REMA) obligates the organization to take stock of, and report on the state of the environment on a biennial basis. REMA is itself established by Article 65(1) of Organic Law N° 04/2005 of 08/04/2005 determining the modalities of protection, conservation and promotion of the environment in Rwanda.
The state of environment report for 2011 is the logical follow up to the 2009 report. In keeping with the ancient Chinese proverb that a picture is worth a thousand words, the 2011 report is deliberately presented as an environmental atlas in order to make the messages both concise and compelling. Using visualization, it is possible for the reader to grasp the gist of the environmental changes that Rwanda is undergoing without the tedium associated with combing through lengthy paragraphs of text. Thus maps, graphs and photographs are combined with brief narratives to concisely tell the story of Rwanda’s environment in ways that a largely text-based report cannot. This is especially appropriate for interrogating climate change which is arguably the most challenging environmental issue of our time.
Focus of the AtlasThis Atlas focuses on selected environmental hotspots for which spatial data are available. It includes data on mostly terrestrial biodiversity and landscapes although some aquatic species and natural resources are covered as well. Besides the availability of before and after data, the selection of which themes to profile and map was informed by two major considerations.
The first was to flag adverse environmental developments that require urgent attention in order to prevent them from spiralling out of control. The second was to showcase Rwanda’s innovative environmental policies, programmes and initiatives, many of which have won internationally acclaimed awards. Successes in implementing the plastic bags ban, in reversing massive deforestation, in instituting monetary and fiscal discipline, in attaining gender parity at several decision making levels and in harnessing ICT have transformed Rwanda into a model nation at many levels. These accomplishments essentially prove that environmental and associated development challenges can be overcome. This is especially important given the inextricable linkages between the environment, development and peace which were fully articulated at the 1992 Earth Summit in Rio de Janeiro.
The overarching goal of this Atlas is to show the environmental changes that are taking place in Rwanda. These are interwoven with the climate change theme with specific emphasis on the associated vulnerabilities as well as the mitigative and adaptive opportunities that arise. Tapping these will ensure a low carbon, climate change resilient development path for the country. Moreover, enhancing Rwanda’s climate change mitigative and adaptive capacities was one of key recommendations of this Atlas’ predecessor, the 2009 SOE report.
The focus on climate change is also predicated on the fact that in 2001, climate hazards ranked third among the 10 top causes of poverty in Rwanda (RoR 2005). As a decade has passed since then, it is highly plausible that these climate change impacts have generally heightened rather than abated. Moreover, although Rwanda is a low-carbon economy and is one of the world’s lowest greenhouse gas (GHG) emitters, it is among those most vulnerable to climate change. This is because several parts of the country such as Bugesera, the Eastern Curve, Southern Plateau and lake shore regions are already dangerously close to the water availability, heat tolerance and food security thresholds. The projected intensification of major climatic events such as droughts and floods are bound to exacerbate the associated vulnerabilities (SEI 2009).
The Atlas also provides a reflection on the progress made towards attaining Rwanda’s development goals outlined in Vision 2020 and EDPRS. As elaborated in the Atlas’ Chapter One, recent monitoring through the EDPRS framework indicates that Rwanda is firmly on course to meeting its Vision 2020’s sectoral targets. Nevertheless, the evaluation results presented at the 2010 senior leadership retreat demonstrated that progress towards achieving the poverty, population and environment targets was still off-track. The analyses in this Atlas underline the urgent need to formulate and implement policy responses intended to promote environmental sustainability. Some of the strong policy responses include the integration of environment and climate change priorities in the 2011/2012 budget call circular (BCC) by the Ministry of Finance and Economic Planning (MINECOFIN). Further, the recent formulation of the Green Growth and Climate Resilience: National Strategy for Climate Change and Low Carbon Development (CCLCD) is also intended to ensure resilience in livelihoods and economic sectors.
Background and Introduction
viii
Preparation ProcessAs ‘Atlas of Rwanda’s changing environment: Implications for climate change resilience’ is the second edition in the State of the Environment reporting, it drew inspiration and relied on the key lessons and best practices of the 2009 SOE reporting process. The Atlas was prepared with the active participation of several stakeholders. These included national and sub-national actors that are regularly engaged in natural resource and environmental management, including climate change. The target groups participated in the Atlas’ preparation through individual input, institutional consultations and group discussions (such as those of the environment and natural resources sector working groups). The validation exercises involved participants from several government institutions, development partners, non-governmental organizations (NGOs), the private sector and general Rwandan citizenry.
A significant feature of the Atlas preparation process was the gleaning of policy relevant messages from targeted interviews with policy makers. These included the Minister of environment and natural resources, the Minister in charge of energy and water supply, the Mayor of Kigali City and the Director General of REMA. The atlas therefore presents a visual account of the environment and climate change based on extensive scientific and policy relevant evidence. Because this evidence was identified and supplied by stakeholders from the various sectoral institutions and implementation agencies at all levels of Rwandan society, it is believed to be an inclusive and authoritative document.
Atlas' StructureThe Atlas is divided into five chapters. Chapter 1 titled Environmental profile outlines Rwanda’s geographic features and characteristics as well as the relevant policy framework. Key components of this are Vision 2020, Vision 2020 Umurenge Programme (VUP) and the Economic Development and Poverty Reduction Strategy 2008-2012 (EDPRS). Vision 2020 is Rwanda’s long term development blueprint while the VUP is the decentralized integrated rural development programme that seeks to appreciably alleviate poverty. The EDPRS is the country’s current medium term development plan.
Chapter 2 contains an analysis of the Environmental changes of selected domestic hotspots. The topics covered in this section range from urban health; integrated settlement, land, water and energy husbandry, wetlands, to forests and mining. An integrated assessment of these hotspots highlights their potential for delivering the development targets enumerated
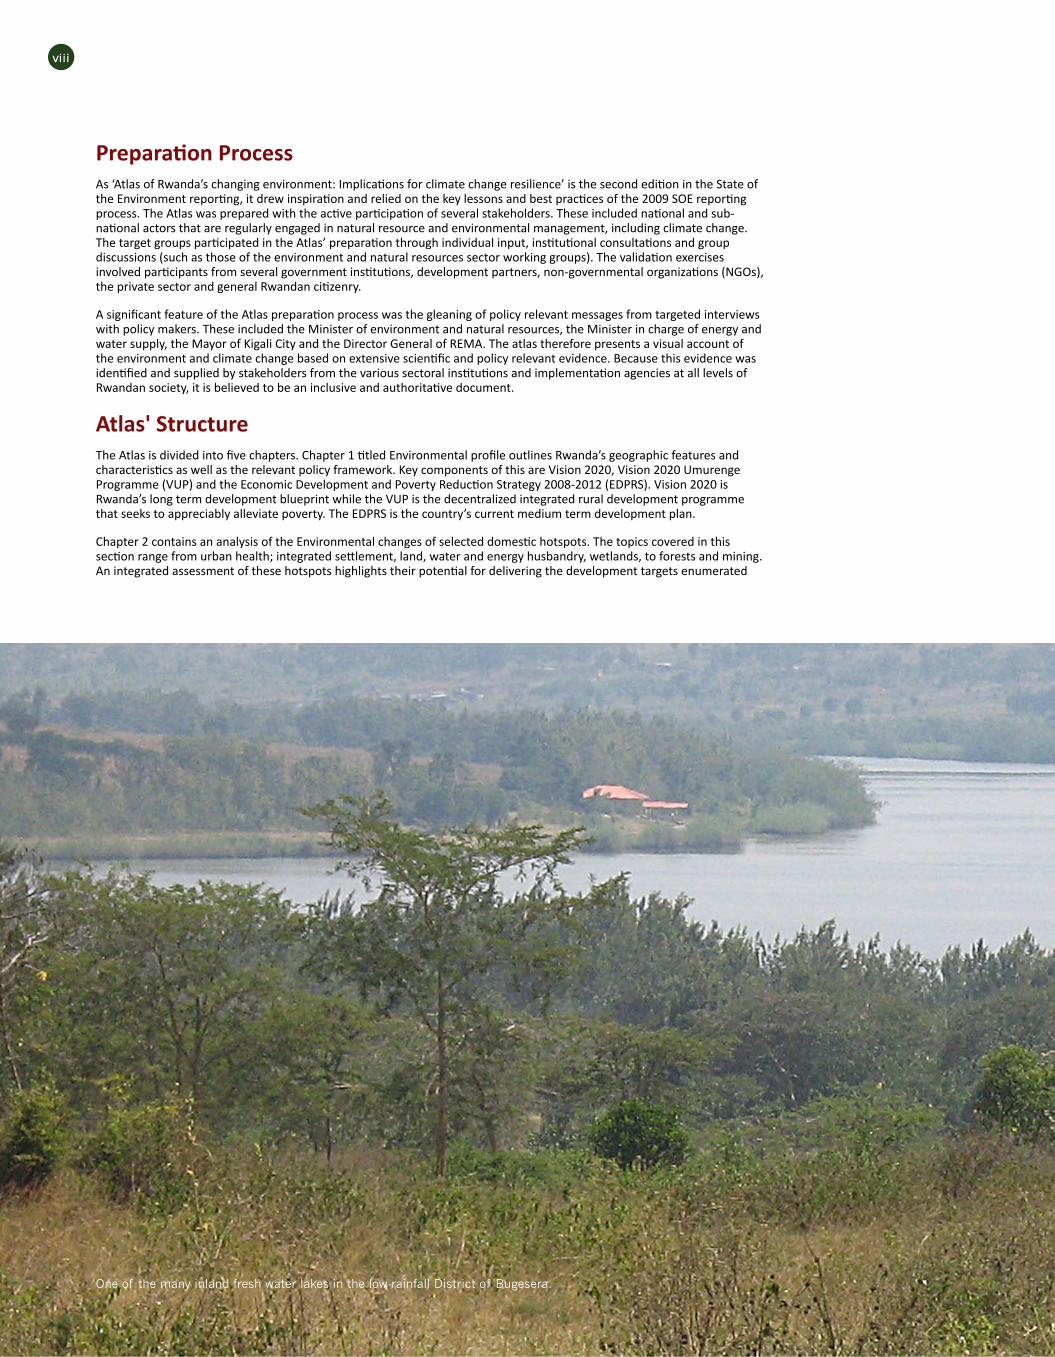
One of the many inland fresh water lakes in the low-rainfall District of Bugesera.

ix
in Vision 2020 and EDPRS, as well as strengthening Rwanda’s climate change resilience. A series of satellite images spanning several years is used to vividly demonstrate the environmental changes of each of the hotspots. These images are complemented by relevant narratives and storylines as well as analyses of the policy and programmatic interventions that are responsible for the trends or trend reversals.
Chapter 3 covers selected Transboundary resources and issues namely: transboundary water resources; transboundary protected areas and transboundary movement of people. Management of transboundary resources is characterized by a unique set of challenges revolving around shared sovereignty over ecosystems and natural resources. Yet despite the fact that each of these natural resources and ecosystems are a single entity from an environmental standpoint, they are subjected to different policy, legal and management regimes. These environmental systems also bear the brunt of spontaneous adverse political, social and economic developments in one or more of the sharing states principally because biodiversity does not respect international borders as these are not physically perceptible. The issue of the transboundary movement of people is especially important for Rwanda given the considerable migration and emigration of people involving the neighboring countries before and after the 1994 genocide against the Tutsi.
Chapter 4 titled Scenario Analysis and Environmental Governance explores Rwanda’s environmental outlook from the perspective of the Vision 2020 and EDPRS targets as well as the MDGs. Using the four scenarios enumerated in the 2009 SOE report namely: Market Forces; Policy Reform; Fortress World; and Great Transitions, it attempts to envisage the trajectories that the country’s development path will take in a range of scenarios where judicious or imprudent environmental decisions are made. The resulting consequences on the country’s environmental integrity, Rwandans’ livelihoods and sustainable development prospects are also discussed. An additional dimension on climate change resilience discusses the ways in which Rwanda can address this definitive environmental problem but also tap the enormous opportunities it presents.
Chapter 5 is titled Conclusions and recommendations. It teases out a number of options for both building on the successes registered and for tackling the persisting or emerging environmental challenges. In line with the theme of this Atlas, it is envisaged that implementing the recommendations will firmly position Rwanda on a low carbon, climate resilient development path.
Vin
cent
Mta
roni
2011

x
A snapshot of the surroundings of the Nyungwe Forest National Park showing the characteristic mixed land use of tea plantations and eucalyptus and pine wood lots that form a buffer zone before mainly subsistence agriculture.

Environmental Profile
Introduction Rwanda lies between latitudes 1°04’ and 2°51’ south and longitudes 28°45’ and 31°15’ east. It marks the western limit of the East Africa Community, a vibrant intergovernmental organization whose membership also includes Burundi, Tanzania, Uganda and Kenya. It is a landlocked country that is bordered by
1
1
RE
MA
2011

Chapter 1: Environmental Profile2
the Democratic Republic of Congo (DRC) to the west, Uganda to the north, Tanzania to the east and Burundi to the south as is displayed Figure 1.1.
Rwanda is located in the heart of Africa and is roughly the midpoint between the Mediterranean Sea and the South African cape. It is one of Africa’s smallest countries and covers a territorial area of only 26 338 km2 (RoR/ MINIJUST 2010). However, owing to its central location with the corollary that a number of important ecosystems converge there, Rwanda is home to a rich array of biodiversity and boasts a number of fascinating geographic features and characteristics.
!\
U G A N D A
D E M O C R AT I C
R E P U B L I C
O F
C O N G O
U N I T E D
R E P U B L I C
O F
TA N Z A N I A
B U R U N D I
R W A N D AR W A N D AKigali
31.5° E
31.5° E
31° E
31° E
30.5° E
30.5° E
30° E
30° E
29.5° E
29.5° E
29° E
29° E
28.5° E
28.5° E
1° S 1° S
1.5° S 1.5° S
2° S 2° S
2.5° S 2.5° S
3° S 3° S
LakeKivu
0 30 60Km
I
LEGEND
Capital city
Town
Major road
National border
Lake
!\
P
River
Figure 1.1: Location of Rwanda. Source: Adapted from various sources of the Republic of Rwanda

Chapter 1: Environmental Profile 3
Figure 1.2: A three dimensional visualization of Rwanda’s relief showing the major topographic subdivisions. Elevation data source: USGS 2004
Karisimbi - 4 507m
Muhabura - 4 127m
CONGO -
N
I LE
R
IDG
E
Lake
Kivu
914 4 483Metres above sea level
CE
NT
RA
L
PL A
TE
AU
Bisoke - 3 711m
Sabyinyo - 3 634m Gahinga - 3 474m
V O L C A N O E S BUBEREKA H I G H LANDS
E A S T E R N S AVA N NA
H
E A S T E R N P L AT E A U
M AY A G A - B U G E S E R A
TopographyRwanda’s relief can be divided into four broad categories: the Congo-Nile Ridge, the Central Plateau, the lowlands of the East and the Bugarama plains. Figure 1.2 contains a three dimensional visualization of Rwanda’s relief.
The Congo-Nile Ridge is dominated by eight giant volcanoes namely Nyamuragira, Nyiragongo, Mikeno, Karisimbi, Bisoke, Sabyinyo, Gahinga and Muhabura (Mehta and Katee 2005). The tallest of these Virunga volcanoes and indeed the highest point in the country is Mount Karisimbi, whose summit elevation is 4 507 m above sea level. The altitude of the Central Plateau ranges between 2 000-1 500 m. The plateau’s relief largely consists of steep hills separated by valleys that plunge by depths of between 15-50 m. Owing to the ridge and the plateau’s rugged mountainous relief, Rwanda is fondly referred to as ‘the land of a thousand hills.’
The eastern lowlands are dominated by a depressed relief, whose altitude undulates between 1 500 m at its highest elevation and 1 100 m at its lowest. The Bugarama Plains located in the south west of Rwanda have an altitude of 900 m and are part of the Great Rift Valley.
BiodiversityAs Rwanda’s diverse ecosystems range from humid montane and planted forests to savannahs, water resources and wetlands, the country is a biodiversity storehouse. Indeed, it is a habitat for 402 mammals (accounting for an astounding 40 per cent of the entire continent’s mammalian species), 1 061 bird species, 293 reptile and amphibian species and 5 793 higher plant species (RoR/ REMA 2009).
The most renowned of Rwanda’s faunal species is the mountain gorilla (Gorilla gorilla beringei) that is much prized by tourists owing to its rarity. Rwanda is therefore one of only three destinations in the entire world that can be visited by tourists seeking to experience these critically endangered primates in the wild. The others are Uganda and the DRC with the three countries’ protected afro-montane forest patches hosting the world’s remaining mountain gorillas, estimated at just 730 individuals (Nellemann and others 2010).
The country is also a habitat for a large chimpanzee troop, estimated at as many as 500 individuals. Rwanda is also home to several monkey species that include the vervet monkey, olive baboon, L’Hoest’s monkey, the silver monkey, grey-cheeked mangabey and red-tailed monkey that proliferate in the country. Rare monkey species that occur in the country are the golden monkey and the Angolan colobus. Together, these mark out the country as a primatologist’s paradise.

Chapter 1: Environmental Profile4
ClimateEven though Rwanda is entirely situated within the equatorial zone, it enjoys a moderate tropical climate due to its high altitude, and temperatures average 20°C. Rainfall follows a bimodal cycle although it is generally abundant throughout the year as Figure 1.3 showing annual average precipitation demonstrates. In higher regions of the Congo-Nile divide, temperatures vary between 15°C and 17°C although they are on an upward trend as is evident in Figure 1.4 below. The volcanoes region has lower temperatures which can dip to as low as 0°C in some areas. In the intermediary altitude zones, temperatures vary between 19°C to 29°C with an average rainfall of about 1 000 mm per year. Rainfall here is however less regular, leading to frequent dry spells (RoR/MINITERE 2005).
Figure 1.3: Average annual precipitation (mm). Source: Adapted from the Initial National Communication, UNFCCC 2005
Figure 1.4: Mean annual temperatures in Kigali and Kamembe (1971 – 2009). Source: Republic of Rwanda

Chapter 1: Environmental Profile 5
Rugezi falls, the outlet of the Rugezi Wetland in Bulera District in northern Rwanda, is a significant addition of electricity generation to the national grid.
RE
MA
2010
In the low altitude zones in the east and south east of the country, temperatures tend to be higher and can top 30°C mostly in February, July and August. In fact, the highest temperature ever recorded was 32.8°C registered at Karama Plateau station in south eastern Rwanda on September 4, 1980 (RoR and EU 2006). Temperature variations are comparatively more pronounced in the rest of the country. In addition, rainfall is less abundant in these other regions and ranges between 700 to 970 mm per year, considerably less than that received in the volcanoes region. Therefore, Rwanda’s climatic conditions and the attendant vulnerabilities to climate change vary spatially and temporally. Implementation of the newly formulated Green Growth and Climate Resilience: National Strategy for Climate Change and Low Carbon Development (CCLCD) (RoR 2011) would therefore have to take into account these regional specificities.
HydrologyRwanda is endowed with abundant water resources distributed in a very dense hydrological network consisting of 101 lakes covering 149 487 ha, 860 marshlands covering a total surface of 278 536 ha and 861 rivers with a combined length of 6 462 km (REMA 2008) as is displayed in Figure 1.5. The country is split into two hydrographical basins by a landmark line of waters known as the Congo-Nile divide that runs from the north to the south of the country. The Congo-Nile divide is roughly perpendicular to the volcanoes line which serves as a natural barrier to the catchment basins of Rwanda, North Kivu and those of southwest Uganda (Harper and others 2008).
To the east of Congo-Nile divide lies the Nile basin which covers 67 per cent of the total national territory and drains 90 per cent of Rwandan waters through two main rivers. These are the Nyabarongo and Akagera (Harding 2009). The latter is the main tributary of Lake Victoria with an average flow of 256 m3/s and is considered to be the main source of the White Nile. The White Nile and the Blue Nile are the main tributaries of the 6 695 km Nile River, the world’s longest watercourse.
Figure 1.5: Rwanda’s hydrological network. Source: Adapted from various sources of the Republic of Rwanda

Chapter 1: Environmental Profile6
Since Europeans began exploring Africa, controversy has dogged the hunt for the remotest source of the Nile. Beginning in the mid-1800s, Lake Victoria was largely accepted as the source of the White Nile. But generations of explorers continued to push farther into the heart of Africa in search of Lake Victoria’s remotest feeder river that would qualify as the Nile’s ‘true’ source. The Akagera River’s journey to Lake Victoria is portrayed in Figure 1.6. Although by no means a unanimous view, cartographers at the National Geographic Society have generally accepted two sources of the Nile; one is located in Rwanda’s Nyungwe Forest and the other in Burundi (Lovgren 2006). The Rwandan portion of the Nile basin includes many small lakes such as Bulera, Ruhondo, Cyohoha South, Mugesera, Muhazi, Rwampanga, Mihindi and Mirayi. These lakes are mostly shallow (with depths of between 5 and 7 m) except Lakes Bulera and Ruhondo which are 50 to 70 m deep (RoR/ MINITERE 2005).
The Congo basin is situated to the west of the Congo-Nile divide. Although it covers the remaining 33 per cent of Rwandan territory, it only drains 10 per cent of the country’s water resources. The basin comprises Lake Kivu and some smaller rivers such as Sebeya, Koko, Rubyiro, Ruhwa and Rusizi. Lake Kivu is itself shared with the DRC and covers an area of 102 800 ha within Rwanda alone. Average flows through hydrological stations are 73 m3/s (Nyabarongo at Kigali), 100 m3/s (Nyabarongo at Kanzenze), 232 m3/s (Akagera at Rusumo) and 256 m3/s (Akagera at Kagitumba). During high waters, there is a serious risk of flooding (RoR/ MINITERE 2005), a risk that is likely to be heightened by climate change unless effective mitigative and adaptive mechanisms are formulated.
Figure 1.6: The course of the Akagera River until it empties into Lake Victoria. Source: Adapted from various sources, UNEP/GRID-Sioux Falls
Chapter 1: Environmental Profile 7
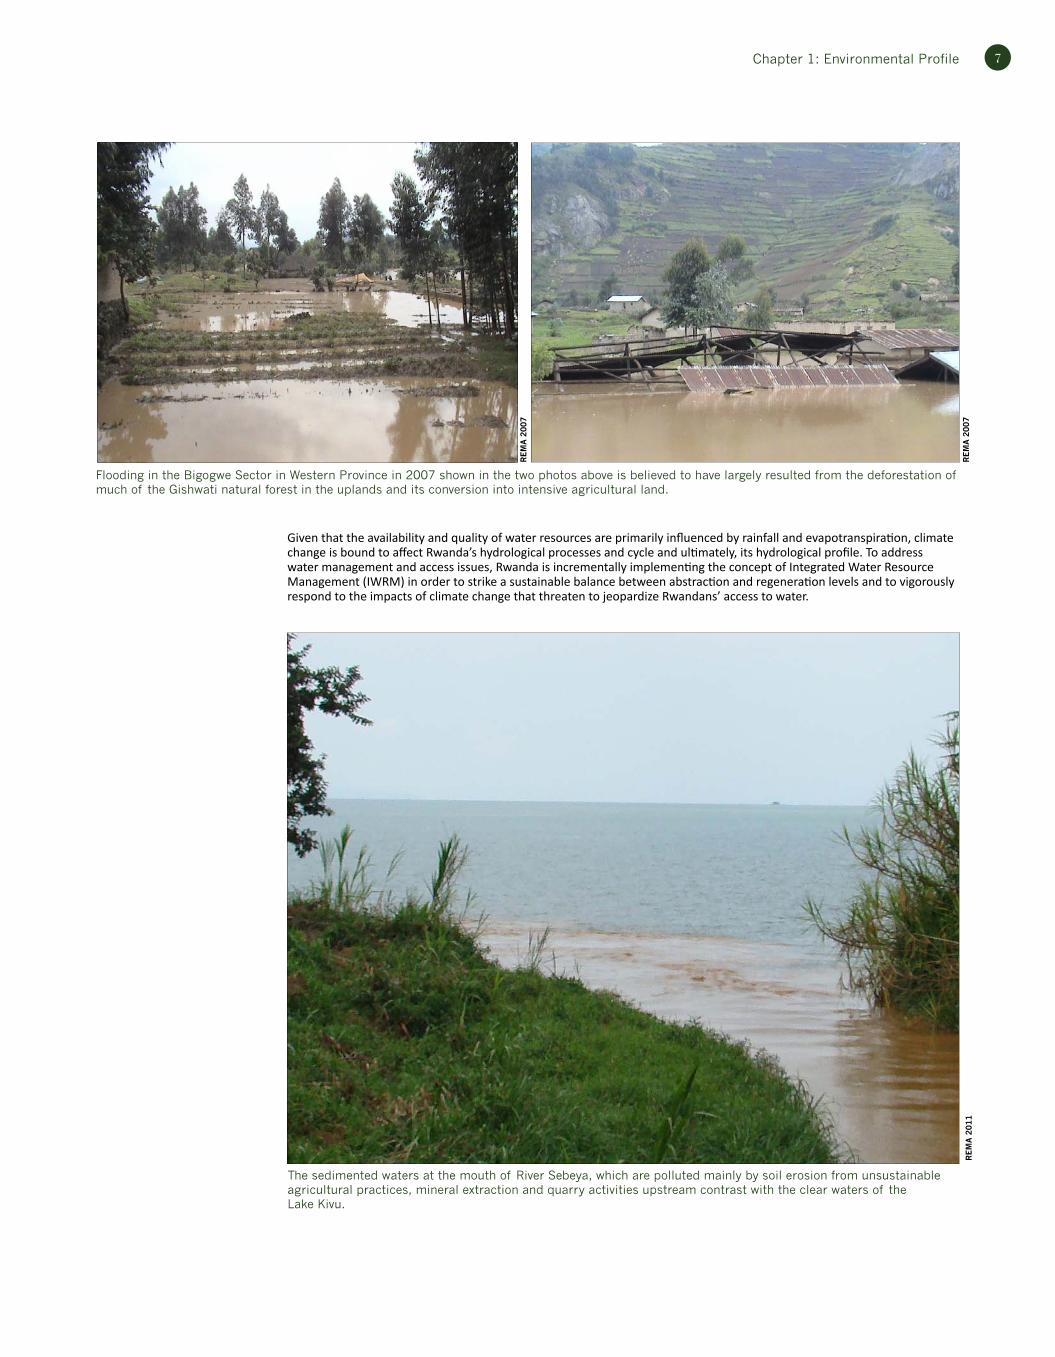
Given that the availability and quality of water resources are primarily influenced by rainfall and evapotranspiration, climate change is bound to affect Rwanda’s hydrological processes and cycle and ultimately, its hydrological profile. To address water management and access issues, Rwanda is incrementally implementing the concept of Integrated Water Resource Management (IWRM) in order to strike a sustainable balance between abstraction and regeneration levels and to vigorously respond to the impacts of climate change that threaten to jeopardize Rwandans’ access to water.
Flooding in the Bigogwe Sector in Western Province in 2007 shown in the two photos above is believed to have largely resulted from the deforestation of much of the Gishwati natural forest in the uplands and its conversion into intensive agricultural land.
The sedimented waters at the mouth of River Sebeya, which are polluted mainly by soil erosion from unsustainable agricultural practices, mineral extraction and quarry activities upstream contrast with the clear waters of the Lake Kivu.
RE
MA
2007
RE
MA
2007
RE
MA
2011

Chapter 1: Environmental Profile8
ForestsRwanda’s forest portfolio consists of those in protected areas (Akagera, Nyungwe and Volcanoes National Parks); forest reserves (Gishwati and Mukura); and natural forests (Busaga, Buhanga and the gallery forests in the eastern region of the country). These are complemented by forest plantations that are largely dominated by exotic species such as Eucalyptus sp., Pinussp sp. and Grevillea robusta, woodlots and, agroforestry where tree growing is combined with crop farming and livestock keeping. Rwanda’s forest cover is depicted in Figure 1.7.
The 2007 forest map depicts a natural forest cover of 1 146 km2 of which 78 km2 are estimated to be fire scars (mainly in Nyungwe Forest National Park) and 126 km2 to consist of forest scrubland. These add up to just under 5 per cent of the national territory. The ‘other forest’ category (consisting of mainly planted eucalyptus and pinus plantations) covers 1 399 km2 accounting for the other a little over 5 per cent.
Rwanda’s forests continue to be under threat from various human drivers such as agriculture, human settlement, illegal logging, charcoal production, bush fires, and climate change. Statistics show that natural vegetation, including forests, plummeted by 59.4 per cent from 6 340 km2 in 1960 to 2 575 km2 in 2010. Akagera National Park’s forest cover plunged by 53 per cent from 2 410 km2 in 1999 to 1 121 km2 in 2010. This was largely because a large portion was used to resettle returning Rwandans who had lived as refugees mostly in neighbouring countries for over 3 decades (Havugimana 2009).
Figure 1.7: Rwanda’s forest cover. Source: Adapted from MINIRENA/CGIS-NUR 2007
A swamp within the Nyungwe Forest National Park.
Gae
l Va
nde
Weg
he 2
010

Chapter 1: Environmental Profile 9
The gallery forests of eastern Rwanda tumbled from 2 410 km2 in 1980 to 250 km2 in 1996. Designated hunting zones that included specified belts of natural forest were gradually reduced by 300 km2 (47 per cent) over a 30-year period from 640 km2 in 1960 to 340 km2 in 1990. In 1996, there was a sudden and complete removal of the hunting grounds as is depicted in Figure 1.8.
The Volcanoes National Park lost mostly natural bamboo forest estimated at 180 km2 (53 per cent) with the forested cover falling from 340 km2 in 1960 to 160 km2 in 1970. Gishwati lost an estimated 192 km2 of forest with the forested area falling from 280 km2 in 1960 to 88 km2 in 1990. An additional 75 km2 was lost between 1990 and 1996 leaving only a dismal patch of 13 km2 (Chadri and Plumptre 2003). The isolated Mukura natural forest was reduced from an already low base of 30 km2 in 1960 to 21 km2 in 1980 while an additional 12 km2 was deforested between 1996 and 1999 (USAID Rwanda 2004).
In contrast to the above trend of dramatic loss of forest cover, the Nyungwe/ Cyamudongo protected forest has remained relatively intact. Although it witnessed an initial decrease of 165 km2 between 1960 and 1980 and a further reduction totalling 50 km2 between 1996 and 2003, the forest cover appears to have stabilized at 1 019 km2 in 2005. The trends in natural forest cover are displayed in Figure 1.8.
In order to reverse deforestation, the government has embarked on a vigorous afforestation programme.
Forests in Rwanda provide wood fuel, food, construction materials and medicinal herbs to local communities. Forests also support a series of economic activities in the agriculture, tourism and energy industries. Their ecological roles include acting as a biodiversity repository, recharging rivers, flood control and regulating regional and micro climate. The integrity of Rwanda’s forests is therefore indispensable to the attainment of Rwanda’s sustainable development. The 2008-2012 EDPRS (RoR 2007) acknowledges reforestation, preservation of biological diversity and climate change mitigation and adaptation as some of Rwanda’s environmental priorities.
Praying mantis (Pseudocreobotra ocellata) are common in many of Rwanda’s forests.
Nyungwe Forest National Park is largely densely forested and lush.
The Rusumo Falls of the Akagera River seen here under the bridge that crosses the Rwanda-Tanzania border.
Pavetta bagshawei (ikinesha, umumenyamabuye in Kinyarwanda, the national language).
Yoko
Wat
anab
e 2011
Mer
cedes
Sti
ckle
r 2011
RE
MA
2011
Yoko
Wat
anab
e 2011
0
400
800
1 200
1 600
2 000
2 400
1960
1970
1980
1990
1996
1999
2000
2003
2005
2006
2007
2008
2009
2010
Fore
st C
over
(sq.
km
.)
Year
Akagera National Park
Nyungwe/Cyamudongo
Gallery ForestsHunting Zone
Gishwati
Volcanoes National ParkMukura
Figure 1.8: Trends in natural forest cover.
Source: Republic of Rwanda

Chapter 1: Environmental Profile10
Administrative StructureRwanda is governed through a highly decentralized administrative structure that is rapidly devolving to increase citizen participation in influencing development as is depicted in Figure 1.9. This has a number of implications for environmental governance including policies and programmes geared at enhancing Rwanda’s climate change resilience.
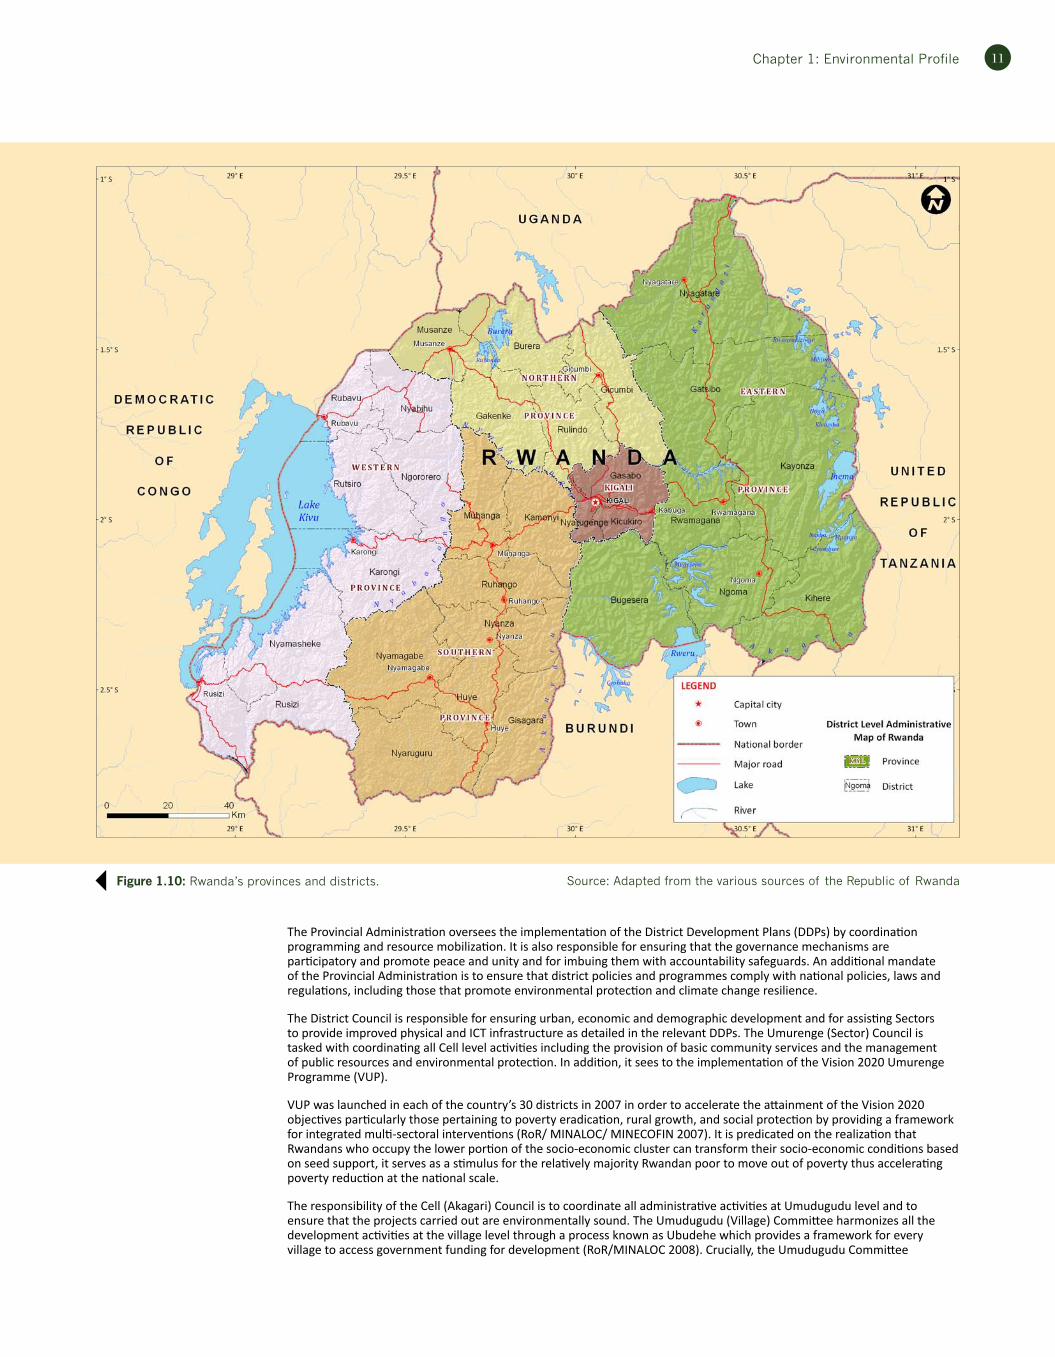
The central government sits at the top of the hierarchy while five provinces (Northern, Eastern, Western and Southern and the City of Kigali) occupy the second tier of the administrative structure followed by 30 districts. Figure 1.10 contains a map of Rwanda’s provinces and districts. The districts are administratively structured in 416 sectors (Imirenge). The Imirenge are themselves organized into 2 148 cells (Utugari). The Utugari (plural for Akagari) are split into several thousand villages (Imidugudu) with the village level (Umudugudu) forming the base of Rwanda’s elaborate local government hierarchy.
According to the 2008 Community Development Policy, this structure is specifically designed to empower local communities to effectively participate in policy making and implementation. It is also designed to ensure local community cooperation in a variety of development initiatives aimed at poverty eradication, fostering self-reliance and ensuring sustainable exploitation of natural resources (RoR/ MINALOC 2008). The overarching goal of the policy is to transform Rwandans of all socio-economic backgrounds into masters of their own destiny.
The central government, through the Ministry of Local Government (MINALOC), is tasked with overseeing the formulation and implementation of national policies such as Vision 2020, the MDG-based Economic Development and Poverty Reduction Strategy (EDPRS) and the Green Growth and Climate Resilience: National Strategy for Climate Change and Low Carbon Development (CCLCD) (RoR 2011) that seeks to set Rwanda on the path to green growth and climate resilience. The latter is already touted as the most inventive strategy on climate change in the entire East African Community (EAC), and possibly sub-Saharan Africa (ILEG 2012).
The other government ministries notably Ministry of Finance and Economic Planning (MINECOFIN), Ministry of Natural Resources (MINIRENA), Ministry of Agriculture and Animal Resources (MINIAGRI), Ministry of Education (MINEDUC), Ministry of Health (MINASANTE), Ministry of Trade and Industry (MINICOM), Ministry of Infrastructure (MININFRA), Ministry of Public Service and Labour (MIFOTRA) support these processes by lending their respective technical expertise as needed. They also assist in mobilizing the resources required for their implementation; capacity building; and evaluating and monitoring the implementation of the national policies and programmes.
CENTRALGOVERNMENT
Joint ActionDevelopment
Forum
DistrictCouncil
CommunityDevelopment
Committee
Sector JointAction Forum
SectorCouncil
CommunityDevelopment
Committee
CommunityDevelopment
Committee
DevelopmentAdvisory
Committee
CellCouncil
UmuduguduCommittee
Civil Society/CBOs Private Sector
Faith BasedOrganisations
Women, Youth &Elders
HOUSEHOLDFAMILY
Figure 1.9: Rwanda’s government hierarchy. Source: RoR/MINALOC 2008
The city centre of Kigali, the administrative capital of Rwanda.
RE
MA
2011
Chapter 1: Environmental Profile 11
Figure 1.10: Rwanda’s provinces and districts. Source: Adapted from the various sources of the Republic of Rwanda
The Provincial Administration oversees the implementation of the District Development Plans (DDPs) by coordination programming and resource mobilization. It is also responsible for ensuring that the governance mechanisms are participatory and promote peace and unity and for imbuing them with accountability safeguards. An additional mandate of the Provincial Administration is to ensure that district policies and programmes comply with national policies, laws and regulations, including those that promote environmental protection and climate change resilience.
The District Council is responsible for ensuring urban, economic and demographic development and for assisting Sectors to provide improved physical and ICT infrastructure as detailed in the relevant DDPs. The Umurenge (Sector) Council is tasked with coordinating all Cell level activities including the provision of basic community services and the management of public resources and environmental protection. In addition, it sees to the implementation of the Vision 2020 Umurenge Programme (VUP).
VUP was launched in each of the country’s 30 districts in 2007 in order to accelerate the attainment of the Vision 2020 objectives particularly those pertaining to poverty eradication, rural growth, and social protection by providing a framework for integrated multi-sectoral interventions (RoR/ MINALOC/ MINECOFIN 2007). It is predicated on the realization that Rwandans who occupy the lower portion of the socio-economic cluster can transform their socio-economic conditions based on seed support, it serves as a stimulus for the relatively majority Rwandan poor to move out of poverty thus accelerating poverty reduction at the national scale.
The responsibility of the Cell (Akagari) Council is to coordinate all administrative activities at Umudugudu level and to ensure that the projects carried out are environmentally sound. The Umudugudu (Village) Committee harmonizes all the development activities at the village level through a process known as Ubudehe which provides a framework for every village to access government funding for development (RoR/MINALOC 2008). Crucially, the Umudugudu Committee

Chapter 1: Environmental Profile12
mobilizes the village to carry out Umuganda, a monthly communal activity that engages all Rwandan residents in primarily environmental priorities such as cleaning and maintenance exercises.
In order to ensure that community level initiatives are synchronized with the national policies, programmes and strategies, there are mutually reinforcing interactions between and across the different tiers of government. For example, while financial resources largely cascade down the hierarchy from the central government, the Imidugudu and Akagari are important focal points for collection of basic community data that is relayed to higher levels of government and is eventually used to influence national policies and programmes. This reciprocal relationship is appropriately represented by the double-sided arrows in Figure 1.9.
School children cleaning their garden.
Gre
en S
choo
ls R
wan
da
2011

Chapter 1: Environmental Profile 13
Primary Policy FrameworkVision 2020 and the Economic Development and Poverty Reduction Strategy (EDPRS) are the primary blueprints for Rwanda’s sustainable development. While there are other policies that flow from these, such as those on the environment, land, water and sanitation and mines and geology policies, the Atlas focuses on the development blueprints as the overarching prescriptions for national development efforts for the sake of brevity.
Vision 2020Rwanda’s long-term economic development goals are defined in Vision 2020 which was launched in 2000. Its main goal is to equitably transform Rwanda into a middle-income country by 2020. It seeks to achieve this by attaining and maintaining an annual GDP growth rate of 8 per cent and lowering the population growth from 2.9 to 2.2 per cent per year. These will together enable the country to register a per capita income of US $900, a poverty rate of 30 per cent and an average life expectancy of 55 years (RoR/MINECOFIN 2000).
Vision 2020 is founded on six pillars which comprise: good governance; human resource development; private sector-led development; infrastructural development; a modernized and commercially-oriented agricultural sector; and economic integration at the regional and global levels. These pillars are themselves supported by three cross-cutting themes: gender equality; science and technology (including ICT); and sustainable environmental and natural resource management as diagrammatically displayed in Figure 1.11.
Hotels such as Umubano Hotel in Kigali are sources of the private sector led growth envisaged by Vision 2020.
Gil
les
Tord
jem
an 2
004
The Vision seeks tofundamentally transform
Rwanda into a middle-incomecountry by year 2020.
Pillars of the VISION 2020
Good Governance and a capable state
Human resource development & knowledge based economy
A private sector led economy
Infrastructure development
Productive & market oriented agriculture
Regional & international economic integration
Cross-cutting areas of VISION 20201. Gender equality
2. Sustainable environmental & natural resource management
3. Science and technology
Figure 1.11: Thematic overview of Vision 2020. Source: Adapted from RoR 2000

Chapter 1: Environmental Profile14
Prioritizing gender equality is predicated on the fact that women constitute 53 per cent of the country’s population and carry a disproportionate burden of domestic chores. Although many of these bring them in close contact with nature, in 2000 when Vision 2020 was formulated, they remained under-represented and many of their specific development needs were unmet. However, there have been significant strides through national efforts that deliberately integrated women in development programmes. In 2011, women represented an impressive 56 per cent of parliamentarians, positioning Rwanda as the country with the highest number of women in decision making levels in the world. Mainstreaming science and technology is premised on the realization that rapid technological innovation is indispensable to Rwanda’s social progress and its transformation into a knowledge economy.
Highlighting sustainable environmental and natural resource management as a cross-cutting theme is an acknowledgement of the undisputable fact that as a developing economy, many Rwandans’ livelihoods are dependent on the country’s natural capital and that this has significant potential for lifting millions of Rwandans out of the intergenerational poverty trap.
Emphasizing the importance of sound environmental management is also central to ensuring that the economic progress envisaged by Vision 2020 is not achieved at the expense of environmental integrity. This is a valid concern, given the increasingly inverse correlation between the country’s population and natural resource wealth. More specifically, Rwanda’s population grew at an annual rate of 3 per cent in the 1980s and 1990s, with the rising population exerting enormous pressure on a diminishing natural resource base. This led to considerable environmental degradation manifested through deforestation; soil erosion and landslides; water and soil pollution; diminution of fragile ecosystems such as swamps; and loss of biodiversity.
Although concerted efforts to reverse this degradation have, as is elaborated in this Atlas, laudably borne fruit, a series of challenges remain. Cognizant of this, a number of the Vision 2020 targets have important implications for environment management as highlighted in Table 1.1. Clearly, the delivery of the stated long term development goals will depend on the appropriateness of the natural resource management strategies employed.
Mainstreaming science and technology is a priority area of the Rwandan government: A student of New Vision High School in Kigali using a microscope in a school laboratory.
RE
MA
2011
Vision 2020 Pillars Targets with Environmental Challenges
1. Good governance and a capable state Effi ciency in deploying scarce resources
2. Human resource development and a knowledge based economy
Malaria and other potenti al epidemic diseases controlled
3. A private sector-led economyFacilitate creati on of 1.4 million jobs outside agriculture at the esti mated 13 million populati on level in 2020
4. Infrastructure development
Consumpti on of wood to decrease from the current 94% (in 2000) to 50% of nati onal energy consumpti on by 2020
Grouped sett lements (iMidugudu) based on economic acti vity equipped with basic infrastructure and services serve as an entry point into the development of non-agricultural income generati ng acti viti es
Land consolidati on to create adequate space for modern and viable farming
Proporti on of those living in towns and citi es will increase from 12% to 30% (from 5% in 1995)
Consumpti on of wood to decrease from the current 94% (in 2000) to 50% of nati onal energy consumpti on by 2020
Rural and urban areas to have suffi cient sewerage and waste disposal systems
Each town to be endowed with an adequate unit for treati ng and compressing solid wastes for disposal
Households to master and practi ce good hygiene and waste disposal
5. Producti ve and Market Oriented Agriculture
Use of high yielding varieti es and intensive input use, especially ferti lizers
Environmental control measures to halt the decline in soil ferti lity
6. Regional and Internati onal Economic integrati on
Consolidate Rwanda’s niche in services and communicati on sectors and take advantage of growing regional cooperati on in the Great Lakes/ Eastern African Region through Export Processing Zones, coupled with the industrial reforms
Table 1.1: Addressing the environmental challenges of the Vision 2020 pillars.
Source: Adapted from RoR/ MINECOFIN 2000

Chapter 1: Environmental Profile 15
Jubilant graduates of the Kigali Institute of Science and Technology after a degree award ceremony in March 2010, ready to provide skilled labour in Rwanda's growing economy.
In order to meet the human resource development goals of Vision 2020, Rwanda is investing in the largest technological endeavour in the education sector in East Africa by providing primary school pupils with their own XO laptops from One Laptop Per Child (OLPC). As it is made completely from recyclable plastics, the XO laptop is the greenest laptop in the world. In addition, owing to its sturdy design, it can withstand harsh conditions and rough handling. It allows pupils to create, research and satisfy their curiosity both in the classroom and at home. This project is part of the country’s educational transformation that will better prepare Rwanda’s workforce to compete in an increasingly IT-driven world.
RE
MA
2010
Juli
a R
eyno
lds
2011
Juli
a R
eyno
lds
2011
Economic Development and Poverty Reduction StrategyThe Economic Development and Poverty Reduction Strategy (EDPRS) is the primary medium term vehicle for delivering the long term development goals embodied in Vision 2020 and the MDGs.
In order to attain these goals, it has adopted a three-pronged approach: sustainable growth for jobs and exports by lowering business operational costs, spurring innovation, scaling up investment in physical infrastructure, increasing the capacity to innovate, and consolidating the financial sector; Vision 2020 Umurenge which seeks to alleviate poverty by promoting pro-poor economic linkages that are poised to accelerate poverty reduction on a national scale; and effective governance characterized by a zero tolerance for corruption, stronger justice institutions and reining in impunity.

Chapter 1: Environmental Profile16
Because the use of Rwanda’s environmental and natural resources and climate resilience underpins all the EDPRS’ sectoral activities, it is a fundamental component of the sustainable development envisaged by the strategy. Table 1.2 summarizes progress made in meeting the environment-related EDPRS targets.
The development of the EDPRS was highly participatory and was carried out in three phases. The first included self-evaluations of the Poverty Reduction Strategy Paper (PRSP1) by each sector working group and every district as well as external consultants. The emerging priorities from these evaluations informed the 2007 budget process. Subsequently the EDPRS targets, and the roadmap and costs for achieving them were incorporated into the evolving EDPRS document by MINECOFIN under the direction of the relevant steering committees (RoR/ MINECOFIN 2007).
A transformation of a bare school compound into a green one with the help of Green Schools Rwanda (GSR), an NGO which provided a water tank for the project. The NGO was formed to reverse the sorry state of school grounds in the poorer sections of Kigali. The majority of these grounds are bare and devoid of trees, grass and shrubs despite the abundance of rain and the potential to harvest it.
GSR’s vision is to create a green, child-friendly and healthy learning environment for underprivileged primary school pupils as well as a conducive atmosphere for holistic and participatory learning. While GSR is committed to improving school compounds, it faces a number of daunting challenges. These include lack of water in these poorer schools and teachers’ lack of the requisite practical knowledge, time and resources. Nevertheless, achievements such as that highlighted here are still possible.
Gre
en S
choo
ls R
wan
da
2008 a
nd 2
009
Environment targets Progress
Begin distributi on of environmental inspecti on checklists to the lowest lo-cal governance administrati ve level (the cell) in all districts – 2008 target
On-going
Database of all regulated substances updated annually and accessible to public – 2009 target
On-going
At least 10 out of 16 environmental regulati ons and guidelines functi oning at central and decentralized insti tuti ons to facilitate investments – 2010 target
5 Regulati ons, 7 Sector Specifi c Guidelines for EIA are available and functi oning
Five degraded ecosystems mapped, assessed and rehabilitated (Gishwati , Mukura, Rugezi, Kamiranzovu, Nyabarongo-Akagera network including Gikondo industrial area) - 2011 target
Three ecosystems mapped (Rugezi, Kamiranzovu, Nyabarogo-Akagera); Rugezi ecosystem fully rehabilitated; One ecosystem in process of being rehabilitated (Nyabarongo-Akagera)
Increase number of projects compliant to nati onal environmental standards to 95% approval rati ng for EIA certi fi cati on – 2012 target
On-going
Agriculture targets aff ecti ng environment Progress
Reducti on in % of livestock in intensive systems from 16% in 2005/6 to 60% in 2012
On-going
Increase in rati o of number of farm households per extension offi cer from 1:3 000 in 2005/6 to 1:1 500 in 2011
On-going
Infrastructure targets aff ecti ng environment Progress
Reducti on in number of households with access to electricity from 70 000 in 2005/6 to 200 000 in 2012
Connected households and enterprises increased to 159 516, beyond 2009-2010 target
Electricity generati on increased from 67 MW in 2008 to 84 MW in 2010
Policy note for reform of electricity taxes and subsidies draft ed - 2009 target
Tariff study completed and submitt ed by Oct 2010
Rules and Regulati ons for the Electricity and Gas sector adopted – 2009 target
On-going
Management of rural based power plants privati zed – 2010 target On-going
Privati zati on of Power Plants managed by Nati onal Power Uti lity (unbundling process) – 2011 target
On-going
Table 1.2: Progress in meeting the environment-related EDPRS targets. Source: Adapted from RoR/ MINECOFIN 2011
Rwanda’s recent rapid economic growth has resulted in the construction of many modern commercial buildings such as the National Social Security Fund building in central Kigali.
RE
MA
2011
A modern residential suburb in the eastern part of Kigali city is a sign of the country’s growing economy.
RE
MA
2011

Chapter 1: Environmental Profile 17
Landmark Accomplishments and ChallengesAs Vision 2020 and the EDPRS make abundantly clear, sustainable development, together with its ancillary benefits, is inextricably dependent on rational utilization and management of environment and natural resources. To be sure, the natural resources provide the raw materials required to drive economic growth while the ambient, aquatic and soil components of the environment absorb and detoxify the attendant wastes and effluent.
For Rwanda’s development prospects to remain strong, it is important that economic growth remains within a range that can be accommodated by the environment in terms of its capacity to supply raw materials while at the same time taking prudent pollution management measures. In this regard, a number of bold processes and initiatives have been formulated to tackle pressing environmental challenges or thwart them altogether through rigorous periodic environmental monitoring and assessment. These systems as well as the internationally acclaimed accomplishments and on-going challenges are reviewed below.
State of Environment ReportingAs already stated, REMA is vested with a statutory mandate to take stock of and report on the state of Rwanda’s environment at the end of every biennium. In fulfilment of this obligation, the first comprehensive State of Environment (SOE) report was published in 2009.
That report noted Rwanda’s performance in a number of environmental facets including improvements in the sanitation, drinking water and conservation indicators for comparable income groups. In addition, given the magnitude of the attendant challenges, the report recognized the country’s success in shaping an efficient cohesive post-genocide political
Pristine shores of Lake Kivu at Kibuye in western Rwanda.
Diesel powered generators in Gikondo Valley in Kigali supplement the shortfall in the electricity supply from mainly hydropower sources that are still not able to meet the rising demand levels.
Rugezi Wetland which was once severely degraded is now a tourist attraction following its recent rehabilitation.
Gae
l Va
nde
Weg
he 2
010
RE
MA
2011
RE
MA
2011

Chapter 1: Environmental Profile18
Environment and economic development
Insti tuti onalize the integrati on of environment into policies, plans and programmes as provided for in the Environment Management Policy.
Provide well-packaged educati on and informati ve material on why environment matt ers and what acti ons the various stakeholders at the district and lower levels could take to promote environmental sustainability.
Invest in strengthening the government’s capacity to assess the costs of environmental degradati on (preferably via satellite account, for example tourism) and how the various taxes and subsidies aff ect the achievement of environmental sustainability, with the view to developing suitable economic instruments.
Climate change and natural disasters
Document the nature and impacts of climate change, especially in the sensiti ve sectors of agriculture, infrastructure, water and health.
Understand, document and strengthen existi ng livelihood coping strategies (e.g. how households cope with unexpected circumstances brought about by extreme weather on food crops, water and energy requirements) rather than imposing new, high-tech soluti ons.
Coordinate eff orts within and between governments, private sector and civil society in promoti ng adaptati on to climate change and sustainable development through sharing ideas. This will encourage innovati on and maximize the effi ciency with which limited resources are used.
Integrate climate change adaptati on into the development agenda across all sectors at all levels of government.
Strengthen nati onal capacity for eff ecti ve engagement in the regional and global negoti ati ons, and for collecti ve acti ons to miti gate and adapt to climate change.
Forests and protected areas
Strengthen the human resource capacity of the forest sector to ensure eff ecti ve provision of technical and extension services.
Intensify water quality monitoring and where practi cal, train and engage the environment committ ees at the district level to support this eff ort.
The ministries responsible for agriculture, environment and industry should harmonize and rati onalize their policies, mandates and functi ons in order not to compromise adequate availability of wetland ecosystem services and products.
Energy resources
Expediti ously develop the Lake Kivu methane projects for natural gas extracti on for electricity generati on and domesti c cooking requirements and bring on-line additi onal hydro-power stati ons.
Foster collaborati on between the ministries responsible for agriculture, environment and energy to ensure that the development of wetlands does not interrupt the availability of water from the wetlands that feed hydropower stati ons.
Implement a wood and charcoal effi ciency and substi tuti on strategy that can help curb deforestati on.
Make rural energy and electrifi cati on an integral part of the country’s rural transformati on and poverty reducti on strategy with the view to achieving the Vision 2020 targets on the percentage of the populati on with access to electricity.
Enforce the Strategic Environmental Assessment (SEA) and Environment Impact Assessment (EIA) requirements in the development of new energy supply systems.
Industry and mining
REMA should implement the provision of the Mines and Geology Policy on its statutory obligati on to study the impacts of mining and quarries on the environment with the view to ensuring that the existi ng laws and regulati ons on mining are complied with.
The Cleaner Producti on programme should be expanded in order to ensure that the increase in industrial producti on brings benefi ts to industry, the economy and the environment.
In deepening decentralizati on, REMA should work closely with the ministries responsible for industry, mining, environment and local government to develop the capacity of district environment committ ees to enable them to contribute to the monitoring and enforcement of the laws and regulati ons governing industrial and mining operati ons.
Populati on, health and human sett lement
Make suffi cient investment in the Imidugudu area in order to improve the quality of human sett lement: capitalizing on the opportunity to promote the uptake of energy-saving cook stoves, the replanti ng of degraded hill tops in the neighbourhood and bett er provision of educati on, water, sanitati on and health services.
Seek to build and strengthen synergies between the programmes of the Ministry of Natural Resources on water and sanitati on and those of the Nati onal Water and Sanitati on Authority for purposes of enabling the country to meet its EDPRS and MDG targets on water and sanitati on.
Environmental policies, legislati on and insti tuti onal arrangements
Increase the knowledge and awareness of the general public on environment laws and policies in order to facilitate public parti cipati on in the EIA public hearings in parti cular, and in public decision making, in general.
Fill the criti cal gaps in environmental policies and laws, ensuring that the inter-linkages approach is adhered to in the development of new policies and laws.
dispensation that made the commendable strides in the environmental management arena possible. The report’s key policy options are summarized in Table 1.3.
As a follow up to the pioneer report, this Atlas builds on the country’s existing baseline for environmental data and indicators in order to enhance informed decision making at all government, corporate and societal levels. These data can inform the formulation, evaluation and realigning of national policies such as Vision 2020 and EDPRS where the environment is prioritized as a crosscutting issue. They can in addition, form important bases for the preparation of functional sectoral policies which would enhance the integration of environmental concerns into development processes and facilitate the preparation of medium-term rolling environmental action plans. The improved data can in turn be used to meet reporting commitments under a range of regional and international reporting processes such as the African Environmental Outlook (AEO), the Global Environmental Outlook (GEO) as well as those undertaken by Rwanda under several Multilateral Environmental Agreements (MEAs) and instruments.
Table 1.3: Recommendations of the Rwanda State of Environment Report 2009. Source: Adapted from RoR/ REMA 2009

Chapter 1: Environmental Profile 19
Vision 2020 Targets and the MDGsThe Vision 2020 targets are categorized into nine main categories: population, economy, poverty, agriculture, infrastructure, environment, education, gender and health. The Ministry of Finance and Economic Planning (MINECOFIN) is responsible for monitoring progress towards the attainment of Rwanda’s long-term development blueprint. It seeks to incrementally realize these goals through implementing a series of five year medium-term rolling EDPRS, with the current strategy spanning the 2008-2012 period. MINECOFIN’s Vision 2020 mid-term review carried out in 2010 revealed that 66 per cent of the development blueprint’s targets were on-track, 11 per cent were on-watch and 23 per cent were off-track as shown in Table 1.4. The following criteria were used to rate progress:
• ‘On-track’ - we must continue pursuing our efforts (keeping in mind that further improvements are always possible)
• ‘On-watch’ - we must strengthen our monitoring and evaluation systems as soon as possible
• ‘Off-track’ - we must reflect on the issues and obstacles and adopt corrective measures as soon as possible
Category Targets On-track On-watch Off -track
Populati on 4 1 2 1 Off -track
Economy 7 6 0 1 On-track
Poverty 3 1 0 2 Off -track
Agriculture 4 3 0 1 On-watch
Infrastructure 2 0 1 1 On-watch
Environment 2 0 1 1 Off -track
Educati on 9 6 1 2 On-track
Gender 6 6 0 0 On-track
Health 7 6 0 1 On-track
Table 1.4: 2010 Mid-term review of the progress towards achieving Vision 2020 goals and the MDGs.
Figure 1.12: Trade balance trends 2005-2009. Figure 1.13: Major contributors to Rwanda’s GDP, 2005-2009.
Source: RoR/ MINECOFIN 2010
Source: RoR/ MINECOFIN 2010
Source: RoR/ MINECOFIN 2010
A space optimized modern residential estate in Gacuriro in eastern Kigali.
Gil
les
Tord
jem
an 2
004
400
200
0
-200
-400
-600
-800
-1 000
-1 200
2005 2006 2007 2008 2009 (est)
Trade balanceExports f.o.b
Imports f.o.nTourism
USD
, mill
ions
200
150
100
50
02005 2006 2007 2008 2009
Tourism
Coffee
Mining
Tea
Hides and skins
Valu
e (m
illio
n U
SD)
Year
Economic indicators including GDP per capita, GDP growth, gross investment and on-farm jobs were rated as on-track. However, there is still considerable scope for reducing the external trade deficit by stimulating export growth as displayed in Figure 1.12. The major contributors to GDP in the 5 years between 2005 and 2009 were mining, coffee, tea and tourism which, as is depicted in Figure 1.13, grew an impressive five-fold. There are important feedbacks between each of these sectors and the environment generally and climate change specifically. In essence, instituting a range of fiscal and other incentives should be accompanied by heightened environmental monitoring to ensure that use of Rwanda’s natural resources does not outstrip their regenerative capacity.
The primary indicators of the education sector namely: literacy, primary school and tertiary institution enrolment as well as vocational training were firmly on-track. Nevertheless, greater prudence was called for in ensuring that the push to raise the literacy level and increase education enrolment rates did not irremediably compromise education quality. Gender indicators for education and decision making were assessed to be on-track although efforts to accelerate women’s economic empowerment, to eradicate gender-based violence and to promote maternal health needed to be stepped up. Health indicators for life expectancy, child immunization, child mortality, HIV/AIDS and malaria were appraised as on-track. Nonetheless, more effort was needed to ensure the quality of healthcare services, eradication of malnutrition and the long-term sustainability of health insurance schemes.

Chapter 1: Environmental Profile20
The indicators for the agricultural sector were evaluated to be on-watch. Even though agriculture’s contribution to GDP fell from 45 per cent in 2000 and 47 per cent in 2010 to 31 per cent in 2011 (RoR/ MINAGRI 2011), its performance is still vital to meeting the poverty alleviation goals set forth in Vision 2020 and EDPRS. Further, in light of the agricultural sector’s size, it will be important to ensure that environmental imperatives are not sacrificed in the drive to modernize it and change its orientation from subsistence to commercial.
The Vision 2020 and EDPRS targets pertaining to infrastructure were also assessed to be on-watch. In particular, the need to drastically increase the proportion of Rwandans who have access to electricity was highlighted. This is primarily because wood fuel consumption stood at 86 per cent in 2008, which remains well off track the Vision 2020 target of 50 per cent and is evidently culpable for the dramatic deforestation Rwanda has witnessed. Although the percentage of Rwandans with access to electricity has increased five-fold from 2 per cent in 2000 to 7 per cent in 2010 (Rutagarama and Uhorakeye 2010), it remains way below the 35 per cent electrification target envisaged by Vision 2020.
Fast tracking this target will need to be accompanied by a paradigm shift that decentres hydropower and refocuses attention on renewable sources of energy that Rwanda is richly endowed with such as solar, methane gas and geothermal potential. This is especially important given that climate variability and the associated precipitation unpredictability are likely to consign hydropower to a much lower rung in the country’s energy hierarchy.
Progress towards achieving the overall population targets was also deemed to be off-track. This was due to the high population growth rate of 2.9 per cent in 2010 which was substantially higher than the Vision 2020 target population growth rate of 2.2 per cent. The poverty category was also rated as off-track as the poverty head count was considerably higher than the MDG and Vision 2020 targets. Even though the GDP per capita stood at US $540 in 2010, 38 per cent of Rwandans continue to live on less than US $2 a day, 8 per cent higher than the Vision 2020 target rate of 30 per cent (RoR/MINECOFIN 2000, RoR/NISR 2011, and World Bank 2011).However, overall, the majority of the targets are on track implying that Rwanda is on course to achieve Vision 2020 as is evident in Figure 1.14.
International Recognition for Environmental AchievementsIn spite of the challenges Rwanda faces in pursuit of sustainable development, the country has received international awards for several courageous and pioneering sustainable environmental management initiatives. These include:
• The Energy Globe Honorary Award 2010 for the country's efforts towards green economic growth.
• The prestigious Green Globe Award in 2010 for successfully restoring the considerably degraded Rugezi-Bulera-Ruhondo wetland.
• Rwanda was named by UNEP as the global host of the World Environment Day 2010 in recognition of the country’s efforts to transition to a Green Economy through a series of ground-breaking initiatives. These included banning the manufacture, importation, use and sale of all forms and gauges of plastic bags, embracing the nationwide clean-up campaigns and reforesting degraded natural rainforests. In addition, Rwanda was feted for instituting the acclaimed chimpanzee conservation programme and keeping the world’s attention focused on the critically endangered mountain gorilla through the annual Kwita Izina naming ceremony for baby gorillas.
• The Future Policy Award was awarded to Rwanda in 2011 on account of a revolutionary National Forest Policy that was formulated in 2004 and updated in 2010. The forest policy has enabled Rwanda to remarkably reverse decline in forest cover by reforesting protected areas with indigenous tree species with the active support of local communities. Given that UN Habitat had named Kigali as the cleanest city in Kigali in 2008 – owing to the outright ban on plastic bag use and designating national and local cleaning days – this award helped to cement Rwanda’s reputation as a pioneer in environmental management policies and programmes.
ConclusionThis chapter has outlined Rwanda’s geographic features, characteristics and rich biodiversity. It has also discussed the relevant policy framework precisely because this is an important determinant of the country’s environmental integrity and is central to reversing the degradation and to consolidating the environmental gains which Rwanda has pioneered and for which it has received global recognition. The above have together set the context for discussing the changes in the country’s selected environmental hotspots in the following two chapters and for the scenario analysis and actionable recommendations in the last two chapters of the Atlas.
25
24
23
22
21
20
19
18
17
16
152006 2007 2008 2009 2010 2011 2012
Year
Actual
EDPRS target
Perc
enta
ge
Figure 1.14: Overall performance of EDPRS targets for the achievement of MDGs and Vision 2020.
Source: RoR/ MINECOFIN 2010
Students of New Vision High School in Kigali relaxing in their large, green compound.
RE
MA
2011

Chapter 1: Environmental Profile 21
ReferencesBue, C. (2010). EU perspectives on social protection in partner countries.
Paper prepared in the framework of the European Report on Development. European Union, Brussels. http://erd.eui.eu/media/BackgroundPapers/Bue%20-%20EU%20perspectives.pdf (Accessed on 28 August 2011).
Chadri. E. and Plumptre, A. J. (2003). Long Term Changes in Africa’s Rift Valley: Impacts on Biodiversity and Ecosystems. http://pubpages.unh.edu/~jnz6/Professional/Publications/ Long%20term%20changes%20in%20Rift%20valley.pdf (Accessed on 17 June 2011).
Harding, B. (2009). Review of the economic impacts of climate change in Kenya, Rwanda and Burundi. Rwanda National Advisory Committee (NAC) on the Economics of Climate Change Report, Kigali. http://www.rema.gov.rw/ccr/Ecosystem%20study.pdf (Accessed on 17 June 2011).
Harper, D., Zalewski, M. and Pacini, N. Eds. (2008). Ecohydrology: Processes, Models and Case Studies. An Approach to the sustainable management of Water Resources. CAB International, Oxfordshire, UK. http://limnobh.wikispaces.com/file/view/ecohydrology.pdf (Accessed on 17 June 2011).
Havugimana, E. (2009). State policies and livelihoods: Rwandan human settlement policy – Case study of Ngera and Nyagahuru Villages. School of Global Studies, University of Gothenburg. Göteburg, Sweden. http://gupea.ub.gu.se/bitstream/2077/21046/5/gupea_2077_21046_5.pdf (Accessed on 29 August 2011).
IGCP (2002). Programme profile - November 2002. International Gorilla Conservation Programme (IGCP), African Wildlife Foundation, Nairobi. http://www.igcp.org/wp-content/themes/igcp/docs/pdf/IGCPprofile_Nov02.pdf (Accessed on 30 June 2011).
ILEG (2012). Proceedings of the Roundtable Discussion on Climate Financing in Kenya held at Sarova Panafric Hotel on January 25, 2012. Institute for Law and Environmental Governance (ILEG) in collaboration with Heinrich Böll Stiftung.
Lovgren, S. (2006). Nile explorers battled adversity, tragedy to find river source. National Geographic News.National Geographic Society, Washington D.C. http://news.nationalgeographic.com/news/2006/04/0419_060419_nile.html (Accessed on 16 June 2011).
Mehta, H. and Katee, C. (2005). Virunga Massif Sustainable Tourism Development Plan.Congolese Wildlife Authority (ICCN), Office of Tourism and National Parks (ORTPN), Uganda Wildlife Authority (UWA) with support from International Gorilla Conservation Programme (IGCP), Nairobi. http://www.igcp.org/wpcontent/themes/igcp/docs/pdf/VirungaTourismMasterPlan_%20Final%20Report.pdf (Accessed on 17 June 2011).
Myers, N. (1980). Conversion of Tropical Moist Forests. A report produced for the Committee on Research Priorities in Tropical Biology of the National Research Council. National Academy of Sciences, Washington D.C. http://pdf.usaid.gov/pdf_docs/PCAAA010.pdf (Accessed on 16 June 2011).
Nellemann, C., I. Redmond and J. Refisch, Eds. (2010). The Last Stand of the Gorilla – Environmental Crime and Conflict in the Congo Basin. A Rapid Response Assessment. UNEP and GRID-Arendal.
RoR (2011). Green Growth and Climate Resilience: National Strategy for Climate Change and Low Carbon Development.Kigali, Rwanda.http://www.smithschool.ox.ac.uk/wp-content/uploads/2011/03/Rwanda-Green-Growth-Strategy-FINAL.pdf (Accessed on January 5, 2012).
RoR/ MINAGRI (2011). Sector Evaluation Report for the Joint Sector Review FY 2010/2011. Ministry of Agriculture and Animal Resources.Republic of Rwanda (RoR), Kigali.
RoR/ MINALOC/ MINECOFIN (2007). Vision 2020 Umurenge: An integrated local development programme to accelerate poverty eradication, rural growth, and social protection.Ministry of Local Government (MINALOC) and Ministry of Finance and Economic Planning (MINECOFIN), Republic of Rwanda (RoR), Kigali.
RoR/ MINICOM (2011). Mainstreaming resource efficient and cleaner production in policies and strategies of Rwanda. Produced by the resource efficient and Cleaner Production Programme of Rwanda as part of delivering as one UN in Rwanda, October 2011.
RoR/MINALOC (2008). Community Development Policy. Ministry of Local Government (MINALOC), Republic of Rwanda (RoR), Kigali. http://www.minaloc.gov.rw/fileadmin/documents/Minaloc_Documents/Community_development.pdf (Accessed on 28 August 2011).
RoR/MINECOFIN (2000). Rwanda Vision 2020. Ministry of Finance and Economic Planning (MINECOFIN), Republic of Rwanda (RoR), Kigali.
RoR/MINECOFIN (2007). Economic Development and Poverty Reduction Strategy 2008-2012. Ministry of Finance and Economic Planning (MINECOFIN), Republic of Rwanda (RoR), Kigali. http://siteresources.worldbank.org/INTRWANDA/Resources/EDPRS-English.pdf (Accessed on 19 June, 2011).
RoR/MINECOFIN (2010). Mid-term review of the progress towards achieving Vision 2020 and the MDGs. Ministry of Finance and Economic Planning (MINECOFIN), Republic of Rwanda (ROR), Kigali.
RoR/MINECOFIN (2011). Fact sheet 2010. Ministry of Finance and Economic Planning (MINECOFIN), Republic of Rwanda (RoR), Kigali. http://www.minecofin.gov.rw/node/211 (Accessed on 25 August 2011).
RoR/MINIJUST (2010). Rwanda national report. Submitted in accordance with paragraph 15(a) of the annex to the human rights council resolution 5/1 in the framework of the universal periodic review. Ministry of Justice (MINIJUST), Republic of Rwanda (RoR), Kigali. http://www.minijust.gov.rw/moj/IMG/pdf/Rapport_Human_Right.pdf (Accessed on 28 August 2011).
RoR/MININFRA (2009). Rwanda national construction industry policy.Ministry of Infrastructure (MININFRA), Republic of Rwanda (RoR), Kigali. http://mininfra.gov.rw/index2.php?option=com_docman&task=doc_view&gid=113&Itemid=263 (Accessed on 28 August 2011).
RoR/MINITERE (2005). Initial national communication to the UNFCCC: Imprimerie Select Graph. United Nations Framework Convention on Climate Change (UNFCCC), Ministry of Lands, Environment, Forestry, Water and Mines (MINTERE), Republic of Rwanda (RoR), Kigali.
RoR/NISR (2011). NISR fast facts. National Institute of Statistics (NISR), Republic of Rwanda (RoR), Kigali. http://statistics.gov.rw/index.php (Accessed on 28 August 2011).
RoR/REMA (2008). Etablissement d’un inventaire national rapide des marais et élaboration de cinq avant projets d’arrêts ministériels relatifs aux marais (4 modules). Draft. Office Rwandais de Protection de l’Environnement (REMA), Kigali.
RoR/REMA (2009). Rwanda state of environment and outlook: our environment for economic development. Rwanda Environment Management Authority (REMA), Republic of Rwanda (RoR)/United Nations Environment Programme (UNEP), Kigali. http://www.rema.gov.rw/soe/full.pdf (Accessed on 20 June 2011).
Rutagarama, U. and Uhorakeye, T. (2010). Geothermal Development in Rwanda: An Alternative to the Energy Crisis.Proceedings World Geothermal Congress 2010. Bali, Indonesia, 25-29.
Rwanda Meteorological Service (2004). Generation and application of climate information, products and services for disaster preparedness and sustainable development in Rwanda; Kigali, June 2004.
UNDP (2010).International human development indicators. UNDP, New York. http://hdr.undp.org/en/statistics/ (accessed on August 30, 2011).
UNEP (2003). Africa: Atlas of our changing environment. UNEP, Nairobi. http://www.unep.org/dewa/Africa/AfricaAtlas/PDF/en/Africa_Atlas_Full_en.pdf (Accessed on 28 August 2011).
USAID-Rwanda (2004). Integrated Strategic Plan 2004-2009. Volume 2: Annexes. USAID, Kigali. http://www.usaid.gov/rw/our_work/about_usaid/docs/missionstrategyvolume2.pdf (Accessed on 17 June 2011).
USGS (2004). United States Geological Survey, Shuttle Radar Topography Mission (SRTM), Global Land Cover Facility, University of Maryland, College Park, Maryland, February 2000.
World Bank (2011). World Bank country data - Rwanda. http://data.worldbank.org/country/rwanda (accessed on 28 August 2011).

View of Kigali city. Rural to urban migration leads to dense settlement in Kigali City and surrounding areas, putting pressure on wetlands.
22

23
Environmental Changes of Selected Hotspots
Introduction
This Chapter features several hotspots presented under the themes: population pressure and shrinking land base; urban expansion and sprawl; rural settlement and integrated land and water management for food and energy production; wetlands; forests and mining impacts. The environmental changes are evident in the visual ‘before and after’ change pairs based on available satellite images as well as aerial and ground photographs.
2D
mit
ri_6
6/F
lick
r

Chapter 2: Environmental Changes of Selected Hotspots24
0.95 ha per person
0.70 ha per person
0.50 ha per person
0.37 ha per person
1960
1970
1980
1990
2000
2010 2020 2030 2040 2050
0.33 ha per person
0.25 ha per person 0.19 ha per person 0.15 ha per person 0.12 ha per person 0.10 ha per person
Population Pressure and Shrinking Land BaseLand is an important component of Rwanda’s national economy. Indeed, between 2000 and 2011, the agricultural sector accounted for 31-47 per cent of the national GDP (RoR/ MINAGRI 2011) and 71 per cent of export revenues. It is also the main source of income for 87 per cent of Rwandans (RoR/REMA 2009). Population pressure is central to the land question in Rwanda because the country has a relatively small territorial area of 26 338 km2 and a high population density.
The country’s population was around 3 million in 1960 but stood at 10.6 million in 2010 and, with an annual growth rate of 2.9 per cent (UNDP 2011), was estimated at 10.9 million in 2011 (see figure 2.1c). This resulted in a population density of 415 persons per square kilometre, the highest on the African mainland. If this population growth rate persists, the population is expected to top the 33.3 million mark in 2050, resulting in a population density of 1 266 people per square kilometre or, in other words, 0.10 ha of land per person as depicted in figure 2.1a.
Figure 2.1a: Population growth and the pressure it places on land resources in Rwanda can be seen through the change in land area per person since the 1960s. The shrinking maps below show the relative change from 0.95 ha per person in 1960 to an estimated 0.25 ha per person in 2010 and 0.10 ha per person by 2050 based on UN population estimates and projections.
Figure 2.1: Population growth since 1960.

Chapter 2: Environmental Changes of Selected Hotspots 25
The factors that are responsible for this high and rising population density are past internal migration, previous inappropriate villagization policies that revolved around the ‘paysannats’ agrarian system. Other factors were land fragmentation under customary law driven succession, a high fertility rate and an influx of returning Rwandans and refugees from politically unstable neighbouring countries. Some of the corrective measures that have been put in place are decentralized governance structures that promote and implement government policies of land tenure reform through land registration, resettlement in Imidugudu, crop intensification based on encouraging the cultivation of crops that are suited to a region’s agro-climate as well as land and water husbandry.
In addition, one of the aspirations of the Vision 2020 human resource development and knowledge based economy pillar is to reduce the fertility rate from 6.5 (in 2000) to 4.5 children and to stabilize the population growth rate at 2.2 per cent by 2020. A reduced fertility rate and transforming the economic base from agricultural subsistence to a knowledge-based one within the Vision’s timeframe are projected to bring the land versus demographic pressure under control.
0.95 ha per person
0.70 ha per person
0.50 ha per person
0.37 ha per person
1960
1970
1980
1990
2000
2010 2020 2030 2040 2050
0.33 ha per person
0.25 ha per person 0.19 ha per person 0.15 ha per person 0.12 ha per person 0.10 ha per person
Figure 2.1b: Rwanda’s high rate of population growth has been spread throughout much of the countryside rather than concentrated in urban centres, as this series of maps shows.
0
2
4
6
8
10
12
1960 1970 1980 1990 2000 2010
Popu
lati
on (
mill
ions
)
YearsFigure 2.1c: Rwanda’s population growth trend since 1960.
Source: World Bank 2011
Source: UN-DESA 2011
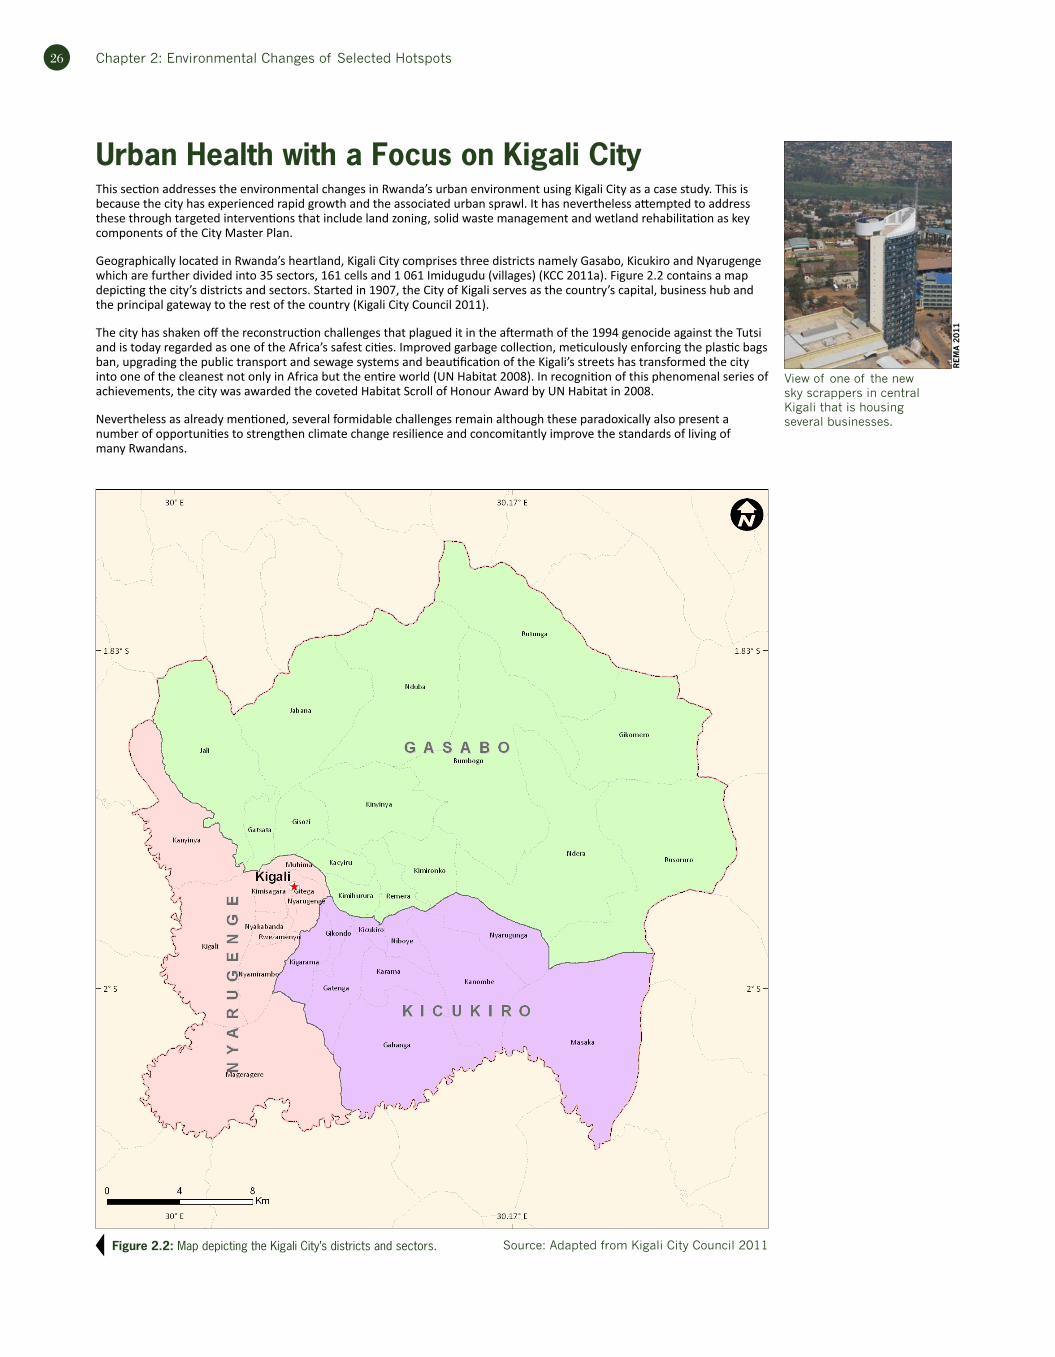
Chapter 2: Environmental Changes of Selected Hotspots26
Urban Health with a Focus on Kigali CityThis section addresses the environmental changes in Rwanda’s urban environment using Kigali City as a case study. This is because the city has experienced rapid growth and the associated urban sprawl. It has nevertheless attempted to address these through targeted interventions that include land zoning, solid waste management and wetland rehabilitation as key components of the City Master Plan.
Geographically located in Rwanda’s heartland, Kigali City comprises three districts namely Gasabo, Kicukiro and Nyarugenge which are further divided into 35 sectors, 161 cells and 1 061 Imidugudu (villages) (KCC 2011a). Figure 2.2 contains a map depicting the city’s districts and sectors. Started in 1907, the City of Kigali serves as the country’s capital, business hub and the principal gateway to the rest of the country (Kigali City Council 2011).
The city has shaken off the reconstruction challenges that plagued it in the aftermath of the 1994 genocide against the Tutsi and is today regarded as one of the Africa’s safest cities. Improved garbage collection, meticulously enforcing the plastic bags ban, upgrading the public transport and sewage systems and beautification of the Kigali’s streets has transformed the city into one of the cleanest not only in Africa but the entire world (UN Habitat 2008). In recognition of this phenomenal series of achievements, the city was awarded the coveted Habitat Scroll of Honour Award by UN Habitat in 2008.
Nevertheless as already mentioned, several formidable challenges remain although these paradoxically also present a number of opportunities to strengthen climate change resilience and concomitantly improve the standards of living of many Rwandans.
Figure 2.2: Map depicting the Kigali City’s districts and sectors. Source: Adapted from Kigali City Council 2011
View of one of the new sky scrappers in central Kigali that is housing several businesses.
RE
MA
2011

Chapter 2: Environmental Changes of Selected Hotspots 27
Kigali City’s ExpansionThe 2002 population census showed that Rwanda’s urban population had grown dramatically from 391 194 in 1991 to 1 362 312 inhabitants in 2002. In relative terms the country’s population hosted by the country’s urban areas increased from 5.5 to 16.7 per cent (Daley 2009). The population of Kigali City itself grew from 34 319 inhabitants in 1960 to close to 1 million inhabitants in 2010 (World Bank 2011) as depicted in Figure 2.3.
The Landsat satellite imagery shows the rapid expansion of the built up area in Kigali City. The city grew rapidly from independence in 1962 and the formal civic, commercial and residential buildings were primarily sited at the top of Nyarugenge Hill. However, densely packed informal housing also grew in tandem, accommodating mostly rural-urban
0
200
400
600
800
1000
1200
1960 1965 1970 1975 1980 1985 1990 1995 2000 2005 2010
Popu
lati
on 0
00’s
Years
Figure 2.3: Population growth trends of Kigali City.
Source: Kigali City Council 2011
The January 1979 image corresponds to a spatial expansion of 121 567 inhabitants and the February 1987 image to 186 609 inhabitants. The August 2001 image relates to 544 569 inhabitants and the December 2010 one to 908 705 inhabitants. The temporal Landsat image series shows a rapid expansion of built up areas over a 30 year period in the purple colour, from 1979 to 2010.
Until recently, the expansion took the form of ‘urban sprawl’ with the unplanned and haphazard construction of residential dwellings and business premises.

Chapter 2: Environmental Changes of Selected Hotspots28
migrants seeking employment in the city. The city expanded its geographic limits from 112 km2 in 1996 to 314 km2 in 2001 and 730 km2 in 2006 to include large areas that were formally designated as rural to accommodate the growing urban population. While this yielded some economic benefits, it also made it difficult for residents and business entities in the expanded city to access basic services such as grid electricity, water and decent sanitation, healthcare, education as well as transport and communication infrastructure.
A Quickbird satellite image of 2010 showing Kigali City and its dense neighbourhoods depicted in light colours ranging from white, yellow-brown, to dark-purple. Note the valleys, most of which are wetlands in between the neighbourhoods in light green to dark green that are protected from development to keep natural drainage and ecological functioning.

Chapter 2: Environmental Changes of Selected Hotspots 29
High spatial resolution satellite image series of October 2000, February 2004 and September 2010 demonstrate the city’s efforts to encourage the removal of scattered, unplanned settlements. The inhabitants of these are then resettled in compact residential dwellings complete with essential infrastructure. The social amenities of the above space-optimized residential housing estate include recreational open spaces, a spiritual centre and a school.
Addressing Urban SprawlThe City of Kigali has embarked on a rezoning exercise that will see the alteration of users of designated areas to create new residential, commercial and industrial zones. The exercise will also result in the creation of detailed physical plans for the city’s districts (Mazimpaka 2011). Programmes to resettle inhabitants of informal settlements that typically lack roads, electricity, water, sanitation and other basic infrastructure into planned and serviced communities are also being implemented. The policy shift to designing sustainable, energy-efficient settlements has the potential to stimulate the growth of the green construction industry. In addition to enhancing the city’s energy security by reducing energy demand, this would create a number of job opportunities (RoR 2011a).
High spatial resolution satellite imagery of 2000, 2004 and 2010 from Google Earth demonstrates the shift to encouraging reconstruction of residential dwellings in space-efficient compact areas. These are then serviced with essential infrastructure.
View of a well planned growing residential area in the eastern part of Kigali city addressing the urban sprawl problems of the past.
RE
MA
2011

Chapter 2: Environmental Changes of Selected Hotspots30
Solid Waste ManagementImplementation of waste management concepts is still a challenge in the City of Kigali. According to the Mayor of Kigali City, Mr. Fidele Ndayisaba, the city’s policies should focus on transforming the city from a largely unplanned to a well-planned and managed one. In this regard, the Kigali Conceptual Master Plan that seeks to, among others improve waste management in the city (MININFRA2007) was developed and endorsed by stakeholders. It is based on the ‘3Es concept’ that includes economic development; ecology and environment and equity and basic needs. The mayor stressed that political will, commitment and the existence of a supportive legal framework for implementation are key to realizing the master plan’s goals. However, another constraint relates to the heavy capital investment required to support the collection, recycling, treatment and safe disposal of solid and liquid waste. As a result, untreated liquid and solid waste is disposed of in ecologically fragile areas such as wetlands, with devastating consequences for the environment, human health and biodiversity.
The population of Kigali City has grown to roughly one million people as of 2010, generating an estimated 500 tonnes of solid waste daily.
A photo capturing landfill fires of the past at the Nyanza landfill, Kigali City. Landfill fires used to be a big problem for the surrounding areas of the site as they caused air pollution.
A bulldozer is seen here compacting garbage before covering with soil in a bid to rehabilitate it.
Tosh
ikaz
u M
ito
2009
Tosh
ikaz
u M
ito
2009

Chapter 2: Environmental Changes of Selected Hotspots 31
Kigali is estimated to generate 500 tonnes of solid waste per day. Of this, only 100-150 tonnes are transported to the sole landfill (KCC 2011b) at Nyanza located 10 km from the city centre. Until recently the Nyanza site posed a huge challenge regarding health and environmental hazards emanating from unpleasant and noxious smells. These were exacerbated by sporadic fires as well as from leachate flow. The Nyanza landfill site has now reached full capacity and work towards its decommissioning has started. In this regard the City of Kigali took steps to compact the solid waste on site and cover it with soil while at the same time installing ventilating pipes to allow the decomposition gases to escape. This intervention has worked well in mitigating the health and environmental hazard and has stopped the fires outbreaks.
A new landfill site has been identified on the southern outskirts of the city. Solid waste will be sorted to remove recyclable products to support the flourishing but largely informal recycling sector before disposal of the residual waste at the new landfill. There is also potential to briquette municipal solid waste with the resultant cylindrical fuel blocks being used as a cooking fuel. Further, the methane gas extracted from the sanitary land fill can be used to generate electricity and earn carbon credits worth more than 9 000 CER (Carbon Emission Reduction units) each. The net monetary cost to the city would be close to US $1 million, although the cost to the environment in addition to emissions reduction would be incalculable.
Kigali City’s sole solid waste facility, Nyanza Landfill in Kicukiro district, has reached capacity and is to be replaced by a new landfill in the near future. By 2009 it was being filled with soil to prepare it for decommissioning.
The Nyanza landfill is partially rehabilitated by covering it with soil. The rehabilitation process involving compaction of the solid waste and covering it with soil after completion in 2011.
Tosh
ikaz
u M
ito
2009
Tosh
ikaz
u M
ito
2009
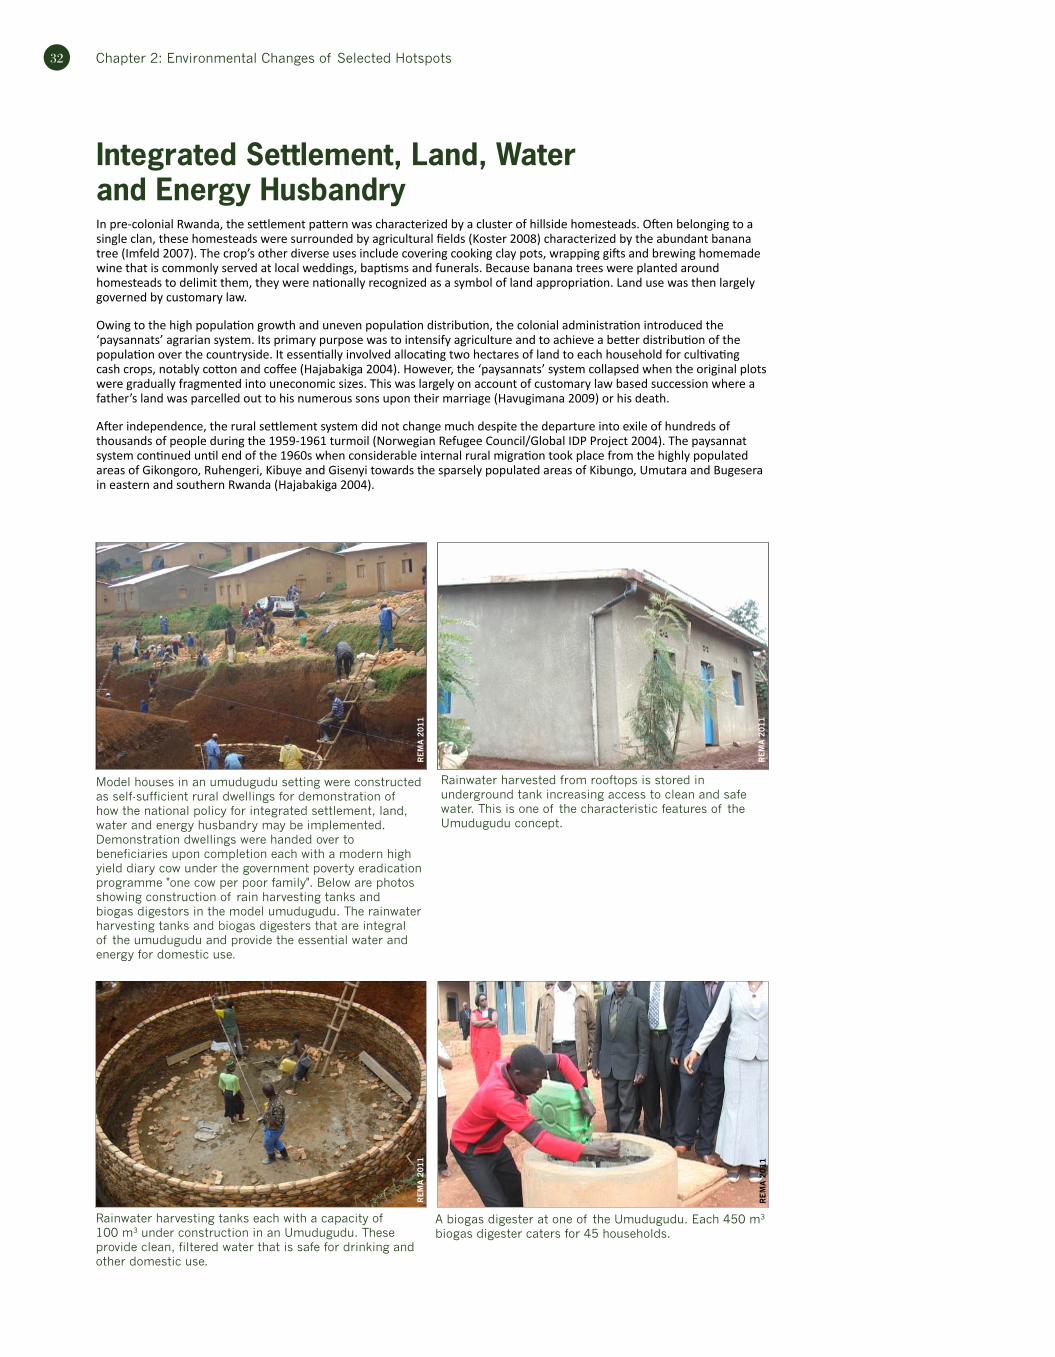
Chapter 2: Environmental Changes of Selected Hotspots32
Integrated Settlement, Land, Water and Energy HusbandryIn pre-colonial Rwanda, the settlement pattern was characterized by a cluster of hillside homesteads. Often belonging to a single clan, these homesteads were surrounded by agricultural fields (Koster 2008) characterized by the abundant banana tree (Imfeld 2007). The crop’s other diverse uses include covering cooking clay pots, wrapping gifts and brewing homemade wine that is commonly served at local weddings, baptisms and funerals. Because banana trees were planted around homesteads to delimit them, they were nationally recognized as a symbol of land appropriation. Land use was then largely governed by customary law.
Owing to the high population growth and uneven population distribution, the colonial administration introduced the ‘paysannats’ agrarian system. Its primary purpose was to intensify agriculture and to achieve a better distribution of the population over the countryside. It essentially involved allocating two hectares of land to each household for cultivating cash crops, notably cotton and coffee (Hajabakiga 2004). However, the ‘paysannats’ system collapsed when the original plots were gradually fragmented into uneconomic sizes. This was largely on account of customary law based succession where a father’s land was parcelled out to his numerous sons upon their marriage (Havugimana 2009) or his death.
After independence, the rural settlement system did not change much despite the departure into exile of hundreds of thousands of people during the 1959-1961 turmoil (Norwegian Refugee Council/Global IDP Project 2004). The paysannat system continued until end of the 1960s when considerable internal rural migration took place from the highly populated areas of Gikongoro, Ruhengeri, Kibuye and Gisenyi towards the sparsely populated areas of Kibungo, Umutara and Bugesera in eastern and southern Rwanda (Hajabakiga 2004).
Model houses in an umudugudu setting were constructed as self-sufficient rural dwellings for demonstration of how the national policy for integrated settlement, land, water and energy husbandry may be implemented. Demonstration dwellings were handed over to beneficiaries upon completion each with a modern high yield diary cow under the government poverty eradication programme "one cow per poor family". Below are photos showing construction of rain harvesting tanks and biogas digestors in the model umudugudu. The rainwater harvesting tanks and biogas digesters that are integral of the umudugudu and provide the essential water and energy for domestic use.
Rainwater harvesting tanks each with a capacity of 100 m3 under construction in an Umudugudu. These provide clean, filtered water that is safe for drinking and other domestic use.
Rainwater harvested from rooftops is stored in underground tank increasing access to clean and safe water. This is one of the characteristic features of the Umudugudu concept.
A biogas digester at one of the Umudugudu. Each 450 m3 biogas digester caters for 45 households.
RE
MA
2011
RE
MA
2011
RE
MA
2011
RE
MA
2011

Chapter 2: Environmental Changes of Selected Hotspots 33
A villagization development scheme was later launched in the 1970s and 1980s and the first pilot villages under this programme were built in Gashora in Bugesera and Sake in Kibungo. 80 000 farming households from the densely populated areas of the country were relocated here (Havugimana 2009). However the exercise was not as successful as had been intended as land continued to be fragmented through inheritance. In addition, services like water, electricity, health centres and schools which had been promised did not materialize.
Nearly 3.5 million people returned to Rwanda after the 1994 genocide against the Tutsi. A large number of Tutsi had fled the country in 1959 following violence against them (Kimonyo and others 2004). An even larger number of Rwandans mainly from the Hutu ethnic group fled following the 1994 genocide against the Tutsi in fear of reprisals as the majority of them were forced to provide ‘human shields’ to fleeing perpetuators. The government made a firm decision that any returnees would not be allowed to claim their old land as this would have resulted in conflict. Instead new villages, called Imidugudu in Kinyarwanda, were created for resettlement (Norwegian Refugee Council and Global IDP Project 2001).
The Imidugudu aimed to promote security and strengthen social bonds and to facilitate the provision of water, electricity, health centres, schools, agricultural services and other basic facilities (Bigsten and Lundstrom 2004). As such, they would encourage non-agricultural activities and the commercialization of agriculture.
Following widespread criticism of the initial conception of the Umudugudu particularly regarding size and site selection, new plans which also integrated agricultural development and animal husbandry were drawn up by the government in 2002 (MINITERE 2007). However, government plans to construct a fully-fledged Umudugudu prototype in each district were hampered by financial constraints. The primary objective of the Imidugudu prototypes had been to ensure local community buy-in and to stimulate investor interest in the programme (Wyatt and others 2008). Nevertheless, no prior assessment of the potential environmental impacts of the Umudugudu concept was carried out. As a consequence, many of the model villages which were constructed suffered a range of adverse environmental impacts such as soil erosion and overall land degradation. However, following the enactment of the Organic law determining the modalities of protection, conservation and promotion of the environment, these detrimental environmental effects in many of the settlements have been reversed.
A 2010 GeoEye satellite image showing a model low cost Umududgudu of Batsinda, north of Kigali City, replacing unserviced urban sprawl as seen in its vicinity.
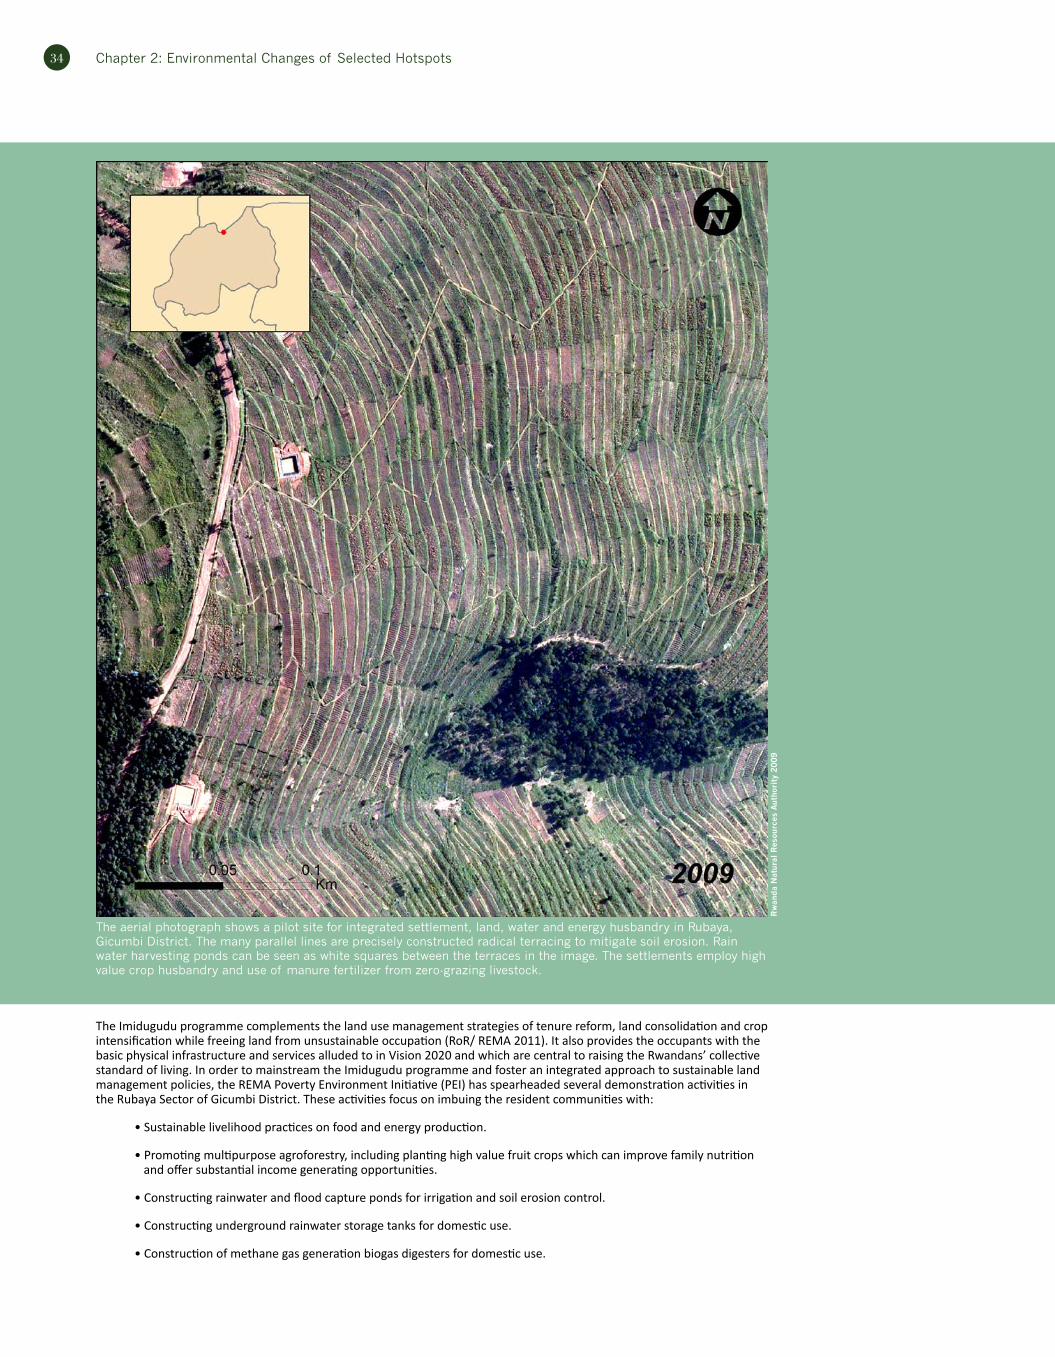
Chapter 2: Environmental Changes of Selected Hotspots34
The Imidugudu programme complements the land use management strategies of tenure reform, land consolidation and crop intensification while freeing land from unsustainable occupation (RoR/ REMA 2011). It also provides the occupants with the basic physical infrastructure and services alluded to in Vision 2020 and which are central to raising the Rwandans’ collective standard of living. In order to mainstream the Imidugudu programme and foster an integrated approach to sustainable land management policies, the REMA Poverty Environment Initiative (PEI) has spearheaded several demonstration activities in the Rubaya Sector of Gicumbi District. These activities focus on imbuing the resident communities with:
• Sustainable livelihood practices on food and energy production.
• Promoting multipurpose agroforestry, including planting high value fruit crops which can improve family nutrition and offer substantial income generating opportunities.
• Constructing rainwater and flood capture ponds for irrigation and soil erosion control.
• Constructing underground rainwater storage tanks for domestic use.
• Construction of methane gas generation biogas digesters for domestic use.
The aerial photograph shows a pilot site for integrated settlement, land, water and energy husbandry in Rubaya, Gicumbi District. The many parallel lines are precisely constructed radical terracing to mitigate soil erosion. Rain water harvesting ponds can be seen as white squares between the terraces in the image. The settlements employ high value crop husbandry and use of manure fertilizer from zero-grazing livestock.
Rw
anda
Nat
ural
Res
ourc
es A
utho
rity
2009

Chapter 2: Environmental Changes of Selected Hotspots 35
• Production of organic manure which enhances soil fertility.
• Zero grazing animal husbandry.
• Soil erosion control using radical terracing as shown in the 2009 orthophoto.
The main goal is to promote integrated environmental management. This would in turn improve standards of living and alleviate poverty by expanding the range of economic opportunities available to the rural poor.
A satellite image change-pair showing a community in Rubaya (Northern Province) with household dwellings scattered along the road in 2007 and planned Umudugudu in 2011, with underground rainwater harvesting infrastructure, zero grazing cowsheds, waste bio-digesters for methane cooking and lighting gas and other amenities as shown in the photos below and on the previous pages.
Square ponds like this have been constructed for rainwater/flood water capture and storage for irrigation during the dry season when water is scarce. RE
MA
2009

Chapter 2: Environmental Changes of Selected Hotspots36
WetlandsRwanda’s wetlands inventory consists of marshlands, lakes and rivers. The country is home to 860 marshlands that cover a total area of 278 536 ha. These account for 10.6 per cent of the national territory. Natural vegetation covers 41 per cent of the marshes while 53 per cent is covered by fields and 6 per cent lies fallow. The marshlands are complemented by 101 lakes which collectively cover and area of 149 487 ha and 861 rivers with a combined length of 6 462 km (REMA 2009). The best known of Rwanda’s wetlands is the Rugezi-Bulera-Ruhondo wetland complex which was designated by Ramsar as a wetland of international importance in December 2005. The location of this and other wetlands in the country is depicted in Figure 2.4.
Legal Protection of Wetlands
The country’s wetlands are protected by Organic Law N° 04/2005 determining the modalities of protection, conservation and promotion of the environment. Its stipulations are consistent with those of the Convention on Wetlands of International Importance especially as Waterfowl Habitat (Ramsar Convention). Rwanda ratified the Ramsar Convention in 2003 and it came into force in the country in April 2006. The Organic Law prohibits a range of activities in the country’s wetlands including construction of buildings, sewage plants, dumping of untreated waste water and hazardous waste and creates a 20 metre construction-free buffer zone around all swamps. It also stipulates that the use of wetlands shall be preceded by environmental impact assessments (EIAs).
To give effect to the Organic Law, a Ministerial Order N° 008/16.01 dated October 13, 2010 established the list of Rwanda’s swamps, their geographic limits and regulates their management and use. In addition, a detailed map that contains Rwanda’s wetlands inventory has been developed and is reproduced in Figure 2.5. This wetland protection levels map assigns different utilization categories of either unconditional exploitation (which is the most permissive and covers 6 per cent of the total wetland area), conditional exploitation (which represents 74 per cent of the total wetland area), or total protection (which is the most stringent utilization category and accounts for 20 per cent of the entire country’s wetland area).
Figure 2.4: Location of Rwanda’s wetlands. Source: Adapted from Republic of Rwanda/REMA 2008
A heron in the Akagera National Park that falls under the designation of total protection.
Ser
ge J
oram
Nse
ngim
ana
2010

Chapter 2: Environmental Changes of Selected Hotspots 37
Figure 2.5: Rwanda’s wetland protection levels. Source: Adapted from Republic of Rwanda/REMA 2008
Moreover, in addition to conducting EIAs as legally provided for, the strategic environmental assessment (SEA) tool is now increasingly used to evaluate the environmental impacts of policies, plans and strategies that affect wetlands. The rigorous requirements are predicated on the realization that wetlands play a critical role in the functioning of ecosystems and that they are vital to the health of humans and wildlife.
They are spawning grounds for diverse fish and amphibians and nurture a wealth of faunal and floral species which attract local and international tourists. They also purify water, recharge lakes, rivers and groundwater, and provide water for irrigation. The wetlands’ aquatic vegetation which in Rwanda mostly consists of Typha, Papyrus, Miscanthus and Cyperus, slows the flow of water, cushioning landscapes from top soil erosion and rivers and lakes from flooding during heavy rainfall. Equally important, because they serve as terrestrial carbon reservoirs, they help to stabilize the climate and attenuate climate change (Mitra and others 2005).
Despite their important role and the strict legal regime, Rwanda’s wetlands continue to be lost to
A view of the Nyabugogo River valley which falls under the conditional exploitation category based on national wetland management criteria.
RE
MA
2006
One of the few remaining pristine shores of Lake Kivu.
RE
MA
2010

Chapter 2: Environmental Changes of Selected Hotspots38
C
A B

Chapter 2: Environmental Changes of Selected Hotspots 39
fallow fields, afforestation, pisciculture (fish-farming), human settlement and to agriculture. Indeed, as Figure 2.6 on the proportion of upstream regions under agricultural use demonstrates, the fact that less than 10 per cent of the upstream agricultural areas utilize water from the highest number of wetlands implies that water abstraction within the agricultural sector is still not yet equitable.
Rugezi Wetland
The Rugezi Wetland located in the Northern Province of Rwanda straddles the Gicumbi and Bulera Districts. It covers an area of 6 735 ha and is located at an altitude of 2 050 m above sea level to the left of the Buberuka Highlands (Hategekimana and Twarabamenye 2007). The Rugezi Wetland is hydrologically connected with Lakes Bulera and Ruhondo and the Mukungwa River and is integral to regulating their water levels. In addition, it is the primary source of water to the Ntaruka hydro power station which was the backbone of hydro power production in Rwanda until the mid-2000s when Rugezi’s degradation, coupled with climate change-induced droughts, led to a significant reduction in water inflows into the station (Kazoora and Hagwirineza 2011).
The case of the Rugezi Wetland highlights the mutually reinforcing relationship between wetlands and climate change in important ways. On one hand, it is plausible that climate change has adversely affected the integrity of the Rugezi Wetland. After all, the availability of water, an integral component of any wetland, is dependent on climate sensitive variables such as rainfall and evaporation rates.
Indeed, although the larger African Great Lakes region has recorded a 5 per cent mean increase in rainfall (Hategekimana and Twarabamenye 2007), at the Rugezi microclimate level borne out by the meteorological data recorded at Ruhengeri (Musanze) station, the historically long rains have been replaced by short spurts of torrential rains. These often leave landslides, soil erosion and devastated infrastructure in their wake. Equally, it is arguable that the increased temperature, prolonged droughts and high evapotranspiration that Rugezi has witnessed over the last few years are directly attributable to climate change and variability (RoR/ MINITERE 2005).
Because these climate change-induced impacts (as opposed to those emanating from localized environmental degradation) are more pervasive and harder to head off, Rwanda needs to enhance its climate change adaptation endeavours. A key area would be to further diversify its energy sources into clean, renewable energy such as methane gas, solar and geothermal.
On the other hand, however, given that the capacity of a natural resource to sequester carbon and concomitantly mitigate climate change is inherently dependent on its integrity, Rugezi Wetland’s dramatic degradation inadvertently exacerbated climate change. A secondary effect of Rugezi Wetland’s degradation is that it reduced the hydropower generating capacity of the Ntaruka station. However, because thermal plants produce power by combusting fossil fuels, they are formidable
Figure 2.6: Proportion of upstream area under agriculture.
Source: Republic of Rwanda/REMA 2011
63
1719
1417
8
1411
3 2
0
10
20
30
40
50
60
70
Num
ber
of w
etla
nds
Upstream agricultural area (%)0 - 10 10 - 20 20 - 30 30 - 40 40 - 50 50 - 60 60 - 70 70 - 80 80 - 90 90 - 100
The dramatic restoration of the Rugezi Wetland is captured in the 2003 and 2010 satellite image change pairs. While the 2003 image is characterized by low water levels, reduced wetland vegetation and exposed soil and sand, these are virtually reversed in the 2010 image.
C C

Chapter 2: Environmental Changes of Selected Hotspots40
emitters of GHGs that accelerate climate change. In addition, these fuels pollute the air with particulates which are carcinogenic and cause a number of pulmonary illnesses such as asthma and chronic bronchitis.
Second, the higher power costs result from the fact that unlike the free water used in hydro power plants, the fuel used to fire the turbines in the thermal power plants costs an astounding US $65 000 per day (Hove and others 2011). This forces many Rwandans who are connected to the national grid to use more of the readily available and comparatively cheaper firewood and charcoal. This exerts more pressure on the country’s dwindling forest and woodlands. The power shortage also slowed the implementation of the Rural Electrification Programme, impeding attainment of the ambitious goal to increase the proportion of Rwandans connected to electricity from 2 per cent in 2000 to 35 per cent in 2020 (RoR 2000).
REMA instituted a series of measures to rehabilitate the Rugezi Wetland which was severely degraded. These included securing the legally mandated 20 metre buffer around the wetland by planting trees. REMA has also encouraged communities which live in Rugezi to engage in alternative livelihood activities, effectively lessening the destructive activities in the wetland. The resulting dramatic restoration of the Rugezi Wetland is captured in the 2003 and 2010 satellite image change pairs. This incredible achievement earned Rwanda the coveted Green Globe Award in 2010 and the degradation-induced effects – such as those related to lower hydropower production – are gradually tapering off.
Gikondo-Nyabugogo Valley Wetland
The Gikondo Valley Wetland, located in Kigali City is part of the Nyabugogo-Nyabarongo-Akagera River system. As the City has inadequate sanitation and storm water management facilities, the wetland plays an important role of storing large amounts of waste and storm water. In so doing, it allows sediments to settle and slows runoff, filters silt, metals, pesticides, excess nutrients and allows bacterial agents to biologically consume potential disease-causing pathogens. The city’s wetlands are also sources of aesthetic beauty while its rich biodiversity notably the endemic and migratory birds are an important source of tourism income.
An abandoned warehouse in the Nyabugogo wetland.
RE
MA
2006
Industrial and commercial activity in the Gikondo Wetland that was stopped by the 2005 Organic Law on environment. RE
MA
2011

Chapter 2: Environmental Changes of Selected Hotspots 41
Past inappropriate land use management policies have compromised the integrity of the Gikondo Valley Wetland. An industrial park was established on the wetland valley in the 1970s. Although the park provides employment to many Rwandans and is an important source of government revenue, the effluent discharge into the wetland is jeopardizing its ecological functions. As a result, downstream inhabitants are increasingly exposed to dangerously polluted waters (Mbabazi 2010). At a broader level, the effluent seeping out of the industrial zone could end up in Lake Victoria, Africa’s largest water body with potentially harmful effects on the entire Nile Basin.
REMA was tasked with providing the government with a framework to address this issue in a socially and environmentally appropriate manner. REMA carried out a wetlands mapping exercise and facilitated the development of an action plan and a series of recommendations arrived at through a highly participatory and consultative team of stakeholders including operators from Gikondo. The action plan and recommendations were adopted at a government of Rwanda retreat of 2007 which tasked the Ministry of Trade and Industry (MINICOM) to guide the implementation of the recommendations. Upon implementation, these will result in the relocation of the industries on the Gikondo Wetland to a modern and well serviced Special Economic Zone that is under construction in Masoro, Gasabo District. The relocation will enable this vital ecosystem to be rehabilitated.
The satellite image of Kigali City (above) is marked with the locations of Nyabugogo Valley and Gikondo Industrial Area, which are shown in greater detail in the enlarged images (left). Wetlands within the city provide valuable ecosystem services and need to be safeguarded through careful planning and management.
A structure under construction in a wetland is abandoned in the Nyabugogo wetland.
RE
MA
2006
Photograph A shows the current state of Gikondo Valley industrial area and while B shows a panoramic view of the new industrial zone that is currently under construction in Masoro where industries from Gikondo will be relocated as required by the Organic Law on environment.
RE
MA
2011
RE
MA
2011
A B

Chapter 2: Environmental Changes of Selected Hotspots42
Effect of Water Hyacinth on Wetlands
The water hyacinth (Eichhornia crassipes) has in the past posed a significant threat to Rwanda’s water resources. The free floating perennial aquatic plant is native to the Amazon Basin in Latin America. As it is a prolific bloomer it is difficult to eradicate. As such, it once colonized many of Rwanda’s water systems, impeding water purification, marine transportation, fishing, hydro power production and irrigation and jeopardizing the capacity of the infested water bodies and courses to play their traditional ecological roles (Williams and others 2005, Odada and Olago 2006).
In 2001, the entire 500 km Mukungwa-Nyabarongo-Kagera River system to Lake Victoria was infested with the water hyacinth (Moorhouse and others 2001). In addition, in 1997, 610 ha, representing more than half of Lake Mihindi in the north of the Akagera National Park was covered in a dense mat of the alien weed (Albright 2004). By the time the first satellite image below was taken at the end of December 1999, the hyacinth infestation had receded to 25 per cent of the lake. This remarkable reduction has been attributed to the El Niño associated rains that ravaged the Lake Victoria Basin in late 1997 and early 1998. The heavy waves and winds caused substantial damage to the individual hyacinth plants while the rapid water level rise is believed to have extricated the interwoven mats (Albright 2004).
Local communities using simple canoes to manually remove the invasive water hyacinth.
RE
MA
2011

Chapter 2: Environmental Changes of Selected Hotspots 43
Efforts to employ the chevroned water hyacinth weevil (Neochetina bruchi) and the water hyacinth weevil (Neochetina eichhorniae) as biological control agents (Agaba and others 2001, Moorhouse and others 2002) proved unsuccessful. This is principally because while the water hyacinth flourishes in diverse weather conditions (Bownes 2008), the population increase of the weevils is suppressed in colder, high altitude areas (Marlin 2010) such as the Akagera region. As such, the weevils are not able to attain the critical mass necessary to tackle such an aggressive weed. The result is that adult weevils are unable to effectively stunt and kill off the plants by eating their way into the plant’s growth base (GISP 2004).
Subsequently, manual removal efforts were intensified, prompted by a rise in innovative uses of the weed. These included using it as manure, a pig feed and to make handicrafts (Gashamura 2009). Using the removed hyacinth to diversity the income generating opportunities of the poor Rwandans who live on the shores of Lake Mihindi has resulted in a virtually 100 per cent removal rate as the 2010 Landsat image attests.
The highly invasive water hyacinth in the Akagera River system.
RE
MA
2011

Chapter 2: Environmental Changes of Selected Hotspots44
ForestsRwanda’s forests comprise a consortium of forested belts in the protected areas (Akagera, Nyungwe and Volcanoes National Parks); forest reserves (Gishwati and Mukura); and natural forests (Busaga, Buhanga and the gallery forests in the Eastern Province); forest plantations that primarily consist of exotic tree species; woodlots; and agroforestry.
Rwanda’s forest cover is around 10 per cent of the national territory (RoR 2007), which coincides with the internationally recommended minimum threshold. Giant strides have been made in the recent past towards Vision 2020’s plan of raising the country’s forest cover to 30 per cent by 2020 (RoR 2000). A national forest inventory carried out by the National University of Rwanda for the Ministry of Natural Resources (MINIRENA) in 2007 produced the forest map of Rwanda (MINIRENA/CGIS-NUR 2007). It estimated the natural and planted forest covers at around 5 per cent each.
The multi-pronged national forest management policy encourages the use of innovative terracing techniques, live mulches reforestation, afforestation and agroforestry. Agroforestry in the country largely revolves around planting Calliandra calothyrsus, a multipurpose tree species with a rapid early growth and Leucaena diversifolia whose properties include aggressive growth in cool or high altitude regions common in Rwanda. These efforts to increase Rwanda’s forest cover are in line with the 2008-2012 EDPRS (RoR 2007) has brought about remarkable changes. These efforts also won Rwanda the highly regarded Future Policy Award in 2011 as already discussed.
Inevitably, forests are an integral part of the national economy and their stature has been rising in light of the positive correlation between deforestation and climate change. Forests also underpin many of the welfare improvements relating to health, education, gender equity, industrialization and poverty reduction promised by Vision 2020 (RoR 2000) and EDPRS (RoR/ MINECOFIN). However, threats to Rwanda’s forests from various human drivers such as illegal logging, bush fires and charcoal production still exist. This is largely due to the country’s deficit in renewable energy supply. Although Rwanda’s forestry sector shows a generally positive trend, the Atlas focuses on two hotspots for decision makers to draw lessons and take corrective action. These are Gishwati and Bugesera.
Dense bamboo forest in Volcanoes National Park. Gar
rett
Zie
gler
/Fli
ckr

Chapter 2: Environmental Changes of Selected Hotspots 45
Figure 2.7: Location of Rwanda’s key forests, including Gishwati Forest Reserve. Adapted from: MINIRENA/CGIS-NUR 2007
Gishwati Forest Reserve
The Gishwati Forest Reserve is situated within the Western Province in north western Rwanda as is shown in Figure 2.7. It lies within the greater Albertine Rift and is close to Lake Kivu. Its relief is characterized by steep hills with an elevation range of 2 000-3 000 m above mean sea level (Nyandwi and Mukashema 2011).
A history of deforestation
The mountainous rainforest’s story over the last eight decades has been one of dramatic deforestation. The forested area stood at about 70 000 ha in 1930, 28 000 ha in 1960 and 8 800 ha in 1990. Deforestation gathered pace in the following 15 years and in 2005, the forest residue covered only a dismal 600 ha (RoR/ REMA 2009; Great Ape Trust 2011; and Forest Landscape Restoration 2011). The satellite image series dated between 1978 and 2010 show this progressive degradation of the forest.
Inappropriate land use management policies of the early 1980s led to the conversion of 70 per cent of Gishwati’s natural forest cover into pasture and pine plantations. A further 10 per cent was designated as a military zone, leaving only 20 per cent as a natural forest (Weber 1989 in Plumptre and others 2001).

Chapter 2: Environmental Changes of Selected Hotspots46
Pasture for dairy farming in Gishwati.
Ferns in the remaining natural forest.
A potato collection point in what was Gishwati Forest.
Planted pines and eucalyptus among the dairy pastures.
Tea plantations thrive in the micro climate surrounding montane forests.
Current land use within the area of Gishwati Forest that had tree cover in 1978 generally falls into one of the five categories illustrated in the photographs.
RE
MA
Pet
er C
lay
RE
MA
2011
Mad
elei
ne N
yira
tuza
2011
Pet
er E
iche
naue
r /
Flic
kr

Chapter 2: Environmental Changes of Selected Hotspots 47
Resettlement of returning refugees in the aftermath of 1994 genocide against the Tutsi saw the loss of most of the remaining natural forest to settlements and agriculture. In 1999, the government capped the resettlement beneficiaries to 818 families on a 3 000 ha site called Arusha in Gishwati (pers com REMA 2011). Families that had settled on areas that were especially prone to soil erosion and landslides were resettled outside Gishwati (pers com REMA 2011).
Apart from a drastic reduction of endemic flora, fauna and avifauna, negative environmental impacts of this land conversion culminated in flooding in the neighbouring low lying areas. The most serious of these occurred in 2007 and caused more than a dozen deaths as well as extensive destruction to property and crops.
Degraded portions of the forest were reforested with exotic tree species that promote monocultures which eliminate the ecological benefits of biodiversity. Gishwati’s deforestation has had far reaching consequences that have been attributed to climate change (GEF 2010). Flooding has in addition to the deaths and destruction of property mentioned above been associated with increased health risks. For example, the flooded low lying valleys and ponds act as breeding grounds for the malaria-transmitting mosquito (UNDP and GEF 2010).
In addition, the degradation of the forest led to landslides and soil erosion. Due to the forest reserve’s mountainous relief, it is estimated that it lost an estimated 1 million tonnes of soil every single year (Andrew and Masozera 2010). This, together with the unpredictable weather patterns associated with climate change, reduced the agricultural productivity of the adjacent land, leading to longer dry spells. The soil erosion also led to the heavy siltation of the Sebeya River, making clean drinking water difficult to obtain and raising the costs of both purifying water and hydropower plant maintenance (Andrew and Masozera 2010).
Concerted efforts to reverse Gishwatis’s deforestation
The current and potential adverse effects of climate change have galvanized international efforts to address deforestation. In the case of Gishwati, the Gishwati Area Conservation Programme (GACP) was initiated in 2007 when H.E. President Paul Kagame and the Founder and Chair of the Great Ape Trust/Earthpark Ted Townsend, pledged at the Clinton Global Initiative meeting in New York City to found a national conservation park that would benefit climate, biodiversity and the welfare of the local community.
Landcover classes digitized from 2010 satellite data shows the current land use for the area that had been forested in 1978. Rangeland covers nearly 40 per cent of the area followed closely by farmland and settlements.
Evidence of Gishwati’s reforestation.
RE
MA
2011

Chapter 2: Environmental Changes of Selected Hotspots48
Through sheer determination and actively involving local communities both as eco-guards and as beneficiaries of a number of sustainable livelihood practices based on Gishwati’s enormous tourism potential, the rehabilitation of Gishwati is in full gear. And, the area occupied by the natural forest grew from 600 ha in 2005 to 886 ha in 2008 and 1 484 ha in 2011 (Forest Landscape Restoration, 2011). Though a number of challenges still have to be overcome, as the forest’s severe deforestation has begun to be reversed, it has been fittingly nicknamed the ‘Forest of Hope.’
The increasing carbon sequestration from the growing tree cover will definitely help to offset Rwanda’s growing emissions as the country continues on its low carbon industrialization path. Besides enhancing Rwanda’s climate resilience, this will also benefit both the global climate and its East and Central African components. Positive outcomes for the forest’s fauna have already been recorded and for the first time in four decades, the chimpanzee population grew an impressive 53.8 per cent from 13 in 2007 to 20 in 2011 while the endangered golden and mountain monkey populations are also increasing. As Gishwati now has the potential to benefit from tourism revenue of between US $40 000 to US $50 000 annually (The New Times 2011), the restoration efforts have transformed the forest reserve into a viable source of income for neighbouring communities. As a result, the forest is poised to play its rightful role in reducing rural poverty in line with Vision 2020 and the EDPRS.
Opportunities for leveraging Gishwati’s potential to strengthen climate resilience
Going forward, it is important for Rwanda to consolidate progress made in conceptualizing its Payments for Ecosystem Services (PES) schemes. The Gishwati forest is still in need of further rehabilitation and consolidating its forest governance mechanisms that are participatory in order to ensure local community support are vital. These can in turn be used to tap funds from the well-resourced Adaptation Fund, a range of bilateral and multi-donor trust funds and the Green Climate Fund, once the latter is established.
Strengthening the forest’s governance mechanisms would also instil the system with accountability and transparency. It would also foster equitable and mutually beneficial relations between the forest adjacent communities and government institutions (De Zoysa and Inoue 2008). The effect of the above would be to transform Rwanda’s development path to a low emission and climate resilient one.
A Memorandum of Understanding (MoU) was signed between the Government of Rwanda and the Great Ape Trust for a conservation initiative to rehabilitate the Gishwati area. This MoU led to the establishment of the Gishwati Area Conservation Programme (GACP) (PCLG 2010) which recognized Gishwati as a protected sanctuary for gravely threatened chimpanzee troops.

Chapter 2: Environmental Changes of Selected Hotspots 49
Bugesera’s Woodlands
The Bugesera District which covers an area of 1 303 km2 is located on Rwanda’s southern plains in the Eastern Province. It shares boundaries with Kigali City and the districts of Rwamagana to the north and Ngoma to the east and Burundi’s Kirundo Province to the south. Bugesera is situated between the Nyabarongo and Akanyaru Rivers which merge into the Akagera River in the southern portion (UNEP/ UNDP/ RoR PEI 2007). The region also hosts numerous lakes which cover an estimated surface area of 10 635 ha (LVBC 2011), the largest of which are Cyohoha and Rweru (Nile Basin Initiative undated). Although there are a few remnants of gallery forests, Bugesera’s vegetation primarily consists of shrubs, understorey trees and short grasses that typically characterize arid and semi-arid areas (Kanyamibwa 1998).
Loss of Bugesera’s woodlands
Bugesera has suffered deforestation over the last four decades particularly in the early 1970s and late 1990s when entire forests and woodlands were nearly wiped out. This was primarily due to drought and soil erosion. The magnitude of deforestation is demonstrated by the fact that in just 5 years, the area occupied by woodlands shrunk by over 80 per cent from 50 000 ha in 1983 to less than 10 000 ha in 1988 (MINAGRI 1998).
Causes and consequences of deforestation
Bugesera’s deforestation is primarily attributed to the fact that the region’s forests and woodlands were cleared for human settlement, agriculture as well as firewood and charcoal production. Bugesera’s deforestation started when it was used to resettle internally displaced persons (IDPs) following the ethnic violence of 1959. This was compounded the influx of Rwandans from the then districts of Butare (Huye), Gikongoro (Nyamagabe), Gisenyi (Rubavu) and Ruhengeri (Musanze). Later some Rwandans who had lived for decades in the neighbouring countries as refugees (UNEP/ UNDP/ RoR PEI 2007) also settled in Bugesera. Thus, the population of Bugesera, which was sparsely populated in the 1960s, soared to 266 775 in 2002 according to the 2002 national population and housing census (National Census Service 2003) and an estimated 274 000 in 2009 (AfDB 2009).
Due to the Bugesera’s close proximity to Kigali, it has traditionally accounted for the largest supply of charcoal to the capital, whose households consume 75 per cent of the national charcoal production (UNEP/ UNDP/ RoR PEI 2007). The district is also a major supplier of firewood to a number of large institutions such as schools and prisons as well as industrial and informal establishments. The effect of these drivers is evident in the satellite change pair images.
Bugesera District’s typically woody shrubby landscape.
Vin
cent
Mta
roni
2011

Chapter 2: Environmental Changes of Selected Hotspots50
The effects of this deforestation have been far reaching. There has been a dramatic loss of biodiversity and the elephants, lions, leopards, buffaloes, hyenas, antelopes, wild pigs, reptiles and birds that abounded in the region had disappeared from the area long before the turn of the century (Kanyamibwa 1998).
Bugesera epitomizes the feedback loop between forests and climate change particularly well. Indeed, despite being endowed with a network of freshwater lakes and the fact that two major rivers namely; Nyabarongo and Akanyaru (which eventually merge into the Akagera River that empties into Lake Victoria) flow through it, rainfall is low and erratic and drought and food shortages frequent. Prolonged drought, for example, devastated Bugesera in 1999/2000 and 2005/2006 with maize and bean production plummeting an astounding 192-203 per cent relative to the 1990 levels (SEI 2009). These prolonged droughts have adverse implications for the inhabitants’ water, livelihood and food security and heighten the risks of under nourishment and malnutrition. This is worsened by the fact that Bugesera’s average temperature typically ranges between 23 oC to 29 oC making it one of the warmer regions of the country.
Challenges faced by Bugesera
Studies have found that climate change-induced temperature rises are expanding malaria zones into higher altitudes where the colder temperature there previously created a natural barrier against the disease. It has therefore been argued that malaria preventive and treatment costs are likely to rise exponentially in the coming decades in hilly tropical countries such as Rwanda (SEI 2009).
Bugesera’s woodlands were seriously deforested, especially during the 1970s and 1990s, however a programme of reforestation begun in 2005 has been successful in restoring tree cover. The 2010 and 2011 images show areas within the recovering woodlands which have been cleared for commercial agriculture.

Chapter 2: Environmental Changes of Selected Hotspots 51
The argument rings especially true for Bugesera whose location on the south eastern edge of the Central Plateau implies that its topography consists of a combination of hills, lowlands and floodplains. The latter mainly abound on the banks of the Nyabarongo and Akanyaru Rivers. Due to the associated intense rainfall, climate change has also made the populations which inhabit the floodplains and lowlands more susceptible to malaria.
Opportunities for strengthening climate change resilience
Following the decimation of Bugesera’s historical gallery forests, pressure has shifted to its woodlands although these are also fast disappearing. In fact, the eucalyptus tree, which has a high calorific value, is now harder to find and Euphorbia (locally known as Imiyenzi) is the dominant source of wood fuel (UNEP/ UNDP/ RoR PEI 2007). Promoting agroforestry would help to fill this gap. In addition, use of improved cooking stoves that are more energy efficient will help to reduce wood fuel consumption.
Ultimately, it will be important for Bugesera (and indeed Rwanda) to look beyond forests and woodlots to satisfy energy needs. As one of Rwanda’s hotter areas, Bugesera is well endowed with solar radiation. This should be harnessed in order to provide alternative, renewable energy to light up and power the region. This would gradually help to reduce the use of wood energy and kerosene which are largely responsible for the climate change that the world is grappling with. Some Bugesera women have already undergone relevant training in India and are earning decent sources of income from installing and maintaining photovoltaic systems (Rwanda Focus 2010). Replicating these initiatives would help to meet the Vision 2020 and EDPRS goals to reduce poverty levels and to increase the percentage of Rwandans with access to electricity. Further, these measures would gradually channel investments to the low emission and climate change resilient sectors of the economy.

Chapter 2: Environmental Changes of Selected Hotspots52
MiningRwanda’s mineral wealth consists of cassiterite (tin ore) as the main mineral, coltan (tantalum ore), wolframite (tungsten ore) as well as some gold and sapphires (RoR 2011c). Figure 2.7 depicts the country’s mineral distribution by district. Mining was not reported as a discrete economic activity by government ministries (Notably MINECOFIN) and agencies (notably NISR) until 2003.
The artisanal nature of mining in Rwanda is associated with a number of adverse environmental ramifications. Owing to the low level of technological application and technical expertise, the country’s miners predominantly use rudimentary technologies for prospecting as well as extracting and processing ore (Avila 2003). As a consequence, open cast cassiterite mining activities on steep slopes allow ore residues to flow uncontrolled downhill into streams and rivers. Although available research has not directly interrogated the human toxicity potential of the resultant pollution, there is evidence of widespread arable soil toxicity (Reetsch 2008, Flugge and others 2007). In addition, mine tailings contaminate surface and groundwater, making it difficult for local communities to access clean, unpolluted drinking water. Some of the surface water in the mining regions of the country reportedly contain lead and arsenic (RoR and EU 2006), which are toxic in miniscule concentrations.
Mining is land and water intensive and climate change is likely to intensify the scarcity of these in the country. While land scarcity is a nationwide problem, water supply is likely to be a problem in the arid areas of Rwanda which already experience frequent and prolonged drought. Supply chain disruptions caused by natural disasters and transport logistic impediments caused by floods are also likely to be compounded by climate change. Further vulnerabilities relate to energy costs and security. The energy security dynamic will be especially vital if Rwanda continues to rely on climate-dependent hydro power. Concerns about rising energy costs will persist if fossil fuelled thermal power continues to dominate Rwanda’s energy sources. To enhance resilience to climate-related flood and drought risks, mining companies need to expand the coping range of their heavy duty equipment.
Figure 2.8: Mineral distribution by district in Rwanda. Source: Adapted from: Government of Rwanda (Rwanda Geology and Mining Authority)
Open cast artisanal mining activity in the Gatumba area of Ngororero District in the Western Province of the country.
RE
MA
2011

Chapter 2: Environmental Changes of Selected Hotspots 53
A higher prevalence of climate change-induced illnesses such as malaria in Rwanda’s high altitude zones and respiratory diseases such as asthma could lower mine employee productivity. Adequately addressing this risk may require more extensive healthcare coverage, which is likely to hurt company profitability.
The mining sector offers considerable scope for job creation. Sustained privatization of the sector can increase government revenue and further boost export earnings, helping Rwanda to narrow its widening trade deficit. However, perhaps the greatest opportunity for the sector relates to its infancy. Because of the hurdles and costs associated with switching from high emission to low emission technologies and processes, Rwanda has taken the strategic decision to adopt this low carbon path from the outset. Additional benefits of the ‘get it right first time’ approach revolve around the growing international carbon market. The reduced carbon emissions can generate carbon credits (Pfeifer 2007) which can be traded and the proceeds used to fund Vision 2020 and the EDPRS’ flagship projects.
A landslide caused by inappropriate mining techniques in the Gatumba area of Ngororero District in the Western Province of the country.
RE
MA
2011
An orthophoto image showing cassiterite (tin ore) residues from open cast artisanal mining in Gakenke District flowing into rice paddies and into the Nyabarongo River.

Chapter 2: Environmental Changes of Selected Hotspots54
ReferencesAfDB (2009): Rwanda-Burundi: AfDB Group approves US$ 47 million grant
for Bugesera project. http://www.afdb.org/en/news-and-events/article/rwanda-burundi-afdb-group-approves-us-47-million-grant-for-bugesera-project-5120/ (Accessed on February 3, 2012).
Agaba, P., Asiimwe, T., Moorhouse, T. G. and McNabb, T. J. (Undated). Biological control of water hyacinth in the Kagera River headwaters of Rwanda: A Review through 2001. Accessed at http://www.cleanlake.com/images/rwanda_bio_paper.pdf(Accessed on December 15, 2011).
Albright, T.P., Moorhouse, T.G., and Mcnabb, T.J. (2004). The Rise and fall of Water Hyacinth in Lake Victoria and the Kagera River Basin, 1989-2001. J. Aquat. Plant Manage. 42: 73-84. http://www.cleanlake.com/images/Water_Hyacinth_Lake_Victoria_JAPM_42_2004.pdf(Accessed on December 15, 2011).
Andrew, G. and Masozera, M. (2010). Payment for ecosystem services and poverty reduction in Rwanda. Journal of Sustainable Development in Africa (Vol.12 (3).Clarion University of Pennsylvania, Clarion, Pennsylvania.http://www.fao.org/fileadmin/user_upload/kagera/resource/Rwanda%20PES.pdf (Accessed on December 17, 2011).
Avila, E. C. (2003). Small-scale mining: A new entrepreneurial approach. Natural Resources and Infrastructure Division, Economic Commission for Latin America and the Caribbean, Santiago, Chile. http://www.eclac.org/publicaciones/xml/1/13901/Lcl1834i.pdf (Accessed on 20 June 2011).
Bhattacharya. A. and Kumar, P. (2010). Water hyacinth as a potential biofuel crop. EJEAFChe, 9 (1).[112-122]. Accessed at http://ejeafche.uvigo.es/index.php?option=com_docman&task=doc_view&gid=584(Accessed on February 5, 2012).
Bownes, A. (2008). Evaluation of a plant-herbivore system in determining potential efficacy of a candidate biological control agent, Cornops Aquaticum for Water Hyacinth, Eichhornia Crassipes. A Thesis Submitted in Fulfilment of the Requirements for the Degree of Doctor of Philosophy of Rhodes University.http://eprints.ru.ac.za/1567/2/Bownes-PhD-tr09-132.pdf (Accessed on January 5, 2012).
De Zoysa, M. and Inoue, M. (2008). Forest governance and community based forest management in Sri Lanka: Past, present and future perspectives. International Journal of Social Forestry, 2008, 1(1):27-49. http://www.ijsf.org/dat/art/vol01/ijsf_vol1_no1_02_zoysa_srilanka.pdf (Accessed on February 4, 2012).
Flugge, J., Pohl, W., and Schmidt, K. (2007). Coltan environmental management: Sustainable restitution/ recultivation of artisanal tantalum mining wasteland in Central Africa.http://adg2007.gfzpotsdam.de/fileadmin/GFZ/site_grafik/adg/pdf/adg__20070707_06_fluegge.pdf(Accessed on June 30, 2011).
Forest Landscape Restoration (2011).Gishwati.http://www.forestlandscaperestoration.org/regional-networks/eastcentralafrica/gishwati/ (Accessed on January 15, 2012).
Gashamura F.R. (2009). Effects of manure from water hyacinth on soil fertility and maize performance under controlled conditions in Rwanda. International Masters Programme at the Swedish Biodiversity Centre. Master’s Thesis No. 56, Uppsala.http://www.slu.se/Global/externwebben/centrumbildningar-projekt/centrum-for-biologisk-mangfald/Dokument/publikationer-cbm/Masteruppsatser/Nr_56_Freddy_Gashamura.pdf (Accessed on January 26, 2012).
GISP (2004). Africa Invaded: The growing danger of invasive alien species. The Global Invasive Species Programme.http://www.gisp.org/downloadpubs/gisp%20africa%202.pdf (Accessed on December 15, 2011).
Hajabakiga, P. (2004). Land conflict: Addressing land issues in post conflict setting – the case of Rwanda. In Quan, J, Tan, S. F. and Toulmin, C. (Eds). Land in Africa: Market asset or secure livelihood? Proceedings and summary of conclusions from the Land in Africa Conference held in London November 8-9, 2004.Institute for Environment and Development (IIED), London.http://www.icarrd.org/en/dialogue/docs_IIED-NRI_Land%20Conference.pdf (Accessed on January 4, 2012).
Havugimana, E. (2009). State policies and livelihoods: Rwandan human settlement policy. A case study of Ngera and Nyagahuru villages. School of Global Studies, University of Gothenburg. Göteburg, Sweden. http://gupea.ub.gu.se/bitstream/2077/21046/5/gupea_2077_21046_5.pdf(Accessed on August 29, 2011).
Imfeld, A. (2007). Decolonizing African agricultural history. Zürich, Switzerland. http://www.alimfeld.ch/African_Agricultural_History/Aghist.pdf (Accessed on June19, 2011).
Kanyamibwa, S. (1998).Impact of war on conservation: Rwandan environment and wildlife in agony. Biodiversity and Conservation 7, pp. 1399-1406. http://www.bren.ucsb.edu/academics/courses/595E/Session%206/KanyamibwaImpactOfWar.pdf (Accessed on February 4, 2012).
Kazoora, C. and Hagwirineza, J. B. (2011). The relationship between bio-physical factors and power generation at Ntaruka, Rwanda and implications for revenue generation. REMA, UNDP and UNEP.
KCC (2011a). About Kigali: City of Kigali a gateway to Rwanda. http://www.kigalicity.gov.rw/spip.php?article109 (Accessed on February 2, 2012).
KCC (2011b). Social Welfare: Water and Sanitation Programmes in the City of Kigali. http://www.kigalicity.gov.rw/spip.php?article116&var_recherche=waste (Accessed on February 2, 2012).
Kimonyo, J. P., Twagiramungu, N. and Kayumba, C. (2004). Supporting the post-genocide transition in Rwanda: The role of the international community. Working Paper 32.Conflict Research Unit, Netherlands Institute of International Relations (Clingendael Institute), The Hague.http://www.clingendael.nl/publications/2004/20041200_cru_working_paper_32.pdf (Accessed on 20 June, 2011).
Koster, M. (2008). Fragmented lives: Reconstructing rural livelihoods in post-genocide Rwanda. PhD Thesis. Sociology of consumers and households, Wageningen University. http://edepot.wur.nl/122047 (Accessed on June19, 2011).
LVBC (2011). Vulnerability Assessment to climate change in Lake Victoria basin. East African Community. Lake Victoria Basin Commission, Kisumu, Kenya and ACTS Press.(Accessed on January 15, 2012).
Marlin, D. (2010). The role of the mite Orthogalumnaterebrantis in the biological control programme for water hyacinth, Eichhorniacrassipes, in South Africa. A thesis submitted in fulfilment of the requirements for the degree of Doctor of Philosophy of Rhodes University. http://eprints.ru.ac.za/2076/2/MARLIN-PhD-TR11-115.pdf (Accessed on January 26, 2012).
MINAGRI (1998). Stratégie et Plan d’action pour la aécurité alimentaire. Ministère de l’Agriculture, de l’Elevage, de l’Environnement et du Développement Rural. Ministry of Agriculture and Animal Resources (MINAGRI), Kigali, Rwanda.
MININFRA (2007). Kigali conceptual master plan.Prepared for the Ministry of Infrastructure (MININFRA) by OZ Architecture, EDAW, Tetra Tech, ERA, and Engineers without Borders.November 2007.
Ministere des Ressources Naturelles (MINIRENA/CGIS-NUR) (2007). Cartographie Forestière du Rwanda, 2007 Volume 1.
Moorhouse, T. G., P. Agaba and T. McNabb. 2001. Recent efforts in biological control of water hyacinth in the Kagera River headwaters of Rwanda, p. 152. In: M. H. Julien, M. P. Hill, T. D. Center and J. Ding (eds.). Biological and Integrated Control of Water Hyacinth, Eichhorniacrassipes. Proceedings of the Second Meeting of the Global Working Group for the Biological and Integrated Control of Water Hyacinth, Beijing, China, 9-12 October 2002. ACIAR Proc. No. 102.
National Census Service (2003). The Rwanda 2002 population and housing census. National Census Service, Kigali, Rwanda.
Nile Basin Initiative (undated). Bugesera Transboundary Water Management Project: The Governments of Rwanda and Burundi work together. Nile Basin Initiative. Equatorial Lakes Subsidiary Action Programme.http://www.nilebasin.org/nelsap/index.php?option=com_content&view=article&id=120:bugesera-transboundary-water-management-project-the-governments-of-rwanda-and-burundi-work-together&catid=1:latest-news&Itemid=128 (Accessed on January 15, 2012).

Chapter 2: Environmental Changes of Selected Hotspots 55
Norwegian Refugee Council and Global IDP Project (2001). Profile of internal displacement: Burundi. A compilation of the information available in the Global IDP Database of the Norwegian Refugee Council. Norwegian Refugee Council (NRC), Geneva, Switzerland. http://www.internal-displacement.org/8025708F004BE3B1/(httpInfoFiles)/094840C4A09B5977802570B500469ED3/$file/Burundi+-October+2001.pdf(Accessed on June 20, 2011).
Nyandwi, E. and Mukashema, A. (2011). Excessive deforestation of Gishwati mountainous forest and biodiversity changes.ict4d article. http://www.idrc.ca/EN/Programs/Agriculture_and_the_Environment/Climate_Change_and_Water/Documents/ICT4D_article_forests_nyandwi_EN.pdf (Accessed on December 10, 2011).
Odada, E.O., and Olago, D.O. (2006). Challenges of an ecosystem approach to water monitoring and management of the African Great Lakes. Aquatic Ecosystem Health and Management 9(4):433-446.
Pfeifer, G. (2007). New instruments for attracting FDI: Carbon finance in Africa. In Dufey, A., Grieg-Gran, M. and Ward, H. (Eds).Responsible enterprise, foreign direct investment and investment promotion: Key issues in attracting investment for sustainable Development. International Institute for Environment and Development (IIED) and World Association of Investment Promotion Agencies (WAIPA), pp. 131-149. http://axisrse.com/medios/nivel1/archivos/0_RESPONSIBLE_ENTERPRISE_FOREING_DIRECT.PDF#page=147 (Accessed on February 12, 2012).
Plumptre, A. J. Masozera, M. and Vedder, A. (2001). The impact of civil war on the conservation of protected areas in Rwanda. Washington, D.C.: Biodiversity Support Program.
Reetsch, A., Nieder, R., Pohl, W. (2008). Effects of Coltan Mining on Properties and Quality of Soils of the Open-Cast Mining in Gatumba District, Rwanda. Technische Universtiät Carolo-Wilhelmina ZuBraunschweig. http://www.soil.tu-bs.de/download/downloads/Diplomarbeiten/Reetsch.2008.toc-abs.DA.pdf(Accessed on 30 June 2011).
RoR (2000). RwandaVision 2020. Kigali, Rwanda.
RoR (2011a). Baseline Report National Strategy on Climate Change and Low Carbon Development for Rwanda. Republic of Rwanda and Smith School of Enterprise and Environment, University of Oxford. February 2011. http://www.smithschool.ox.ac.uk/wp-content/uploads/2011/03/Rwanda-Baseline-Final.pdf (Accessed on February 11, 2012).
RoR (2011a). Baseline Report National Strategy on Climate Change and Low Carbon Development for Rwanda. Republic of Rwanda and Smith School of Enterprise and Environment, University of Oxford. February 2011. http://www.smithschool.ox.ac.uk/wp-content/uploads/2011/03/Rwanda-Baseline-Final.pdf (Accessed on February 11, 2012).
RoR and EU (2006). Environmental Profile of Rwanda. Kigali 2006. http://www.vub.ac.be/klimostoolkit/sites/default/files/documents/rwanda-environmental-profile.pdf (Accessed on February 14, 2012).
RoR/ MINAGRI (2011). Sector Evaluation Report for the Joint Sector Review FY 2010/2011.Ministry of Agriculture and Animal Resources.Republic of Rwanda (RoR), Kigali.
RoR/ MINICOM (2011). Rwanda National Export Strategy (NES).http://www.minicom.gov.rw/IMG/pdf/National_Export_Strategy.pdf (Accessed on February 12, 2012).
RoR/ MINITERE (2005). Initial national communication under the United Nations Framework Convention on Climate Change. Republic of Rwanda, Ministry of Lands, environment, forestry, water and mines, Kigali. June 2005.http://unfccc.int/resource/docs/natc/rwanc1.pdf (Accessed on December 31, 2011).
RoR/ NISR (2008). Rwanda in Statistics and Figures 2008.http://174.120.5.254/~statgov/sites/default/files/user_uploads/files/books/rwanda%20in%20figures.pdf (Accessed on February 12, 2012).
RoR/MINECOFIN (2007). Economic Development and Poverty Reduction Strategy (EDPRS) 2008-2012.Minister of Finance and Economic Planning (MINECOFIN), Republic of Rwanda (RoR), Kigali.
RoR/REMA (2009). Rwanda state of environment and outlook: Our environment for economic development. Rwanda Environment Management Authority (REMA), Republic of Rwanda (RoR)/United Nations Environment Programme (UNEP), Kigali.
RoR/REMA (2011). Economic analysis of natural resource use in Rwanda with a case of land and water resource use in Rugezi Wetlands: A Summary. EA II Study. Sponsored by REMA, UNEP and UNDP. Rwanda Environmental Management Authority (REMA), Republic of Rwanda (RoR), Kigali.http://rema.gov.rw/rema_doc/pei/Final%20report.%20EANRII_FEB_2011_SUMMARY.pdf (Accessed on June 20, 2011).
Rwanda Focus (2010). India-trained women light up Bugesera with solar energy. The Rwanda Focus.http://focus.rw/wp/2010/08/india-trained-women-light-up-bugesera-with-solar-energy/ (Accessed on January 14, 2012).
SEI (2009). The Economics of Climate Change in Rwanda. Stockholm Environment Institute (SEI), Oxford. http://www.rema.gov.rw/ccr/Final%20report.pdf (Accessed on January 6, 2012).
Twarabamenye, E. and Hategekimana, S. (2007). The impact of wetlands degradation on water resources management in Rwanda: the case of Rugezi Marsh. Proceedings of the 5th International Symposium on Hydrology, Cairo, September, 2007.http://www.irst.ac.rw/IMG/pdf/Paper_for_V_International_Symposium_on_En_Hydrology1.pdf
UNDP and GEF (2010). Rwanda: Reducing vulnerability to climate change by establishing early warning and disaster preparedness systems and support for integrated watershed management in flood prone areas. UNDP Kigali, Rwanda and Global Environment Facility (GEF).http://www.thegef.org/gef/node/3340 (Accessed on December 17, 2011).
Williams, A.E., Duthie, H.C., Hecky, R.E. (2005). Water hyacinth in Lake Victoria: Why did it vanish so quickly and will it return? Aquat. Bot. 81,300–314.
Wyatt, A., Holloway, S., Blackshaw, U. and Ntagungira, C. (2008). Functional reviews and institutional audit of six public sector institutions to assess the impact of ongoing public sector reforms: Project ID PO66386. Oxford Policy Management, February 2008. http://www.mifotra.gov.rw/fileadmin/templates/downloads/Functional%20Review%20-%20Final%20report.pdf(Accessed on January 24, 2012).

A beautiful Lake Kivu peninsular residential area in Karongi District, Western Province.
56

57
Environmental Changes of Transboundary Natural Resources and Issues
Introduction
Transboundary natural resources are those natural resources and ecosystems that are shared by two or more countries. This chapter covers selected transboundary resources and issues namely: transboundary water resources; transboundary protected areas; and transboundary movement of people. Management of transboundary natural resources, as opposed to domestic ones, is associated with a peculiar set of challenges that relate to the concept of national sovereignty. In its most radical
3G
ille
s To
rdje
man
2004
57

Chapter 3: Environmental Changes of Transboundary Natural Resources and Issues58
form, the concept postulates that a State is a master of its territory and may adopt in regard to natural resources within it, any measures suitable to its national interests regardless of their effects beyond its borders (Kelly 1996).
Because access to and the benefits of these resources are often claimed by several countries, cooperative and equitable management is key to preventing conflict and environmental degradation. This is primarily because unlike people whose transboundary movement is controlled through immigration processes, the natural environment does not respect these borders (Kituo Cha Katiba 2005). This often gives rise to environmental concerns that stem from the movement of plants and living organisms including migratory animals and birds, water as well as air, water and soil pollution across political borders either naturally or when induced by people (FAO 2008). Rwanda’s transboundary resource wealth consisting of water resources and protected areas is portrayed in Figure 3.1.
Transboundary Water ResourcesThe major transboundary water bodies include Lake Kivu (shared with DRC) as well as Lakes Cyohoha and Rweru (shared with Burundi). The major transboundary rivers include the Akagera (shared with Tanzania), Akanyaru (shared with Burundi), Kagitumba and Muvumba (shared with Uganda), Ruvubu (shared with Burundi) as well as Rusizi (shared with Burundi and DRC).
Almost half of Rwanda’s territory lies within the Albertine Rift which is considered to be one of the important ‘water towers’ of the African continent (UNEP 2010). Indeed, Rwanda’s hydrological system is characterized by the great Nile-Congo divide. As such, Rwanda accounts for important inflows into the Nile and Congo Rivers (Brooks and others 2011). As indicated in an earlier section, the Nile basin accounts for more than two thirds of the Rwandan territory so it is the more significant of
Figure 3.1: Map showing Rwanda’s transboundary resources consisting of water resources protected areas. Source: Adapted from the various sources of the Republic of Rwanda

Chapter 3: Environmental Changes of Transboundary Natural Resources and Issues 59
the two basins for the country. Indeed, the remotest source of the White Nile is Rwanda’s Nyabarongo River which merges with the Akanyaru River to become the Akagera River (Lovgren 2006). The Akagera River empties into Lake Victoria, Africa’s largest freshwater lake, from which the Nile River starts its long, winding journey to the Mediterranean Sea.
Shared natural resources and ecosystems present unique social, economic and environmental challenges, especially in the face of climate change. Transboundary cooperation among the sharing nations is critical to addressing the specific challenges that relate to climate change (UNECE 2011; Conway 2004) and to avoiding conflict. In this regard, the Nile Basin Countries (NBCs) formed the Nile Basin Initiative (NBI) which was envisioned as a long term partnership of the NBCs in order to effectively manage this shared water resource and collectively initiative basin-wide development projects while preventing any potential conflict over its utilization (Uitto and Duda 2002). Rwanda is an active participant in the Nile Basin Initiative. In 2010, Rwanda, along with Kenya, Uganda, Tanzania, Burundi and Ethiopia, signed the historic Nile Cooperative Framework Agreement which seeks to ensure equitable and sustainable use of the waters of the Nile River Basin by the riparian countries. This cooperation will especially be important given that climate change is projected to heighten the water scarcity that already plagues some of the NBCs (NBI 2011).
Protected AreasRwanda’s territory, particularly the Albertine Rift, is endowed with a rich biodiversity of important endemic species of flora and fauna. It is a habitat for the critically endangered mountain gorilla (RoR/REMA 2009). Around 10 per cent of the country’s area is dedicated to environmental conservation and protection in the form of three national parks. These national parks which are all transboundary in nature (SCBD 2003) are: the Virunga National Park (shared with the DRC and Uganda), the Akagera National Park (shared with Tanzania) and the Nyungwe National Park (shared with Burundi).
The Nyabarongo River merges with the Akanyaru River to become the Akagera River which flows into Lake Victoria from where the Nile starts its long journey to the Mediterranean Sea in Egypt. G
ille
s To
rdje
man
2004

Chapter 3: Environmental Changes of Transboundary Natural Resources and Issues60
Figure 3.2: Map depicting the historical and transboundary nature of Volcanoes National Park.
Source: Adapted from the various sources of the Republic of Rwanda
Volcanoes National ParkThe Volcanoes National Park (PNV) is located between 1°50’ S and 29°30’E and has a surface area of 160 km2. It is coterminous with the Virunga National Park (PNVi) of the DRC and Mgahinga Gorilla National Park (MGNP) in Uganda (Mehta and Katee 2005). In order to protect the gorillas that inhabit it from poachers, the PNV was first gazetted in 1925, making it the first national park to be created in Africa. However, initially, it covered a comparatively small area that was enclosed by the Karisimbi, Bisoke and Mikeno volcanoes. However in 1929, the borders of the park were extended farther into Rwanda and into the then Belgian Congo to form the Albert National Park. This park occupied a vast area of 8 090 km², managed by the Belgian colonial authorities which were in charge of both colonies.
The Volcanoes National Park (PNV) is renowned for its chain of eight volcanic mountains that are popularly referred to as the ‘Virunga Massif.’ It is also the natural habitat of the endangered mountain gorilla (Gorilla gorilla beringei). These mountains, which rise from a baseline of 2 300 m to 4 005 m above sea level form Rwanda’s northern frontier with Uganda and the DRC. The volcanoes from west to east are: Nyamuragira, Nyiragongo, Mikeno, Karisimbi, Bisoke, Sabyinyo, Gahinga and Muhabura.
The Nyiragongo and Nyamuragira volcanoes are still active (Mehta and Katee 2005). Mount Nyamuragira which stands at 3 058 m above sea level is the more active one, having erupted 35 times since 1982. The last of these eruptions was recorded in January 2010. Mount Nyiragongo is however the more dangerous of the two volcanoes as highly fluid lava has been known to flow down its slopes at speeds of up to 100 km per hour. In 1977, 70 people died following the mountain’s eruption. In 2002, 47 people were killed and the lava flows reached the carbon dioxide and methane gas laden Lake Kivu (Allard and others 2002).
The Sabyinyo volcanic mountain is one of the Virunga chain of eight that mark the boundary between Rwanda and the DRC.
Bru
ce P
engr
a 2010

Chapter 3: Environmental Changes of Transboundary Natural Resources and Issues 61
Flowers of the Hagenia abyssinica tree.
Flora and Fauna
The volcanic mountains and their slopes are covered with natural vegetation. The bamboo forest belt stretches from near the base up to about 3 000 m above sea level. A Hagenia forest belt with patches of herbaceous cover the next 300 m, a sub afro-alpine vegetation belt occupies the following 600 m while afro-alpine vegetation occupies the summit and its environs. The entire Volcanoes National Park of Rwanda is surrounded by settlements and agricultural land on both the Rwandan and Ugandan sides (RoR/ REMA 2009).
Vegetation varies considerably due to the large altitudinal range within the park. There is some lower montane forest although most of it has now been largely lost to agriculture. Between 2 400 m and 2 500 m is Neoboutonia forest while from 2 500 m to 3 200 m Arundinaria alpina (bamboo) forest occurs, covering about 30 per cent of the park. From 2 600 m to 3 600 m, mainly on the more humid slopes in the south and west, Hagenia-Hypericum forest which covers about 30 per cent of the park dominates. This is one of the largest Hagenia abyssinica forests in Africa.
The vegetation from 3 500 m to 4 200 m is characterized by Lobelia wollastonii, L. lanurensis, and Senecio erici-rosenii and covers about 25 per cent of the park. From 4 300 m to 4 500 m, grasslands occur. Secondary thicket, meadows, marshes, swamps and small lakes also occur, but their total area is relatively small.
Besides its famous mountain gorilla (Gorilla beringei beringei) population, PNV hosts a number of other mammals. These include the golden monkey (Cercopithecus mitis kandti), black-fronted duiker (Cephalophus niger), buffalo (Syncerus caffer), spotted hyena (Crocuta crocuta) and bushbuck (Tragelaphus scriptus). Although the elephant has also been spotted, this is now very rare. In addition, there are 178 recorded bird species. At least 13 of these species and 16 subspecies are endemic to the Virunga and Rwenzori Mountains.
Climate change is a major concern because it aggravates existing pressure on biodiversity. Already human activity, land use changes and alien invasive species are causing biodiversity losses at an unprecedented scale (CBD 2007). Climate change compounds this pressure especially in light of the Millennium Ecosystem Assessment that projects that climate change will become the major driver of biodiversity loss by the end of the century (Millennium Ecosystem Assessment 2005). Given this worrying prognosis, Rwanda, along with her neighbours, need to urgently tap the considerable opportunities for climate change mitigation and adaptation. In this regard, maintaining and restoring native ecosystems and protecting these transboundary wildlife parks from encroachment would help to stave off loss of their biodiversity on the projected scale.
John
For
long
e n.
d.
The rare silverback mountain gorilla in its natural habitat of the Volcanoes National Park. Yoko
Wat
anab
e 2011

Chapter 3: Environmental Changes of Transboundary Natural Resources and Issues62
Conservation and Tourism
Studies in 2007 showed that there were 17 gorillas groups divided into two subcategories: nine groups were used for research activities while the remaining eight were for tourism purposes (WWF and World Bank 2007). However the recent Mountain gorillas’ census in 2010 indicated that there were a total of 480 mountain gorillas that lived in 36 groups along with 14 solitary silverback males in the Virunga Massif. The Virunga gorilla population has shown a significant increase. The 2003 census had revealed a population of 380 gorillas, up from 324 individuals recorded in the previous census in 1989 (Gray and others 2010).
The importance of transboundary protected areas is especially clear for migratory species or animals that move within a large home range. For example in November 2004, two habituated tourism gorilla groups, one from PNVi in DRC (Kwitonda group) and one from MGNP in Uganda (Nyakagezi group) moved from their usual ranges to Rwanda’s PNV.
Regional collaboration is vital to the sustainable management of these critically endangered gorillas. A Memorandum of Understanding for the ‘Transboundary Gorilla Groups’ was signed in 2006. Its aim is to ensure the collaborative monitoring of and sharing revenues earned from the transboundary tourism gorilla groups. In February 2008, a 10-year Transboundary
2010 Landsat image showing the current extent of the Volcanoes National Park, with a map overlay as a dotted yellow line marking the extent of the Park in 1973. The yellow square inside the Landsat image indicates the location of a high resolution inset on the opposite page showing ernomous landuse pressure on the Volcanoes National Park from the surrounding population as clearly visible as a sharp contrast of the image between the dark green of the Park protected forest against the light greens and dark browns of the surrounding intensive cultivation with settlements along the roads.

Chapter 3: Environmental Changes of Transboundary Natural Resources and Issues 63
Strategic Plan for the Central Albertine Rift was developed which will enable sustainable conservation of natural resources for the benefit of the people of Rwanda, the DRC, Uganda and the larger international community.
In 1979, the Virunga’s first official mountain gorilla tourism programme was launched in Rwanda. Mountain gorilla based tourism is one of the most lucrative income generating activities in Rwanda. It not only generates important revenue for conservation efforts but also benefits both the local communities surrounding the park and the country (Neilsen and Spenceley 2010).
The tourism infrastructure around the Volcanoes National Park largely consists of hotels, eco lodges and roads. Kinigi is the base of tourism activities, mainly mountain gorilla tracking. Among the luxurious hotels in the vicinity of PNV area is Sabyinyo Silverback Lodge (Grobpietsch 2007). This luxurous lodge offers panoramic views of the park and the surrounding farmlands. Other hotel infrastructure near the park includes the Mountain Gorilla View Lodge and The Gorilla Nest. In addition, Iby’Iwacu Cultural Village and SACOLA Cultural Village offer an interesting peek into Rwanda’s rich culture.
In 2005, a revenue sharing scheme was established which consists of giving 5 per cent of total park revenues to local communities as an incentive for conservation (Nielsen and Spenceley 2010). Money from the revenue earned from tourism is allocated to Sectors around the Park. For example, over a period of 6 years, a total of Rwf 422 405 832 (approximately US$ 698 191) has been distributed to the areas surrounding the Volcanoes National Park. This has been used to support a number of community projects.
Even though a lot has been done in the conservation of the mountain and the Volcanoes National Park, there are still challenges. Poaching, beekeeping, the unsustainable harvesting of wood for fuel and other human activities all threaten the environmental integrity of the park. Furthermore, humans are potentially a source of zoonotic diseases such as Ebola that, once transmitted to gorillas, could decimate entire families (UNEP 2003).
Climate change is likely to alter the natural goods and services associated with the Volcanoes National Park ecosystem. This could potentially deprive the park’s wildlife of food, water and shelter, threatening their very existence. Changing weather patterns are also likely to compound human pressure on the park as people go in search of increasingly rarer natural capital. Anti-poaching and anti-biopiracy efforts therefore need to be urgently strengthened. In addition, initiatives that encourage local community participation in national park conservation should be sustained.
The photo shows a sharp boundary line separating the Volcanoes National Park and the surrounding subsistence agriculture based settlements depicting land use pressure on the protected area.
Gil
les
Tord
jem
an 2
004

Chapter 3: Environmental Changes of Transboundary Natural Resources and Issues64
Akagera National ParkLocation and Vegetation
Akagera National Park in located in the north eastern corner of Rwanda and covers an estimated area of 1 085 km2. It is considered to be among the most complex savannah ecosystems in the eastern Africa region. Its landscape largely consists of open grassland dotted with tangled acacia trees that are occasionally combined with patches of gallery forest in the north. The national park is also home to wetlands and lakes particularly along the course of the Akagera River (UNEP 2008).
Flora and Fauna
Akagera National Park is characterized by grassland plains interspersed with mainly savannah woodland and wetlands endowed with rich biodiversity of endemic birds and large mammals. The park is important for the conservation of the sitatunga (Tragelaphus spekei) and the roan antelopes (Hippotragus equinus) (Plumptre and others 2001). It is also home to an estimated 700 bird species, making it an ornithologist’s paradise.
Akagera National Park overlooking Lake Muhindi.
Gae
l Va
nde
Weg
he 2
010

Chapter 3: Environmental Changes of Transboundary Natural Resources and Issues 65
A giraffe cow in the Akagera National Park.
Persistent Challenges
The 2009 SOE (RoR/ REMA 2009) report highlighted some of the challenges facing the Akagera National Park. These include poaching, alien invasive species notably the water hyacinth (although significant successes have been recorded in its manual removal from the lakes), bushfires during the dry season, illegal grazing and fishing. It also warned of negative implications of isolation of mammalian species with small populations such as the African lion, African elephant and rhinoceros. The isolation is brought about by the inability of wildlife to cross the Akagera River into Tanzania. Migration patterns are further blocked by human settlements and other incompatible land use.
Fire is common in the savannah portions of the Akagera National Park. Satellite images from July 1980, June 1984, and July 2004 show large fire scars in and around the park, manifested as dark purple patches. In 1980, fires left a scar that covered a gigantic area of 3 500 km2. In 2004, fires believed to have been started by poachers burned nearly one-third of the park. Bushfires spread a lot faster in situations of drought and the projected increased incidence of this in the face of climate change will have a considerable bearing on the park’s integrity. In contrast to the dry season images alluded to above, the December 1999 image shows the region during the rainy season, when fires rarely occur.
RE
MA
2011
A Landsat image time series shows scars from persistent fires in 1980, 1984, 1994 and 2004 as dark purple to dark brown shades contrasting with the green shades indicating healthy vegetation and lakes which appear as dark blue to black.

Chapter 3: Environmental Changes of Transboundary Natural Resources and Issues66
Human pressure is another significant challenge facing the park. In 1997, the size of the national park was reduced by approximately two thirds to allow for the resettlement of large numbers of refugees. Growing grazing pressure, agricultural encroachment, charcoal production, the felling of trees for construction, and deliberately started fires have considerably fragmented the park’s ecosystem. As a result, wildlife populations are now concentrated in scattered enclaves (USAID Rwanda 2004).
A herd of zebras in the Akagera National Park.
Dan
iel
Coo
mber
n.
d.
The black and white images (enlarged area of red box on the facing page) from along what was formerly the northern boundary of Akagera National Park show the intensity of settlement and agriculture that has developed since the top image was taken in 1980. A small number of settlements can be seen along the road near the center of the 1980 image, by 2009 the entire area is being farmed and several concentrated settlements have been built.
The orange outline (facing page) shows the current extent of the National Park, the yellow dashed line shows the pre-1997 boundary.
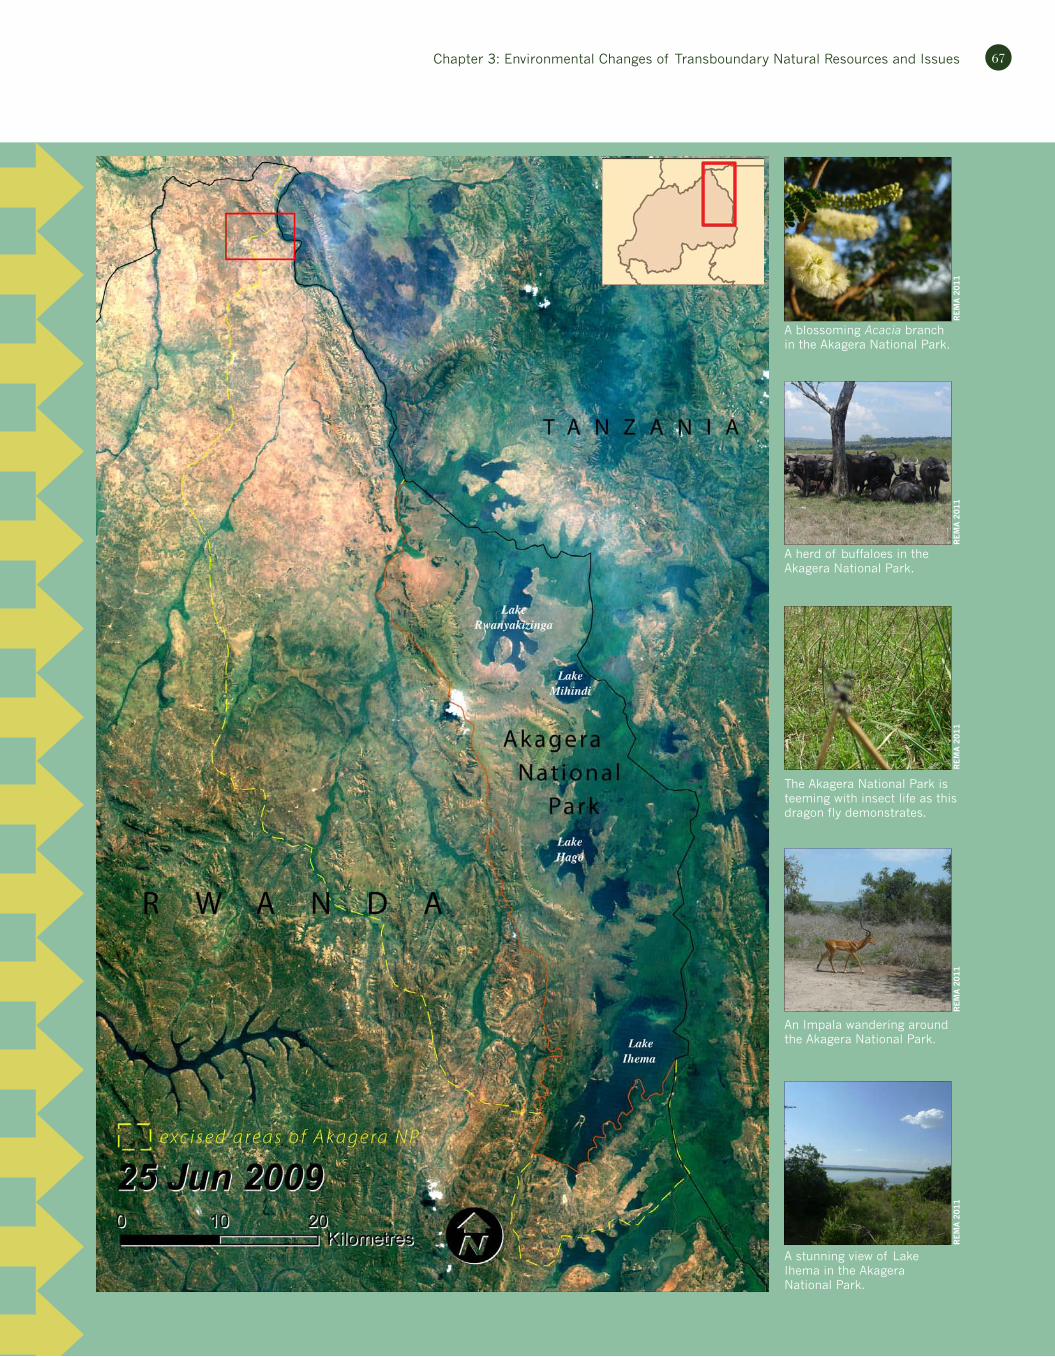
Chapter 3: Environmental Changes of Transboundary Natural Resources and Issues 67
A blossoming Acacia branch in the Akagera National Park.
A herd of buffaloes in the Akagera National Park.
The Akagera National Park is teeming with insect life as this dragon fly demonstrates.
An Impala wandering around the Akagera National Park.
A stunning view of Lake Ihema in the Akagera National Park.
RE
MA
2011
RE
MA
2011
RE
MA
2011
RE
MA
2011
RE
MA
2011

Chapter 3: Environmental Changes of Transboundary Natural Resources and Issues68
Nyungwe-Kibira Forest EcosystemLocation and Conservation Status
Nyungwe National Park which is located in the southwest of the country covers an area of more than 1 030 km², 980 km2 of which consists of tropical montane forest. Nyungwe National Park is contiguous with the Kibira National Park in Burundi (UNEP 2008). Together, these two protected areas form the largest block of forest in Eastern Africa. Nyungwe Forest lies at an altitude of 1 500 m-2 300 m. Even though 20 per cent of the forest’s cover has been lost since 1990 due to human pressure, the protected area remains the most significant natural forest in Rwanda (ORTPN 2004).
Flora and Fauna
Nyungwe National Park’s rich biodiversity includes 75 mammals, 275 bird species, 125 butterfly species, over 260 species of trees and climbers and more than 148 orchid species. The park also includes the small Cyamudongo Forest 10 km to the southwest of Nyungwe. Cyamudongo is a habitat for 13 species of primates such as the chimpanzee, black and white Colobus monkey. These complement the mountain gorilla (in Volcanoes National Park) which is the main tourist attraction and make the Nyungwe National Park an important component of the Rwanda primate tour.
The park has recently added the canopy walk to its tourism product portfolio. This offers a range of opportunities such as bird watching and primates viewing at close range. This has the potential to attract and keep foreign tourists for longer, significantly boosting tourism earnings.
Nyungwe National Park’s diverse floral species include the giant forest fern.
RE
MA
2011
A tea plantation in the buffer zone of Nyungwe National Park.
The Canopy Walk is a major tourist attraction in Nyungwe National Park.
A L'Hoest monkey mother and baby in Nyungwe National Park.
The visitors’ registration centre in Nyungwe National Park.
Mer
cedes
Sti
ckle
r 2011
RE
MA
2011
Mer
cedes
Sti
ckle
r 2011
RE
MA
2011

Chapter 3: Environmental Changes of Transboundary Natural Resources and Issues 69
Climate change has already resulted in more and longer droughts in Nyungwe National Park, resulting in more frequent and longer droughts. As a result, bushfires occur more frequently, threatening the park’s primates, including chimpanzees, mangabeys and black and white colobus monkeys. In addition, the loss of forest cover released previously sequestered carbon dioxide resulting in a negative contribution to climate change (Crawford 2012).Raising community awareness of the park’s role, increasing the level of collaboration among stakeholders and actively involving local communities in park’s management would help to reduce the prevalent resource access conflicts (Crawford 2012). This would in turn help to strengthen its climate change resilience as they would address the problems of human-induced biodiversity reduction and habitat destruction.
Landsat satellite image of 2010 showing the Nyungwe Forest National Park in Rwanda contiguous with the Kibira Forest National Park in Burundi. The two national parks together cover an area of over 1 000 km2 and are described in UNEP's Africa Atlas of 2008 as the largest block of forest in East Africa. The forest a tropical montane type, lying between the altitudes of 1 500 and 2 300 m. The forest is home to hundreds of species of birds, butterflies, orchids as well as dozens of mammal species including endangered primates.

Chapter 3: Environmental Changes of Transboundary Natural Resources and Issues70
Transboundary Movement of PeopleEvents leading to the 1994 genocide against the Tutsi and widespread murder of moderate Hutu date back to 1959 when similar anti-Tutsi violence led to the emigration of people into neighbouring countries as refugees. It is estimated that over 2.5 million refugees fled Rwanda for neighbouring countries particularly the DRC in the wake of the 1994 mass atrocities. Many of these Rwandans were forced out by the fleeing army of the government of the day that was on the rampage (Havugimana 2009). On fleeing to the DRC, remnants of the army and Interahamwe militia terrorized the Congolese Tutsi who themselves fled into Rwanda (Plumptre 2001). These largely settled in the Gicumbi and Rubavu Districts.
Top: The densely settled Kiziba refugee camp in the Karongi District of Rwanda hosting 19 000 persons. The dense settlement is associated with severe erosion due to the lack of storm water management infrastructure as well as other environmental degradation and health problems. Bottom: The Landsat satellite image change-pair shows the Kiziba refugee camp before and after it had been established. The camp, hosting 19 000 persons is seen as a large bare scar on the 2011 image compared to the green undisturbed site in 1986.

Chapter 3: Environmental Changes of Transboundary Natural Resources and Issues 71
The transboundary movement of people and their subsequent resettlement occasions a range of environmental pressures especially in already overpopulated areas. This is compounded in situations where these cross border movements and settlements are unplanned.
Climate change is likely to increase the transboundary movement of people fleeing from associated environmental catastrophes. Unless well planned, the pressure on refugee camps and surrounding environmental degradation is likely to increase. The Gihembe refugee camp in Gicumbi District, Northern Province as shown in the orthophoto is a very dense settlement hosting 20 000 people on 44 hectares that generates large volumes of high speed and uncontrolled storm water. This has caused gully erosion that has led to land slumps and landslides which keep on growing in size. Similar environmental degradation conditions exist in the Kiziba refugee camp where 19 000 people are settled on 27 hectares of land.
Landsat satellite image change-pair and a high resolution aerial photo insert showing the Gihembe refugee camp in the Gicumbi District of Rwanda. The change-pair shows before the camp was established in the 1984 image and after establishment in the 2011 image as a large bare area. Like the Kiziba camp, Gihembe also suffers environmental degradation, health and other problems with erosion representing the greatest challenge.
Dangerous landslides followed by erosion caused by uncontrolled storm water from the Gihembe refugee camp visible in a distance above.
RE
MA
2011

Chapter 3: Environmental Changes of Transboundary Natural Resources and Issues72
Image change pair depicting the Nyabiheke area in 2002 (IKONOS satellite data on the top) before the refugee camp for 15 000 Congolese was established. The 2009 orthorectified image (Rwanda Natural Resources Authority 2009) shows how the settlement was installed without cutting down the existing woodlots, thereby retaining the ecological integrity of the site.

Chapter 3: Environmental Changes of Transboundary Natural Resources and Issues 73
RE
MA
2011
However, the Nyabiheke refugee camp in Gatsibo District, Eastern Province provides a pleasantly contrasting picture. The Nyabiheke refugee camp provides many important lessons in preventing the negative effects of the transboundary movement of people. The 2002 IKONOS satellite image shows large tracts of vacant land in Gatsibo District in February 2002. A 2009 orthorectified aerial photograph depicts the well laid out Nyabiheke refugee camp. Crucially, the settlement structures seen in the 2009 image were built without cutting down the existing woodlots. As such, Nyabiheke refugee camp which hosts 15 000 inhabitants is well organized and laid out to minimize environmental impacts. This was deliberately done to avert the environmental pressures exerted following the establishment of the Gihembe camp in 1997 as already discussed.
The substantial transboundary movement of people into and out of Rwanda as detailed above should be seen in light of the fact that Rwanda doesn’t have a railway line. Cross border movement is therefore likely to increase when the planned 450 km railway line between Isaka in Tanzania, Kigali and Musongati in Burundi (ADF 2009) is completed. Although the longer portion of this will traverse Tanzania, 38.9 per cent of this will snake around Rwandan territory. Figure 3.3 shows the route of the proposed railway.
The rising transboundary movement of people could compound the transmission and severity of human and livestock diseases. This is because geographic shifts in human and vector borne diseases could result from the growing cross border movement of people and with them, the transboundary movement of livestock and pets. Strengthening screening and quarantine processes and systems would help to boost Rwanda’s climate change resilience.
Figure 3.3: Proposed transnational railway line from Dar es Salaam, Tanzania to Kigali, Rwanda and Musongati, Burundi
Source: Adapted from the various sources of the Republic of Rwanda
A mobile goods x-ray inspection truck at the Rusumo Rwanda-Tanzania border in Kirehe District.

Chapter 3: Environmental Changes of Transboundary Natural Resources and Issues74
ConclusionRwanda’s most important watercourses and protected areas are transboundary in nature. Yet the resources and biodiversity species hosted in these shared natural resources are not restricted to political boundaries, reinforcing the need for an ecosystem-wide management approach. Conventionally, transboundary natural resource management (TBNRM) initiatives are preoccupied with ensuring sustainable utilization and conflict reduction at the state-to-state levels. However, it is ordinary citizens who interact with these resources on a routine basis. Therefore, identifying the individual stakeholders who could be a source of the transboundary environmental problems and co-opting them in a collaborative mechanism for natural resources that mutually benefits these individuals (Ravnborg and Westermann 2002) and the multiple state agencies might well be the best way to ensure integrity of these resources from the ground up. High rates of transboundary movement of people have also taken their toll on Rwanda’s resources. As the Gicumbi refugee camp attests, settling displaced persons in planned settlements can help to avert environmental degradation that in turn increases the magnitude of the havoc caused by climate change. The effect would be to strengthen the climate resilience of Rwanda’s transboundary natural resources.
The Rwanda – Tanzania Rusumo border post is the main gateway to Tanzania. RE
MA
2011
Chapter 3: Environmental Changes of Transboundary Natural Resources and Issues 75
ReferencesAgaba, P., Asiimwe, T., Moorhouse, T. G. and McNabb, T. J. (Undated).
Biological Control of Water Hyacinth in the Kagera River Headwaters of Rwanda: A Review Through 2001. Accessed at http://www.cleanlake.com/images/rwanda_bio_paper.pdf
Albright, T.P., Moorhouse, T.G., and Mcnabb, T.J. (2004).The Rise and Fall of Water Hyacinth in Lake Victoria and the Kagera River Basin, 1989-2001. J. Aquat. Plant Manage. 42: 73-84. http://www.cleanlake.com/images/Water_Hyacinth_Lake_Victoria_JAPM_42_2004.pdf
Bates, B.C., Z.W. Kundzewicz, S. Wu and J.P. Palutikof, Eds. (2008).Climate Change and Water. Technical Paper of the Intergovernmental Panel on Climate Change, IPCC Secretariat, Geneva.
Bhattacharya. A. and Kumar, P. (2010).Water hyacinth as a potential biofuel crop. EJEAFChe, 9 (1). [112-122]. Accessed at http://ejeafche.uvigo.es/index.php?option=com_docman&task=doc_view&gid=584
Bloesch, U., Troupin, G. and Derungs, N. (2009). Les Plantes Ligneuses du Rwanda: Flore, Écologie et Usages. Shaker Verlag GmbH.
Boko, M., Niang, I., Nyong, V., Vogel, C., Githeko, A., Medany, M., Osman-Elasha, B., Tabo, R. and Yanda, P. (2007). Africa. Climate Change 2007: Impacts, Adaptation and Vulnerability. Contribution of Working Group II to the Fourth Assessment Report of the Intergovernmental Panel on Climate Change, Parry, M.L., Canziani, O.F., Palutikof, J.P., van der Linden, P.J. and Hanson, C.E. (Eds.), Cambridge University Press, Cambridge UK, 433-467.
Bownes, A. (2008). Evaluation of a Plant-Herbivore System in Determining Potential Efficacy of a Candidate Biological Control Agent, Cornops Aquaticum for Water Hyacinth, Eichhornia Crassipes. A Thesis Submitted in Fulfilment of the Requirements for the Degree of Doctor of Philosophy of Rhodes University.
CBD (2007).Biodiversity and climate change. Convention on Biological Diversity.http://www.cbd.int/doc/bioday/2007/ibd-2007-booklet-01-en.pdf (Accessed on February 14, 2012).
Conway, D. (2004). From headwater tributaries to international river: Observing and adapting to climate variability and change in the Nile basin. Global Environmental Change 15 (2005) 99–114. http://www.colorado.edu/geography/class_homepages/geog_4501_s11/readings/Climate%20Change%20and%20Africa/Conway.pdf (Accessed on February 12, 2012).
Crawford, A. (2012). Conflict-Sensitive Conservation in Nyungwe National Park: Conflict analysis. The International Institute for Sustainable Development Report, January 2012. http://www.iisd.org/pdf/2012/csc_nyungwe_conflict_analysis.pdf
Gashamura F.R. (2009). Effects of manure from water hyacinth on soil fertility and maize performance under controlled conditions in Rwanda. International Masters Programme at the Swedish Biodiversity Centre. Master’s Thesis No. 56, Uppsala.
GISP (2004).Africa Invaded: The growing danger of invasive alien species. The Global Invasive Species Programme.
Hassan, T., Attia, F., and El-attfy, H. (2004). Groundwater potentiality map of the Nile Basin Countries – a step towards integrated water management. International Conference and Exhibition on Groundwater in Ethiopia: Providing Water for Millions May 25 -27, 2004. Addis Ababa.
Hategekimana, S. and Twarabamenye, E. (2007).The impact of wetlands degradation on water resources management in Rwanda: the case of Rugezi Marsh. Proceedings of the 5th International Symposium on Hydrology; Cairo, Egypt. Accessed at http://www.irst.ac.rw/IMG/pdf/Paper_for_V_International_Symposium_on_En_Hydrology1.pdf.
Kelly, M. J. (1996). Overcoming obstacles to the effective implementation of international environmental agreements. Geo. Int’l Envtl. L. Rev., 1996. pp. 447-487.
Marlin, D. (2010).The role of the mite Orthogalumnaterebrantis in the biological control programme for water hyacinth, Eichhorniacrassipes, in South Africa. A thesis submitted in fulfilment of the requirements for the degree of Doctor of Philosophy of Rhodes University.
Mbabazi, S. S. (2010). Wetlands Management and Conservation in Rwanda. Case Study: Gikondo Wetland. A research report submitted to the School of Geography, Archaeology and Environmental Studies, University of the Witwatersrand, Johannesburg, in partial fulfilment of the requirements for the degree in Masters of Science by coursework in Environmental Studies.
McClure W. R. and Bartuska, T. J. (Eds.) (2007). The built environment: a collaborative inquiry into design and planning. 2nd Ed. Wiley and Sons, New Jersey and Canada.
Millennium Ecosystem Assessment (2005).Ecosystems and Human Well-being: Biodiversity Synthesis. World Resources Institute, Washington, DC. http://www.maweb.org/documents/document.354.aspx.pdf (Accessed on February 17, 2012).
MINALOC (2004). Mission d’étude de conservation et de gestion intégrée du Marais de Rugezi. Rapport provisoire. Helpage, Rwanda, Kigali.
Mitra, S., Wassmann, R. and Vlek, P. (2005).An appraisal of global wetland area and its organic carbon stock. Current Science Vol. 88(1).
Moorhouse, T. G., P. Agaba and T. McNabb (2001). Recent efforts in biological control of water hyacinth in the Kagera River headwaters of Rwanda, p. 152. In: M. H. Julien, M. P. Hill, T. D. Center and J. Ding (eds.). Biological and Integrated Control of Water Hyacinth, Eichhorniacrassipes. Proceedings of the Second Meeting of the Global Working Group for the Biological and Integrated Control of Water Hyacinth, Beijing, China, 9-12 October 2002. ACIAR Proc. No. 102.
NBI (2011). Water Resource Management.http://www.nilebasin.org/newsite/index.php?option=com_content&view=article&id=76&Itemid=96&lang=en (Accessed on February 12, 2012).
Odada, E. O., and Olago, D. O. (2006). Challenges of an ecosystem approach to water monitoring and management of the African Great Lakes. Aquatic Ecosystem Health and Management 9(4):433-446.
Ravnborg, H. M and Westermann, O. (2002). Understanding interdependencies: stakeholder identification and negotiation for collective natural resource management. Agricultural Systems 73 (2002) 41–56. ftp://ftp.puce.edu.ec/Facultades/CienciasHumanas/Ecoturismo/ArticulosTurismo/Art%C3%ADculos%20cient%C3%ADficos/Turismo%20comunitario/Ravnborg_understandinginterdependencies_2002.pdf (Accessed on February 17, 2012).
REMA (2009). Rwanda state of environment and outlook. Kigali, Rwanda.
RoR (2009). National Adaptation Programmes of Action to Climate Change (NAPA Rwanda). Ministry of Lands, Environment, Forestry, Water and Mines, December 2006.
RoR (2011). Cities and the Built Environment Sector Working Paper: Appendix B. Smith School of Enterprise and the Environment. University of Oxford. June 2011.
RoR (2011). Green Growth and Climate Resilience: National Strategy for Climate Change and Low Carbon Development. Kigali, Rwanda. http://www.smithschool.ox.ac.uk/wp-content/uploads/2011/03/Rwanda-Green-Growth-Strategy-FINAL.pdf (Accessed on January 5, 2012).
Rwanda Focus (2010). India-trained women light up Bugesera with solar energy. Rwanda Focus. Wednesday, August 4th, 2010. Accessed athttp://focus.rw/wp/2010/08/india-trained-women-light-up-bugesera-with-solar-energy/
UN (2011). World Population Prospects: The 2010 Revision. Population Division of the Department of Economic and Social Affairs of the United Nations Secretariat.
Williams, A. E., Duthie, H. C. and Hecky, R. E. (2005). Water hyacinth in Lake Victoria: Why did it vanish so quickly and will it return? Aquatic Botany 81:300-314

76
A snapshot of the sub-alpine environment near the summit of Rwanda's highest peak, Karisimbi volcanic mountain.

Scenario Analysis and Environmental Governance
Introduction
The Rwanda SOE report (RoR/REMA 2009), in taking an outlook approach to environmental policy analysis deliberately presented plausible scenarios for the future of the country’s environment. This was predicated on the realization that effective environmental stewardship in an increasingly uncertain world paradoxically requires an appreciation of the likelihood of future uncertainty. The changes in Rwanda’s environment presented in the preceding chapters of this Atlas are prone to the multiple and interacting influences of some key drivers which often obscure a
4R
EM
A 2
011
77

Chapter 4: Scenario Analysis and Environmental Governance78
clear road to a sustainable future environment like that envisioned in Vision 2020 (RoR/MINECONFIN 2000). The snapshot assessment presented in this Atlas through text narratives, satellite images, maps and photographs will certainly change in ways that may not be fully understood currently. Nevertheless, we need to explore these admittedly indeterminate trajectories of the future by taking stock of lessons from plausible future images of the environment in order to better couch policies that will address or prevent environmental degradation. As recognized in RoR/REMA (2009), these alternative images will be determined by major policy shifts and socio-economic developments as well as climate change.
Extending the exercise of scenario building to atlas production would help to illustrate a national outlook of how possibly short-term and long-term environmental shifts based on alternative policy pathways and actions could facilitate realization of Vision 2020 aspirations, achievement of the MDG environmental targets, the EDPRS and explore other environmental changes beyond 2020. A fuller picture of the plausible changes and lessons were captured in the 2009 SOE report as already stated. The four scenarios explored in that report and downscaled from the Africa Environment Outlook (AEO) report (UNEP 2006) are Market Forces; Policy Reform; Fortress World; and Great Transitions.
The Market Forces Scenario represents a world where the environmental dimension is hardly perceivable because exploitation of environmental goods and services is dictated by profit objectives and market forces. In the Policy Reform Scenario, the government and institutions regulate environmental management through reactive (rather than proactive) policies aimed at merely addressing the impacts of market forces on environment. In the Fortress World Scenario, a few select elite benefit from environmental goods and services at the expense of the vulnerable cohort of the population or comparatively marginalized regions. The Great Transitions Scenario is characterized by a complete policy paradigm shift leading to sustainable development and social equity. These scenarios have been replicated in this chapter in order to offer a basis for various pathway illustrations.
Demographic Changes and EnvironmentWith an annual growth rate of 2.9 per cent, Rwanda’s population is expected to rapidly grow from 10.6 million in 2010 to over 14 million by 2020. This will exacerbate pressure on the country’s environment and natural resources with marked changes in forestry, land and water resources. This will undoubtedly affect all sectors of the economy particularly agriculture, manufacturing and infrastructure with particular impacts on sanitation and energy demand. The implications of these changes on human wellbeing including health as well as food, energy and income security will vary in each of the scenarios depending on the magnitude and interaction between the drivers.
The country’s population is anticipated to steadily increase at different rates in all scenarios with different impacts on the environment and other socio-economic development dimensions. However, it is only under the Policy Reform and Great Transitions Scenarios that the country may address and even contain environmental challenges despite the anticipated population growth. Other aspects of demography that will continue to drive environmental change include population distribution, total fertility rate, migration patterns within and across borders and population structure. Adverse changes to the environment are more likely to be witnessed under the Fortress World and Market Forces Scenarios with the growing population having to rely on an increasingly constrained resource base. In Kigali, under the Great Transitions Scenario for instance, proper planning will see organized and energy-efficient transport, infrastructure design and settlement that can accommodate the anticipated population upsurge and climatic changes.
Realizing Vision 2020: The Challenge and Lessons from Future ScenariosRwanda is currently on track to realizing the majority of its 2020 Vision and selected targets of the MDGs. Under the different scenarios however, there are critical challenges and important lessons that this Atlas recommends for policy consideration. In case the country moves towards the Great Transitions Scenario, positive social transformation and sustainable environmental management are tenable, with associated economic benefits which are in turn likely to accelerate poverty alleviation. Improved livelihoods signified by a reduced environmental health burden, decreased mortality, improved life expectancy and expansion of sustainably managed ecosystems and built environments will be witnessed.
In this scenario, Vision 2020’s aspiration to transform Rwanda into a middle-income country is realized ahead of time. This would be possible if the country sustains an annual economic growth rate above 10 per cent as from 2012 through the support of reinforcing polices that promote environmental sustainability particularly in the productive sectors of the economy. Rwanda will get to this level if the effort to mainstream the six main pillars of Vision 2020 into government policies, programmes and actions is fast tracked. These six pillars of Vision 2020 are good governance and a capable state; human resource development and a knowledge based economy; emphasis on a private sector-led economy; infrastructural development; productive and market oriented agriculture; and regional and international economic integration.
Unlike the other scenarios, the Great Transitions Scenario would witness infrastructural rehabilitation and development further ensuring fast, efficient, clean and environmentally sound development. Improved laws would be enacted providing security of tenure and freedom of exchange while harmonized policy on grouped settlements (Imidugudu) will ensure sustainable land use and improved livelihoods options. Other aspects that need to be streamlined include urban development with regulated settlements and land consolidation. With appropriate planning, more than 40 per cent of the population would be connected to electricity by 2020 significantly up from 2 per cent in 2000 and 7 per cent currently (Rutagarama and Uhorakeye 2010). A vast majority of the population (nearly 100 per cent) would have access to potable

Chapter 4: Scenario Analysis and Environmental Governance 79
water. In this scenario, the country would apply appropriate land and water management techniques, coupled with a sound biodiversity policy. The realization of the Vision 2020 dream will be possible in this scenario because the government will have deliberately decided to implement the flagship programmes through its 5-year MDG-based Economic Development and Poverty Reduction Strategy (EDPRS) which will in addition be restructured to integrate all major sectors of the economy (RoR/MINECOFIN 2007). In other scenarios, the challenges would be formidable but certainly surmountable, with lessons from the foregoing narrative.
A refreshing photo of a clean water stream in the southern part of the prestine Nyungwe Forest National Park flowing to contribute to the Nyabarongo, Akagera and eventually into the great Nile river. The scene represents a snapshot of plausibility for medium to longterm outcomes achievable under the Great Transitions Scenario policy approach that should bring about environmentally sound development based on among other key drivers, Payment of Ecosystem Services. G
ael
Vand
e W
eghe
2011

Chapter 4: Scenario Analysis and Environmental Governance80
Future Changes in Selected Environmental IssuesClimate Change
As reported in the 2009 SOE Report (RoR/REMA 2009), climate change impacts will vary according to scenario. If case the country moves towards the Market Forces Scenario, there would be a rapid growth in energy use and the debate over the reality and gravity of climate change leads to a rapid rise in CO2 concentrations. There will also be more intense rainfall days and flooding. This would precipitate the increases in natural disasters and diseases associated with extreme weather events. Under the Policy Reform Scenario, greenhouse gas (GHG) emissions will continue to rise but will have partially abated owing to lower economic growth and enforcing restrictions on the engine capacity and age of vehicles imported into the Rwanda by 2015. The reduced demand for wood products would lead to public interest in reforestation in anticipation of eventual recovery of demand following an economic upturn. In case Rwanda degenerates into the Fortress World Scenario, we would witness the emergence of new diseases and a resurgence of diseases as their vectors advance into hitherto uncharted territory. Higher altitude ecosystems will begin to be impacted by climate change with an attendant decline in productivity and deteriorating human wellbeing. The Great Transitions Scenario will also see increased climate change-related events but government adaptation efforts will reduce their impacts. Specifically, the shift toward higher energy efficiency, fuel cells and renewable energy will reduce CO2 emissions as Rwanda joins other developing and developed nations in implementing multi-faceted efforts to address climate change. The integration of low carbon production with cost-effective adaptation mechanisms will be the cornerstone of this scenario.
A study by SEI (2009) found that existing climate variability has significant economic costs in Rwanda. This is already borne out through frequent extreme weather events such as floods and droughts that cause major socio-economic impacts and reduce economic growth. These economic costs are likely to rise as climate change becomes progressively severer. In almost all scenarios, the impacts of climate change could threaten to reverse past development gains and constrain future economic progress beyond any known tipping points.
Some regions and populations in Rwanda already have very high vulnerability and this will worsen under the Market Forces and Fortress World Scenarios. Under both scenarios, the future economic costs of climate change are likely to remain highly uncertain with the additional net economic costs (on top of existing climate variability) reaching an aggregate loss of almost 1 per cent of GDP each year by 2030 in Rwanda. In all scenarios except the Great Transitions, it is estimated that the costs of adaptation will rise in future years. In the medium term, this could range from US$ 50 million to US$ 300 million per year for the country by 2030 and would largely reflect the cost of enhancing climate resilience. Under the Fortress World, this figure may be even higher, rising to over US$ 600 million per year if the social protection and accelerated development measures required to address the negative impacts of climate change are not taken. The annualized costs of adaptation as projected by SEI (2009) are shown in Figure 4.1.
Enhancingresilience for
future investment
Immediatepriorities inc.
capacity building
SocialProtection
+
AcceleratedDevelopment
Adaptation toFuture Climate
Change
Adaptation toCurrent Climate(development)
and future resilience
$300 Mill.
$200 Mill.
$100 Mill.
$800 Mill.
$400 Mill.
$200 Mill.
~$300 M/yr
~$300 M/yr
~$280 M/yr
50 M/yr
2012 2030
Figure 4.1: Annualized costs of adaptation. Source: SEI 2009

Chapter 4: Scenario Analysis and Environmental Governance 81
Lessons from successes obtained under the Great Transitions Scenario vary by sector and perhaps by region. In the water sector for example, water resource investments will require activities focusing on climate resilient development and adaptation mainstreaming. In this scenario, the current National Adaptation Programme of Action (NAPA) and EDPRS would be adjusted to ensure integrated water resource management (IWRM), as well as annual public expenditures and Medium Term Expenditure Framework (MTEF) projections to promote resilient water systems. A great deal of effort will be required under all scenarios in the agricultural sector with urgent priorities in the provision of irrigation water and livestock production.
Under the Fortress World Scenario, failures to adapt and reduce the residual effects of climate change indicate lessons and future evidence for action on the following:
• Capacity building to strengthen the meteorological analysis and forecasting for seasonal outlooks and forecasting (agriculture) and extreme events (drought and flood risk), with the latter linked to the strengthening and development of early warning and disaster risk reduction, as well as risk mapping and basic screening in planning.
• Pilot actions across all sectors and for promising options (such as terracing and malaria prevention) and the potential scaling up of sectoral programmes.
• Strengthening health surveillance and prevention programmes which would themselves be complemented by enhanced meteorological and other monitoring systems.
In general, lessons from all scenarios indicate that adaptation has potentially huge benefits in reducing present and future climate change damages. The study by SEI (2009) recommended a range of priority actions for adaptation and these are contained in Table 4.1.
Table 4.1: Recommendations for addressing specific climate change adaptation challenges.
Source: SEI 2009
Adaptati on Strategies Priority Acti ons
Immediate needs & capacity building
Expanded research assessment into eff ects, adaptati on and economics. Early capacity building, e.g. meteorological data/systems and early warning systems
Develop nati onal climate change strategy including knowledge management and screening of sectoral and regional plans for climate risks and adaptati on opportuniti es. Include in EDPRS revision. Build into long-term vision (e.g. next Vision 2020)
Prepare plans for a nati onal adaptati on authority to improve sectoral coordinati on, link to internati onal fi nance, and support private sector. Enhance links between adaptati on and low carbon.
Climate resilience
Develop climate resilience strategies for immediate concerns (e.g. cross sectoral meteorological systems, informati on and forecasti ng, health and malaria monitoring and acti ons, fl ood risk screening)
Develop prototypes of sectoral acti ons pilots) and pathways for scaling up to cover all vulnerable regions and populati ons
Social protecti onProtect vulnerable livelihoods and strengthen existi ng social protecti on programmes, expanding the coverage to consider climate change.
Accelerated developmentAdapt existi ng development projects to include ‘no regret’ measures to reduce climate risks and opportuniti es to develop adapti ve capacity
Scale up successful prototypes to sectoral development plans
Several reports applying findings of the IPCC fourth assessment report (IPCC 2007) and downscaled models such as those by Shongwe and others (2009) have forecast increased intensity of extreme rainfall events in the wider Eastern Africa region which includes Rwanda. According to SEI (2009), precipitation could increase by more than 10 per cent by 2100, with similar percentage changes in the 10-year wettest seasons and events, implying that floods could become more intense. What will vary towards 2030 is the impact of such climate changes given assumptions of social resilience and policy responses in different scenarios. Flood events will have major effects on key infrastructure under Fortress World. Increase in climate change intensity would also be likely to increase the relative economic costs of periodic flood events particularly under both Fortress World and Market Forces scenarios.
The lessons from the future scenarios therefore point to a need to increase resilience to floods and landslides as a priority. While many of the models predict increases in rainfall on average as a result of climate change, droughts are also likely to continue, although it is unclear whether the intensity of these events will change. SEI (2009) recommended an array of adaptation measures to address sectoral challenges (see, for instance, Figure 8.3 for adaptations for water and flood risk to infrastructure).
A comprehensive plan, “Green Growth and Climate Resilience”: the National Strategy for Climate Change and Low Carbon Growth (CCLCD) strategy, (RoR 2011) will help to climate proof Vision 2020 and other national development programmes for the foreseeable future projected to 2050. The significant feature of the strategy lies in its multi-sectoral nature as it will embed climate change considerations in all development programming and implementation. Furthermore, there is a deliberate focus on a low carbon economic growth path with remarkable dividends for a climate resilient economy. Accelerating adoption of the CCLCD strategy could portend policy and implementation shifts in favour of the Great Transition and Policy Reform scenarios and will likely fast-track the achievement of the MDG and Vision 2020 targets.

Chapter 4: Scenario Analysis and Environmental Governance82
As is evident from the preceding paragraph, in the aftermath of the SOE 2009, Rwanda has made remarkable progress in formulating a climate change strategy fashioned as the National Strategy for Climate Change and Low Carbon Growth Development (CCLCD). The particular areas of focus in developing the strategy have been the multi-sectoral involvement and the financing framework in the form of an environment and climate change fund (FONERWA). This fund is national in character and has the potential to leverage resources from diverse sources for effective environment and climate change management. The broad partnership around climate proofing the Rwandan economy is increasingly informing high level national development policy. As such, the next generation of EDPRS will deliberately be made climate resilient so as to inform the revision of Vision 2020 towards national sustainable development. If Rwanda continues on the current development trajectory that takes into account emerging issues such as climate change and green economy that reduce reliance on fossil fuels, it will be in a position to address even the seemingly intractable problems of population and poverty. This development path is more in line with the Great Transitions Scenario.
Development pathways in the Great Transitions Scenario would see the programmatic areas and enabling pillars proposed under the CCLCD strategy realized. These include geothermal power generation, reduced dependency on inorganic fertilizers and high density walkable cities as mitigation measures. For adaptation, the measures include irrigation infrastructural development, robust road networks and integrated climate data management. These actions will be enabled through intensification of institutional, financial, capacity building, technological and infrastructural support.
Forests and Woodlands
Rwanda remains one of the few African countries maintaining a significant forest cover although this is already under enormous pressure from a burgeoning population, urban sprawl, agricultural expansion, changing land use and climate change. Under all scenarios, the threat remains significant but the future image of Rwanda’s forest cover differs due to temporal and spatial effects of conservation and forest protection measures. The current change in forest cover is largely due to growth in population density which doubled between 2002 and 2009. This will take the trends presented by Nyandwi and Mukashema (2011) for especially Gishwati Mountains. As we move towards 2020, immense pressure will be exerted on the country’s remaining natural ecosystems irrespective of whether these are forests, savannahs or wetlands. The rich biodiversity of the two main watersheds, the Congo and Nile basins will be under their greatest threat in the Market Forces Scenario due to wanton destruction for uncontrolled profits emanating from plumbing and agricultural activities.
Building institutional capacity Sectoral protection Migration
Relocation
Building regulations Flood protection infrastructure
Urban planning, drainage design
Improve inter-agency,regional coordination
Climate risk screening intoplanning and developments
Trend analysis
Early warningsystems
Terracing
Buffer zones
Seasonal outlooks
Risk maping
Emergency response plans
Integrated management and plans
Monitoring, vulnerability assessment
No regrets: variability and disaster reduction
No regrets: trends and climate outlooks
Pilot actions
Restoring ecosystems fornatural protection
Land-use planning and development controls(high risk areas)
Figure 4.2: Adaptations for water and flood risk to infrastructure. Source: SEI 2009

Chapter 4: Scenario Analysis and Environmental Governance 83
Other changes related to future forests and woodlands resources include land cover which is typified by a shrinking forest cover in a future characterized by limited land tenure regulation. Figure 4.4 illustrates the spatial distribution of future woody biomass consumption with the values indicating the estimated consumption of oven-dry woody biomass (as wood fuel, charcoal or construction material) in Kg per 0.25 ha pixel. The Ameliorated (AME) and Business As Usual (BAU) scenarios represent ‘ameliorated’ and business as usual attitudes similar to Fortress World and Market Forces Scenarios respectively. Future wood fuel demand and availability are displayed in Figure 4.5 and although the figure is based on projections and GIS based scenario analysis by FAO (2011), the assumptions are strikingly similar to the 2009 SOE scenarios. In addition, Figure 4.6 depicts the available woody biomass for two scenarios according to FAO (2011)—business as usual (BAU)—which is similar to the Market Forces Scenario of the 2009 SOE report—and Managed Demand (MAN)—which is similar to Policy Reform Scenario of the report.
Figure 4.3: Rwanda land cover map merging ISAR-NUR forest cover map and Africover map.
Figure 4.4: Spatial distribution of future woody biomass consumption.
Source: MINIRENA/CGIS-NVR 2007
Source: Adapted from FAO 2011

Chapter 4: Scenario Analysis and Environmental Governance84
As would happen under the Policy Reform and Great Transitions Scenarios, protected areas will provide the last remnants of the forest biomes that would dictate future forest cover for Rwanda. In these two scenarios, the total surface area of national parks and protected forests especially in the Albertine Rift is expanded.
Figure 4.5: Balance between sustainable woody biomass production and wood fuel demand with assumptions similar to the Rwanda Environment Outlook Scenarios.
Figure 4.6: Available woody biomass based on scenarios similar to Market Forces and Policy Reform Scenarios.
Source: Adapted from FAO 2011
Source: Adapted from FAO 2011

Chapter 4: Scenario Analysis and Environmental Governance 85
Land Use and Agricultural Productivity
The overwhelming majority of Rwandans rely primarily on land for their livelihoods. Agriculture and other land use activities interact with other drivers, including climate change and urbanization, in ways that will create varying changes in the landscape of Rwanda towards 2020. The sustainability of Rwanda’s agricultural sector remains pegged on intensive introduction to new technologies, such as fertilizer use and the selection of new and appropriate crop varieties and livestock species. Profitability and productivity will be highest in Great Transitions Scenario where the government policies are best poised to focus on value chains and transformation from subsistence agriculture to intensified, commercial agriculture. The Scenarios would witness various land use type changes depicted in Figure 4.7. The main drivers in all the scenarios presented are demographic changes, urbanization, climate change and agricultural expansion.
Agricultural land consolidation in an inland valley in Muhanga District, Southern Province - The strategy will bear fruit especially under the Policy Reforms Scenario where regulatory frameworks will forestall the effects of uncontrolled expansion and productivity decline due to population pressure and land subdivision.
2007 baseline
Arable land andpermanent crops
56.0%
Inland water6.3% Other land
0.3%
Forest area20.3%
Permanentmeadows and
pastures17.1%
Market forces
Arable land andpermanent crops
38.7%
Inland water6.0% Other land
4.4%
Forest area16.1%
Permanentmeadows and
pastures34.8%
Policy reform
Arable land andpermanent crops
54.2%
Inland water6.2% Other land
0.8%
Forest area12.4%
Permanentmeadows and
pastures26.4%
Fortress World
Arable land andpermanent crops
58.4%
Inland water6.2% Other land
4.5%
Forest area6.3%
Permanentmeadows and
pastures24.6%
Great transtitions
Arable land andpermanent crops
47.3%
Inland water7.4% Other land
1.2%
Forest area25.1%
Permanentmeadows and
pastures19.0%
Figure 4.7: Projected future distribution of land use types under the four scenarios compared with the 2007 baseline.
Source: Based on quantitative projections of the land use scenarios and related driver assumptions

Chapter 4: Scenario Analysis and Environmental Governance86
Water and Sanitation
In the Great Transitions Scenario, Rwanda continues with the water sector reforms that have set it apart from other sub-Saharan African countries. These include rapid spread of locally initiated public-private partnerships in rural areas which now cover over 45 per cent of rural water systems (RoR/ REMA 2009) and the continued use of a common basket approach by all donors in the rural sector, following a clearly established government strategy. Provision of potable water will improve even in remote villages through initiatives and innovations such as standpipes and roof catchment.
As elaborated in the SOE 2009 report, the Market Forces Scenario will witness rapid urbanization leading to rapid aquifer depletion and endangered freshwater ecosystems. The scenario will also experience escalating water resources development costs associated with water infrastructure and increased public health risks from access to contaminated drinking water and inadequate sanitation. Water is likely to be a major source of conflict and social division. If the country were to progress towards the Policy Reform Scenario, the picture would be characterized by slightly improved access to freshwater (as it is recognized as a basic human right) and waste management. Although corrective policies and water use regulations would be instituted, they would be inadequate to address the financial needs associated with maintenance and improvements to water and sanitation infrastructure. The Great Transitions Scenario would present a positive future for the country with lessons gathered out of water crises in both Rwanda and the neighbouring countries being used to institute extensive adoption of water efficiency technologies. Water remains the entry point to responding to climate change and to maintaining the prevailing paradigm shift in sustainable national development. Both domestic and international water conflicts will be considerably lessened with the Nile Basin Initiative fully realizing its goals.
Energy Resources
According to SEI (2009b), Rwanda’s energy and agriculture sectors are the largest emitters of GHGs (see Figure 4.8). However, owing to the high sequestration of CO2 by the country’s forests and agricultural plantations, Rwanda remains a net GHG sink. The study by SEI (2009b) estimated future electricity generation and emissions, using demand forecasts from Vision 2020. The estimates reflect the projections of future energy capacity for Rwanda especially under the Policy Reform Scenario. With planned projects like the Lake Kivu methane gas project, the Rukarara and Nyabarongo hydropower plants coming to fruition under the Great Transitions Scenario, the country will afford Rwandans higher rates of connectivity to electricity. The greater regional cooperation envisioned under the scenario implies that there will be greater access to the regional energy pool. The Lake Kivu project would bring into the national grid an estimated 200 MW (100 MW of which would be on stream by 2015). The electricity forecasts by SEI (2009b) are shown in Figure 4.9.
CO2 CH2N20
ENE_Petroleum
ENE_Wood
ENE_Charcoal
IndustryAGRICWASTE
1 400
1 200
1 000
800
600
400
200
0
Gg
CO2 e
q
Figure 4.8: GHG emissions by GHG (excluding LUCF). Source: SEI 2009
2005 2006 2007 2008 2009 2010 2011 2012 2013 2014 2015 2016 2017 2018 2019 2020
2 000
1 800
1 600
1 400
1 200
1 000
800
400
200
0
600
GW
h
New Imports (Hyd)
New Gas
New Hydro
New H FO
Ex. Solar
Ex. Imports (Hyd)
Ex. Hydro
Ex. Diesel (R)
Ex. Diesel
Forescast
Figure 4.9: Historic and projected estimates of electricity generation (GWh) in Rwanda, 2005-2020. Source: RoR 2009

Chapter 4: Scenario Analysis and Environmental Governance 87
Lessons from the scenario analysis for future energy resources base and demand show a need to address the following when dealing with energy planning:
• Cross-sectoral (forestry, energy, agriculture, industry and rural development) integration
• Adoption of resource efficiency and waste reduction technologies and approaches
• The prevailing heterogeneity of the country concerning biomass supply sources and water resources
• Consideration of the contribution of industrial residues to the national and local alternative energy reserves
• The contribution of hydro-power, solar, wind and alternative forms of energy that will substantially feature in the energy systems of the country in all scenarios
The energy options suggested by SEI (2009b) are classified into the following categories:
• Advanced technologies
• Demand side measures such as behavioural change
• Fuel switching for instance, from fossil fuels to biofuels
• Modal shift for example, private to public transport systems
• Vehicle efficiency improvement for example, older to newer vehicles
Additionally, the country may opt for more short-term technical solutions including the use of biofuels blended with conventional fossil fuels and increased efficiency vehicles and other wood fuel saving devices such as energy efficient stoves. The government’s support for peer-reviewed research into the potential of large-scale biofuel production would illuminate the possibilities and is certainly encouraged. In the short-term though, non-technical solutions are likely to yield considerable dividends and need to be urgently explored. These solutions include expanding and improving the public transport network and eliciting behavioural change through economic instruments and public awareness and education on energy conservation. In addition, exploration of Rwanda’s geothermal potential estimated to be as high as 700 MW should be speeded up as suggested by Rutagarama and Uhorakeye (2010).
ReferencesFAO (2011). WISDOM Rwanda - Spatial analysis of woodfuel production
and consumption in Rwanda applying the Woodfuel Integrated Supply/Demand Overview Mapping (WISDOM) methodology. Report prepared by Rudi Drigo and Vital Nzabanita. Study carried out in the framework of the FAO/Government of Rwanda Project ‘Rationalisation de la filière bois-énergie’ TCP/RWA/3103. FAO Forestry Department – Wood Energy. http://www.fao.org/docrep/013/ma223e/ma223e00.pdf (Accessed on February 12, 2012).
IPCC (2007). Climate change 2007. The physical science basis. Contribution of working group I to the fourth assessment report of the Intergovernmental Panel on Climate Change (IPCC). Cambridge University Press, Cambridge, UK.
Nyandwi, E. and Mukashema, A. (2011).Excessive deforestation of Gishwati Mountainous forest and biodiversity changes. ICT4D Article in Participatory Geographic Information Systems (P-GIS) for natural resource management and food security in Africa. http://www.leadinafrica.org/sigp1 (Accessed on 12 July 2011).
RoR/MINECOFIN (2007).Economic Development and Poverty Reduction Strategy (EDPRS) 2008-2012.Minister of Finance and Economic Planning (MINECOFIN), Republic of Rwanda (RoR), Kigali.
RoR/MINECOFIN (2000).Rwanda Vision 2020.Ministry of Finance and Economic Planning (MINECOFIN), Republic of Rwanda (RoR), Kigali.
RoR/MININFRA (2009).National Energy Policy and National Energy Strategy 2008-2012. Funded by the EUEI. Ministry of Infrastructure and Roads (MININFRA), Republic of Rwanda (RoR), Kigali.
RoR/REMA (2009).Rwanda State of Environment and Outlook: Our Environment for Economic Development. Rwanda Environment Management Authority (REMA), Republic of Rwanda (RoR)/United Nations Environment Programme (UNEP), Kigali.
Rutagarama, U. and Uhorakeye, T. (2010).Geothermal Development in Rwanda: An Alternative to the Energy Crisis. Proceedings World Geothermal Congress 2010. Bali, Indonesia, 25-29.
SEI (2009).The Economics of Climate Change in Rwanda. Stockholm Environment Institute (SEI), Oxford.
Shongwe, M. E., van Oldenborgh and van Aalst (2009). Projected changes in mean and extreme precipitation in Africa under global warming. Part II: East Africa. Nairobi, Kenya, 56 pp. Submitted to Journal of Climate.
UNEP (2006).Africa Environment Outlook 2: Our Wealth Our Future. United Nations Environment Programme (UNEP), Nairobi.

88
A motorcycle taxi in Kigali locally known as "Taxi-moto".

89
Conclusions and Recommendations
Introduction
This Atlas has built on the policy messages and options provided by the 2009 State of Environment (SOE) Report. The recommendations made by the 2009 report were based on thematic assessments and touched on environmental policies, legislation and institutional arrangements and environmental trends and scenarios. Significant progress has been made in implementing a number of policy recommendations over the last 2 years. In fact, the extensive scenarios analysis in this Atlas
5D
ylan
Wal
ters
/Fli
ckr

Chapter 5: Conclusions and Recommendations90
is testament of the drive to reorient the policy discussions to new and emerging environmental (such as climate change) and how these are rapidly influencing Rwanda’s sustainable development path.
The Atlas was structured to visually highlight the current environmental hotspots and success stories by narrowing down on sites for which compelling scientific evidence – mainly in the form of satellite image change pairs – was available. The recommendations hereunder are categorized by theme in order to ensure a logical flow and fit with the featured environmental hotspots which are also classified by theme.
Population Pressure and Shrinking Land BaseEnvironmental changes in the land arena illustrate Rwanda’s shrinking land base owing to high population pressure and the associated natural resources degradation resulting from stresses on ecosystems. Associated socio-economic challenges were illustrated in subsequent hotspot sites as well as policy relevant practical models that seek to address the identified challenges.
The successful models highlighted in the Atlas for integration of land use include improved land use management and land tenure regularization. The two principal land use approaches are increasingly informing land consolidation as well as crop optimization and intensification. Two main advantages flow from this: enhanced agricultural productivity and settlement reorganization towards the ‘Imidugudu.’ These approaches are also central to successfully implementing targeted pro-poor livelihoods improvement measures such as the ‘one cow per poor household programme.’ Under this programme, more than 125 000 exotic cattle have been distributed to poor Rwandans in order to lower poverty and malnutrition levels and reduce the pressure exerted on land by encouraging zero grazing. Equally, the success of the ‘bye-bye Nyakatsi’ initiative, which affords all nationals access to decent housing is dependent on integrated development approach with the central focus on livelihoods improvement and sustainable land use management.
The above measures are premised on the Vision 2020 Umurenge (VUP) programme which is one of the EDPRS flagship programmes that supports sustainable and inclusive economic growth. The overwhelming success of the home-grown, pro-poor, integrated development model that is based on indigenous knowledge and culture as well as local resources is currently being practised at pilot levels. It is increasingly reinforcing the policy shift from excessive reliance on external aid to a Rwandan-initiated development path. This proves that complementary, locally devised policy interventions can remedy daunting environmental and poverty challenges and present opportunities to achieve related development goals such as those pertaining to climate resilience.
The key land use recommendations include:
• Replicating successful pilot projects by entrenching the concept in all development planning, programming and implementation. In particular, there would be need to scale up the integrated environmental management and climate resilient approach to planning as well as the implementation of the Umudugudu programme.
• Enhancing relevant cross sectoral coordination. For instance, in order to maximize the benefits that emanate from integrated development planning, synchronization of the programmatic activities of the Ministry of Local Government (MINALOC) with those of the Ministry of Infrastructure (MININFRA) would be critical to the success of the resettlement schemes.
• Facilitating the Ministry of Agriculture (MINAGRI) to take advantage of the rising stature of integrated environmental management and of climate resilience to transform agricultural practices. Concerted efforts could, for example, be made to reorient rural farmers to cost effective production systems that rely on using manure instead of chemical fertilizers. Further, given that climate change is likely to lead to unpredictable rainfall patterns, farmers should be encouraged to switch from relying on rain fed agriculture to using harvested rainwater for drip irrigation. In addition, incorporating the Strategic Environmental Assessment (SEA) tool into the nascent strategy on agricultural transformation could help to consolidate the gains recorded in improving agricultural production and food security.
Urban Health with a Focus on Kigali CityUrban sprawl resulting from unplanned rapid expansion and the proliferation of slums, solid waste management and land use rezoning are some of the urbanization issues highlighted in the Atlas. Using Kigali City as a hotspot, the Atlas illustrates commendable measures taken to deal with these problems including the systematic promotion of planned, space optimized and serviced housing.
The CCLCD recommends the adoption of energy and water efficiency standards into building codes and establishment of an integrated multi-mode urban transport system. It also proposes low carbon urban planning. It also makes the case for harnessing the opportunities presented by urban waste by incorporating the latter into the City’s land use master plan. Whereas the Kigali Conceptual Master Plan is in place, its implementation requires significant funding that would entail external financing partnerships. Sensitizing the public on the importance of the city’s master plan to the sustainable cities model is also vital. In addition, there is need to expedite the relocation of industries from the Gikondo Valley Wetland in the heart of Kigali City to the new industrial park located in what is called the Special Economic Zone (SEZ) in the outskirts of Kigali, Masoro. This is because many of the industrial activities in Gikondo are incompatible with wetland conservation. In addition, Gikondo experiences frequent flooding that paralyzes business for several days at a time.
Chapter 5: Conclusions and Recommendations 91
ForestsThis Atlas has shown evidence of severe deforestation that has occurred in recent decades. The worst of these was illustrated in the Gishwati forest reserve and the Bugesera woodlands. However, the Atlas also demonstrates remarkable reforestation efforts that have stabilized the country’s natural and planted forest cover at 10 per cent of the national territory. These are primarily driven by government and its agencies such as Projet d'appui à la reforestation (PAREF), Rwanda’s reforestation and afforestation special purpose vehicle.
According to the Green Growth and Climate Resilience: National Strategy for Climate Change and Low Carbon Development (CCLCD), Rwanda has the lowest emissions per capita in the world. This, together with its forest based carbon sequestration levels, makes the country a net carbon sink. The sustainable forestry, agroforestry and biomass energy initiative will for example, ensure surplus wood fuel through afforestation, reforestation, agroforestry and urban tree planting. These will in turn attract funding from the Adaptation Fund and other environment and climate funds as well the Green Climate Fund when this is established. As part of the strategy, the country has formulated the National Fund for the Environment in Rwanda (FONERWA) to uptake the environment and climate funds from both domestic and external sources and plough back into cross sectoral priorities that are likely to achieve national sustainable development.
Rwanda's forest stocks are however still low compared with other countries with respect to competing for the Payment for Ecosystem services (PES) funds from REDD-plus initiative also aims to strengthen and enhance the role of forests as carbon pools. This can be achieved by supporting the conservation and sustainable management of forests. It is recommended that all stakeholders align respective sectoral programmes and actions to support the successful implementation of the CCLCD strategy. This would benefit the current policy relevant initiatives aimed at improving national forestry management.
WetlandsRwanda is endowed with abundant fresh water in its dense network of rivers, lakes and wetlands. The Atlas presents Rwanda as an important ‘water tower’ as it contributes more than two thirds of its territorial waters to the Nile basin through the Akagera-Nyabarongo river system. The remaining 33 per cent drains into the Congo basin. The revolutionary CCLCD advocates the establishment of the principle of Integrated Water Resource Management (IWRM). This primarily focuses on equitable access to and use of water resources and a better understanding of current and future demand and supply. It is envisaged that this will ensure better planning and the crafting of appropriate mitigative and adaptive responses to climate change.
In order to better ground the concept of resource efficient and cleaner production through all formal and informal processes, it is recommended that Rwanda adopts stringent water resources management principles. These would be based on precaution, prevention, polluter pays, user pays and charges predicated on the contributory capacity of the users. Further, incentives should be instituted to encourage households and commercial entities to both reduce the volume of water consumed and pollution of water resources.
The Atlas emphasises the need for a robust wetland management programme in order to safeguard their critical ecological functions. As already stated these include water purification, storage and recharge as well as providing a habitat for a range of bird, fish and amphibian species. Existing governance measures that prescribe mapping of wetlands as well as their categorization in order to guide use decisions obviously demonstrate political commitment to delicately balance economic benefits with environmental sustainability. While the Atlas presents some research findings on the vulnerability of the country’s wetlands to climate change, further research on demarcating wetland risk zones in accordance with the CCLCD is highly recommended. This is because these measures are likely to both raise the climate resilience of these important ecosystems and ensure that practical disaster management systems are in place.
MiningRwanda has a considerable mineral base. Even with its largely artisanal nature, the sector is the country’s second highest foreign exchange earner after tourism. However, as the images in the Atlas demonstrate, the mining sector is responsible for several environmental ills that include land and water degradation and pollution. Significant command and control efforts that include revision of the mining policy as well as legislative and institutional coordination are already underway and these need to be fast tracked. In line with the CCLCD, these efforts would help to reduce GHG emissions in two main ways. First, they would improve energy and water security by encouraging industry actors to adopt efficient production techniques. Second, they promote the use of less climate-dependent, renewable sources of energy such as geothermal and methane gas, both of which Rwanda is well-endowed with.
Available research has not reported human toxicity from mining pollution although soil toxicity has been reported. Nevertheless, REMA has already developed a number of broad research questions that will form the basis for environmental monitoring and evaluation of the mining industry. It is recommended that priority research be urgently conducted in order to develop and operationalize the attendant indicators. These, along with training in environmental imperatives and encouraging artisanal miners to form cooperatives, should help the industry to internalize sustainable mining practices.

Chapter 5: Conclusions and Recommendations92
Transboundary Natural Resources and IssuesThe Atlas highlights Rwanda’s contribution to shared water resources notably to the Nile and Congo basins. The Atlas also illustrates the contiguous nature of the Volcanoes National Park and Nyungwe National Park. Transboundary movement of people across Rwanda’s borders has historically been associated with involuntary displacement of people as a result of violent conflict. The lasting environmental impacts for Rwanda are the large, densely populated refugee camps that are associated with severe land and soil degradation. Efforts to ensure regional political stability should therefore be enhanced.
There is also need to boost regional collaboration through cross border monitoring of illegal activities such as poaching that deplete transboundary natural resources. Equally, Rwanda needs to actively participate in the implementation regional projects such as the Lake Victoria Environmental Management Project (LVEMP II) in order to improve livelihoods as well the conservation and sustainable use of shared resources.
Scenario Analysis and Environmental GovernanceDemographic changes, climate change, economic expansion, urban growth, technology and other drivers will continue to shape the future of Rwanda’s environment. With their multiple and interacting implications on the future of Rwanda’s natural resources, these future changes will certainly present challenges and opportunities of different magnitudes under the four scenarios. The lessons from these ‘environmental futures’ point to the need to consolidate current policy support for natural resource-based sustainable development programmes. Special emphasis should be on conservation, controlled urban growth, cross-sectoral integration of environmental sustainability principles and practices and resource efficiency. Waste management and adoption of appropriate technological and livelihood-based adaptation to climate change will also be important.
The outlook for both short-term and long-term environmental shifts demonstrate how alternative policy pathways and actions could facilitate realization of Vision 2020 aspirations and the MDGs. Only under the Great Transitions Scenario would the country realize considerable positive social transformation and sustainable environmental management coupled with the associated economic benefits. In order to consolidate current gains, policies should support realization of improved livelihoods manifested through a reduced environmental health burden, decreased mortality, improved life expectancy as well as expansion of sustainably managed ecosystems towards 2020 and beyond.
Rwanda should attain and sustain an annual GDP growth rate of 8 per cent and fast track the mainstreaming of the themes relating to Vision 2020’S six pillars. Environmental management and climate resilience should be mainstreamed across all policies and economic sectors. These policies and sectoral programmes should have the capacity to raise funding that benefits local livelihoods and Rwanda’s micro climate. This will in turn help to strengthen the economy’s climate change resilience, resulting in truly sustainable national development.


Rwandaʼs Changing EnvironmentAtlas of
Implications for Climate Change Resilience
This Atlas is a visual account of Rwanda’s state of natural resources revealed through maps, current and historical satellite images, aerial and ground photographs as well as narrative based on extensive scienti� c evidence. The Atlas serves as a re� ection on the progress made towards mitigating environmental degradation and climate change that were recognized as some of the main barriers to realizing medium term Millennium Development Goals and the development aspirations of the Rwanda Vision 2020.
These visual elements provide Rwandan decision makers and stakeholders in production sectors with compelling illustrations of how human activities have altered their surroundings resulting in adverse impacts on the environment. The information provided will not only be useful in the context of the selected locations, but will also underscore the intrinsic value of the harnessing, visualizing and communicating technologies to gain a deeper understanding of the dynamics and impacts of Rwanda’s environmental changes.
Atlas of Rw
andaʼs Changing Environm
ent Implications for C
limate C
hange Resilience