rx-to-otc switch: changes in physician and - cornell university
TRANSCRIPT

Rx-to-OTC Switch: Changes in Physician and Patient Behavior
A Dissertation
Presented to the Faculty of the Graduate School
of Cornell University
In Partial Fulfillment of the Requirements for the Degree of
Doctor of Philosophy
by
Sarah Hoda Neyaz
August 2007

© 2007 Sarah Hoda Neyaz

RX-TO-OTC SWITCH: CHANGES IN PHYSICIAN AND PATIENT BEHAVIOR
Sarah Hoda Neyaz, Ph. D.
Cornell University 2007
When Claritin (a popular allergy/antihistamine drug) and Prilosec (a popular
anti-ulcer/anti-acid drug) became available over the counter (OTC), a unique situation
was created in which a drug was now available OTC while close substitutes remained
prescription (Rx) only. The OTC/Rx status of a drug should not affect physician
recommendations for it or others in its class as no chemical change has occurred. The
theory developed here to model physician incentives suggests, however, that due to
several institutional features of insurance markets, such as reimbursement methods,
there may be differences in the incentives faced by physicians that lead to changes in
which medications are prescribed as drugs switch regulatory status. In this model,
capitated physicians are expected to use the lowest cost form of treatment since they
can be held financially responsible for their treatment decisions. The existence of an
OTC version of a drug is also hypothesized to alter patient behavior as well. The
availability of an OTC is expected to increase the likelihood that patients will self-
medicate and therefore should result in fewer visits to physicians with diagnoses
related to that condition. Self-treatment with OTC drugs is likely to be greater when
symptoms are not very severe. Consequently, it is also hypothesized that after the
OTC drug is available those who do see a physician will manifest more severe
symptoms. To test the theory empirically the National Ambulatory Medical Survey
for the years 1997-2004 is utilized. The analysis shows that when a drug in a class
becomes available in the OTC market, fewer patients visit physicians for the related
diagnoses and the severity of ailments of patients visiting physicians does seem to
change somewhat after the availability of OTC medication. There is some evidence
that physicians change their prescribing behavior, when a drug moves from
prescription to OTC. In both the allergy and acid reflux markets, capitated physicians
are found to utilize the least costly form of treatment. These physicians are found to
cost shift away from the insurance company, while FFS cost shift away from the
patient. Finally, both the allergy and acid reflux classes show some evidence of brand
loyalty for drugs amongst patients.

iii
BIOGRAPHICAL SKETCH
Sarah Hoda Neyaz was born and raised in the Corning, NY area. After
graduating from Horseheads High School in 1996, she began her undergraduate career
at the University of Rochester in Rochester, N.Y. In May, 2000 she completed a
Bachelors degree in Molecular Genetics. After graduation, she enrolled in the
Master’s in Health Administration program at Cornell University, in the Department
of Policy Analysis and Management and finished in May, 2002.
During the master’s program, Sarah worked as a teaching assistant for a class
in microeconomics. It was at this time she became interested in the research issues of
applied economics and decided to pursue her Ph.D. Sarah continued on in the same
department to do her doctorate work in the field of Policy Analysis and Management.
Her concentration was in Consumer Policy and she had minors in subjects of Health
Policy and Marketing. Sarah completed her Ph.D. in May, 2007.
The interdisciplinary program at Cornell University included training in Health
Policy, Consumer Policy, Family and Social Welfare, and Evaluation. Sarah’s studies
provided her with knowledge of theories in Microeconomics and Policy issues, and
she focused particularly on the health care industry. Her main areas of interest include
pharmaceutical economics, physician behavior, cost/benefit analysis, and
insurance/reimbursements.
In addition to course work and her own dissertation research, Sarah spent a
significant amount of time as teaching assistant. The courses she assisted with
included: microeconomics, health economics and policy, public policy and marketing,
statistics, corporate finance, as well as others.
In 2007, Sarah moved to Lansing, Michigan with her husband and joined the
Thomson Healthcare Group as a health economics researcher, studying issues related
to the management of healthcare costs and quality.

iv
This work is dedicated to my parents and to my husband, Danish.

v
ACKNOWLEDGMENTS
So many have been involved in the process of this dissertation. I would like to
thank each and every one of them for all their help, guidance, and support.
I would like to acknowledge all of my committee members for their insight.
Thank you, first, to my committee chair, Alan Mathios, who provided constructive
discussions, interesting ideas for research, and useful comments. Professor Mathios
was a model for what a mentor and teacher should be. Thank you to Kosali Simon, for
all of her help, which went over and beyond anything I could have ever expected.
Professor Simon, always found the time to guide me in any and every way she could,
no matter how busy her schedule was. Sharon Tennyson, as my advisor during the
Masters program, played an integral role in my decision to pursue the Ph.D. I wish to
thank Professor Tennyson for her valuable suggestions, not only with the dissertation,
but with all aspects of my graduate school career. Thank you to Vrinda Kadiyali for
sharing her important inputs from a marketing perspective. Professor Kadiyali always
had her door open and provided the most interesting and lively conversations.
All members of the Policy Analysis and Management faculty and staff have
provided assistance in some way. I would like to thank Professor Don Kenkel,
Professor Will White, and Professor John Cawley for their guidance. Thank you,
especially, to Professor Sean Nicholson who provided his expertise, as well access to
much needed data, and was always so helpful.
I am indebted to the wonderful PAM department staff. Thank you to Geysa
Smiljanic, who had been a guide and a great source of support for seven years. I
would not have gotten through the masters or the Ph.D. programs without her. Thank
you to Kenna Snow Tompkins who has been so instrumental in this dissertation
process and has always gone out of the way to help me. Thank you also to Justine
Lynge for her support and willingness to always assist me.

vi
Finally, this dissertation would not have been possible without my family.
Thank you to Mummy and Papa, Shama Neyaz and Neyaz Hussain, for your
understanding and patience with this long process. Thank you to Mommy and Daddy,
Rafea and Syed N. Hoda, for always being there for me and for your unconditional
support. Mommy, thank you for encouraging me to do the Ph.D. in the first place.
Daddy, thank you for all of your suggestions and for proof-reading this dissertation so
many times. Last, but not least, thank you to my husband, Danish, for your
encouragement, consideration, and for always believing in me.

vii vii
TABLE OF CONTENTS
BIOGRAPHICAL SKETCH iii
DEDICATION iv
ACKNOWLEDGMENTS v
LIST OF FIGURES xi
LIST OF TABLES xiv
CHAPTER ONE: INTRODUCTION 1
IMPORTANCE OF THIS STUDY 2
PURPOSE AND SCOPE OF RESEARCH 3
KEY ISSUES 3
PHYSICIAN INCENTIVES AND REIMBURSEMENT 4
CAPITATION
6 PATIENT CASE MIX 9
REGULATORY STATUS OF DRUGS AND POLICY IMPACT 11
SIGNIFICANCE OF PHARMACEUTICAL MARKET ANALYSIS 12
CHAPTER TWO: BACKGROUND 16
PLAYERS IN THE HEALTH CARE INDUSTRY 16
POLICY ANALYSIS AND THE PHARMACEUTICAL INDUSTRY 18
U.S. DRUG APPROVAL PROCESS 20
PRE-CLINICAL RESEARCH 21
CLINICAL TRIALS 22
NDA REVIEW 23
PRESCRIPTION AND OTC DRUGS 23
OTC APPROVAL 24
viii viii
PRESCRIPTION TO OTC RECLASSIFICATION 25
FINANCING DRUG DEVELOPMENT 26
OTC MARKET 29
KEY DRUG SWITCHES 32
AREAS OF DEBATE 34
CHAPTER THREE: PREVIOUS LITERATURE 36
PHYSICIAN INCENTIVES 36
PHYSICIAN PRESCRIBING BEHAVIOR 37
MANAGED CARE INCENTIVES 40
PRESCRIPTION TO OTC SWITCH 41
PATIENT SEVERITY 46
CHAPTER FOUR: THEORETICAL MODEL 50
PATIENTS 50
INSURANCE COMPANIES 51
PHYSICIANS 52
FEE FOR SERVICE PLANS 55
CAPITATED PLANS 58
HYPOTHESES 60
CHAPTER FIVE: EMPIRICAL MODEL 61
PHYSICIANS 61
PREDICTIONS OF PHYSICIAN BEHAVIOR 64
PATIENT SEVERITY 65
SEVERITY PREDICTIONS 66

ix ix
ADDITIONAL EMPIRICAL ANALYSIS 67
POTENTIAL LIMITATIONS 68
CHAPTER SIX: DATA 69
NATIONAL AMBULATORY MEDICAL CARE SURVEY (NAMCS) 69
ADVANTAGES OF USING NAMCS 70
DESCRIPTIVE STATISTICS 70
CHAPTER SEVEN: ALLERGY CLASS ANALYSIS 86
ALLERGY SHOTS 86
ANTIHISTAMINE MARKET 87
CLARITIN 88
ALLERGY/ANTIHISTAMINE NAMCS DATA 92
ANTIHISTAMINE RESULTS 103
SEVERITY RESULTS 113
ALLERGY MARKET DISCUSSION 120
CHAPTER EIGHT: ACID REFLUX CLASS ANALYSIS 122
ACID REFLUX MEDICATIONS 123
PRILOSEC 124
ACID REFLUX NAMCS DATA 127
ACID REFLUX RESULTS 138
SEVERITY RESULTS 148
ACID REFLUX MARKET DISCUSSION 155
CHAPTER NINE: CONCLUSIONS 157

x x
POLICY IMPLICATIONS 162
LIMITATIONS OF THIS STUDY 162
RECOMMENDATIONS FOR FUTURE WORK 164
APPENDIX 166
BIBLIOGRAPHY 194

xi xi
LIST OF FIGURES
Figure 1.1. Control Methods Used by HMOs to Influence Physician Prescribing
Behavior ...……………………………………………………...…….....5
Figure 1.2. Method of Physician Reimbursement by HMOs in 2001………………...7
Figure 1.3. Percent of Physicians with Capitated Contracts by Specialty 2001……...8
Figure 1.4. Percent of per Capita National Health Expenditures Attributable to
Prescription Drugs …………………………….………………………..13
Figure 1.5. Percent of Population with a Prescription Expense ……………………..14
Figure 1.6 Mean Out-Of-Pocket Expense for Population with Prescription
Expense……………………………………….………………...………15
Figure 2.1. OTC New Approvals, Rx-to-OTC Switches, and New Uses by Year ….27
Figure 2.2. OTC Retail Sales by Year ……………………………………………....30
Figure 2.3. OTC Sales by Category …………………………………………………31
Figure 6.1. Percent of Patients with Diagnosis Total Insured NAMCS Sample
1997 – 2004 ……...………………………………………………….....72
Figure 6.2. Type of Patient Visit – Total Insured NAMCS Sample 1997 – 2004 ….73
Figure 6.3. Percent of Patients Seeing a Specialist Physician by Diagnosis – Insured
NAMCS 1997 – 2004 …………………………...……………………..74
Figure 6.4. Average Number of Diagnostic Tests per Patient by Diagnosis – Insured
NAMCS 1997 - 2004……..………………………………………….....75
Figure 6.5 Average Time Spent (in minutes) with Physician by Diagnosis Group –
Insured NAMCS 1997 – 2004 ..………………………………………..76
Figure 6.6 Average Number of Tests per Patient by Diagnosis Group Specialist
Physicians – Insured NAMCS 1997 – 2004 .…………………………..77
Figure 6.7 Average Time Spent (in minutes) with a Specialist Physician by Diagnosis
-Group Insured NAMCS 1997 – 2004 ……..…………………………..78
xii xii
Figure 6.8. Percent of Patients Receiving a Prescription Medication – by Diagnosis
Group NAMCS 1997 – 2004 ……………………………………….…79
Figure 6.9. Percent of Patients Receiving an OTC Medication - by Diagnosis Group
NAMCS 1997 – 2004 ………………………..…………………….…..80
Figure 7.1. Percent of World Wide Sales per Year – Antihistamine Class …………90
Figure 7.2. Advertising Dollars Spent per Year by Drug – Antihistamine Class ...…91
Figure 7.3. Number of Prescriptions by Allergy Drug – Total Insured NAMCS
Sample ……………………………………………………………….....93
Figure 7.4. Number of Prescriptions by Allergy Drug – Allergy Sample .……….....94
Figure 7.5. Percent of Population Receiving an Allergy Shot –
NAMCS 1997 – 2004 …………………………………………....….....95
Figure 7.6. Percent of Patients Seeing an Allergy Specialist –
NAMCS 1997 – 2004 ……………………………………………….....96
Figure 7.7. Percent of Visits by Type of Patient – Allergy Sample
NAMCS 1997 – 2004 ……………………………………………….....97
Figure 7.8. Percent of Visits by Type of Patient Amongst Specialist Physicians–
Allergy Sample NAMCS 1997 – 2004 ……………………..……….....98
Figure 8.1. Percent of Worldwide Sales by Drug - Acid Reflux Class ………….....126
Figure 8.2. Advertising Dollars Spent per Year by Drug – Acid Reflux Class .…...127
Figure 8.3. Number of Prescriptions by Drug NAMCS 1997 – 2004 Total Insured
Sample ………………...………………………………………………129
Figure 8.4. Number of Prescriptions by Drug NAMCS 1997 – 2004 Acid Reflux
Sample ………………………………………………………………...130
Figure 8.5. Percent of Patients Seeing Gastrointestinal Specialist by Diagnosis Group
– NAMCS 1997 – 2004 ………………………...……………..……...131

xiii xiii
Figure 8.6. Percent of Visits by Patient Type – All Physicians – NAMCS 1997 – 2004
Acid Reflux Sample …………..………………………………………132
Figure 8.7. Percent of Visits by Patient Type – Gastrointestinal Specialists – NAMCS
1997 – 2004 Acid Reflux Sample …………………………………….133
xiv
LIST OF TABLES
Table 2.1. Annual Revenues Before and After Patent Expiration and Generic
Drug Entry ……………………………………………………………...28
Table 2.2. Blockbuster Drugs Facing Patent Expiry ………………………………...28
Table 5.1. Capitation vs. FFS Before and After OTC ……………………………….63
Table 6.1. Descriptive Statistics - Entire Insured Sample NAMCS 1997-2000,
2003-2004 ………………………………….…………………………….81
Table 7.1. Descriptive Statistics - Allergy Insured Sample NAMCS 1997-2000,
2003-2004 ………………………………………………………………..99
Table 7.2. Probability of Receiving Allergy Prescription Medication Before and After
Claritin OTC Event – Total Insured NAMCS Sample …………………104
Table 7.3. Probability of Receiving Allergy Prescription Medication Before and After
Claritin OTC Event by Capitation Status – Total Insured NAMCS
Sample …………………………………………………….…………….104
Table 7.4. Probability of Receiving Allergy Prescription Medication Before and After
Claritin OTC Event – Insured Allergy Sample …………...…………….105
Table 7.5. Probability of Receiving Allergy Prescription Medication Before and After
Claritin OTC Event by Capitation Status – Insured Allergy Sample …..105
Table 7.6. Allergy OLS Regression Results for Entire Insured Sample NAMCS 1997
– 2004 ……………………………………………………………...…...108
Table 7.7. Allergy OLS Regression Results for Insured Allergy Sample NAMCS
1997 – 2004 ………………………………………..…………………...111

xv
Table 7.8. Probability of Patient Type/Severity Indicators Before and After Claritin
OTC Event – Insured Allergy Sample …………………….…………114
Table 7.9. Allergy OLS Severity Regression Results for Insured Allergy Sample
NAMCS 1997 – 2004 ……...…….………………….…………….....115
Table 7.10. Time Spent and Diagnostic Tests Regressions NAMCS 1997 – 2004
Allergy Sample ………………………………………………………119
Table 8.1. Descriptive Statistics - Acid Reflux Insured Sample NAMCS 1997-2000,
2003-2004 ……………………..…………………………………….134
Table 8.2. Probability of Receiving Acid Reflux Prescription Medication Before and
After Prilosec OTC Event – Total Insured NAMCS Sample …….…139
Table 8.3. Probability of Receiving Acid Reflux Prescription Medication Before and
After Prilosec OTC Event by Capitation Status – Total Insured NAMCS
Sample ………………………………………………….……………139
Table 8.4. Probability of Receiving Acid Reflux Prescription Medication Before and
After Prilosec OTC Event – Insured Acid Reflux Sample .………….140
Table 8.5. Probability of Receiving Acid Reflux Prescription Medication Before and
After Prilosec OTC Event by Capitation Status – Insured Acid Reflux
Sample …..……………………………………………………………140
Table 8.6. Acid Reflux OLS Regression Results for Entire Insured Sample NAMCS
1997 – 2004 …………………………………………………………….143
Table 8.7. Acid Reflux OLS Regression Results for Insured Acid Reflux Sample
NAMCS 1997 – 2004 …………………………………………………..146
xvi
Table 8.8. Probability of Patient Type/Severity Indicators Before and After Prilosec
OTC Event – Insured Acid Reflux Sample …………………………149
Table 8.9. Acid Reflux OLS Severity Regression Results for Insured Acid Reflux
Sample NAMCS 1997 – 2004 ……...……………….………………150
Table 8.10. Time Spent and Diagnostic Tests Regressions NAMCS 1997 – 2004 Acid
Reflux Sample ………………………………………………………154
Table A.1. Allergy Probit Regression Results – Total Insured NAMCS Sample 1997 –
2000; 2003 – 2004 ………………………………………………….166
Table A.2. Allergy Probit Regression Results – Insured Allergy Sample NAMCS
1997 – 2000; 2003 – 2004 ………………………………………….168
Table A.3. Allergy Marginal Effect Regression Results – Total Insured NAMCS
Sample 1997 – 2000; 2003 – 2004 ………………………………….170
Table A.4. Allergy Marginal Effect Regression Results – Insured Allergy Sample
NAMCS 1997 – 2000; 2003 – 2004 ………………………………...172
Table A.5. Allergy Severity Probit Results – Insured Allergy Sample NAMCS 1997 –
2000; 2003 – 2004 …………………………………………………..174
Table A.6. Allergy Severity Marginal Effect Results – Insured Allergy Sample
NAMCS 1997 – 2000; 2003 – 2004 ………………………………...177
Table A.7. Acid Reflux Probit Regression Results – Total Insured NAMCS Sample
1997 – 2000; 2003 – 2004 …………………………………………..180
Table A.8. Acid Reflux Probit Regression Results – Insured Acid Reflux Sample
NAMCS 1997 – 2000; 2003 – 2004 ………………………...………182

xvii
Table A.9. Acid Reflux Marginal Effect Regression Results – Total Insured NAMCS
Sample 1997 – 2000; 2003 – 2004 ………………………………….184
Table A.10. Acid Reflux Marginal Effect Regression Results – Insured Acid Reflux
Sample NAMCS 1997 – 2000; 2003 – 2004 ………………………..186
Table A.11. Acid Reflux Severity Probit Results – Insured Acid Reflux Sample
NAMCS 1997 – 2000; 2003 – 2004 ………………………………...188
Table A.12. Acid Reflux Severity Marginal Effect Results – Insured Acid Reflux
Sample NAMCS 1997 – 2000; 2003 – 2004 ………………………..191

1
CHAPTER 1
INTRODUCTION
Significant changes in the prescription (Rx) and over the counter (OTC) drug
markets have recently developed. For the first time, drugs that were moved to the
OTC market were equal in strength and effectiveness to prescription-only
counterparts. This study explores how patients and physicians react to such changes
when deciding treatment options. It also explores the impact of physician
reimbursement methods on prescribing behavior.
The results of the study provide some evidence of a change in the patient case
mix seen in physician offices after these equally effective medications move to the
OTC market. In both the allergy and acid reflux groups, there is an increased use of
specialist physicians after the availability of an OTC. In addition, acute patients are
less likely to be seen in physician offices for acid reflux related conditions, and
chronic flare-up patients are less likely to be seen for allergy related conditions. These
results indicate that the overall severity of patients seen in physician offices increases
after the availability of an OTC, since those with less severe conditions can self-treat.
This study also finds that physicians reimbursed under a capitated health plan
provide their patients with the least costly form of treatment. In the allergy group,
capitated physicians are significantly more likely than fee-for-service to provide
patients with allergy shots, which are less costly than medications. After the
availability of an OTC, however, capitated physicians are less likely to provide these
shots, as they are no longer the least costly. OTCs are instead the most cost effective
form of treatment for an insurance plan, since the patient pays completely out-of-
pocket for them.
Similarly, for the acid reflux group, physicians under capitation are more likely
to provide the older OTC medication Zantac to their patients as this is least costly.

2
Once Prilosec moves to the OTC market, capitated physicians have another option for
treatment that is just as cost effective for the insurance company since the patient
remains fully responsible for the cost of the drug.
Overall there also seems to be some evidence of brand loyalty amongst
patients when drugs move to the OTC market. In both markets, there is a decrease in
the overall use of prescription medications after the availability of an OTC, indicating
that patients follow these drugs to the OTC market, even though it may be more
costly.
Importance of Study
The pharmaceutical industry has recently seen the switch of several top selling
drugs from the prescription to the over-the-counter drug market. Traditionally, drugs
available over the counter were less effective than prescription medications. Rx-only
and OTC drugs, therefore, could only be considered as imperfect substitutes for each
other. Even those brands that moved their products from the prescription market
tended to have reduced dosages as OTCs. This changed in 2002 when, for the first
time, a prescription drug product became available to the public on an over the counter
basis and was of equal strength and effectiveness as those in the same class that
remained prescription-only.
Little research to date has addressed how the change in prescription status
affects the use of a drug, or other competing drugs in the same class with equal
effectiveness, when it moves to the over-the-counter market. While other researchers
have studied physician incentives in regards to brand-name versus generic drug
prescriptions, few have studied the incentives physicians face when deciding between
prescription and OTC substitutes. Even those studies that have examined prescription
versus OTC drugs were done when the two markets were not as comparable. OTCs

3
and prescriptions drugs for these studies could have been used as compliments rather
than substitutes for one another.
Healthcare resource utilization can potentially be made more efficient with
access to OTCs that are equal in strength and effectiveness to prescription-only
counterparts. The availability of these drugs on the OTC market can create an
effective sorting system in which those patients with less severe symptoms can self
treat allowing for quicker, less expensive therapy; and preventing unnecessary
physician office visits.
Purpose and Scope of Research
The purpose of this study is to examine how patients and physicians change
their behavior after the availability of an OTC drug that is chemically equivalent to its
prescription counterparts. Specifically, this study first intends to examine whether
those patients that have less severe symptoms, utilize OTC drugs to self-treat, as a
substitute to physician office visits. This could potentially increase the overall
severity of the patient case-mix seen in physician offices after the availability of an
OTC drug. Second, the study also focuses on whether or not physicians change their
prescribing behavior when a drug switches from prescription to OTC class, and how
this varies by the drug class being considered and the reimbursement method to
physicians. Patient level data was used from the National Ambulatory Medical Care
Survey (NAMCS) from the years 1997 – 2004 to study the effects of this switch. The
allergy/antihistamine and the acid reflux drug classes are the two categories being
examined since both have witnessed recent movements of blockbuster medications
from the prescription-only to the OTC market in 2002 and 2003 respectively.
Key Issues
The following section discusses the important factors that are considered in
this research.

4
Physician Incentives and Reimbursement
All players in the health care industry are affected by the switch of drugs from
prescription to over the counter status. The physician is perhaps in the most important
position, however, since he/she is integral in determining whether or not a patient
receives a prescription. Physicians’ incentives are an important aspect to examine
when studying the effects of OTC switches as they are in this vital position. As
owners and partners of private practices, physicians have a financial incentive to
maximize their own profits, but at the same time, they must balance their intentions
with patient welfare. As an agent for his/her patients, the physician’s choice of a drug
for a patient’s ailment should not be influenced by its OTC versus Rx status, from a
chemical perspective, even though physician authorization is required only for
prescription drugs. Financial motives, however, may affect the decision between
prescription and OTC medications as there could be an impact on physician profits.
A switch in regulatory status may also entail a change in the cost to the patient
depending on their insurance coverage. It is therefore important for patients to
understand their full range of options for medications and the implications of the
physician’s choice.
Pharmaceutical companies must also analyze the incentives of physicians as
they are the gatekeepers for prescription medications. The makers of drugs can
determine the best strategies to promote and sell their products when patent
expirations near for their own drug or when other drugs in the class move to the OTC
market by understanding how a physician may change his/her prescribing pattern
when these changes occur.
As providers of health insurance coverage, both government and private
insurance companies can employ certain techniques to align the incentives of the
physician with those of the third part payer, especially in regards to prescribing
5
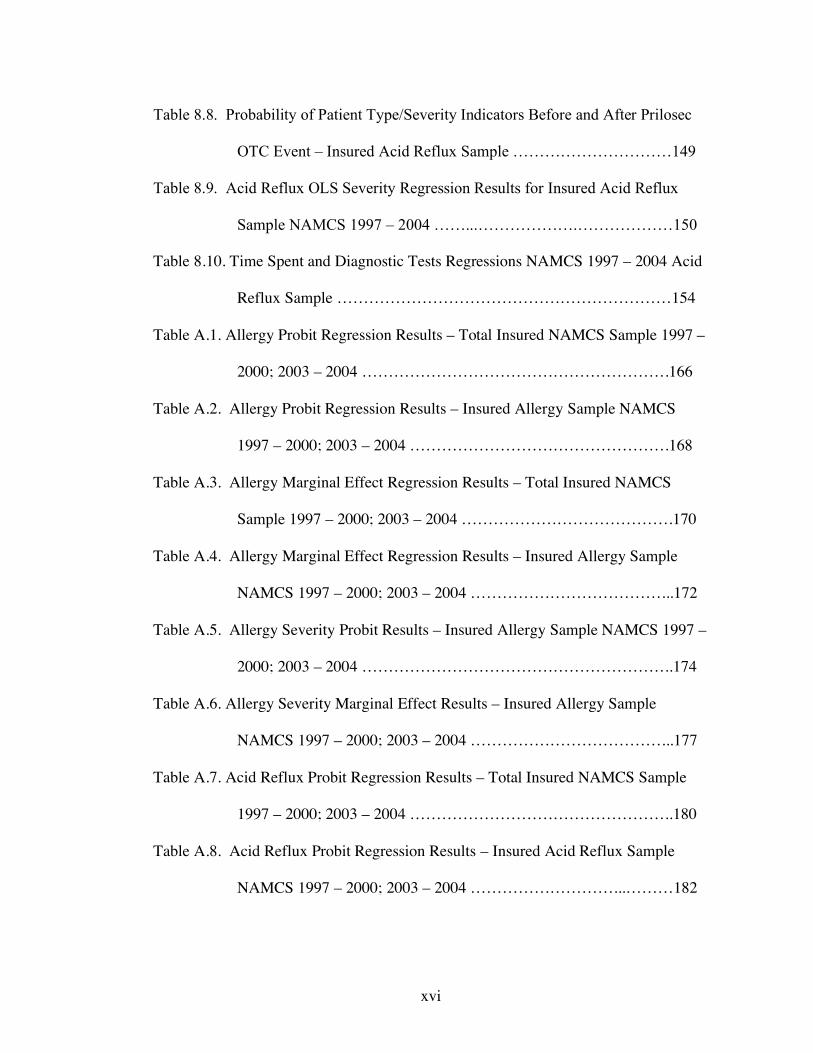
behavior. In fact, rather than fully reimburse physicians for all costs of care, some
insurance companies use discounted reimbursements, capitated payments, and other
controls to monitor the drug consumption decisions made by physicians. These
companies also use annual reviews to either reward or penalize physicians based on
their prescribing behavior. Figure 1.1 shows the extent to which these measures are
used to control physician decisions. As can be seen, almost all companies use at least
some form of cost control, with most requiring physicians to adhere to some practice
guidelines or undergo drug utilization review; and over ninety percent requiring
physicians to get prior authorization for medication choice. From 2001 onwards, as
depicted in the figure, all HMO’s implement some form of prescription control. While
the use of financial incentives declined after 1998, it steadily remained a control
method for over twenty percent of HMO’s. Second opinion is the least used control
method amongst these managed care organizations.
0
10
20
30
40
50
60
70
80
90
100
1997 1998 1999 2000 2001 2002 2003
Year
Per
cent
of H
MO
s U
sing
Con
trol
Met
hod
No Control Financial Incentives Drug Utilization Review Quality Assurance
Second Opinion Prior Authorization Practice Guidelines
Figure 1.1
Control Methods Used by HMOs to Influence Physician Prescribing Behavior
(Kaiser Family Foundation, 2006)

6
Capitation
Increases in health care expenditures created a restructuring of the industry that
was led by cost-conscious managed care organizations (MCOs) beginning in the
1980s. In the new environment, these organizations attempted to curb the effects of
moral hazard, or over utilization, by making physicians financially accountable for
their decisions. Traditionally, physicians were completely unattached to the third party
payers since they received full reimbursements without any incentives to reduce costs.
Physicians made their treatment and health care decisions based on what they thought
was appropriate for the patient and were not at all financially responsible for providing
medical care. This led to an increase in moral hazard since physician revenues
increased with the higher utilization of resources.
In order to create a more efficient use of resources, managed care organizations
created a system in which the physician was now financially responsible for his/her
treatment decision. MCOs developed protocols for physicians to follow and even
began controlling treatment options, thereby decreasing physician autonomy.
Managed care companies, however, vary in the amount of financial responsibility they
place on the physician. It is under capitation that physicians are most financially
responsible for their treatment decisions.
According to the Centers for Medicare and Medicaid Services, capitation is the
physician payment method in which a set dollar amount per patient per unit of time is
paid by insurance companies to cover services without regard to the actual number of
services provided. That is, an insurance company pays the physician a set amount; all
services utilized by the physician for the patient during the period are deducted from
that payment. While the use of capitation has decreased in recent years, this method
of payment is most likely to align physician incentives with those of the insurance
companies, as physicians bear some financial responsibility for their decisions. This

7
method of reimbursement can vary in the extent to which physicians are held
responsible. Some companies allow physicians to only take the administrative costs of
a patient visit out of the fixed payment, while the company covers the cost of tests,
medications, and other services. Other companies require physicians to deduct all
services from the fixed payment. Figures 1.2 and 1.3 depict the extent to which
capitation has penetrated the physician market. It is possible for a physician to
reimbursed by both FFS and capitation simultaneously, as he or she could have
patients under both types of insurance plans.
0
10
20
30
40
50
60
70
80
90
Relative Value Scale FFS Salary Capitation
Method of Physician Reimbursement
Pe
rce
nt
of
HM
Os
Primary Care Phys Specialist
Figure 1.2
Method of Physician Reimbursement by HMOs in 2001
(Kaiser Family Foundation, 2006)
According to Figures 1.2 and 1.3, capitation seems to be relevant for both
specialists and primary care physicians, but to a lesser extent for specialists.

8
Capitation for both types of physicians is the second most used method of physician
reimbursement, with over fifty- percent of HMO’s using some form of capitation for
primary care practices. The majority of pediatricians face capitation as their method
of reimbursement, while both general internal medicine and family practice have
capitation rates for nearly 50% of their field.
0 10 20 30 40 50 60
All Physicians
General/Family Practice
General Internal Medicine
Pediatrics
Internal Medicine Subspecialties
General Surgery
Surgical Subspecialty
Obstetrics/Gynecology
Radiology
Psychiatry
Anesthesiology
Pathology
Emergency Medicine
Other Specialty
Ph
ys
icia
n S
pe
cia
lty
Percent of Physicians with Capitated Contract
Figure 1.3
Percent of Physicians with Capitated Contracts by Specialty in 2001
(Kaiser Family, 2006)
Capitation is compared with Fee-for-Service in the work here to examine the
impact of financial incentives on physician prescribing behavior. The incentives
under capitation are to minimize the use of resources in order for the physician to
maximize profits. FFS physicians, however, can increase profits by maximizing
resource use. Under the context of prescribing behavior, this study examines how

9
capitated and FFS physicians differ in their prescribing behavior. This analysis is then
further carried to examine how these physicians differ in prescribing behavior, once a
low cost OTC becomes available in the market that is of equal strength and
effectiveness as prescription-only drugs. By providing an OTC drug to their patient,
physicians can minimize further office visits for the same illness, since the patient no
longer has to get physician approval for refills. Providing a prescription drug,
however, increases the likelihood that a patient will return to a physician’s office,
since the patient will need refills and/or physician monitoring. Using OTCs, therefore,
can limit the amount of resources used, which may be beneficial to capitated
physicians.
Patient Case Mix
According to the theoretical model described later, it is predicted that patients
will have the opportunity to self-treat with an OTC, and therefore the only patients
seen in physician offices are those who were not successful with the OTC or those
who were not able to properly diagnose themselves, perhaps because of co-
morbidities. Also, those patients that have the relevant illness on a long term basis are
likely to be seen in physician offices for disease management.
It is therefore hypothesized that the case mix of patients with a related
diagnosis seen in physician offices will become more severe after the availability of an
OTC medication for a particular class of drugs. Measuring patient severity is difficult
without knowing the exact nature of a patient’s symptoms or the results of patient
exams and tests. Other researchers have utilized measures such as Ambulatory Care
Groups (ACGs) and Chronic Disease Scores (CDS) to adjust for patient case-mix.
With ACGs, resource use is predicted using ambulatory visit diagnoses. CDS uses the
category of drugs prescribed to identify chronic comorbid conditions (Hillman et al,
1999).

10
Some researchers have used time spent with the physician, defined as the
number of minutes the physician spends face-to-face with the patient, as a measure for
severity, where an increased time spent indicates a higher severity of illness. It has
often been suggested that a greater amount of time spent with a patient indicates
greater physician effort (Rice, 2004). While time spent with the physician could very
well shed light on the severity of the patient, this measure can be influenced by many
other factors that are not related to severity. For example, physicians may spend more
or less time with a patient simply because of changes in reimbursement methods rather
than the nature of the patient’s illness. Also, it is when patients first have symptoms
that time spent with the physician could be greatest. It is in these initial visits that the
physician takes time to understand the patient’s symptoms and educates the patient
about the illness. Time spent therefore, could be an indication of the start of an illness
for a patient, in which case the severity may still be low. Also, those that have chronic
conditions are thought of having a higher severity. Time spent with chronic patients,
however, does not necessarily have to be higher, since these patients are most likely
being managed, rather than first being diagnosed with the illness. Time spent with the
physician is therefore tested here, to simply better understand what happens amongst
patients and physicians once an over the counter drug is available, rather than to
predict changes in case-mix severity.
The number of diagnostic tests ordered could also be an indicator for the
complexity of a patient’s illness since physicians use these tests as tools in the
diagnosis process. When patients have many symptoms that could lead to a variety of
illnesses, physicians utilize diagnostic tests to help discern between them. Again,
however, the most testing could be done when patients first present with symptoms in
the physician’s office. It is during this initial time period that the physician could still
be in the diagnosis process and utilizes testing to help determine the patient’s illness.

11
The total number of diagnostic tests therefore would not necessarily indicate a higher
severity, but rather the early part of an illness. Total testing is also examined here to
better understand the effects of an OTC becoming available in a class, but it is not
used as a measure of severity.
To better understand changes in severity, this study analyzes the use of
specialist physicians before and after the availability of an OTC medication to indicate
any changes in patient case-mix. The use of a specialist indicates that the patient has
symptoms that can no longer be effectively treated by a primary care physician and
instead need to be more aggressively handled by a physician trained in the area (Diette
et al, 2001).
Finally, this study examines the nature of the patient’s condition to estimate
severity. The nature of the illness is categorized by the length of time the patient has
had symptoms. Acute patients are defined as those having symptoms for less than
three months; chronic routine are those patients with symptoms for more than three
months; and chronic flare-up includes those patients that have had the illness for more
than three months, but their symptoms have suddenly been exacerbated. As described
by Rice (2004), chronic conditions can be considered as more severe and more costly
than acute ones because they require a greater use of medications and a longer time
period for treatment. According to the hypotheses of this study, if acute patients can
be successfully treated with OTC medications, these patients will no longer see their
physicians, thereby increasing the overall severity of the patient case mix seen in
physician offices. Chronic flare-up patients are expected to act similarly to acute
patients, since their conditions may also be short-term.
Regulatory Status of Drugs and Policy Impact
The regulatory status of drugs determines the extent of access patients have to
the medication. To obtain prescription drugs, patients must first go through

12
physicians, whereas OTC medications can be accessed directly, without prior
authorization. As more medications for more illnesses, move to the OTC market,
patients will increasingly be able to self treat. This could create an efficient
mechanism to sort between patients with mild conditions from those with higher
severity. If all patients first use OTC medications, some will be treated effectively and
will not have to see a physician at all. Others, however, will not be treated
successfully by the OTC and will have to see a physician for further diagnosis. The
availability of OTC medications creates a system in which unnecessary physician
visits can be avoided, thereby decreasing health care costs. This could impact the
decisions of the Food & Drug Administration, when determining which drugs and
which drug classes should be available without physician approval. The downside of
OTC availability is an important factor in this decision making process as well. With
increased access, patients could over-utilize medications, or could even take these
drugs incorrectly if they misdiagnose themselves.
Significance of Pharmaceutical Market Analysis
The medical drug market has become an increasingly important component of
the health care industry, which further provides reason for increased research in this
area. In 1999–2000, according to a survey done by the National Center for Health
Statistics, 44.3 percent of Americans of all ages reported using at least one
prescription drug during the month in which the survey was conducted. During the
same period the percent of individuals who reported using three or more drugs in the
past month was almost 17 percent. More than 60 percent of adults age 45–64 years
and more than 80 percent of adults age 65 years and over reported taking at least one
prescription drug during the month in which the survey was conducted between 1999-
2000. In 2002, national expenditures on prescription drugs were over $162 billion and
grew over 15% from the amount spent the year before (National Center for Health

13
Statistics, 2004). Figure 1.4 shows the percent of National Health Expenditures spent
on prescription drugs.
0.0%
5.0%
10.0%
15.0%
20.0%
25.0%
1996 1997 1998 1999 2000 2001 2002 2003 2004
Year
Pe
rce
nt
of
Pe
r C
ap
ita
He
alt
h E
xp
en
dit
ure
Figure 1.4
Percent of per Capita National Health Expenditures Attributable to Prescription Drugs
(MEPS, 2006)
These expenditures should progressively increase as the use of drugs continues
to rise. As some blockbuster drugs come off patent, there may be a leveling off of
prescription drug expenditures since the cost of these drugs should decline. Other new
drugs, however, will still be introduced at higher prices, off setting the patent
expiration effect. Figures 1.5 shows the percent of the U.S. population that has a
prescription expense. Figure 1.6 depicts the mean out-of-pocket cost paid by patients
amongst those that have a prescription expense. The two figures provide different
perspectives on the pharmaceutical market and its trends.
14
60.0%
60.5%
61.0%
61.5%
62.0%
62.5%
63.0%
63.5%
64.0%
64.5%
65.0%
1997 1998 1999 2000 2001 2002 2003 2004
Year
Perc
en
t o
f P
op
ula
tio
n w
ith
Pre
scri
pti
on
Dru
g E
xp
en
se
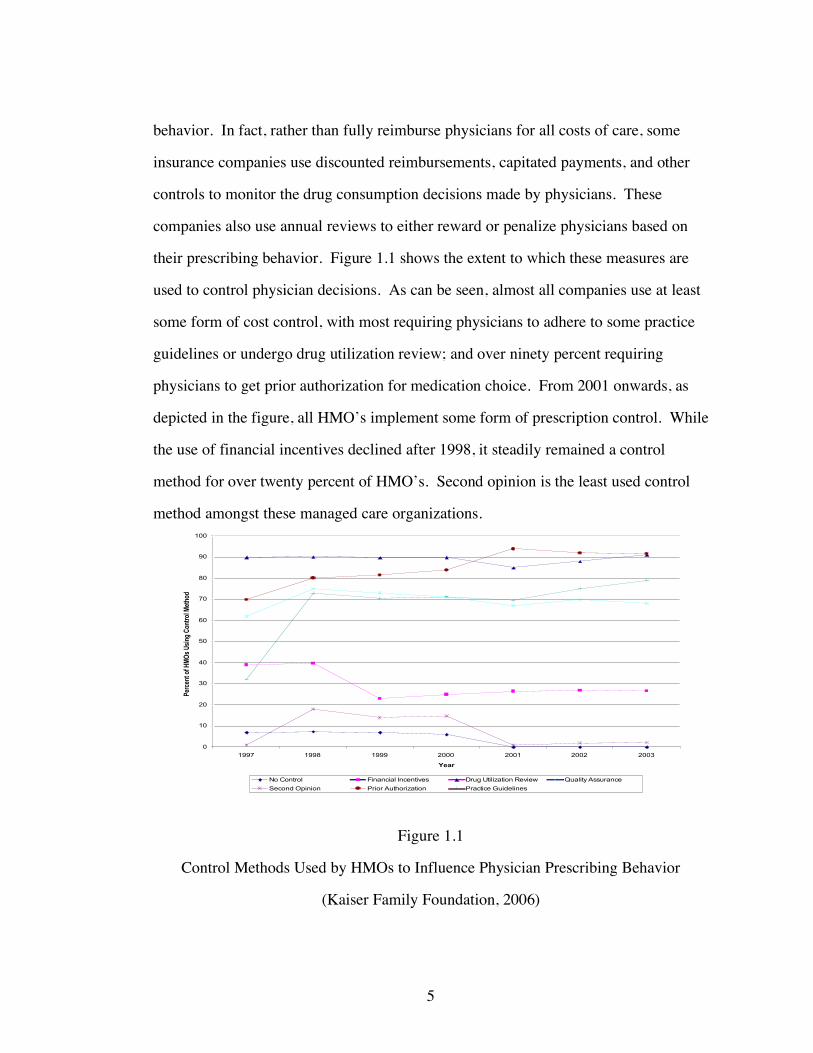
Figure 1.5
Percent of Population with a Prescription Expense
(MEPS, 2006)
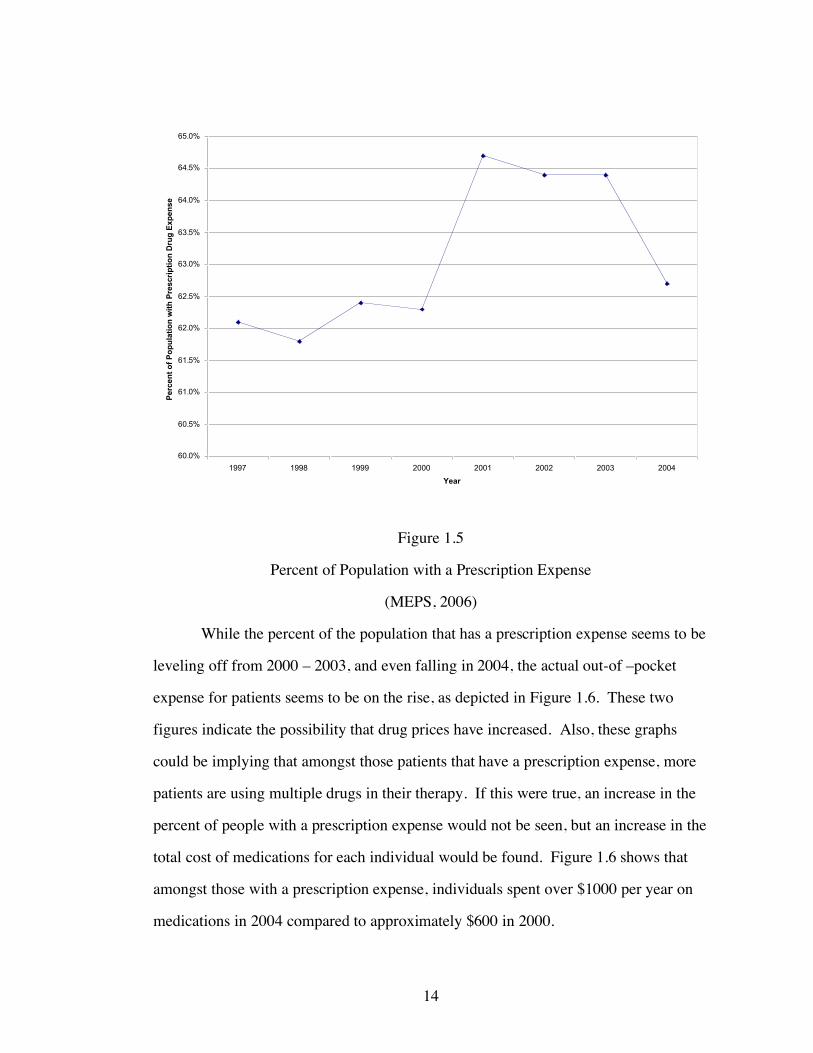
While the percent of the population that has a prescription expense seems to be
leveling off from 2000 – 2003, and even falling in 2004, the actual out-of –pocket
expense for patients seems to be on the rise, as depicted in Figure 1.6. These two
figures indicate the possibility that drug prices have increased. Also, these graphs
could be implying that amongst those patients that have a prescription expense, more
patients are using multiple drugs in their therapy. If this were true, an increase in the
percent of people with a prescription expense would not be seen, but an increase in the
total cost of medications for each individual would be found. Figure 1.6 shows that
amongst those with a prescription expense, individuals spent over $1000 per year on
medications in 2004 compared to approximately $600 in 2000.
15
$0
$200
$400
$600
$800
$1,000
$1,200
1997 1998 1999 2000 2001 2002 2003 2004
Year
Mean
An
nu
al E
xp
en
se P
er
Pers
on
Figure 1.6
Mean Out-of-Pocket Expense for Population with Prescription Expense
(MEPS, 2006)
16
CHAPTER 2
BACKGROUND
Players in the Health Care Industry
The health care market in the U.S. has many players acting with varying
interests. Patients are the primary consumers of health care, but physicians often act
as agents for them in their consumption decisions. The majority of U.S. patients do
not pay the full price of all the products and services in the health care industry at the
point of consumption because of insurance. Because patients do not necessarily face
the marginal cost of these services, there can be a moral hazard tendency to over
consume.
While physicians are suppliers of health care services, they are consumers as
well. Physicians provide their skills and services to patients and charge a fee, but, as
mentioned earlier, they must simultaneously act as an agent on behalf of patients and
their interests. As owners of private practices or even as employees of managed care
companies, physicians must balance business interests as well, by minimizing costs.
In this position physicians must provide adequate care at the least possible cost.
The U.S. government through the services of Medicare and Medicaid and
private insurance companies are the major providers of health insurance in this
country. These organizations do not consume any health care services directly;
however, they are the major payers of all health care products. As third party payers,
the main incentive for insurers is to minimize excess costs.
Pharmaceutical companies are players in this industry as well. Most of these
companies are public and therefore, in order to meet shareholder goals, they must
maximize profitability. To accomplish this, drug companies engage in heavy
marketing directly to the consumer, but most of all to the physician. Pharmaceuticals
also attempt to find the most innovative medication for each type of illness to sell in

17
drug markets with patent protection. These companies engage in heavy research and
development efforts to find the newest products, obtain patents, and gain FDA
approvals. By getting a patent for the product, these corporations can protect
themselves from competition and can set their prices in a monopolistic way.
According to the Congressional Budget Office, as of 1994, the patent for a
prescription drug lasts 20 years from the date of filing. The 20 years of exclusivity
includes the period in which the drug moves through FDA trials, and therefore
amounts to an average of 11.5 years of marketing time (CBO, 1998).
Once a drug loses patent protection, generics are able to enter the market and
create a great deal of competition, driving down prices. At times, pharmaceuticals are
able to extend the profit life of prescription products as they lose patent protection by
turning to the over the counter market. As they switch a drug to OTC status,
pharmaceutical companies can take advantage of the brand name associated with their
product and can continue to make profits from it. In addition, the Drug Price
Competition and Patent Restoration Act of 1984 (Hatch-Waxman) allows for a 3 year
patent extension of those drugs switched from prescription only to over-the-counter
status, if the company has been required to provide additional clinical trials for the
switch to be evaluated. This extension is also given to those products in which a
pharmaceutical firm can find a new indication for use when the drug moves to the
OTC market (Harrington, 2002).
When competing in the OTC market, however, pharmaceuticals must also face
increased price elasticity. That is, since patients generally pay for the full cost of OTC
medications completely out-of-pocket, they will be more sensitive to differences in
price. For this reason, pharmaceutical companies are not able to price their
medications as high in the OTC market as compared to when the drug was
prescription-only.
18
Insurance companies that provide drug coverage are also in a position to push
for the switch of prescription drugs to over the counter status. Traditionally, most
insurance companies have not covered OTC products within their prescription drug
plans. Therefore, as they are looking for ways to reduce costs in the prescription drug
market, insurance companies can petition the FDA to convert a drug from the
prescription to the OTC market. Also the company can save costs when people self-
medicate and thereby decrease their trips to physician offices.
Policy Analysis and the Pharmaceutical Industry
There are many public policy issues concerning the pharmaceutical industry as
well. In 2003 the Medicare Modernization Act (MMA) was initiated to provide drug
coverage for the Medicare population to ease the financial burden of prescription drug
spending, especially for those with low incomes. Under this plan, in January 2006,
Medicare began paying for outpatient prescription drug coverage through private drug
plans. With the recent start, there is considerable interest in understanding how the
new benefit could affect the out of pocket costs beneficiaries face. According to a
Kaiser Family Foundation report, in 2006, the Congressional Budget Office (CBO)
estimates that Part D participants will spend, on average, $792 out of pocket for
prescription drugs (excluding premiums), which is 37% less than the $1,257 they
would have spent in the absence of the law.
In another area of pharmaceutical policy, in 2004, a group of senators
introduced a bill that would allow the re-importation of prescription drugs from other
nations. The Pharmaceutical Market Access and Drug Safety Act would allow U.S.
residents to re-import as much as a 90-day supply of prescription drugs from Canada
for personal use from only Canadian pharmacies that have been approved by the Food
and Drug Association (FDA). Those in favor of the bill argue that there is no reason
why Americans have to pay more for their medications than people in other countries.

19
Those opposed to the bill feel that re-importation will prevent the FDA from being
able to monitor the quality of drugs entering the U.S. and will thereby open the door
for unapproved medications that could be potentially harmful to patients. The bill has
not been passed into law, and therefore it is still illegal for anyone other than a drug
manufacturer to bring pharmaceuticals into the US.
Advertising has also been at the center of public policy recently. Before 1997,
pharmaceutical companies had to provide all of the risk information associated with a
drug during a television advertisement. This requirement increased the length of the
advertisement, making them impractical. In 1997, the FDA issued a new guidance
allowing pharmaceutical companies to meet requirements by presenting the major side
effects, either in audio or in audio and visual form, and by telling consumers where to
find additional information, including how or where to obtain the approved product
labeling. According to the General Accounting Office from 1997-2001 spending on
advertising increased from $1.1 billion to an estimated $2.7 billion. Meanwhile,
spending on total promotion increased from $11.0 billion to an estimated $19.1
billion. This rapid increase caused a great deal of debate as to the true effect of
advertising. Those in favor of direct-to-consumer advertising claim that these ads
provide information to consumers by making them aware of conditions and the
treatments available. These advertisements encourage patients to see their physicians
and get proper care in a timely manner. On the other hand, those opposed to
advertising claim that these ads create unnecessary demand for pharmaceutical
products. People see ads and think they have conditions that they may not in fact
have; patients then demand these brand name products from their physicians.
According to the opposition, this wastes valuable physician time and physician
autonomy, especially when the physician has to explain to the patient why they do not
need a particular drug.

20
U.S. Drug Approval Process
Before a drug can even enter the prescription or OTC markets, it must be
approved by the Food and Drug Administration (FDA). According to the FDA, a
legal drug is a substance used in the diagnosis, treatment, or prevention of a disease or
as a component of a medication. In 1938, the Food, Drug, and Cosmetic Act was
passed, requiring for the first time that drugs be cleared by the FDA before being
marketed for patient use. Under this act, all new drugs had to be proven as safe for
human use and had to have the labeling specifications required by the act.
Drug companies formally propose that the FDA approve a new drug for sale in
the United States with a new drug application (NDA). An NDA includes data
collected from various research trials and analyses. Specifically they must provide
sufficient results to prove the safety and effectiveness in treating, preventing, or
diagnosing a specific disease. Decisions that the FDA must make include:
• Whether or not the drug is safe and effective for its proposed use.
• Whether the drug’s proposed labeling is appropriate.
• Whether manufacturing methods are adequate to preserve the drug’s strength,
quality, and purity.
The research and development process for drug companies is very
complicated, time-consuming, and expensive. In addition, it is never guaranteed that a
successful product will be the end result. Thousands of chemical compounds are
made and tested in hopes of finding one that can make it through the approval process.
According to FDA estimates, it takes approximately eight and a half years to study and
test a new drug before it can be approved for the general public. This approximation
includes laboratory and animal testing, as well as clinical trials on human subjects.
Drugs are developed in many different ways. In some instances,
pharmaceutical companies themselves decide to develop a new drug for a specific
21
medical condition. Scientists may choose to investigate an interesting line of research,
or findings from university and government research may point the way for drug
companies to follow their own research. In all cases, new drug research begins with
an understanding of how the body functions, normally, as well as abnormally. This
level of understanding allows researchers to determine how a drug might be used to
prevent, cure, or treat a medical condition. Sometimes scientists can find the correct
compound quickly, but usually thousands must be screened first.
In the U.S., it is estimated that bringing a prescription drug to market costs
between $300 million and $600 million, and takes approximately 10-15 years. One in
five thousand compounds that enter preclinical testing actually proceeds to human
testing, and around 20% of those that enter clinical trials actually make it to the market
(Paul, 2001).
Pre-Clinical Research
Before the approval process even begins, companies are required to first
undergo pre-clinical research to show that a drug is reasonably safe for initial small
scale studies. It is during this stage that sponsors evaluate a drug’s toxic and
pharmacological effects. The results of these tests are then used in the Investigational
New Drug (IND) application required to be submitted to the FDA before testing can
begin on human subjects. This application lays out all the information known about
the drug to date and it begins the official dialogue between the FDA and the
pharmaceutical company. According to the FDA, sponsors of drug applications have
various options for fulfilling these requirements. Depending on whether a compound
has been marketed previously or even studied before, companies can compile data
from past laboratory studies on the compound; they can compile data from previous
clinical testing or marketing of the drug; or companies can undertake new pre-clinical
studies.
22
Animal testing generally begins in this pre-clinical phase to measure the
toxicity of a drug and examine the chemical breakdown of it in vivo. Animal testing
can be short term, lasting a few weeks to a few months. Long term animal testing,
however, can even last several years, at times running concurrently with human testing
in order to learn about the long term effects of a drug. All of the data in this phase is
used to determine if it is safe to proceed with human/clinical trials.
Clinical Trials
The goal of clinical trials is to obtain safety and effectiveness data for each
drug. The clinical trials part of the process is divided into three phases. Phase 1 is the
initial introduction of the investigation. Here, tests are usually conducted on
approximately twenty to eighty healthy volunteer subjects to determine the metabolic
and pharmacologic actions of the drug in humans; any side effects associated with
increased doses; and gain early evidence on effectiveness.
In Phase 2 researchers conduct controlled clinical studies on several hundred
people to obtain data on the effectiveness of the drug in those patients with the target
disease. Many short-term side effects are often found in this phase. This phase can
take several years to complete and costs between $20 million and $40 million (Paul,
2001). The studies in this phase also determine the dosage levels and frequency of
administration at which this level of effectiveness is reached safely.
Phase 3 includes expanded controlled and uncontrolled trials. After evidence
from Phase 2 has been found indicating that a drug is effective, Phase 3 trials begin to
gather more information about the effectiveness and safety of a drug to create an
overall benefit-risk relationship. Physicians monitor patients closely in this phase of
trials in order to confirm the effectiveness of the product and also to identify and
adverse reactions. Because Phase 3 trials are conducted on several hundred to several

23
thousand people, they provide an adequate basis for extrapolating the results to the
general public.
Occasionally, the FDA conditionally approves a product, in which case, it
requires companies to conduct Phase 4 trials. This additional research is generally
conducted to measure the compounds impact on particular patient subgroups or to
provide a clearer picture of benefits. Companies can begin marketing their products
while they are in the process of conducting Phase 4 trials.
NDA Review
After Phase 3 of the Clinical Trials stage is complete and successful, an NDA
is submitted for review. After careful review of data from all of the research trials, the
FDA decides whether or not the drug labeling, or the official instructions for use, is
acceptable. The FDA then has an inspection of manufacturing sites and areas where
significant clinical trials were performed. If those are found to be in satisfactory
condition, the NDA is generally approved, after which only the sponsor of the NDA
can market the drug. Pharmaceutical companies are still required, after approval, to
continue to submit periodic reports to the FDA regarding all serious adverse reactions
and quality control problems (FDA, 2005).
Prescription & OTC Drugs
The distinction between prescription and over-the-counter (OTC) drugs was
first established in 1951 with the Durham-Humphrey amendments to the Food, Drug,
and Cosmetic Act which defined the types of drugs that could only be safely used with
medical supervision (FDA Food and Drug Law History, 2005). Later, all drugs, both
those that did and did not require physician authorization, were required to be proven
safe and effective with the passing of the Kefauver-Harris amendments in 1962. In
1972, the OTC Drug Review was started to evaluate OTC product ingredients to
ensure safety, effectiveness, and labeling standards. Formally, a prescription drug is

24
any drug or medicine requiring physician authorization before it can be purchased or
obtained. OTC drugs on the other hand are available to consumers without a
prescription from a physician. Like prescription medications, however, these drugs
also undergo an approval process and are monitored by the FDA. According to the
FDA, OTC drugs generally possess the following characteristics (Mossinghoff, 1999):
• Benefits outweigh risks.
• Potential for misuse and abuse is low.
• Consumers can use them for self-diagnosed conditions.
• They can be adequately labeled.
• Health practitioners are not needed for the safe and effective use of the
product.
OTC Approval
The FDA's review of OTC drugs is primarily handled by Center for Drug
Evaluation and Research’s (CDER) Division of Over-the-Counter Drug Products. The
FDA has been evaluating the ingredients and labeling of some drugs since many OTC
products have been marketed to the public even before laws were passed requiring
proof of safety and effectiveness. This FDA project is part of "The OTC Drug Review
Program" which is intended to establish OTC drug monographs for each class of
products.
OTC drug monographs include information on acceptable ingredients, doses,
formulations, labeling, and testing, and they are continually updated to add additional
ingredients and labeling as needed. Those products that already conform to a
monograph can be marketed without pre-approval from the FDA. Those drugs that do
not conform to the monographs, however, must undergo separate reviews and must
gain approval through the New Drug Application (NDA) process, which is the same

25
process for approving prescription drugs. New ingredients that enter the OTC market
for the first time also must use the NDA process.
The OTC Drug Review evaluates OTC product ingredients and initially
categorizes a drug as Category I, II, or III. Category I drugs are generally recognized
as safe and effective for the claims given by the sponsor. Category II drugs are
recognized as generally unsafe and ineffective, while Category III drugs are those with
insufficient data to allow for a final classification. The FDA evaluates the findings
from this review to either approve or reject a drug for OTC marketing (FDA, 2005).
Prescription to OTC Reclassification
Thirty percent of new OTC drugs that were put on the market between 1975
and 1994 were originally prescription-only drugs. Since the OTC Drug Review was
initiated, more than 40 product ingredients have been switched from prescription to
OTC status.
According to Mahecha (2006), “The US Food and Drug Administration
defines an Rx-to-OTC switch as over-the-counter (OTC) marketing of a drug product
that was once a prescription (Rx) drug for the same indication, with the same strength,
dose, duration of use, dosage form, population and route of administration”. There
are three sponsors that can apply for the reclassification process from prescription to
OTC. First, manufacturers can create a supplement to the original New Drug
Application (NDA) if post-marketing evidence from prescription-only sales shows
that the drug can be used safely without physician supervision. Second, after a drug
has already been sold on the prescription-only market the FDA itself can file a petition
for reclassification if it has been determined that prescription status is not necessary
for safe use of a drug. Third, any interested party (such as patients, physicians, or
insurance companies) that feels an Rx-to-OTC switch would be appropriate can file a
citizen petition asking the FDA to consider changing a drug’s status (CDER, 2006).

26
The majority of switches, however, are initiated by the parent company of the drug in
question since the manufacturer has the most access to data that can determine
whether or not a switch is appropriate.
Drugs must meet certain criteria before the FDA will consider such
reclassification. The indications for use as an OTC drug must first be similar to the
prescription indications, and the OTC drug must allow for easy diagnosis and
monitoring by the patient. Next, the drug must have positive adverse-event and drug-
interaction profiles, relatively low toxicity, as well as a low potential for abuse.
Finally, the drug must not have characteristics that make it impractical for OTC use
(FDA, 2005). Figure 2.1 shows the number of OTC approvals and Rx-to-OTC
switches per year. According to the figure, 1996 had the most switches/new
approvals. This year had high profile switches in products from drug classes
including:
• Acid Reflux – (Zantac, Axid)
• Smoking Cessation – (Nicorette, Nicotrol, Nicoderm)
• Hair Growth – (Rogaine)
• Anticandidal – (Femstat, Monistat, Gyne-Lotrimin) (Soller, 2000).
Financing Drug Development
Drug manufacturers are faced with increasing costs for drug development. The
Southern Medical Association estimates that the cost for developing and marketing a
single pharmaceutical product has risen from $54 million in the 1970s to greater than
$800 million in 2000 (Spruill, 2005).Many companies therefore try to extend patent
life as long as possible to prevent any threats of competition that may drive revenues
down. Table 2.1 shows the change in profits after patents have expired for a few
major drugs. Drugs such as Claritin have a decrease in profits of nearly ninety –
percent.

27
0
5
10
15
20
25
1995 1996 1997 1998 1999 2000 2001 2002 2003 2004 2005
Year
Nu
mb
er
of
New
Ap
pro
vals
, S
wit
ch
es, an
d N
ew
Uses
New Approvals or Rx-to-OTC Switches New Uses
Figure 2.1
OTC New Approvals, Rx-to-OTC Switches, and New Uses by Year
(CDER, 2005)
Table 2.2 provides recent revenues for drugs with upcoming patent expirations.
Many drugs facing patent expiry are switched to the OTC market to protect revenues
from generic competition. When a drug patent is about to expire, the company
submits a switch request in the hopes that brand recognition and loyalty cultivated
among prescription customers will transfer to the over-the-counter market. As
mentioned earlier, The Hatch-Waxman Act of 1984 added another incentive: granting
3 additional years of market exclusivity to drug makers if they perform the extra
clinical trials required to gain over-the-counter approval or if they create new
indications for use (Reynolds, 2002). Even if a drug does not receive the exclusivity
extension, it still may be worthwhile for drug companies to move their products to the

28
OTC market to capitalize on their brand name. In addition, companies can use the
OTC market for these, older drugs, and open the prescription-only market for other
new products they may have in the class, that are still under patent protection.
Table 2.1
Annual Revenues Before and After Patent Expiration and Generic Drug Entry
(Spruill, 2005)
Brand Name Manufacturer
US Sales (pre-
patent expiration)
US Sales (post-
patent expiration)
Year
Expired
Claritin Schering-Plough > $3 Billion $370 Million 2002
Prozac Eli Lilly > $2.9 Billion $480 Million 2001
Pepcid Merck $755 Million $110 Million 2000
Table 2.2
Blockbuster Drugs Facing Patent Expiration (Generic Drugs, 2006)
Brand Name Manufacturer Common Uses Revenues in 2003
(in - billions)
Year of
Expiration
Prevacid TAP GERD, Peptic
Ulcers $3.5 2007
Imitrex Glaxo-
SmithKline
Migraine
Headache $1.1 2007
Zyrtec and
Zyrtec D Pfizer Allergies $1.4 2007
Depakene and
Depakote Abbott Seizures $0.7 2008
Effexor and
Effexor XR Wyeth Depression $2.1 2008
29
Some manufacturers sell their drugs on both the OTC and prescription markets
simultaneously, also known as dual status. According to the FDA, “Dual status is
defined as having the same molecule and the same brand name simultaneously in the
Rx and OTC markets, but with a different strength or indication from one to the
other.” The three year market exclusivity available in the OTC market would still
apply to those drugs with dual status, however, according to the FDA, this status is
still not that well known or practiced by US domestic Rx marketers (CDER, 2006).
While, dual regulatory status could potentially extend the market exclusivity and allow
for utilization of brand recognition, it could also cause companies to spread their
resources too thin over the two markets since competition would exist from both
prescription and OTC drugs (Goldfarb, 2002).
OTC Market
Many patients use OTC drugs as their first attempt at treatment for illnesses.
Some feel that the switch from prescription to OTC status of drugs drives down the
cost of healthcare, especially for insurers since they generally do not cover the cost of
OTC drugs. Almost all OTC medicines can be purchased for well under $20, while
the average price of a prescription drug is closer to $40 (CHPA, 2005).
According to a 2005 AC Nielsen report, in 2004, OTCs accounted for over $15
billion in sales in the U.S. retail market, excluding Wal-Mart. Wal-Mart is excluded
from this figure because of the unavailability of data from the company. In 2001, the
Consumer Healthcare Products Association (CHPA) reports, “More than 700 medicine
products available over-the-counter today use ingredients and dosages that were
available only by prescription less than 30 years ago.” In the same year the CPHA
estimated that there were more than 100,000 OTC products with approximately 1000
active ingredients used in them in the market. In 2003, the CHPA stated, “Since 1976,
30
almost 80 ingredients, dosages, or indications have made the ‘switch’ from
prescription to OTC status” (CHPA, 2005).
From 1976 to 1989, the FDA approved 39 Rx-to-OTC switches and 20
switches just between 1990 and 1996. Some of the switched products during this time
period include Smoking Cessation products, such as Nicorette; Children's Advil,
Children's Motrin, Orudis KT, and Actron all for pain relief; Femstat 3 for treating
vaginal yeast infection; Pepcid AC, Tagamet HB, Zantac 75, and Axid AR for
heartburn; and Rogaine for promoting hair growth (Ling, 2002). Figure 2.2 depicts the
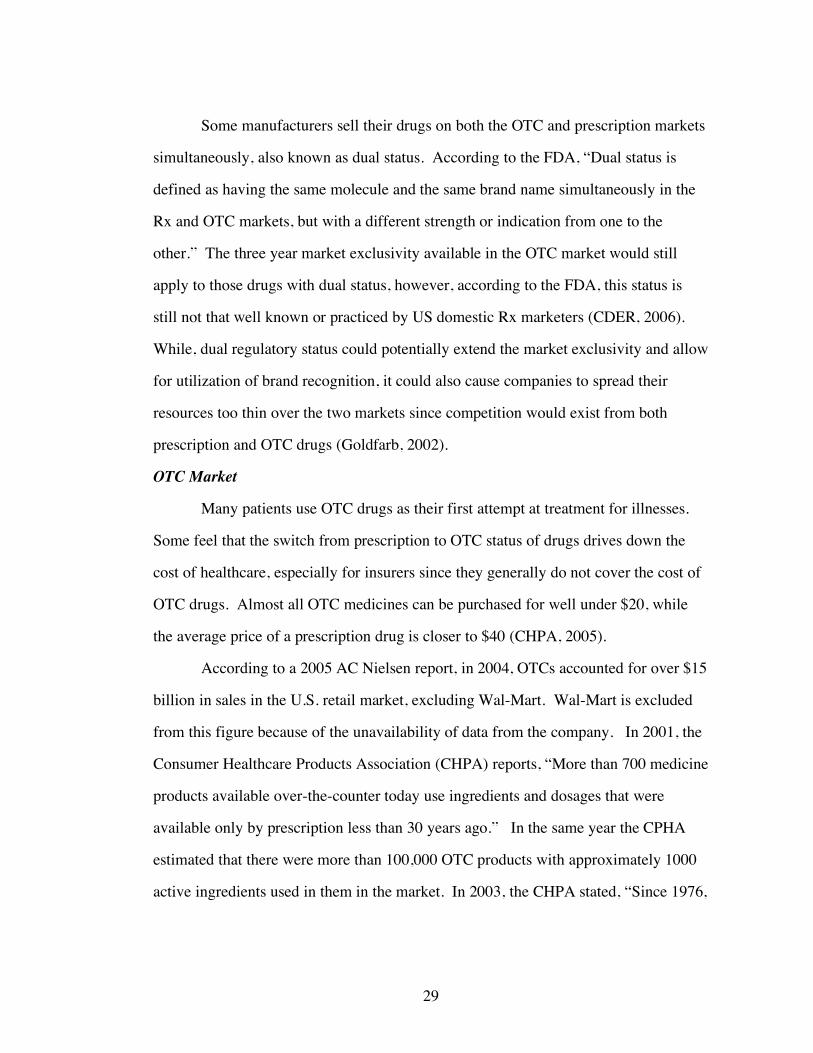
total sales for OTC medications by year.
Figure 2.2
OTC Retail Sales by Year (excluding Wal-Mart) (CHPA, 2006)
The OTC industry, as seen above, accounted for over $18 billion in sales in
1999 at the peak, but continued to have sales well over $12 billion afterwards. This
0
2
4
6
8
10
12
14
16
18
20
1995 1996 1997 1998 1999 2000 2001 2002 2003 2004 2005
Year
Sa
les
Do
lla
rs (
in B
illi
on
s)
31
market, however, is limited to only a few drug categories, as not all are appropriate for
sale without physician approval.
0
500
1000
1500
2000
2500
3000
3500
4000
2002 2003 2004 2005
Year
Sa
les
Do
lla
rs (
in M
illi
on
s)
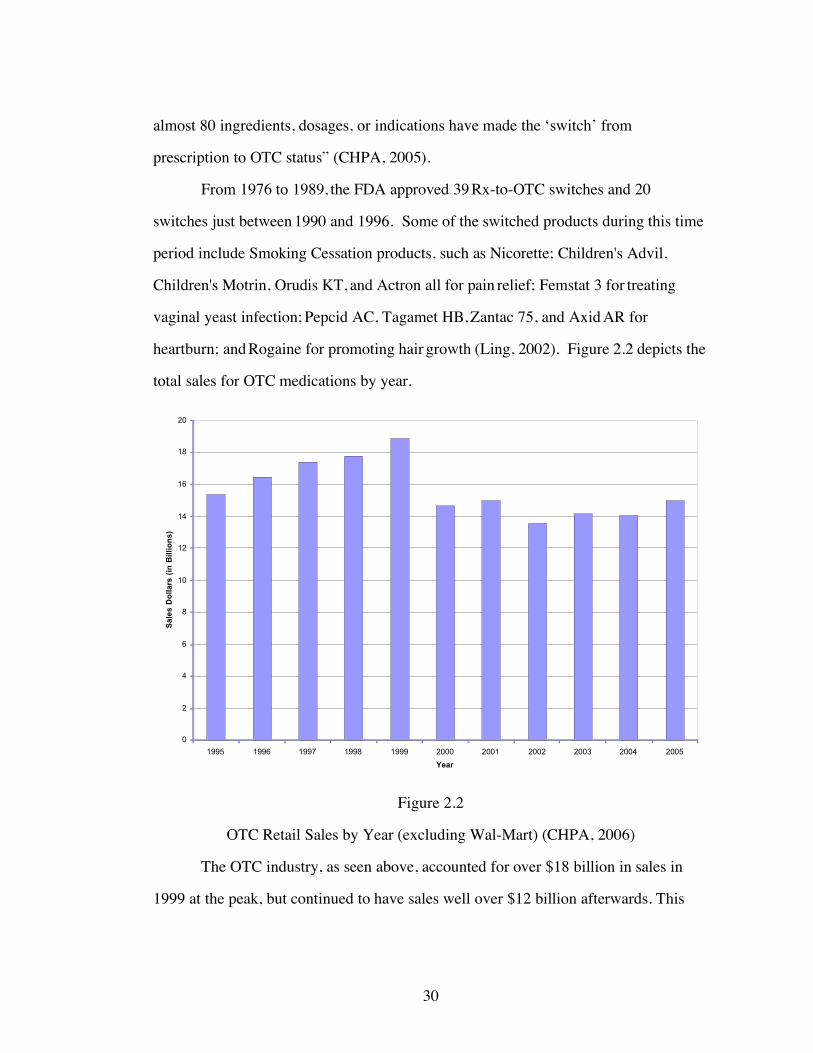
Acne Analgesics (Internal) AntiSmoking Cough/Cold Heartburn Antidiarrheals Laxatives Oral Antiseptic
Figure 2.3
OTC Sales by Category (in Millions) (CHPA, 2006)
Sales are broken down by drug class in the Figure 2.3. As this figure shows,
the cough and cold category had the most sales with a general upward trend from 2002
– 2005 and over $2.5 billion in sales. While sales of OTC healthcare products
continued to be strong in 2004, they were slightly less than that of 2003. The pressures
to recall certain COX-2 prescription painkillers and the ephedra ban deterred many
consumers from buying as many medications. Also, there was a decrease in major
product innovations which constrained the growth of many types of OTC products.
Digestive remedies, medicated skin care, eye care, wound treatments, and other
products, however, continued to increase in 2004 (The-Infoshop, 2005).

32
Key Drug Switches
The December 2002 switch of Schering-Plough Corp’s Claritin (loratadine)
into the OTC market was one of the biggest ever. In this case, the manufacturer was
not the one to lobby the FDA for the switch. Instead, California-based WellPoint
Health Networks, a third-party insurer, requested the FDA to switch the product
because they claimed to spend millions on prescription Claritin annually.
Claritin, a top prescription performer, was the first non-sedating formula in the
OTC market. First generation antihistamines, generally caused drowsiness. The active
ingredient of Claritin, loratadine, is considered a second generation antihistamine, and
has non-sedating properties. The American College of Allergy Asthma and
Immunology (ACAAI) estimates that 44% of allergy patients using OTC products
switch medications because of dissatisfaction with first generation antihistamine
products. Second generation products are, however, more expensive than the first
generation counterparts. Generic diphenhydramine (Benadryl’s active ingredient) or
chlorpheniramine (ChlorTrimeton’s active ingredient) cost $3 to $4 for 24-30 tablets,
whereas the same number of Claritin tablets, in the OTC market, can cost a patient
between $18 - $19.
Schering-Plough was denied the 3 year Hatch Waxman exclusivity period
because of the company’s delays and lack of planning. Therefore, Claritin was soon
followed to the OTC market by competitors. Wyeth Consumer Healthcare’s
loratadine product, Alavert, is on store shelves and has a suggested retail price of $27
for a 48 count package (www.drugstore.com). The OTC sales of Claritin have been
successful with first year sales totaling nearly $400 million and a market share of 50%
in the allergy market.
Prilosec, the world’s most prescribed drug from 1996 – 2000, was also a major
switch into the OTC market. H2Antagonists such as Zantac and Tagamet were the

33
antacid products in the OTC market, while the more effective proton pump inhibitors
(PPIs) were available by prescription only. The mechanism of PPIs is different from
earlier products in that they work by shutting down proton pumps in the stomach that
produce acid. Prilosec was the first of the PPIs to switch to the OTC market.
A licensing agreement between Astra-Zeneca and Proctor & Gamble was
created and the two companies conducted the switch of Prilosec jointly. A great deal
of debate took place between these companies and the FDA regarding claims, usage,
and the risk for more serious conditions, such as ulcers and gastroesophageal reflux
disease to go undiagnosed. After collaboration between the two sides, however,
Prilosec was approved for OTC sales in June 2003. Prilosec was also given the 3 year
Hatch Waxman market exclusivity and the first year of OTC sales were nearly $300
million (Mahecha, 2006). This extension applies only to the drug moving into the
OTC market. All other drugs, under the same name, that have not switched markets,
are not granted this period of exclusivity.
In the cases of both Claritin and Prilosec, the parent pharmaceutical company
had new prescription-only products ready to be launched at the same time as the
switch of the older drugs into the OTC market. Both companies shifted their
advertising expenses towards the promotion of their newer medications in order to
move patients from the older drug to the new one. In the case of Claritin, Schering-
Plough attempted to convert patients from using Claritin to their new prescription
product Clarinex. Astra-Zeneca had the newer PPI, Nexium, ready to take over the
prescription market once Prilosec became OTC. Schering-Plough was not as
successful at moving patients to the newer medication because neither patients nor
physicians found any major differences between Clarinex and the over the counter
Claritin. Astra-Zeneca was, however, more successful at moving patients to Nexium.
In fact, in Prilosec’s first advertising campaign the drug became known as the “purple

34
pill”. After Prilosec’s movement to the OTC market, Astra-Zeneca referred to
Nexium as the “new purple pill” symbolizing the replacement on the prescription only
market.
Areas of Debate
There are three classes of drugs in which there is much debate as to whether or
not OTC status should be approved. Emergency Contraception was the major topic of
debate in June 2000, when the FDA had to decide whether to sell emergency
contraceptives over the counter. Women's-health advocates said that the move is
overdue since the drug was available without prescription in the United Kingdom and
Canada. Opponents, however, argue that over-the-counter emergency contraception
could discourage use of conventional birth control methods. The FDA has just
recently approved the OTC status of this drug, with some restrictions. Emergency
contraception will only be available to those individuals 18 years or older. Also, the
drug will not be stocked on store shelves, but rather behind pharmacy counters.
Antimicrobials were denied OTC status in December 1998 largely because of
fears of antiviral resistance. While there were no major concerns for individual safety,
The Infectious Disease Drug Committee indicated that it would not support the over-
the-counter availability of antimicrobials because of the serious threat of antibiotic
resistance.
Statins, used to lower cholesterol levels, were also denied OTC status. The
FDA issued a guideline stating that lowering of cholesterol levels is not an appropriate
indication for over-the-counter approval because physician monitoring is required.
Most OTC products are for conditions that patients can generally detect easily.
Hypercholesterolemia, however, may not be a condition patients can diagnose on their
own, and therefore require physician supervision. Concern existed in regards to the
OTC sale of these drugs because of the possibility of improper use. That is, those

35
individuals that do not need to lower their cholesterol may take these drugs
unnecessarily. In addition, these medications are not recommended for use by women
who are pregnant. The availability of statins on the OTC market would create the risk
that women who were unaware of their pregnancy may take the drug and potentially
harm themselves or their babies.
36
CHAPTER 3
PREVIOUS LITERATURE
This study examines how both patients and physicians react to a change in
prescription status of a drug. The first section of this chapter examines physician
incentives, generally, not related to prescribing behavior, but to other physician
decisions. The second part of this chapter examines the impact of incentives on
physician prescribing behavior. The research to date that has focused on prescribing
behavior utilizes the standard principal agent model. In terms of the research done
here, such a model would indicate that the physician’s choice of a drug for a patient’s
ailment should not be influenced by simple its OTC versus Rx status, but rather the
effectiveness of the medication for the patient. The third section examines the
literature comparing the use of prescription and OTC drugs.
The model in this study also predicts that patient will also react to the
availability of an OTC medication. That is, those patients with less severe conditions
should choose to self-treat, leaving only those with more severe illnesses in physician
offices. The final section of this chapter examines how severity has been measured in
previous studies.
Physician Incentives
Barros et al (2003) create a model to test hospital production in which they
define the output produced by the hospital as the health status of the patient. These
authors also use physicians as the major decision makers of resource allocation. The
hospital based physician must balance decisions between acting as a perfect agent for
the patient and as an agent for the hospital, whose objective is to restrain hospital
spending. Their model contains the utility functions of physicians and uses the
expected health status of patients, resource allocation, and hospital financing policy as
arguments. Their evidence shows that for physicians employed by hospitals, budget

37
setting methods and possession of third party payers are important predictors of
resource use. Also, the authors conclude that resource use is important in predicting
the final health status of the patient.
Both Glied et al (2002) and Melichar (2007) examine the effect of financial
incentives on physician behavior, with respect to the amount of time a physician
spends with a patient. Glied et al use the NAMCS to investigate the effect of managed
care on physician time spent with the patient, while Melichar distinguishes between
managed care and capitation. Glied et al find a negative relationship between the
percent of patients under HMOs seen by a physician and the average length of time
that physician spends with a patient. These authors do find an increased use of other
services during a visit when there are a greater percentage of managed care patients in
a practice. This may indicate that physicians, who have a higher number of managed
care patients, substitute other services for length of visit time. Melichar, however,
finds that it is capitation, and not just HMO status, that affects the amount of time
physicians spend with patients.
Physician Prescribing Behavior
The theoretical framework used in this study models physician behavior as
resulting from an objective function in which fee-for-service physicians have the
incentive to provide prescriptions in order to increase the number of repeat patient
visits which thereby increases physician profit. The model developed here also
indicates that capitated physicians can maximize profits by providing OTC
medications in order to minimize resource use.
Prescribing incentives are modeled as the outcome of a production function.
The hypotheses drawn from this are tested by regressions in which indicators for
providing a prescription are dependent on patient characteristics, insurance status, and
the availability of an OTC drug for a particular diagnosis.

38
Bradford et al (2004) used a similar model in studying the impact of direct-to-
consumer advertising on physician prescribing behavior. Their output measure was
the number of prescriptions for COX-2 inhibitors (used for treatment of osteoarthritis).
The authors used the flow of patients with osteoarthritis as an input to capture the
patient demand function for office visits. Patient demand, as explained by the authors,
is influenced by the price of office visits, patient characteristics and the exposure to
advertising. This study found that direct-to-consumer advertising of certain drugs
increase prescriptions for that drug as well as others.
In another study of prescribing behavior, Iizuka (2004) examines physician-
patient agency in the prescription drug market of Japan. Doctors in Japan provide
diagnostic services to patients and dispense drugs as well. This creates an incentive to
induce demand since doctors can choose drugs based on the extent of profit they
obtain, rather than safety or cost. The data used in this paper indicate that physicians’
choices for drugs are significantly affected by the profit margin they earn.
In a 1998 paper on prescribing behavior, Stern and Trajtenberg use the theory
of physician agency to examine the implications of physician authority in
pharmaceutical prescribing decisions. According to their article physicians’ expertise
in prescribing relies on two assets: diagnostic skills and information about drugs. The
authors define concentration of prescribing behavior as the degree of variation in
drugs that physicians use. That is, those physicians that use a wide range of drugs or
vary their choice of drugs by patient, for a particular illness, are not very concentrated.
Those that choose their prescriptions amongst the same few medications, for most of
their patients, are considered to have a concentrated portfolio of drugs. They find
substantial variation in the degree to which physician prescribing is concentrated and
this concentration is correlated with observable drug characteristics. These authors
use the NAMCS survey to find that physicians who are concentrated in their
39
prescribing portfolio tend to prescribe those drugs with high levels of advertising, low
prices, and high market shares. These features allow highly concentrated physicians
to invest the minimum required resources to provide care for patients with the least
overall harm.
Hellerstein, in her 1998 article, studied how physicians decide to give patients
either generic or trade-name drugs. She specifically tests whether or not physicians
are more likely to give generic drugs, because they are less expensive, to those
patients without drug coverage. The author explains that if there were no costs to
physicians for prescribing drugs, physicians would act as perfect agents for patients.
There are, however, costs to the physician such as the time cost of learning about new
drugs. Therefore, physicians may choose a prescription based on what is more
convenient for them, rather than what is best for the patient. This paper utilizes the
1989 NAMCS survey. While the author does find that physicians are important agents
in the prescription decision, she is unable to decipher why some physicians are more
likely to give generics than others. The only statistically significant finding regarding
insurance in this paper showed that physicians with a large proportion of HMO
patients are more likely to give out generic prescriptions. As the author explains, this
may be due to cost control methods implemented by managed care companies which
make physicians somewhat financially responsible for their prescribing decisions. The
author concludes that it is not the individual patient’s insurance type that determines
the physician’s prescribing behavior, but rather the distribution of insurance types
across all patients that the physician sees.
There are many studies that focus on how managed care influences
prescription choices amongst physicians. In general, the majority of the studies that
explore issues with managed care and prescribing behavior focus on the decision
between brand name drugs and generics. The following articles, examine the financial

40
incentives of physicians to some extent, but they either look at a drug category as a
whole, when one product in it moves to the OTC market or they examine the financial
incentives of the patient and the physician in general prescribing, without examining a
specific drug class.
Managed Care Incentives
Hillman et al (1999) estimated the impact of patient financial incentives on the
use of prescription drugs while physicians had differing payment mechanisms. The
study included some physicians who were compensated fee-for-service through the
Independent Practice Association (IPA) model, while others were reimbursed by
capitation under network-model Health Maintenance Organizations (HMO). Under
IPAs physicians did not bear financial risk for medications, whereas with HMOs
physicians did bear risk for their prescribing decisions. The results from this study
show that higher patient copayments for prescription drugs are associated with lower
drug spending in models in which physicians are not at risk for drug costs. Higher
copays for patients do not, however, have much effect in models where physicians
bear some financial risk for prescribing behavior. A limitation of this study is that it
uses claims data and therefore the authors are not able to determine what the physician
prescribed and how this may have differed from what was actually provided in the
pharmacy. This is especially important since some plans and some states allow the
pharmacist to fill the prescription with the lowest cost drug. If this is the case, the
effect of financial incentives for the physician may be ambiguous.
Mortimer (1998) used the NAMCS from 1991 – 1993 and marketing data from
IMS America to determine the demand characteristics of prescription drugs and how
they are influenced by types of insurance. The author uses two therapeutic markets:
antidepressants and beta blockers; and creates a mixed logit model that estimates the
probability of a drug being prescribed. The explanatory variables in this paper include

41
drug characteristics; patient and physician characteristics; and average drug price. The
main explanatory variable used here, however, is the interaction of drug price and
insurance type, such as HMO, Medicaid, or Private Insurance. The author finds that
managed care is effective in increasing a physician’s awareness of drug costs. The
results of this paper show that demand for drugs in managed care sectors is more price
elastic than in other sectors. Interestingly, this author finds demand in the self-paid
sector to be the least price elastic.
Prescription to OTC Switch
The following studies examine changes, once a drug moves from the
prescription to the OTC market. While this literature is helpful in guiding the
hypotheses of this study, little research thus far has examined how physician
prescribing behavior is affected by OTC switches. In fact, even amongst most of those
studies in which prescription and OTC drug use is analyzed, the markets for the two
sets of drugs were different than what is being studied here. Previously, OTC and
prescription drugs were not considered as substitutes for one another, as the
prescription drugs were always stronger. This study adds to the literature by being
able to utilize the unique situation in which equivalent drugs exist on the prescription
and OTC market simultaneously. In the research here Claritin and Prilosec attained
OTC status while therapeutic equivalents remained Rx only.
Andrade et al (1999) indicate that in the setting of managed care organizations,
there were reductions in the prescriptions for H2 receptor antagonists given to patients
with chronic conditions after the availability of some OTC versions of these products.
This suggests that physicians are under certain pressures in a MC setting to alter
prescribing behavior when drugs go OTC. It was during this time, though, that Proton
Pump Inhibitors entered the market, and therefore the study may fail to capture the
movement physicians made to the newer, more effective drugs. Since this study

42
looked only at managed care and did not compare to FFS, the two effects are possibly
confounded.
In her 1989 article titled “Substitution Between Prescribed and Over-the-
Counter Medications” Leibowitz became one of the first to research OTC use in an
experimental setting. Leibowitz used data from the Rand Health Insurance
Experiment in which patients were assigned to health insurance plans with varied
levels of medical cost sharing. The experimental design allowed the author to not only
examine patients with different relative out-of-pocket payments for prescription drugs
compared to OTCs, but she also was able to study areas in which access to physicians
services were varied. This article hypothesizes, as do others described later, that OTC
drugs may be used as a substitute for prescription drugs and/or a substitute to formal
medical care, i.e. physician office visits. With the data from this experiment,
Leibowitz hypothesized that those with less generous health care plans, that is, those
plans that required higher out-of-pocket copays, would substitute OTC medications
for prescription ones. Also, the author hypothesized that OTC drugs would be a
substitute for physician office visits for those that did not have convenient access to
physicians, as well as for those with high wages, in order to spend their time at work,
rather than at a physician office. Similarly, when medical care is less available, for
example with uninsured patients, OTC drugs should be used as substitutes as well.
An interesting finding of this article was that there were infrequent purchases
of OTC drugs overall: on average less than one purchase per-person per-year. The
author suggests that this may be consistent with high levels of OTC use if these drugs
are purchased in large quantities and stored for later use. In terms of health insurance
difference, Leibowitz found that with drug coverage, participants purchased more
prescription and over-the-counter medications. Those patients facing cost sharing
purchased fewer OTC drugs than those in the free plan. Females, children, and those

43
patients with more education were more likely to buy OTC drugs. In general, this
study found no evidence of substitution between OTC and prescription drugs. While
this article is an important one because of its key experimental design, it was also
conducted in a time where the drugs available by prescription were generally not in
competition with those available OTC. Prescription drugs were stronger and more
effective than the OTC products. Since 2002, however, the situation in some drug
markets has changed considerably. The availability of equivalent drugs on the
prescription and OTC market could potentially lead to a different result if this study
were conducted today.
Hollenbeak in his 1999 Health Affairs article used a game theory model to
determine the optimal time, in relation to generic competition, to switch a drug from
the prescription to OTC market. He determines that switching of drugs occur if the
probability that an application will be approved by the FDA is strictly positive and the
OTC market is characterized by first-mover advantages. He shows that firms switch
their products into the OTC market in response to the threat of generic competition
when patents are close to expiration. Pharmaceutical firms know that if they do not
switch into the OTC market first, the generic may initiate the switch and become the
first mover.
Harrington (2002) found that the conversion of prescription products to OTC
availability can have an impact on prescription drug benefit costs and on total health
care costs. According to Harrington, in 2000, the U.S. was estimated to spend $19.1
billion on OTC drugs expanding from $10.2 billion in 1991. While approximately
600 of the currently available OTC products were available only by prescription 20
years ago, less than 2 cents of every dollar spent annually on health care in the U.S is
spent on OTC drugs. Harrington also estimates that almost $13 billion a year is saved
by consumers when they use medications switched from prescription only to OTC

44
status. Furthermore, she finds that, 63% of total U.S. OTC sales in 1996 were from
prescription to OTC switched products. She illustrates that for those patients with
drug coverage, out-of-pocket payments for prescription drugs were less than the prices
for OTC products. She also found that OTC approval was associated with elevated
medical service use.
In their 2002 review of literature, Shih et al proposed that according to
economic theory a firm that is protected by a patent will price aggressively in the OTC
market. The OTC markets will likely be more elastic, however, due to a lack of
insurance coverage. Therefore, drug manufacturers would be likely to charge a lower
price in the OTC market.
In his 1992 article, Temin analyzed data from the cough and cold drug market
and hypothesized that once a drug in this category moves to OTC, the number of
people seeing physicians for the common cold should decrease since they can self
medicate. In fact, even those that have more serious conditions will be able to ease
some of their symptoms by using more readily available medications, and will
therefore delay any trips to the physician’s office. On average, Temin found that
physician visits for the common cold fell by 110,000 a year and he estimated the
savings plus the consumer surplus from this to be $770 million.
Shiffman et al (1997) tried to estimate the impact of allowing nonprescription
sales of nicotine replacement therapies in the U.S. using sales and marketing data
before and after the OTC switch of these products. These authors found that since
1996, when the sale of nicotine medications went to the OTC market, utilization of
these products increased by 152% compared to when these medications were available
by prescription only. They find that the increased availability of nicotine medications
have significantly increased the number of former smokers.

45
Thorndike et al (2002) also examined whether or not the change in nicotine
replacement therapy sales to the OTC market, from prescription only status, affected
smoking cessation. These authors found no significant change over time in the
proportion of smokers who used nicotine replacement therapy. They did, however,
find racial and ethnic differences in the use of these products in the OTC market.
According to these results, fewer non-Whites used nicotine replacement therapy after
the switch to OTC, while the proportion of Whites using these products did not change
significantly. They therefore concluded that there appear to be other barriers to the
use of nicotine replacement products besides access to a physician among minority
smokers.
Many other papers have looked at the impact of switching drugs from
prescription only to OTC status in specific product markets. Temin also examined the
hydrocortisone market in 1983 and found that the switch of these drugs increased
consumer surplus in the years immediately after the switch. Gurwtiz et al (1995)
examined the vaginal antifungal agent market and found that the number of
prescriptions fell by 6.42% creating an annual savings of $42,528 in medication costs.
These authors did not find any significant change in the number of physician visits.
Lipsky and Waters (1999) also researched the vaginal antifungal product
market and found that the use of these agents have increased since their conversion
into the OTC market. According to this article, sales of these agents were about 13.7
million units per year as prescription products and jumped to more than 25 million
units per year once the agents started moving into the OTC market. These authors list
patient autonomy and reduced health care costs as advantages of the switch of drugs
from prescription to OTC status. The authors include the potential for unnecessary use
of the agents as well as the development of resistant strains of bacteria causing
infections as disadvantages of the switch of products into the OTC market.

46
Kalish et al (1997) found negligible differences in health care costs between
Rx and OTC drugs for treatment in initial episodes of dyspepsia or acid reflux when
examining the market for H2 receptor antagonists. Andrade et al (1999) did find an
annual savings of $187,212 for managed care plans in medications costs for chronic
treatment of dyspepsia when looking at the same market in 1999. These authors found
a decrease in the number of prescriptions by 1.5 prescriptions per chronic user after
the OTC products were introduced and they did not find significant changes in the
number of physician visits.
Ling et al (2002) examined the impact of direct-to-consumer advertising and
physician oriented marketing on the sales of prescription and OTC versions of
antiulcer medications. These authors find spillover effects of marketing for Rx drugs
on same brand OTC versions. They also find that marketing intensity increases with
order of entry in the OTC market and that demand elasticities are dependant on order
of entry. Ling et el also mention that since OTC products are primarily “experience”
rather than “search” goods, brand loyalty is strong, and therefore, perceived switching
costs may be high.
Patient Severity
The theoretical model of this study predicts that the severity of patients in
physician offices should decline after the availability of an OTC medication. This is
because those patients with less severe symptoms should be able to successfully self-
treat with the OTC. Since these patients drop out of the sample in physician offices,
the overall case mix of patients should become more severe. Severity is a difficult
characteristic to measure without knowing the exact nature of the illness, other
problems the patient may be having, tests results, and other specifics about the patient.
Nonetheless, other researchers have tried to measure severity using indirect methods.
47
Severity can be defined differently depending on the discipline of the
healthcare provider. Physicians for example may categorize severity based on the
impact a disease has on physiology, while a therapist may instead use functionality or
activities of daily living to determine the severity of an illness. There are three
components that are most used in the measurement of severity, including:
1. Functional ability of individual to conduct daily activities of living.
2. Cost to society
3. Physiologic, morphologic, and biologic derangements
Many computerized programs have been developed in an effort to standardize
severity measurement. Some of these programs include Acute Physiology and
Chronic Health Organization System, the Computerized Severity Index, Disease
Staging, MedisGroups, and Patient Management Categories. The basis for all of these
programs is either physiology or resource use (Petryshen et al, 1995).
Many of these measures calculate severity based on the likelihood of a death
for patients already admitted to hospitals. MedisGroups uses clinical data to predict
the probability of an in-hospital death and creates a score based on sixty-four disease
groups. Physiology scores also calculate severity using clinical data, but for patients
in intensive care units. Disease stating, another measure, predicts the probability of an
in-hospital death using the discharge summary. Finally, All Patient Refined Diagnosis
Related Groups utilizes patient discharge summaries as well, but to estimate total
hospital charges, rather than the probability of death (Iezonni, 1995).
While Rice (2004) examines the differences in quality of care between
managed care and fee-for-service physicians, she also examines the intensity of
treatment provided by the physician. It is assumed here that greater treatment
intensity is needed for patients with more severe symptoms. A similar model is
therefore used here to assess changes in patient case mix after the availability of an
48
OTC. Rice analyzes the NAMCS data for 1997 – 2000 and uses five instruments to
measure the intensity of treatment including: consultation length (measured in
minutes of physician and patient contact time); number of physical exams; number of
tests; number of imaging procedures; and prescriptions ordered. The author finds that,
compared to FFS physicians, those physicians under managed care spent less time
with their patients, ordered fewer physical exams, and prescribed fewer medications,
but they also ordered more tests and imaging procedures. She finds that overall FFS
physicians provided slightly more intense treatment. Rice distinguishes between
acute, chronic routine, and chronic flare-up patients, and determines that acute are the
least severe, while chronic patients have a higher severity of illness.
Hillman et al (1999), as described earlier, study the impact of patient financial
incentives on the use of prescription drugs given varying physician payment
mechanisms. In their research, the authors adjust for patient case-mix by using
Chronic Disease Scores (CDS). The authors compare the use of Ambulatory Care
Groups (ACGs) and CDS and found that CDS was more appropriate. ACGs use
ambulatory visit diagnoses while CDS uses drug categories to identify comorbidities.
The authors chose CDS because it explained more variation in drug spending for their
data. CDS is also based on filled prescriptions indicating that the physician and the
patient both felt that the illness was serious enough to treat with medication. In
addition, CDS identifies comorbid conditions in those patients without ambulatory
visits since patients can fill prescriptions without actually seeing a provider. While the
data used here does not allow for this level of analysis of prescriptions, the article
provides insight on how case-mix can be measured.
Glied et al (2002) also examine treatment intensities in their work studying the
effects of managed care on physician behavior. Similar to the model used by Rice
(2004), these authors use four measures for treatment intensity including: length of

49
visit; number of tests ordered; number of medications ordered; and whether a return
visit was scheduled by the physician. Using the NAMCS 1993 – 1996, the authors
find that on an individual level, patients under managed care receive less intense
treatment as compared to FFS.

50
CHAPTER 4
THEORETICAL MODEL
The following theoretical model is used to draw testable implications about
how physicians’ prescribing behavior reacts to the movement of prescription
medication to the over the counter market. The interactions of three main players in
the health care industry are modeled, including: patients, insurance companies, and
physicians to anticipate physician prescription behavior under two different
reimbursement schemes.
Patients
In this model, patients seek care, advice and prescription authorization from
physicians. There are two main types of patients; Type I has an illness and sees a
physician for consultation, advice, and treatment. Type II also has an illness, but it
may have just occurred recently and may be short term. These patients would have
otherwise needed to see a physician, but after the availability of an OTC, they can
choose to self-treat rather than spend the time or money on a physician office visit.
When a drug moves from prescription to over-the-counter status, Type II no longer has
to see the physician. Since Type II patients may have conditions that are temporary,
they can bypass the physician and self treat using the OTC market. Let θ represent
patient severity and assume that (θ)I > (θ)II since Type I requires physician expertise
for diagnosis. The severity of Type I patients is also higher because their illnesses are
likely to be long term, requiring lengthier periods for treatment and a greater use of
resources. In addition, it is possible that Type I patients are also likely to have co-
morbid conditions, making diagnosis more difficult. Patients with more comorbidities
or those with symptoms that are more difficult to diagnose may require a greater
number of health care resources for diagnosis since their conditions may point to
multiple illnesses. Some Type I patients may have initially tried to self-treat with

51
OTC medication, but were unsuccessful. For these patients, their conditions could
have been complex or severe enough such that OTCs did not work; or they may have
misdiagnosed their conditions because of other co-morbidities. After a drug moves to
OTC status, the probability that Type II patients will see the physician is 0 since they
can now self-treat. Therefore only Type I is seen in physician offices and this shifts
the distribution for the severity of cases seen in physician offices towards the right
once a drug moves OTC, a testable hypothesis.
Given the above assumptions, the movement of a drug to the OTC market
creates an efficient sorting system for the health care industry. Since those patients
with less severe conditions should self-treat, only those patients that need to see
physicians should actually make office visits. This system can eliminate unnecessary
physician visits, thereby reducing the cost of care. If all patients use OTC medications
as their first method of treatment, those with less severe conditions are successfully
treated with these drugs, while those with more severe conditions can later see a
physician. In addition, the patients with more severe conditions could at least
accomplish a temporary relief of symptoms until they can directly see their health care
providers.
Insurance Companies
Insurance companies are profit maximizing entities. Physician prescribing
behavior enters the per patient profit function for fee for service contracts as follows:
πi = P – C(q)
where P is the premium revenue and C is the cost of treatment, which is a function of
the amount of medical services consumed, q. In this case, only the use of medications
as consumed medical services is considered, thus:
q = z
where z = the number of medications used. z is defined as:

52
z = p + otc
where p is the total number of prescription medications and otc is the total number of
OTC medications. Thus, C(z) is the cost of medications; C(p) is the cost of
prescription medications and C(otc) is the cost of over the counter medications.
Therefore per patient profits are equal to:
πi = P – C(p) – C(otc)
It is assumed that C(otc) = 0 since insurance companies do not cover OTC drugs,
which gives us per patient profits as:
πi = P – C(p)
Some insurance companies create contracts with physicians to align their
incentives with those of the company by giving only fixed payments per patient per
year. This puts the physician at financial risk for all care provided. In these, most
extreme cases of capitation, the profit function per patient for the insurance company
is:
πi = P – a
where a is the capitated fixed payment per patient. This remains unchanged regardless
of whether a prescription or OTC drug is provided since the payment made to the
physician is always a. The incentives of the insurance company will enter into
understanding physician prescribing behavior in the next section.
Physicians
The physician market is different from any other type of business in a number
of important ways. For example, while physicians have financial incentives to
maximize profits, they are also concerned for their patients’ health. Third party payers
set prices and try to influence treatment decisions, but yet physicians are able to
induce their own demand to a certain extent because of the asymmetry of knowledge
between the physician, patient, and third party payer.
53
It is assumed that the only care provided by physicians is that of providing
medications. Here, physicians are thought to be interested both in their own profits,
πpz, and the benefits to patients, Bz. Where z is the proportion of medications given to
patients and is normalized to 1.
The physician maximizes the following utility function:
Max U[πp(z), B(z)]
assuming:
z = ∑ (x + (1-x))
where x = fraction of OTC drugs and 1-x = fraction of prescription drugs
As agents for their patients, and because they are bound by their ethical code,
physicians typically care about patients and their welfare. In addition, physicians can
maximize their own profits when they perform well and create good reputations. This
then affects the number of new patients coming in for office visits, the loyalty of
established patients, as well as the number of referrals from other colleagues, all of
which directly impact physician profits.
The balance between health care utilization and physician profits depends on
the reimbursement arrangement between the physician and the insurance company.
With Fee-For-Service arrangements, profits are maximized when maximum health
services are provided. Under capitation, however, the minimization of resources leads
to profit maximization.
A physician’s profits per patient visit, assuming Fee-for-Service, are given by:
πpz = Rz – Cz
where Rz is revenue per patient visit and Cz is the time cost of providing medications
per patient visit. Since no financial burden is placed on the physician for either
prescription or OTC drugs other than the time cost of seeing the patient, the equations
for both prescription and OTC medications are the same.
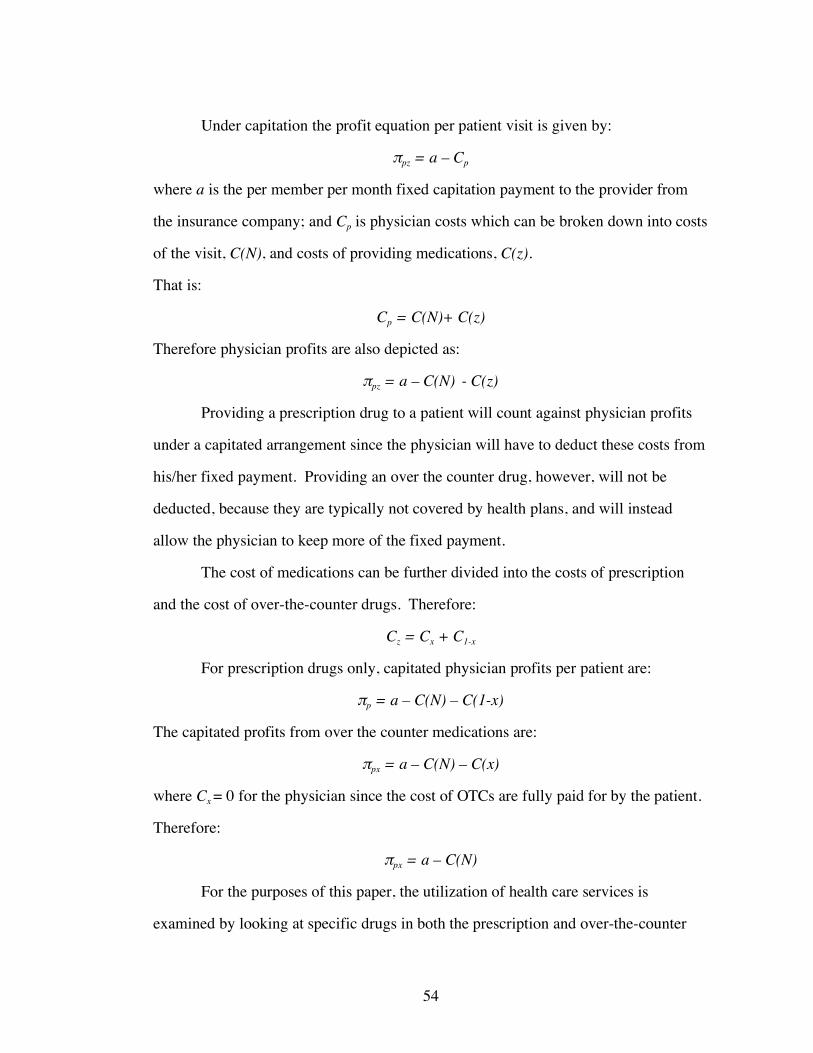
54
Under capitation the profit equation per patient visit is given by:
πpz = a – Cp
where a is the per member per month fixed capitation payment to the provider from
the insurance company; and Cp is physician costs which can be broken down into costs
of the visit, C(N), and costs of providing medications, C(z).
That is:
Cp = C(N)+ C(z)
Therefore physician profits are also depicted as:
πpz = a – C(N) - C(z)
Providing a prescription drug to a patient will count against physician profits
under a capitated arrangement since the physician will have to deduct these costs from
his/her fixed payment. Providing an over the counter drug, however, will not be
deducted, because they are typically not covered by health plans, and will instead
allow the physician to keep more of the fixed payment.
The cost of medications can be further divided into the costs of prescription
and the cost of over-the-counter drugs. Therefore:
Cz = Cx + C1-x
For prescription drugs only, capitated physician profits per patient are:
πp = a – C(N) – C(1-x)
The capitated profits from over the counter medications are:
πpx = a – C(N) – C(x)
where Cx = 0 for the physician since the cost of OTCs are fully paid for by the patient.
Therefore:
πpx = a – C(N)
For the purposes of this paper, the utilization of health care services is
examined by looking at specific drugs in both the prescription and over-the-counter
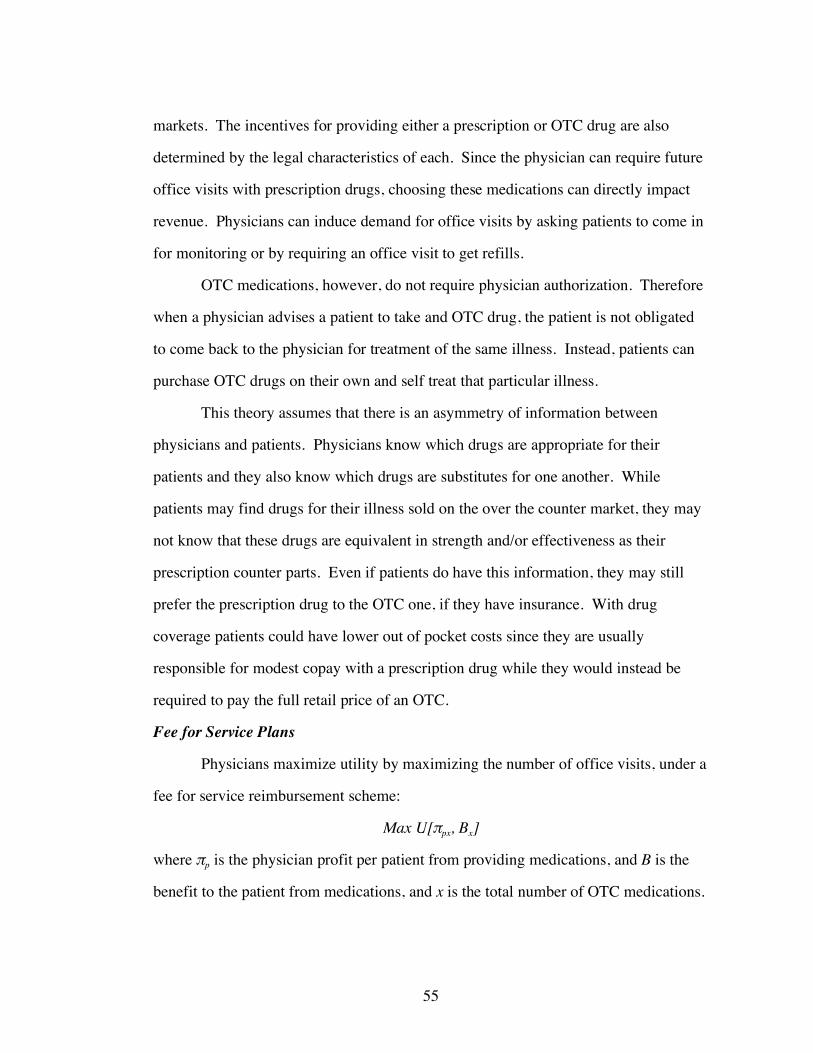
55
markets. The incentives for providing either a prescription or OTC drug are also
determined by the legal characteristics of each. Since the physician can require future
office visits with prescription drugs, choosing these medications can directly impact
revenue. Physicians can induce demand for office visits by asking patients to come in
for monitoring or by requiring an office visit to get refills.
OTC medications, however, do not require physician authorization. Therefore
when a physician advises a patient to take and OTC drug, the patient is not obligated
to come back to the physician for treatment of the same illness. Instead, patients can
purchase OTC drugs on their own and self treat that particular illness.
This theory assumes that there is an asymmetry of information between
physicians and patients. Physicians know which drugs are appropriate for their
patients and they also know which drugs are substitutes for one another. While
patients may find drugs for their illness sold on the over the counter market, they may
not know that these drugs are equivalent in strength and/or effectiveness as their
prescription counter parts. Even if patients do have this information, they may still
prefer the prescription drug to the OTC one, if they have insurance. With drug
coverage patients could have lower out of pocket costs since they are usually
responsible for modest copay with a prescription drug while they would instead be
required to pay the full retail price of an OTC.
Fee for Service Plans
Physicians maximize utility by maximizing the number of office visits, under a
fee for service reimbursement scheme:
Max U[πpx, Bx]
where πp is the physician profit per patient from providing medications, and B is the
benefit to the patient from medications, and x is the total number of OTC medications.

56
Physician profits per patient are determined by the revenues, R, per patient
visit minus the cost of per patient visit, C, times the total number of office visits, N.
As a physician provides more OTC drugs the likelihood for further visits is less since
the patient does not have to come in for refill visits. In addition, the physician does
not have to induce further visits in order to monitor the patient for adverse effects of
the prescription drug. Therefore, assuming
where N is the number of office visits and x is the proportion of OTC medications
provided:
N = f( x-1)
dN = - f’(x-2) dx
assuming f’( 1/ x2) > 0
The above equations prove N and x to be inversely related. Therefore, as a
physician provides more OTC medications, there should be a decrease in patient visits.
The profits for a FFS physician are as follows:
πp = N[R – C]
where, again, the number of patient visits, N; R is the amount of revenues from a visit,
and C is the cost of a visit. The derivative with respect to N is:
πp = N[R – C]
δπp = [R – C] δ N
!"
#$%
&=
xfN1
!"
#$%
&'(=2
1
xf
dx
dN
0!dx
dN

57
assuming [R – C] > 0
As expected, the above equations show that physician profits and patient visits
are positively related. That is, as a FFS physician has more patient visits, s/he should
expect more profits.
Claim 1:
For FFS physicians:
For all patients, the FFS physician is more likely to provide a prescription drug
in order to bring that patient back into the office and generate more revenue. Also,
many insured patients have drug coverage in their insurance plans and not only prefer
prescription medications, but expect them. By providing a prescription, physicians
can satisfy their patients, who may then refer their friends and family to this physician,
again to generate more revenue. Therefore, assuming:
and thereby:
The following can be modeled:
πp = N[R – C]
[ ] dxx
fCRd p !!"
#$$%
&!"
#$%
&'((=2
1)
[ ] !!"
#$$%
&!"
#$%
&'((=
2
1
xfCR
dx
d p)
[ ]CRdN
d p!=
"
0!dN
d p"
0!dx
d p"
!"
#$%
&=
xfN1
0!dx
dN
[ ]CRx
fp !"#
$%&
'=
1(

58
assuming [R - C] > 0 (With zero fixed costs and zero economies of scale.)
Therefore, as a FFS physician provides more OTC drugs, s/he can expect
fewer patient visits which will lead to fewer physician profits as well. It can,
therefore, be understood that a FFS physician stands to maximize profits, by providing
patients with prescription drugs, rather than OTC.
Capitated Plans
Physicians under capitation similarly maximize their utility function:
Max U[πp(x), B(x)]
Physician profits for the capitated physician are the fixed capitated payment, a, minus
the cost of office visits, minus the total cost of prescription drugs. The cost of
providing OTC drugs is zero, as described earlier, and is therefore not included in the
following equation.
πp = a – C(N) - C(1–x)
where a is the capitated payment and (1-x) is the proportion of prescription drugs;
When deriving the profit function with respect to N the equation is:
πp = a – C(N) - C(1–x)
δπp =(-C )( δN)
assuming C >0
Incentives under capitation are to minimize utilization of resources. Therefore,
an increasing number of office visits leads to decreasing physician profits.
0!dx
d p"
CdN
d p!=
"
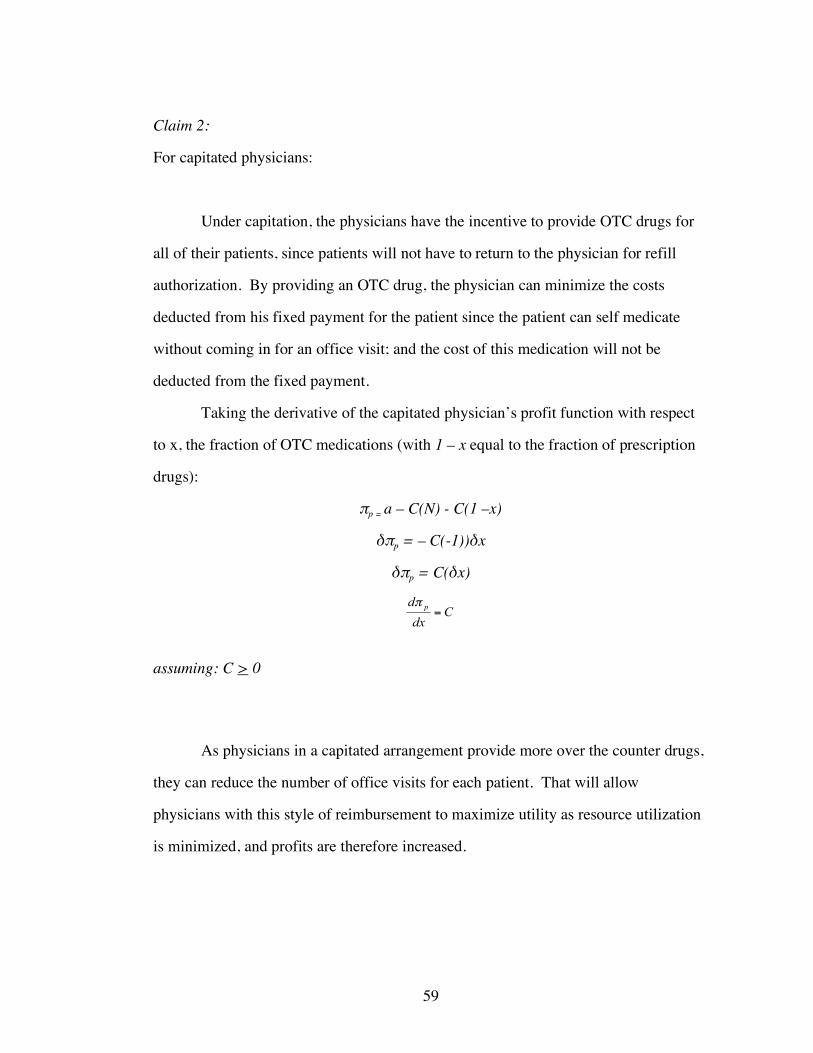
59
Claim 2:
For capitated physicians:
Under capitation, the physicians have the incentive to provide OTC drugs for
all of their patients, since patients will not have to return to the physician for refill
authorization. By providing an OTC drug, the physician can minimize the costs
deducted from his fixed payment for the patient since the patient can self medicate
without coming in for an office visit; and the cost of this medication will not be
deducted from the fixed payment.
Taking the derivative of the capitated physician’s profit function with respect
to x, the fraction of OTC medications (with 1 – x equal to the fraction of prescription
drugs):
πp = a – C(N) - C(1 –x)
δπp = – C(-1))δx
δπp = C(δx)
assuming: C > 0
As physicians in a capitated arrangement provide more over the counter drugs,
they can reduce the number of office visits for each patient. That will allow
physicians with this style of reimbursement to maximize utility as resource utilization
is minimized, and profits are therefore increased.
Cdx
d p=
!

60
Hypotheses
In summary, the following are testable hypotheses from this model.
1. After a medication in a particular class of drug moves over the counter, the
overall case mix of patients physicians see in their offices will have higher
severity.
2. In an attempt to maximize profits, FFS physicians will provide prescription
drugs instead of over-the-counter substitutes for patients.
3. Capitated physicians will minimize costs and patient visits by advising patients
to take more over-the-counter medications, thereby maximizing profits.

61
CHAPTER 5
EMPIRICAL MODEL
The reaction to the availability of an OTC medication of both physicians and
patients is empirically modeled here. The first section of this chapter outlines the
analysis for the physician group, while the second section examines changes in the
patient case mix seen in physician offices.
Physicians
The theory established in the previous chapter portrays physicians as profit
maximizing entities. This model provides a link between the likelihood that a
physician orders a prescription or over-the-counter drug for his/her patients and
physician profits, depending on how they are reimbursed for their services. The
following empirical model studies how physicians differ in their prescribing behavior
based on capitation versus FFS, both before and after the availability of an OTC.
How Number of Prescriptions Impacts Revenues
When physicians provide patients with prescription drugs, those patients must
visit the physicians’ offices repeatedly in order to get refills; to be monitored for side
effects; or to change to another type of prescription medication for that particular
illness. Therefore, by advising patients to take a prescription medication, physicians
increase the number of visits from those patients. When providing over-the-counter
medications, however, physicians cannot impact future visits as directly since patients
do not need physician approval to get these drugs. Instead, patients can bypass
physician offices and obtain these medications on their own.
Capitated Versus FFS Physicians
The financial incentives for capitated physicians are very different from those
of non-capitated physicians. Non-capitated physicians generally receive payments on
a fee-for-service scale from third party payers. Therefore, as the number of services
62
provided increases, the payments these physicians receive increase as well. Capitated
physicians, however, receive a fixed payment for their services, generally per member
per month. The capitated physician then must deduct any services provided from this
fixed amount. This creates financial risk for the physician, and creates the incentive to
minimize costs. A capitated physician, thus, will prefer, in terms of profit motives, to
minimize the number of future patient visits. By providing more over-the-counter
drugs, in place of prescription counterparts, the capitated physician can decrease the
likelihood of repeated patient visits for the same illness.
Capitated physicians also face the incentive to minimize the cost of care by
providing the lowest cost form of therapy. Amongst medications, these physicians
would be responsible for the cost of prescription medications. OTC medications,
however, are paid fully by the patient. This thereby creates a greater incentive
amongst capitated physicians, as compared to FFS, to provide these drugs.
There are variations in the degree to which physicians are held financially
responsible under capitated arrangements. In some cases, only the administrative
costs for an office visit are deducted from the capitated payment, while the insurance
company pays for all other treatments. In other cases, however, the total cost of care
including: prescription medications, lab tests, and other exams, may be deducted from
the capitated payment. For the purposes of making predictions from the model here,
however, it will be assumed that under capitation physicians are held fully financially
responsible for their prescription decisions. Under drug plans for both capitation and
FFS, patients face copays for their prescription drug use. It is assumed here that
patients under both types of plans face similar drug coverage and copays; and
therefore no differences in these are modeled here.
The model used here compares how capitated physicians vary in their
prescribing decisions from FFS physicians. The two types of reimbursement methods

63
are also compared before and after the availability of an OTC medication. Table 5.1
helps depict how this will be empirically tested.
Table 5.1
Capitation vs. FFS Before and After OTC FFS Capitation
After OTC
A
B
Before OTC
C
D
Where A = FFS After OTC availability
B = Capitation After OTC availability
C = FFS Before OTC availability
D = Capitation Before OTC availability
The equation that has been set up to estimate physician behavior when a drug
moves from prescription to over the counter is as follows:
Y = β0 + β1Capitation + β2AfterOTC + β3 (Capitation * AfterOTC) + β4 Xi + β5 Uj + ε
Where Y = The likelihood of a prescription in the drug class being examined
Capitation = Physician with capitated payments in the Before OTC period
AfterOTC = FFS Physicians in the After OTC Period
Capitated*AfterOTC = Capitated Physicians in the After OTC Period.
Xi = Patient Characteristics
Uj = Physician Characteristics
Both B and D from the above table include capitation while B and A include
the after OTC period. The interaction of Capitation and AfterOTC is, therefore,
depicted by B. Hence, the only variable missing from the table is C. The regression
therefore uses this variable, FFS in the Before OTC, period as the comparison group.

64
Predictions of Physician Behavior
For both the allergy and acid reflux class, the above regression is carried out
such that Y is first equal to the likelihood of any prescription in the drug class. The
analysis is further carried where Y is then equal to the likelihood of being prescribed
one of each of the other competing brand name drugs in the class.
Capitated physicians are expected to utilize the least costly form of treatment
as compared to FFS. Before the availability of an OTC drug, capitated physicians
may use prescriptions at least as much as FFS, since medications could be less
expensive than other forms of treatment, depending on the illness category. Amongst
medication choice, it is expected that capitated physicians will use older prescription
products more than FFS in the before OTC period, as these should be less expensive
than the newer medications.
After an OTC is available, it is expected that those FFS physicians that
previously utilized the drug that changed status, will now use other medications that
remain prescription-only, in order to maximize their own profits. That is, FFS
physicians will redistribute their patients towards one of the other brands in the
category that remain on the prescription market, rather than use the new OTC drug.
The expectation is that capitated physicians will be more likely than FFS in the
after OTC period to use the new OTC medication. OTCs are less expensive and
therefore, can be used by capitated physicians to minimize costs, especially since
physicians would not be held financially responsible for providing these drugs to
patients. In the after OTC period, it is therefore expected that capitated physicians
should decrease their usage of all prescription drugs. Some of these physicians that
previously used other brand name medications are expected to switch their patients to
the new OTC. A decrease in the likelihood of all prescription medications should be
65
expected for capitated physicians, after the availability of an OTC as compared to
FFS.
Patient Severity
The second part of this study examines how patients change their behavior
after the availability of an OTC. That is, this research questions if patients that have
less severe symptoms choose to self-treat after the availability of an OTC, as a
substitute to visiting physician offices. If there is a change in patient behavior, a
noticeable change should also occur in the case mix of patients seen in physician
offices. It is hypothesized in this model that because those with minor symptoms can
self treat, only those with more severe conditions will be seen in physician offices
after the availability of an OTC.
Severity, here, is measured using the length of time a patient has had
symptoms. Acute patients are defined as those that have had symptoms for less than
three months. Chronic routine patients include those that have had symptoms for
more than three months, while chronic flare-up includes those with symptoms that
have lasted for more than three months, but are suddenly exacerbated. It is assumed
that acute patients are the least severe of the three types, since their symptoms have
been occurring for the shortest time period. Chronic conditions are thought of as
being more severe since there is generally a longer time spent on treatment and an
increased probability of long-term medication use.
The likelihood of a visit to a specialist physician is also used as a measure for
severity. With an increase in severity of patient case mix, specialists may be utilized
more after the availability of an OTC. Primary care physician may also have a
decreased threshold in referring patients to specialists, since many patients may have
already tried the OTC drug that is chemically equivalent to the prescription-only
products, which would have otherwise been used as the first line of treatment.

66
In the empirical model here, we use the type of patient as the dependent
variable, and examine the impact on the number of office visits from each of these
patient types after of availability of an OTC.
The model used is as follows:
Y = β0 + β1AfterOTC + β2 Xi + β3 Uj + ε
Where Y = Type of patient (Acute, Chronic Routine, or Chronic Flare-up) or
Specialist Physician
After OTC = the period after which an OTC is available in the drug class
Xi = Patient Characteristics
Uj = Physician Characteristics
This model allows for the comparison of the patient type before and after the
availability of an OTC. That is, this model aims to predict the likelihood of a
physician office visit from an acute, chronic routine, or chronic flare-up patient after
an OTC is available, to compare with the before OTC time period. This model is then
repeated using just specialist physicians, rather than all physicians to determine if
there are any changes amongst this group.
Severity Predictions
Before the availability of an OTC drug in the class, all patients have to see
physicians to get treatment for the related illness. After the availability of an OTC, it
is expected that those with more minor symptoms can self-treat with OTC
medications, in place of physician office visits. Those patients who have severe
conditions and know of the available OTC treatment may delay a physician’s office
visit to instead attempt self-treatment first. Only when self-treatment is unsuccessful,
should these patients be seen in physician offices. Therefore, the patients seen in
physician offices are those that were unsuccessfully treated with the OTC, or those
that must have physicians manage their illnesses because of higher levels of severity.
67
The expectations from the above model, therefore, are that acute patients, who
have the least severe symptoms, should be less likely to come to physician offices
after the availability of an OTC. There are no expectations for any changes in the
likelihood of chronic routine patients in physician offices since these patients may be
regularly monitored by the physician because of their higher severity. Chronic flare-
up patients may be also less likely to see a physician when there is an OTC available
since their conditions are short term and may also be temporary.
Specialist physicians are more likely to see patients with more severe
symptoms than primary care physicians. It is, therefore, expected that the impact on
patient severity of an OTC may be less amongst these physicians since they are not
likely to see patients with minor conditions even before an OTC is available due to
self-treatment. There may be an increase in visits to specialists, however, if there are
more referrals to these physicians from primary care.
In summary, it is expected that the AfterOTC variable will have a negative
impact on the likelihood of acute patient visits, and possibly a negative impact on
visits from chronic flare-up patients. If the severity of patient case mix has increased,
the number of visits to specialist physicians is also expected to increase.
Additional Empirical Analysis
Time spent with the physician, and the total number of diagnostic tests, are
also examined in this study. Both of these variables are used as dependent variables in
regressions similar to those done in the severity section. That is, both of these
variables are examined to determine the effects of the availability of an OTC.
Therefore the model used for these is as follows:
Y = β0 + β1AfterOTC + β2 Xi + β3 Uj + ε
Where Y = Time Spent with Physician or Total Number of Diagnostic Tests
After OTC = the period after which an OTC is available in the drug class

68
Xi = Patient Characteristics
Uj = Physician Characteristics
There are no expectations for these variables since it is not clear as to how
these variables may be affected by changes in patient case-mix. While higher levels of
both time spent and number of diagnostic tests could indicate an increase in patient
severity, these variables could also be higher during the early diagnosis period of an
illness when severity may still be low. In addition, changes in these variables could
result because of other factors not related to patient severity such as changes in
reimbursement amounts. These two variables are, therefore, being used just for
exploratory purposes to better understand the effects of OTC availability.
Potential Limitations
The analysis done here does not include models for the actual drug that has
moved to the OTC market. Since over the counter drugs are available without
authorization from physicians, there should be a general decline in observations of
those drugs that have changed status. In addition, while the NAMCS instructs
physicians to include all types of medications on the survey form, physicians may feel
that since OTC drugs are available without a prescription, that they do not need to
include them in their survey. Because of these factors, it may not be possible to
determine if capitated physicians actually move towards the OTC since these
observations may not be recorded.
While severity is attempted to be measured here, it is very difficult to actually
determine patient severity without knowing further details of the patient’s condition.
In fact it may be possible that a patient comes to a physician’s office with severe
symptoms even during the early part of the illness, i.e. when the patient would still be
considered acute. In general, however, even when an acute patient becomes a chronic
one, the early stages of the illness are thought to be the least severe.
69
CHAPTER 6
DATA
In order to fully examine the effect on patients and physicians of drugs moving
from the prescription to over the counter market, the data used would ideally provide
information about all drugs prescribed and the severity of patients before and after the
change in regulatory status. This would allow for the examination of whether
physicians are making their decisions based on profit motives or simply because
severity of patients is different in each time period. Also, it would be ideal to have
data that included the extent of detailing (pharmaceutical advertising to physicians)
and direct-to-consumer advertising for each drug and how that changes when a drug
moves from prescription to over the counter status. Data that followed patients from
the physician’s office to the drug store would be helpful as well since it would be
possible to directly examine not only what physicians recommend, but also what
patients actually purchase. Finally, ideal data would follow both patients and
physicians over time to adequately see long-term effects. No such ideal data set exists,
thus the data source used is now described, along with its relative strengths and
weaknesses.
National Ambulatory Medical Care Survey (NAMCS)
The National Ambulatory Medical Care Survey (NAMCS) for the years 1997
– 2004 is used to test the implications of the theoretical model proposed here. The
NAMCS is a national survey conducted through the CDC’s National Center for Health
Statistics annually from 1973 to 1981, in 1985, and every year since 1989. The survey
was administered to physicians, rather than patients. Physicians were randomly
assigned to a 1-week reporting period, during which data for a random sample of visits
were recorded by the physician. Data were obtained on patients' symptoms,
physicians' diagnoses, and medications ordered or provided. The survey also provides

70
statistics on the demographic characteristics of patients (e.g. gender, age, race,
insurance type) and services provided, including information on diagnostic
procedures, patient management, and planned future treatment. The NAMCS focuses
on outpatient care since hospital-based physicians are excluded from the sample. The
survey allows physicians to list up to six medications prescribed to a patient during an
office visit, including both prescription and OTC drugs. Later years actually allow for
eight drugs to be recorded, but for comparison purposes these last two drug entries
were dropped from analysis. In total, before any exclusions, each year of data (1997-
2004) contains over 20,000 patient records.
Advantages of Using NAMCS
• The NAMCS provides data from physicians directly. This is an important
feature when examining physician incentives, since physician decisions and
intentions are recorded and do not have to be extrapolated from other sources.
• The NAMCS collects data on health insurance status of patients. This creates
data that can be used to compare utilization rates for patients enrolled in
managed care plans versus other types of health insurance.
• The NAMCS contains detailed information on demographics, diagnoses and
laboratory testing which can be used to examine the change in the case mix of
patients after drugs move to OTC status.
Descriptive Statistics
Restricting the data to only those patients with any insurance coverage allows for
the clean comparison of the effects of Fee-for-Service against those of capitation,
regardless of whether the patient is publicly or privately insured. This limits the data
to only those patients with either: Private Insurance, Medicare, or Medicaid. In some
of the specifications, the data are further restricted to only those patients with the
diagnosis relevant to the drug class being examined. Before limiting the data by

71
diagnosis, however, the summary statistics show that the insured NAMCS sample
averages slightly over 20,000 patient visits per year. The data consists of 57.5%
females and 87.1% white patients, with an average age of 46.1 years. The majority of
the insured patients (63.7%) have private insurance, while 26.5% have Medicare and
9.8% have Medicaid. Approximately 26.3% of physicians accept capitated payments
and the majority of capitation is seen through private insurance (as opposed to
Medicare or Medicaid).
The summary statistics show that 58.1% of patients see a specialist and 85.1%
are established patients (i.e. not new patients). Physicians provide medications for
their patients in over 62% of visits. Prescription drugs are provided in 56.1% of visits,
while OTC medications are provided in 10.4%. It should be noted that prescription
and OTC medications can be provided both as substitutes and as compliments.
Therefore, a person receiving a prescription drug could also receive an OTC drug at
the same time and vice versa.
Physicians spend an average of just over 19 minutes with each patient. It
should be noted, however, that physicians bill insurance companies using a tiered
structure of time spent with the patient. Therefore a skew in the reported amount of
time spent with the patient that follows the billing schedule for reimbursement can be
expected.
In terms of severity, as measured here, 32.8% of patients reported having acute
conditions. Chronic routine patients made up 33% of physicians office visits and
9.5% were from chronic flare-up patients.
The following figures provide further insight into the nature of physician office
visits amongst the insured population in the NAMCS 1997 – 2004 data for the entire
sample, as well as for the two drug classes considered here: allergy and acid reflux.

72
For all of the figures, it should be noted that Claritin, in the allergy class, is an OTC in
2003 and 2004; while Prilosec, in the acid reflux class, is an OTC in 2004.
0.00
1.00
2.00
3.00
4.00
5.00
6.00
7.00
8.00
9.00
10.00
1997 1998 1999 2000 2001 2002 2003 2004
Year
Percen
t o
f T
ota
l N
AM
CS
Pati
en
ts
Allergy Acid Reflux
Figure 6.1
Percent of Patients with Diagnosis – Total Insured NAMCS Sample 1997 – 2004
Figure 6.1 shows the percent of patients in the insured NAMCS sample for
each of the diagnoses analyzed here. According to this figure there is an increase in
the percent of patients with an allergy diagnosis after 2001 and then a decline after
2003. The decrease in visits for those patients in the allergy sample, after 2003, could
be an indication of patients using Claritin OTC as a substitute to physician visits.
Prilosec moves to the OTC market at the end of 2003, but this graph does not
provide any indication of a decrease in visits from this market. From 1997 – 2001
there seems to be very few changes in the number of patients coming in to physician
offices for an acid reflux related diagnosis. While, an increase in the acid reflux group

73
is seen after 2001 but then declines after 2002 and then levels off. These changes,
however, are slight, providing little conclusive evidence of a change due to the OTC
status of Prilosec.
0
5
10
15
20
25
30
35
40
1997 1998 1999 2000 2001 2002 2003 2004
Year
Pe
rc
en
t o
f P
ati
en
ts
Acute Chronic Routine Chronic Flare-up
Figure 6.2
Type of Patient Visit – Total Insured NAMCS Sample 1997 – 2004
Figure 6.2 depicts the type of patient (acute, chronic routine, or chronic flare-
up) per year for the general population. The figure shows a slight increase in acute
patients after 2001, but then levels off. Chronic routine has a slight increase after
2002, but no major changes are seen in any of the groups. This is as expected since
these trends are for the general population and not the specific class associated with
the drug moving to the OTC market. The number of visits from chronic flare-up
patients seems to change only slightly over the years from 1997 – 2004. Again, while
this graph is shown for descriptive purposes, no changes are expected in the severity

74
of the entire sample, since they should not be influenced by the availability of an OTC
in one specific drug category.
0%
10%
20%
30%
40%
50%
60%
70%
Year
Pe
rce
nt
of
Pa
tie
nts
Se
ein
g S
pe
cia
lis
t
Total Insured Population Insured Allergy Population Insured Acid Reflux/GERD Population
Figure 6.3
Percent of Patients Seeing a Specialist Physician by Diagnosis – Insured NAMCS
1997 – 2004
In the analysis of patient severity, the use of specialist physicians is also used.
Figure 6.3 depicts the percent of patients seeing a specialist physician, under both the
allergy and the acid reflux diagnosis categories, as well as for the entire insured
population.
The Allergy group does have an increased percentage of specialist visits in
2003, the year following the Claritin OTC switch, but then this decreases in 2004.
Similarly, the Acid Reflux group has an increased percentage of specialist visits in

75
2004, the year after the Prilosec OTC switch. There is, however, a general increasing
trend of seeing a specialist, as seen with the Total Insured Population line, after 2002.
0
0.2
0.4
0.6
0.8
1
1.2
Year
Avera
ge N
um
ber
of
Dia
gn
osti
c T
ests
Total Insured Population Insured Allergy Population Insured Acid Reflux/GERD Population
Figure 6.4
Average Number of Diagnostic Tests per Patient by Diagnosis – Insured NAMCS
1997 - 2004.
Figure 6.4 depicts the average number of diagnostic tests ordered per patient
for the entire insured NAMCS sample. This graph provides the average number of
tests for the entire NAMCS sample as well as by diagnosis group (allergy or acid
reflux). The average number of tests could provide insight into the severity of patients
if one assumes that as the number of tests increases, a patient is likely to have more
severe conditions. This is not the assumption utilized here. Instead, the average
number of tests is only used to help examine what happens, in general, after a drug in
a category moves to the OTC market. The only expectation for this variable is that no

76
changes should be seen amongst the entire insured NAMCS sample, since the entire
population should not have any changes when a drug in a specific class is given a
different regulatory status. The only changes, therefore, should be seen amongst those
populations that are related to the drug class in which an OTC is newly available.
0
5
10
15
20
25
1997 1998 1999 2000 2001 2002 2003 2004
Year
Av
era
ge
Tim
e S
pe
nt
wit
h P
hy
sic
ian
(in
min
ute
s)
Total Insured Population Allergy Population Acid Reflux Population
Figure 6.5
Average Time Spent (in minutes) with Physician by Diagnosis Group – Insured
NAMCS 1997 – 2004
Figure 6.5 depicts the average amount of time spent with the physician, in
minutes, by year. As mentioned earlier, some studies indicate that an increase in time
spent indicates an increase in severity of patients. While, this is not used as a measure
of severity in this research, time spent is included in the analysis just as an exercise to
see if there are any changes after the availability of an OTC. There is a peak in time
spent with acid reflux patients in 2003 after which there is a decline. There is a slight

77
increase in time spent with the allergy group also after 2002. The total population
remains unchanged as expected. These trends overall do not depict any major changes
in time spent after the availability of an OTC.
0
0.2
0.4
0.6
0.8
1
1.2
1997 1998 1999 2000 2001 2002 2003 2004
Year
Avera
ge N
um
ber
of
Dia
gn
osti
c T
ests
Total Population Allergy Acid Reflux
Figure 6.6
Average Number of Tests per Patient by Diagnosis Group Specialist Physicians –
Insured NAMCS 1997 – 2004
Figure 6.6 depicts the average number of tests ordered by specialist physicians.
There is a peak of tests done in 2001 for acid reflux patients, and then this trend levels
off. Others remained relatively unchanged indicating no real effect of OTC
availability.
Due to the possibility that primary care physicians are more likely to refer
patients to specialists after the availability of an OTC because of an increase in patient

78
severity, visits to specialist physicians are further analyzed as well. Figure 6.7 depicts
the average time spent with a specialist physician.
10
12
14
16
18
20
22
24
26
28
30
1997 1998 1999 2000 2001 2002 2003 2004
Year
Tim
e S
pe
nt
wit
h P
hy
sic
ian
(in
min
ute
s)
Total Population Allergy Acid Reflux
Figure 6.7
Average Time Spent (in minutes) with a Specialist Physician by Diagnosis Group -
Insured NAMCS 1997 – 2004
No conclusions can be formulated for the allergy or total population groups
from Figure 6.7. Acid reflux patients have an increase in time spent with a specialist
physician from 2002 – 2003, and then a decrease in 2004. While this could imply a
change in patient severity, it could also indicate other changes, such as a different
reimbursement schedule for the amount of time physicians spend with patients.
In terms of drug use, the percentages of patients receiving medications by
population are examined in Figures 6.8 and 6.9. Figure 6.8 shows the percent of

79
patients receiving a prescription medication by diagnosis group while Figure 6.9
depicts the usage of OTC medications.
0%
10%
20%
30%
40%
50%
60%
70%
80%
90%
1997 1998 1999 2000 2001 2002 2003 2004
Year
Pe
rc
en
t o
f P
ati
en
ts
Total Insured Population Allergy Acid Reflux
Figure 6.8
Percent of Patients Receiving a Prescription Medication – by Diagnosis Group
NAMCS 1997 – 2004
There are no major changes in prescription drug use over the years from Figure
6.8. The majority of physicians are FFS and therefore, overall, physicians are not
expected to change their prescribing habits drastically after the availability of an OTC.
Instead only those FFS physicians that prescribed the medication that is now OTC are
expected to switch to another prescription-only product. In the allergy group, there is
a slight decrease in the use of prescriptions after 2002, which may indicate that some
physicians are using the OTC drug instead of prescription-only ones.

80
Figure 6.9 shows that there is a decrease in OTC use for acid reflux patients
from 2001 – 2003, but then levels off in 2004. OTC use increases in the allergy group
after 2002.
0%
2%
4%
6%
8%
10%
12%
14%
16%
18%
20%
1997 1998 1999 2000 2001 2002 2003 2004
Year
Pe
rc
en
t o
f P
ati
en
ts
Total Insured Allergy Acid Reflux
Figure 6.9
Percent of Patients Receiving an OTC Medication - by Diagnosis Group NAMCS
1997 – 2004
Table 6.1 provides the summary statistics for the NAMCS data used. In the
regressions conducted, the samples consisted of insured patients only from 1997 –
2000, and 2003 – 2004. The years 2001 and 2002 were dropped from the analysis
because the capitation variable is missing for these years. The capitation variable is
the one indicating whether or not the physician is under any influence of a capitated
reimbursement system.
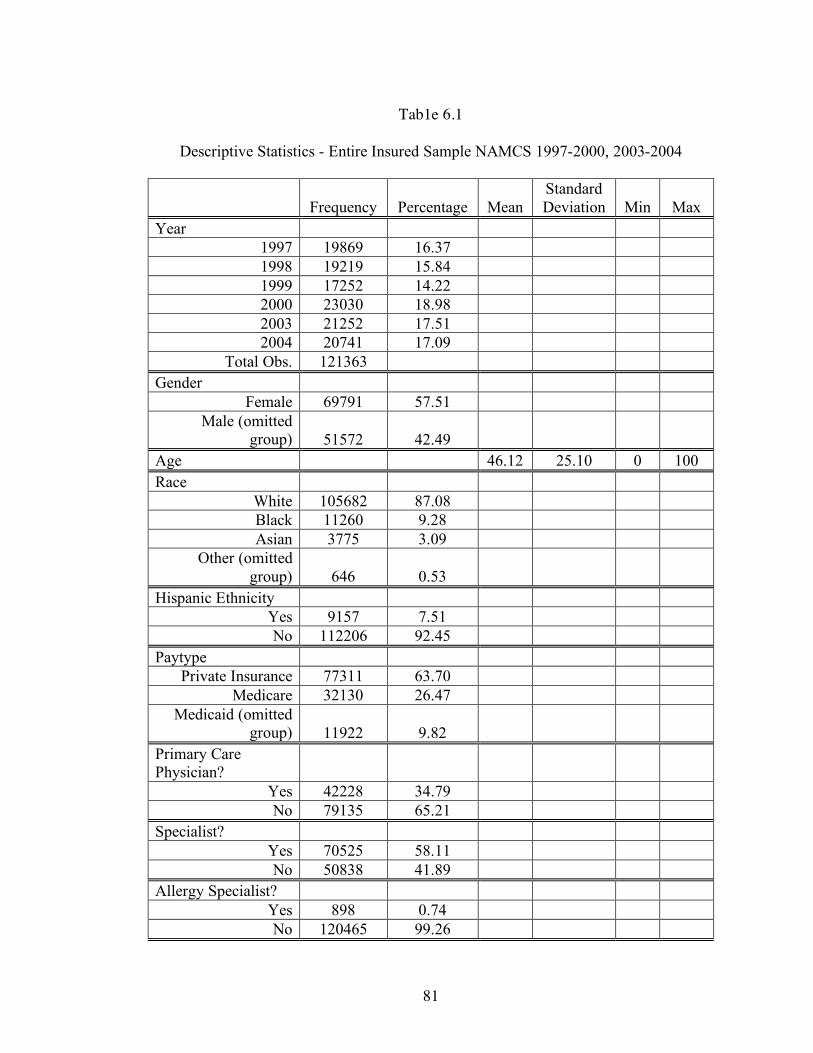
81
Tab1e 6.1
Descriptive Statistics - Entire Insured Sample NAMCS 1997-2000, 2003-2004
Frequency Percentage Mean Standard Deviation Min Max
Year 1997 19869 16.37 1998 19219 15.84 1999 17252 14.22 2000 23030 18.98 2003 21252 17.51 2004 20741 17.09
Total Obs. 121363 Gender
Female 69791 57.51 Male (omitted
group) 51572 42.49 Age 46.12 25.10 0 100 Race
White 105682 87.08 Black 11260 9.28 Asian 3775 3.09
Other (omitted group) 646 0.53
Hispanic Ethnicity Yes 9157 7.51 No 112206 92.45
Paytype Private Insurance 77311 63.70
Medicare 32130 26.47 Medicaid (omitted
group) 11922 9.82 Primary Care Physician?
Yes 42228 34.79 No 79135 65.21
Specialist? Yes 70525 58.11 No 50838 41.89
Allergy Specialist? Yes 898 0.74 No 120465 99.26

82
Table 6.1 (Continued) Gastro Specialist?
Yes 1452 1.19 No 119911 98.81
Patient Referred for this visit?
Yes 27790 22.90 No 93573 77.10
Has patient been seen here before?
Yes 103257 85.08 No 17493 14.41
Missing 613 0.51 Were Any Medications Provided?
Yes 75186 61.95 No 46177 38.05
Total Number of Medications 1.36 1.57 0 6 Were any Prescription Drugs Given?
Yes 68045 56.07 No 53318 43.93
Were any OTC Drugs Given?
Yes 12635 10.41 No 108728 89.59
Were any Allergy Prescriptions Given?
Yes 3011 2.48 No 118352 97.52
Was Allegra Given? Yes 900 0.74 No 120463 99.26
Was Zyrtec Given? Yes 871 0.72 No 120492 99.28
Was Clarinex Given?
Yes 121226 99.89 No 137 0.11

83
Table 6.1 (Continued) Were Allergy Shots Given?
Yes 120803 99.54 No 560 0.46
Allergy OTC Available
Yes 41801 34.44 No 79562 65.56
Claritin OTC Market Share 0.03 0.04 0 0.098 Were any Gastro Prescriptions Given?
Yes 2233 1.84 No 119130 98.16
Was Nexium Given? Yes 256 0.21 No 121107 99.79
Was Prevacid Given?
Yes 785 0.65 No 120578 99.35
Was Protonix Given?
Yes 196 0.16 No 121167 99.84
Was Zantac Given? Yes 716 0.59 No 120647 99.41
Gastro OTC Available
Yes 20540 16.90 No 100823 83.08
Prilosec OTC Market Share 0.03 0.07 0 0.185 Major Reason For Visit
Acute Problem 39792 32.79 Chronic Problem,
Routine 40101 33.04 Chronic Problem,
Flareup 11557 9.52
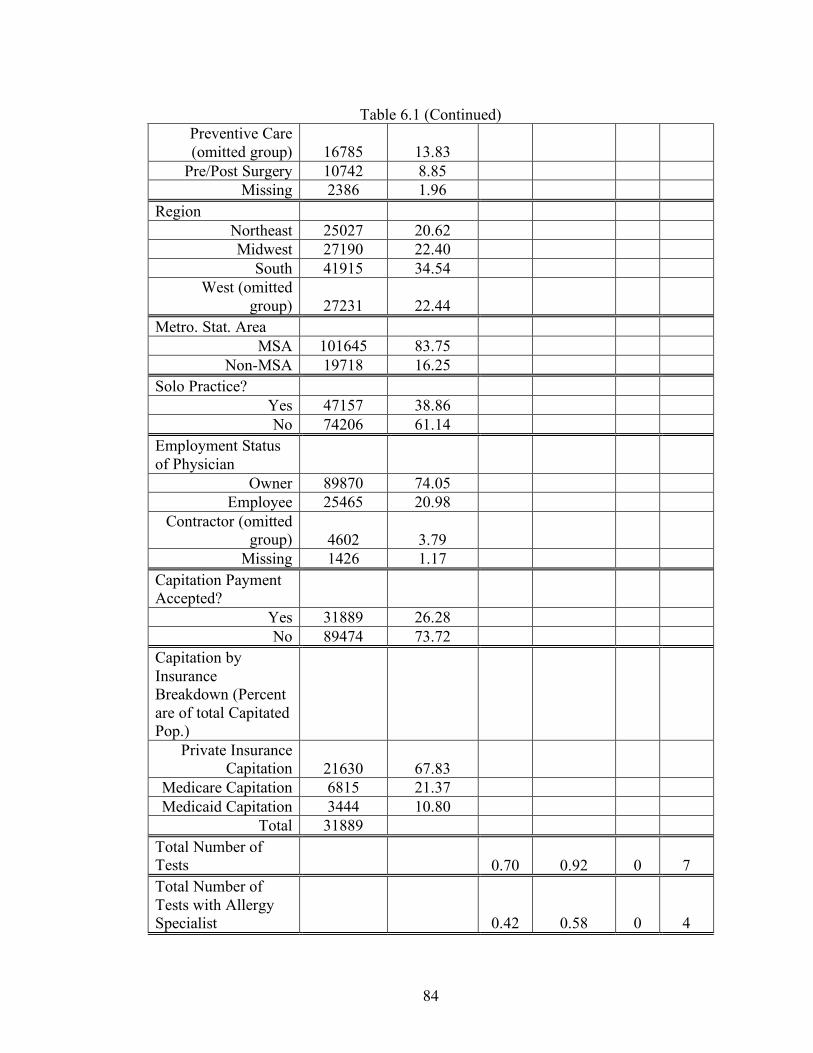
84
Table 6.1 (Continued) Preventive Care (omitted group) 16785 13.83
Pre/Post Surgery 10742 8.85 Missing 2386 1.96
Region Northeast 25027 20.62 Midwest 27190 22.40
South 41915 34.54 West (omitted
group) 27231 22.44 Metro. Stat. Area
MSA 101645 83.75 Non-MSA 19718 16.25
Solo Practice? Yes 47157 38.86 No 74206 61.14
Employment Status of Physician
Owner 89870 74.05 Employee 25465 20.98
Contractor (omitted group) 4602 3.79
Missing 1426 1.17 Capitation Payment Accepted?
Yes 31889 26.28 No 89474 73.72
Capitation by Insurance Breakdown (Percent are of total Capitated Pop.)
Private Insurance Capitation 21630 67.83
Medicare Capitation 6815 21.37 Medicaid Capitation 3444 10.80
Total 31889 Total Number of Tests 0.70 0.92 0 7 Total Number of Tests with Allergy Specialist 0.42 0.58 0 4
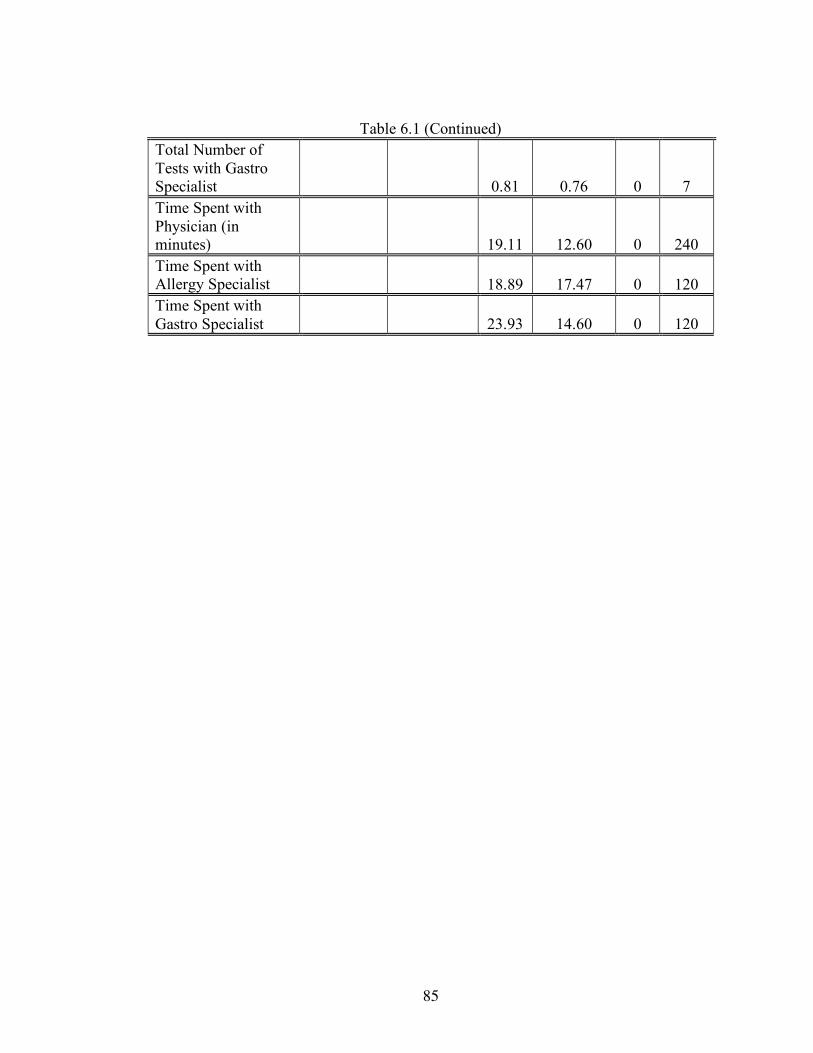
85
Table 6.1 (Continued) Total Number of Tests with Gastro Specialist 0.81 0.76 0 7 Time Spent with Physician (in minutes) 19.11 12.60 0 240 Time Spent with Allergy Specialist 18.89 17.47 0 120 Time Spent with Gastro Specialist 23.93 14.60 0 120

86
CHAPTER 7
ALLERGY CLASS ANALYSIS
Allergies are a condition in which one’s immune system overreacts to a
substance in the environment. This disease is one of the most common in the United
States, affecting more than 50 million people. Allergies rank sixth in leading causes of
chronic disease and approximately $18 billion are spent annually in treatment and
diagnosis. Common allergies include: plant pollens, mold spores, foods, insects, and
animal products. The symptoms associated with allergies can greatly affect patients’
life styles and can be a concern for employers as well. According to a previously
mentioned study, productivity losses associated with a diagnosis of allergic rhinitis
were estimated to be $601 million (Crystal-Peters, 2000).
Antihistamines are medications used in the treatment of allergies. While no
cure exists for allergies, antihistamines are used to relieve patients of allergy
symptoms such as itchy, watery eyes; sneezing; and congestion. These medications
are available on both the OTC and prescription drug markets. Examples of
antihistamines include:
• OTC Market: Benadryl, Claritin, Chlor-Trimeton, Dimetane and Tavist
• Prescription Market: Clarinex, Allegra, and Zyrtec
Allergy Shots
Allergy shots, also known as immunotherapy, are another form of treatment for
allergy symptoms. With immunotherapy, patients are injected with a serum
containing the substances they are specifically allergic to so that their immune
response and tolerance can be built. While allergy shots are not available for all types
of allergies or patients, they are considered as one of the most effective forms of
treatment for severe allergies (Haines, 2006). Allergy shots are, however, time
intensive for the patient as they have to, at least initially, receive weekly injections. In

87
order to build immunity, the patient later receives shots once per month in a
maintenance cycle, which can last for several years. Because of the time requirements
for allergy shots and because it often takes several months before any relief is realized
from these injections, this therapy is most appropriate for chronic patients.
The cost of allergy shots is less than that of medications for both patients and
insurance companies. A study in the April 2000 issue of Research Reviews showed
that patients generally pay $1200 in out-of-pocket costs for year-round drug treatment
of allergic rhinitis. Another study, however, shows that a patient would pay only $800
for the first year of allergy shots. Because the first year has the most number of shots
in order to build up the patient’s tolerance, it is also the most expensive. This study
calculates that in later years, once the patient had reached maintenance and shots were
given less frequently, the costs drop to between $170 and $290 per year. Since
allergies are a chronic condition, the cost difference between drug therapy and
immunotherapy can add up to significant amounts in the long term (Kirchheimer,
2003).
Antihistamine Market
There are two main categories of antihistamines: first generation and second
generation. First generation antihistamines, such as Benadryl, are effective in the
treatment of allergy symptoms; they are widely available and are generally
inexpensive. Second generation antihistamines, such as Claritin, are also effective, but
are more expensive than the first generation counterparts. For example, generic
diphenhydramine (Benadryl’s active ingredient) or chlorpheniramine
(ChlorTrimeton’s active ingredient) cost $3 to $4 for 24-30 tablets, whereas the same
number of Claritin OTC tablets can cost a patient $20 or more (Drug Store, 2005).
The main differences between these two types of drugs, other than prices,
however, are in their side effects. While, first generation antihistamines are effective,

88
they also contain very strong sedating effects. This is due to their lack of selectivity
for the proper chemical receptors in the body. This reaction is so effective, it is a
characteristic used in many OTC sleeping aid medications (Gleason et al, 1998). In
fact, a study testing the driving capabilities of subjects showed that taking common,
over-the-counter antihistamines can impair a person's ability to drive, even more so
than being legally drunk (Tracey, 2000).
In addition to the driving concerns that result from the use of first generation
antihistamines, there are productivity concerns as well. Other authors have found that
when first generation allergy medications were used and an assessment of productivity
was considered, the estimated loss in productivity ranged between $2.4 billion to $4.6
billion. The results from the 1995 National Health Interview Study showed that “the
most significant productivity losses resulted not from absenteeism but from reduced
at-work productivity associated with the use of sedating OTC antihistamines”
(Crystal-Peters, 2000). Therefore, while first generation antihistamines have lower
retail prices for consumers, the costs of taking these medications can be far greater to
patients, employers, and society.
Second generation antihistamines are far more effective at locating the proper
receptors and therefore, have greatly improved sedation effects of their earlier
counterparts. Consumers can gain greater access to these medications, at possibly
lower prices, with the movement of these drugs to the OTC market. This could allow
for dramatic reductions in the productivity losses and driving hazards that are caused
by the use of first generation anti-histamines.
Claritin
As described in Chapter 2, the December 2002 switch of Schering-Plough
Corp’s Claritin (loratadine) into the OTC market was initiated by the third part payer,

89
Wellpoint, who argued that the drug was just as safe as other OTC antihistamines
(Goldfarb, 2002).
Claritin’s patent was to expire on December 19, 2002, and on November 27th
of the same year, the FDA approved Claritin, a top prescription performer, as the first
non-sedating formula for the OTC market (FDA Orange Book, 2006). Schering-
Plough was denied the 3 year Hatch Waxman exclusivity period because of the
company’s delays and lack of planning. Therefore, after Claritin’s December 2002
OTC launch, it was soon followed to the market by private-label and value versions of
loratadine in January and April 2003, respectively. The OTC switch of Claritin was
successful with first year sales totaling nearly $400 million and a market share of 50%
in the allergy market (Mahecha, 2006).
Schering-Plough attempted to keep their place in the prescription-only second
generation antihistamine market by launching their new drug, Clarinex in January
2002. This new drug was designed to work faster and last longer than the older
Claritin. However, the company had little time, less than one-year in fact, to convert
the Claritin patients to Clarinex because of delays in Clarinex approval (IMS Health,
2003).
When Claritin made the switch into the OTC market, many insurance
companies dropped their drug coverage for all antihistamines. These third party
payers argued that there was an effective, low price antihistamine in the OTC market,
and therefore patients should utilize that drug, rather than the more expensive,
prescription counterparts (Kirchheimer, 2003).
According to the magazine Drug Topics, “total sales of antihistamines dropped
28.5% in 2003 following a 9.7% increase for 2002”. While the top performing drugs
still had some growth in sales from the previous year, this change had dropped
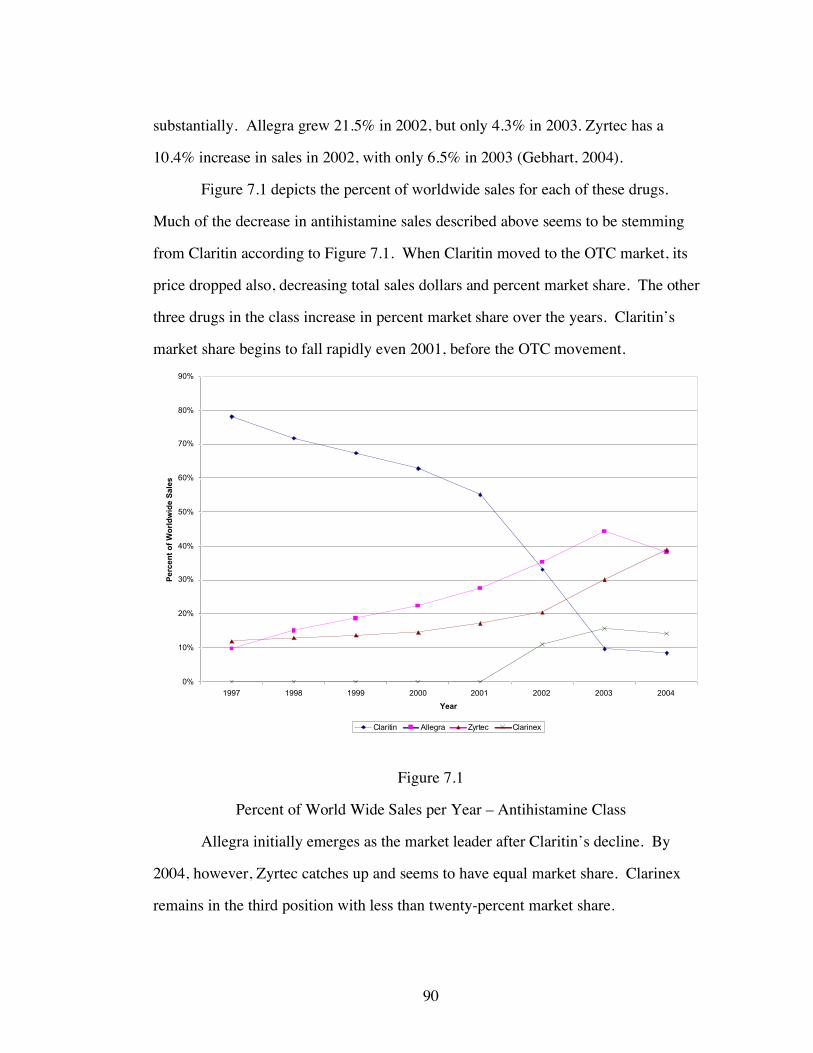
90
substantially. Allegra grew 21.5% in 2002, but only 4.3% in 2003. Zyrtec has a
10.4% increase in sales in 2002, with only 6.5% in 2003 (Gebhart, 2004).
Figure 7.1 depicts the percent of worldwide sales for each of these drugs.
Much of the decrease in antihistamine sales described above seems to be stemming
from Claritin according to Figure 7.1. When Claritin moved to the OTC market, its
price dropped also, decreasing total sales dollars and percent market share. The other
three drugs in the class increase in percent market share over the years. Claritin’s
market share begins to fall rapidly even 2001, before the OTC movement.
0%
10%
20%
30%
40%
50%
60%
70%
80%
90%
1997 1998 1999 2000 2001 2002 2003 2004
Year
Pe
rc
en
t o
f W
orld
wid
e S
ale
s
Claritin Allegra Zyrtec Clarinex
Figure 7.1
Percent of World Wide Sales per Year – Antihistamine Class
Allegra initially emerges as the market leader after Claritin’s decline. By
2004, however, Zyrtec catches up and seems to have equal market share. Clarinex
remains in the third position with less than twenty-percent market share.

91
The companies that produced second generation antihistamines engaged in
heavy marketing efforts directly to consumers. Figure 7.2 shows the dollar amount
spent on direct-to-consumer advertising, using Competitive Media Reports (CMR)
data for the years 1997 – 2002 and Neilsen data collected from Med Ad News for
2003 and 2004.
$0
$20,000,000
$40,000,000
$60,000,000
$80,000,000
$100,000,000
$120,000,000
$140,000,000
$160,000,000
$180,000,000
1997 1998 1999 2000 2001 2002 2003 2004
Year
Ad
ve
rtis
ing
Do
lla
rs S
pe
nt
Claritin Allegra Zyrtec Clarinex
Figure 7.2
Advertising Dollars Spent per Year by Drug – Antihistamine Class
The data from Med Ad News does not include advertising information for most
OTC. Therefore, the advertising data for Claritin is missing for the years 2003 and
2004, when it is sold in the OTC market. It is in 2002, however, when Claritin is still
prescription that the advertising drops to nearly zero. In fact, Schering-Plough begins
to slow down the advertising of Claritin from 1998. Also in 2002, the advertising for
Clarinex, the new second generation antihistamine from Schering-Plough, is initiated.

92
Allergy/Antihistamine NAMCS Data
For the analysis of the allergy/antihistamine market, the NAMCS 1997 – 2000,
2003 – 2004 is used. The entire data set is examined, first, to study the use of allergy
drugs because approximately half of the prescriptions for these medications were
given to patients with non-allergy diagnoses. Due to the nature of the NAMCS, in that
diagnoses are very specifically defined, it was not possible to find any one non-allergy
diagnosis that dominated these prescriptions.
The data was then limited to only those patients with an allergy diagnosis. The
data was also restricted, both for the entire population as well as the allergy
population, to just those with some form of health insurance. This is done so that the
effects of capitation and FFS can be clearly compared, without drawing in
comparisons with the uninsured group.
This data, when restricted to the insured allergy group, provides a total sample
of 9,692 allergy patient visits, averaging slightly over 1600 allergy patient visits per
year. Nearly 58% of the allergy sub-population is female, while over 86% is white,
and the average age is 37.5 years (somewhat younger than the average age for the
entire NAMCS sample). Private insurance covers 74.4% of the patients, while 15.1%
are covered by Medicare, and 10.5% by Medicaid. Capitated reimbursement is
accepted by 27.7% of physicians and nearly 86% of allergy patients received a
medication at their visit. While 77.4% received a prescription drug, 12.6% received
an OTC, and fewer than 18% of the patients were given an allergy prescription. When
describing their major reason for visit, 47.4% claimed to have an acute problem
(symptoms occurring for 3 months or less); nearly 29% had chronic routine problems;
and 13.3% had flare-ups of chronic conditions.
The following figures are first used to examine the allergy diagnosis in the
NAMCS sample. Figure 7.3 shows the number of prescriptions for each allergy drug

93
for the total NAMCS population. Figure 7.4 shows the number of prescriptions for
each allergy drug as well, but for the group diagnosed with an allergy condition.
0
50
100
150
200
250
300
350
400
1997 1998 1999 2000 2001 2002 2003 2004
Year
Nu
mb
er
of
Pre
sc
rip
tio
ns
*Claritin (OTC in 2003 & 2004) Allegra Zyrtec Clarinex Allergy Shots
Figure 7.3
Number of Prescriptions by Allergy Drug – Total Insured NAMCS Sample
As was depicted in the figure showing the market share of world wide sales,
this figure also shows that Claritin dominates the market until 2001. In 2002, Allegra
takes over as market leader, with the most number of prescriptions, but Zyrtec soon
catches up in 2002. Allergy shot use was found to increase steadily after 2001 and
then declines in 2004. In this last year of data, however, allergy shots are still used
more than either Claritin or Clarinex.
In both Figures 7.3 and 7.4, Claritin is classified as an OTC medication in the
years 2003 and 2004; in all others it is a prescription. The two graphs provide the
number of prescriptions by allergy drug; the first being for the entire insured sample

94
and the second is for the insured sample with an allergy related diagnosis. The two
figures follow nearly the same patterns, with more prescriptions overall for the total
insured sample.
0
50
100
150
200
250
1997 1998 1999 2000 2001 2002 2003 2004
Year
Nu
mb
er
of
Pre
sc
rip
tio
ns
*Claritin (OTC in 2003 & 2004) Allegra Zyrtec Clarinex Allergy Shots
Figure 7.4
Number of Prescriptions by Allergy Drug – Allergy Sample
To measure severity in the allergy group the use of allergy shots is examined.
This treatment is most often used for patients with severe allergies since the full
benefits from this treatment are normally realized only after many months. Therefore,
as the case-mix of patients becomes more severe and the patients seen in physicians’
offices possess chronic symptoms, a greater utilization of allergy shots should be
noticed. Figure 7.5 shows the percent of patients receiving allergy shots, for the entire
NAMCS population and for the allergy related diagnosis sample.

95
0%
1%
2%
3%
4%
5%
6%
7%
8%
1997 1998 1999 2000 2001 2002 2003 2004
Year
Perc
en
t o
f P
op
ula
tio
n R
eceiv
ing
Allerg
y S
ho
ts
Total Insured Population Insured Allergy Population
Figure 7.5
Percent of Population Receiving an Allergy Shot – NAMCS 1997 – 2004
An increase in the use of allergy shots is found in both groups after 2001. The
allergy group peaks its use of allergy shots in 2003, the year following the Claritin
OTC switch. The percent of patients getting an allergy shot then declines in 2004.
Between 2001 and 2003, the percent of patients receiving allergy shots more than
doubled amongst those with an allergy related diagnosis. Physicians may have felt the
need to use allergy shots increasingly after 2001 because the types of patients coming
into their offices may have become more severe. Also, after the switch of Claritin to
the OTC market, many insurance companies dropped coverage of all antihistamines.
For this reason, there may have been an increase in the use of allergy shots amongst
allergy patients, since this form of treatment was still covered under most insurance

96
plans. Later, there was a backlash against insurance companies and many returned
antihistamines to their drug coverage plans.
0%
2%
4%
6%
8%
10%
12%
14%
1997 1998 1999 2000 2001 2002 2003 2004
Year
Pe
rce
nt
of
Pa
tie
nts
Se
ein
g A
lle
rgy
Sp
ec
iali
st
Total Insured Population Insured Allergy Population
Figure 7.6
Percent of Patients Seeing an Allergy Specialist - NAMCS 1997 – 2004
In another attempt to examine severity the use of allergy specialists is
examined. Figure 7.6 depicts the percent of patients in both the total insured
population and the insured allergy population who see an allergy specialist.
While a peak in the use of allergy specialists is found in 2003 (the year after
the Claritin switch) the percent of visits to allergy specialist begins to decrease there
afterwards. It is expected that the use of an allergy specialist should increase with an
increase in the use of allergy shots, since these physicians provide the injections in the
majority of cases. Severity is not expected to change for the entire population, as the
availability of an OTC in a drug class should only affect the relevant diagnosis group.

97
In order to analyze patient severity, the nature of the patient’s illness is used,
which categorized as acute, chronic routine, and chronic flare-up. Figure 7.7 depicts
the trend in visits for each of these types of patients for the allergy sample.
0
10
20
30
40
50
60
1997 1998 1999 2000 2001 2002 2003 2004
Year
Pe
rc
en
t o
f P
ati
en
ts
Acute Chronic Routine Chronic Flare-up
Figure 7.7
Percent of Visits by Type of Patient – Allergy Sample
NAMCS 1997 – 2004
While the number of visits from chronic routine patients seems to decrease
after 2003, visits from acute and chronic flare-up patients seem to have minimal
changes. The number of acute patients increases slightly, while the number of chronic
flare-up patients seems to change only slightly.
In Figure 7.8 the type of patient seen in the offices of allergy specialists is
depicted. This figure shows an increase in chronic routine patients amongst specialist

98
and a decrease in both acute and chronic flare-up patients, especially after 2002, the
year in which Claritin moves to the OTC market.
0
10
20
30
40
50
60
70
80
90
100
1997 1998 1999 2000 2001 2002 2003 2004
Year
Pe
rc
en
t o
f P
ati
en
ts
Acute - Specialist Physician Chronic Routine - Specialist Physician Chronic Flare-up - Specialist Physician
Figure 7.8
Percent of Visits by Type of Patient amongst Specialist Physicians– Allergy Sample
NAMCS 1997 - 2004
As expected, there is a decline in visits from acute and chronic flare-up
patients that may be due to self treatment. Their conditions could be temporary, thus,
they may be substituting Claritin OTC for a physician’s office visit.
Table 7.1 provides the descriptive statistics for the allergy group. The
capitation variable was only available for the NAMCS survey in the years 1997 –
2000 and then again in 2003 – 2004. Therefore, 2001 and 2002 are dropped from the
actual regression analysis done later.

99
Table 7.1
Descriptive Statistics - Allergy Insured Sample NAMCS 1997-2000, 2003-2004
Frequency Percentage Mean Standard Deviation Min Max
Year 1997 1464 15.11 1998 1555 16.04 1999 1473 15.20 2000 1700 17.54 2003 1993 20.56 2004 1507 15.55
Total Obs. 9692 Gender
Female 5605 57.83 Male (omitted
group) 4087 42.17 Age 37.45 24.41 0 100 Race
White 8343 86.08 Black 906 9.35 Asian 385 3.97
Other (omitted group) 58 0.59
Hispanic Ethnicity Yes 789 8.14 No 8903 91.86
Paytype Private Insurance 7207 74.36
Medicare 1471 15.18 Medicaid (omitted
group) 1014 10.46
Primary Care Physician?
Yes 4449 45.90 No 5243 54.10

100
Table 7.1 (Continued) Specialist?
Yes 4726 48.76 No 4966 51.24
Allergy Specialist? Yes 722 7.45 No 8970 92.55
Patient Referred for this visit?
Yes 1587 16.37 No 8105 83.63
Has patient been seen here before?
Yes 8247 85.09 No 1405 14.50
Missing 40 0.41 Were Any Medications Provided?
Yes 8311 85.75 No 1381 14.25
Total Number of Medications 1.98 1.49 0 6 Were any Prescription Drugs Given?
Yes 7504 77.42 No 2188 22.58
Were any OTC Drugs Given?
Yes 1217 12.56 No 8475 87.44
Were any Allergy Prescriptions Given?
Yes 1699 17.53 No 7993 82.47
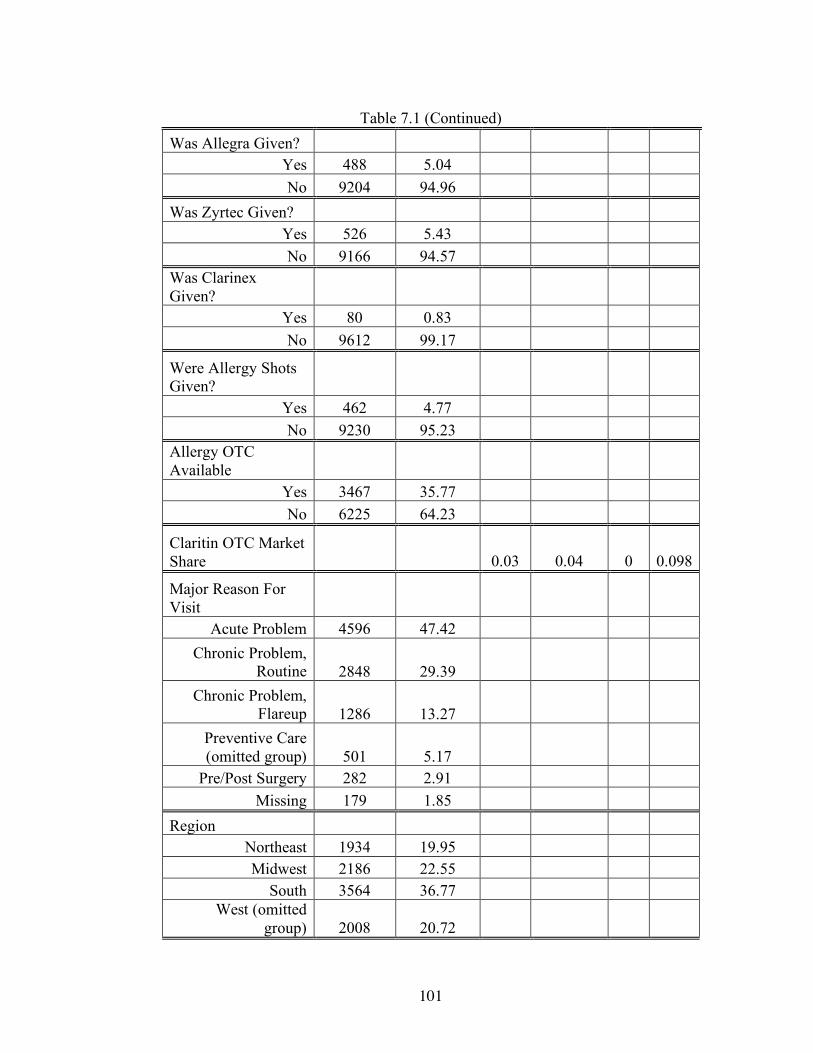
101
Table 7.1 (Continued) Was Allegra Given?
Yes 488 5.04 No 9204 94.96
Was Zyrtec Given? Yes 526 5.43 No 9166 94.57
Was Clarinex Given?
Yes 80 0.83 No 9612 99.17
Were Allergy Shots Given?
Yes 462 4.77 No 9230 95.23
Allergy OTC Available
Yes 3467 35.77 No 6225 64.23
Claritin OTC Market Share 0.03 0.04 0 0.098
Major Reason For Visit
Acute Problem 4596 47.42 Chronic Problem,
Routine 2848 29.39 Chronic Problem,
Flareup 1286 13.27 Preventive Care (omitted group) 501 5.17
Pre/Post Surgery 282 2.91 Missing 179 1.85
Region Northeast 1934 19.95 Midwest 2186 22.55
South 3564 36.77 West (omitted
group) 2008 20.72

102
Table 7.1 (Continued) Metro. Stat. Area
MSA 8145 84.04 Non-MSA 1547 15.96
Solo Practice? Yes 3830 39.52 No 5862 60.48
Employment Status of Physician
Owner 7063 72.87 Employee 2186 22.55
Contractor (omitted group) 352 3.63
Missing 91 0.94
Capitation Payment Accepted?
Yes 2616 26.99 No 7076 73.01
Capitation by Insurance Breakdown (Percent are of total Capitated Pop.)
Private Insurance Capitation 2008 76.76
Medicare Capitation 284 10.86 Medicaid Capitation 324 12.39
Total 2616 Total Number of Tests 0.49 0.74 0 7 Total Number of Tests with Allergy Specialist 0.39 0.51 0 2 Time Spent with Physician (in minutes) 16.48 11.05 0 240
Time Spent with Allergy Specialist 19.21 17.97 0 120

103
Antihistamine Results
As mentioned earlier, in the theoretical model chapter, the case mix of patients
is expected to become more severe after the availability of an OTC drug. Also,
capitated physicians are hypothesized to provide OTC medications to minimize costs,
and thereby maximize profits. For the allergy group, only the second generation
antihistamine market is examined. Claritin is the drug that moves to the OTC market
in 2002, while Allegra, Zyrtec, and Clarinex are the drugs in the prescription-only
market. Also included are allergy shots as an alternative therapy to antihistamines.
The following cross tabulations are used to help frame the predictions of the
effect of an OTC medication for the allergy group, using the means calculated from
the NAMCS data.
In the first table (7.2), the probability of receiving each drug, before and after
the availability of Claritin OTC, is shown. The second table (7.3) also depicts the
probability of receiving each drug, before and after Claritin OTC, but broken down by
reimbursement type. Both of these tables are for the entire, insured NAMCS sample.
Tables 7.4 and 7.5 repeat the probabilities shown in tables 7.2 and 7.3, but for the
allergy diagnosis sample.
Tables 7.2 and 7.4 show that there is an increase in prescriptions for each
brand of antihistamine. There is also an increase in the use of allergy shots amongst
patients from both the entire NAMCS insured population, as well as the allergy
population. Amongst the allergy group, there is an overall decrease in the use of
allergy prescriptions in general. When broken down to individual drugs, however, the
tables show that there are increases in the use of Allegra, Zyrtec, Clarinex, and allergy
shots. This could indicate that even though the use of other drugs increases, other
patients have followed Claritin to the OTC market. For the entire insured population,
there is also an increased use of allergy prescriptions.

104
`
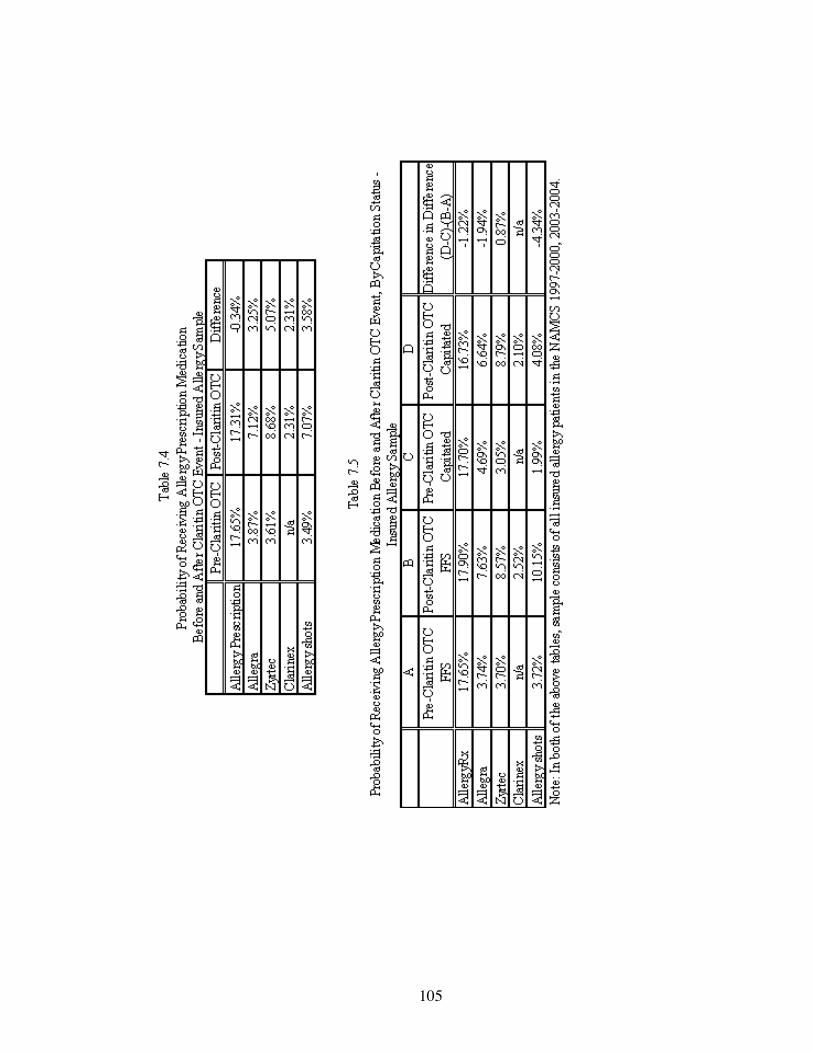
105

106
FFS physicians are expected to continue providing prescription medications to
their patients to ensure repeat visits. Once Claritin moves to the OTC market, it is
expected that FFS physicians will be more likely to move away from prescribing this
drug, and will instead provide Allegra, Zyrtec, or Clarinex. If the case mix of patients
does become more severe, as predicted, it is also expected that FFS physicians will be
more likely to prescribe allergy shots since this therapy is used on more severe cases
of allergies. In both the entire insured sample, as well as the allergy diagnosis sample,
the tabulations above show an increased probability that FFS physician will provide
each of the brand name prescriptions. These physicians are also more likely to
provide allergy shots after the availability of Claritin OTC for both samples.
Capitated physicians, before the availability of an OTC, are expected to
provide the least costly form of treatment. Other studies have shown that using allergy
shots can amount to lower costs per year than using medications. Because of this, it is
expected that cost-minded capitated physicians will be more likely than FFS
physicians to utilize allergy shots as opposed to prescription medications. Once
Claritin moved to the OTC market, insurance companies generally dropped coverage
for Claritin and in some cases, all antihistamines. Hence, it is expected that capitated
physicians will be more likely than FFS physicians to move from providing allergy
shots to their patients, to instead providing the OTC medication. That is, while no
OTC’s are available, capitated physicians choose the lowest cost of treatment by
providing allergy shots since these are less expensive than prescription medications.
Once Claritin moves to the OTC market, and insurance companies no longer pay for
Claritin, or even all antihistamines, capitated physicians choose the lower cost
treatment for the insurance provider which, in this case, is antihistamines. It is also
expected that the capitated physician will be less likely to provide Allegra, Zyrtec, or

107
Clarinex than FFS physicians, as these drugs are more expensive for insurance
companies when they are included under drug coverage.
The difference in differences columns in Tables 7.3 and 7.5 allow for the
comparison of the effect of OTC availability on capitation versus the effect on FFS. If
the effect of the availability of an OTC is the same for both groups, the difference in
the change between these two will be zero. The results are not zero and therefore,
indicate that one group is more affected by the availability of an OTC than the other.
The tables mentioned above show that under capitation there is a decreased
likelihood that physicians will provide allergy prescriptions and allergy shots to the
total insured NAMCS sample. For the allergy sample, the tables show a decreased use
of allergy prescriptions amongst capitated physicians.
Table 7.6 provides the prescription drug regression results for the entire
insured NAMCS population. The first three independent variables will be the focus
in the analysis of the results. The results in Table 7.6 show that before the availability
of an OTC, for the entire insured population, capitated physicians are more likely than
FFS to provide allergy shots. This is as expected since allergy shots are the least
costly form of treatment. After the availability of an OTC, FFS physicians are more
likely to use allergy shots, than before. This could be a result because FFS physicians
are shifting costs from the patient to the insurance company. Because many
companies dropped coverage for antihistamines, FFS physicians are alleviating
patients from paying the full cost of prescriptions, and are instead providing allergy
shots, which would be covered under insurance plans as an office visit and, thus,
would have lower copays.

108
Table 7.6
Allergy OLS Regression Results for Entire Insured Sample NAMCS 1997 – 2004
(Note - Regressions exclude years 2001 and 2002)
Standard Errors in Brackets
*significant at 10% **significant at 5% ***significant at 1% 1 2 3 4 5
Allergy
RX Allegra Zyrtec Clarinex Allergy Shots
Capitated Visit 0.001 0.001 -0.001 0 0.003*** [0.002] [0.001] [0.001] [0.000] [0.001] AllergyOTC -0.018*** -0.004** 0.004*** 0.004*** 0.009*** [0.003] [0.001] [0.001] [0.001] [0.001] Capitated Visit * AllergyOTC -0.003 -0.002* 0.001 -0.001 -0.008*** [0.002] [0.001] [0.001] [0.000] [0.001] Private Insurance 0.008*** 0.004*** 0.001* 0 0.003*** [0.002] [0.001] [0.001] [0.000] [0.001] Medicare 0.001 0.002 0 0 0.002* [0.002] [0.001] [0.001] [0.000] [0.001] Female 0.004*** 0.002*** 0.002*** 0 0.001** [0.001] [0.001] [0.000] [0.000] [0.000] White 0.005 0.005 -0.002 -0.002 -0.001 [0.006] [0.003] [0.003] [0.001] [0.003] Black 0.005 0.004 -0.003 -0.001 -0.002 [0.006] [0.003] [0.003] [0.001] [0.003] Asian 0.009 0.008** -0.002 0 0 [0.007] [0.004] [0.004] [0.001] [0.003] Hispanic -0.001 0 -0.002* 0 0 [0.002] [0.001] [0.001] [0.000] [0.001] Age 0.000*** 0.000*** -0.000*** 0.000** 0.000*** [0.000] [0.000] [0.000] [0.000] [0.000] Age^2 -0.000*** -0.000*** 0.000*** -0.000** -0.000*** [0.000] [0.000] [0.000] [0.000] [0.000] Acute 0.024*** 0.006*** 0.006*** 0.001*** -0.003*** [0.001] [0.001] [0.001] [0.000] [0.001] Chronic Routine 0.013*** 0.002*** 0.005*** 0.001* 0.007*** [0.001] [0.001] [0.001] [0.000] [0.001]
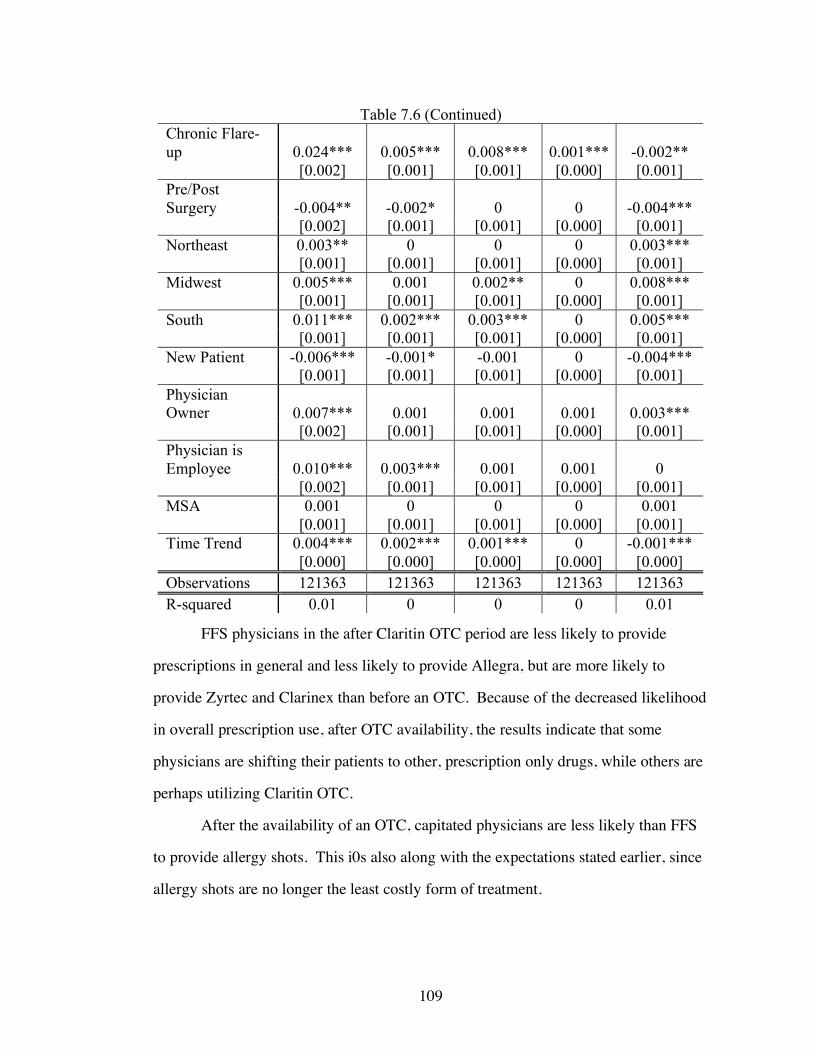
109
Table 7.6 (Continued) Chronic Flare-up 0.024*** 0.005*** 0.008*** 0.001*** -0.002** [0.002] [0.001] [0.001] [0.000] [0.001] Pre/Post Surgery -0.004** -0.002* 0 0 -0.004*** [0.002] [0.001] [0.001] [0.000] [0.001] Northeast 0.003** 0 0 0 0.003*** [0.001] [0.001] [0.001] [0.000] [0.001] Midwest 0.005*** 0.001 0.002** 0 0.008*** [0.001] [0.001] [0.001] [0.000] [0.001] South 0.011*** 0.002*** 0.003*** 0 0.005*** [0.001] [0.001] [0.001] [0.000] [0.001] New Patient -0.006*** -0.001* -0.001 0 -0.004*** [0.001] [0.001] [0.001] [0.000] [0.001] Physician Owner 0.007*** 0.001 0.001 0.001 0.003*** [0.002] [0.001] [0.001] [0.000] [0.001] Physician is Employee 0.010*** 0.003*** 0.001 0.001 0 [0.002] [0.001] [0.001] [0.000] [0.001] MSA 0.001 0 0 0 0.001 [0.001] [0.001] [0.001] [0.000] [0.001] Time Trend 0.004*** 0.002*** 0.001*** 0 -0.001*** [0.000] [0.000] [0.000] [0.000] [0.000] Observations 121363 121363 121363 121363 121363 R-squared 0.01 0 0 0 0.01
FFS physicians in the after Claritin OTC period are less likely to provide
prescriptions in general and less likely to provide Allegra, but are more likely to
provide Zyrtec and Clarinex than before an OTC. Because of the decreased likelihood
in overall prescription use, after OTC availability, the results indicate that some
physicians are shifting their patients to other, prescription only drugs, while others are
perhaps utilizing Claritin OTC.
After the availability of an OTC, capitated physicians are less likely than FFS
to provide allergy shots. This i0s also along with the expectations stated earlier, since
allergy shots are no longer the least costly form of treatment.

110
Because the dependent variables in this analysis are all binary, probits were
also conducted. The results of these estimations are found in Table A.1. in the
Appendix section. Marginal effects were also found for these estimations with results
in Table A.3. Both the probit results and the marginal effects follow along the same
lines as the OLS regressions above with similar significant results and the same signs
of the coefficients. The marginal effect results show that under capitation, physicians
are less likely to provide Zyrtec, by 0.1%, but more likely to provide allergy shots,
than FFS by 0.1% before Claritin OTC. After the availability of an OTC, FFS
physicians are 1.5% less likely to provide prescriptions and 0.4% less likely to provide
Allegra to patients. FFS phys0icians are, however, more likely to provide allergy
shots in the post OTC period by 0.4%. Capitated physicians are 0.2% less likely than
FFS to provide Allegra and 0.1% less likely to provide allergy shots, after the
availability of an OTC.
In other results, private insurance patients are more likely than Medicaid to get
any allergy prescription, as well as Allegra, Zyrtec, and allergy shots for the entire
population. Medicare is more likely than Medicaid to get allergy shots. Females were
more likely to get allergy prescriptions, Allegra, Zyrtec, and allergy shots as well.
Acute patients are less likely than preventive care patients to get allergy shots, as
expected since this form of treatment is normally used for those with more severe
conditions. Chronic routine patients are more likely to get allergy shots, while those
with flare-ups are less likely to get shots than preventive care patients.
The regression results found in Table 7.7 repeat the same analysis as from
Table 7.6. These results, however, are for the insured sample with an allergy related
diagnosis.

111
Table 7.7
Allergy OLS Regression Results for Insured Allergy Sample NAMCS 1997 – 2004
(Note - Regressions exclude years 2001 and 2002)
Standard Errors in Brackets
*significant at 10% **significant at 5% ***significant at 1% 1 2 3 4 5
Allergy
RX Allegra Zyrtec Clarinex Allergy Shots
Capitated Visit 0.005 0.014* -0.006 0 0.005 [0.014] [0.008] [0.009] [0.003] [0.008] AllergyOTC -0.120*** -0.033*** 0.027** 0.022*** 0.071*** [0.022] [0.013] [0.013] [0.005] [0.012] Capitated Visit * AllergyOTC -0.013 -0.020* 0.007 -0.005 -0.054*** [0.019] [0.011] [0.011] [0.005] [0.010]
Private Insurance 0.022 0.011 0.003 0.001 0.013* [0.013] [0.008] [0.008] [0.003] [0.007] Medicare 0.014 0.009 -0.007 -0.001 0.017* [0.019] [0.011] [0.011] [0.005] [0.010] Female 0.012 0.006 0.012** 0 0.002 [0.008] [0.005] [0.005] [0.002] [0.004] White 0.054 0.028 0.018 -0.024** -0.011 [0.050] [0.029] [0.030] [0.012] [0.027] Black 0.067 0.034 0.005 -0.02 -0.027 [0.051] [0.029] [0.031] [0.012] [0.027] Asian 0.064 0.052* 0 -0.015 -0.002 [0.053] [0.031] [0.032] [0.013] [0.028] Hispanic 0.001 0.005 -0.012 -0.003 0.007 [0.014] [0.008] [0.009] [0.003] [0.008] Age 0.004*** 0.003*** -0.001*** 0.000*** 0.001*** [0.001] [0.000] [0.000] [0.000] [0.000] Age^2 -0.000*** -0.000*** 0.000** -0.000** -0.000*** [0.000] [0.000] [0.000] [0.000] [0.000] Acute 0.021 0.016* -0.013 0.002 -0.106*** [0.015] [0.009] [0.009] [0.004] [0.008] Chronic Routine 0.014 0.011 -0.012 -0.001 0.009 [0.016] [0.009] [0.010] [0.004] [0.009] Chronic Flare-up 0.053*** 0.016 0.003 0.003 -0.098*** [0.018] [0.010] [0.011] [0.004] [0.010]
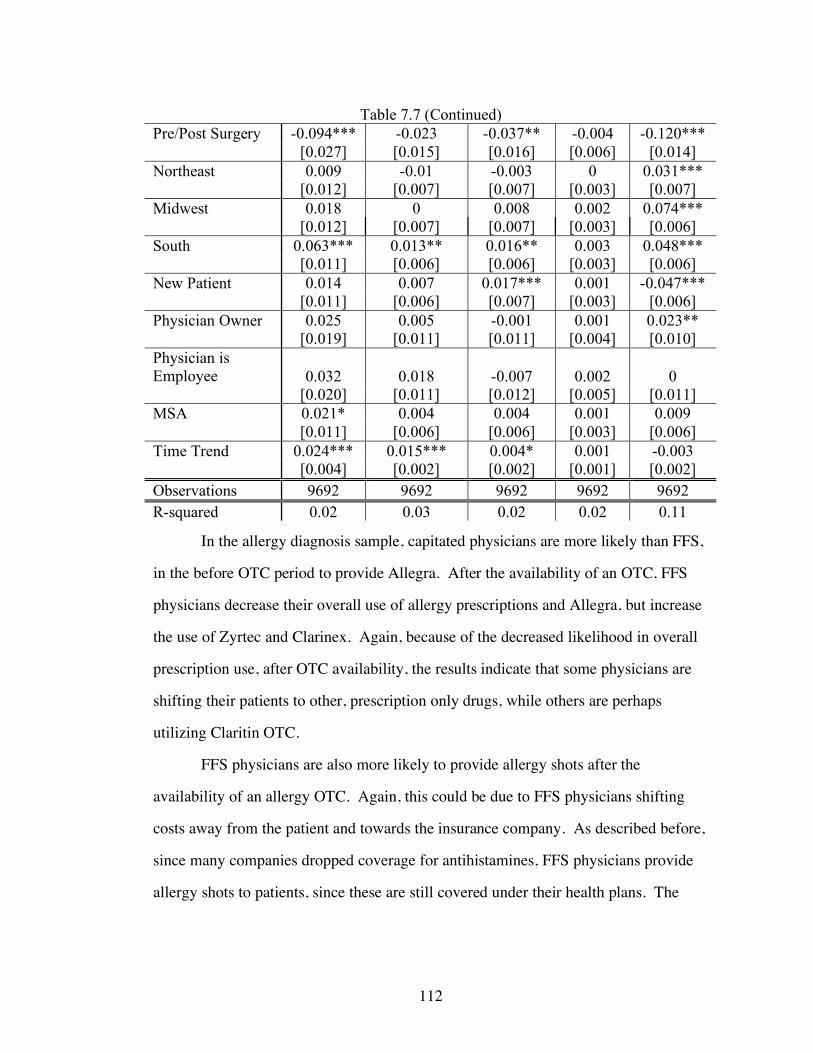
112
Table 7.7 (Continued) Pre/Post Surgery -0.094*** -0.023 -0.037** -0.004 -0.120*** [0.027] [0.015] [0.016] [0.006] [0.014] Northeast 0.009 -0.01 -0.003 0 0.031*** [0.012] [0.007] [0.007] [0.003] [0.007] Midwest 0.018 0 0.008 0.002 0.074*** [0.012] [0.007] [0.007] [0.003] [0.006] South 0.063*** 0.013** 0.016** 0.003 0.048*** [0.011] [0.006] [0.006] [0.003] [0.006] New Patient 0.014 0.007 0.017*** 0.001 -0.047*** [0.011] [0.006] [0.007] [0.003] [0.006] Physician Owner 0.025 0.005 -0.001 0.001 0.023** [0.019] [0.011] [0.011] [0.004] [0.010] Physician is Employee 0.032 0.018 -0.007 0.002 0 [0.020] [0.011] [0.012] [0.005] [0.011] MSA 0.021* 0.004 0.004 0.001 0.009 [0.011] [0.006] [0.006] [0.003] [0.006] Time Trend 0.024*** 0.015*** 0.004* 0.001 -0.003 [0.004] [0.002] [0.002] [0.001] [0.002] Observations 9692 9692 9692 9692 9692 R-squared 0.02 0.03 0.02 0.02 0.11
In the allergy diagnosis sample, capitated physicians are more likely than FFS,
in the before OTC period to provide Allegra. After the availability of an OTC, FFS
physicians decrease their overall use of allergy prescriptions and Allegra, but increase
the use of Zyrtec and Clarinex. Again, because of the decreased likelihood in overall
prescription use, after OTC availability, the results indicate that some physicians are
shifting their patients to other, prescription only drugs, while others are perhaps
utilizing Claritin OTC.
FFS physicians are also more likely to provide allergy shots after the
availability of an allergy OTC. Again, this could be due to FFS physicians shifting
costs away from the patient and towards the insurance company. As described before,
since many companies dropped coverage for antihistamines, FFS physicians provide
allergy shots to patients, since these are still covered under their health plans. The
113
patient, hence, does not have to bear the full cost of a prescription, but can instead pay
the copay amounts associated with shots.
Capitated physicians are less likely than FFS to provide allergy shots for this
population, after the availability of an OTC. Again, this is as expected since allergy
shots are no longer the least costly form of treatment. After the availability of Claritin
OTC, capitated physicians are also less likely than FFS to provide Allegra.
The probit and marginal effects results for the allergy sample are found in
Tables A.2. and A.4., respectively. According the table from the marginal effects
estimations, none of results for the pre-OTC capitation variable are significant. In the
post-OTC period, FFS physicians are 10.8% less likely to give out prescriptions and
are 3.6% less likely to prescribe Allegra; however, these physicians are more likely to
give allergy shots by 1.9%. After the availability of Claritin OTC, capitated
physicians, compared to FFS, are less likely to prescribe Allegra by 1.5% and less
likely to provide allergy shots by 0.6%.
Both private insurance and Medicare patients are more likely than Medicaid to
get allergy shots. Females are more likely to get Zyrtec in the allergy group and
whites are less likely to get Clarinex. With this sample as well, acute patients are less
likely than preventive care to get allergy shots, as are chronic flare-up patients.
Severity Results
It is expected that after the availability of an OTC, the overall case-mix of
patients seen in physician offices will be of higher severity. The measures used to
examine severity include: seeing a specialist physician; and the nature of the condition
(acute, chronic routine, and chronic flare-up). Both time spent with the
physician/specialist as well as total number of diagnostic tests are also examined, but
are not used as measures of severity. The severity of patient case-mix is expected to
change only for the allergy diagnosis sample, since the drug moving to the OTC
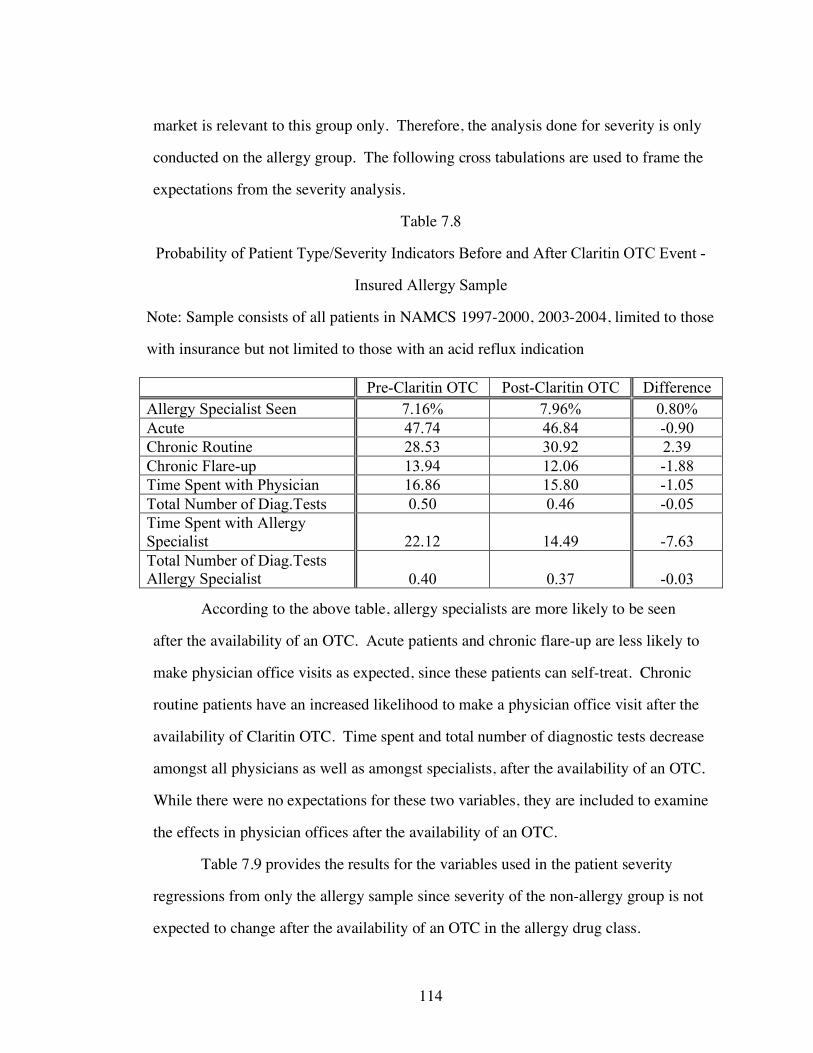
114
market is relevant to this group only. Therefore, the analysis done for severity is only
conducted on the allergy group. The following cross tabulations are used to frame the
expectations from the severity analysis.
Table 7.8
Probability of Patient Type/Severity Indicators Before and After Claritin OTC Event -
Insured Allergy Sample
Note: Sample consists of all patients in NAMCS 1997-2000, 2003-2004, limited to those
with insurance but not limited to those with an acid reflux indication Pre-Claritin OTC Post-Claritin OTC Difference Allergy Specialist Seen 7.16% 7.96% 0.80% Acute 47.74 46.84 -0.90 Chronic Routine 28.53 30.92 2.39 Chronic Flare-up 13.94 12.06 -1.88 Time Spent with Physician 16.86 15.80 -1.05 Total Number of Diag.Tests 0.50 0.46 -0.05 Time Spent with Allergy Specialist 22.12 14.49 -7.63 Total Number of Diag.Tests Allergy Specialist 0.40 0.37 -0.03
According to the above table, allergy specialists are more likely to be seen
after the availability of an OTC. Acute patients and chronic flare-up are less likely to
make physician office visits as expected, since these patients can self-treat. Chronic
routine patients have an increased likelihood to make a physician office visit after the
availability of Claritin OTC. Time spent and total number of diagnostic tests decrease
amongst all physicians as well as amongst specialists, after the availability of an OTC.
While there were no expectations for these two variables, they are included to examine
the effects in physician offices after the availability of an OTC.
Table 7.9 provides the results for the variables used in the patient severity
regressions from only the allergy sample since severity of the non-allergy group is not
expected to change after the availability of an OTC in the allergy drug class.

115
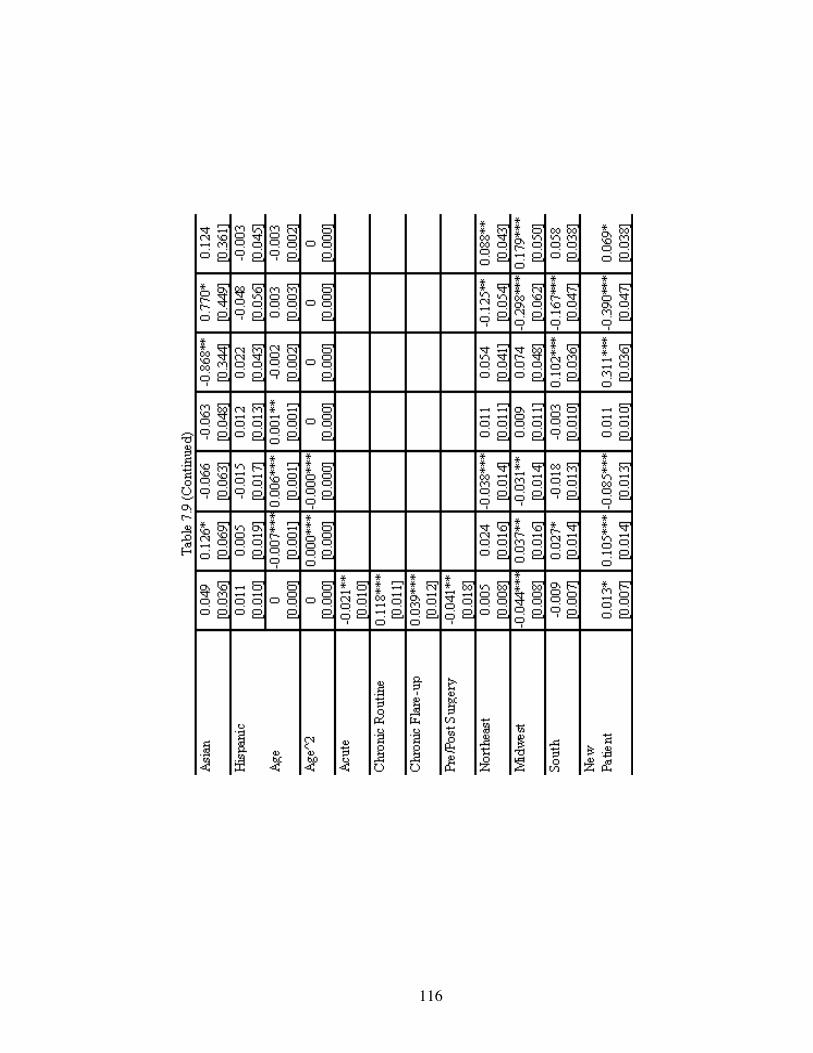
116

117

118
The main variable of interest from these equations is allergy OTC. This variable
is an indicator for when Claritin moves to the OTC market. The above results show
that there is an increased likelihood, after the availability of an OTC, for allergy
patients to see a specialist physician. There is also a decreased likelihood of chronic
flare-up patients making a physician office visit. This is consistent with the earlier
hypothesis that these patients may try to self-treat their temporarily exacerbated
symptoms rather than see a physician. It was expected that acute patients would be
less likely to make physician office visits in the after OTC period. The resulting
coefficient is positive, which is not as expected, but this result is not significant.
It was also found that specialists are less likely to be seen under capitation than
FFS. Acute patients are more likely to be seen and chronic routine are less likely to be
seen under capitated plans than under FFS. Acute patients are less likely to be seen by
specialists, as expected since this group is thought to have less severe symptoms.
Tables A.5 and A.6. show the results from the probit and marginal effect
estimations for severity. According to these results, after the availability of an OTC,
there is a 2.5% increase in the likelihood of seeing a specialist physician and a 3.2%
decrease in the likelihood of a Chronic Flare-up patient seen in the physician’s office.
Table 7.10 provides the results of the regressions examining time spent with
the physician and the total number of diagnostic tests ordered. Again, because the
effect of OTC is only expected on the allergy diagnosis, only this group is being
studied.
The results for allergy OTC in these regressions are not significant for
physicians in general, nor are they significant for specialist. Interestingly, capitated
physicians are likely to spend less time with patients than FFS and are more likely to
order tests. This perhaps indicates that capitated physicians substitute time spent with
diagnostic testing.

119
Table 7.10
Time Spent and Diagnostic Tests Regressions NAMCS 1997 – 2004 Allergy Sample
Note – 2001 and 2002 are excluded from these regressions.
Standard Errors in Brackets
*significant at 10% **significant at 5% ***significant at 1%
1 2 3 4
Time Spent with
Physician
Total Number of Diag. Tests
Time Spent with
Specialist Physician
Total Number of Diag.
Tests Specialist Physician
AllergyOTC -0.525 -0.03 -4.187 -0.146 [0.611] [0.040] [3.155] [0.108]
Private Insurance 0.313 -0.100*** 1.263 0.071 [0.381] [0.025] [1.871] [0.064] Medicare 0.199 -0.048 -2.42 -0.103 [0.548] [0.036] [2.894] [0.099] Capitated Visit -0.765*** 0.078*** 1.244 -0.101* [0.276] [0.018] [1.569] [0.054] Female -0.462** 0.017 -2.045* -0.015 [0.223] [0.015] [1.086] [0.037] White 0.185 -0.139 5.557 0.438 [1.417] [0.092] [13.892] [0.476] Black 0.831 -0.038 6.401 0.495 [1.459] [0.095] [13.987] [0.479] Asian -1.055 -0.08 5.8 0.414 [1.514] [0.098] [14.088] [0.483] Hispanic -1.103*** 0.021 -3.567** -0.100* [0.412] [0.027] [1.758] [0.060] Age 0.046*** 0.024*** 0.034 0.011*** [0.017] [0.001] [0.092] [0.003] Age^2 0 -0.000*** 0 -0.000** [0.000] [0.000] [0.001] [0.000] Acute -2.153*** -0.441*** -3.342 0.063 [0.442] [0.029] [2.972] [0.101] Chronic Routine -2.289*** -0.566*** -5.290* 0.019 [0.463] [0.030] [2.713] [0.092]

120
Table 7.10 (Continued) Chronic Flare-up -0.188 -0.494*** 3.355 0.268*** [0.512] [0.033] [2.922] [0.100] Pre/Post Surgery -1.322* -0.808*** -7.346 0.371 [0.766] [0.050] [10.176] [0.349] Northeast -0.872** -0.006 -6.030*** -0.393*** [0.346] [0.023] [1.682] [0.058] Midwest -3.564*** -0.018 0.536 -0.002 [0.341] [0.022] [1.983] [0.068] South -1.290*** -0.006 -4.802*** -0.161*** [0.307] [0.020] [1.496] [0.051] New Patient 5.906*** -0.128*** 25.516*** 0.311*** [0.313] [0.020] [1.572] [0.054] Physician Owner -1.369** -0.018 -6.462 0.008 [0.536] [0.035] [3.971] [0.134] Physician is Employee -0.466 0.128*** 2.146 0.099 [0.566] [0.037] [4.404] [0.149] MSA 0.228 -0.063*** 7.295** -0.138 [0.306] [0.020] [3.311] [0.113] Time Trend -0.011 -0.007 0.332 0.056** [0.114] [0.007] [0.642] [0.022] Observations 9690 9692 721 722 R-squared 0.06 0.11 0.44 0.19
Allergy Market Discussion
The change in regulatory status of Claritin from prescription-only to OTC
spurred many changes in the antihistamine drug class. While Clarinex was launched
by Schering-Plough as an attempt to capture the prescription market share of Claritin,
it was unable to fully accomplish this. Both Allegra and Zyrtec had increased market
shares after the Claritin switch, as expected.
One of the most interesting results of this analysis came with the Allergy Shots
regressions. Allergy shots, before the availability of any OTC products, were the
lowest cost of treatment according to other studies. After the movement of Claritin to
the OTC market, insurance companies no longer covered this drug and in fact many
stopped coverage for antihistamines altogether.
121
As was proposed, capitated physicians had the incentive to reduce the cost of
care in order to maximize their profits. For this reason, according to these results,
capitated physicians were found to be more likely to provide allergy shots than FFS
before the availability of an OTC. After the availability of an OTC, capitated
physicians were less likely than FFS to provide allergy shots, while FFS was more
likely in the after OTC period to provide shots than before. Capitated physicians,
therefore, seem to reduce the use of allergy shots once an OTC becomes available
because these are no longer the lowest cost treatment. From these results, capitated
physicians seem to act as an agent for the insurance company by shifting costs away
from the payer, to the patient. FFS physicians, however, act as an agent for patients,
by protecting them from the full cost of prescription medications when providing
allergy shots in the after OTC period.
The results for the severity regressions indicate that specialists are more likely
to be used after the availability of an OTC. This measure indicates that perhaps
severity has increased, as specialists are more likely to deal with severe patients than
primary care physicians. Also, the results indicate that, in the post OTC period, those
patients with chronic conditions are likely to self-treat, as opposed to visiting a
physician’s office when their symptoms are exacerbated.

122
CHAPTER 8
ACID REFLUX CLASS ANALYSIS
Acid reflux, or heart burn, is characterized by a burning discomfort in the throat or
chest, caused by the presence of acid in the esophagus. Infrequent acid reflux is
typically caused by various types of foods or drinks. Frequent or chronic heart burn is
generally due to permanent changes in the barrier between the esophagus and the
stomach. Gastroesophageal reflux disease (GERD) can be defined as heartburn that
occurs more than twice a week, and can lead to more serious health problems
(NDDIC, 2005). These complications include:
• Esophageal Narrowing – In this condition, cells in the lower esophagus are
damaged due to acid exposure which leads to the formation of scar tissue.
The scar tissue then narrows the food pathway and can interfere with
swallowing.
• Esophageal Ulcer – With this condition, stomach acids create an open sore by
eroding tissues in the esophagus.
• Barrett’s Esophagus - Although uncommon, this disease is caused by repeated
and long-term exposure to stomach acid and causes a cellular change
associated with an increased risk of esophageal cancer (Mayo Clinic, 2005).
Treatments for acid reflux or GERD range from simple lifestyle changes to the
use of medications, and even surgery in more extreme cases. Physicians often initially
recommend patients to adjust particular parts of their lifestyle in order to alleviate
symptoms of acid reflux. These changes include: avoiding alcohol; avoiding
cigarettes; losing weight; eating smaller meals; wearing loose fitted clothing; and
raising the head of a bed 6-8 inches so that the patient is not lying flat, but rather at an
123
angle. Physicians also advise patients to make dietary changes and avoid certain
foods. These foods include: citrus products, such as oranges and lemons; chocolate;
drinks with caffeine; fried foods; garlic and onions; mint flavorings; spicy foods; and
tomato-based products (NDDIC, 2003).
Surgery is not a common treatment for acid reflux or GERD, but it remains an
option for those who have other complications; for those who do not want to remain
dependent on medications; or for those who cannot tolerate these drugs.
Fundoplication is the most common of surgeries and involves tightening the lower
esophageal sphincter to prevent stomach acid from moving into the throat/esophagus.
Endoluminal gastroplication is another form of surgery in which stitches are sewn into
the stomach, near the weakened sphincter to strengthen it and prevent the flow of acid
into the esophagus. Finally, the stretta procedure uses radiofrequency energy to melt
tissues within the esophagus that contain the weakened valve (Mayo Clinic, 2005).
Acid Reflux Medications
The use medication is the most common form of treatment for acid-
reflux/GERD. Drugs in this category are widely available and include both over-the-
counter and prescription-only products. Antacids, one of the oldest acid reflux
medications, neutralize stomach acids and usually provide quick-relief. These are
OTC products and are generally used by those with mild or occasional heart burn
problems. Some familiar antacids include: Maalox, Mylanta, Rolaids, and Tums.
Histamine-2 (H-2) Antagonists, also known as H-2 Receptor Blockers, reduce
the production of acid, instead of acting as neutralizing agents like Antacids. These
drugs do not act as quickly as their earlier counterparts; however they do provide
longer relief. Some brand names included in this category are: Tagamet, Pepcid AC,
Axid, or Zantac. H-2 Antagonists are readily available in the OTC market.

124
Proton pump inhibitors (PPIs) are the youngest of acid-reflux medications;
they are long-acting; and the most effective. These drugs work by blocking the
production of acid and thereby allow time for the esophageal tissue that has been
damaged by stomach acids, to heal. Common brands of PPIs include: Prilosec,
Nexium, Prevacid, and Protonix (Mayo Clinic, 2005).
Prilosec
Prilosec, the world’s most prescribed drug from 1996 – 2000, was a major
entrant into the OTC market in 2003. H-2 Antagonists such as Zantac and Tagamet,
along with antacids were the products already in the OTC market, while the more
effective proton pump inhibitors (PPIs) such as Prilosec and Prevacid were available
by prescription only. Because the drug was approaching patent expiration, Astra-
Zeneca made Prilosec the first of the PPIs to switch to the OTC market (Goozner,
2004).
Rx-to-OTC switches can be less profitable for companies that are solely
involved in the prescription-only market. Therefore, some of these companies create
partnerships for OTC marketing with companies that have the infrastructure and
expertise to market the drug as a consumer product. In order to ensure a successful
switch, Astra-Zeneca, the parent company of Prilosec, created a licensing agreement
with Proctor & Gamble and the two companies conducted the switch of Prilosec
jointly (Mahecha, 2006). Both companies worked closely to develop the clinical data
needed for the Rx-to-OTC switch and because of Procter & Gamble’s success in
bringing consumer health care products to market, it handled the marketing and
distribution of Prilosec OTC in the U.S. and Puerto Rico (National Heartburn
Alliance, 2002).
A great deal of debate took place between these companies and the FDA
regarding claims, usage, and the risk for more serious conditions, such as ulcers and

125
gastroesophageal reflux disease to go undiagnosed. Eventually Prilosec was approved
for OTC sales on June 20, 2003. Prilosec was also given the 3 year Hatch Waxman
extension, giving it market exclusivity until June 20, 2006 (FDA Orange Book, 2006).
The first year of Prilosec OTC sales were nearly $300 million (Mahecha, 2006).
Astra-Zeneca attempted to transition patients off from Prilosec, even before it
was moved to the OTC market, to their younger prescription-only PPI, Nexium, which
still had patent protection. The parent company of both these drugs had intensive
DTC and detailing promotions to move people to the “new purple pill”. These
advertising efforts were successful as can be seen by the market shares of these
medications. Prilosec had 40% of the market share for worldwide sales of PPIs in
2002, the year before it moved into the OTC market. Nexium took over some of this
by claiming a 30% market share in 2003. Although it had switched to the OTC
market, Prilosec still maintained nearly 20% of the market even after 2003.
Overall, PPIs performed well in terms of sales, even after the switch of
Prilosec. Total sales for this category were up by 11.6% and made PPIs the top selling
drug class for 2003. Individually, drugs also performed well: Prevacid was up 9%;
Nexium was up 54%; and Protonix was up 52% (Gebhart, 2004).
Figure 8.1 shows the percent of market share of worldwide sales for each PPI
and for Zantac, an H2 Antagonist. Zantac is included because, even though it is an
OTC for all years included, it is one of Prilosec’s major competitors, especially in the
earlier years of the graph. The percent market share of Prilosec peaks in 1999. After
2001, Prilosec’s percent market share declines substantially per year. This is the same
year in which Nexium is introduced. By 2003, Nexium becomes the market leader,
followed by Prevacid. While Protonix is the newest of the Proton Pump Inhibitor
class, its market share remains below 20% for the entire time period depicted in the
figure.

126
0.0%
10.0%
20.0%
30.0%
40.0%
50.0%
60.0%
70.0%
1997 1998 1999 2000 2001 2002 2003 2004
Year
Pe
rc
en
t o
f W
orld
wid
e S
ale
s
Prilosec Nexium Prevacid Protonix Zantac
Figure 8.1
Percent of Worldwide Sales by Drug - Acid Reflux Class
The companies that make these medications are well known for their heavy
advertising efforts. Figure 8.2 shows the direct-to-consumer advertising amounts for
each of the PPIs, along with the advertising for Zantac. Since Zantac is an OTC
medication throughout the time period of this analysis, the regulations for advertising
of this drug are different from those of prescription medications. In addition, it is
generally less expensive to advertise OTC medications because of these more relaxed
rules for advertising. The data from Figure 8.2 was collected through CMR and Med
Ad News, which does not include most OTC drugs. Therefore, the advertising amount
for Prilosec OTC in 2004 is missing from the data. Astra-Zeneca seems to begin the
complete phase out of Prilosec between 2000 and 2001. The company reduces its

127
advertising of Prilosec to nearly nothing in this time period and instead begins its
promotion for Nexium in 2001. Interestingly, this replacement occurs two years
before Prilosec actually moves to the OTC market.
$0
$20,000,000
$40,000,000
$60,000,000
$80,000,000
$100,000,000
$120,000,000
$140,000,000
$160,000,000
$180,000,000
$200,000,000
1997 1998 1999 2000 2001 2002 2003 2004
Year
Ad
ve
rtis
ing
Do
lla
rs S
pe
nt
Prilosec Nexium Prevacid Protonix Zantac
Figure 8.2
Advertising Dollars Spent per Year by Drug – Acid Reflux Class
Acid Reflux NAMCS Data
For the analysis of the acid reflux/GERD market, the NAMCS 1997 – 2000,
2003 - 2004 is used again. As was done with the allergy group, the entire data set was
first used to examine the use of acid reflux drugs because approximately half of the
prescriptions for these medications were given to patients with non-acid reflux
diagnoses. Because of the nature of the NAMCS, in that diagnoses are very
specifically defined, it was not possible to find any one non-acid reflux diagnosis that
dominated these prescriptions.

128
The data was then limited to only those patients with an acid-reflux or related
diagnosis. The data was also restricted, both for the entire population as well the acid-
reflux population, to just the insured. This is done so that the effects of capitation and
FFS can be compared clearly, without drawing in comparisons with the uninsured
group.
This data, when restricted to the insured acid reflux group, provides a total
sample of 5,386 acid reflux patient visits, averaging over 800 acid-reflux patient visits
per year. Nearly 57.8% of the acid reflux sub-population is female, while over 85.4%
is white, and the average age is 49.5 years, slightly older than the average for the
entire population. Private insurance covers 60% of the patients, while 29.2% are
covered by Medicare, and 10.8% by Medicaid. Capitated plans were accepted by
27.4% of physicians. Over 70% of acid-reflux patients received a medication at their
visit. While 65.3% received a prescription drug, 14.4% received an OTC, and
approximately 17% of the patients were given an acid reflux prescription. When
describing their major reason for visit, 45.1% claimed to have an acute problem
(symptoms occurring for 3 months or less); over 30% had chronic routine problems;
and 13% had flare-ups of chronic conditions.
The following figures are first used to examine the acid reflux diagnosis in the
NAMCS sample. Figure 8.3 shows the number of prescriptions of each acid reflux
drug for the total NAMCS population. Figure 8.4 shows the number of prescriptions
for each acid reflux drug as well, but for the group diagnosed with an acid reflux
condition. For each of these graphs, it should be noted that Prilosec is classified as an
OTC drug only in 2004.
Prescriptions for Prilosec peak in 2000 and then begin to fall in 2001, the same
year Nexium enters the market. Nexium overtakes Prilosec in number of prescriptions
in 2002. Prevacid has the most number of prescriptions in the NAMCS from 2002 –

129
2004. Prescriptions for Zantac fall in 2004, as expected since this is when Prilosec is
OTC and creates direct competition with Zantac, in the same market.
0
50
100
150
200
250
300
1997 1998 1999 2000 2001 2002 2003 2004
Year
Nu
mb
er
of
Pre
sc
rip
tio
ns
*Prilosec (OTC in 2004) Nexium Prevacid Protonix Zantac (OTC in all years)
Figure 8.3
Number of Prescriptions by Drug NAMCS 1997 – 2004 Total Insured Sample
Both Figures 8.3 and 8.4 seem to follow similar patterns. Physicians are found
to decrease the use of Prilosec for acid reflux patients earlier than they do for all other
patients, as the prescriptions for Prilosec for the acid reflux group peak in 1999, while
they peak in 2000 for the total sample. Just as with the entire insured NAMCS
sample, Prevacid has the most prescriptions from 2002 – 2004 for the group with an
acid reflux related diagnosis. All prescriptions decrease from 2003 – 2004, but Zantac
has the steepest decline, after having reached a peak in 2003 for the acid reflux
diagnosis group. Amongst both populations, Protonix continues a steady increase in
number of prescriptions after its introduction in 2000.
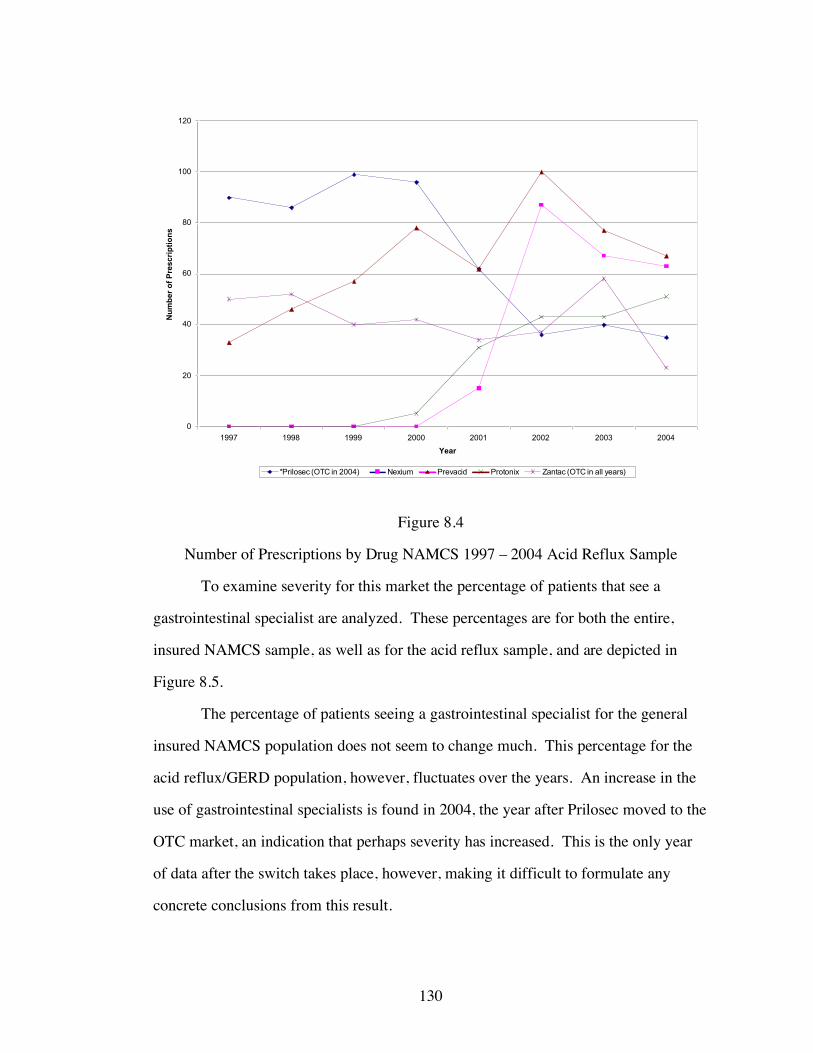
130
0
20
40
60
80
100
120
1997 1998 1999 2000 2001 2002 2003 2004
Year
Nu
mb
er
of
Pre
sc
rip
tio
ns
*Prilosec (OTC in 2004) Nexium Prevacid Protonix Zantac (OTC in all years)
Figure 8.4
Number of Prescriptions by Drug NAMCS 1997 – 2004 Acid Reflux Sample
To examine severity for this market the percentage of patients that see a
gastrointestinal specialist are analyzed. These percentages are for both the entire,
insured NAMCS sample, as well as for the acid reflux sample, and are depicted in
Figure 8.5.
The percentage of patients seeing a gastrointestinal specialist for the general
insured NAMCS population does not seem to change much. This percentage for the
acid reflux/GERD population, however, fluctuates over the years. An increase in the
use of gastrointestinal specialists is found in 2004, the year after Prilosec moved to the
OTC market, an indication that perhaps severity has increased. This is the only year
of data after the switch takes place, however, making it difficult to formulate any
concrete conclusions from this result.

131
0%
2%
4%
6%
8%
10%
12%
14%
16%
18%
1997 1998 1999 2000 2001 2002 2003 2004
Year
Pe
rce
nt
of
Pa
tie
nts
Se
ein
g G
as
tro
inte
sti
na
l S
pe
cia
lis
t
Total Insured Population Insured Acid Reflux/GERD Population
Figure 8.5
Percent of Patients Seeing Gastrointestinal Specialist by Diagnosis Group – NAMCS
1997 – 2004
Severity is also measured using the nature of the patient’s illness, which
includes acute, chronic routine, and chronic flare-up. Acute patients are assumed to
have the least severe conditions since their conditions are short term and may in fact
be temporary. Chronic routine patients are assumed to be more severe because their
conditions have lasted over a longer time period and they are likely to have utilized
more resources in diagnosis and treatment. While chronic flare-up patients are
expected to have severe conditions, they may act more similarly to acute patients since
their conditions are also likely to be short term or temporary.
Figure 8.6 depicts the trend in visits for each of these types of patients for the
acid reflux group. This graph indicates an increase in the number of visits from

132
chronic routine patients between 2003 and 2004. Also, Figure 8.6 indicates a decrease
in the number of visits from acute patients after 2002, and especially after 2003, when
Prilosec moves to the OTC market, while chronic flare-up remains unchanged.
0
10
20
30
40
50
60
1997 1998 1999 2000 2001 2002 2003 2004
Year
Pe
rc
en
t o
f P
ati
en
ts
Acute Chronic Routine Chronic Flare-up
Figure 8.6
Percent of Visits by Patient Type – All Physicians – NAMCS 1997 – 2004 Acid
Reflux Sample
Figure 8.7 also depicts office visits by patient type, but for specialist
physicians. Office visits to specialists by patient type in the above graph vary greatly
year by year. While it is difficult to make any conclusions from this figure, there is a
decrease in acute patients seen in specialist offices after 2003, when Prilosec becomes
available on the OTC market. There is also a leveling off of chronic flare-up patients
after this time period as well, following an increase between 2002 and 2003. Visits
from chronic routine patients increased in 2004.

133
0
10
20
30
40
50
60
70
1997 1998 1999 2000 2001 2002 2003 2004
Year
Pe
rc
en
t o
f P
ati
en
ts
Acute - Specialist Physician Chronic Routine - Specialist Physician Chronic Flare-up - Specialist Physician
Figure 8.7
Percent of Visits by Patient Type – Gastrointestinal Specialists – NAMCS 1997 –
2004 Acid Reflux Sample
Table 8.1 provides the descriptive statistics for the acid reflux group. The data
used for these statistics reflect the same data used in the regression analysis conducted
later. The capitation variable asks whether or not the physician accepts capitated
payments. This variable was only available in the NAMCS survey for the years 1997
– 2000 and then again for the 2003 – 2004 surveys. The capitation variable was not
included in the 2001 and 2002 surveys, and therefore these years are dropped from the
actual regression analysis done later. For this reason, these two years are also not
included in the descriptive statistics table.

134
Table 8.1
Descriptive Statistics - Acid Reflux Insured Sample NAMCS 1997-2000, 2003-2004
Frequency Percentage Mean Standard Deviation Min Max
Year 1997 815 15.13 1998 803 14.91 1999 720 13.37 2000 962 17.86 2003 1047 19.44 2004 1039 19.29
Total Obs. 5386 Gender
Female 3112 57.78 Male (omitted group) 2274 42.22 Age 49.45 23.61 0 100 Race
White 4601 85.43 Black 517 9.60 Asian 236 4.38
Other (omitted group) 32 0.59
Hispanic Ethnicity Yes 430 7.98 No 4956 92.02
Paytype Private Insurance 3233 60.03
Medicare 1570 29.15 Medicaid (omitted
group) 583 10.82
Primary Care Physician?
Yes 2701 50.15 No 2685 49.85

135
Table 8.1 (Continued) Specialist?
Yes 2514 46.68 No 2872 53.32
Gastro Specialist? Yes 527 9.78 No 4859 90.22
Patient Referred for this visit?
Yes 1318 24.47 No 4068 75.53
Has patient been seen here before?
Yes 4442 82.47 No 922 17.12
Missing 22 0.41 Were Any Medications Provided?
Yes 3778 70.14 No 1608 29.85
Total Number of Medications 1.79 1.80 0 6 Were any Prescription Drugs Given?
Yes 3517 65.30 No 1869 34.70
Were any OTC Drugs Given?
Yes 777 14.43 No 4609 85.57
Were any Gastro Prescriptions Given?
Yes 918 17.04 No 4468 82.96

136
Table 8.1 (Continued) Was Nexium Given?
Yes 109 2.02 No 5277 97.98
Was Prevacid Given? Yes 339 6.29 No 5047 93.71
Was Protonix Given? Yes 75 1.39 No 5311 98.61
Was Zantac Given? Yes 256 4.75 No 5130 95.25
Gastro OTC Available
Yes 1036 19.24 No 4350 80.76
Prilosec OTC Market Share 0.04 0.07 0 0.185 Major Reason For Visit
Acute Problem 2430 45.12 Chronic Problem,
Routine 1635 30.36 Chronic Problem,
Flareup 702 13.03 Preventive Care (omitted group) 314 5.83
Pre/Post Surgery 193 3.58 Missing 112 2.08
Region Northeast 952 17.68 Midwest 1285 23.86
South 2043 37.93 West (omitted group) 1106 20.53

137
Table 8.1 (Continued) Metro. Stat. Area
MSA 4390 81.51 Non-MSA 996 18.49
Solo Practice? Yes 1956 36.32 No 3430 63.68
Employment Status of Physician
Owner 3891 72.24 Employee 1261 23.41
Contractor (omitted group) 170 3.16
Missing 64 1.19
Capitation Payment Accepted?
Yes 1478 27.44 No 3908 72.56
Capitation by Insurance Breakdown (Percent are of total Capitated Pop.)
Private Insurance Capitation 986 66.71
Medicare Capitation 340 23.00 Medicaid Capitation 152 10.28
Total 1478 Total Number of Tests 1.04 1.02 0 7 Total Number of Tests with Gastro Specialist 0.76 0.68 0 6 Time Spent with Physician (in minutes) 20.52 12.93 0 240
Time Spent with Gastro Specialist 24.47 15.23 0 120

138
Acid Reflux Results
As mentioned earlier in the theory section, the case mix of patients is expected
to become more severe after the availability of an OTC drug and capitated physicians
are hypothesized to provide OTC medications to minimize costs, thereby maximizing
profits. For the acid reflux group, Proton Pump Inhibitors, as well as one H2
Antagonist, Zantac, are examined. Prilosec is the drug that moves to the OTC market
in 2003, while Nexium, Prevacid, and Protonix are the drugs in the prescription-only
market. Zantac, an OTC in all years of data, is included because of its strong market
share and competition with Prilosec.
The following cross tabulations are used to help frame the predictions of the
effect of an OTC medication for the acid reflux group.
Table 8.2, the probability of receiving each drug, before and after the
availability of Prilosec OTC, is shown. Table 8.3 depicts the probability of each
prescription, before and after Prilosec OTC, but broken down by reimbursement type.
Both of these tables are for the entire insured NAMCS sample. Tables 8.4 and 8.5
repeat these analyses, but for the insured acid reflux population.
Table 8.2 indicates that there is a decreased likelihood of acid reflux
prescriptions in general, after the availability of Prilosec OTC. This table also shows a
decreased likelihood of Zantac being prescribed in the post OTC period. This is
expected, since once Prilosec is on the OTC market, it competes more directly with
Zantac and may take some of its market share. Table 8.4 also shows that there is a
decrease in the likelihood of receiving any acid reflux prescription or Zantac after the
Prilosec OTC period for the acid reflux group. This table also indicates that Prevacid
is less likely to be prescribed after the availability of an OTC amongst those patients
with an acid reflux related diagnosis.
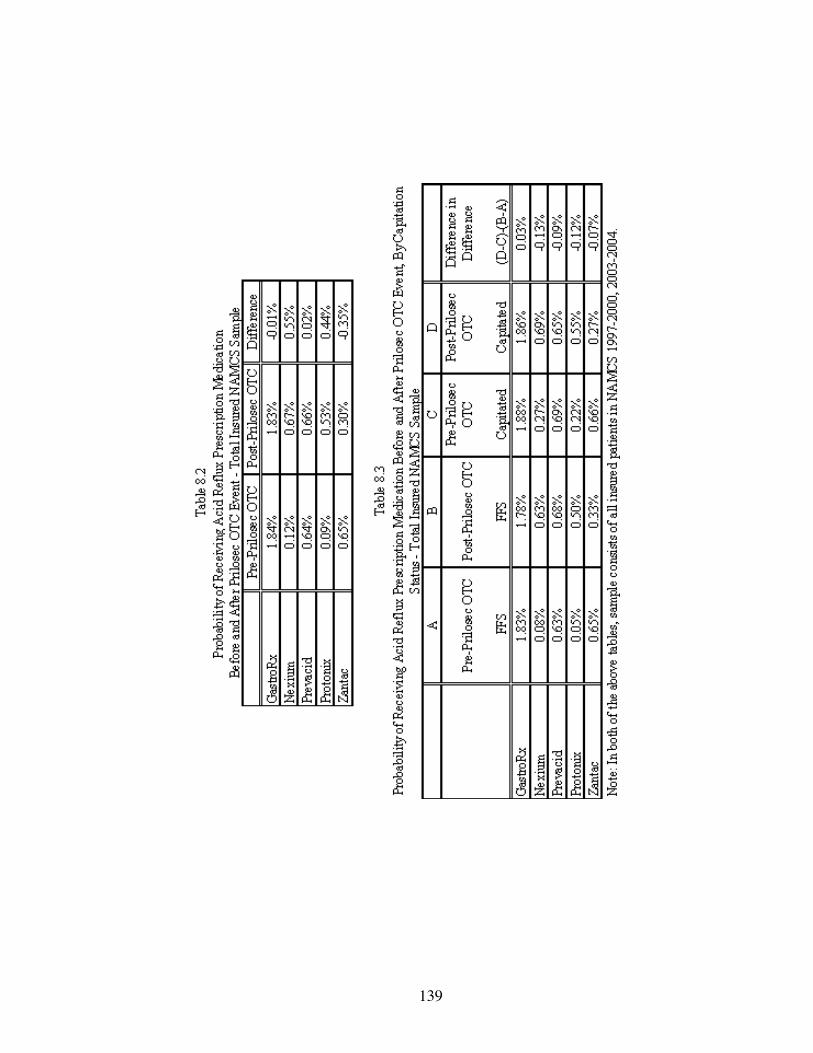
139
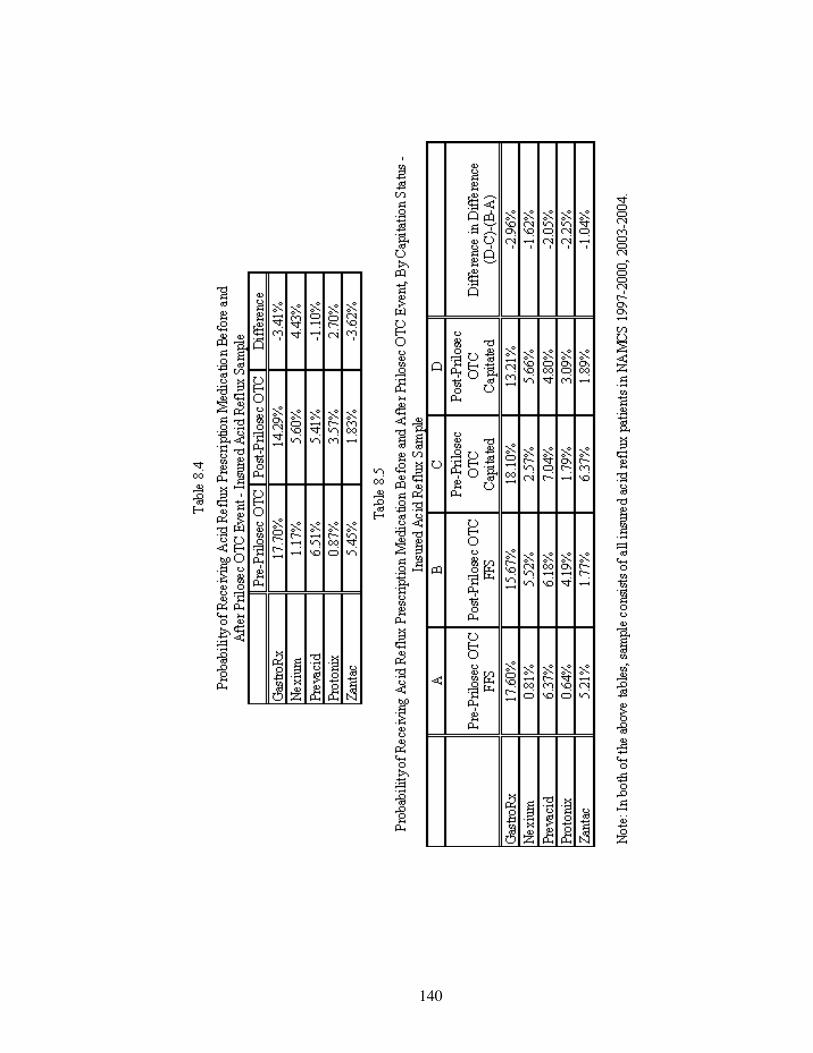
140

141
FFS physicians are expected to continue providing prescription medications to
their patients to ensure repeat visits. Once Prilosec moves to the OTC market, it is
expected that FFS physicians will be likely to move away from prescribing this drug,
and will instead provide more Nexium, Prevacid, or Protonix. In the entire insured
sample, the tabulations in Table 8.3 show an increased probability that FFS physicians
will provide each of the brand name prescriptions, except Zantac. FFS physicians are
likely to provide less Zantac in the post OTC period, as expected, since Prilosec OTC
may be used as a substitute.
Amongst the acid reflux sample, as shown in Table 8.5, FFS physicians are
more likely to provide Nexium and Protonix to patients in the post OTC period. The
table shows that the use of Prevacid decreases after the availability of an OTC, as does
the use of Zantac and acid reflux prescriptions in general.
Capitated physicians, before the availability of a Prilosec OTC are expected to
provide the least costly form of treatment. Amongst the drugs analyzed here, it is
expected that in the before Prilosec OTC period, these physicians will be more likely
to provide patients with Zantac since this is an OTC drug already, and is likely to be
the least expensive.
Once Prilosec moves to the OTC market, it is also expected that the capitated
physician will be even less likely to provide Nexium, Prevacid, or Protonix. Also,
these physicians are likely to decrease their use of Zantac, since they can now
substitute with Prilosec OTC.
Tables 8.3 and 8.5 above show that under capitation, there is a decreased
likelihood of acid reflux prescriptions, in general, after the availability of Prilosec
OTC for both groups. Capitated physicians are likely to increase their use of Nexium
and Protonix in the after OTC period, while they are likely to decrease their use of
Prevacid and Zantac.

142
The difference in difference columns in Tables 8.3 and 8.5 allow for the
comparison of capitation before and after Prilosec OTC with FFS before and after
Prilosec OTC. If there are no differences in their reaction to the availability of an
OTC, the change between the two groups should be zero. The table shows that the
difference is not zero, indicating that the two groups are reacting to the availability of
an OTC differently.
Table 8.6 provides the prescription drug regression results for the entire
insured NAMCS population. The first three independent variables will be the focus
in the analysis of the regression results.
The results show that before the availability of an OTC, for the entire insured
population, capitated physicians are more likely than FFS to provide Zantac, as
expected since this the least costly form of treatment amongst these medications.
Capitated physicians, however, are also more likely than FFS to provide Nexium and
Protonix than FFS before the availability of Prilosec OTC. This was unexpected since
Protonix is the youngest of the PPI medications, and is likely to be the most
expensive.
After the availability of an OTC, it was expected that FFS physicians would be
more likely to use any of the other prescription medications, since they should
transition patients from Prilosec to one of the other prescription-only products. The
results show that FFS physicians in the after Prilosec OTC period are less likely to
provide prescriptions in general and less likely to provide Prevacid. These physicians,
however, are more likely to provide Nexium and Protonix than before Prilosec OTC.
Because of the decreased likelihood in overall prescription use, after OTC availability,
the results indicate that some physicians are shifting their patients to other,
prescription only drugs, while others are perhaps utilizing Prilosec OTC.

143
Table 8.6
Acid Reflux OLS Regression Results for Entire Insured Sample NAMCS 1997 – 2004
(Note - Regressions exclude years 2001 and 2002)
Standard Errors in Brackets
*significant at 10% **significant at 5% ***significant at 1% 1 2 3 4 5
Gastro RX Nexium Prevacid Protonix Zantac Capitated Visit 0.001 0.001* 0 0.001** 0.002*** [0.001] [0.000] [0.001] [0.000] [0.001] GastroOTC -0.006*** 0.001* -0.002** 0.002*** 0.001 [0.002] [0.001] [0.001] [0.001] [0.001] Capitated Visit * GastroOTC 0.001 0 0 0 -0.002* [0.002] [0.001] [0.001] [0.001] [0.001] Private Insurance -0.003** 0 -0.001* 0 -0.002** [0.001] [0.000] [0.001] [0.000] [0.001] Medicare -0.001 0 -0.001 0 -0.001 [0.002] [0.001] [0.001] [0.001] [0.001] Female -0.001 -0.001** 0 0 -0.001 [0.001] [0.000] [0.000] [0.000] [0.000] White 0.002 -0.001 0.002 0.001 0.004 [0.005] [0.002] [0.003] [0.002] [0.003] Black 0.002 -0.001 0.002 0 0.005* [0.005] [0.002] [0.003] [0.002] [0.003] Asian 0.008 0 0.005 0.001 0.006* [0.006] [0.002] [0.003] [0.002] [0.003] Hispanic 0.002 0 0.001 0.001*** 0 [0.002] [0.001] [0.001] [0.000] [0.001] Age 0.001*** 0.000*** 0.000*** 0.000*** 0.000*** [0.000] [0.000] [0.000] [0.000] [0.000] Age^2 -0.000*** -0.000** -0.000*** 0 0 [0.000] [0.000] [0.000] [0.000] [0.000] Acute 0.006*** 0.001 0.003*** 0 0.001** [0.001] [0.000] [0.001] [0.000] [0.001] Chronic Routine 0.008*** 0.001** 0.003*** 0.001 0.002** [0.001] [0.000] [0.001] [0.000] [0.001]
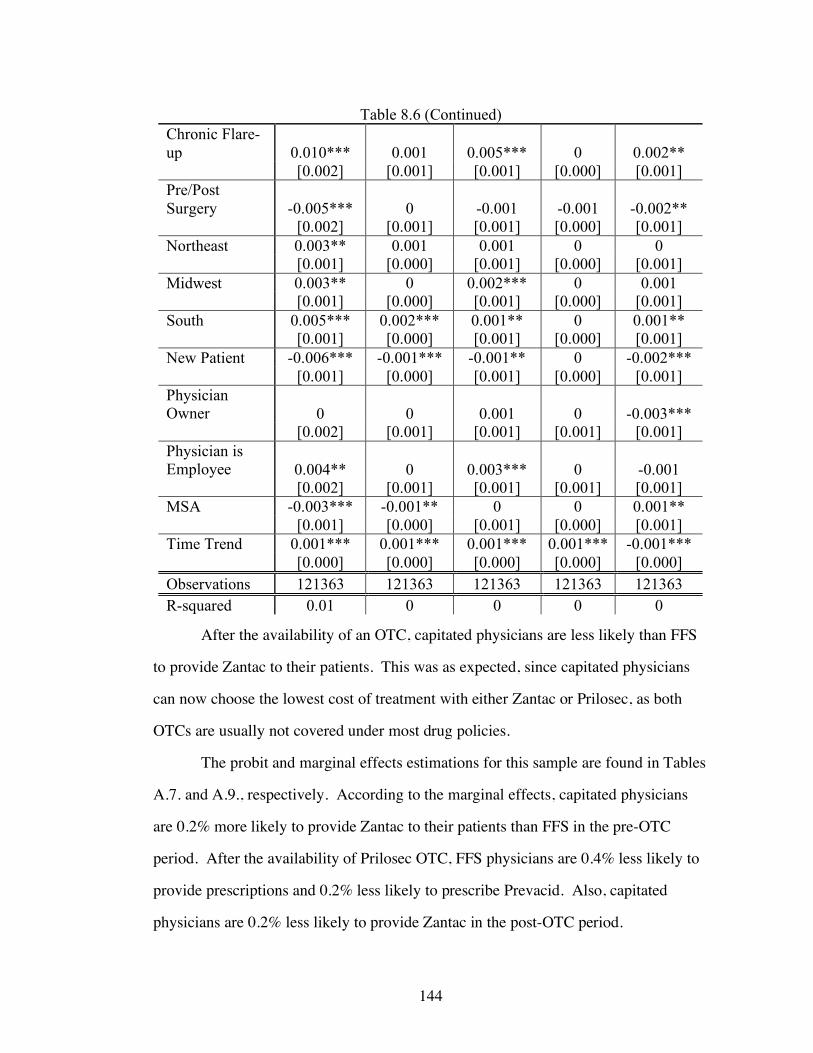
144
Table 8.6 (Continued) Chronic Flare-up 0.010*** 0.001 0.005*** 0 0.002** [0.002] [0.001] [0.001] [0.000] [0.001] Pre/Post Surgery -0.005*** 0 -0.001 -0.001 -0.002** [0.002] [0.001] [0.001] [0.000] [0.001] Northeast 0.003** 0.001 0.001 0 0 [0.001] [0.000] [0.001] [0.000] [0.001] Midwest 0.003** 0 0.002*** 0 0.001 [0.001] [0.000] [0.001] [0.000] [0.001] South 0.005*** 0.002*** 0.001** 0 0.001** [0.001] [0.000] [0.001] [0.000] [0.001] New Patient -0.006*** -0.001*** -0.001** 0 -0.002*** [0.001] [0.000] [0.001] [0.000] [0.001] Physician Owner 0 0 0.001 0 -0.003*** [0.002] [0.001] [0.001] [0.001] [0.001] Physician is Employee 0.004** 0 0.003*** 0 -0.001 [0.002] [0.001] [0.001] [0.001] [0.001] MSA -0.003*** -0.001** 0 0 0.001** [0.001] [0.000] [0.001] [0.000] [0.001] Time Trend 0.001*** 0.001*** 0.001*** 0.001*** -0.001*** [0.000] [0.000] [0.000] [0.000] [0.000] Observations 121363 121363 121363 121363 121363 R-squared 0.01 0 0 0 0
After the availability of an OTC, capitated physicians are less likely than FFS
to provide Zantac to their patients. This was as expected, since capitated physicians
can now choose the lowest cost of treatment with either Zantac or Prilosec, as both
OTCs are usually not covered under most drug policies.
The probit and marginal effects estimations for this sample are found in Tables
A.7. and A.9., respectively. According to the marginal effects, capitated physicians
are 0.2% more likely to provide Zantac to their patients than FFS in the pre-OTC
period. After the availability of Prilosec OTC, FFS physicians are 0.4% less likely to
provide prescriptions and 0.2% less likely to prescribe Prevacid. Also, capitated
physicians are 0.2% less likely to provide Zantac in the post-OTC period.
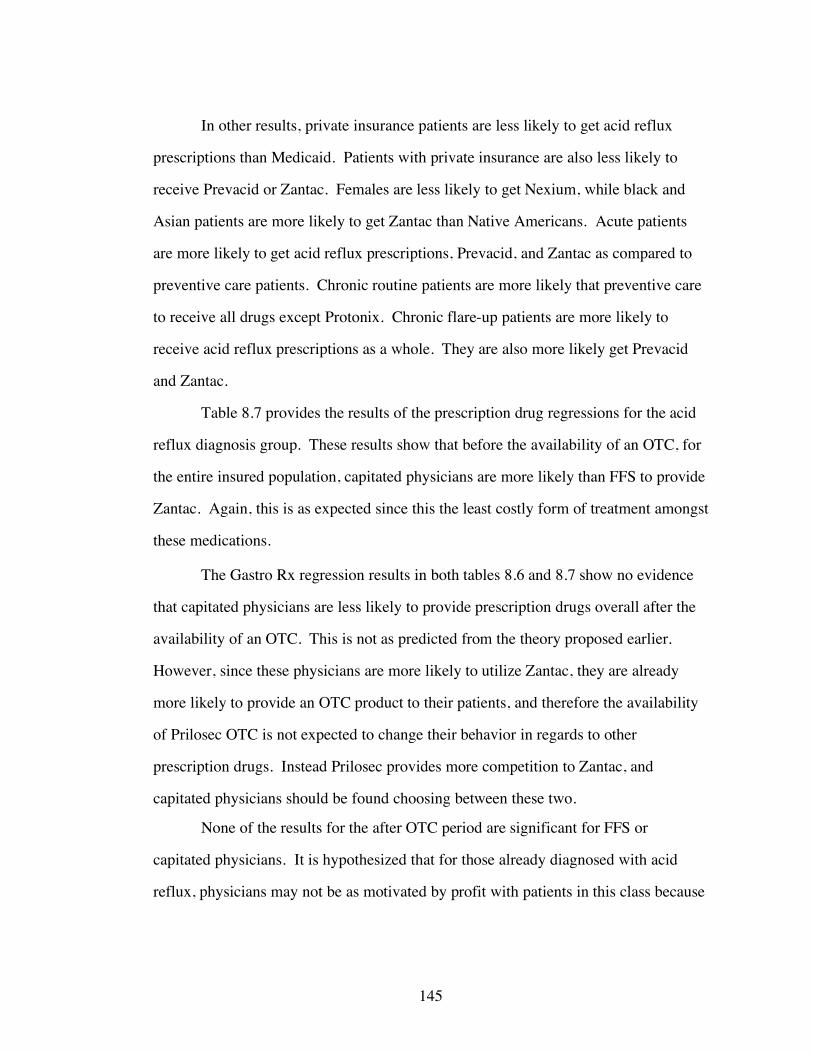
145
In other results, private insurance patients are less likely to get acid reflux
prescriptions than Medicaid. Patients with private insurance are also less likely to
receive Prevacid or Zantac. Females are less likely to get Nexium, while black and
Asian patients are more likely to get Zantac than Native Americans. Acute patients
are more likely to get acid reflux prescriptions, Prevacid, and Zantac as compared to
preventive care patients. Chronic routine patients are more likely that preventive care
to receive all drugs except Protonix. Chronic flare-up patients are more likely to
receive acid reflux prescriptions as a whole. They are also more likely get Prevacid
and Zantac.
Table 8.7 provides the results of the prescription drug regressions for the acid
reflux diagnosis group. These results show that before the availability of an OTC, for
the entire insured population, capitated physicians are more likely than FFS to provide
Zantac. Again, this is as expected since this the least costly form of treatment amongst
these medications.
The Gastro Rx regression results in both tables 8.6 and 8.7 show no evidence
that capitated physicians are less likely to provide prescription drugs overall after the
availability of an OTC. This is not as predicted from the theory proposed earlier.
However, since these physicians are more likely to utilize Zantac, they are already
more likely to provide an OTC product to their patients, and therefore the availability
of Prilosec OTC is not expected to change their behavior in regards to other
prescription drugs. Instead Prilosec provides more competition to Zantac, and
capitated physicians should be found choosing between these two.
None of the results for the after OTC period are significant for FFS or
capitated physicians. It is hypothesized that for those already diagnosed with acid
reflux, physicians may not be as motivated by profit with patients in this class because

146
the illness and complications associated with acid reflux and GERD can be more
serious.
Table 8.7
Acid Reflux OLS Regression Results for Insured Acid Reflux Sample NAMCS 1997 –
2004
(Note – Regressions exclude years 2001 and 2002)
Standard Errors in Brackets
*significant at 10% **significant at 5% ***significant at 1% 1 2 3 4 5
Gastro RX Nexium Prevacid Protonix Zantac Capitated Visit 0.004 0.005 0.001 0.001 0.018** [0.015] [0.006] [0.010] [0.005] [0.009] GastroOTC -0.034 0.007 -0.013 0.008 -0.019 [0.023] [0.009] [0.015] [0.007] [0.013] Capitated Visit * GastroOTC -0.032 -0.003 -0.016 -0.012 -0.018 [0.028] [0.010] [0.018] [0.009] [0.016] Private Insurance 0 -0.003 -0.003 -0.004 -0.007 [0.017] [0.006] [0.011] [0.005] [0.010] Medicare -0.007 -0.004 -0.009 -0.007 0.007 [0.021] [0.008] [0.014] [0.007] [0.012] Female -0.024** -0.005 -0.004 0.002 -0.002 [0.010] [0.004] [0.007] [0.003] [0.006] White 0.032 0.004 0.032 0.026 0.035 [0.066] [0.025] [0.043] [0.021] [0.038] Black 0.021 0.004 0.031 0.025 0.04 [0.068] [0.025] [0.044] [0.021] [0.039] Asian 0.078 -0.003 0.058 0.022 0.062 [0.070] [0.026] [0.046] [0.022] [0.040] Hispanic -0.006 0.005 -0.009 0.009 -0.008 [0.019] [0.007] [0.013] [0.006] [0.011] Age 0.007*** 0.001*** 0.003*** 0.001** 0.001 [0.001] [0.000] [0.001] [0.000] [0.000] Age^2 -0.000*** -0.000* -0.000*** 0 -0.000* [0.000] [0.000] [0.000] [0.000] [0.000] Acute -0.002 0.001 -0.004 0.006 -0.036*** [0.020] [0.007] [0.013] [0.006] [0.011]
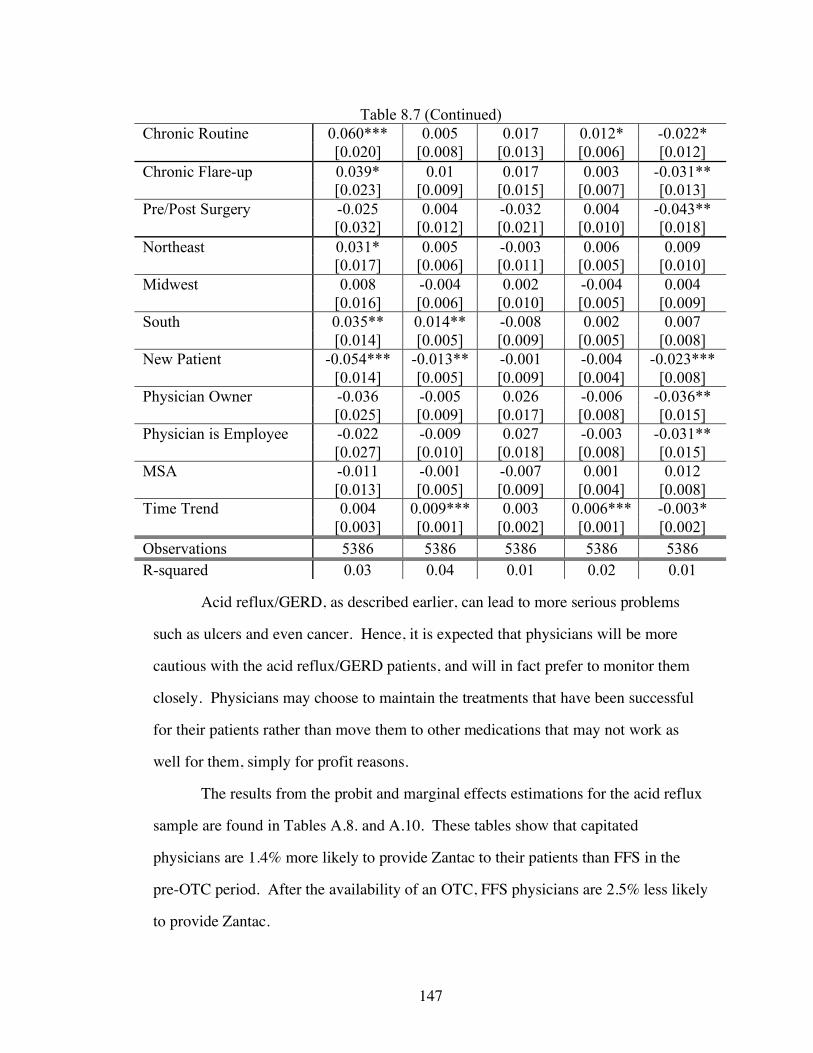
147
Table 8.7 (Continued) Chronic Routine 0.060*** 0.005 0.017 0.012* -0.022* [0.020] [0.008] [0.013] [0.006] [0.012] Chronic Flare-up 0.039* 0.01 0.017 0.003 -0.031** [0.023] [0.009] [0.015] [0.007] [0.013] Pre/Post Surgery -0.025 0.004 -0.032 0.004 -0.043** [0.032] [0.012] [0.021] [0.010] [0.018] Northeast 0.031* 0.005 -0.003 0.006 0.009 [0.017] [0.006] [0.011] [0.005] [0.010] Midwest 0.008 -0.004 0.002 -0.004 0.004 [0.016] [0.006] [0.010] [0.005] [0.009] South 0.035** 0.014** -0.008 0.002 0.007 [0.014] [0.005] [0.009] [0.005] [0.008] New Patient -0.054*** -0.013** -0.001 -0.004 -0.023*** [0.014] [0.005] [0.009] [0.004] [0.008] Physician Owner -0.036 -0.005 0.026 -0.006 -0.036** [0.025] [0.009] [0.017] [0.008] [0.015] Physician is Employee -0.022 -0.009 0.027 -0.003 -0.031** [0.027] [0.010] [0.018] [0.008] [0.015] MSA -0.011 -0.001 -0.007 0.001 0.012 [0.013] [0.005] [0.009] [0.004] [0.008] Time Trend 0.004 0.009*** 0.003 0.006*** -0.003* [0.003] [0.001] [0.002] [0.001] [0.002] Observations 5386 5386 5386 5386 5386 R-squared 0.03 0.04 0.01 0.02 0.01
Acid reflux/GERD, as described earlier, can lead to more serious problems
such as ulcers and even cancer. Hence, it is expected that physicians will be more
cautious with the acid reflux/GERD patients, and will in fact prefer to monitor them
closely. Physicians may choose to maintain the treatments that have been successful
for their patients rather than move them to other medications that may not work as
well for them, simply for profit reasons.
The results from the probit and marginal effects estimations for the acid reflux
sample are found in Tables A.8. and A.10. These tables show that capitated
physicians are 1.4% more likely to provide Zantac to their patients than FFS in the
pre-OTC period. After the availability of an OTC, FFS physicians are 2.5% less likely
to provide Zantac.

148
In the acid reflux sample, the results show that females are less likely to get a
prescription. Acute patients are found to be less likely to get Zantac than preventive
care, as are chronic routine and chronic flare-up. Chronic routine patients are more
likely to get prescriptions in general and are more likely to get Protonix. Chronic
flare-up patients are more likely to get acid reflux prescriptions than preventive care.
Severity Results
It is expected that after the availability of an OTC, the overall case-mix of
patients seen in physician offices will be of higher severity. The measures used to
examine severity include: seeing a specialist physician; and the nature of the condition
(acute, chronic routine, and chronic flare-up). It is assumed that if conditions become
more severe in the patient population seen in physician offices after the availability of
an OTC, there may be a greater use of specialists. This is because these physicians
may be more equipped to handle complicated cases than primary care.
Acute patients are defined here as having the least severe conditions, since
their symptoms have only been present for a short time period (i.e. less than three
months). Chronic routine patients have had symptoms for a longer time and have
most likely used more resources in their diagnosis and treatment. These patients are
therefore considered to be more severe. Chronic flare-up patients, while they may
have severe conditions, they are expected to act similarly to acute patients since their
symptoms could also be temporary.
Time spent with the physician/specialist as well as total number of diagnostic
tests is also examined. These two variables are not used as measures for severity, but
rather to provide insight into the changes in physician offices, if any, after the
availability of an OTC. The severity of patient case-mix is expected to change only
for the acid reflux diagnosis sample, since the drug moving to the OTC market is
relevant to this group only.

149
Table 8.8
Probability of Patient Type/Severity Indicators Before and After Prilosec OTC
Event - Insured Acid Reflux Sample
Note: Sample consists of all patients in NAMCS 1997-2000, 2003-2004, limited to
those with insurance and those with an acid reflux indication
Pre-Prilosec
OTC Post-Prilosec
OTC Difference Gastro Specialist Seen 9.84% 9.56% -0.2800% Acute 45.22 44.69 -0.53 Chronic Routine 30.21 30.98 0.77 Chronic Flare-up 13.22 12.26 -0.96 Time Spent with Physician 20.75 19.55 -1.20 Total Number of Diag.Tests 1.05 0.99 -0.05 Time Spent with Gastro Specialist 26.38 16.21 -10.16 Total Number of Diag.Tests Gastro Specialist 0.82 0.51 -0.31
Table 8.8, used to frame the expectations for severity results, indicates that
there is a decreased likelihood of specialist visits after the availability of Prilosec
OTC. Both Acute and Chronic Flare-up patients are less likely to be seen in physician
offices after the availability of Prilosec OTC, which is in line with the expectation that
these patients will self-treat. Chronic routine patients have an increased likelihood of
an office visit in the post OTC period according to the table above. Time spent and
total number of diagnostic tests decrease amongst all physicians as well as amongst
specialists, after the availability of an OTC. Table 8.9 provides the results for the
variables used in the patient severity regressions. Only the acid reflux class of patients
is used since a change in severity is only expected amongst patients with a diagnosis
relevant to the class in which an OTC has become available.

150

151

152

153
The main variable of interest from these equations is gastro OTC. This
variable is an indicator for when Prilosec moves to the OTC market. The above
results show that there is an increased likelihood, after the availability of an OTC, for
acid reflux patients to see a specialist physician. There is also a decreased likelihood
of acute patients making a physician office visit. This is consistent with the earlier
hypothesis that these less severe patients may try to self-treat. Also, from the probit
and marginal effects tables (A.11. and A.12.) it can be seen that acute patients are
0.41% less likely to visit a physician’s office in the post-OTC period.
In other results, private insurance patients are more likely to be acute patients
than Medicaid and less likely to be chronic routine. Medicare patients are also less
likely to be chronic routine than Medicaid, but are more likely to be chronic flare-up.
Under capitation, patients are more likely to be acute and less likely to be chronic
flare-up.
Table 8.10 provides the results of the regressions examining time spent with
the physician and the total number of diagnostic tests ordered. Again, because the
effect of OTC is only expected on the acid reflux diagnosis, only this group is being
studied.
The results show that time spent with the physician decreases after the
availability of Prilosec OTC. The decrease in time spent after Prilosec OTC is
especially strong amongst specialist physicians. Specialists are also found to be less
likely to use diagnostic tests after Prilosec OTC. Under capitation, there is less time
spent with the physician than under FFS. This is true for both physicians in general,
as well as specialists. Both private insurance and Medicare patients are more likely to
spend time with the specialist than Medicaid.
154
Table 8.10
Time Spent and Diagnostic Tests Regressions NAMCS 1997 – 2004
Acid Reflux Sample
Note – 2001 and 2002 are excluded from these regressions.
Standard Errors in Brackets
*significant at 10% **significant at 5% ***significant at 1% 1 2 3 4
Time Spent with Physician
Total Number of Diag. Tests
Time Spent with Specialist Physician
Total Number of Diag. Tests
Specialist Physician
GastroOTC -1.459** -0.009 -15.222*** -0.249** [0.572] [0.045] [2.115] [0.107]
Private Insurance 0.714 0.005 3.771* -0.078 [0.574] [0.045] [1.937] [0.098]
Medicare 0.722 0.024 4.567** -0.004 [0.700] [0.055] [2.249] [0.114]
Capitated Visit -0.818* 0.044 -2.565* 0.036 [0.421] [0.033] [1.488] [0.076]
Female -0.045 -0.026 -1.315 0.066 [0.339] [0.027] [1.124] [0.057]
White 0.346 -0.065 -32.360*** -0.226 [2.183] [0.172] [7.297] [0.371]
Black -0.181 0.077 -33.745*** -0.025 [2.244] [0.177] [7.656] [0.389]
Asian -2.279 -0.109 -35.801*** -0.012 [2.315] [0.182] [7.623] [0.387]
Hispanic -1.242* 0.057 4.565** -0.138 [0.635] [0.050] [2.126] [0.108]
Age 0.153*** 0.037*** 0.378*** 0.021*** [0.027] [0.002] [0.132] [0.007]
Age^2 -0.001*** -0.000*** -0.003*** -0.000** [0.000] [0.000] [0.001] [0.000]
Acute -3.919*** -0.578*** 0.697 -0.202 [0.644] [0.051] [2.864] [0.146]
Chronic Routine -3.119*** -0.728*** 0.067 -0.406*** [0.671] [0.053] [2.791] [0.142]
Chronic Flare-up -3.109*** -0.688*** -2.786 -0.353** [0.755] [0.059] [2.907] [0.148]

155
Table 8.10 (Continued) Pre/Post Surgery -5.620*** -1.077*** -3.987 -0.492**
[1.066] [0.084] [3.780] [0.192] Northeast 0.995* 0.094** -4.672** 0.487***
[0.553] [0.044] [2.068] [0.105] Midwest -2.917*** 0.023 -11.719*** 0.154
[0.526] [0.041] [2.143] [0.109] South -1.367*** 0.01 -9.053*** 0.436***
[0.476] [0.038] [1.695] [0.086] New Patient 9.449*** 0.007 12.215*** -0.008
[0.450] [0.035] [1.328] [0.067] Physician Owner -1.803** 0.065 -0.498 0.096
[0.837] [0.066] [3.083] [0.157] Physician is Employee -1.14 0.086 1.982 0.026
[0.885] [0.070] [3.281] [0.167] MSA 0.387 0.055 -1.107 0.157**
[0.444] [0.035] [1.570] [0.080] Time Trend 0.149 -0.009 2.008*** -0.019
[0.092] [0.007] [0.325] [0.017] Observations 5383 5386 527 527
R-squared 0.11 0.12 0.37 0.19
Amongst gastrointestinal specialists, the results show strong differences in
time spent with the physician between races. White, black, and Asian patients are all
likely to spend less time with the specialist than Native Americans, while Hispanics
are likely to spend more time. According to Stancioiu (2005), as well as other
researchers, H – pylori infections, associated with ulcers and cancer, are highly
prevalent in both Native American and Hispanic communities. Thus, there is likely to
be an increased amount of time spent with the specialist physician for these two
groups.
Acid Reflux Market Discussion
With the switch in prescription status of Prilosec, the acid reflux/GERD market
saw the gradual phasing out of one drug, with the replacement of a newer one. Years
before Prilosec was to lose patent protection, Astra-Zeneca began to transition patients
off of the older drug and over to Nexium, the “new purple pill” in order to maintain
156
the market share it had with Prilosec. Prevacid, Protonix, and Nexium all begin to
take over market share from Prilosec as it gets closer to the OTC switch. Surprisingly,
Zantac, the oldest of these drugs and an OTC, maintains a steady market share
throughout the years.
The analysis found that capitated physicians are more likely than FFS to use
Zantac and this is consistent with the hypothesis that these physicians utilize the
lowest cost treatment. Not all of the changes in prescribing behavior that were
expected after Prilosec moved to the OTC market, however, were found. As
mentioned earlier, this may be due to the serious complications that can potentially
occur in patients with acid reflux related illnesses. Physicians may choose to provide
prescription drugs for the purpose of being able to monitor patients and prevent any
serious complications that can occur when the illness is untreated. There is an overall
decrease in the use of prescriptions for the total insured sample, indicating that some
physicians are just shifting patients from Prilosec to one of the other medications,
while others increase their usage of Prilosec after it is OTC. Amongst capitated
physicians, strong changes may not have been seen because they were already
utilizing the OTC drug Zantac. Therefore, the effect of Prilosec’s change in regulatory
status was not as much on other prescription medications, as it was on Zantac.
When examining severity the results indicate that there is a decrease in
physician office visits from acute patients, who are less severe, as was expected. This
result indicates that these patients perhaps choose to self treat, rather than make a
physician office visit. It was also found that there is an increased likelihood of
specialist visits after Prilosec OTC, which supports the hypothesis of an increase in the
severity of patient case mix after the availability of an OTC.

157
CHAPTER 9
CONCLUSIONS
The goal of this study was to examine the reaction of physicians as well as
patients to the availability of an OTC medication that is chemically equivalent to its
prescription-only counterparts. Amongst physicians, the differences in prescribing
decisions between fee-for-service and capitated were studied. These physicians were
then compared by reimbursement type before and after the availability of an OTC.
Patient reactions were also examined by analyzing the change in case mix of patients
seen in physician offices after the availability of an OTC.
The main findings from this study were:
• Capitated physicians choose the least costly form of treatment and shift
the responsibility of costs towards patients.
• FFS physicians cost shift away from patients by providing treatments
that are covered by third party payers.
• There is an increased use of specialists after the availability of an OTC,
indicating a higher severity of the patient case-mix.
• Patients with less severe conditions make fewer physician office visits
after the availability of an OTC, causing the overall patient case-mix in
offices to become more severe.
• There is a decreased use of prescriptions overall after the availability of
an OTC, indicating brand loyalty as patients follow drugs to OTC
market.
The results show some evidence of physicians under capitated plans cost
shifting towards the patient, and away from the insurance company and/or themselves.
Capitated physicians are found to utilize the least costly form of treatment before the
availability of these new OTCs, and then shift away from those treatments after the

158
new OTCs are available, as these become the least costly form of care. In the acid
reflux class, these physicians are significantly more likely than FFS to provide Zantac,
an OTC and the least costly form of treatment, to their patients. By providing Zantac,
the physician puts the responsibility of payment solely on the patient, in most cases,
thereby reducing costs for the insurance company.
In the allergy market, capitated physicians are found to be significantly more
likely to provide allergy shots to their patients before the availability of an OTC, as
these are the least costly form of treatment. Once an OTC becomes available,
capitated physicians decrease their usage of allergy shots, perhaps because the OTCs
are of even lower cost. As mentioned earlier, FFS physicians significantly increase
their use of allergy shots after Claritin moves to the OTC market, perhaps because of
an increase in severity. This may also have been the result of FFS physicians
attempting to cost shift away from patients. By providing allergy shots, these
physicians save their patients the total out-of-pocket costs associated with OTCs, since
shots are still covered under most health plans.
There is also some evidence of patients with less severe conditions decreasing
physician office visits after the availability of these new OTC drugs. This indicates
that perhaps these patients are using the medications as a substitute to physician care.
Amongst the acid reflux group, those patients with acute conditions have a statistically
significant decrease in the likelihood of making a physician office visit after Prilosec
moves to the OTC market. In the allergy group there is a significant decrease in the
likelihood of seeing chronic flare-up patients in physician offices. There is also
evidence of an increase in the use of specialist physicians after the availability of an
OTC. In both the allergy as well as the acid reflux group there was a significant
increase in the use of specialist physicians. Both sets of these results indicate that the
overall severity of the patient case mix seen in physician offices, after the availability
159
of an OTC, is higher. In addition, amongst the allergy group, FFS physicians are
found to be more likely to provide allergy shots after the availability of an OTC, also
indicating that severity may have increased.
Finally, in both the allergy and acid reflux groups, overall prescriptions for the
class decrease after the availability of an OTC medication. This indicates that patients
are brand loyal to medications in these groups and follow the drugs to the OTC
market. That is, those patients on Claritin or Prilosec prefer to continue with these
drugs, even though they are on the OTC market, rather than switch to another
prescription-only medication.
Patient Case Mix
The theoretical model developed here shows that the patient case mix seen in
physician offices should be more severe after the availability of OTC medications,
since those patients with milder conditions can self-treat. Empirically, changes in
severity are measured by examining the use of specialist physicians; and the nature of
the patient’s illness, based on the length of time the patient has had symptoms. It was
hypothesized that if the patient case mix worsens, more patients will be seen by
specialists since these physicians are better equipped to manage more severe patients.
Acute patients were defined as those having symptoms for less than three
months. Both chronic routine and chronic flare-up patients are considered to have
more severe symptoms than acute because their illnesses are long term and require
more time and medication for treatment. Once an OTC becomes available, it was
expected that acute patients will self treat and will no longer need to see the physician.
This would drive up the severity of the patient case mix in physician offices. Chronic
flare-up patients are also less likely to make physician office visits after the
availability of an OTC because they may recognize that their symptoms are temporary.

160
These patients may, therefore, choose the OTC treatment rather than make an office
visit.
As mentioned earlier, there was some evidence of an increase in patient
severity seen in physician offices from both the allergy and acid reflux analyses. In
both result sections, there was an increased use of specialist physicians. Acute
patients were less likely to make physician office visits when Prilosec moved to the
OTC market. In addition, chronic flare-up patients were less likely to make an office
visit after the OTC switch of Claritin.
Capitation vs. FFS
The theoretical model developed here also provides the differences in
financial incentives faced by fee-for-service physicians versus those under capitation.
Under this model it can be seen that fee-for-service physicians have the most to gain
with the repeated visits of patients. As the number of visits increases, so does the FFS
physician’s profits since they are not financially liable for any costs. These physicians
are most easily able to induce these visits by providing prescription drugs to their
patients. That is, when a prescription-only drug moves to the OTC market, the model
suggests that FFS physicians that formerly provided that drug will instead switch to
another competitor medication that remains on the prescription-only market. These
physicians choose prescription drugs because patients must return to the office for
refills and physicians can further increase the number of return visits by asking
patients to come back for monitoring reasons.
The capitated physician, on the other hand, sees a decrease in profits with an
increased number of office visits. These physicians become financially responsible
for the care of patients because of the prepaid method insurance companies utilize.
Therefore, as the capitated physician sees patients more, a greater amount is deducted
from the prepaid amount, decreasing profits. In order to minimize costs, it was

161
expected that capitated physicians will utilize the least costly form of care and limit
the number of repeat visits. When a drug becomes available in the OTC market, it
was hypothesized that capitated physicians could decrease patient office visits by
providing this drug instead of prescription-only ones. By advising patients to take an
OTC medication, the physician can reduce the number of repeat visits since these
patients can self-treat in the future. These patients also do not have to come back for
refills or monitoring since the FDA deems these medications as safe.
The major finding of this study shows that capitated physicians, amongst both
drug classes, choose the least costly form of treatment. In the allergy market, when
choosing between prescription drugs only and allergy shots, the capitated physician
treats patients with allergy shots, as these are the more cost-effective option for the
insurance company. Once Claritin moves the OTC market, the cost of antihistamines
falls for insurance companies, as most no longer cover Claritin, and some drop
coverage for all antihistamines. After the availability of OTC Claritin, capitated
physicians decrease the use of allergy shots since they are no longer the most cost-
effective. In the acid reflux class, as well, capitated physicians are found to be more
likely than FFS physicians to choose Zantac, the lowest cost form of treatment before
Prilosec OTC. By utilizing Zantac, capitated physicians are less likely to change their
behavior in relation to prescription medications (Gastro Rx), since they are already
using an OTC. Instead, these physicians may substitute Prilosec OTC for Zantac.
Overall, the results of this study indicate that physicians under a capitated
system are acting as agents for the insurance companies to shift the cost of therapy
from the third party payer to the patient. Even amongst FFS physicians, there is a
decrease in the use of prescription drugs overall, after the availability of an OTC,
leading to the conclusion that patients are brand loyal and follow the medications to
162
the OTC market, even though it may cost them more, as OTCs are generally not
included in drug coverage plans.
Policy Implications
The empirical results from this study suggest that capitation is an effective tool
for aligning physician incentives with those of the insurance company when dealing
with illnesses that are not life threatening. In addition, the availability of an OTC may
be an efficient mechanism to sort patients by severity. When an OTC is available,
both acute and chronic flare-up patients are less likely to be seen in physician offices.
Both of these types of patients have symptoms that are short term. While acute
patients have had their symptoms for less than three months, chronic flare-up also
consists of patients who are possibly having a temporary increase in severity. The
availability of an OTC allows these patients to self treat. If the self treatment is
successful, resources are saved including the time and cost of an office visit. If the
OTC treatment is not successful, the patient can at least receive some level of
temporary relief until he/she is able to see a physician. The downside of this,
however, is that those patients that self treat, but actually should see a physician, may
be delayed unnecessarily. Also, there is the chance that patients could incorrectly
diagnose themselves and thereby attempt self treatment with the wrong type of
medication. Finally, the availability of an OTC, because of more convenient access,
increases the likelihood that patients will utilize these medications even when not
necessary.
Limitations of This Study
Severity. While it was attempted to understand changes in severity for the
entire sample of the data, it was not possible to directly measure it. Without more
detailed information on symptoms, diagnoses, and patient histories, the changes in the

163
severity of patient case-mix, if any, cannot be gauged before and after the availability
of an OTC medication.
Clinical Effects. The analyses for the two drug classes produce somewhat
differing results. While some significant changes in physician behavior are found
under the allergy class, the results are weaker with the acid reflux class. This
difference could be the result of the differing characteristics of each category. That is,
antihistamines and other allergy drugs are generally considered as medications in
which the quality of a patient’s life is improved, but the drug is not necessary for
survival. With acid reflux, however, conditions can worsen in patients causing further
complications such as ulcers and even cancer. For this reason, physicians may feel it
necessary to maintain regular visits with acid reflux patients, so that they can continue
to monitor the illness and prevent progression into something more serious.
Patient Drug Co-pays. By using the NAMCS, it is not possible to determine
how much patients actually pay out-of-pocket for their medications, which may
influence physician incentives. It is very likely that physicians make their medication
choices based on what the patient requests or what is least expensive for the patient.
Without knowing the cost each patient faces, this portion of physician incentives
cannot be analyzed.
Extent of Capitation. While the NAMCS does ask physicians whether or not
they accept capitated payments and whether or not that particular patient visit was
from a capitated plan, it does not ask the extent to which the physician is capitated.
Under capitation some physicians can face plans in which they are minimally
financially responsible for their decisions while others are fully financially responsible
for their therapy choices. There is a vast array of capitated contracts; however, using
the NAMCS the degree to which each physician faces capitation cannot be
determined.

164
Strength of Sample. The OTC switch of Claritin took place in December 2002,
while Prilosec entered the OTC market in mid-2003. The NAMCS data includes the
years 1997 – 2004. This allows only 2 years in the case of Claritin and 1 year in the
case of Prilosec for analysis. Because of the short time period available after the
switch of these drugs, the analyses may not be capturing the full effects from the move
into the OTC market. While those patients that were already on Claritin and Prilosec
most likely followed the drugs closely, other patients, new to these drug classes may
not have been aware of the availability of these medications without physician
approval. Therefore, changes in patient case-mix could perhaps be captured more
accurately with later years of data.
Recommendations for Future Work
As the FDA allows more drugs to move from the prescription-only to the OTC
market, further work can be carried on analyzing the effects of these switches and how
they vary with the diagnosis class. For even the drugs analyzed here, long term
studies can be carried out to determine the true impact of the availability of OTC drugs
on costs and patient access.
Future research can also examine if patients are truly sorted by severity once
an OTC is available, by utilizing data that captures the magnitude of the illness.
Patient health outcomes with this sorting mechanism could also be examined, to
determine if patients are better or worse off with access to more medications on the
OTC market.
When examining physician prescribing behavior, a key factor for future work
would be to incorporate the physician’s exposure to detailing. In addition, more
insight into the exact nature of physician reimbursement plans would be ideal since
physicians are influenced by the incentives set up in these contracts.
165
Finally, more information on patient characteristics would be optimal. Such
data would include factors such as the employment status of the patients, their exact
health plans and drug coverage, and their education. Patient information is important
because physicians are not only influenced by their own incentives, but also the
preferences of their patients.

166
APPENDIX
TABLE A.1. ALLERGY PROBIT REGRESSION RESULTS – TOTAL INSURED
NAMCS SAMPLE 1997 – 2000; 2003 – 2004
Standard Errors in Brackets
*significant at 10% **significant at 5% ***significant at 1% 1 2 3 4 5
Allergy
RX Allegra Zyrtec Clarinex Allergy Shots
Capitated Visit 0.024 0.083* -0.099* -0.061 0.205*** [0.030] [0.050] [0.060] [0.059] [0.064] AllergyOTC -0.322*** -0.319*** 0.115 N/A 0.637*** [0.045] [0.073] [0.076] [0.097] Capitated Visit * AllergyOTC -0.061 -0.117* 0.075 N/A -0.505*** [0.040] [0.062] [0.069] [0.081] Private Insurance 0.134*** 0.235*** 0.071* 0.105 0.295*** [0.029] [0.055] [0.042] [0.110] [0.069] Medicare 0.002 0.158** -0.048 0.037 0.180** [0.039] [0.067] [0.061] [0.142] [0.087] Female 0.071*** 0.093*** 0.106*** 0.041 0.070** [0.016] [0.026] [0.026] [0.059] [0.034] White 0.094 0.308 -0.093 -0.32 -0.168 [0.119] [0.237] [0.146] [0.254] [0.218] Black 0.083 0.255 -0.147 -0.149 -0.269 [0.121] [0.241] [0.152] [0.265] [0.225] Asian 0.143 0.444* -0.13 0.022 -0.091 [0.126] [0.245] [0.165] [0.280] [0.242] Hispanic -0.014 0.003 -0.074 -0.096 -0.001 [0.031] [0.049] [0.049] [0.115] [0.068] Age 0.007*** 0.027*** -0.013*** 0.014*** 0.009*** [0.001] [0.002] [0.002] [0.005] [0.003] Age^2 -0.000*** -0.000*** 0.000*** -0.000*** -0.000*** [0.000] [0.000] [0.000] [0.000] [0.000] Acute 0.436*** 0.352*** 0.351*** 0.319*** -0.702*** [0.027] [0.044] [0.044] [0.110] [0.079] Chronic Routine 0.268*** 0.165*** 0.268*** 0.229** 0.380*** [0.029] [0.046] [0.046] [0.112] [0.045]

167
Table A.1. (Continued) Chronic Flare-up 0.452*** 0.307*** 0.420*** 0.356*** -0.250*** [0.033] [0.054] [0.054] [0.128] [0.080] Pre/Post Surgery -0.239*** -0.184** -0.211** -0.462 N/A [0.050] [0.076] [0.088] [0.294] Northeast 0.058** -0.036 0.007 0.039 0.486*** [0.026] [0.041] [0.042] [0.095] [0.077] Midwest 0.092*** 0.034 0.085** 0.033 0.836*** [0.025] [0.039] [0.041] [0.097] [0.073] South 0.189*** 0.105*** 0.166*** 0.142* 0.641*** [0.023] [0.035] [0.036] [0.083] [0.072] New Patient -0.109*** -0.065* -0.022 -0.101 -0.967*** [0.023] [0.035] [0.036] [0.086] [0.147] Physician Owner 0.128*** 0.125 0.066 0.443 0.303*** [0.042] [0.076] [0.068] [0.318] [0.096] Physician is Employee 0.186*** 0.210*** 0.069 0.449 0.062 [0.044] [0.078] [0.071] [0.323] [0.104] MSA 0.017 0.012 -0.014 0.231** 0.027 [0.022] [0.036] [0.036] [0.114] [0.048] Time Trend 0.071*** 0.126*** 0.045*** -0.005 -0.063*** [0.008] [0.014] [0.014] [0.058] [0.018] Observations 121363 121363 121363 41801 110621
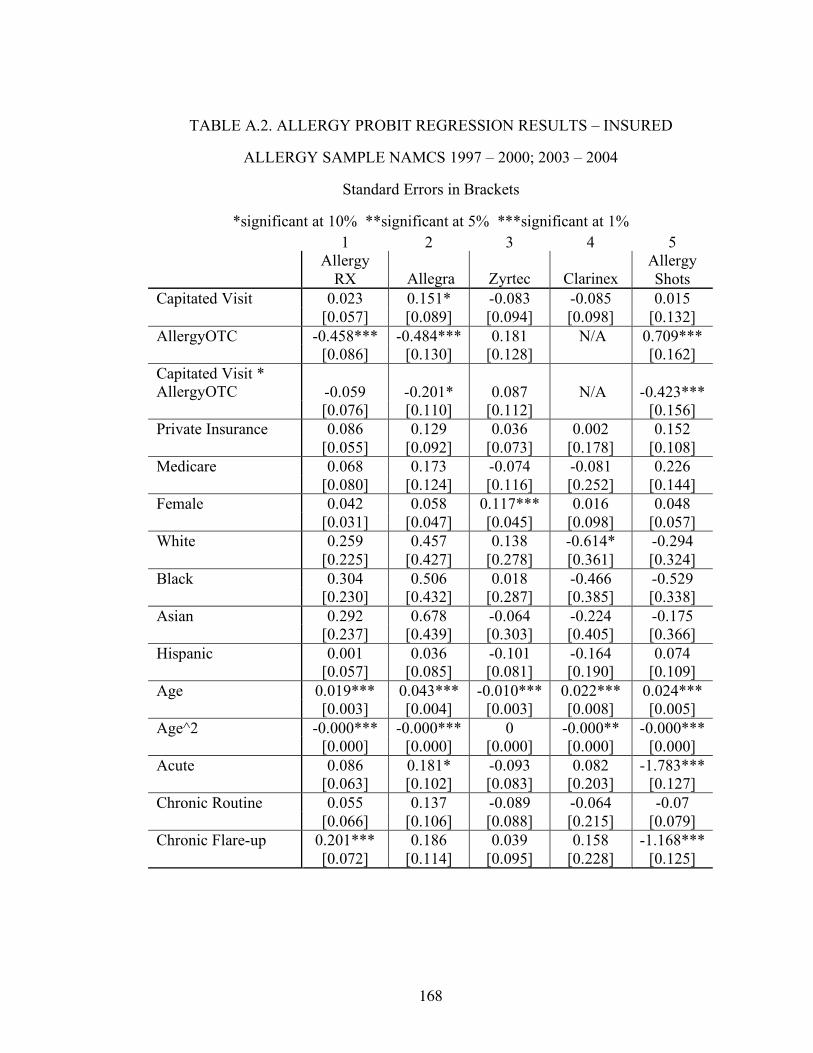
168
TABLE A.2. ALLERGY PROBIT REGRESSION RESULTS – INSURED
ALLERGY SAMPLE NAMCS 1997 – 2000; 2003 – 2004
Standard Errors in Brackets
*significant at 10% **significant at 5% ***significant at 1% 1 2 3 4 5
Allergy
RX Allegra Zyrtec Clarinex Allergy Shots
Capitated Visit 0.023 0.151* -0.083 -0.085 0.015 [0.057] [0.089] [0.094] [0.098] [0.132] AllergyOTC -0.458*** -0.484*** 0.181 N/A 0.709*** [0.086] [0.130] [0.128] [0.162] Capitated Visit * AllergyOTC -0.059 -0.201* 0.087 N/A -0.423*** [0.076] [0.110] [0.112] [0.156] Private Insurance 0.086 0.129 0.036 0.002 0.152 [0.055] [0.092] [0.073] [0.178] [0.108] Medicare 0.068 0.173 -0.074 -0.081 0.226 [0.080] [0.124] [0.116] [0.252] [0.144] Female 0.042 0.058 0.117*** 0.016 0.048 [0.031] [0.047] [0.045] [0.098] [0.057] White 0.259 0.457 0.138 -0.614* -0.294 [0.225] [0.427] [0.278] [0.361] [0.324] Black 0.304 0.506 0.018 -0.466 -0.529 [0.230] [0.432] [0.287] [0.385] [0.338] Asian 0.292 0.678 -0.064 -0.224 -0.175 [0.237] [0.439] [0.303] [0.405] [0.366] Hispanic 0.001 0.036 -0.101 -0.164 0.074 [0.057] [0.085] [0.081] [0.190] [0.109] Age 0.019*** 0.043*** -0.010*** 0.022*** 0.024*** [0.003] [0.004] [0.003] [0.008] [0.005] Age^2 -0.000*** -0.000*** 0 -0.000** -0.000*** [0.000] [0.000] [0.000] [0.000] [0.000] Acute 0.086 0.181* -0.093 0.082 -1.783*** [0.063] [0.102] [0.083] [0.203] [0.127] Chronic Routine 0.055 0.137 -0.089 -0.064 -0.07 [0.066] [0.106] [0.088] [0.215] [0.079] Chronic Flare-up 0.201*** 0.186 0.039 0.158 -1.168*** [0.072] [0.114] [0.095] [0.228] [0.125]

169
Table A.2. (Continued) Pre/Post Surgery -0.494*** -0.324 -0.447** -0.247 N/A [0.128] [0.202] [0.189] [0.419] Northeast 0.032 -0.143* -0.025 0.018 0.629*** [0.050] [0.076] [0.072] [0.168] [0.119] Midwest 0.071 -0.007 0.07 0.157 1.118*** [0.049] [0.072] [0.069] [0.160] [0.112] South 0.240*** 0.120* 0.142** 0.19 0.879*** [0.043] [0.063] [0.061] [0.141] [0.109] New Patient 0.051 0.063 0.142** 0.063 -1.299*** [0.042] [0.061] [0.059] [0.134] [0.191] Physician Owner 0.099 0.103 -0.001 0.28 0.356** [0.078] [0.135] [0.112] [0.438] [0.180] Physician is Employee 0.126 0.228 -0.045 0.33 0.057 [0.082] [0.140] [0.119] [0.447] [0.191] MSA 0.084* 0.042 0.03 0.072 0.051 [0.044] [0.066] [0.063] [0.164] [0.082] Time Trend 0.096*** 0.184*** 0.050** 0.136 -0.037 [0.016] [0.026] [0.024] [0.097] [0.031] Observations 9692 9692 9692 3467 9410

170
TABLE A.3. ALLERGY MARGINAL EFFECT REGRESSION RESULTS –
TOTAL INSURED NAMCS SAMPLE 1997 – 2000; 2003 – 2004
Standard Errors in Brackets
*significant at 10% **significant at 5% ***significant at 1% 1 2 3 4 5
Allergy
RX Allegra Zyrtec Clarinex Allergy Shots
Capitated Visit 0.001 0.001 -0.001* 0 0.001*** [0.002] [0.001] [0.001] [0.000] [0.000] AllergyOTC -0.015*** -0.004*** 0.002 N/A 0.004*** [0.002] [0.001] [0.001] [0.001] Capitated Visit * AllergyOTC -0.003 -0.002** 0.001 N/A -0.001*** [0.002] [0.001] [0.001] [0.000] Private Insurance 0.006*** 0.003*** 0.001* 0.001 0.001*** [0.001] [0.001] [0.001] [0.001] [0.000] Medicare 0 0.003** -0.001 0 0.001* [0.002] [0.001] [0.001] [0.001] [0.000] Female 0.004*** 0.001*** 0.002*** 0 0.000** [0.001] [0.000] [0.000] [0.000] [0.000] White 0.004 0.003* -0.002 -0.003 -0.001 [0.005] [0.002] [0.003] [0.004] [0.001] Black 0.004 0.005 -0.002 -0.001 -0.001* [0.007] [0.006] [0.002] [0.001] [0.000] Asian 0.008 0.011 -0.002 0 0 [0.008] [0.010] [0.002] [0.002] [0.001] Hispanic -0.001 0 -0.001 -0.001 0 [0.002] [0.001] [0.001] [0.001] [0.000] Age 0.000*** 0.000*** -0.000*** 0.000*** 0.000*** [0.000] [0.000] [0.000] [0.000] [0.000] Age^2 -0.000*** -0.000*** 0.000*** -0.000*** -0.000*** [0.000] [0.000] [0.000] [0.000] [0.000] Acute 0.026*** 0.006*** 0.006*** 0.003** -0.002*** [0.002] [0.001] [0.001] [0.001] [0.000] Chronic Routine 0.015*** 0.003*** 0.005*** 0.002* 0.002*** [0.002] [0.001] [0.001] [0.001] [0.000] Chronic Flare-up 0.033*** 0.006*** 0.010*** 0.004* -0.001*** [0.003] [0.001] [0.002] [0.002] [0.000]

171
Table A.3. (Continued) Pre/Post Surgery -0.010*** -0.002*** -0.003*** -0.002*** N/A [0.002] [0.001] [0.001] [0.001] Northeast 0.003** -0.001 0 0 0.003*** [0.001] [0.001] [0.001] [0.001] [0.001] Midwest 0.005*** 0.001 0.001** 0 0.007*** [0.001] [0.001] [0.001] [0.001] [0.001] South 0.010*** 0.002*** 0.003*** 0.001 0.004*** [0.001] [0.001] [0.001] [0.001] [0.001] New Patient -0.005*** -0.001* 0 -0.001 -0.002*** [0.001] [0.000] [0.001] [0.001] [0.000] Physician Owner 0.006*** 0.002* 0.001 0.003* 0.001*** [0.002] [0.001] [0.001] [0.001] [0.000] Physician is Employee 0.010*** 0.004** 0.001 0.005 0 [0.003] [0.002] [0.001] [0.005] [0.000] MSA 0.001 0 0 0.001*** 0 [0.001] [0.001] [0.001] [0.001] [0.000] Time Trend 0.004*** 0.002*** 0.001*** 0 -0.000*** [0.000] [0.000] [0.000] [0.000] [0.000] Observations 121363 121363 121363 41801 110621

172
TABLE A.4. ALLERGY MARGINAL EFFECT REGRESSION RESULTS –
INSURED ALLERGY SAMPLE NAMCS 1997 – 2000; 2003 – 2004
Standard Errors in Brackets
*significant at 10% **significant at 5% ***significant at 1% 1 2 3 4 5
Allergy RX Allegra Zyrtec Clarinex Allergy Shots
Capitated Visit 0.006 0.013 -0.008 -0.004 0 [0.014] [0.008] [0.009] [0.005] [0.003] AllergyOTC -0.108*** -0.036*** 0.019 N/A 0.019*** [0.019] [0.009] [0.014] [0.007] Capitated Visit * AllergyOTC -0.015 -0.015** 0.009 N/A -0.006*** [0.018] [0.007] [0.012] [0.002] Private Insurance 0.021 0.01 0.004 0 0.003 [0.013] [0.007] [0.007] [0.009] [0.002] Medicare 0.017 0.016 -0.007 -0.004 0.005 [0.021] [0.012] [0.010] [0.011] [0.004] Female 0.011 0.005 0.011*** 0.001 0.001 [0.008] [0.004] [0.004] [0.005] [0.001] White 0.059 0.028 0.012 -0.047 -0.008 [0.046] [0.019] [0.023] [0.040] [0.011] Black 0.085 0.059 0.002 -0.016* -0.006** [0.071] [0.068] [0.029] [0.008] [0.003] Asian 0.083 0.094 -0.006 -0.009 -0.003 [0.074] [0.090] [0.027] [0.013] [0.005] Hispanic 0 0.003 -0.009 -0.007 0.002 [0.014] [0.007] [0.007] [0.007] [0.002] Age 0.005*** 0.004*** -0.001*** 0.001*** 0.000*** [0.001] [0.000] [0.000] [0.000] [0.000] Age^2 -0.000*** -0.000*** 0 -0.000** -0.000*** [0.000] [0.000] [0.000] [0.000] [0.000] Acute 0.022 0.015* -0.009 0.004 -0.057*** [0.016] [0.009] [0.008] [0.010] [0.006] Chronic Routine 0.014 0.012 -0.008 -0.003 -0.001 [0.017] [0.010] [0.008] [0.010] [0.001] Chronic Flare-up 0.054*** 0.017 0.004 0.009 -0.011*** [0.021] [0.012] [0.010] [0.014] [0.002]
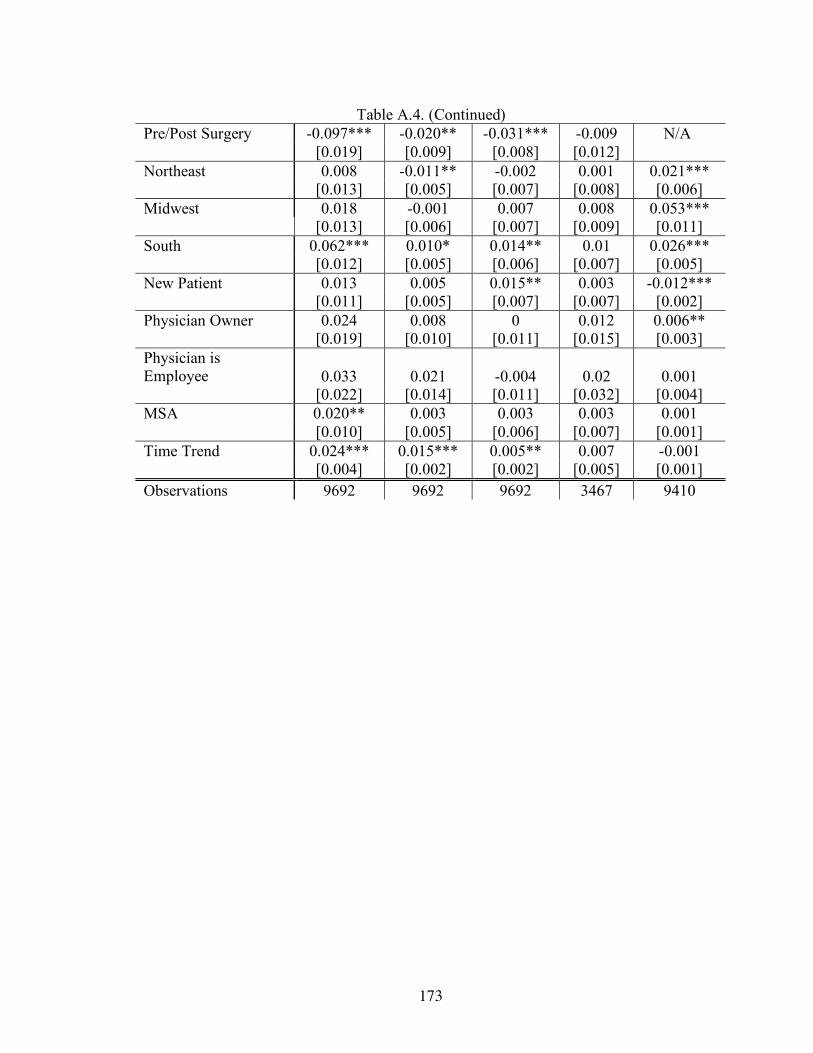
173
Table A.4. (Continued) Pre/Post Surgery -0.097*** -0.020** -0.031*** -0.009 N/A [0.019] [0.009] [0.008] [0.012] Northeast 0.008 -0.011** -0.002 0.001 0.021*** [0.013] [0.005] [0.007] [0.008] [0.006] Midwest 0.018 -0.001 0.007 0.008 0.053*** [0.013] [0.006] [0.007] [0.009] [0.011] South 0.062*** 0.010* 0.014** 0.01 0.026*** [0.012] [0.005] [0.006] [0.007] [0.005] New Patient 0.013 0.005 0.015** 0.003 -0.012*** [0.011] [0.005] [0.007] [0.007] [0.002] Physician Owner 0.024 0.008 0 0.012 0.006** [0.019] [0.010] [0.011] [0.015] [0.003] Physician is Employee 0.033 0.021 -0.004 0.02 0.001 [0.022] [0.014] [0.011] [0.032] [0.004] MSA 0.020** 0.003 0.003 0.003 0.001 [0.010] [0.005] [0.006] [0.007] [0.001] Time Trend 0.024*** 0.015*** 0.005** 0.007 -0.001 [0.004] [0.002] [0.002] [0.005] [0.001] Observations 9692 9692 9692 3467 9410
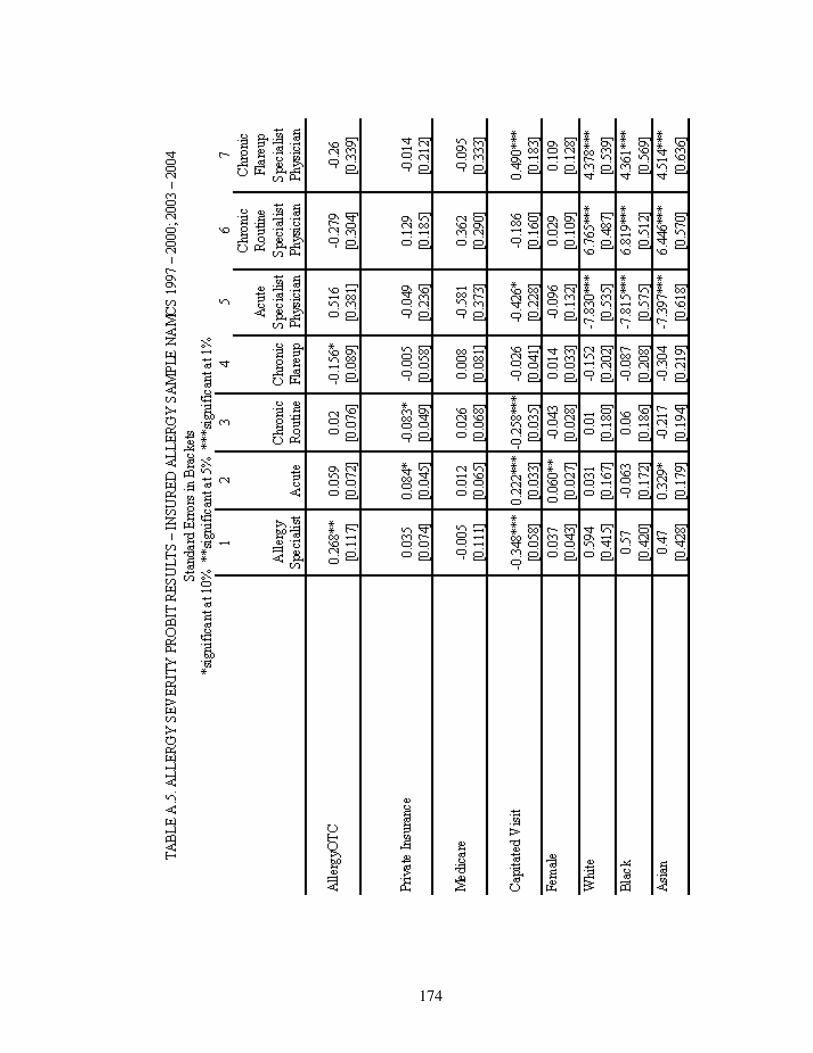
174
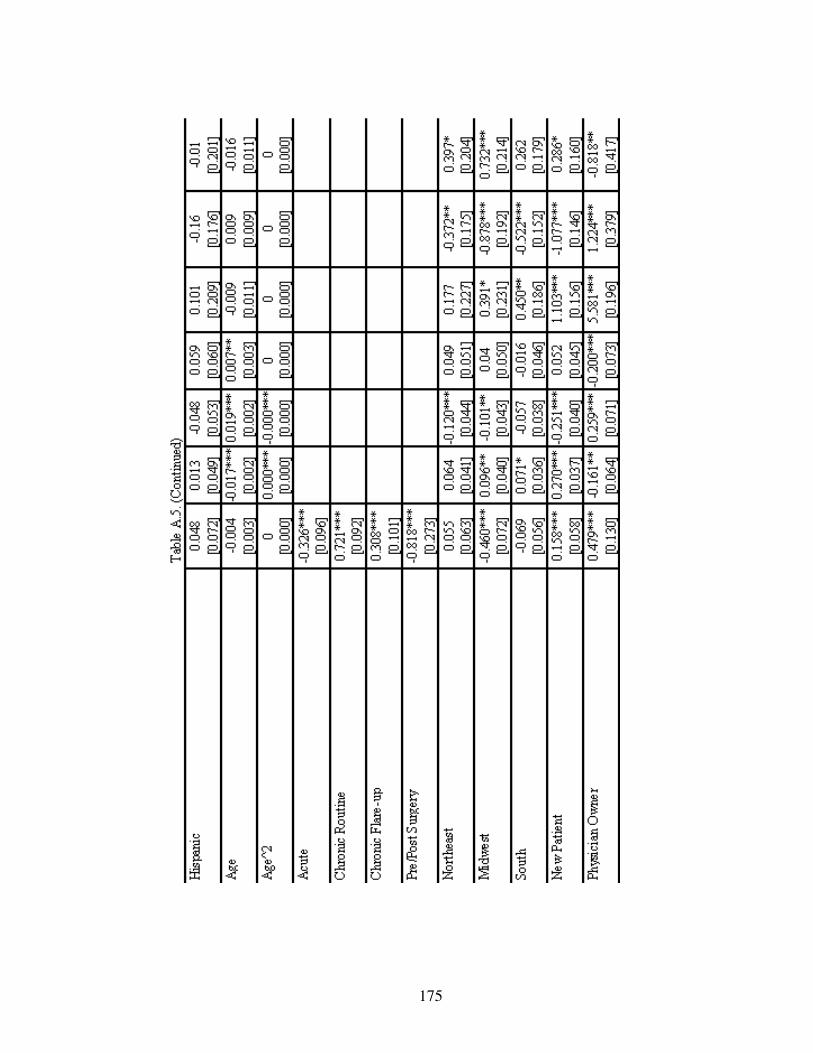
175

176

177

178

179
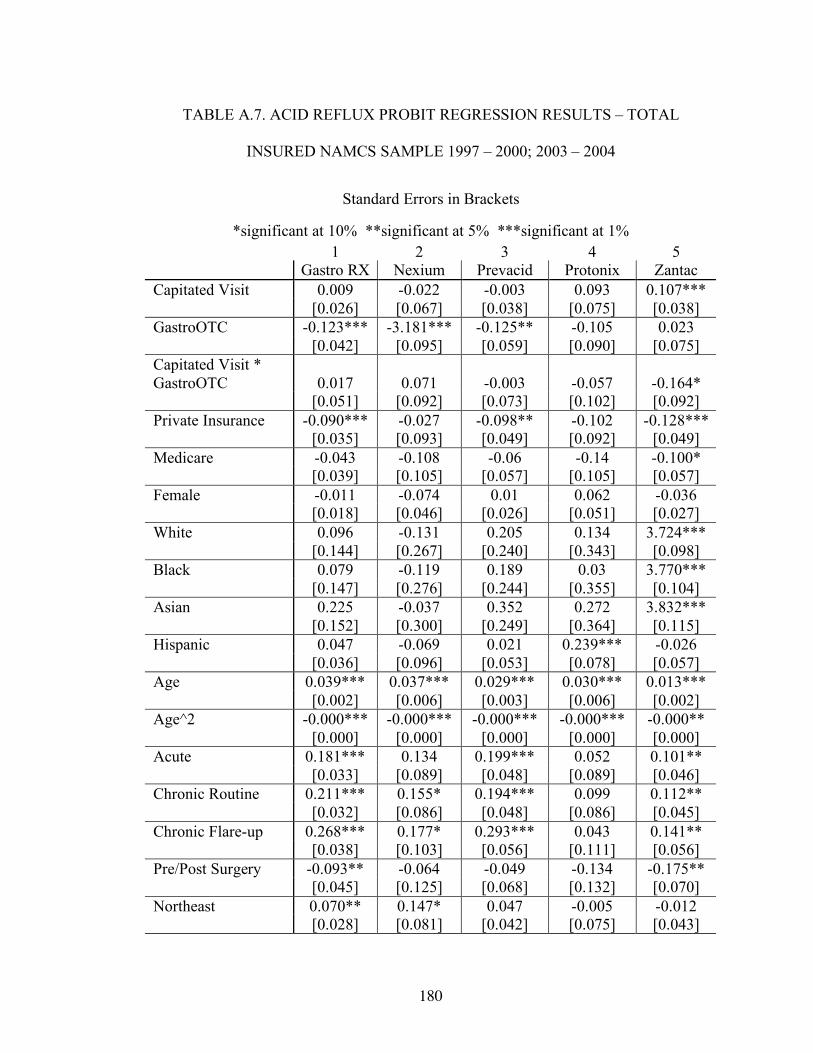
180
TABLE A.7. ACID REFLUX PROBIT REGRESSION RESULTS – TOTAL
INSURED NAMCS SAMPLE 1997 – 2000; 2003 – 2004
Standard Errors in Brackets
*significant at 10% **significant at 5% ***significant at 1% 1 2 3 4 5 Gastro RX Nexium Prevacid Protonix Zantac Capitated Visit 0.009 -0.022 -0.003 0.093 0.107*** [0.026] [0.067] [0.038] [0.075] [0.038] GastroOTC -0.123*** -3.181*** -0.125** -0.105 0.023 [0.042] [0.095] [0.059] [0.090] [0.075] Capitated Visit * GastroOTC 0.017 0.071 -0.003 -0.057 -0.164* [0.051] [0.092] [0.073] [0.102] [0.092] Private Insurance -0.090*** -0.027 -0.098** -0.102 -0.128*** [0.035] [0.093] [0.049] [0.092] [0.049] Medicare -0.043 -0.108 -0.06 -0.14 -0.100* [0.039] [0.105] [0.057] [0.105] [0.057] Female -0.011 -0.074 0.01 0.062 -0.036 [0.018] [0.046] [0.026] [0.051] [0.027] White 0.096 -0.131 0.205 0.134 3.724*** [0.144] [0.267] [0.240] [0.343] [0.098] Black 0.079 -0.119 0.189 0.03 3.770*** [0.147] [0.276] [0.244] [0.355] [0.104] Asian 0.225 -0.037 0.352 0.272 3.832*** [0.152] [0.300] [0.249] [0.364] [0.115] Hispanic 0.047 -0.069 0.021 0.239*** -0.026 [0.036] [0.096] [0.053] [0.078] [0.057] Age 0.039*** 0.037*** 0.029*** 0.030*** 0.013*** [0.002] [0.006] [0.003] [0.006] [0.002] Age^2 -0.000*** -0.000*** -0.000*** -0.000*** -0.000** [0.000] [0.000] [0.000] [0.000] [0.000] Acute 0.181*** 0.134 0.199*** 0.052 0.101** [0.033] [0.089] [0.048] [0.089] [0.046] Chronic Routine 0.211*** 0.155* 0.194*** 0.099 0.112** [0.032] [0.086] [0.048] [0.086] [0.045] Chronic Flare-up 0.268*** 0.177* 0.293*** 0.043 0.141** [0.038] [0.103] [0.056] [0.111] [0.056] Pre/Post Surgery -0.093** -0.064 -0.049 -0.134 -0.175** [0.045] [0.125] [0.068] [0.132] [0.070] Northeast 0.070** 0.147* 0.047 -0.005 -0.012 [0.028] [0.081] [0.042] [0.075] [0.043]
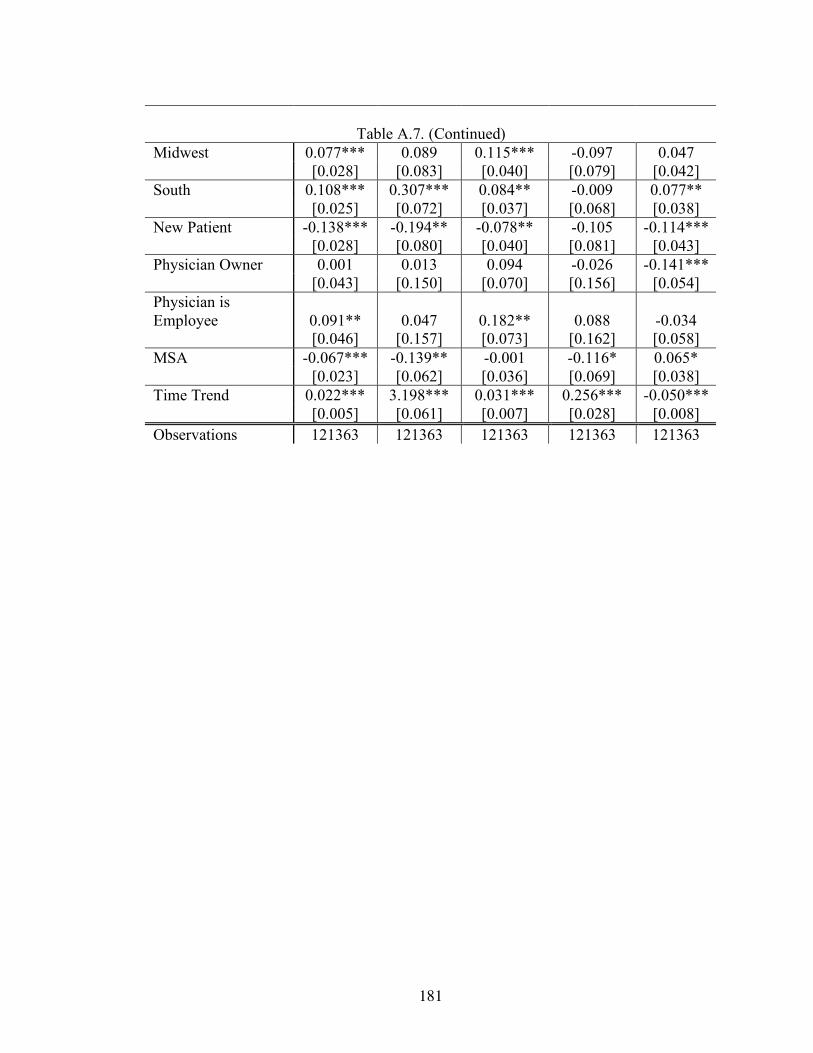
181
Table A.7. (Continued)
Midwest 0.077*** 0.089 0.115*** -0.097 0.047 [0.028] [0.083] [0.040] [0.079] [0.042] South 0.108*** 0.307*** 0.084** -0.009 0.077** [0.025] [0.072] [0.037] [0.068] [0.038] New Patient -0.138*** -0.194** -0.078** -0.105 -0.114*** [0.028] [0.080] [0.040] [0.081] [0.043] Physician Owner 0.001 0.013 0.094 -0.026 -0.141*** [0.043] [0.150] [0.070] [0.156] [0.054] Physician is Employee 0.091** 0.047 0.182** 0.088 -0.034 [0.046] [0.157] [0.073] [0.162] [0.058] MSA -0.067*** -0.139** -0.001 -0.116* 0.065* [0.023] [0.062] [0.036] [0.069] [0.038] Time Trend 0.022*** 3.198*** 0.031*** 0.256*** -0.050*** [0.005] [0.061] [0.007] [0.028] [0.008] Observations 121363 121363 121363 121363 121363

182
TABLE A.8. ACID REFLUX PROBIT REGRESSION RESULTS – INSURED
ACID REFLUX SAMPLE NAMCS 1997 – 2000; 2003 – 2004
Standard Errors in Brackets
*significant at 10% **significant at 5% ***significant at 1% 1 2 3 4 5 Gastro RX Nexium Prevacid Protonix Zantac Capitated Visit 0.023 -0.002 0.007 -0.05 0.157* [0.062] [0.141] [0.080] [0.154] [0.083] GastroOTC -0.113 -3.464*** -0.09 -0.177 -0.343** [0.094] [0.198] [0.122] [0.177] [0.169] Capitated Visit * GastroOTC -0.17 0.009 -0.145 -0.142 -0.139 [0.116] [0.195] [0.152] [0.216] [0.207] Private Insurance 0.014 -0.091 -0.011 -0.105 -0.057 [0.076] [0.177] [0.096] [0.179] [0.102] Medicare -0.003 -0.101 -0.051 -0.186 0.085 [0.088] [0.201] [0.115] [0.210] [0.124] Female -0.095** -0.14 -0.028 0.05 -0.022 [0.042] [0.097] [0.055] [0.106] [0.061] White 0.144 0.142 0.335 4.619*** 4.496*** [0.291] [0.481] [0.446] [0.569] [0.215] Black 0.1 0.158 0.326 4.555*** 4.554*** [0.298] [0.502] [0.455] [0.590] [0.233] Asian 0.312 -0.177 0.523 4.418*** 4.746*** [0.306] [0.576] [0.461] [0.628] [0.237] Hispanic -0.022 0.063 -0.092 0.219 -0.078 [0.082] [0.170] [0.112] [0.171] [0.119] Age 0.039*** 0.035*** 0.027*** 0.024** 0.007 [0.004] [0.010] [0.005] [0.011] [0.005] Age^2 -0.000*** -0.000** -0.000*** 0 -0.000* [0.000] [0.000] [0.000] [0.000] [0.000] Acute -0.002 -0.039 -0.038 0.191 -0.331*** [0.085] [0.197] [0.109] [0.249] [0.104] Chronic Routine 0.243*** 0.068 0.129 0.401 -0.188* [0.086] [0.199] [0.111] [0.249] [0.107] Chronic Flare-up 0.173* 0.18 0.131 0.12 -0.271** [0.095] [0.218] [0.123] [0.284] [0.125] Pre/Post Surgery -0.085 0.035 -0.332 0.217 -0.444** [0.138] [0.312] [0.206] [0.369] [0.206] Northeast 0.123* 0.183 -0.025 0.154 0.076 [0.069] [0.174] [0.090] [0.166] [0.098]

183
Table A.8. (Continued) Midwest 0.039 -0.133 0.017 -0.182 0.037 [0.067] [0.180] [0.084] [0.179] [0.095] South 0.147** 0.319** -0.064 0.017 0.061 [0.060] [0.154] [0.078] [0.153] [0.086] New Patient -0.225*** -0.390** -0.014 -0.139 -0.287*** [0.059] [0.152] [0.073] [0.151] [0.094] Physician Owner -0.147 -0.086 0.282* -0.232 -0.262** [0.101] [0.371] [0.166] [0.325] [0.129] Physician is Employee -0.098 -0.225 0.290* -0.133 -0.213 [0.108] [0.385] [0.172] [0.338] [0.138] MSA -0.045 -0.079 -0.058 -0.007 0.126 [0.054] [0.137] [0.071] [0.152] [0.083] Time Trend 0.018 3.510*** 0.023 0.321*** -0.026 [0.012] [0.121] [0.015] [0.052] [0.016] Observations 5386 5386 5386 5386 5386

184
TABLE A.9. ACID REFLUX MARGINAL EFFECT REGRESSION RESULTS –
TOTAL INSURED NAMCS SAMPLE 1997 – 2000; 2003 – 2004
Standard Errors in Brackets
*significant at 10% **significant at 5% ***significant at 1% 1 2 3 4 5
Gastro
RX Nexium Prevacid Protonix Zantac Capitated Visit 0 0 0 0 0.002*** [0.001] [0.000] [0.001] [0.000] [0.001] GastroOTC -0.004*** 0 -0.002** 0 0 [0.001] [0.000] [0.001] [0.000] [0.001] Capitated Visit * GastroOTC 0.001 0 0 0 -0.002** [0.002] [0.000] [0.001] [0.000] [0.001] Private Insurance -0.003** 0 -0.001* 0 -0.002** [0.001] [0.000] [0.001] [0.000] [0.001] Medicare -0.001 0 -0.001 0 -0.001* [0.001] [0.000] [0.001] [0.000] [0.001] Female 0 0 0 0 0 [0.001] [0.000] [0.000] [0.000] [0.000] White 0.003 0 0.002 0 0.017*** [0.004] [0.000] [0.002] [0.000] [0.001] Black 0.003 0 0.003 0 0.790*** [0.006] [0.000] [0.005] [0.000] [0.028] Asian 0.01 0 0.008 0 0.862*** [0.008] [0.000] [0.008] [0.001] [0.025] Hispanic 0.002 0 0 0.000* 0 [0.001] [0.000] [0.001] [0.000] [0.001] Age 0.001*** 0 0.000*** 0.000*** 0.000*** [0.000] [0.000] [0.000] [0.000] [0.000] Age^2 -0.000*** 0 -0.000*** -0.000*** -0.000** [0.000] [0.000] [0.000] [0.000] [0.000] Acute 0.007*** 0 0.003*** 0 0.001** [0.001] [0.000] [0.001] [0.000] [0.001] Chronic Routine 0.008*** 0 0.003*** 0 0.002** [0.001] [0.000] [0.001] [0.000] [0.001] Chronic Flare-up 0.012*** 0 0.006*** 0 0.002** [0.002] [0.000] [0.001] [0.000] [0.001] Pre/Post Surgery -0.003** 0 -0.001 0 -0.002*** [0.001] [0.000] [0.001] [0.000] [0.001] Northeast 0.003** 0 0.001 0 0 [0.001] [0.000] [0.001] [0.000] [0.001]

185
Table A.9. (Continued) Midwest 0.003*** 0 0.002*** 0 0.001 [0.001] [0.000] [0.001] [0.000] [0.001] South 0.004*** 0 0.001** 0 0.001** [0.001] [0.000] [0.001] [0.000] [0.001] New Patient -0.004*** 0 -0.001** 0 -0.001*** [0.001] [0.000] [0.001] [0.000] [0.000] Physician Owner 0 0 0.001 0 -0.002** [0.001] [0.000] [0.001] [0.000] [0.001] Physician is Employee 0.003* 0 0.003** 0 0 [0.002] [0.000] [0.001] [0.000] [0.001] MSA -0.002*** 0 0 0 0.001* [0.001] [0.000] [0.001] [0.000] [0.000] Time Trend 0.001*** 0 0.000*** 0.000*** -0.001*** [0.000] [0.000] [0.000] [0.000] [0.000] Observations 121363 121363 121363 121363 121363
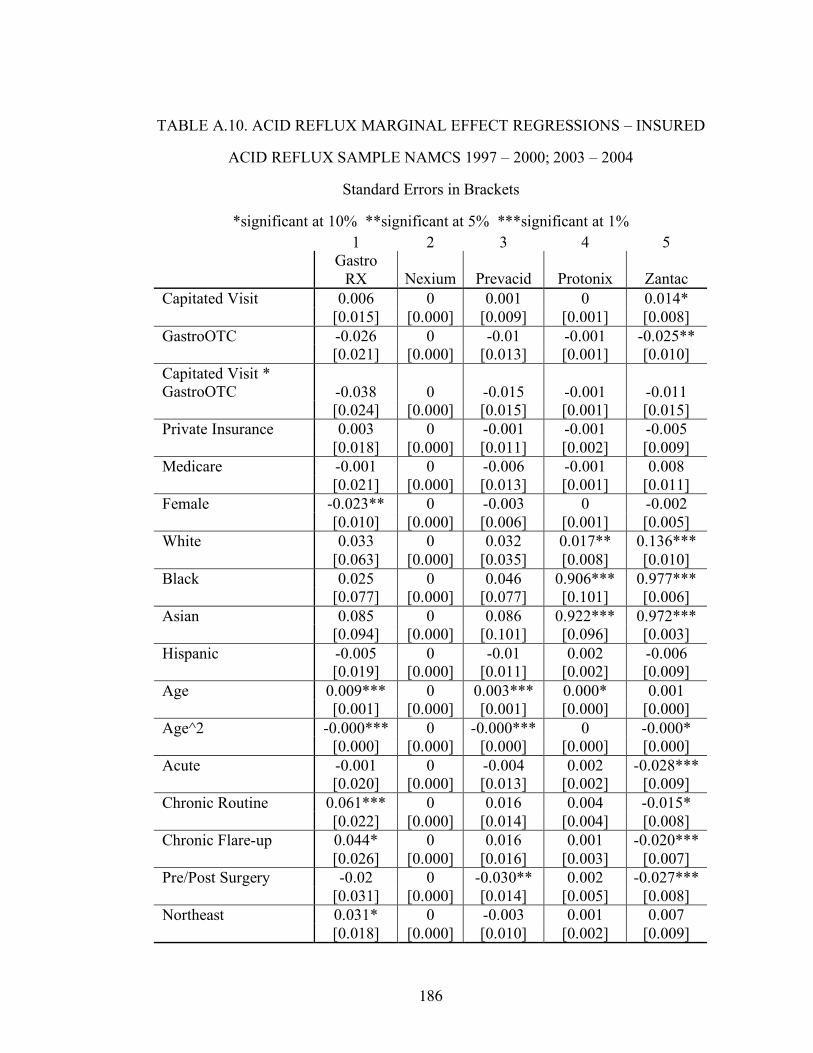
186
TABLE A.10. ACID REFLUX MARGINAL EFFECT REGRESSIONS – INSURED
ACID REFLUX SAMPLE NAMCS 1997 – 2000; 2003 – 2004
Standard Errors in Brackets
*significant at 10% **significant at 5% ***significant at 1% 1 2 3 4 5
Gastro
RX Nexium Prevacid Protonix Zantac Capitated Visit 0.006 0 0.001 0 0.014* [0.015] [0.000] [0.009] [0.001] [0.008] GastroOTC -0.026 0 -0.01 -0.001 -0.025** [0.021] [0.000] [0.013] [0.001] [0.010] Capitated Visit * GastroOTC -0.038 0 -0.015 -0.001 -0.011 [0.024] [0.000] [0.015] [0.001] [0.015] Private Insurance 0.003 0 -0.001 -0.001 -0.005 [0.018] [0.000] [0.011] [0.002] [0.009] Medicare -0.001 0 -0.006 -0.001 0.008 [0.021] [0.000] [0.013] [0.001] [0.011] Female -0.023** 0 -0.003 0 -0.002 [0.010] [0.000] [0.006] [0.001] [0.005] White 0.033 0 0.032 0.017** 0.136*** [0.063] [0.000] [0.035] [0.008] [0.010] Black 0.025 0 0.046 0.906*** 0.977*** [0.077] [0.000] [0.077] [0.101] [0.006] Asian 0.085 0 0.086 0.922*** 0.972*** [0.094] [0.000] [0.101] [0.096] [0.003] Hispanic -0.005 0 -0.01 0.002 -0.006 [0.019] [0.000] [0.011] [0.002] [0.009] Age 0.009*** 0 0.003*** 0.000* 0.001 [0.001] [0.000] [0.001] [0.000] [0.000] Age^2 -0.000*** 0 -0.000*** 0 -0.000* [0.000] [0.000] [0.000] [0.000] [0.000] Acute -0.001 0 -0.004 0.002 -0.028*** [0.020] [0.000] [0.013] [0.002] [0.009] Chronic Routine 0.061*** 0 0.016 0.004 -0.015* [0.022] [0.000] [0.014] [0.004] [0.008] Chronic Flare-up 0.044* 0 0.016 0.001 -0.020*** [0.026] [0.000] [0.016] [0.003] [0.007] Pre/Post Surgery -0.02 0 -0.030** 0.002 -0.027*** [0.031] [0.000] [0.014] [0.005] [0.008] Northeast 0.031* 0 -0.003 0.001 0.007 [0.018] [0.000] [0.010] [0.002] [0.009]

187
Table A.10. (Continued) Midwest 0.009 0 0.002 -0.001 0.003 [0.016] [0.000] [0.010] [0.001] [0.008] South 0.036** 0 -0.007 0 0.005 [0.015] [0.000] [0.009] [0.001] [0.008] New Patient -0.050*** 0 -0.002 -0.001 -0.021*** [0.012] [0.000] [0.008] [0.001] [0.006] Physician Owner -0.036 0 0.030* -0.002 -0.025* [0.026] [0.000] [0.016] [0.004] [0.014] Physician is Employee -0.023 0 0.038 -0.001 -0.017* [0.024] [0.000] [0.025] [0.002] [0.010] MSA -0.011 0 -0.007 0 0.01 [0.013] [0.000] [0.009] [0.001] [0.006] Time Trend 0.004 0 0.003 0.003*** -0.002 [0.003] [0.000] [0.002] [0.001] [0.001] Observations 5386 5386 5386 5386 5386

188

189

190

191

192

193
194
BIBLIOGRAPHY
Andrade, S.E., Gurwitz, J.H. and Fish, L.S. (1999). “The Effect of and Rx-to-OTC Switch on Medication Prescribing Patterns and Utilization of Physician Services: The Case of H2 Receptor Antagonists.” Medical Care, 37: 424-430. Armantier, O. and Namoro, S.D. (2003). “Prescription Drug Advertising and Patient Compliance: A Physician Agency Approach.” Department of Economics Working Papers 03-01, SUNY-Stony Brook, Department of Economics. Barros, P., Dismuke, C. (2003). “Stochastic Production Function and Physician’s Choices.” Working Paper. Bradford, W., Kleit, A., McIlwain, T., Neitert, P., Steyer, T. and Ornstein, S. (2004). “The Impact of Direct-to-Consumer Advertising for Prescription Drugs on Physician Prescribing Behavior for the Treatment for Osteoarthritis.” DRAFT Calfee, J. (2002). “Public Policy Issues in Direct-to-Consumer Advertising of Prescription Drugs.” Journal of Public Policy & Marketing, 21(2): 174-193. CDER Handbook (2006). [On-Line]. Available: http://www.fda.gov/cder/handbook/develop.htm CDER Report to the Nation (2005). [On-Line]. Available: http://www.fda.gov/cder/reports/rtn/2005/rtn2005.pdf CHPA (2006). [On-Line]. Available: http://www.chpa-info.org/Web/index.aspx CBO (1998). “The Effects of the Hatch-Waxman Act on the Returns from Innovation.” How Increased Competition from Generic Drugs Has Affected Prices and Returns in the Pharmaceutical Industry. [On-Line]. Available: http://www.cbo.gov/showdoc.cfm?index=655&sequence=5 Crystal-Peters, J., Crown, W.H., Goetzel, R.Z., Schutt, D.C. (2000). “The Productivity Losses Associated with Allergic Rhinitis.” American Journal of Managed Care, 6(3): 373-378. Diette, G., Skinner, E., Nguyen, T., Markson, L., Clark, B., Wu, A. (2001). “Comparison of Quality of Care by Specialist and Generalist Physicians as Usual Source of Asthma Care for Children.” Pediatrics, 108(2): 432-437. Drug Store (2005). [On-Line]. Available: http://www.drugstore.com

195
Findlay, S. (2001). “Direct-to-Consumer Promotion of Prescription Drugs – Economic Implications for Patients, Payers, and Providers.” Pharmacoeconomics, 19(2): 109-119. FDA Orange Book (2006). [On-Line]. Available: http://www.fda.gov/cder/ob/default.htm FDA Food and Drug Law History (2005). [On-Line]. Available: http://www.fda.gov/opacom/backgrounders/miles.html Gebhart, Fred. (2004). “Cover story: A Snapshot of 2003 Rx Market”. Drug Topics, 148: 68. [On-Line]. Available at: http://www.drugtopics.com/drugtopics/article/articleDetail.jsp?id=107833 General Accounting Office. (2002). “Prescription Drugs – FDA Oversight of Direct-to-Consumer Advertising Has Limitations.” Report to Congressional Requestors. Generic Drugs: The Unadvertised Brand. (2006). “Drugs Coming Off Patent” http://www.theunadvertisedbrand.com/pdfs/Patent_Exp0505.pdf Gleason, P., Schultz, R., Smith, N., Newsom, J., Kroboth, P., Kroboth, F., Psaty, B. (1998). “Correlates and Prevalence of Benzodiazepine Use in Community-Dwelling Elderly.” Journal of General Internal Medicine, 13(4): 243 – 250. Glied, S., Zivin, J.G. (2002). “How do Doctors Behave When Some (but not all) of Their Patients are in Managed Care?” Journal of Health Economics, 21: 337 – 353. Gluck, M. (2002). “Federal Policies Effecting the Cost and Availability of New Pharmaceuticals.” Kaiser Family Foundation. Goldfarb, Bruce. (2002). “Claritin Approval Marks Significant Shift in RX-To-OTC Switches.” The Food and Drug Letters, 666. http://brucegoldfarb.com/FDL3.pdf Goozner, Merrill. (2004). “From the $800 Million Pill – Me Too!” Medscape General Medicine, 6(2). http://www.pubmedcentral.nih.gov/articlerender.fcgi?artid=1395782 Granlund, D., Rudhlom, N. and Wikstrom, M. (2004). “Fixed Budgets as a Cost Containment Measure for Pharmaceuticals.” Umeå Economic Studies 639, Umeå University, Department of Economics. Gurwitz, J.H., McLaughlin, T.J. and Fish, L.S. (1995). “The Effect of an Rx-to-OTC Switch on Medication Prescribing Patterns and Utilization of Physician Services: The Case of Vaginal Antifungal Products.” Health Services Research, 30: 672-685.

196
Haines, Cynthia. (2006). “Allergy Medications.” WebMD [On-Line] Available at: http://www.webmd.com/solutions/hs/allergies/medications Harrington, P. (2002). “Analysis of the Movement of Prescription Drugs to Over-the-Counter Status.” Journal of Managed Care Pharmacy, 8(6): 499-508. Hillman, A., Pauly, M., Escarce, J., Ripley, K., Gaynor, M., Clouse, J. and Ross, R. (1999) “Financial Incentives and Drug Spending in Managed Care.” Health Affairs, 18(2): 189-199. Hollenbeak, C. (1999) “The Effect of Generic Competition on Prescription to Over-the-Counter Switching.” Pharmacoeconomics, 16(6): 661-668. Iezonni, L., Ash, A., Shwartz, M., Daley, J., Hughes, J., Mackiernan, Y. (1995). “Predicting Who Dies Depends on How Severity is Measured: Implications for Evaluating Patient Outcomes.” Annals of Internal Medicine, 123(10): 763 – 770. Iizuka, T. (2004). “Experts’ Agency Problems: Evidence from the Prescription Drug Market in Japan.” Working Paper, Owen Graduate School of Management, Vanderbilt University. Iizuka, T. and Jin, G. (2005). “The Effects of Direct-to-Consumer Advertising in the Prescription Drug Market.” The Journal of Economics & Management Strategy, 14(3): 701-727. IMS Health. (2003). “Shakeup for the US Antihistamine Market.” [On-Line] Available at: http://www.imshealth.com/web/content/0,3148,64576068_63872702_70261006_70324491,00.html The-Infoshop. (2005). “OTC Healthcare in United States.” Global Information, Inc. [On-Line] Available at: http://www.the-infoshop.com/study/eo33412-otc-healthcare.html Jack, W. (2005). “Purchasing Health Care Services from Providers with Unknown Altruism.” Journal of Health Economics, 24: 73-93. Jacobs, L.R. (1998) “Prescription to Over-the Counter Drug Reclassification.” American Family Physician, 57(9): 2209-2214. Kaiser Family Foundation. (2004). “Prescription Drug Trends.” [On-Line]. Available: http://www.kff.org Kaiser Family Foundation. (2006). “Trends and Indicators in the Changing Health Care Marketplace.” [On-Line] Available at: http://www.kff.org

197
Kalish, S.C., Bohn, R.L. and Avorn, J. (1997). “Policy Analysis of the Conversion of Histamine Antagonists to Over-the-Counter Use.” Medical Care, 35: 32-48. Kirchheimer, Sid. (2003). “Allergy Shots: Underused Treatment?” WebMD [On-Line]. Available at: http://www.webmd.com/content/Article/72/81859.htm?pagenumber=1 Leibowitz, A. (1989). “Substitution Between Prescribed and Over-the-Counter Medications.” Medical Care, 27(1): 85-93. Lexchin, J. and Mintzes, B. (2002). “Direct-to-Consumer Advertising of Prescription Drugs: The Evidence says No.” Journal of Public Policy & Marketing, 21(2): 194-201. Ling, D., Berndt, E. and Kyle, M. (2002). “Deregulating Direct-to-Consumer Marketing of Prescription Drugs: Effects on Prescription and Over-the-Counter Product Sales.” Journal of Law and Economics, 45: 691-723. Link, M. (2004). “Statin Switch to OTC.” Nature Reviews, 3: 641-642. Lipsky, M. and Waters, T. (1999). “The ‘Prescription-to-OTC Switch Movement’ – Its Effects on Antifungal Vaginitis Preparations.” Arch. Family Medicine, 8: 297-300. Lyon, G. (2001). “New Game, Old Competencies: The Outlook for OTC.” International Journal of Medical Marketing, 1(3): 236-244. Mahecha, L. (2006). “Rx-to-OTC Switches: Trends and Factors Underlying Success.” Nature Reviews Drug Discovery, 5(5): 380-386. Mayo Clinic. (2005). “Heartburn/GERD” [On-Line]. Available at: http://www.mayoclinic.com/health/heartburn-gerd/DS00095/DSECTION=1 Mays, J., Brenner, M., Neuman, T., Cubanski, J. and Claxton, G. (2004). “Estimates of Medicare Beneficiaries’ Out-of-Pocket Drug Spending in 2006: Modeling the Impact of the MMA.” Kaiser Family Foundation. Med Ad News. “Direct-to-Consumer Advertising Expenditure.” (May 2006): 24. Med Ad News. “Med Ad News 200 Best-Selling Prescription Drugs-Sales.” (June 2006): 22. Melichar, Lori. (2007). “The Effect of Reimbursement on Medical Decision Making: do Physicians Alter Treatment in Response to a Managed Care Incentive?” Working Paper.

198
MEPS. (2006). “Trends in Health Expenditure Shares for Community-Based Population by Selected Population.” [On-Line] Available at: http://www.meps.ahrq.gov/mepsweb/data_stats/download_data/pufs/pmep04/pmep04_table6.pdf Mortimer, R. O. (1998). Demand for Prescription Drugs: The Effects of Managed Care Pharmacy Benefits. University of California Berkeley Dissertation. Mossinghoff, G. (1999). “Overview of the Hatch-Waxman Act and Its Impact on the Drug Development Process.” Food and Drug Law Journal, 54: 187-194. Mukherji, P., Dutta, S. and Rajiv, S. (2004). “Estimating the Effects of Direct-to-Consumer Advertising for Prescription Drugs: A Natural Experiment.” [On-Line]. Available at SSRN: http://ssrn.com/abstract=502863 National Center for Health Statistics (NCHS). (2004). “Health, United States, 2004 With Chartbook on Trends in the Health of Americans.” [On-Line]. Available at: http://www.cdc.gov/nchs/data/hus/hus04.pdf National Center for Health Statistics (NCHS). (2005) [On-Line]. Available at: http://www.cdc.gov/nchs/about/major/ahcd/ahcd1.htm National Heartburn Alliance. (2002). “Joint FDA Advisory Committee Recommends Approval of PRILOSEC® (omeprazole) for OTC Switch at Full Prescription Strength.” [On-Line]. Available at: http://www.heartburnalliance.org/nosection/4122.jsp National Digestive Disease Information Clearing House (NDDIC). (2003). “Heartburn, Hiatal Hernia, and Gastroesophageal Reflux Disease (GERD).” NIH Publication No. 03–0882. [On-Line]. Available at: http://digestive.niddk.nih.gov/ddiseases/pubs/gerd/ Paul, D. (2001). “Comparison of the Drug Approval Processes in the US, the EU, and Canada.” International Journal of Medical Marketing 1(3): 224-235. Peters, C. P. (2004). “Fundamentals of the Prescription Drug Market.” NHPF Background Paper. Petryshen, P., Pallas, L., Shamian, J. (1995). “Outcomes Monitoring: Adjusting for Risk Factors, Severity of Illness, and Complexity of Care.” JAMA 2(4): 243 – 249. Reynold, T. (2002). “Switching from Prescription to Over the Counter.” Annals of Internal Medicine, 136(2): 177-180.

199
Rice, J. (2004). “Physician Compensation and Treatment Intensity in Managed Care Practices.” [On-Line] Available at: http://www.iupui.edu/~econ/courses/newseminars.htm Shifman, S., Gitchel, J., Pinney, J., Burton, S., Kemper, K. and Lara,E. (1997). “Public Health Benefit of Over-the-Counter Nicotine Medications.” Tobacco Control, 6: 306-210. Shih, Y., Prasad, M. and Luce, B. (2002). “The Effect on Social Welfare of a Switch of Second-Generation Antihistamines from Prescription to Over-the-Counter Status: A Microeconomic Analysis.” Clinical Therapeutics, 24(4): 701-716. Shrank, W.H., Young, H.N., Ettner, S., Glassman, P. and Asch, S. (2005). “Do the Incentives in 3-Tier Pharmaceutical Benefit Plans Operate as Intended? Results from a Physician Leadership Survey.” The American Journal of Managed Care, 11: 16-22. Smith, R. (2003). “The Influence of Patient Knowledge in the Physician Services Market: An Alternative Perspective on Information Asymmetry.” Available at SSRN: http://ssrn.com/abstract=441880 Soller, R.W. (2000). “OTCs 2000 – Achievements and Challenges.” Drug Information Journal, 34: 693 – 701. Southern Medical Association (2005). http://www.sma.org/ Spruill, W. M. and Cunningham, M. (2005) “Strategies for Extending the Life of Patents.” BioPharm International. [On-Line] Available at: http://www.biopharminternational.com/biopharm/article/articleDetail.jsp?id=150834&sk=&date=&pageID=3 Stancioiu, F., Ahmed, S., Buschor, R. (2005) “Helicobacter pylori: Findings in a Native American Population.” HIS Primary Care Provider. 30(3): 1 - 5. Stern, S. and Trajtenberg, M. (1998). “Empirical Implications of Physician Authority in Pharmaceutical Decision Making.” National Bureau of Economic Research Working Paper Series: Number 6851. Sullivan, P. and Nichol, M. (2004). “The Economic Impact of Payer Policies after the Rx-to-OTC Switch of Second Generation Antihistamines.” Value in Health, 7(4): 402-412. Temin, P. (1983). “Cost and Benefits in Switching from Rx to OTC.” Journal of Health Economics, 2: 187-205.
200
Temin, P. (1992). “Realized Benefits from Switching Drugs.” Journal of Law and Economics, (35)2: 351-369. Thorndike, A.N., Biener, L. and Rigotti, N.A. (2002). “Effect on Smoking Cessation of Switching Nicotine Replacement Therapy to Over-the Counter Status.” American Journal of Public Health, 92(3): 437-442. Tracey, Elizabeth. (2000). “Taking Common Antihistamines Worthy of a DUI?” WebMD. [On-Line]. Available at: http://www.webmd.com/content/article/22/1728_55465.htm Tsao, Amy. (2002). “Schering Puts on a Marketing Clinic.” BusinessWeek Online. http://www.businessweek.com/bwdaily/dnflash/mar2002/nf20020321_9529.htm UCLA School of Public Health (2003): “Public Health’s Drug Problem.” [On-Line] Available at: http://www.ph.ucla.edu/pdfs/SPHmag.Nov03.pharma.pdf Vanderhoff, B. and Tahboub, R. (2002). “Proton Pump Inhibitors: An Update.” American Family Physician, 66(2): 273-282. Waters, T., Lispky, M., LoSasso, A. and Almagor, O. (1998). “Analysis of Prescription Drug to Over-the-Counter (Rx-to-OTC) Switch Movement.” Institute for Health Services Research and Policy Studies Northwestern University. [On-Line]. Available at: http://aspe.hhs.gov/pic/pdf/6723.PDF Wikipedia. (2006). “Heartburn” [On-Line]. Available at: http://en.wikipedia.org/wiki/Heart_burn Wikipedia. (2007). “Allergy” [On-Line]. Available at: http://en.wikipedia.org/wiki/Allergy Wosinska, M. (2002). “Just What the Patient Ordered? Direct-to-Consumer Advertising and the Demand for Pharmaceutical Products.” HBS Marketing Research Paper, No. 02-04. Wosinska, M. (2003). “Advertising and Optional Consumption Path: The Case of Prescription Drugs.” HBS Marketing Research Papers, No. 03-07.