ryanair holdings plc - investor relations · global research published by raymond james &...
TRANSCRIPT
Global Research Published by Raymond James & Associates
Please read domestic and foreign disclosure/risk information beginning on page 4 and Analyst Certification on page 4.
© 2016 Raymond James & Associates, Inc., member New York Stock Exchange/SIPC. All rights reserved.
International Headquarters: The Raymond James Financial Center | 880 Carillon Parkway | St. Petersburg, Florida 33716 | 800-248-8863
Ryanair Holdings plc October 18, 2016
(RYAAY-NASDAQ) Company Comment Savanthi Syth, CFA, RJA, (727) 567-5274, [email protected]
Matt Roberts, Res. Assoc., RJA, (727) 567-2099, [email protected]
Airlines: Low Cost Carriers ______________________________________________
Not Immune to Yield Pressure, but Better Positioned; Reiterate Outperform
Recommendation: As discussed in our quick-take note earlier this morning, Ryanair lowered its FY17 (March YE) net profit guidance by ~5% to €1,300-1,350b on expectations of lower average fares partially offset by stronger passenger growth and lower non-fuel costs (Exhibit 1). Local shares are up ~2.5% as we believe investors had feared a larger cut. We are lowering our F2Q17E net profit and EPS by ~2% to €904m (+7% y/y) and $3.94 (+15% y/y) and our FY17E net profit and EPS by 2-3% to €1,341m (+8% y/y) and $5.85 (+16% y/y). With believe Ryanair’s competitive strengths (substantially lower costs and formidable balance sheet) are most advantageous in a challenging environment (rising fuel costs/industry yield pressure) and, thus, will continue to gain market share. As such, we reiterate our Outperform rating.
Lower fare outlook: Ryanair lowered its expectation for 2H (Dec-Q & Mar-Q) average fares from (10)-(12)% to (13)-(15)% reflecting yield pressure and the recent weakening of the sterling (GBP), which has declined ~5% against the euro since Ryanair’s August 23 update (on top of the ~12% decline prior to that following the Brexit vote). Similar to its European peers, Ryanair saw broad-based softness in bookings as it exited the peak summer season and has responded with more promotional fares.
GBP sensitivity: As discussed previously, Ryanair is long the GBP vs. the euro (EUR) with ~26% of revenue and only ~18% of costs denominated in GBP. As such, every £0.01 relative decrease has a negative €15m impact on annual net income. Additionally, while the weaker GBP is expected to pressure fares, it accounts for ~1 ppt of the improved non-fuel unit cost outlook which is now expected to decline 3% in FY17 vs. 1% previously.
Lowering estimates: We are lowering our F2Q17E net profit and EPS from €918m to €904m (+7% y/y) and from $4.00 to $3.94 (+15% y/y), with average fares expected to decline 9% y/y (vs. 7% previously) partly offset by lower non-fuel costs and slightly stronger ancillary revenue. Additionally, we are lowering our FY17E net profit and EPS from €1,376m to €1,341m (+8% y/y) and from $6.00 to $5.85 (+16% y/y), with average fares expected to decline 13% y/y (vs. 9% previously) partly offset by lower non-fuel costs, higher load factor, and slightly stronger ancillary revenue. In turn, our FY18E and FY19E EPS are lowered from $6.35 to $6.10 (+4% y/y) and from $6.65 to $6.35 (+4% y/y).
Valuation: Our $88 target price (down from $90) is based on ~14x our CY17E EPS of $6.24. The multiple is below the 16.1x for the S&P 500 (2017E) due to the higher level of economic uncertainty in the euro area. However, Ryanair has lower earnings volatility from fluctuating fuel prices as it has hedged 95% of its FY17 fuel needs at $62/bbl (down from $90/bbl in FY16) and 55% of FY18 at $50/bbl. Additionally, our EPS forecast does not reflect potential share repurchases, which we estimate at ~€500m (over $2/share) each in FY18/19.
Non-GAAP Q1 Q2 Q3 Q4 Full Revenues EPS Jun Sep Dec Mar Year (mil.)
2016A $0.99 $3.44 $0.42 $0.21 $5.06 €6,536 Old 2017E 1.12A 4.00 0.50 0.38 6.00 6,746
New 2017E 1.12A 3.94 0.50 0.29 5.85 6,710 Old 2018E UR UR UR UR 6.35 7,098
New 2018E UR UR UR UR 6.10 7,041 Old 2019E NA NA NA NA 6.65 7,908
New 2019E UR UR UR UR 6.35 7,847
UR: Under Review. Rows may not add due to rounding. Non-GAAP figures use the average exchange rate for the period and exclude non-recurring charges. Figures are based on ADRs/ADSs. Reported figures are in accordance with International Financial Reporting Standards (IFRS).
Rating _________________________________ Outperform 2 Current and Target Price __________________ Current Price (Oct-18-16) $69.63 Target Price: Old: $90.00 New: $88.00 52-Week Range $89.67 - $66.09 Suitability Medium Risk/Growth Market Data ___________________________ Shares Out. (mil.) 265.8 Market Cap. (mil.) $18,508 Avg. Daily Vol. (10 day) 521,904 Dividend/Yield $0.00/0.0% Book Value (Jun-16) $16.15 Adj. Net Debt (mil.)/% Cap. $537/11% Earnings & Valuation Metrics ______________
2016A 2017E 2018E 2019E
P/E Ratios (Non-GAAP) 13.8x 11.9x 11.4x 11.0x
2016E 2017E 2018E 2019E
Non-GAAP EPS (CY) Old $5.83 $6.43 $6.59 NA New $5.77 $6.24 $6.32 UR
P/E Ratios (CY Non-GAAP) 12.1x 11.2x 11.0x NM Company Description ____________________ Ryanair Holdings plc, headquartered in Dublin, Ireland, is Europe’s largest low cost carrier, with 81 bases and 1,600 routes across 29 countries. As of March 2016, it had a fleet of over 330 Boeing 737 aircraft and offered approximately 1,800 scheduled short-haul flights per day serving approximately 200 airports primarily in Europe.
Upcoming Catalyst ______________________ Ryanair is scheduled to release its F2Q17 (Sep Q) earnings results on November 7, 2016.

Raymond James Global Research
© 2016 Raymond James & Associates, Inc., member New York Stock Exchange/SIPC. All rights reserved.
International Headquarters: The Raymond James Financial Center | 880 Carillon Parkway | St. Petersburg, Florida 33716 | 800-248-8863 2
Exhibit 1: Ryanair Guidance Summary
Source: Ryanair, Raymond James research.
Revised
Guidance
Previous
GuidanceΔ
Ryanair
F17 Net Income €1.3-1.5b €1.375-1.425b (5)%
F17 Net Income (y/y) 7% 12% (5) ppts.
F17 CASM ex-fuel (3)% (1)% (2) ppts.
F17 Load Factor 95% 94% 1%
2H F17 Fares (13)-(15)% (10)-(12)% (3) ppts.
1H F17 Fares (10)% (9)% (1) ppts.

Raymond James Global Research
© 2016 Raymond James & Associates, Inc., member New York Stock Exchange/SIPC. All rights reserved.
International Headquarters: The Raymond James Financial Center | 880 Carillon Parkway | St. Petersburg, Florida 33716 | 800-248-8863 3
Last
Update
d:
10
/18
/16
(In
Eu
ros
an
d IF
RS
*)E
x-F
ue
lF
ue
l
Pa
xA
va
il.
An
cilla
ryT
ota
lC
os
tC
os
tC
os
t
Re
v %
An
cilla
ry %
To
tal
%O
pO
pO
pN
on
-Op
Pre
tax
Pre
tax
Ne
t S
hrs
.E
UR
Ea
rnin
gs
%A
DS
Se
ats
%L
oa
dP
.P.
Pa
x%
Av
era
ge
%R
ev
%A
ve
rag
e%
Pe
r%
Pe
r%
Pe
r%
(MM
)C
hg
Re
vC
hg
Re
vC
hg
Ex
pIn
cM
gn
Inc
(E
xp
)In
cM
gn
Ta
xIn
co
me
Ou
t.F
X R
ate
Pe
r A
DS
Ch
gO
ut.
(MM
)C
hg
Fa
cto
rC
hg
(MM
)C
hg
Fa
re^
Ch
gP
er
Pa
xC
hg
Fa
reC
hg
Pa
xC
hg
Pa
xC
hg
Pa
xC
hg
20
08
-1Q
June
€ 5
76
18
%€
11
75
3%
€ 6
93
22
%€
53
6€
15
72
3%
(€ 1
.5)
€ 1
56
23
%1
1%
€ 1
39
1,5
25
1.3
5$
0.6
12
8%
30
5.0
15
.32
1%
82
.6%
(1.8
)1
2.6
18
%€
45
.71
0%
€ 9
.29
29
%€
55
.00
4%
€ 4
2.5
15
%€
27
.41
1%
€ 1
5.1
-4%
20
08
-2Q
Se
pt.
€ 7
26
21
%€
13
55
4%
€ 8
61
25
%€
55
7€
30
43
5%
(€ 0
.4)
€ 3
04
35
%1
1%
€ 2
69
1,4
93
1.3
7$
1.2
33
7%
29
8.5
15
.72
2%
89
.0%
(0.4
)1
4.0
22
%€
52
.04
-1%
€ 9
.70
27
%€
61
.73
3%
€ 3
9.9
54
%€
25
.48
%€
14
.5-2
%
20
08
-3Q
De
c.
€ 4
59
15
%€
11
11
6%
€ 5
69
16
%€
52
5€
44
8%
(€ 7
.4)
€ 3
76
%5
%€
35
1,4
71
1.4
5$
0.1
7-1
5%
29
4.2
15
.32
1%
80
.8%
(0.3
)1
2.4
21
%€
37
.11
-4%
€ 8
.96
-3%
€ 4
6.0
7-4
%€
42
.49
0%
€ 2
6.9
6%
€ 1
5.6
-9%
20
08
-4Q
Ma
r.€
46
52
1%
€ 1
25
22
%€
59
02
1%
€ 5
48
€ 4
27
%(€
9.5
)€
33
6%
11
%€
29
1,4
59
1.5
0$
0.1
54
1%
29
1.7
16
.12
0%
74
.4%
(1.0
)1
2.0
19
%€
38
.72
2%
€ 1
0.4
13
%€
49
.14
2%
€ 4
5.6
40
%€
28
.54
%€
17
.2-4
%
20
08
-YR
€ 2
,22
61
9%
€ 4
88
35
%€
2,7
14
21
%€
2,1
66
€ 5
48
20
%(€
18
.7)
€ 5
29
19
%1
1%
€ 4
72
1,4
87
1.4
2$
2.2
53
3%
29
7.4
62
.42
1%
81
.6%
(0.8
)5
0.9
20
%€
43
.71
-1%
€ 9
.59
13
%€
53
.29
1%
€ 4
2.5
42
%€
27
.07
%€
15
.5-5
%
20
09
-1Q
June
€ 6
30
9%
€ 1
47
25
%€
77
71
2%
€ 7
51
€ 2
63
%(€
4.8
)€
21
3%
0%
€ 2
11
,45
11
.56
$0
.11
-82
%2
90
.31
8.5
21
%8
1.0
%(1
.6)
15
.01
9%
€ 4
2.1
4-8
%€
9.8
26
%€
51
.95
-6%
€ 5
0.2
31
8%
€ 2
5.7
-6%
€ 2
4.5
62
%
20
09
-2Q
Se
pt.
€ 8
58
18
%€
17
53
0%
€ 1
,03
42
0%
€ 8
23
€ 2
11
20
%(€
7.3
)€
20
32
0%
5%
€ 1
93
1,4
50
1.5
1$
1.0
1-1
8%
29
0.0
19
.02
1%
87
.7%
(1.3
)1
6.7
19
%€
51
.49
-1%
€ 1
0.5
29
%€
62
.01
0%
€ 4
9.3
72
4%
€ 2
4.1
-5%
€ 2
5.3
75
%
20
09
-3Q
De
c.
€ 4
73
3%
€ 1
32
19
%€
60
56
%€
69
6(€
92
)-1
5%
(€ 1
9.5
)(€
11
1)
-18
%9
%(€
10
1)
1,4
37
1.3
2($
0.4
7)
NM
28
7.4
17
.31
3%
80
.8%
0.0
14
.01
4%
€ 3
3.7
0-9
%€
9.4
05
%€
43
.09
-6%
€ 4
9.6
41
7%
€ 2
6.3
-2%
€ 2
3.4
50
%
20
09
-4Q
Ma
r.€
38
3-1
8%
€ 1
44
15
%€
52
7-1
1%
€ 5
27
(€ 0
)0
%(€
19
.0)
(€ 1
9)
-4%
10
%(€
17
)1
,44
41
.31
($0
.08
)N
M2
88
.81
7.3
7%
74
.5%
0.1
12
.97
%€
29
.66
-23
%€
11
.17
7%
€ 4
0.8
3-1
7%
€ 4
0.8
6-1
0%
€ 3
0.0
5%
€ 1
0.9
-37
%
20
09
-YR
€ 2
,34
45
%€
59
82
3%
€ 2
,94
28
%€
2,7
98
€ 1
44
5%
(€ 5
0.6
)€
94
3%
-2%
€ 9
61
,44
61
.42
$0
.47
-79
%2
89
.17
2.0
15
%8
1.3
%(0
.4)
58
.61
5%
€ 4
0.0
3-8
%€
10
.21
7%
€ 5
0.2
4-6
%€
47
.78
12
%€
26
.3-3
%€
21
.53
8%
20
10
-1Q
June
€ 6
09
-3%
€ 1
65
13
%€
77
50
%€
62
0€
15
52
0%
(€ 1
0.9
)€
14
41
9%
8%
€ 1
33
1,4
43
1.3
6$
0.6
34
56
%2
88
.72
0.1
9%
82
.5%
1.5
16
.61
1%
€ 3
6.7
1-1
3%
€ 9
.96
1%
€ 4
6.6
7-1
0%
€ 3
7.3
5-2
6%
€ 2
4.5
-5%
€ 1
2.9
-47
%
20
10
-2Q
Se
pt.
€ 8
11
-6%
€ 1
81
3%
€ 9
92
-4%
€ 6
94
€ 2
98
30
%(€
11
.1)
€ 2
87
29
%1
2%
€ 2
52
1,4
44
1.4
3$
1.2
52
4%
28
8.8
22
.41
8%
88
.4%
0.7
19
.81
9%
€ 4
0.9
6-2
0%
€ 9
.14
-13
%€
50
.11
-19
%€
35
.06
-29
%€
22
.7-6
%€
12
.4-5
1%
20
10
-3Q
De
c.
€ 4
73
0%
€ 1
39
6%
€ 6
12
1%
€ 6
11
€ 1
0%
(€ 1
3.9
)(€
13
)-2
%1
3%
(€ 1
1)
1,4
40
1.4
8($
0.0
6)
NM
28
8.1
19
.51
3%
82
.1%
1.3
16
.01
4%
€ 2
9.5
3-1
2%
€ 8
.71
-7%
€ 3
8.2
4-1
1%
€ 3
8.1
6-2
3%
€ 2
5.2
-4%
€ 1
2.9
-45
%
20
10
-4Q
Ma
r.€
43
21
3%
€ 1
78
23
%€
60
91
6%
€ 6
61
(€ 5
2)
-9%
(€ 1
1.7
)(€
64
)-1
0%
13
%(€
55
)1
,44
51
.38
($0
.26
)N
M2
88
.91
8.9
9%
74
.7%
0.2
14
.19
%€
30
.58
3%
€ 1
2.6
11
3%
€ 4
3.1
96
%€
46
.87
15
%€
30
.83
%€
16
.14
8%
20
10
-YR
€ 2
,32
5-1
%€
66
41
1%
€ 2
,98
82
%€
2,5
86
€ 4
02
13
%(€
47
.6)
€ 3
55
12
%1
0%
€ 3
19
1,4
43
1.4
1$
1.5
52
30
%2
88
.68
0.9
12
%8
2.2
%0
.96
6.5
14
%€
34
.95
-13
%€
9.9
8-2
%€
44
.93
-11
%€
38
.88
-19
%€
25
.4-3
%€
13
.4-3
7%
20
11
-1Q
June
€ 6
93
14
%€
20
42
3%
€ 8
97
16
%€
72
7€
16
91
9%
(€ 1
4.8
)€
15
51
7%
10
%€
13
81
,44
91
.28
$0
.61
-2%
28
9.9
23
.41
6%
76
.9%
(5.6
)1
8.0
8%
€ 3
8.4
95
%€
11
.33
14
%€
49
.82
7%
€ 4
0.4
18
%€
24
.50
%€
15
.92
3%
20
11
-2Q
Se
pt.
€ 1
,06
53
1%
€ 2
20
21
%€
1,2
85
30
%€
90
9€
37
62
9%
(€ 1
6.4
)€
36
02
8%
13
%€
31
31
,45
41
.29
$1
.39
11
%2
90
.72
5.2
13
%8
7.6
%(0
.8)
22
.11
2%
€ 4
8.1
91
8%
€ 9
.95
9%
€ 5
8.1
41
6%
€ 4
1.1
21
7%
€ 2
4.2
7%
€ 1
6.9
36
%
20
11
-3Q
De
c.
€ 5
79
23
%€
16
72
0%
€ 7
46
22
%€
74
7(€
0)
0%
(€ 1
2.4
)(€
13
)-2
%1
9%
(€ 1
0)
1,4
50
1.4
3($
0.0
5)
NM
29
0.1
20
.87
%8
2.2
%0
.21
7.1
7%
€ 3
3.8
71
5%
€ 9
.77
12
%€
43
.64
14
%€
43
.66
14
%€
27
.17
%€
16
.62
8%
20
11
-4Q
Ma
r.€
49
11
4%
€ 2
11
18
%€
70
21
5%
€ 7
30
(€ 2
9)
-4%
(€ 2
2.0
)(€
51
)-7
%2
0%
(€ 4
1)
1,4
53
1.3
7($
0.1
9)
NM
29
0.6
19
.85
%7
5.4
%0
.71
4.9
6%
€ 3
2.8
88
%€
14
.11
12
%€
46
.99
9%
€ 4
8.9
14
%€
30
.0-3
%€
18
.91
8%
20
11
-YR
€ 2
,82
82
2%
€ 8
02
21
%€
3,6
29
21
%€
3,1
13
€ 5
16
14
%(€
65
.6)
€ 4
51
12
%1
1%
€ 4
01
1,4
52
1.3
4$
1.7
61
3%
29
0.3
89
.21
0%
80
.8%
(1.4
)7
2.1
8%
€ 3
9.2
11
2%
€ 1
1.1
11
1%
€ 5
0.3
21
2%
€ 4
3.1
61
1%
€ 2
6.2
3%
€ 1
7.0
27
%
20
12
-1Q
June
€ 9
08
31
%€
24
82
1%
€ 1
,15
52
9%
€ 9
86
€ 1
70
15
%(€
13
.3)
€ 1
57
14
%1
1%
€ 1
39
1,4
56
1.4
4$
0.6
91
3%
29
1.2
25
.71
0%
82
.7%
5.8
21
.31
8%
€ 4
2.6
61
1%
€ 1
1.6
43
%€
54
.30
9%
€ 4
6.3
11
5%
€ 2
6.3
7%
€ 2
0.0
26
%
20
12
-2Q
Se
pt.
€ 1
,31
82
4%
€ 2
39
9%
€ 1
,55
72
1%
€ 1
,07
6€
48
13
1%
(€ 1
7.6
)€
46
33
0%
13
%€
40
41
,44
31
.42
$1
.98
43
%2
88
.62
6.7
6%
87
.7%
0.1
23
.56
%€
56
.18
17
%€
10
.18
2%
€ 6
6.3
61
4%
€ 4
5.8
71
2%
€ 2
5.4
5%
€ 2
0.5
21
%
20
12
-3Q
De
c.
€ 6
67
15
%€
17
76
%€
84
41
3%
€ 8
15
€ 2
93
%(€
13
.9)
€ 1
52
%4
%€
15
1,4
31
1.3
5$
0.0
7N
M2
86
.12
0.5
-1%
81
.4%
(0.8
)1
6.7
-2%
€ 3
9.9
31
8%
€ 1
0.5
98
%€
50
.51
16
%€
48
.76
12
%€
28
.86
%€
20
.02
0%
20
12
-4Q
Ma
r.€
54
51
1%
€ 2
23
6%
€ 7
68
9%
€ 8
30
(€ 6
2)
-8%
(€ 1
5.8
)(€
78
)-1
0%
15
%(€
66
)1
,43
71
.31
($0
.30
)N
M2
87
.41
9.1
-3%
75
.1%
(0.3
)1
4.4
-4%
€ 3
7.9
81
6%
€ 1
5.5
11
0%
€ 5
3.4
91
4%
€ 5
7.8
11
8%
€ 3
3.2
11
%€
24
.63
0%
20
12
-YR
€ 3
,43
92
2%
€ 8
86
11
%€
4,3
25
19
%€
3,7
07
€ 6
18
14
%(€
60
.6)
€ 5
57
13
%1
1%
€ 4
92
1,4
42
1.3
8$
2.4
43
9%
28
8.3
92
.13
%8
2.3
%1
.47
5.8
5%
€ 4
5.3
51
6%
€ 1
1.6
95
%€
57
.04
13
%€
48
.89
13
%€
27
.97
%€
21
.02
4%
20
13
-1Q
June
€ 9
98
10
%€
28
61
5%
€ 1
,28
41
1%
€ 1
,15
2€
13
21
0%
(€ 1
9.5
)€
11
39
%1
2%
€ 9
91
,41
01
.29
$0
.45
-35
%2
81
.92
7.5
7%
82
.0%
(0.7
)2
2.5
6%
€ 4
4.2
74
%€
12
.68
9%
€ 5
6.9
55
%€
51
.10
10
%€
27
.03
%€
24
.12
0%
20
13
-2Q
Se
pt.
€ 1
,52
41
6%
€ 2
98
25
%€
1,8
22
17
%€
1,2
42
€ 5
81
32
%(€
13
.9)
€ 5
67
31
%1
2%
€ 4
97
1,4
10
1.2
5$
2.2
11
1%
28
1.9
29
.41
0%
86
.7%
(1.0
)2
5.5
9%
€ 5
9.8
77
%€
11
.70
15
%€
71
.57
8%
€ 4
8.7
66
%€
25
.92
%€
22
.81
1%
20
13
-3Q
De
c.
€ 7
49
12
%€
22
02
4%
€ 9
69
15
%€
93
4€
35
4%
(€ 1
5.3
)€
19
2%
6%
€ 1
81
,41
21
.30
$0
.08
18
%2
82
.42
1.3
4%
81
.1%
(0.2
)1
7.3
3%
€ 4
3.2
98
%€
12
.73
20
%€
56
.02
11
%€
54
.02
11
%€
30
.04
%€
24
.02
0%
20
13
-4Q
Ma
r.€
54
91
%€
26
01
7%
€ 8
09
5%
€ 8
38
(€ 2
9)
-3.6
%(€
18
.6)
(€ 4
8)
-6%
7%
(€ 4
4)
1,4
14
1.3
2($
0.2
1)
NM
28
2.8
18
.4-4
%7
5.8
%0
.61
4.0
-3%
€ 3
9.3
24
%€
18
.65
20
%€
57
.97
8%
€ 6
0.0
64
%€
35
.36
%€
24
.81
%
20
13
-YR
€ 3
,82
01
1%
€ 1
,06
42
0%
€ 4
,88
41
3%
€ 4
,16
6€
71
81
5%
(€ 6
7.3
)€
65
11
3%
9%
€ 5
69
1,4
11
1.2
9$
2.5
34
%2
82
.29
6.6
5%
82
.1%
(0.2
)7
9.3
5%
€ 4
8.2
06
%€
13
.43
15
%€
61
.62
8%
€ 5
2.5
68
%€
28
.83
%€
23
.81
3%
20
14
-1Q
June
€ 9
86
-1%
€ 3
57
25
%€
1,3
42
5%
€ 1
,23
9€
10
38
%(€
14
.8)
€ 8
97
%1
2%
€ 7
81
,41
01
.31
$0
.36
-20
%2
82
.12
8.2
3%
82
.3%
0.3
23
.23
%€
42
.44
-4%
€ 1
5.3
52
1%
€ 5
7.7
91
%€
53
.34
4%
€ 2
8.5
6%
€ 2
4.8
3%
20
14
-2Q
Se
pt.
€ 1
,55
62
%€
35
62
0%
€ 1
,91
35
%€
1,2
99
€ 6
14
32
%(€
17
.0)
€ 5
97
31
%1
2%
€ 5
24
1,3
94
1.3
2$
2.4
91
3%
27
8.8
29
.71
%8
7.4
%0
.72
6.0
2%
€ 5
9.9
60
%€
13
.72
17
%€
73
.68
3%
€ 5
0.0
33
%€
26
.00
%€
24
.15
%
20
14
-3Q
De
c.
€ 7
15
-4%
€ 2
49
13
%€
96
40
%€
98
7(€
23
)-2
%(€
18
.8)
(€ 4
2)
-4%
16
%(€
35
)1
,37
21
.35
($0
.17
)N
M2
74
.42
2.3
5%
81
.9%
0.7
18
.36
%€
39
.18
-9%
€ 1
3.6
57
%€
52
.83
-6%
€ 5
4.0
90
%€
29
.2-3
%€
24
.94
%
20
14
-4Q
Ma
r.€
53
2-3
%€
28
51
0%
€ 8
18
1%
€ 8
53
(€ 3
6)
-4%
(€ 1
6.6
)(€
52
)-6
%1
6%
(€ 4
4)
1,3
54
1.3
7($
0.2
2)
NM
27
0.9
18
.71
%7
6.3
%0
.51
4.2
2%
€ 3
7.4
0-5
%€
20
.05
8%
€ 5
7.4
5-1
%€
59
.95
0%
€ 3
4.9
-1%
€ 2
5.1
1%
20
14
-YR
€ 3
,79
0-1
%€
1,2
47
17
%€
5,0
37
3%
€ 4
,37
8€
65
91
3%
(€ 6
7.2
)€
59
11
2%
12
%€
52
31
,38
31
.34
$2
.45
-3%
27
6.5
98
.92
%8
2.6
%0
.58
1.7
3%
€ 4
6.4
0-4
%€
15
.27
14
%€
61
.67
0%
€ 5
3.6
12
%€
29
.01
%€
24
.64
%
20
15
-1Q
June
€ 1
,12
51
4%
€ 3
71
4%
€ 1
,49
61
1%
€ 1
,26
4€
23
21
5%
(€ 8
.2)
€ 2
24
15
%1
2%
€ 1
97
1,3
84
1.3
7$
0.9
81
70
%2
76
.72
8.3
0%
85
.7%
3.3
24
.34
%€
46
.38
9%
€ 1
5.2
80
%€
61
.66
7%
€ 5
2.1
0-2
%€
28
.91
%€
23
.2-6
%
20
15
-2Q
Se
pt.
€ 1
,67
17
%€
37
14
%€
2,0
42
7%
€ 1
,34
0€
70
23
4%
(€ 1
7.7
)€
68
43
3%
13
%€
59
81
,38
81
.33
$2
.86
15
%2
77
.62
9.6
0%
91
.4%
4.0
27
.14
%€
61
.77
3%
€ 1
3.7
00
%€
75
.46
2%
€ 4
9.5
3-1
%€
27
.14
%€
22
.5-7
%
20
15
-3Q
De
c.
€ 8
36
17
%€
29
61
9%
€ 1
,13
21
7%
€ 1
,06
1€
72
6%
(€ 1
7.3
)€
54
5%
10
%€
49
1,3
89
1.2
5$
0.2
2N
M2
77
.82
3.5
5%
88
.6%
6.7
20
.81
4%
€ 4
0.1
73
%€
14
.24
4%
€ 5
4.4
13
%€
50
.97
-6%
€ 2
9.3
0%
€ 2
1.7
-13
%
20
15
-4Q
Ma
r.€
62
81
8%
€ 3
56
25
%€
98
42
0%
€ 9
47
€ 3
84
%(€
17
.3)
€ 2
12
%-1
1%
€ 2
31
,39
01
.13
$0
.09
NM
27
7.9
21
.11
3%
87
.5%
11
.21
8.5
30
%€
34
.05
-9%
€ 1
9.3
0-4
%€
53
.35
-7%
€ 5
1.3
0-1
4%
€ 3
1.3
-10
%€
20
.0-2
0%
20
15
-YR
€ 4
,26
01
2%
€ 1
,39
41
2%
€ 5
,65
41
2%
€ 4
,61
1€
1,0
43
18
%(€
60
.5)
€ 9
82
17
%1
2%
€ 8
67
1,3
88
1.2
7$
4.1
56
9%
27
7.5
10
2.5
4%
88
.4%
5.7
90
.61
1%
€ 4
7.0
41
%€
15
.39
1%
€ 6
2.4
21
%€
50
.91
-5%
€ 2
8.9
0%
€ 2
2.0
-11
%
20
16
-1Q
June
€ 1
,24
81
1%
€ 4
05
9%
€ 1
,65
31
0%
€ 1
,36
4€
28
81
7%
(€ 1
0.6
)€
27
81
7%
12
%€
24
51
,37
61
.11
$0
.99
1%
27
5.2
30
.47
%9
2.0
%6
.32
8.0
15
%€
44
.58
-4%
€ 1
4.4
5-5
%€
59
.03
-4%
€ 4
8.7
3-6
%€
28
.70
%€
20
.0-1
4%
20
16
-2Q
Se
pt.
€ 1
,99
21
9%
€ 3
96
7%
€ 2
,38
71
7%
€ 1
,41
5€
97
24
1%
(€ 1
0.9
)€
96
14
0%
12
%€
84
31
,36
31
.11
$3
.44
20
%2
72
.63
1.8
7%
94
.7%
3.3
30
.11
1%
€ 6
6.2
07
%€
13
.14
-4%
€ 7
9.3
45
%€
47
.04
-5%
€ 2
7.2
0%
€ 1
9.8
-12
%
20
16
-3Q
De
c.
€ 9
87
18
%€
34
21
6%
€ 1
,33
01
7%
€ 1
,20
4€
12
69
%(€
14
.9)
€ 1
11
8%
8%
€ 1
03
1,3
37
1.0
9$
0.4
29
1%
26
7.5
26
.81
4%
92
.8%
4.2
24
.92
0%
€ 3
9.6
6-1
%€
13
.76
-3%
€ 5
3.4
2-2
%€
48
.35
-5%
€ 2
8.9
-1%
€ 1
9.5
-10
%
20
16
-4Q
Ma
r.€
74
01
8%
€ 4
26
20
%€
1,1
66
18
%€
1,0
93
€ 7
46
%(€
19
.3)
€ 5
45
%7
%€
51
1,3
18
1.1
0$
0.2
11
30
%2
63
.52
5.5
21
%9
1.7
%4
.22
3.4
27
%€
31
.66
-7%
€ 1
8.2
2-6
%€
49
.88
-7%
€ 4
6.7
3-9
%€
28
.4-9
%€
18
.4-8
%
20
16
-YR
€ 4
,96
71
7%
€ 1
,56
91
3%
€ 6
,53
61
6%
€ 5
,07
6€
1,4
60
22
%(€
55
.7)
€ 1
,40
42
1%
12
%€
1,2
42
1,3
48
1.1
0$
5.0
62
2%
26
9.7
11
4.5
12
%9
2.9
%4
.51
06
.41
7%
€ 4
6.7
0-1
%€
14
.75
-4%
€ 6
1.4
5-2
%€
47
.72
-6%
€ 2
8.2
-2%
€ 1
9.5
-11
%
20
17
-1Q
June
€ 1
,24
40
%€
44
31
0%
€ 1
,68
72
%€
1,3
81
€ 3
07
18
%(€
20
.3)
€ 2
87
17
%1
1%
€ 2
56
1,2
84
1.1
3$
1.1
21
4%
25
6.8
33
.29
%9
3.9
%1
.83
1.2
11
%€
39
.92
-10
%€
14
.23
-2%
€ 5
4.1
5-8
%€
44
.31
-9%
€ 2
7.7
-4%
€ 1
6.6
-17
%
20
17
-2Q
ES
ep
t.€
2,0
24
2%
€ 4
47
13
%€
2,4
71
4%
€ 1
,42
4€
1,0
47
42
%(€
19
.0)
€ 1
,02
84
2%
12
%€
90
41
,28
21
.12
$3
.94
15
%2
56
.33
5.1
11
%9
5.7
%1
.03
3.6
12
%€
60
.24
-9%
€ 1
3.3
01
%€
73
.54
-7%
€ 4
2.3
9-1
0%
€ 2
6.5
-3%
€ 1
5.9
-20
%
20
17
-3Q
ED
ec.
€ 9
78
-1%
€ 3
92
14
%€
1,3
70
3%
€ 1
,22
0€
15
01
1%
(€ 1
9.0
)€
13
11
0%
12
%€
11
51
,28
21
.11
$0
.50
19
%2
56
.33
0.3
13
%9
3.5
%0
.72
8.3
14
%€
34
.50
-13
%€
13
.83
1%
€ 4
8.3
3-1
0%
€ 4
3.0
4-1
1%
€ 2
8.0
-3%
€ 1
5.0
-23
%
20
17
-4Q
EM
ar.
€ 7
08
-4%
€ 4
74
11
%€
1,1
82
1%
€ 1
,08
7€
95
8%
(€ 1
9.0
)€
76
6%
12
%€
66
1,2
82
1.1
1$
0.2
93
6%
25
6.3
27
.89
%9
2.5
%0
.82
5.7
10
%€
27
.54
-13
%€
18
.43
1%
€ 4
5.9
7-8
%€
42
.30
-9%
€ 2
7.5
-3%
€ 1
4.8
-20
%
20
17
-YR
E€
4,9
54
0%
€ 1
,75
61
2%
€ 6
,71
03
%€
5,1
13
€ 1
,59
82
4%
(€ 7
7.3
)€
1,5
21
23
%1
2%
€ 1
,34
11
,28
21
.12
$5
.85
16
%2
56
.51
26
.41
0%
94
.0%
1.1
11
8.8
12
%€
41
.70
-11
%€
14
.78
0%
€ 5
6.4
8-8
%€
43
.03
-10
%€
27
.4-3
%€
15
.7-2
0%
20
18
-YR
E€
5,1
68
4%
€ 1
,87
47
%€
7,0
41
5%
€ 5
,37
0€
1,6
71
24
%(€
71
.0)
€ 1
,60
02
3%
12
%€
1,4
08
1,2
82
1.1
1$
6.1
04
%2
56
.31
35
.37
%9
3.7
%(0
.2)
12
6.8
7%
€ 4
0.7
5-2
%€
14
.78
0%
€ 5
5.5
3-2
%€
42
.35
-2%
€ 2
7.4
0%
€ 1
5.0
-4%
20
19
-YR
E€
5,7
83
12
%€
2,0
64
10
%€
7,8
47
11
%€
6,1
17
€ 1
,73
02
2%
(€ 6
3.0
)€
1,6
67
21
%1
2%
€ 1
,46
71
,28
21
.11
$6
.35
4%
25
6.3
14
6.1
8%
93
.7%
(0.0
)1
37
.08
%€
42
.22
4%
€ 1
5.0
72
%€
57
.30
3%
€ 4
4.6
75
%€
27
.20
%€
17
.41
6%
*F1
Q1
1 e
xclu
de
s v
olc
an
ic a
sh
re
late
d c
osts
of
€50
millio
n o
r $
0.2
0 p
er
AD
S (
pre
-sto
ck s
plit)
CY
14
$3
.83
55
%J
uly
11
.81
0%
96
.0%
1.0
11
.31
1%
CY
15
$4
.94
29
%A
ug
12
.09
%9
6.0
%1
.01
1.5
11
%
CY
16
$5
.77
17
%S
ep
t1
1.4
12
%9
5.0
%1
.01
0.8
13
%
CY
17
$6
.24
8%
F2
Q1
73
5.1
11
%9
5.7
%1
.03
3.6
12
%
CY
18
$6
.32
1%
Ry
an
air
Ho
ldin
gs
plc
EP
S C
on
ve
rte
d t
o $
US
D
Pre
va
ilin
g E
UR
Ex
ch
. R
ate
Raymond James Global Research
© 2016 Raymond James & Associates, Inc., member New York Stock Exchange/SIPC. All rights reserved.
International Headquarters: The Raymond James Financial Center | 880 Carillon Parkway | St. Petersburg, Florida 33716 | 800-248-8863 4
Important Investor Disclosures Raymond James & Associates (RJA) is a FINRA member firm and is responsible for the preparation and distribution of research created in the United States. Raymond James & Associates is located at The Raymond James Financial Center, 880 Carillon Parkway, St. Petersburg, FL 33716, (727) 567-1000. Non-U.S. affiliates, which are not FINRA member firms, include the following entities that are responsible for the creation and distribution of research in their respective areas: in Canada, Raymond James Ltd. (RJL), Suite 2100, 925 West Georgia Street, Vancouver, BC V6C 3L2, (604) 659-8200; in Latin America, Raymond James Argentina S.A., San Martin 344, 22nd Floor, Buenos Aires, C10004AAH, Argentina, +54 11 4850 2500; in Europe, Raymond James Euro Equities SAS (also trading as Raymond James International), 40, rue La Boetie, 75008, Paris, France, +33 1 45 64 0500, and Raymond James Financial International Ltd., Broadwalk House, 5 Appold Street, London, England EC2A 2AG, +44 203 798 5600.
This document is not directed to, or intended for distribution to or use by, any person or entity that is a citizen or resident of or located in any locality, state, country, or other jurisdiction where such distribution, publication, availability or use would be contrary to law or regulation. The securities discussed in this document may not be eligible for sale in some jurisdictions. This research is not an offer to sell or the solicitation of an offer to buy any security in any jurisdiction where such an offer or solicitation would be illegal. It does not constitute a personal recommendation or take into account the particular investment objectives, financial situations, or needs of individual clients. Past performance is not a guide to future performance, future returns are not guaranteed, and a loss of original capital may occur. Investors should consider this report as only a single factor in making their investment decision.
For clients in the United States: Any foreign securities discussed in this report are generally not eligible for sale in the U.S. unless they are listed on a U.S. exchange. This report is being provided to you for informational purposes only and does not represent a solicitation for the purchase or sale of a security in any state where such a solicitation would be illegal. Investing in securities of issuers organized outside of the U.S., including ADRs, may entail certain risks. The securities of non-U.S. issuers may not be registered with, nor be subject to the reporting requirements of, the U.S. Securities and Exchange Commission. There may be limited information available on such securities. Investors who have received this report may be prohibited in certain states or other jurisdictions from purchasing the securities mentioned in this report. Please ask your Financial Advisor for additional details and to determine if a particular security is eligible for purchase in your state.
The information provided is as of the date above and subject to change, and it should not be deemed a recommendation to buy or sell any security. Certain information has been obtained from third-party sources we consider reliable, but we do not guarantee that such information is accurate or complete. Persons within the Raymond James family of companies may have information that is not available to the contributors of the information contained in this publication. Raymond James, including affiliates and employees, may execute transactions in the securities listed in this publication that may not be consistent with the ratings appearing in this publication.
Raymond James (“RJ”) research reports are disseminated and available to RJ’s retail and institutional clients simultaneously via electronic publication to RJ's internal proprietary websites (RJ Investor Access & RJ Capital Markets). Not all research reports are directly distributed to clients or third-party aggregators. Certain research reports may only be disseminated on RJ's internal proprietary websites; however such research reports will not contain estimates or changes to earnings forecasts, target price, valuation, or investment or suitability rating. Individual Research Analysts may also opt to circulate published research to one or more clients electronically. This electronic communication distribution is discretionary and is done only after the research has been publically disseminated via RJ’s internal proprietary websites. The level and types of communications provided by Research Analysts to clients may vary depending on various factors including, but not limited to, the client’s individual preference as to the frequency and manner of receiving communications from Research Analysts. For research reports, models, or other data available on a particular security, please contact your RJ Sales Representative or visit RJ Investor Access or RJ Capital Markets.
Additional information is available on request.
Analyst Information
Registration of Non-U.S. Analysts: The analysts listed on the front of this report who are not employees of Raymond James & Associates, Inc., are not registered/qualified as research analysts under FINRA rules, are not associated persons of Raymond James & Associates, Inc., and are not subject to FINRA Rule 2241 restrictions on communications with covered companies, public companies, and trading securities held by a research analyst account.
Analyst Holdings and Compensation: Equity analysts and their staffs at Raymond James are compensated based on a salary and bonus system. Several factors enter into the bonus determination including quality and performance of research product, the analyst's success in rating stocks versus an industry index, and support effectiveness to trading and the retail and institutional sales forces. Other factors may include but are not limited to: overall ratings from internal (other than investment banking) or external parties and the general productivity and revenue generated in covered stocks.
The views expressed in this report accurately reflect the personal views of the analyst(s) covering the subject securities. No part of said person's compensation was, is, or will be directly or indirectly related to the specific recommendations or views contained in this research report. In addition, said analyst has not received compensation from any subject company in the last 12 months.
Raymond James Global Research
© 2016 Raymond James & Associates, Inc., member New York Stock Exchange/SIPC. All rights reserved.
International Headquarters: The Raymond James Financial Center | 880 Carillon Parkway | St. Petersburg, Florida 33716 | 800-248-8863 5
Ratings and Definitions
Raymond James & Associates (U.S.) definitions
Strong Buy (SB1) Expected to appreciate, produce a total return of at least 15%, and outperform the S&P 500 over the next six to 12 months. For higher yielding and more conservative equities, such as REITs and certain MLPs, a total return of at least 15% is expected to be realized over the next 12 months. Outperform (MO2) Expected to appreciate and outperform the S&P 500 over the next 12-18 months. For higher yielding and more conservative equities, such as REITs and certain MLPs, an Outperform rating is used for securities where we are comfortable with the relative safety of the dividend and expect a total return modestly exceeding the dividend yield over the next 12-18 months. Market Perform (MP3) Expected to perform generally in line with the S&P 500 over the next 12 months. Underperform (MU4) Expected to underperform the S&P 500 or its sector over the next six to 12 months and should be sold. Suspended (S) The rating and price target have been suspended temporarily. This action may be due to market events that made coverage impracticable, or to comply with applicable regulations or firm policies in certain circumstances, including when Raymond James may be providing investment banking services to the company. The previous rating and price target are no longer in effect for this security and should not be relied upon. Raymond James Ltd. (Canada) definitions
Strong Buy (SB1) The stock is expected to appreciate and produce a total return of at least 15% and outperform the S&P/TSX Composite Index over the next six months. Outperform (MO2) The stock is expected to appreciate and outperform the S&P/TSX Composite Index over the next twelve months. Market Perform (MP3) The stock is expected to perform generally in line with the S&P/TSX Composite Index over the next twelve months and is potentially a source of funds for more highly rated securities. Underperform (MU4) The stock is expected to underperform the S&P/TSX Composite Index or its sector over the next six to twelve months and should be sold. Raymond James Argentina S.A. rating definitions
Strong Buy (SB1) Expected to appreciate and produce a total return of at least 25.0% over the next twelve months. Outperform (MO2) Expected to appreciate and produce a total return of between 15.0% and 25.0% over the next twelve months. Market Perform (MP3) Expected to perform in line with the underlying country index. Underperform (MU4) Expected to underperform the underlying country index. Suspended (S) The rating and price target have been suspended temporarily. This action may be due to market events that made coverage impracticable, or to comply with applicable regulations or firm policies in certain circumstances, including when Raymond James may be providing investment banking services to the company. The previous rating and price target are no longer in effect for this security and should not be relied upon.
Raymond James Europe (Raymond James Euro Equities SAS & Raymond James Financial International Limited) rating definitions
Strong Buy (1) Expected to appreciate, produce a total return of at least 15%, and outperform the Stoxx 600 over the next 6 to 12 months. Outperform (2) Expected to appreciate and outperform the Stoxx 600 over the next 12 months. Market Perform (3) Expected to perform generally in line with the Stoxx 600 over the next 12 months. Underperform (4) Expected to underperform the Stoxx 600 or its sector over the next 6 to 12 months. Suspended (S) The rating and target price have been suspended temporarily. This action may be due to market events that made coverage impracticable, or to comply with applicable regulations or firm policies in certain circumstances, including when Raymond James may be providing investment banking services to the company. The previous rating and target price are no longer in effect for this security and should not be relied upon. In transacting in any security, investors should be aware that other securities in the Raymond James research coverage universe might carry a higher or lower rating. Investors should feel free to contact their Financial Advisor to discuss the merits of other available investments.
Rating Distributions
Coverage Universe Rating Distribution* Investment Banking Distribution
RJA RJL RJ Arg RJEE/RJFI RJA RJL RJ Arg RJEE/RJFI
Strong Buy and Outperform (Buy) 54% 68% 56% 53% 17% 42% 11% 0%
Market Perform (Hold) 42% 31% 44% 35% 7% 22% 0% 0%
Underperform (Sell) 4% 1% 0% 12% 5% 0% 0% 0%
* Columns may not add to 100% due to rounding.
Raymond James Global Research
© 2016 Raymond James & Associates, Inc., member New York Stock Exchange/SIPC. All rights reserved.
International Headquarters: The Raymond James Financial Center | 880 Carillon Parkway | St. Petersburg, Florida 33716 | 800-248-8863 6
Suitability Ratings (SR)
Medium Risk/Income (M/INC) Lower to average risk equities of companies with sound financials, consistent earnings, and dividend yields above that of the S&P 500. Many securities in this category are structured with a focus on providing a consistent dividend or return of capital.
Medium Risk/Growth (M/GRW) Lower to average risk equities of companies with sound financials, consistent earnings growth, the potential for long-term price appreciation, a potential dividend yield, and/or share repurchase program.
High Risk/Income (H/INC) Medium to higher risk equities of companies that are structured with a focus on providing a meaningful dividend but may face less predictable earnings (or losses), more leveraged balance sheets, rapidly changing market dynamics, financial and competitive issues, higher price volatility (beta), and potential risk of principal. Securities of companies in this category may have a less predictable income stream from dividends or distributions of capital.
High Risk/Growth (H/GRW) Medium to higher risk equities of companies in fast growing and competitive industries, with less predictable earnings (or losses), more leveraged balance sheets, rapidly changing market dynamics, financial or legal issues, higher price volatility (beta), and potential risk of principal.
High Risk/Speculation (H/SPEC) High risk equities of companies with a short or unprofitable operating history, limited or less predictable revenues, very high risk associated with success, significant financial or legal issues, or a substantial risk/loss of principal.
Raymond James Relationship Disclosures
Raymond James expects to receive or intends to seek compensation for investment banking services from the subject companies in the next three months.
Company Name Disclosure
Ryanair Holdings plc Raymond James & Associates makes a market in shares of RYAAY.
Stock Charts, Target Prices, and Valuation Methodologies
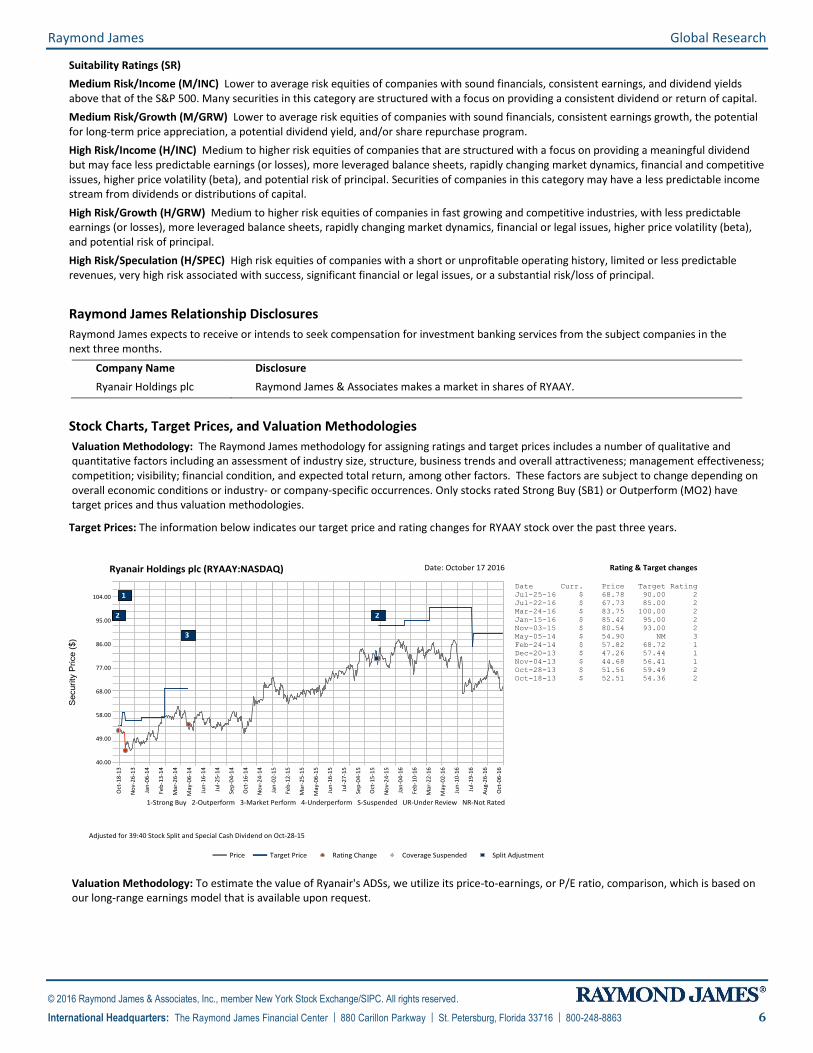
Valuation Methodology: The Raymond James methodology for assigning ratings and target prices includes a number of qualitative and quantitative factors including an assessment of industry size, structure, business trends and overall attractiveness; management effectiveness; competition; visibility; financial condition, and expected total return, among other factors. These factors are subject to change depending on overall economic conditions or industry- or company-specific occurrences. Only stocks rated Strong Buy (SB1) or Outperform (MO2) have target prices and thus valuation methodologies.
Target Prices: The information below indicates our target price and rating changes for RYAAY stock over the past three years.
Valuation Methodology: To estimate the value of Ryanair's ADSs, we utilize its price-to-earnings, or P/E ratio, comparison, which is based on our long-range earnings model that is available upon request.
Raymond James Global Research
© 2016 Raymond James & Associates, Inc., member New York Stock Exchange/SIPC. All rights reserved.
International Headquarters: The Raymond James Financial Center | 880 Carillon Parkway | St. Petersburg, Florida 33716 | 800-248-8863 7
Risk Factors
General Risk Factors: Following are some general risk factors that pertain to the businesses of the subject companies and the projected target prices and recommendations included on Raymond James research: (1) Industry fundamentals with respect to customer demand or product / service pricing could change and adversely impact expected revenues and earnings; (2) Issues relating to major competitors or market shares or new product expectations could change investor attitudes toward the sector or this stock; (3) Unforeseen developments with respect to the management, financial condition or accounting policies or practices could alter the prospective valuation; or (4) External factors that affect the U.S. economy, interest rates, the U.S. dollar or major segments of the economy could alter investor confidence and investment prospects. International investments involve additional risks such as currency fluctuations, differing financial accounting standards, and possible political and economic instability.
Specific Investment Risks Related to the Industry or Issuer
Airline Industry Risk Factors Companies within the airline industry are exposed to risks relating to general economic and market conditions. External economic factors include the fluctuations in the price of jet fuel and capacity changes by competing airlines, which can negatively impact operating costs and revenue, respectively. Airlines operating in international markets may also be exposed to fluctuations in foreign currencies. Also, the airline industry is highly unionized, which implies that a significant number of employees may be subject to risks associated with labor contract negotiations and potential strikes. Moreover, Airlines are subject to various federal, state, local, and foreign laws and regulations and, as a result, are highly exposed to the impacts of new regulation. Greater U.S. government scrutiny on ancillary revenue and the European Union’s recently enacted carbon emissions tax are examples of recent concerns faced by the industry.
Company-Specific Risk Factors for Ryanair Holdings plc Currency Mismatch Majority of Ryanair’s costs are in U.S. dollars (USD) while a majority of its revenue is in British pounds (GBP) and euros (EUR). Moreover, 28% of Ryanair’s revenue and 21% of its non-fuel costs (which accounts for ~64% of total) are denominated in GBP, making it net long the GBP. Regarding its USD costs, Ryanair has hedged 100% of its aircraft purchase costs through FY19 at ~1.31 USD/EUR. Moreover, it has hedged ~95% of its FY17 (March year-end) and ~45% of its FY18 fuel purchases (most of the USD cost) at an exchange rate of 1.18 and 1.12 USD/EUR, respectively. Therefore, the strengthening of the USD against the euro is unlikely to have a material negative impact on its earnings through YE CY17. However, while the USD strength does not impact earnings, it has a material impact in the translation to EPS (per ADR share).
Brexit Vote Uncertainty The recent vote by the U.K. to leave the European Union creates substantial uncertainty not only in terms of economic growth and currency exchange rates, but also on whether the U.K. will remain part of the European Common Aviation Area (CAA). If the U.K. is required to leave the CAA, it will need to negotiate bilateral agreements with the EU and other countries, which may require Ryanair to discontinue intra-U.K. service (~1.5% of total seats) or to set up a U.K. subsidiary.
Additional Risk and Disclosure information, as well as more information on the Raymond James rating system and suitability categories, is available at rjcapitalmarkets.com/Disclosures/index. Copies of research or Raymond James’ summary policies relating to research analyst independence can be obtained by contacting any Raymond James & Associates or Raymond James Financial Services office (please see raymondjames.com for office locations) or by calling 727-567-1000, toll free 800-237-5643 or sending a written request to the Equity Research Library, Raymond James & Associates, Inc., Tower 3, 6
th Floor, 880 Carillon Parkway, St. Petersburg, FL
33716.
For clients in the United Kingdom:
For clients of Raymond James & Associates (London Branch) and Raymond James Financial International Limited (RJFI): This document and any investment to which this document relates is intended for the sole use of the persons to whom it is addressed, being persons who are Eligible Counterparties or Professional Clients as described in the FCA rules or persons described in Articles 19(5) (Investment professionals) or 49(2) (High net worth companies, unincorporated associations etc) of the Financial Services and Markets Act 2000 (Financial Promotion) Order 2005 (as amended) or any other person to whom this promotion may lawfully be directed. It is not intended to be distributed or passed on, directly or indirectly, to any other class of persons and may not be relied upon by such persons and is therefore not intended for private individuals or those who would be classified as Retail Clients.
For clients of Raymond James Investment Services, Ltd.: This report is for the use of professional investment advisers and managers and is not intended for use by clients.

Raymond James Global Research
© 2016 Raymond James & Associates, Inc., member New York Stock Exchange/SIPC. All rights reserved.
International Headquarters: The Raymond James Financial Center | 880 Carillon Parkway | St. Petersburg, Florida 33716 | 800-248-8863 8
For purposes of the Financial Conduct Authority requirements, this research report is classified as independent with respect to conflict of interest management. RJA, RJFI, and Raymond James Investment Services, Ltd. are authorised and regulated by the Financial Conduct Authority in the United Kingdom.
For clients in France:
This document and any investment to which this document relates is intended for the sole use of the persons to whom it is addressed, being persons who are Eligible Counterparties or Professional Clients as described in “Code Monétaire et Financier” and Règlement Général de l’Autorité des Marchés Financiers. It is not intended to be distributed or passed on, directly or indirectly, to any other class of persons and may not be relied upon by such persons and is therefore not intended for private individuals or those who would be classified as Retail Clients.
For clients of Raymond James Euro Equities: Raymond James Euro Equities is authorised and regulated by the Autorité de Contrôle Prudentiel et de Résolution and the Autorité des Marchés Financiers.
For institutional clients in the European Economic Area (EEA) outside of the United Kingdom:
This document (and any attachments or exhibits hereto) is intended only for EEA institutional clients or others to whom it may lawfully be submitted.
For Canadian clients:
This report is not prepared subject to Canadian disclosure requirements, unless a Canadian analyst has contributed to the content of the report. In the case where there is Canadian analyst contribution, the report meets all applicable IIROC disclosure requirements.
Proprietary Rights Notice: By accepting a copy of this report, you acknowledge and agree as follows:
This report is provided to clients of Raymond James only for your personal, noncommercial use. Except as expressly authorized by Raymond James, you may not copy, reproduce, transmit, sell, display, distribute, publish, broadcast, circulate, modify, disseminate or commercially exploit the information contained in this report, in printed, electronic or any other form, in any manner, without the prior express written consent of Raymond James. You also agree not to use the information provided in this report for any unlawful purpose. This is RJA client
releasable resear ch
This report and its contents are the property of Raymond James and are protected by applicable copyright, trade secret or other intellectual property laws (of the United States and other countries). United States law, 17 U.S.C. Sec.501 et seq, provides for civil and criminal penalties for copyright infringement. No copyright claimed in incorporated U.S. government works.