ryder system inc - annualreports.com€¦ · ryder system, inc. (the company ) was incorpo rated in...
TRANSCRIPT

RYDER SYSTEM INC
FORM 10-K(Annual Report)
Filed 03/03/03 for the Period Ending 12/31/02
Address 11690 N.W. 105TH STREET
MIAMI, FL 33178Telephone 3055003726
CIK 0000085961Symbol R
SIC Code 7510 - Automotive Rental And Leasing, Without DriversIndustry Rental & Leasing
Sector ServicesFiscal Year 12/31
http://www.edgar-online.com© Copyright 2015, EDGAR Online, Inc. All Rights Reserved.
Distribution and use of this document restricted under EDGAR Online, Inc. Terms of Use.

SECURITIES AND EXCHANGE COMMISSION WASHINGTON, D.C. 20549
FORM 10-K
RYDER SYSTEM, INC. (Exact name of registrant as specified in its charter)
Indicate by check mark whether the registrant (l) has filed all reports required to be filed by Section 13 or 15(d) of the Securities Exchange Act of 1934 during the preceding 12 months (or for such shorter period that the registrant was required to file such reports), and (2) has been subject to such filing requirements for the past 90 days: YES NO �
Indicate by check mark if disclosure of delinquent filers pursuant to Item 405 of Regulation S-K is not contained herein, and will not be contained, to the best of the registrant’s knowledge, in definitive proxy or information statements incorporated by reference in Part III of this Form 10-K or any amendment to this Form 10-K: �
Indicate by check mark whether the registrant is an accelerated filer (as defined by Rule 12b-2 of the Exchange Act). YES NO �
The aggregate market value of the voting and non-voting common equity held by non-affiliates of the registrant computed by reference to the price at which the common equity was sold as of June 30, 2002 was $1,677,366,804. The number of shares of Ryder System, Inc. Common Stock ($0.50 par value) outstanding as of January 31, 2003 was 62,512,753.
ANNUAL REPORT PURSUANT TO SECTION 13 OR 15(d) OF THE SECURITIES EXCHANGE ACT OF 1934
FOR THE FISCAL YEAR ENDED DECEMBER 31, 2002 OR �
TRANSITION REPORT PURSUANT TO SECTION 13 OR 15(d) OF THE SECURITIES EXCHANGE ACT OF 1934 FOR THE TRANSITION PERIOD FROM TO
Commission file number 1-4364
FLORIDA 59-0739250
(State or other jurisdiction of incorporation or organization)
(I.R.S. Employer Identification No.)
3600 N.W. 82 AVENUE, MIAMI, FLORIDA 33166 (305) 500-3726
(Address of principal executive offices including zip code)
(Telephone number including area code)
DOCUMENTS INCORPORATED BY REFERENCE INTO THIS REPORT
PART OF FORM 10-K INTO WHICH DOCUMENT IS INCORPORATED
Ryder System, Inc. 2003 Proxy Statement
Part III

[Cover page 1 of 2 pages]
SECURITIES REGISTERED PURSUANT TO SECTION 12(b) OF THE ACT:
SECURITIES REGISTERED PURSUANT TO SECTION 12(g) OF THE ACT:
[Cover page 2 of 2 pages]
TITLE OF EACH CLASS OF SECURITIES EXCHANGE ON WHICH REGISTERED
Ryder System, Inc. Common Stock ($.50 par value) and Preferred Share Purchase Rights (the Rights are not currently exercisable, transferable or exchangeable apart from the Common Stock)
New York Stock Exchange Pacific Stock Exchange Chicago Stock Exchange Berlin Stock Exchange
Ryder System, Inc. 9% Series G Bonds, due May 15, 2016
New York Stock Exchange
Ryder System, Inc. 9 7/8% Series K Bonds, due May 15, 2017
New York Stock Exchange
None
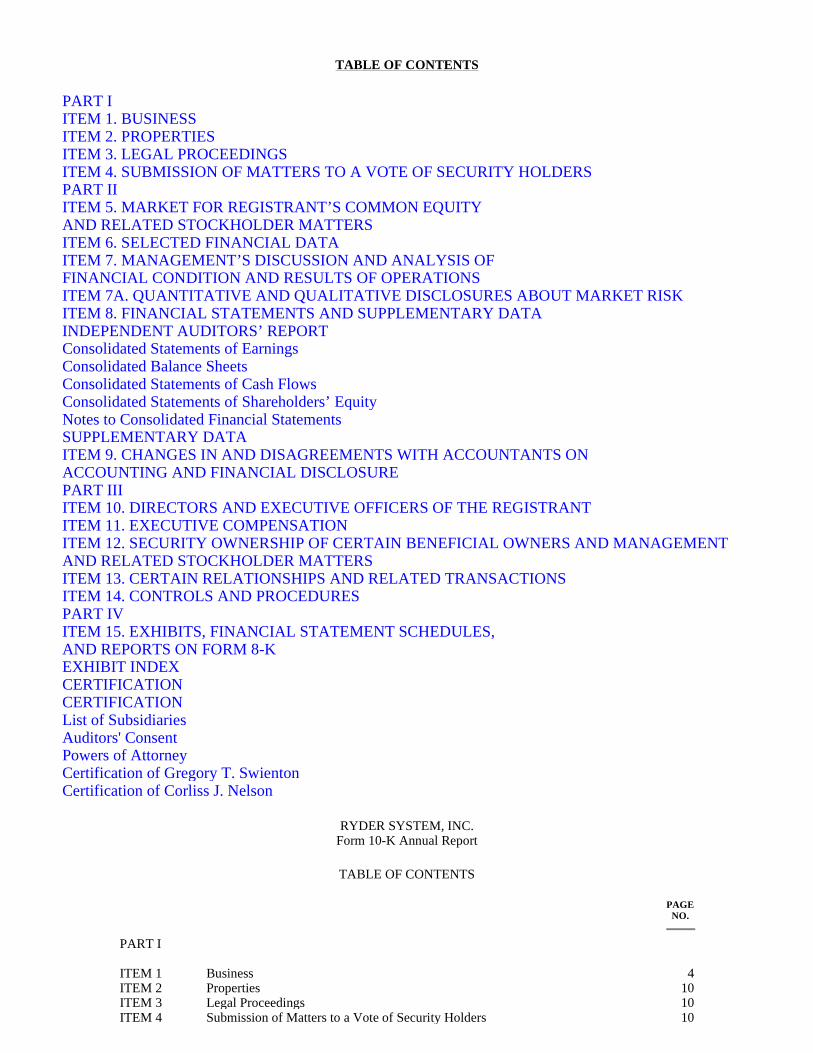
TABLE OF CONTENTS
RYDER SYSTEM, INC. Form 10-K Annual Report
TABLE OF CONTENTS
PART I ITEM 1. BUSINESS ITEM 2. PROPERTIES ITEM 3. LEGAL PROCEEDINGS ITEM 4. SUBMISSION OF MATTERS TO A VOTE OF SECURITY HOLDERS PART II ITEM 5. MARKET FOR REGISTRANT’S COMMON EQUITY AND RELATED STOCKHOLDER MATTERS ITEM 6. SELECTED FINANCIAL DATA ITEM 7. MANAGEMENT’S DISCUSSION AND ANALYSIS OF FINANCIAL CONDITION AND RESULTS OF OPERATIONS ITEM 7A. QUANTITATIVE AND QUALITATIVE DISCLOSURES ABOUT MARKET RISK ITEM 8. FINANCIAL STATEMENTS AND SUPPLEMENTARY DATA INDEPENDENT AUDITORS’ REPORT Consolidated Statements of Earnings Consolidated Balance Sheets Consolidated Statements of Cash Flows Consolidated Statements of Shareholders’ Equity Notes to Consolidated Financial Statements SUPPLEMENTARY DATA ITEM 9. CHANGES IN AND DISAGREEMENTS WITH ACCOUNTANTS ON ACCOUNTING AND FINANCIAL DISCLOSURE PART III ITEM 10. DIRECTORS AND EXECUTIVE OFFICERS OF THE REGISTRANT ITEM 11. EXECUTIVE COMPENSATION ITEM 12. SECURITY OWNERSHIP OF CERTAIN BENEFICIAL OWNERS AND MANAGEMENT AND RELATED STOCKHOLDER MATTERS ITEM 13. CERTAIN RELATIONSHIPS AND RELATED TRANSACTIONS ITEM 14. CONTROLS AND PROCEDURES PART IV ITEM 15. EXHIBITS, FINANCIAL STATEMENT SCHEDULES, AND REPORTS ON FORM 8-K EXHIBIT INDEX CERTIFICATION CERTIFICATION List of Subsidiaries Auditors' Consent Powers of Attorney Certification of Gregory T. Swienton Certification of Corliss J. Nelson
PAGE NO.
PART I ITEM 1 Business 4 ITEM 2 Properties 10 ITEM 3 Legal Proceedings 10 ITEM 4 Submission of Matters to a Vote of Security Holders 10
3
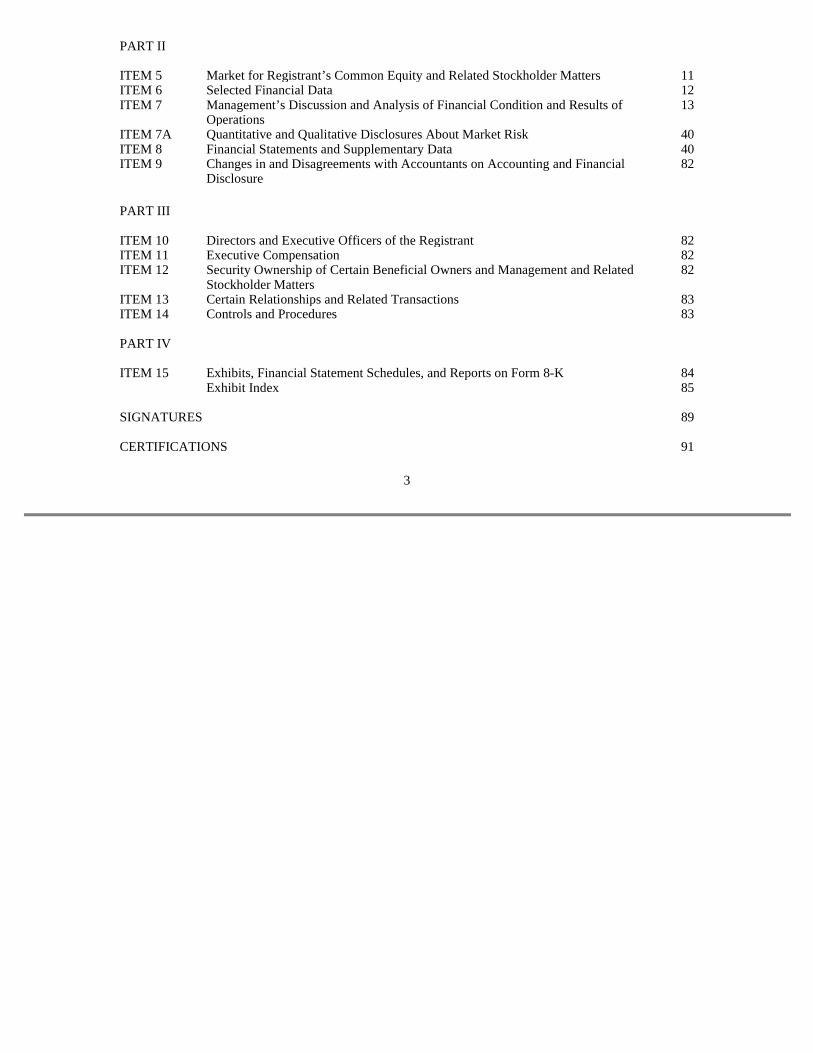
PART II ITEM 5 Market for Registrant’s Common Equity and Related Stockholder Matters 11 ITEM 6 Selected Financial Data 12 ITEM 7
Management’s Discussion and Analysis of Financial Condition and Results of Operations
13
ITEM 7A Quantitative and Qualitative Disclosures About Market Risk 40 ITEM 8 Financial Statements and Supplementary Data 40 ITEM 9
Changes in and Disagreements with Accountants on Accounting and Financial Disclosure
82
PART III ITEM 10 Directors and Executive Officers of the Registrant 82 ITEM 11 Executive Compensation 82 ITEM 12
Security Ownership of Certain Beneficial Owners and Management and Related Stockholder Matters
82
ITEM 13 Certain Relationships and Related Transactions 83 ITEM 14 Controls and Procedures 83 PART IV ITEM 15 Exhibits, Financial Statement Schedules, and Reports on Form 8-K 84 Exhibit Index 85 SIGNATURES 89 CERTIFICATIONS 91
PART I
ITEM 1. BUSINESS
GENERAL
Ryder System, Inc. (the “Company”) was incorporated in Florida in 1955. The Company operates in three reportable business segments: (1) Fleet Management Solutions (FMS), which provides full service leasing, commercial rental and programmed maintenance of trucks, tractors and trailers to customers, principally in the U.S., Canada and the U.K.; (2) Supply Chain Solutions (SCS), which provides comprehensive supply chain consulting and lead logistics management solutions that support customers’ entire supply chains, from inbound raw materials through distribution of finished goods throughout North America, in Latin America, Europe and Asia; and (3) Dedicated Contract Carriage (DCC), which provides vehicles and drivers as part of a dedicated transportation solution, principally in North America. As of December 31, 2002, the Company and its subsidiaries had a fleet of approximately 161,400 vehicles and 27,800 employees.
Financial information about business segments is included in Item 8 on pages 75 through 79 of this report.
FLEET MANAGEMENT SOLUTIONS
The FMS business segment provides full service truck leasing to over 13,300 customers principally in the U.S., Canada and the United Kingdom, ranging from large national enterprises to small companies, with a fleet of 120,900 vehicles. Under a full service lease, the Company provides customers with vehicles, maintenance, supplies and related equipment necessary for operation, while the customers furnish and supervise their own drivers, and dispatch and exercise control over the vehicles. Additionally, the Company provides contract maintenance to service customer vehicles under maintenance contracts and provides short-term truck rental, which tends to be seasonal, to commercial customers to supplement their fleets during peak business periods. The Company also provides additional services for customers, including fleet management, freight management and insurance programs. A fleet of 37,600 vehicles, ranging from heavy-duty tractors and trailers to light-duty trucks, is available for commercial short-term rental. In 2002, the FMS business segment continued its focus on increased pricing discipline on new business, which has resulted in fewer sales but improved margins on business sold. Also in 2002, the FMS business segment focused on executing cost management initiatives, improving commercial rental utilization, increasing used truck sales activity, re-deploying used equipment, and term-extending maturing lease contracts, which has contributed to the improved operating performance.
SUPPLY CHAIN SOLUTIONS
The SCS business segment provides global integrated logistics support of customers’ entire supply chains, from inbound raw materials supply through finished goods distribution, the management of carriers, inventory deployment, and overall supply chain design and management. Services include varying combinations of logistics system and information technology design, the provision of vehicles and equipment (including maintenance and drivers), warehouse management (including cross docking and flow-through distribution), transportation management, vehicle dispatch, and inbound and outbound just-in-time delivery. Supply chain solutions includes procurement and management of all modes of transportation, shuttles, interstate long-haul operations, just-in-time service to assembly plants and factory-to-warehouse-to-retail facility service. These services are used in major industry sectors including electronics, high-tech, telecommunications, automotive, industrial, aerospace, consumer goods, paper and paper products, chemical, office equipment, news, food and beverage, and general retail industries. Part of the Company’s strategy is to take advantage of, and build upon, the expertise, market knowledge and infrastructure of strategic alliance and joint venture partners to complement its own expertise in providing supply chain solutions to businesses involved in the over-the-road transportation of goods and to those who move goods around the world using any mode of transportation.
4
In 2002, SCS increased its emphasis on pricing discipline and operational performance while it implemented profit improvement initiatives. The SCS business segment continues to be focused on its global account management program and expanding its global presence in the logistics market.
DEDICATED CONTRACT CARRIAGE
The DCC business segment combines the equipment, maintenance and administrative services of a full service lease with additional services in order to provide a customer with a dedicated transportation solution. Such additional services include driver hiring and training, routing and scheduling, fleet sizing, safety, regulatory compliance, risk management, and other technical support. This business uses a consultative approach to examine and assess the optimal approach to moving the products within a customer’s business, from raw material procurement to finished goods distribution. Ryder has sought to expand its DCC operations through growth from existing customers.
DISPOSITION OF REVENUE EARNING EQUIPMENT
The Company’s FMS segment has historically disposed of used revenue earning equipment at prices in excess of book value. During 2000, an industry-wide downturn in the market for new and used tractors and trucks, particularly “Class 8” vehicles (the largest heavy-duty tractors), combined with higher average book values per unit, led to reduced gains on the sale of revenue earning equipment. During 2001 and 2002, demand for new and used tractors and trucks, particularly Class 8 vehicles, continued to be depressed. The Company has reduced the residual values of certain vehicles and increased depreciation expense to account for the reduction in anticipated sales proceeds on certain used vehicles.
Gains on the sale of revenue earning equipment were approximately 5 percent, 5 percent and 6 percent of earnings from operations before interest, taxes, restructuring and other charges and cumulative effect of change in accounting principle in 2002, 2001 and 2000, respectively. The extent to which gains will be realized on future disposal of revenue earning equipment is dependent upon various factors including the general state of the used vehicle market, the age and condition of vehicles at the time of their disposal and depreciation methods with respect to vehicles.
COMPETITION
As an alternative to using the Company’s services, customers may choose to provide these services for themselves, or may choose to obtain similar or alternative services from other third-party vendors.
The FMS and DCC business segments compete with companies providing similar services on a national, regional and local level. Regional and local competitors may sometimes provide services on a national level through their participation in various cooperative programs. Competitive factors include price, equipment, maintenance, service and geographical coverage and, with respect to DCC, driver and operations expertise. Ryder competes with other finance lessors and also to an extent, particularly in the U.K., with a number of truck and trailer manufacturers who provide truck and trailer leasing, extended warranty maintenance, rental and other transportation services. Value-added differentiation of the full service truck leasing, truck rental, contract and non-contract truck maintenance service and DCC offerings has been, and will continue to be, Ryder’s emphasis.
In the SCS business segment, Ryder competes with companies providing similar services on an international, national, regional and local level. Additionally, this business is subject to potential competition in most of the regions it serves from air cargo, shipping, railroads, motor carriers and other companies that are expanding logistics services such as freight forwarders, contract manufacturers and integrators. Competitive factors include price, service, equipment, maintenance, geographical coverage, market knowledge, expertise in logistics-related technology, and overall performance (e.g., timeliness, accuracy and flexibility). Value-added differentiation of these service offerings across the full global supply chain will continue to be Ryder’s overriding strategy.
EMPLOYEES
As of December 31, 2002, the Company had approximately 27,800 full-time employees worldwide, of which 22,400 were employed in North America, 1,800 in South America and Mexico, 3,200 in Europe and 400 in Asia. The Company has approximately 17,200 hourly employees in the United States, approximately 3,600 of which are organized by labor unions. These employees are principally represented by the International Brotherhood of Teamsters, the International Association of Machinists and Aerospace Workers and the United Auto Workers,
5
and their wages and benefits are governed by approximately 100 labor agreements that are renegotiated periodically. None of the businesses in which the Company currently engages have experienced a material work stoppage, slowdown or strike and the Company considers its relationship with its employees to be good.
EXECUTIVE OFFICERS OF THE REGISTRANT
All of the executive officers of the Company were elected or re-elected to their present offices either at or subsequent to the meeting of the Board of Directors held on May 3, 2002 in conjunction with the Company’s 2002 Annual Meetings. They all hold such offices, at the discretion of the Board of Directors, until their removal, replacement or retirement.
Gregory T. Swienton has been Chairman since May 2002, President since June 1999 and Chief Executive Officer since November 2000. Before joining Ryder, Mr. Swienton was Senior Vice President of Growth Initiatives of Burlington Northern Santa Fe Corporation (BNSF) and before that Mr. Swienton was BNSF’s Senior Vice President, Coal and Agricultural Commodities Business Unit.
Corliss J. Nelson has been Senior Executive Vice President and Chief Financial Officer since April 1999. Previously, Mr. Nelson was President of Koch Capital Services and was a Vice President of Koch Industries, Inc., a diversified energy company engaged in a broad range of business activities.
Bobby J. Griffin has been Executive Vice President, International Supply Chain Solutions since January 2003. Previously, Mr. Griffin served as Executive Vice President, Global Supply Chain Operations since March 2001. Prior to this appointment, Mr. Griffin was Senior Vice President, Field Management West from January 2000 to March 2001. Mr. Griffin was Vice President, Operations of Ryder Transportation Services from 1997 to December 1999. Mr. Griffin also served Ryder as Vice President and General Manager of ATE Management and Service Company, Inc. and of Managed Logistics Systems, Inc. operating units of the former Ryder Public Transportation Services, positions he held from 1993 to 1997. Mr. Griffin was Executive Vice President, Western Operations of Ryder/ATE from 1987 to 1993. He joined Ryder as Executive Vice President, Consulting of ATE in 1986 after Ryder acquired ATE Management and Service Company.
Tracy A. Leinbach has been Executive Vice President, Fleet Management Solutions since March 2001. Ms. Leinbach served as Senior Vice President, Sales and Marketing from September 2000 to March 2001, and she was Senior Vice President Field Management from July 2000 to September 2000. Ms. Leinbach also served as Managing Director-Europe of Ryder Transportation Services from January 1999 to July 2000 and previously she had served
6
NAME AGE POSITION
Gregory T. Swienton 53 Chairman, President and Chief Executive Officer Corliss J. Nelson 58 Senior Executive Vice President and Chief Financial Officer Bobby J. Griffin 54 Executive Vice President, International Supply Chain Solutions Tracy A. Leinbach 43 Executive Vice President, Fleet Management Solutions Challis M. Lowe
57
Executive Vice President, Human Resources, Public Affairs and Corporate Communications
Vicki A. O’Meara 45 Executive Vice President, General Counsel and Secretary Anthony G. Tegnelia 57 Executive Vice President, U.S. Supply Chain Solutions Kathleen S. Partridge 48 Senior Vice President, Business and Accounting Services Robert E. Sanchez 37 Senior Vice President and Chief Information Officer Art A. Garcia 41 Vice President and Controller
Ryder Transportation Services as Senior Vice President and Chief Financial Officer from 1998 to January 1999, Senior Vice President, Business Services from 1997 to 1998, and Senior Vice President, Purchasing and Asset Management for six months during 1996. From 1985 to 1996, Ms. Leinbach held various financial positions in Ryder subsidiaries.
Challis M. Lowe has served as Executive Vice President, Human Resources, Public Affairs and Corporate Communications since November 2000. Ms. Lowe joined the Company as EVP of Human Resources in May of 2000. Before joining Ryder, Ms. Lowe was a consultant to the merger of Beneficial Management Corp. with Household Finance from 1998 to 1999. From 1997 to 1998 Ms. Lowe was Executive Vice President, Human Resources and Administrative Services at Beneficial Management Corp., a financial services company. Previously, she was Executive Vice President at Heller International, a financial services company, from 1993 to 1997 where she was responsible for Human Resources and Communications.
Vicki A. O’Meara has been Executive Vice President and General Counsel since June 1997 and Secretary since February 1998. Prior to joining Ryder, Ms. O’Meara was a partner with the Chicago office of the law firm Jones Day. Previously, she held a variety of positions with the federal government including service as Assistant Attorney General for the Environmental and Natural Resources Division of the Department of Justice, Deputy General Counsel of the Environmental Protection Agency and in the Office of White House Counsel.
Anthony G. Tegnelia has served as Executive Vice President, U.S. Supply Chain Solutions since December 2002. Previously, he was Senior Vice President, Global Business Value Management. Mr. Tegnelia joined Ryder in 1977 and has held a variety of other positions with the Company including Senior Vice President and Chief Financial Officer of the Company’s integrated logistics business segment and Senior Vice President, Field Finance.
Kathleen S. Partridge has been Senior Vice President, Business and Accounting Services since February 2002. Previously, Ms. Partridge served as Senior Vice President and Controller from April 2001 until February 2002. Ms. Partridge was Vice President, Shared Services Center, from August 1997 to April 2001. In 1994, Ms. Partridge became District Manager in Bloomington, Ill., and held that position until she moved to the Ryder Shared Services Center in 1997. In 1989, she moved to Pittsburgh, Pa., where she was a field controller. Ms. Partridge joined Ryder in 1982 as a corporate auditor and held positions of increasing responsibility in the finance and accounting group.
Robert E. Sanchez has served as Senior Vice President and Chief Information Officer since January 2003. He previously served as Senior Vice President of Global Transportation Management from March 2002 to January 2003. Previously, he also served as Chief Information Officer from June 2001 to March 2002. Mr. Sanchez joined Ryder in 1993 as a Senior Business System Designer.
Art A. Garcia has been Vice President and Controller since February 2002. Previously, Mr. Garcia served as Group Director — Accounting Services from September 2000 to February 2002 and from April 2000 to June 2000. Mr. Garcia was Chief Financial Officer of Blue Dot Services, Inc., a national provider of heating and air conditioning services, from June 2000 to September 2000. Mr. Garcia served as Director — Corporate Accounting for Ryder from April 1998 to April 2000. Mr. Garcia joined Ryder in December 1997 as Senior Manager — Corporate Accounting. Prior to joining Ryder, Mr. Garcia held various positions in the audit services practice of Coopers and Lybrand LLP from 1984 to December 1997.
CERTAIN FACTORS THAT MAY AFFECT THE COMPANY’S BUSINESS
The Company’s business is subject to a number of general economic factors in the United States and worldwide that may have a materially adverse effect on its results of operations, many of which are largely out of the Company’s control. These include recessionary economic cycles and downturns in customers’ business cycles, particularly in market segments and industries where we have a concentration of customers, interest rate fluctuations, increases in fuel prices or fuel shortages and the effects of future or threatened terrorism. Slow economic conditions in the United States and other countries where the Company operates, principally Brazil and Argentina, contributed to its decline in revenue for the year ended December 31, 2002 compared with 2001.
Numerous competitive factors could impair the ability of the Company to maintain its current profitability. These factors include the following:
7
• the Company competes with many other leasing and transportation service providers, some of which have greater capital resources or lower capital costs;
The Company has implemented and continues to implement a variety of strategic initiatives to reduce costs and improve productivity. These initiatives include improving purchasing programs, improving the efficiency of maintenance operations, increasing the efficiency of rental and trailer fleet utilization, extending the duration of expiring leases and generating revenue from increased utilization of idle equipment. The continued successful implementation of these initiatives on a timely basis in the future is one of the keys to the Company’s future competitiveness and profitability.
The Company’s business has been negatively impacted by an industry-wide downturn in the market for used tractors and trucks, particularly Class 8 vehicles, which are the largest class of heavy-duty tractors. This overall trend has caused the actual proceeds realized upon the sale of used revenue earning equipment to be lower than what was realized historically. The continuation or worsening of this trend may cause further unfavorable differences between residual values realized and current expectations, thus negatively affecting the profitability and financial condition of the Company.
The Company’s business is subject to regulation by various federal, state and foreign governmental entities. Changes in applicable laws and regulations, or costs of complying with current or future laws and regulations, could have a material adverse effect on the Company’s operations and profitability. The U.S. Department of Transportation and various state agencies exercise broad powers over certain aspects of the Company’s business, generally governing such activities as authorization to engage in motor carrier operations, safety and financial reporting. The Company may also become subject to new or more restrictive regulations imposed by the Environmental Protection Agency, the Department of Transportation, the Occupational Safety and Health Administration or other authorities relating to engine exhaust emissions, drivers’ hours in service, security and ergonomics, compliance which could increase operating costs.
The Environmental Protection Agency has issued regulations that require progressive reductions in exhaust emissions from diesel engines through 2007. Beginning in October 2002, new diesel engines were required to meet new emissions limits. Some of these regulations require subsequent reductions in the sulfur content of diesel fuel beginning in June 2006 and the introduction of emissions after-treatment devices on newly manufactured engines and vehicles beginning with the model year 2007. These regulations have resulted in higher prices for tractors and diesel engines and are likely to decrease demand for new tractors in the short-term and increase fuel and maintenance costs. These adverse effects combined with uncertainty as to the reliability of the vehicles equipped with the newly designed diesel engines and the residual values that will be realized from the disposition of these vehicles could reduce the Company’s revenues from truck leasing, increase costs, make it more difficult to realize expected residual values for used vehicles equipped with the newly designed diesel engines or otherwise adversely affect business.
Many federal, state and local laws designed to protect the environment, and similar laws in some foreign jurisdictions, have varying degrees of impact on the way the Company and its subsidiaries conduct their business operations, primarily with regard to their use, storage and disposal of petroleum products and various wastes associated with vehicle maintenance and operating activities. Based on information presently available, management believes that the ultimate disposition of such matters, although potentially material to the Company’s results of operations in any one year, will not have a material adverse affect on the Company’s financial condition or liquidity.
Certain aspects of the Company’s business are very capital intensive and the Company requires large amounts of capital to finance additions to its fleet. In 2002, the Company had capital expenditures of approximately $600 million. These capital needs are funded through borrowings, sale-leaseback transactions, vehicle securitizations, the sale of trade receivables and cash generated from operations. If the Company should lose access to its current sources of capital or is unable to generate sufficient cash from operations, it may have to limit its growth, find alternative sources of external capital or operate revenue earning equipment for longer periods. A downgrade of the Company’s debt below investment grade level would both limit its ability to issue commercial paper and render it unable to sell trade receivables under its existing facility.
8
• some of the Company’s competitors periodically reduce their prices to gain business which may limit the ability of the Company to maintain or increase prices;
• the trend towards consolidation in the transportation industry may create large competitors with greater financial resources and other
competitive advantages relating to their size; • advances in technology require increased investments to remain competitive, and the Company’s customers may not be willing to
accept higher prices to cover the cost of these investments; and • competition from logistics and freight management companies that do not operate trucking fleets may adversely affect customer
relationships and prices.
In the aftermath of terrorist attacks on the United States, federal, state and municipal authorities have implemented and are implementing various security measures, including checkpoints and travel restrictions on large trucks. Although many companies will be adversely affected by any slowdown in the availability of transportation services, the negative impact could disproportionately affect the Company’s business. New security measures could disrupt or impede the Company’s ability to meet the needs of its customers, particularly those related to the timeliness of deliveries. No assurance can be given that these measures will not have a material adverse effect on operating results.
FURTHER INFORMATION
For further discussion concerning the business of the Company and its subsidiaries, see the information included in Items 7 and 8 of this report.
The Company makes available free of charge through its website at http://www.ryder.com its annual report on Form 10-K, quarterly reports on Form 10-Q, current reports on Form 8-K and all amendments to those reports as soon as reasonably practicable after such material is electronically filed with or furnished to the Securities and Exchange Commission.
9

ITEM 2. PROPERTIES
The Company’s property consists primarily of vehicle maintenance and repair facilities, warehouses and other real estate and improvements.
The Company has approximately 170 locations in the United States and Canada in connection with its domestic SCS and DCC businesses. Almost all of these facilities are leased and generally include a warehouse and administrative offices.
The Company also has approximately 800 FMS locations in the United States, Puerto Rico and Canada; approximately 390 of these facilities are owned and the remainder are leased. These locations generally include a repair shop and administrative offices.
The Company’s international operations (locations outside of the United States and Canada) have over 70 locations. These locations are in the U.K., Ireland, Germany, Poland, Mexico, Argentina, Brazil, Australia, China, Taiwan, Malaysia and Singapore. The majority of these facilities are leased. These locations generally include a repair shop, warehouse and administrative offices.
The Company’s headquarters facility is a 400,000 square foot building located on approximately 40 acres of land in Miami, Florida that the Company has owned since 1973. Due to the age of the headquarters building and the headcount reductions experienced over recent years, the Company explored various strategic alternatives for the relocation of its headquarters. As a result, in December 2002, the Company announced that it reached an agreement with a real estate developer to build a new headquarters facility in Miami, Florida. The new building will be approximately 230,000 square feet and will be leased by the Company. The Company expects the new headquarters to be completed within two years and has started marketing its current facility and land for sale.
ITEM 3. LEGAL PROCEEDINGS
The Company and its subsidiaries are involved in various claims, lawsuits, and administrative actions arising in the course of their businesses. Some involve claims for substantial amounts of money and/or claims for punitive damages. While any proceeding or litigation has an element of uncertainty, management believes that the disposition of such matters, in the aggregate, will not have a material impact on the consolidated financial condition, results of operations or liquidity of the Company and its subsidiaries.
ITEM 4. SUBMISSION OF MATTERS TO A VOTE OF SECURITY HOLDERS
There were no matters submitted to a vote of security holders during the quarter ended December 31, 2002.
10
PART II
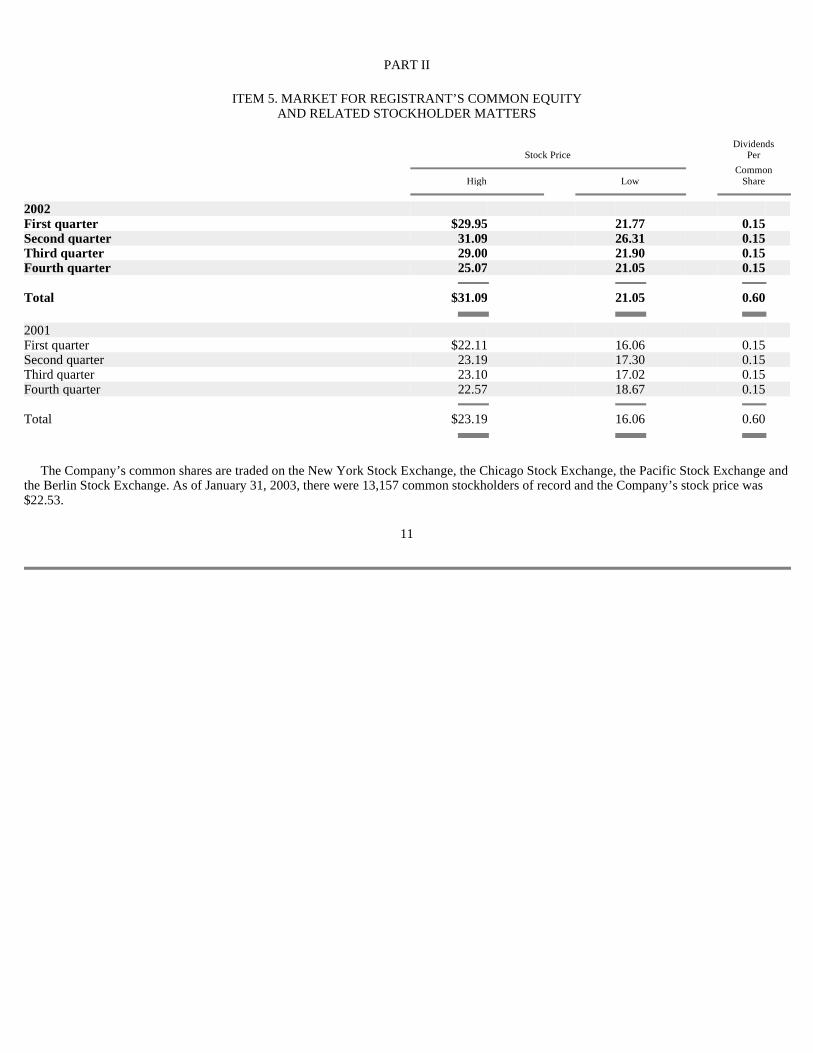
ITEM 5. MARKET FOR REGISTRANT’S COMMON EQUITY AND RELATED STOCKHOLDER MATTERS
The Company’s common shares are traded on the New York Stock Exchange, the Chicago Stock Exchange, the Pacific Stock Exchange and the Berlin Stock Exchange. As of January 31, 2003, there were 13,157 common stockholders of record and the Company’s stock price was $22.53.
11
Dividends Stock Price Per
Common High Low Share
2002 First quarter $ 29.95 21.77 0.15 Second quarter 31.09 26.31 0.15 Third quarter 29.00 21.90 0.15 Fourth quarter 25.07 21.05 0.15 Total $ 31.09 21.05 0.60 2001 First quarter $ 22.11 16.06 0.15 Second quarter 23.19 17.30 0.15 Third quarter 23.10 17.02 0.15 Fourth quarter 22.57 18.67 0.15 Total $ 23.19 16.06 0.60
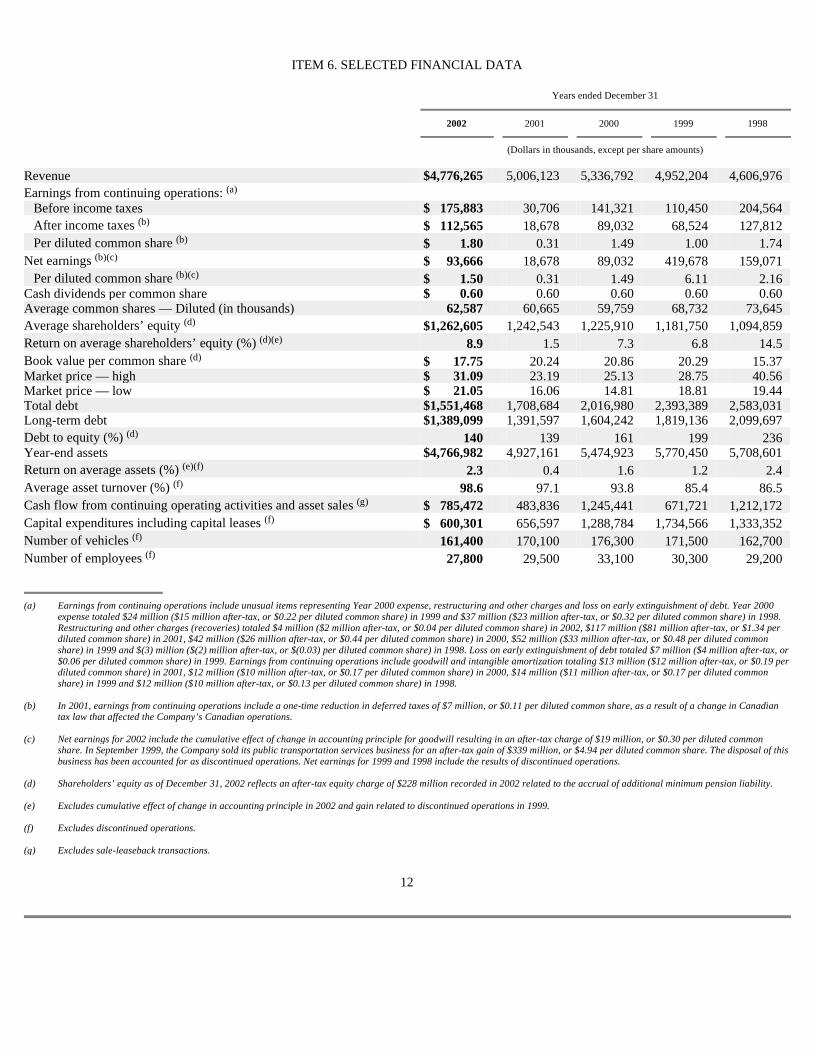
ITEM 6. SELECTED FINANCIAL DATA
12
Years ended December 31
2002 2001 2000 1999 1998
(Dollars in thousands, except per share amounts)
Revenue $ 4,776,265 5,006,123 5,336,792 4,952,204 4,606,976 Earnings from continuing operations: (a) Before income taxes $ 175,883 30,706 141,321 110,450 204,564 After income taxes (b) $ 112,565 18,678 89,032 68,524 127,812 Per diluted common share (b) $ 1.80 0.31 1.49 1.00 1.74 Net earnings (b)(c) $ 93,666 18,678 89,032 419,678 159,071 Per diluted common share (b)(c) $ 1.50 0.31 1.49 6.11 2.16 Cash dividends per common share $ 0.60 0.60 0.60 0.60 0.60 Average common shares — Diluted (in thousands) 62,587 60,665 59,759 68,732 73,645 Average shareholders’ equity (d) $ 1,262,605 1,242,543 1,225,910 1,181,750 1,094,859 Return on average shareholders’ equity (%) (d)(e) 8.9 1.5 7.3 6.8 14.5 Book value per common share (d) $ 17.75 20.24 20.86 20.29 15.37 Market price — high $ 31.09 23.19 25.13 28.75 40.56 Market price — low $ 21.05 16.06 14.81 18.81 19.44 Total debt $ 1,551,468 1,708,684 2,016,980 2,393,389 2,583,031 Long-term debt $ 1,389,099 1,391,597 1,604,242 1,819,136 2,099,697 Debt to equity (%) (d) 140 139 161 199 236 Year-end assets $ 4,766,982 4,927,161 5,474,923 5,770,450 5,708,601 Return on average assets (%) (e)(f) 2.3 0.4 1.6 1.2 2.4 Average asset turnover (%) (f) 98.6 97.1 93.8 85.4 86.5 Cash flow from continuing operating activities and asset sales (g) $ 785,472 483,836 1,245,441 671,721 1,212,172 Capital expenditures including capital leases (f) $ 600,301 656,597 1,288,784 1,734,566 1,333,352 Number of vehicles (f) 161,400 170,100 176,300 171,500 162,700 Number of employees (f) 27,800 29,500 33,100 30,300 29,200
(a) Earnings from continuing operations include unusual items representing Year 2000 expense, restructuring and other charges and loss on early extinguishment of debt. Year 2000 expense totaled $24 million ($15 million after-tax, or $0.22 per diluted common share) in 1999 and $37 million ($23 million after-tax, or $0.32 per diluted common share) in 1998. Restructuring and other charges (recoveries) totaled $4 million ($2 million after-tax, or $0.04 per diluted common share) in 2002, $117 million ($81 million after-tax, or $1.34 per diluted common share) in 2001, $42 million ($26 million after-tax, or $0.44 per diluted common share) in 2000, $52 million ($33 million after-tax, or $0.48 per diluted common share) in 1999 and $(3) million ($(2) million after-tax, or $(0.03) per diluted common share) in 1998. Loss on early extinguishment of debt totaled $7 million ($4 million after-tax, or $0.06 per diluted common share) in 1999. Earnings from continuing operations include goodwill and intangible amortization totaling $13 million ($12 million after-tax, or $0.19 per diluted common share) in 2001, $12 million ($10 million after-tax, or $0.17 per diluted common share) in 2000, $14 million ($11 million after-tax, or $0.17 per diluted common share) in 1999 and $12 million ($10 million after-tax, or $0.13 per diluted common share) in 1998.
(b) In 2001, earnings from continuing operations include a one-time reduction in deferred taxes of $7 million, or $0.11 per diluted common share, as a result of a change in Canadian
tax law that affected the Company’s Canadian operations. (c) Net earnings for 2002 include the cumulative effect of change in accounting principle for goodwill resulting in an after-tax charge of $19 million, or $0.30 per diluted common
share. In September 1999, the Company sold its public transportation services business for an after-tax gain of $339 million, or $4.94 per diluted common share. The disposal of this business has been accounted for as discontinued operations. Net earnings for 1999 and 1998 include the results of discontinued operations.
(d) Shareholders’ equity as of December 31, 2002 reflects an after-tax equity charge of $228 million recorded in 2002 related to the accrual of additional minimum pension liability. (e) Excludes cumulative effect of change in accounting principle in 2002 and gain related to discontinued operations in 1999. (f) Excludes discontinued operations. (g) Excludes sale-leaseback transactions.
ITEM 7. MANAGEMENT’S DISCUSSION AND ANALYSIS OF FINANCIAL CONDITION AND RESULTS OF OPERATIONS
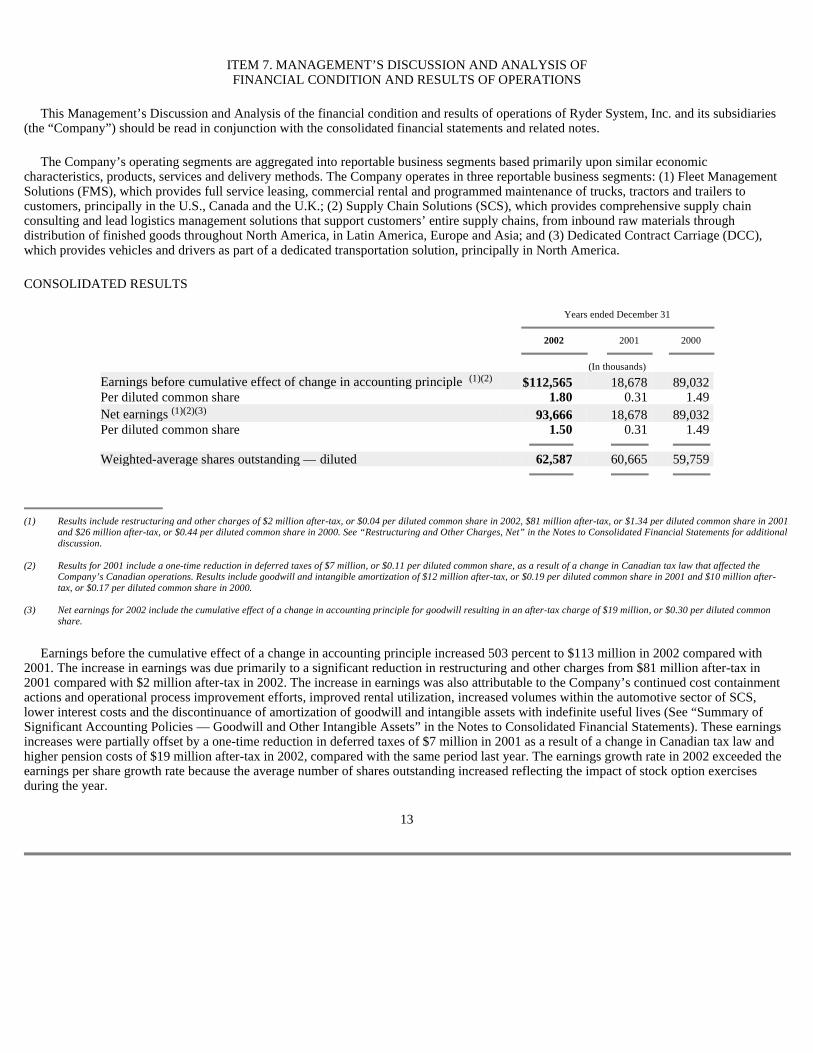
This Management’s Discussion and Analysis of the financial condition and results of operations of Ryder System, Inc. and its subsidiaries (the “Company”) should be read in conjunction with the consolidated financial statements and related notes.
The Company’s operating segments are aggregated into reportable business segments based primarily upon similar economic characteristics, products, services and delivery methods. The Company operates in three reportable business segments: (1) Fleet Management Solutions (FMS), which provides full service leasing, commercial rental and programmed maintenance of trucks, tractors and trailers to customers, principally in the U.S., Canada and the U.K.; (2) Supply Chain Solutions (SCS), which provides comprehensive supply chain consulting and lead logistics management solutions that support customers’ entire supply chains, from inbound raw materials through distribution of finished goods throughout North America, in Latin America, Europe and Asia; and (3) Dedicated Contract Carriage (DCC), which provides vehicles and drivers as part of a dedicated transportation solution, principally in North America.
CONSOLIDATED RESULTS
Earnings before the cumulative effect of a change in accounting principle increased 503 percent to $113 million in 2002 compared with 2001. The increase in earnings was due primarily to a significant reduction in restructuring and other charges from $81 million after-tax in 2001 compared with $2 million after-tax in 2002. The increase in earnings was also attributable to the Company’s continued cost containment actions and operational process improvement efforts, improved rental utilization, increased volumes within the automotive sector of SCS, lower interest costs and the discontinuance of amortization of goodwill and intangible assets with indefinite useful lives (See “Summary of Significant Accounting Policies — Goodwill and Other Intangible Assets” in the Notes to Consolidated Financial Statements). These earnings increases were partially offset by a one-time reduction in deferred taxes of $7 million in 2001 as a result of a change in Canadian tax law and higher pension costs of $19 million after-tax in 2002, compared with the same period last year. The earnings growth rate in 2002 exceeded the earnings per share growth rate because the average number of shares outstanding increased reflecting the impact of stock option exercises during the year.
13
Years ended December 31
2002 2001 2000
(In thousands)
Earnings before cumulative effect of change in accounting principle (1)(2) $ 112,565 18,678 89,032 Per diluted common share 1.80 0.31 1.49 Net earnings (1)(2)(3) 93,666 18,678 89,032 Per diluted common share 1.50 0.31 1.49 Weighted-average shares outstanding — diluted 62,587 60,665 59,759
(1) Results include restructuring and other charges of $2 million after-tax, or $0.04 per diluted common share in 2002, $81 million after-tax, or $1.34 per diluted common share in 2001 and $26 million after-tax, or $0.44 per diluted common share in 2000. See “Restructuring and Other Charges, Net” in the Notes to Consolidated Financial Statements for additional discussion.
(2) Results for 2001 include a one-time reduction in deferred taxes of $7 million, or $0.11 per diluted common share, as a result of a change in Canadian tax law that affected the
Company’s Canadian operations. Results include goodwill and intangible amortization of $12 million after-tax, or $0.19 per diluted common share in 2001 and $10 million after-tax, or $0.17 per diluted common share in 2000.
(3) Net earnings for 2002 include the cumulative effect of a change in accounting principle for goodwill resulting in an after-tax charge of $19 million, or $0.30 per diluted common
share.
Earnings decreased 79 percent to $19 million in 2001 compared with 2000. The decrease in earnings in 2001 was due primarily to increased restructuring and other charges as part of the Company’s implementation of strategic initiatives during 2001 to reduce Company expenses and improve profitability. See “Restructuring and Other Charges, Net” for a further discussion of such initiatives. The 2001 decrease also resulted from a 6 percent decrease in revenue as discussed below. See “Operating Results by Business Segment” for a further discussion of operating results in the past three years.
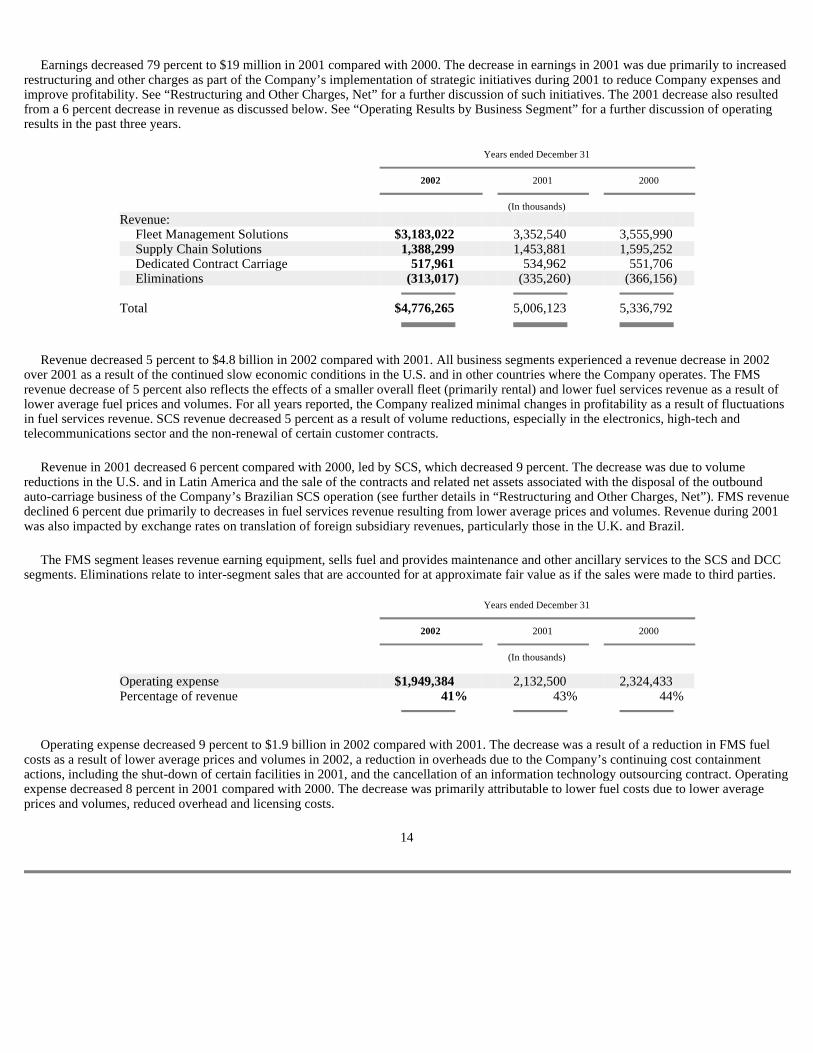
Revenue decreased 5 percent to $4.8 billion in 2002 compared with 2001. All business segments experienced a revenue decrease in 2002 over 2001 as a result of the continued slow economic conditions in the U.S. and in other countries where the Company operates. The FMS revenue decrease of 5 percent also reflects the effects of a smaller overall fleet (primarily rental) and lower fuel services revenue as a result of lower average fuel prices and volumes. For all years reported, the Company realized minimal changes in profitability as a result of fluctuations in fuel services revenue. SCS revenue decreased 5 percent as a result of volume reductions, especially in the electronics, high-tech and telecommunications sector and the non-renewal of certain customer contracts.
Revenue in 2001 decreased 6 percent compared with 2000, led by SCS, which decreased 9 percent. The decrease was due to volume reductions in the U.S. and in Latin America and the sale of the contracts and related net assets associated with the disposal of the outbound auto-carriage business of the Company’s Brazilian SCS operation (see further details in “Restructuring and Other Charges, Net”). FMS revenue declined 6 percent due primarily to decreases in fuel services revenue resulting from lower average prices and volumes. Revenue during 2001 was also impacted by exchange rates on translation of foreign subsidiary revenues, particularly those in the U.K. and Brazil.
The FMS segment leases revenue earning equipment, sells fuel and provides maintenance and other ancillary services to the SCS and DCC segments. Eliminations relate to inter-segment sales that are accounted for at approximate fair value as if the sales were made to third parties.
Operating expense decreased 9 percent to $1.9 billion in 2002 compared with 2001. The decrease was a result of a reduction in FMS fuel costs as a result of lower average prices and volumes in 2002, a reduction in overheads due to the Company’s continuing cost containment actions, including the shut-down of certain facilities in 2001, and the cancellation of an information technology outsourcing contract. Operating expense decreased 8 percent in 2001 compared with 2000. The decrease was primarily attributable to lower fuel costs due to lower average prices and volumes, reduced overhead and licensing costs.
14
Years ended December 31
2002 2001 2000
(In thousands)
Revenue: Fleet Management Solutions $ 3,183,022 3,352,540 3,555,990 Supply Chain Solutions 1,388,299 1,453,881 1,595,252 Dedicated Contract Carriage 517,961 534,962 551,706 Eliminations (313,017 ) (335,260 ) (366,156 ) Total $ 4,776,265 5,006,123 5,336,792
Years ended December 31
2002 2001 2000
(In thousands)
Operating expense $ 1,949,384 2,132,500 2,324,433 Percentage of revenue 41 % 43 % 44 %
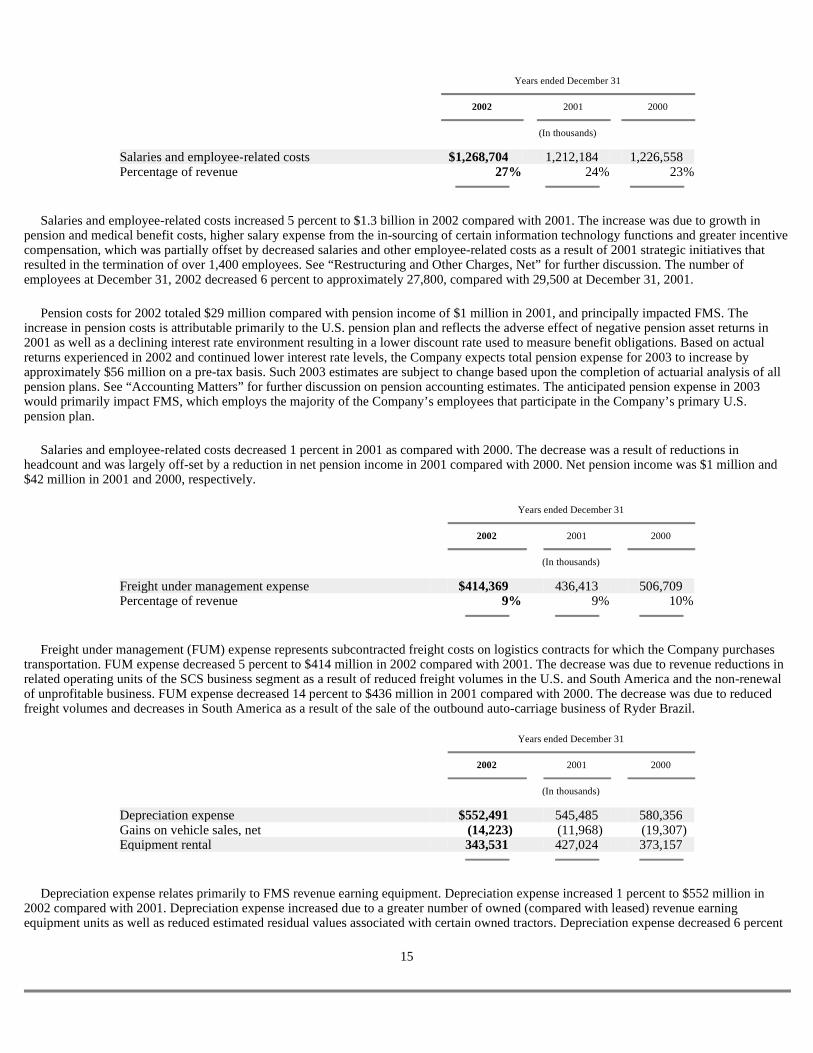
Salaries and employee-related costs increased 5 percent to $1.3 billion in 2002 compared with 2001. The increase was due to growth in pension and medical benefit costs, higher salary expense from the in-sourcing of certain information technology functions and greater incentive compensation, which was partially offset by decreased salaries and other employee-related costs as a result of 2001 strategic initiatives that resulted in the termination of over 1,400 employees. See “Restructuring and Other Charges, Net” for further discussion. The number of employees at December 31, 2002 decreased 6 percent to approximately 27,800, compared with 29,500 at December 31, 2001.
Pension costs for 2002 totaled $29 million compared with pension income of $1 million in 2001, and principally impacted FMS. The increase in pension costs is attributable primarily to the U.S. pension plan and reflects the adverse effect of negative pension asset returns in 2001 as well as a declining interest rate environment resulting in a lower discount rate used to measure benefit obligations. Based on actual returns experienced in 2002 and continued lower interest rate levels, the Company expects total pension expense for 2003 to increase by approximately $56 million on a pre-tax basis. Such 2003 estimates are subject to change based upon the completion of actuarial analysis of all pension plans. See “Accounting Matters” for further discussion on pension accounting estimates. The anticipated pension expense in 2003 would primarily impact FMS, which employs the majority of the Company’s employees that participate in the Company’s primary U.S. pension plan.
Salaries and employee-related costs decreased 1 percent in 2001 as compared with 2000. The decrease was a result of reductions in headcount and was largely off-set by a reduction in net pension income in 2001 compared with 2000. Net pension income was $1 million and $42 million in 2001 and 2000, respectively.
Freight under management (FUM) expense represents subcontracted freight costs on logistics contracts for which the Company purchases transportation. FUM expense decreased 5 percent to $414 million in 2002 compared with 2001. The decrease was due to revenue reductions in related operating units of the SCS business segment as a result of reduced freight volumes in the U.S. and South America and the non-renewal of unprofitable business. FUM expense decreased 14 percent to $436 million in 2001 compared with 2000. The decrease was due to reduced freight volumes and decreases in South America as a result of the sale of the outbound auto-carriage business of Ryder Brazil.
Depreciation expense relates primarily to FMS revenue earning equipment. Depreciation expense increased 1 percent to $552 million in 2002 compared with 2001. Depreciation expense increased due to a greater number of owned (compared with leased) revenue earning equipment units as well as reduced estimated residual values associated with certain owned tractors. Depreciation expense decreased 6 percent
15
Years ended December 31
2002 2001 2000
(In thousands)
Salaries and employee-related costs $ 1,268,704 1,212,184 1,226,558 Percentage of revenue 27 % 24 % 23 %
Years ended December 31
2002 2001 2000
(In thousands)
Freight under management expense $ 414,369 436,413 506,709 Percentage of revenue 9 % 9 % 10 %
Years ended December 31
2002 2001 2000
(In thousands)
Depreciation expense $ 552,491 545,485 580,356 Gains on vehicle sales, net (14,223 ) (11,968 ) (19,307 ) Equipment rental 343,531 427,024 373,157
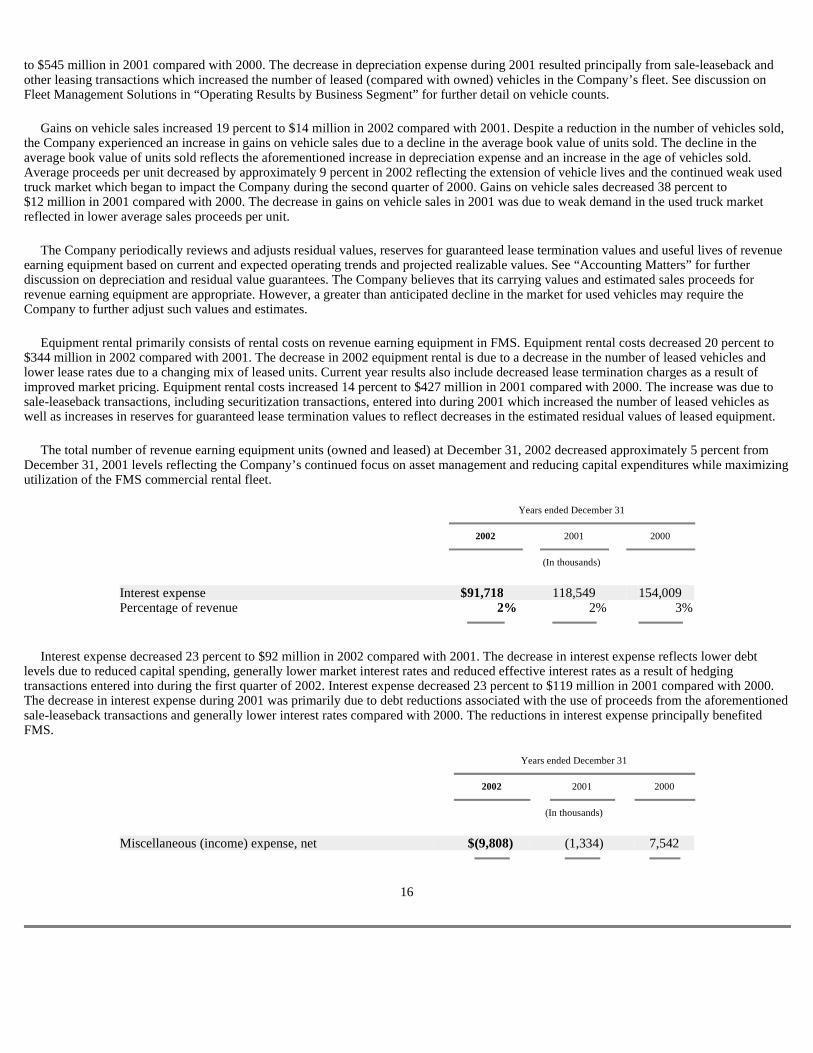
to $545 million in 2001 compared with 2000. The decrease in depreciation expense during 2001 resulted principally from sale-leaseback and other leasing transactions which increased the number of leased (compared with owned) vehicles in the Company’s fleet. See discussion on Fleet Management Solutions in “Operating Results by Business Segment” for further detail on vehicle counts.
Gains on vehicle sales increased 19 percent to $14 million in 2002 compared with 2001. Despite a reduction in the number of vehicles sold, the Company experienced an increase in gains on vehicle sales due to a decline in the average book value of units sold. The decline in the average book value of units sold reflects the aforementioned increase in depreciation expense and an increase in the age of vehicles sold. Average proceeds per unit decreased by approximately 9 percent in 2002 reflecting the extension of vehicle lives and the continued weak used truck market which began to impact the Company during the second quarter of 2000. Gains on vehicle sales decreased 38 percent to $12 million in 2001 compared with 2000. The decrease in gains on vehicle sales in 2001 was due to weak demand in the used truck market reflected in lower average sales proceeds per unit.
The Company periodically reviews and adjusts residual values, reserves for guaranteed lease termination values and useful lives of revenue earning equipment based on current and expected operating trends and projected realizable values. See “Accounting Matters” for further discussion on depreciation and residual value guarantees. The Company believes that its carrying values and estimated sales proceeds for revenue earning equipment are appropriate. However, a greater than anticipated decline in the market for used vehicles may require the Company to further adjust such values and estimates.
Equipment rental primarily consists of rental costs on revenue earning equipment in FMS. Equipment rental costs decreased 20 percent to $344 million in 2002 compared with 2001. The decrease in 2002 equipment rental is due to a decrease in the number of leased vehicles and lower lease rates due to a changing mix of leased units. Current year results also include decreased lease termination charges as a result of improved market pricing. Equipment rental costs increased 14 percent to $427 million in 2001 compared with 2000. The increase was due to sale-leaseback transactions, including securitization transactions, entered into during 2001 which increased the number of leased vehicles as well as increases in reserves for guaranteed lease termination values to reflect decreases in the estimated residual values of leased equipment.
The total number of revenue earning equipment units (owned and leased) at December 31, 2002 decreased approximately 5 percent from December 31, 2001 levels reflecting the Company’s continued focus on asset management and reducing capital expenditures while maximizing utilization of the FMS commercial rental fleet.
Interest expense decreased 23 percent to $92 million in 2002 compared with 2001. The decrease in interest expense reflects lower debt levels due to reduced capital spending, generally lower market interest rates and reduced effective interest rates as a result of hedging transactions entered into during the first quarter of 2002. Interest expense decreased 23 percent to $119 million in 2001 compared with 2000. The decrease in interest expense during 2001 was primarily due to debt reductions associated with the use of proceeds from the aforementioned sale-leaseback transactions and generally lower interest rates compared with 2000. The reductions in interest expense principally benefited FMS.
16
Years ended December 31
2002 2001 2000
(In thousands)
Interest expense $ 91,718 118,549 154,009 Percentage of revenue 2 % 2 % 3 %
Years ended December 31
2002 2001 2000
(In thousands)
Miscellaneous (income) expense, net $ (9,808 ) (1,334 ) 7,542
The Company had net miscellaneous income of $10 million in 2002 compared with net miscellaneous income of $1 million in 2001. Net miscellaneous income in 2002 is principally composed of servicing fee income for administrative services provided to vehicle lease trusts related to the Company’s vehicle securitization transactions. The increase in net miscellaneous income during 2002 is primarily attributed to a reduction in losses on the sale of receivables related to the decreased use of the Company’s revolving facility for the sale of receivables and 2001 losses on the sale of operating property and equipment. The Company had net miscellaneous income of $1 million in 2001 compared with net miscellaneous expense of $8 million in 2000. The change was primarily due to a reduction in losses on the sale of receivables related to the decreased use of the Company’s revolving facility for the sale of trade receivables combined with increased servicing fee income related to the Company’s vehicle securitization transactions. See “Financial Resources and Liquidity — Off-balance Sheet Arrangements” for further discussion on securitization transactions.
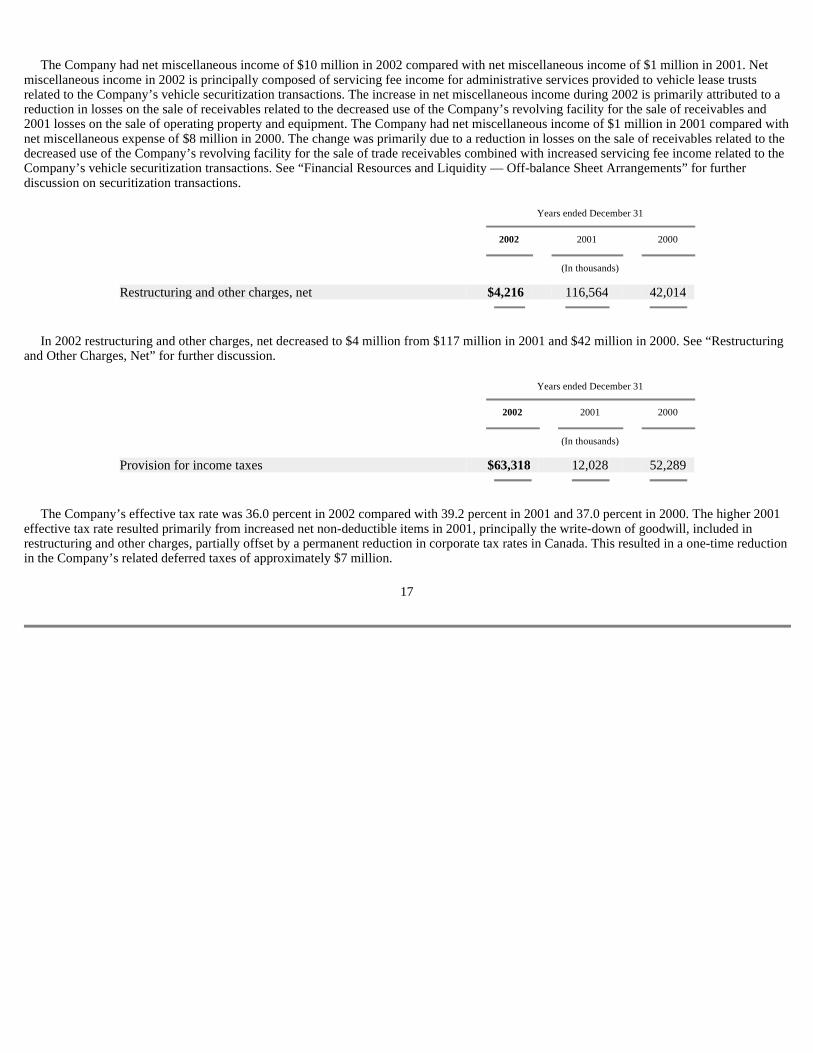
In 2002 restructuring and other charges, net decreased to $4 million from $117 million in 2001 and $42 million in 2000. See “Restructuring and Other Charges, Net” for further discussion.
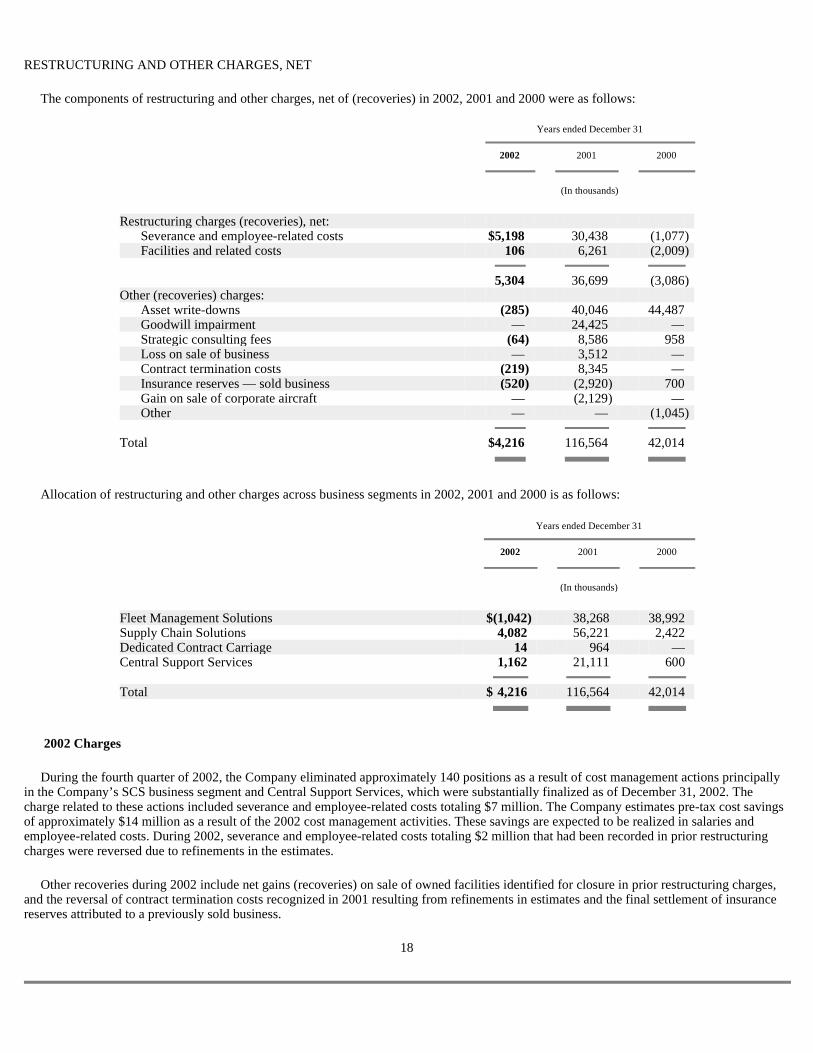
The Company’s effective tax rate was 36.0 percent in 2002 compared with 39.2 percent in 2001 and 37.0 percent in 2000. The higher 2001 effective tax rate resulted primarily from increased net non-deductible items in 2001, principally the write-down of goodwill, included in restructuring and other charges, partially offset by a permanent reduction in corporate tax rates in Canada. This resulted in a one-time reduction in the Company’s related deferred taxes of approximately $7 million.
17
Years ended December 31
2002 2001 2000
(In thousands)
Restructuring and other charges, net $ 4,216 116,564 42,014
Years ended December 31
2002 2001 2000
(In thousands)
Provision for income taxes $ 63,318 12,028 52,289
RESTRUCTURING AND OTHER CHARGES, NET
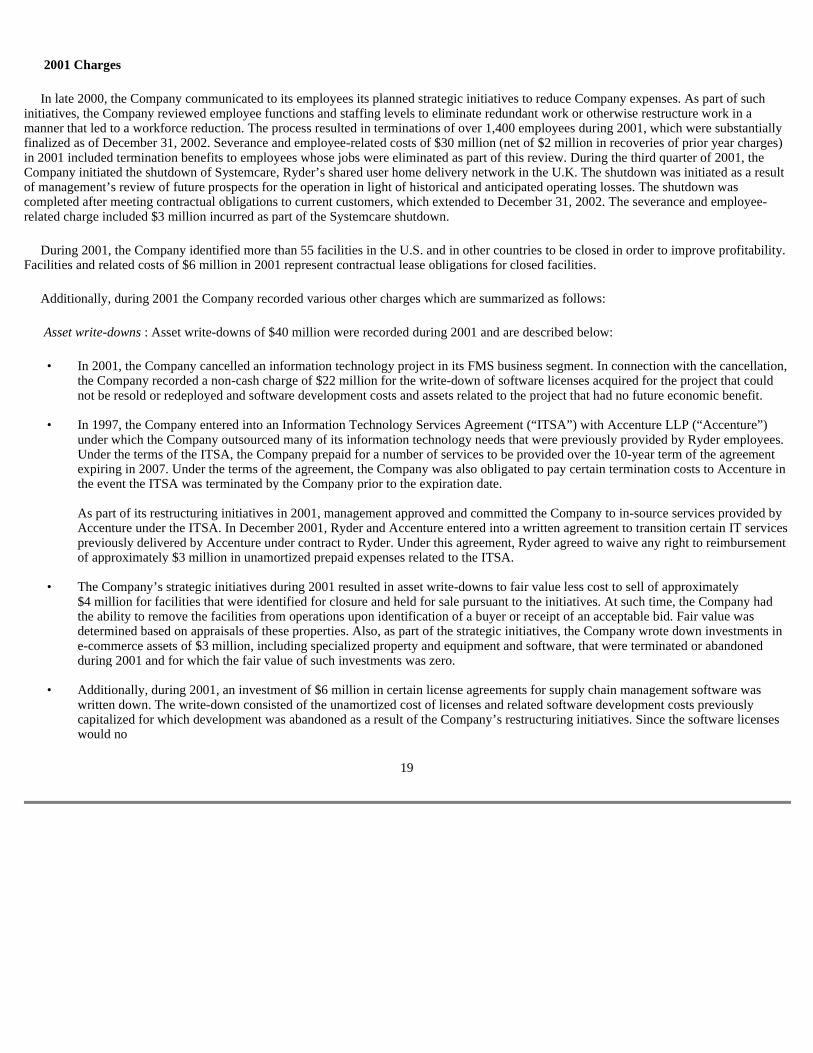
The components of restructuring and other charges, net of (recoveries) in 2002, 2001 and 2000 were as follows:
Allocation of restructuring and other charges across business segments in 2002, 2001 and 2000 is as follows:
2002 Charges
During the fourth quarter of 2002, the Company eliminated approximately 140 positions as a result of cost management actions principally in the Company’s SCS business segment and Central Support Services, which were substantially finalized as of December 31, 2002. The charge related to these actions included severance and employee-related costs totaling $7 million. The Company estimates pre-tax cost savings of approximately $14 million as a result of the 2002 cost management activities. These savings are expected to be realized in salaries and employee-related costs. During 2002, severance and employee-related costs totaling $2 million that had been recorded in prior restructuring charges were reversed due to refinements in the estimates.
Other recoveries during 2002 include net gains (recoveries) on sale of owned facilities identified for closure in prior restructuring charges, and the reversal of contract termination costs recognized in 2001 resulting from refinements in estimates and the final settlement of insurance reserves attributed to a previously sold business.
18
Years ended December 31
2002 2001 2000
(In thousands)
Restructuring charges (recoveries), net: Severance and employee-related costs $ 5,198 30,438 (1,077 ) Facilities and related costs 106 6,261 (2,009 ) 5,304 36,699 (3,086 ) Other (recoveries) charges: Asset write-downs (285 ) 40,046 44,487 Goodwill impairment — 24,425 — Strategic consulting fees (64 ) 8,586 958 Loss on sale of business — 3,512 — Contract termination costs (219 ) 8,345 — Insurance reserves — sold business (520 ) (2,920 ) 700 Gain on sale of corporate aircraft — (2,129 ) — Other — — (1,045 ) Total $ 4,216 116,564 42,014
Years ended December 31
2002 2001 2000
(In thousands)
Fleet Management Solutions $ (1,042 ) 38,268 38,992 Supply Chain Solutions 4,082 56,221 2,422 Dedicated Contract Carriage 14 964 — Central Support Services 1,162 21,111 600 Total $ 4,216 116,564 42,014
2001 Charges
In late 2000, the Company communicated to its employees its planned strategic initiatives to reduce Company expenses. As part of such initiatives, the Company reviewed employee functions and staffing levels to eliminate redundant work or otherwise restructure work in a manner that led to a workforce reduction. The process resulted in terminations of over 1,400 employees during 2001, which were substantially finalized as of December 31, 2002. Severance and employee-related costs of $30 million (net of $2 million in recoveries of prior year charges) in 2001 included termination benefits to employees whose jobs were eliminated as part of this review. During the third quarter of 2001, the Company initiated the shutdown of Systemcare, Ryder’s shared user home delivery network in the U.K. The shutdown was initiated as a result of management’s review of future prospects for the operation in light of historical and anticipated operating losses. The shutdown was completed after meeting contractual obligations to current customers, which extended to December 31, 2002. The severance and employee-related charge included $3 million incurred as part of the Systemcare shutdown.
During 2001, the Company identified more than 55 facilities in the U.S. and in other countries to be closed in order to improve profitability. Facilities and related costs of $6 million in 2001 represent contractual lease obligations for closed facilities.
Additionally, during 2001 the Company recorded various other charges which are summarized as follows:
Asset write-downs : Asset write-downs of $40 million were recorded during 2001 and are described below:
19
• In 2001, the Company cancelled an information technology project in its FMS business segment. In connection with the cancellation, the Company recorded a non-cash charge of $22 million for the write-down of software licenses acquired for the project that could not be resold or redeployed and software development costs and assets related to the project that had no future economic benefit.
• In 1997, the Company entered into an Information Technology Services Agreement (“ITSA”) with Accenture LLP (“Accenture”)
under which the Company outsourced many of its information technology needs that were previously provided by Ryder employees. Under the terms of the ITSA, the Company prepaid for a number of services to be provided over the 10-year term of the agreement expiring in 2007. Under the terms of the agreement, the Company was also obligated to pay certain termination costs to Accenture in the event the ITSA was terminated by the Company prior to the expiration date.
As part of its restructuring initiatives in 2001, management approved and committed the Company to in-source services provided by
Accenture under the ITSA. In December 2001, Ryder and Accenture entered into a written agreement to transition certain IT services previously delivered by Accenture under contract to Ryder. Under this agreement, Ryder agreed to waive any right to reimbursement of approximately $3 million in unamortized prepaid expenses related to the ITSA.
• The Company’s strategic initiatives during 2001 resulted in asset write-downs to fair value less cost to sell of approximately
$4 million for facilities that were identified for closure and held for sale pursuant to the initiatives. At such time, the Company had the ability to remove the facilities from operations upon identification of a buyer or receipt of an acceptable bid. Fair value was determined based on appraisals of these properties. Also, as part of the strategic initiatives, the Company wrote down investments in e-commerce assets of $3 million, including specialized property and equipment and software, that were terminated or abandoned during 2001 and for which the fair value of such investments was zero.
• Additionally, during 2001, an investment of $6 million in certain license agreements for supply chain management software was
written down. The write-down consisted of the unamortized cost of licenses and related software development costs previously capitalized for which development was abandoned as a result of the Company’s restructuring initiatives. Since the software licenses would no
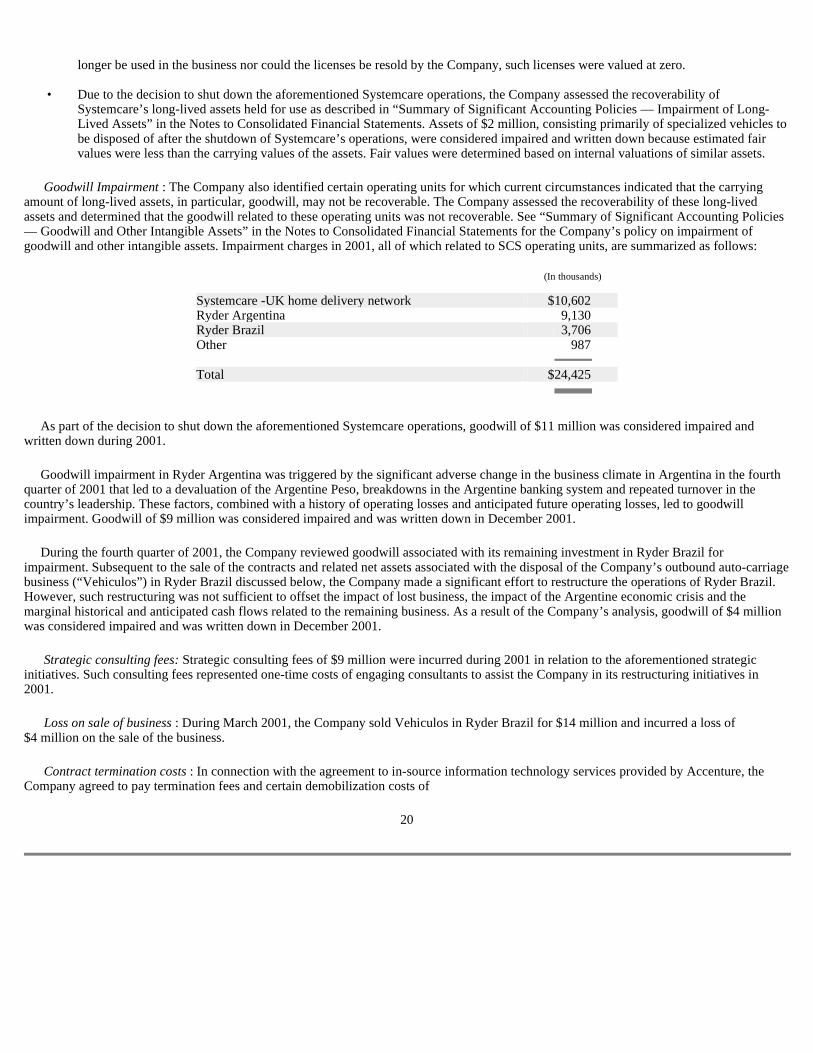
Goodwill Impairment : The Company also identified certain operating units for which current circumstances indicated that the carrying amount of long-lived assets, in particular, goodwill, may not be recoverable. The Company assessed the recoverability of these long-lived assets and determined that the goodwill related to these operating units was not recoverable. See “Summary of Significant Accounting Policies — Goodwill and Other Intangible Assets” in the Notes to Consolidated Financial Statements for the Company’s policy on impairment of goodwill and other intangible assets. Impairment charges in 2001, all of which related to SCS operating units, are summarized as follows:
As part of the decision to shut down the aforementioned Systemcare operations, goodwill of $11 million was considered impaired and written down during 2001.
Goodwill impairment in Ryder Argentina was triggered by the significant adverse change in the business climate in Argentina in the fourth quarter of 2001 that led to a devaluation of the Argentine Peso, breakdowns in the Argentine banking system and repeated turnover in the country’s leadership. These factors, combined with a history of operating losses and anticipated future operating losses, led to goodwill impairment. Goodwill of $9 million was considered impaired and was written down in December 2001.
During the fourth quarter of 2001, the Company reviewed goodwill associated with its remaining investment in Ryder Brazil for impairment. Subsequent to the sale of the contracts and related net assets associated with the disposal of the Company’s outbound auto-carriage business (“Vehiculos”) in Ryder Brazil discussed below, the Company made a significant effort to restructure the operations of Ryder Brazil. However, such restructuring was not sufficient to offset the impact of lost business, the impact of the Argentine economic crisis and the marginal historical and anticipated cash flows related to the remaining business. As a result of the Company’s analysis, goodwill of $4 million was considered impaired and was written down in December 2001.
Strategic consulting fees: Strategic consulting fees of $9 million were incurred during 2001 in relation to the aforementioned strategic initiatives. Such consulting fees represented one-time costs of engaging consultants to assist the Company in its restructuring initiatives in 2001.
Loss on sale of business : During March 2001, the Company sold Vehiculos in Ryder Brazil for $14 million and incurred a loss of $4 million on the sale of the business.
Contract termination costs : In connection with the agreement to in-source information technology services provided by Accenture, the Company agreed to pay termination fees and certain demobilization costs of
20
longer be used in the business nor could the licenses be resold by the Company, such licenses were valued at zero. • Due to the decision to shut down the aforementioned Systemcare operations, the Company assessed the recoverability of
Systemcare’s long-lived assets held for use as described in “Summary of Significant Accounting Policies — Impairment of Long-Lived Assets” in the Notes to Consolidated Financial Statements. Assets of $2 million, consisting primarily of specialized vehicles to be disposed of after the shutdown of Systemcare’s operations, were considered impaired and written down because estimated fair values were less than the carrying values of the assets. Fair values were determined based on internal valuations of similar assets.
(In thousands)
Systemcare -UK home delivery network $ 10,602 Ryder Argentina 9,130 Ryder Brazil 3,706 Other 987 Total $ 24,425
approximately $8 million. Also during 2001, the Company made a decision to terminate a long-term marketing arrangement to reduce marketing costs.
Insurance reserves — sold business : During 2001, the Company recognized $3 million in recoveries from an insurance settlement attributed to a business sold in 1989. The insurance recovery represents an adjustment to the Company’s indemnification reserve for favorable actuarial developments since the time of the sale.
Gain on sale of corporate aircraft: As a direct result of the Company’s 2001 restructuring and cost reduction initiatives, the Company decided to sell its corporate aircraft. The Company sold the aircraft during the first quarter of 2001 and recorded a $2 million gain on the sale.
2000 Charges
In 2000, severance and employee-related costs of $1 million that had been recorded in the 1999 restructuring were reversed due to refinements in estimates. Facilities and related costs reflect $2 million of net gains (recoveries) on sale of owned facilities identified for closure in the 1999 and 1996 restructuring.
In 2000, an asset write-down of $41 million resulted from the rapid industry-wide downturn in the market for new and used “Class 8” vehicles (the largest heavy-duty tractors) which led to a decrease in the market value of used tractors during the second half of 2000. The Company’s unsold Class 8 inventory consists of units previously used by customers of the FMS segment. Approximately $15 million of the charge related to Class 8 tractors held for sale and identified in 2000 as increasingly undesirable and unmarketable due to lower-powered engines or a potential lack of future support for parts and service. The remainder of the charge related to other owned and leased tractors held for sale for which estimated fair value less costs to sell declined below carrying value (or termination value, which represents the final payment due to lessors, in the case of leased units) in 2000. These charges were slightly offset with gains of $1 million on vehicles sold in the U.K. during 2000, for which an impairment charge had been recorded in the 1999 restructuring.
During 2000, the Company settled long-standing litigation with a former customer, OfficeMax, relating to a logistics services agreement that was terminated in 1997. In 2000, asset write-downs include $4 million related to the write-down, net of recoveries, of certain assets related to the OfficeMax contract.
A charge of $1 million for consulting fees was incurred during 2000 related to the completion of the Company’s 1999 profitability improvement study. Also during 2000, the Company recorded a $1 million charge for an adjustment to the Company’s indemnification reserve associated with the aforementioned insurance settlement and a $1 million reversal of certain other charges recorded in the 1999 restructuring.
21

OPERATING RESULTS BY BUSINESS SEGMENT
Beginning in the first quarter of 2002, the primary measurement of segment financial performance, defined as “Net Before Tax” (NBT), includes an allocation of Central Support Services (CSS) and excludes goodwill impairment, goodwill amortization and restructuring and other charges, net. Prior-year segment results have been restated to conform to the new measurement standard. CSS represents those costs incurred to support all business segments, including sales and marketing, human resources, finance, corporate services shared management information systems, customer solutions, health and safety, legal and communications. The objective of the NBT measurement is to provide clarity on the profitability of each business segment and, ultimately, to hold leadership of each business segment and each operating segment within each business segment accountable for their allocated share of CSS costs. To facilitate the comparison of 2002 business segment NBT to prior periods, prior-year goodwill amortization is now treated as a corporate, rather than segment, cost and is segregated as such.
Certain costs are considered to be overhead not attributable to any segment and remain unallocated in CSS. Included within the unallocated overhead remaining within CSS are the costs for investor relations, corporate communications, public affairs and certain executive compensation.
22
Years ended December 31
2002 2001 2000
(In thousands)
Revenue: Fleet Management Solutions: Full service lease and program maintenance $ 1,795,254 1,855,865 1,865,345 Commercial rental 458,355 468,438 523,776 Fuel 582,643 658,325 773,320 Other 346,770 369,912 393,549 3,183,022 3,352,540 3,555,990 Supply Chain Solutions 1,388,299 1,453,881 1,595,252 Dedicated Contract Carriage 517,961 534,962 551,706 Eliminations (313,017 ) (335,260 ) (366,156 ) Total $ 4,776,265 5,006,123 5,336,792 NBT: Fleet Management Solutions $ 214,384 194,398 225,088 Supply Chain Solutions (6,221 ) (6,760 ) 10,035 Dedicated Contract Carriage 31,157 34,755 37,282 Eliminations (34,636 ) (36,989 ) (41,888 ) 204,684 185,404 230,517 Unallocated Central Support Services (24,585 ) (25,396 ) (35,522 ) Goodwill Amortization — (12,738 ) (11,660 ) Earnings before restructuring and other charges,
taxes and cumulative effect of change in accounting principle 180,099 147,270 183,335
Restructuring and other charges, net (4,216 ) (116,564 ) (42,014 ) Earnings before income taxes and cumulative effect
of change in accounting principle $ 175,883 30,706 141,321
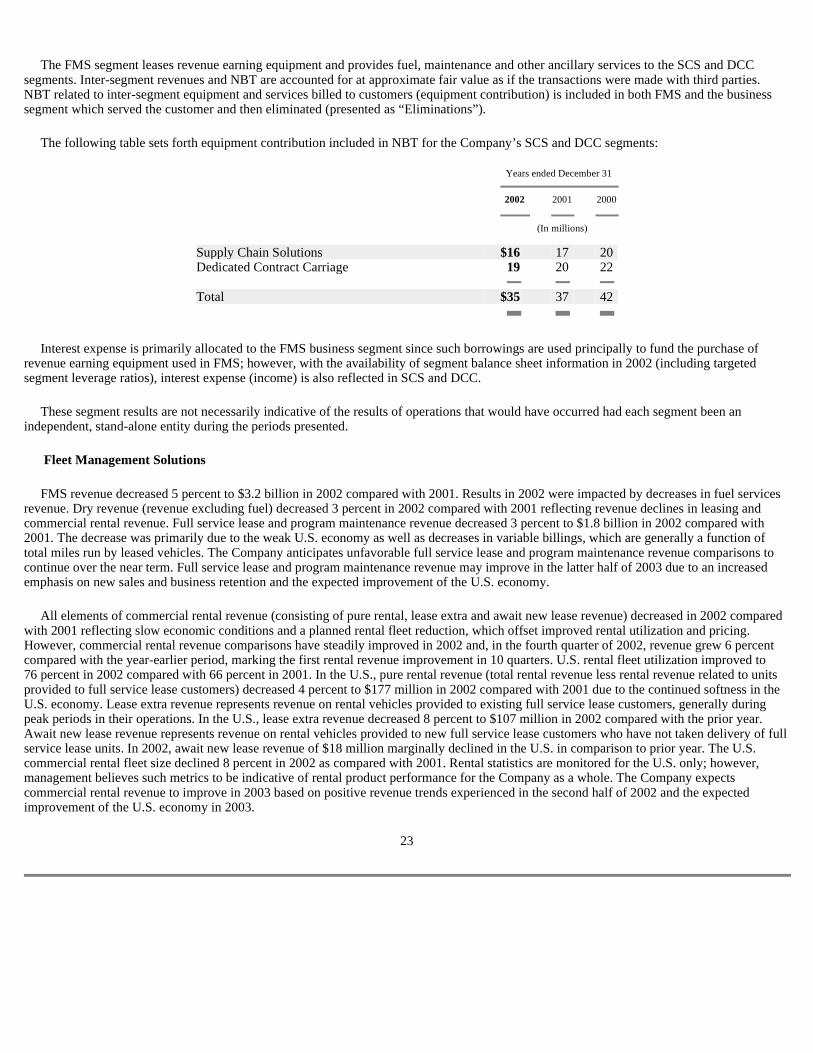
The FMS segment leases revenue earning equipment and provides fuel, maintenance and other ancillary services to the SCS and DCC segments. Inter-segment revenues and NBT are accounted for at approximate fair value as if the transactions were made with third parties. NBT related to inter-segment equipment and services billed to customers (equipment contribution) is included in both FMS and the business segment which served the customer and then eliminated (presented as “Eliminations”).
The following table sets forth equipment contribution included in NBT for the Company’s SCS and DCC segments:
Interest expense is primarily allocated to the FMS business segment since such borrowings are used principally to fund the purchase of revenue earning equipment used in FMS; however, with the availability of segment balance sheet information in 2002 (including targeted segment leverage ratios), interest expense (income) is also reflected in SCS and DCC.
These segment results are not necessarily indicative of the results of operations that would have occurred had each segment been an independent, stand-alone entity during the periods presented.
Fleet Management Solutions
FMS revenue decreased 5 percent to $3.2 billion in 2002 compared with 2001. Results in 2002 were impacted by decreases in fuel services revenue. Dry revenue (revenue excluding fuel) decreased 3 percent in 2002 compared with 2001 reflecting revenue declines in leasing and commercial rental revenue. Full service lease and program maintenance revenue decreased 3 percent to $1.8 billion in 2002 compared with 2001. The decrease was primarily due to the weak U.S. economy as well as decreases in variable billings, which are generally a function of total miles run by leased vehicles. The Company anticipates unfavorable full service lease and program maintenance revenue comparisons to continue over the near term. Full service lease and program maintenance revenue may improve in the latter half of 2003 due to an increased emphasis on new sales and business retention and the expected improvement of the U.S. economy.
All elements of commercial rental revenue (consisting of pure rental, lease extra and await new lease revenue) decreased in 2002 compared with 2001 reflecting slow economic conditions and a planned rental fleet reduction, which offset improved rental utilization and pricing. However, commercial rental revenue comparisons have steadily improved in 2002 and, in the fourth quarter of 2002, revenue grew 6 percent compared with the year-earlier period, marking the first rental revenue improvement in 10 quarters. U.S. rental fleet utilization improved to 76 percent in 2002 compared with 66 percent in 2001. In the U.S., pure rental revenue (total rental revenue less rental revenue related to units provided to full service lease customers) decreased 4 percent to $177 million in 2002 compared with 2001 due to the continued softness in the U.S. economy. Lease extra revenue represents revenue on rental vehicles provided to existing full service lease customers, generally during peak periods in their operations. In the U.S., lease extra revenue decreased 8 percent to $107 million in 2002 compared with the prior year. Await new lease revenue represents revenue on rental vehicles provided to new full service lease customers who have not taken delivery of full service lease units. In 2002, await new lease revenue of $18 million marginally declined in the U.S. in comparison to prior year. The U.S. commercial rental fleet size declined 8 percent in 2002 as compared with 2001. Rental statistics are monitored for the U.S. only; however, management believes such metrics to be indicative of rental product performance for the Company as a whole. The Company expects commercial rental revenue to improve in 2003 based on positive revenue trends experienced in the second half of 2002 and the expected improvement of the U.S. economy in 2003.
23
Years ended December 31
2002 2001 2000
(In millions)
Supply Chain Solutions $ 16 17 20 Dedicated Contract Carriage 19 20 22 Total $ 35 37 42
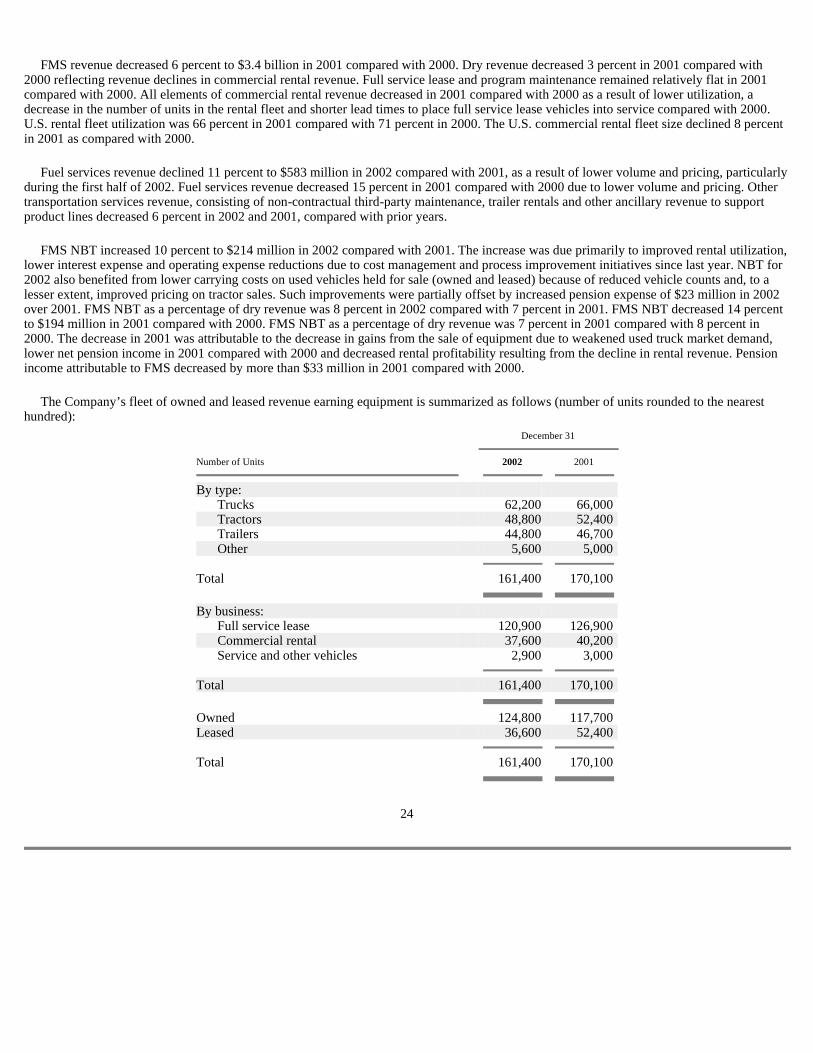
FMS revenue decreased 6 percent to $3.4 billion in 2001 compared with 2000. Dry revenue decreased 3 percent in 2001 compared with 2000 reflecting revenue declines in commercial rental revenue. Full service lease and program maintenance remained relatively flat in 2001 compared with 2000. All elements of commercial rental revenue decreased in 2001 compared with 2000 as a result of lower utilization, a decrease in the number of units in the rental fleet and shorter lead times to place full service lease vehicles into service compared with 2000. U.S. rental fleet utilization was 66 percent in 2001 compared with 71 percent in 2000. The U.S. commercial rental fleet size declined 8 percent in 2001 as compared with 2000.
Fuel services revenue declined 11 percent to $583 million in 2002 compared with 2001, as a result of lower volume and pricing, particularly during the first half of 2002. Fuel services revenue decreased 15 percent in 2001 compared with 2000 due to lower volume and pricing. Other transportation services revenue, consisting of non-contractual third-party maintenance, trailer rentals and other ancillary revenue to support product lines decreased 6 percent in 2002 and 2001, compared with prior years.
FMS NBT increased 10 percent to $214 million in 2002 compared with 2001. The increase was due primarily to improved rental utilization, lower interest expense and operating expense reductions due to cost management and process improvement initiatives since last year. NBT for 2002 also benefited from lower carrying costs on used vehicles held for sale (owned and leased) because of reduced vehicle counts and, to a lesser extent, improved pricing on tractor sales. Such improvements were partially offset by increased pension expense of $23 million in 2002 over 2001. FMS NBT as a percentage of dry revenue was 8 percent in 2002 compared with 7 percent in 2001. FMS NBT decreased 14 percent to $194 million in 2001 compared with 2000. FMS NBT as a percentage of dry revenue was 7 percent in 2001 compared with 8 percent in 2000. The decrease in 2001 was attributable to the decrease in gains from the sale of equipment due to weakened used truck market demand, lower net pension income in 2001 compared with 2000 and decreased rental profitability resulting from the decline in rental revenue. Pension income attributable to FMS decreased by more than $33 million in 2001 compared with 2000.
The Company’s fleet of owned and leased revenue earning equipment is summarized as follows (number of units rounded to the nearest hundred):
24
December 31
Number of Units 2002 2001
By type: Trucks 62,200 66,000 Tractors 48,800 52,400 Trailers 44,800 46,700 Other 5,600 5,000 Total 161,400 170,100 By business: Full service lease 120,900 126,900 Commercial rental 37,600 40,200 Service and other vehicles 2,900 3,000 Total 161,400 170,100 Owned 124,800 117,700 Leased 36,600 52,400 Total 161,400 170,100

The totals in each of the tables above include the following non-revenue earning equipment (number of units rounded to the nearest hundred):
NYE units represent new units on hand that are being prepared for deployment to a lease customer or into the rental fleet. Preparations include activities such as adding lift gates, paint, decals, cargo area and refrigeration units. NLE units represent units held for sale, as well as other units for which no revenue has been earned in the previous 30 days. These vehicles may be temporarily out of service, being prepared for sale or not rented due to lack of demand. The total number of units not earning revenue of 8,100 units is at a 48 month low due to the Company’s efforts to redeploy surplus units and the continued downsizing of the commercial rental fleet.
Supply Chain Solutions
SCS revenue in 2002 decreased 5 percent to $1.4 billion compared with 2001. Operating revenue (which excludes FUM) decreased 4 percent in 2002 compared with 2001. The declines in revenue for 2002 reflect volume reductions in the electronics, high-tech and telecommunications and consumer products operating units as a result of the slowdown in the U.S. economy in general and those sectors specifically. The revenue decline was also impacted by the non-renewal of certain customer contracts and the currency devaluation and economic downturn in Argentina. Such revenue decreases were partially offset by new and expanded business in the automotive sector in the Company’s U.S. and European operations. Overall, in light of these factors, the Company expects unfavorable revenue comparisons to continue over the near term.
SCS revenue decreased 9 percent to $1.5 billion in 2001 compared with 2000 mostly due to volume reductions in North America and Latin America as a result of the continued worldwide economic slowdown. In North America, volume reductions were experienced in the Company’s automotive and electronics, high-tech and telecommunications operating units due to slowed consumer demand in those sectors combined with the non-renewal of certain customer contracts 2001. Volume decreases in Latin America were due to the slowing economies in Brazil and Argentina and to the sale of Brazil’s outbound auto-carriage business in 2001. Additionally, revenue reductions occurred in 2001 due to the impact of exchange rates on translation of foreign subsidiaries.
SCS NBT improved 8 percent to a deficit of $6 million in 2002 from a deficit of $7 million in 2001. SCS NBT as a percentage of operating revenue was negative 0.6 percent in 2002 compared with negative 0.7 percent in 2001. SCS NBT was negatively impacted by facility lease termination charges of $3 million recorded in the fourth quarter of 2002, reduced revenue and higher overhead spending. The increased overhead spending was due to increased costs associated with profit improvement initiatives and higher employee benefit costs. These decreases were partially offset by new and expanded profitable business in the automotive and electronics, high-tech and telecommunications operating units, improvement in SCS European operations and continued benefits from margin improvement initiatives, including the elimination of certain unprofitable business and the implementation of cost containment controls.
SCS NBT decreased to a deficit of $7 million in 2001 compared with earnings of $10 million in 2000. The decrease in NBT was due primarily to the previously mentioned volume reductions as a result of the economic downturn, the non-renewal of customer contracts and increased operating costs, particularly related to the Company’s transportation management operations. NBT as a percentage of operating revenue was negative 0.7 percent in 2001 compared with 0.9 percent in 2000.
25
December 31
Number of Units 2002 2001
Not yet earning revenue (NYE) 1,100 1,200 No longer earning revenue (NLE): Units held for sale 3,500 5,200 Other NLE units 3,500 4,700 Total 8,100 11,100
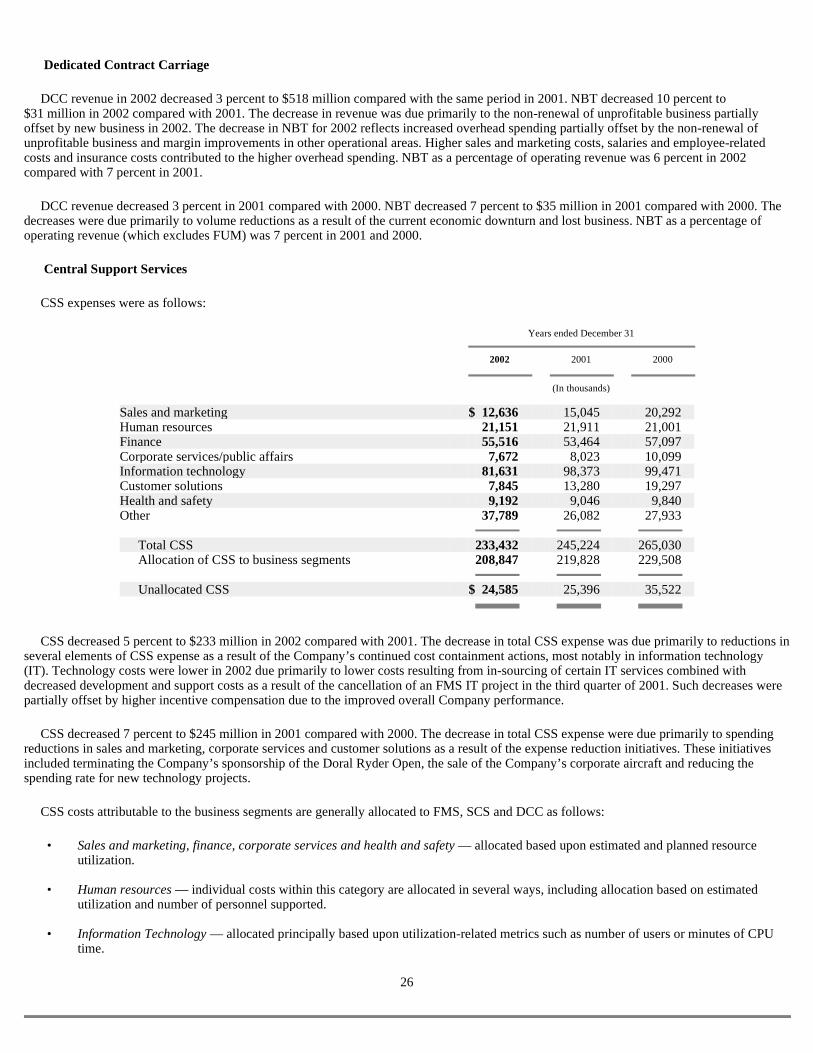
Dedicated Contract Carriage
DCC revenue in 2002 decreased 3 percent to $518 million compared with the same period in 2001. NBT decreased 10 percent to $31 million in 2002 compared with 2001. The decrease in revenue was due primarily to the non-renewal of unprofitable business partially offset by new business in 2002. The decrease in NBT for 2002 reflects increased overhead spending partially offset by the non-renewal of unprofitable business and margin improvements in other operational areas. Higher sales and marketing costs, salaries and employee-related costs and insurance costs contributed to the higher overhead spending. NBT as a percentage of operating revenue was 6 percent in 2002 compared with 7 percent in 2001.
DCC revenue decreased 3 percent in 2001 compared with 2000. NBT decreased 7 percent to $35 million in 2001 compared with 2000. The decreases were due primarily to volume reductions as a result of the current economic downturn and lost business. NBT as a percentage of operating revenue (which excludes FUM) was 7 percent in 2001 and 2000.
Central Support Services
CSS expenses were as follows:
CSS decreased 5 percent to $233 million in 2002 compared with 2001. The decrease in total CSS expense was due primarily to reductions in several elements of CSS expense as a result of the Company’s continued cost containment actions, most notably in information technology (IT). Technology costs were lower in 2002 due primarily to lower costs resulting from in-sourcing of certain IT services combined with decreased development and support costs as a result of the cancellation of an FMS IT project in the third quarter of 2001. Such decreases were partially offset by higher incentive compensation due to the improved overall Company performance.
CSS decreased 7 percent to $245 million in 2001 compared with 2000. The decrease in total CSS expense were due primarily to spending reductions in sales and marketing, corporate services and customer solutions as a result of the expense reduction initiatives. These initiatives included terminating the Company’s sponsorship of the Doral Ryder Open, the sale of the Company’s corporate aircraft and reducing the spending rate for new technology projects.
CSS costs attributable to the business segments are generally allocated to FMS, SCS and DCC as follows:
26
Years ended December 31
2002 2001 2000
(In thousands)
Sales and marketing $ 12,636 15,045 20,292 Human resources 21,151 21,911 21,001 Finance 55,516 53,464 57,097 Corporate services/public affairs 7,672 8,023 10,099 Information technology 81,631 98,373 99,471 Customer solutions 7,845 13,280 19,297 Health and safety 9,192 9,046 9,840 Other 37,789 26,082 27,933 Total CSS 233,432 245,224 265,030 Allocation of CSS to business segments 208,847 219,828 229,508 Unallocated CSS $ 24,585 25,396 35,522
• Sales and marketing, finance, corporate services and health and safety — allocated based upon estimated and planned resource utilization.
• Human resources — individual costs within this category are allocated in several ways, including allocation based on estimated
utilization and number of personnel supported. • Information Technology — allocated principally based upon utilization-related metrics such as number of users or minutes of CPU
time.
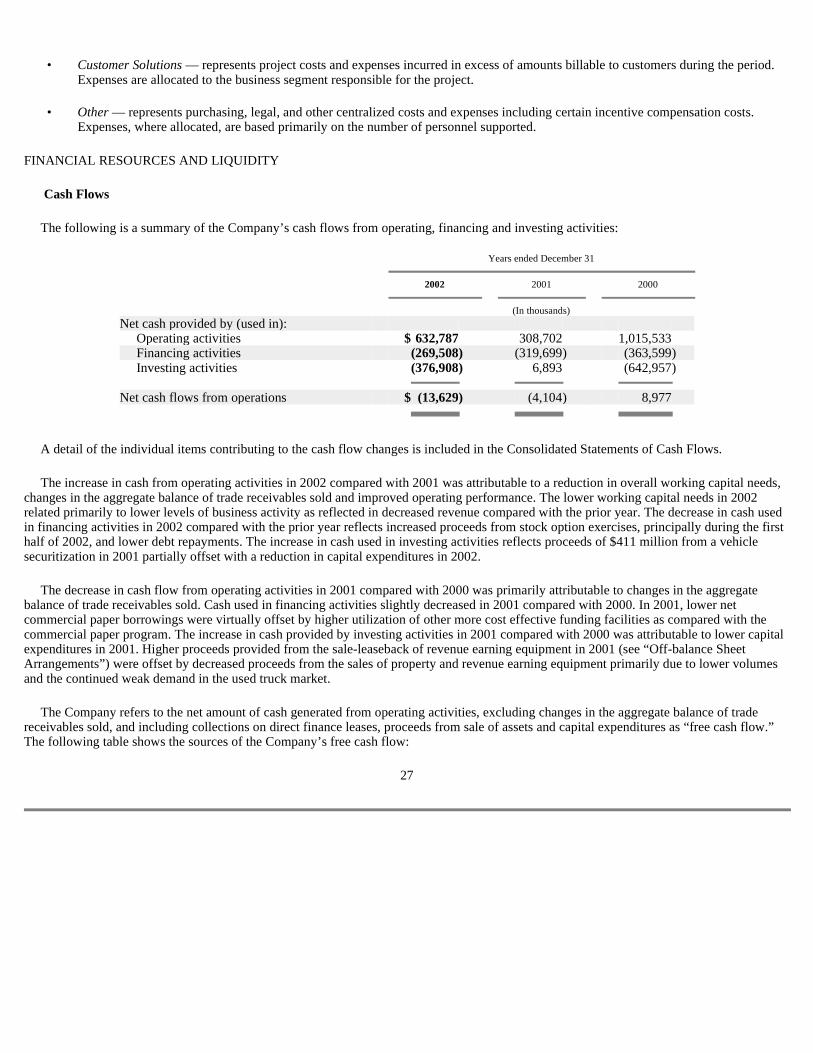
FINANCIAL RESOURCES AND LIQUIDITY
Cash Flows
The following is a summary of the Company’s cash flows from operating, financing and investing activities:
A detail of the individual items contributing to the cash flow changes is included in the Consolidated Statements of Cash Flows.
The increase in cash from operating activities in 2002 compared with 2001 was attributable to a reduction in overall working capital needs, changes in the aggregate balance of trade receivables sold and improved operating performance. The lower working capital needs in 2002 related primarily to lower levels of business activity as reflected in decreased revenue compared with the prior year. The decrease in cash used in financing activities in 2002 compared with the prior year reflects increased proceeds from stock option exercises, principally during the first half of 2002, and lower debt repayments. The increase in cash used in investing activities reflects proceeds of $411 million from a vehicle securitization in 2001 partially offset with a reduction in capital expenditures in 2002.
The decrease in cash flow from operating activities in 2001 compared with 2000 was primarily attributable to changes in the aggregate balance of trade receivables sold. Cash used in financing activities slightly decreased in 2001 compared with 2000. In 2001, lower net commercial paper borrowings were virtually offset by higher utilization of other more cost effective funding facilities as compared with the commercial paper program. The increase in cash provided by investing activities in 2001 compared with 2000 was attributable to lower capital expenditures in 2001. Higher proceeds provided from the sale-leaseback of revenue earning equipment in 2001 (see “Off-balance Sheet Arrangements”) were offset by decreased proceeds from the sales of property and revenue earning equipment primarily due to lower volumes and the continued weak demand in the used truck market.
The Company refers to the net amount of cash generated from operating activities, excluding changes in the aggregate balance of trade receivables sold, and including collections on direct finance leases, proceeds from sale of assets and capital expenditures as “free cash flow.” The following table shows the sources of the Company’s free cash flow:
27
• Customer Solutions — represents project costs and expenses incurred in excess of amounts billable to customers during the period. Expenses are allocated to the business segment responsible for the project.
• Other — represents purchasing, legal, and other centralized costs and expenses including certain incentive compensation costs.
Expenses, where allocated, are based primarily on the number of personnel supported.
Years ended December 31
2002 2001 2000
(In thousands)
Net cash provided by (used in): Operating activities $ 632,787 308,702 1,015,533 Financing activities (269,508 ) (319,699 ) (363,599 ) Investing activities (376,908 ) 6,893 (642,957 ) Net cash flows from operations $ (13,629 ) (4,104 ) 8,977
The increase in free cash flow in 2002 compared with 2001 was primarily attributable to a reduction in overall working capital needs and improved operating performance. The decrease in working capital is attributable in part to lower levels of business activity in 2002 as reflected in decreased revenue compared with the prior year. The Company expects free cash flow to decline in 2003 as a result of the increased capital spending requirements discussed below. The increase in free cash flow in 2001 compared with 2000 was primarily attributable to a reduction in net capital spending levels offset by lower operating performance and increased overall working capital needs.
The following is a summary of capital expenditures:
The decreases in capital expenditures in 2002 and 2001 were due primarily to reduced market demand, improved controls over capital expenditures and a reduction in the volume of early replacements of full service leases compared with 2000. The Company has worked to improve controls over capital expenditures and reduce the volume of early terminations of full service leases over the past two years. As part of its initiatives, the Company successfully implemented a strategy of extending certain full service leases rather than leasing new units, which has allowed the Company to further control capital expenditures while frequently providing customers with vehicles at favorable pre-owned rates compared with rates on new units. Capital expenditures are anticipated to increase to approximately $890 million in 2003 as a result of higher levels of vehicle replacements. The Company expects to fund 2003 capital expenditures with internally generated funds and borrowings.
No acquisitions were completed in 2002 or 2001. During 2000, the Company completed a few immaterial acquisitions, each of which was accounted for using the purchase method of accounting. Total consideration for these acquisitions was $28 million. The Company will continue to evaluate selective acquisitions in FMS, SCS and DCC in 2003.
Financing and Other Funding Transactions
The Company utilizes external capital to support growth in its asset-based product lines. The Company has a variety of financing alternatives available to fund its capital needs. These alternatives include long-term and
28
Years ended December 31
2002 2001 2000
(In thousands)
Cash provided by operating activities $ 632,787 308,702 1,015,533 Changes in the aggregate balance of trade receivables
sold 110,000 235,000 (270,000 ) Collections on direct finance leases 66,489 66,204 67,462 Sales of property and revenue earning equipment 152,685 175,134 229,908 Purchases of property and revenue earning equipment (600,301 ) (656,597 ) (1,288,784 ) Net free cash flows $ 361,660 128,443 (245,881 )
Years ended December 31
2002 2001 2000
(In thousands)
Revenue earning equipment* $ 556,328 579,320 1,186,787 Operating property and equipment 43,973 77,277 101,997 Total $ 600,301 656,597 1,288,784
* 2002 excludes non-cash additions of $67 million in assets held under capital lease resulting from the extension of existing operating leases and other additions.
medium-term public and private debt, asset-backed securities, bank term loans, leasing arrangements, bank credit facilities, commercial paper and sale of receivable program.
Total debt was $1.6 billion at December 31, 2002, a decrease of 9 percent from December 31, 2001. The Company issued $150 million of medium-term notes and retired $166 million of medium-term notes in 2002. U.S. commercial paper outstanding at December 31, 2002 decreased to $118 million, compared with $210 million at December 31, 2001. During 2002, the Company added capital lease obligations of $67 million primarily in connection with the extension of existing operating leases of revenue earning equipment. The Company’s foreign debt was $238 million at December 31, 2002, a decrease of approximately $104 million from December 31, 2001. The Company’s percentage of variable-rate financing obligations (including notional value of swap agreements) was 37 percent at December 31, 2002, compared with 27 percent at December 31, 2001. Generally, the Company targets a variable-rate exposure of 25 to 45 percent of total obligations.
Debt totaled $1.7 billion at the end of 2001 compared with $2.0 billion at the end of 2000. The decrease in debt in 2001 was principally due to repayment of $100 million in debentures and a decrease of $231 million in commercial paper borrowings, which were repaid with proceeds of sale-leaseback transactions described below. In addition to the Company’s reduced debt in 2001, receivables sold decreased $235 million in 2001 compared with 2000. Decreased debt levels and reduced overall funding needs were generally the result of reduced levels of capital expenditures on revenue earning equipment.
The Company’s debt to equity and related ratios were as follows:
Debt to equity consists of the Company’s on-balance sheet debt for the period divided by total equity. Total obligations to equity represents debt plus the following off-balance sheet funding, all divided by total equity: (1) receivables sold, and (2) the present value of minimum lease payments and guaranteed residual values under operating leases for equipment, discounted at the interest rate implicit in the lease. Total obligations to equity, including securitizations, consists of total obligations, described above, plus the present value of contingent rentals under the Company’s securitizations (assuming customers make all lease payments on securitized vehicles when contractually due), discounted at the average interest rate paid to investors in the trust, all divided by total equity. Off-balance sheet obligations with special-purpose entities, primarily securitizations, were approximately $381 million and $536 million at December 31, 2002 and 2001, respectively.
All leverage ratios in 2002 were impacted by a non-cash equity charge of $228 million (after-tax) recorded as of December 31, 2002 in connection with additional minimum pension liability adjustments — see “Pension Information” below for additional discussion. Excluding the pension equity charge, all ratios declined in 2002 as a result of the Company’s reduced funding needs attributable to decreases in purchases of revenue earning equipment. For 2003, the Company anticipates these ratios to increase as a result of higher anticipated capital spending.
The Company participates in an agreement, as amended from time to time, to sell with limited recourse, trade receivables on a revolving and uncommitted basis. This agreement expires in July 2004. In June 2002, the Company reduced the amount available for sale under its trade receivable facility from $375 million to $275 million as a result of a reduction in overall capital needs. The Company sells receivables in order to fund operations,
29
December 31
2002 2001
(In thousands)
On-balance sheet debt $ 1,551,468 1,708,684 Debt to equity 140 % 139 % Total obligations excluding securitizations 1,921,905 2,443,104 Total obligations to equity excluding securitizations 173 % 199 % Total obligations including securitizations 2,232,860 2,884,483 Total obligations to equity including securitizations 201 % 234 %
particularly when the cost of such sales is cost effective compared with other means of funding, notably, commercial paper. Receivables are sold first to a bankruptcy-remote special-purpose entity, Ryder Receivables Funding LLC (“RRF LLC”), that is included in the Company’s consolidated financial statements. RRF LLC then sells certain receivables to unrelated commercial entities at a loss, which approximates the purchasers’ financing cost of issuing its own commercial paper backed by the trade receivables over the period of anticipated collection. The Company is responsible for servicing receivables sold, but has no retained interests. At December 31, 2002 and 2001, the outstanding balance of receivables sold pursuant to this agreement was $0 and $110 million, respectively. Losses on receivable sales associated with this program were $2 million in 2002, $9 million in 2001 and $17 million in 2000 and are included in miscellaneous (income) expense, net. RRF LLC records estimates of losses under the recourse provision which are included in accrued liabilities. Since no receivables were sold at the end of 2002, no amount of available recourse or recognized recourse obligation existed as of December 31, 2002. At December 31, 2001, the amount of available recourse was $14 million and the estimated losses under the recourse obligation attributed to receivables sold were $1 million. The decrease in trade receivables sold since December 31, 2001 is due to a reduced need for cash as a result of lower working capital needs. See “Receivables” in the Notes to Consolidated Financial Statements for a further discussion on the Company’s sale of receivables.
The Company’s ability to access unsecured debt in the capital markets is linked to both its short and long-term debt ratings. These ratings are intended to provide guidance to investors in determining the credit risk associated with particular Company securities based on current information obtained by the rating agencies from the Company or other sources that such agencies consider to be reliable. Lower ratings generally result in higher borrowing costs as well as reduced access to capital markets.
The Company’s debt ratings as of December 31, 2002 were as follows:
On December 19, 2001, Moody’s Investor Service confirmed the Company’s long-term debt rating and changed its long-term debt rating outlook to negative. The Company’s debt ratings have remained unchanged since the first quarter of 2001. A downgrade of the Company’s debt below investment grade level would limit the Company’s ability to issue commercial paper and would result in the Company no longer having the ability to sell trade receivables under the agreement described above or participate in existing derivative transactions. As a result, the Company would have to rely on other established funding sources described below.
The Company has established an $860 million global revolving credit facility. The facility is composed of $300 million which matures in May 2003 and is renewable annually (and is in the process of being renewed), and $560 million which matures in May 2006. The primary purposes of the credit facility are to finance working capital and provide support for the issuance of commercial paper. At the Company’s option, the interest rate on borrowings under the credit facility is based on LIBOR, prime, federal funds or local equivalent rates. The credit facility’s annual facility fee ranges from 12.5 to 15.0 basis points applied to the total facility of $860 million based on the Company’s current credit ratings. At December 31, 2002, $674 million was available under this global credit facility. Of this amount, $300 million was available at a maturity of less than one year. Foreign borrowings of $68 million were outstanding under the facility at December 31, 2002. In order to maintain availability of funding, the global revolving credit facility requires the Company to maintain a ratio of debt to consolidated tangible net worth, as defined, of less than or equal to 300 percent. The ratio at December 31, 2002 was 119 percent.
In September 1998, the Company filed an $800 million shelf registration statement with the Securities and Exchange Commission (SEC). Proceeds from debt issues under the shelf registration have been and are expected to
30
Short- Long- Term Term
Moody’s Investors Service P2 Baa1 Standard & Poor’s Ratings Group A2 BBB Fitch Ratings F2 BBB+
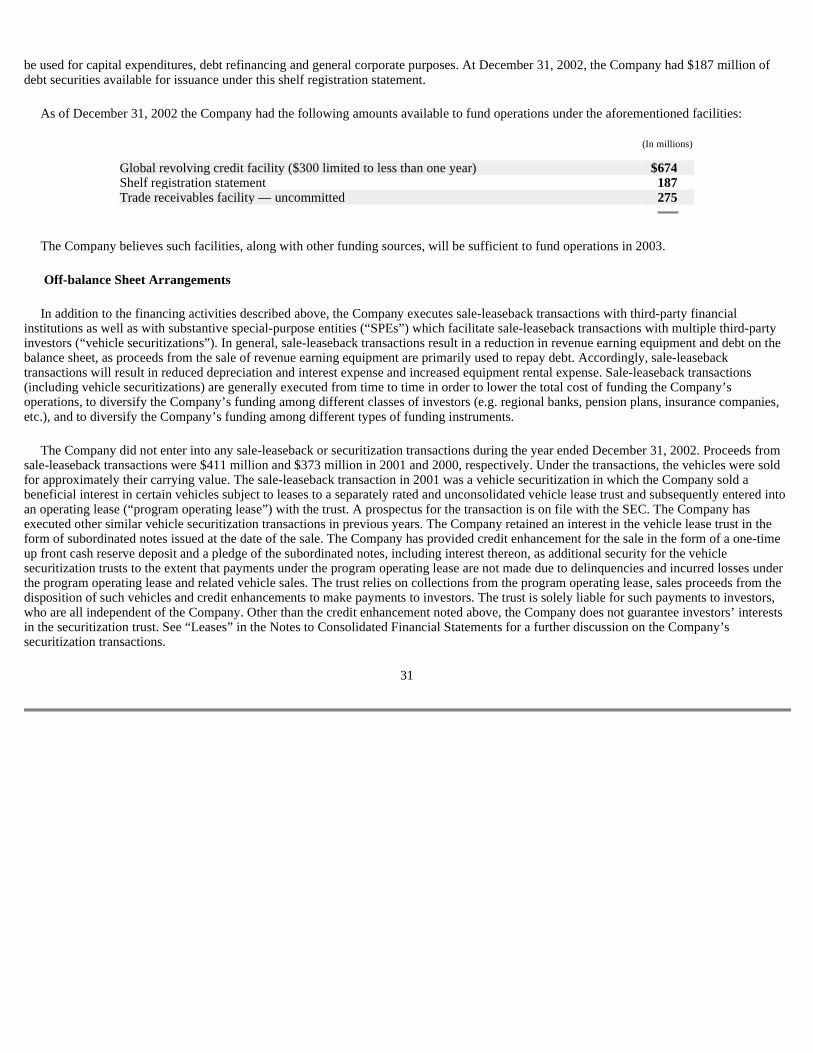
be used for capital expenditures, debt refinancing and general corporate purposes. At December 31, 2002, the Company had $187 million of debt securities available for issuance under this shelf registration statement.
As of December 31, 2002 the Company had the following amounts available to fund operations under the aforementioned facilities:
The Company believes such facilities, along with other funding sources, will be sufficient to fund operations in 2003.
Off-balance Sheet Arrangements
In addition to the financing activities described above, the Company executes sale-leaseback transactions with third-party financial institutions as well as with substantive special-purpose entities (“SPEs”) which facilitate sale-leaseback transactions with multiple third-party investors (“vehicle securitizations”). In general, sale-leaseback transactions result in a reduction in revenue earning equipment and debt on the balance sheet, as proceeds from the sale of revenue earning equipment are primarily used to repay debt. Accordingly, sale-leaseback transactions will result in reduced depreciation and interest expense and increased equipment rental expense. Sale-leaseback transactions (including vehicle securitizations) are generally executed from time to time in order to lower the total cost of funding the Company’s operations, to diversify the Company’s funding among different classes of investors (e.g. regional banks, pension plans, insurance companies, etc.), and to diversify the Company’s funding among different types of funding instruments.
The Company did not enter into any sale-leaseback or securitization transactions during the year ended December 31, 2002. Proceeds from sale-leaseback transactions were $411 million and $373 million in 2001 and 2000, respectively. Under the transactions, the vehicles were sold for approximately their carrying value. The sale-leaseback transaction in 2001 was a vehicle securitization in which the Company sold a beneficial interest in certain vehicles subject to leases to a separately rated and unconsolidated vehicle lease trust and subsequently entered into an operating lease (“program operating lease”) with the trust. A prospectus for the transaction is on file with the SEC. The Company has executed other similar vehicle securitization transactions in previous years. The Company retained an interest in the vehicle lease trust in the form of subordinated notes issued at the date of the sale. The Company has provided credit enhancement for the sale in the form of a one-time up front cash reserve deposit and a pledge of the subordinated notes, including interest thereon, as additional security for the vehicle securitization trusts to the extent that payments under the program operating lease are not made due to delinquencies and incurred losses under the program operating lease and related vehicle sales. The trust relies on collections from the program operating lease, sales proceeds from the disposition of such vehicles and credit enhancements to make payments to investors. The trust is solely liable for such payments to investors, who are all independent of the Company. Other than the credit enhancement noted above, the Company does not guarantee investors’ interests in the securitization trust. See “Leases” in the Notes to Consolidated Financial Statements for a further discussion on the Company’s securitization transactions.
31
(In millions)
Global revolving credit facility ($300 limited to less than one year) $ 674 Shelf registration statement 187 Trade receivables facility — uncommitted 275

The following table summarizes the Company’s undiscounted on and off-balance sheet contractual cash obligations and contingent rentals at December 31, 2002:
Guarantees
In the ordinary course of business, the Company provides certain guarantees or indemnifications to third parties as part of certain lease, financing and sales agreements. Certain guarantees and indemnifications, whereby the Company may be contingently required to make a payment to a third-party, are required to be disclosed even if the likelihood of payment is considered remote. The Company’s financial guarantees as of December 31, 2002 consisted of the following:
32
2003 2004 2005 2006 2007 Thereafter Total
(In thousands)
Long-term debt $ 139,769 165,490 208,438 383,458 235,761 347,787 1,480,703 Capital leases 22,600 37,960 9,912 293 — — 70,765 Total debt 162,369 203,450 218,350 383,751 235,761 347,787 1,551,468 Operating leases (a) 297,964 128,679 75,079 53,914 41,650 56,393 653,679 Total contractual cash
obligations 460,333 332,129 293,429 437,665 277,411 404,180 2,205,147 Contingent rentals (b) 101,898 89,371 65,805 29,077 6,608 690 293,449 Total $ 562,231 421,500 359,234 466,742 284,019 404,870 2,498,596
(a) The amounts in the previous table are based upon the assumption that revenue earning equipment will remain on lease for the length of time specified by the respective lease agreements. No effect has been given to renewals, cancellations, contingent rentals or future rate changes, except as described below for vehicle securitization transactions.
(b) Contingent rentals relate to the Company’s vehicle securitization transactions. The timing and amount of payment of rent by the Company for securitized vehicles is dependent on the
timing and amount of payments received from the Company’s customers for use of such vehicles, as stipulated by the program operating lease. For purposes of this presentation, the Company has assumed that the full monthly payment for each vehicle is received from the customer exactly when such payment is due, and that there are no defaults, prepayments or early termination of leases between the Company and its customers. Contingent rentals in the table above are estimated based upon this assumption. The actual amount and timing of contingent rentals due by the Company may vary from that assumed above.
Maximum exposure Carrying amount
Guarantee of guarantee of liability
(In millions)
Vehicle residual value guarantees: Sale and leaseback arrangements — end of term guarantees (a) $ 203 19 Finance lease program 4 1 Used vehicle financing 7 4 Standby letters of credit 15 — Total $ 229 24
(a) Amounts exclude contingent rentals associated with residual value guarantees on certain vehicles held under operating leases for which the guarantees are conditional upon early termination of the lease agreement as a result of a vehicle disposal. The Company’s maximum exposure for early lease termination guarantees was approximately $184 million, with $9 million recorded as a liability at December 31, 2002.
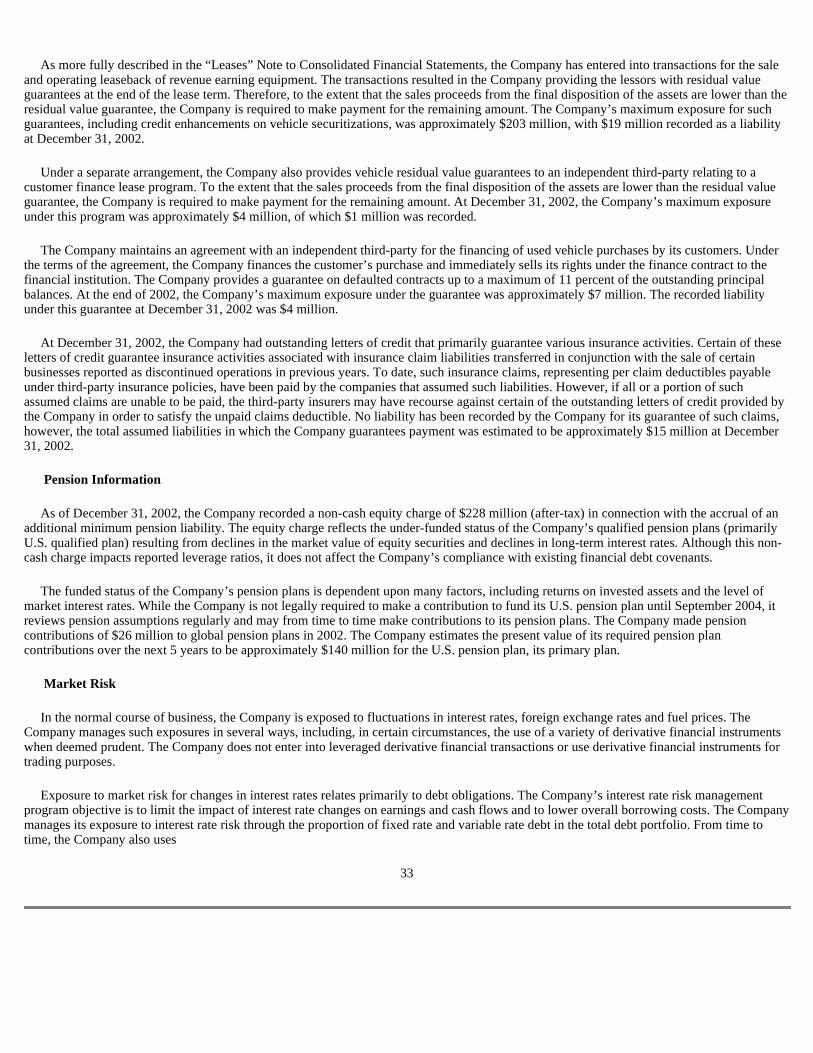
As more fully described in the “Leases” Note to Consolidated Financial Statements, the Company has entered into transactions for the sale and operating leaseback of revenue earning equipment. The transactions resulted in the Company providing the lessors with residual value guarantees at the end of the lease term. Therefore, to the extent that the sales proceeds from the final disposition of the assets are lower than the residual value guarantee, the Company is required to make payment for the remaining amount. The Company’s maximum exposure for such guarantees, including credit enhancements on vehicle securitizations, was approximately $203 million, with $19 million recorded as a liability at December 31, 2002.
Under a separate arrangement, the Company also provides vehicle residual value guarantees to an independent third-party relating to a customer finance lease program. To the extent that the sales proceeds from the final disposition of the assets are lower than the residual value guarantee, the Company is required to make payment for the remaining amount. At December 31, 2002, the Company’s maximum exposure under this program was approximately $4 million, of which $1 million was recorded.
The Company maintains an agreement with an independent third-party for the financing of used vehicle purchases by its customers. Under the terms of the agreement, the Company finances the customer’s purchase and immediately sells its rights under the finance contract to the financial institution. The Company provides a guarantee on defaulted contracts up to a maximum of 11 percent of the outstanding principal balances. At the end of 2002, the Company’s maximum exposure under the guarantee was approximately $7 million. The recorded liability under this guarantee at December 31, 2002 was $4 million.
At December 31, 2002, the Company had outstanding letters of credit that primarily guarantee various insurance activities. Certain of these letters of credit guarantee insurance activities associated with insurance claim liabilities transferred in conjunction with the sale of certain businesses reported as discontinued operations in previous years. To date, such insurance claims, representing per claim deductibles payable under third-party insurance policies, have been paid by the companies that assumed such liabilities. However, if all or a portion of such assumed claims are unable to be paid, the third-party insurers may have recourse against certain of the outstanding letters of credit provided by the Company in order to satisfy the unpaid claims deductible. No liability has been recorded by the Company for its guarantee of such claims, however, the total assumed liabilities in which the Company guarantees payment was estimated to be approximately $15 million at December 31, 2002.
Pension Information
As of December 31, 2002, the Company recorded a non-cash equity charge of $228 million (after-tax) in connection with the accrual of an additional minimum pension liability. The equity charge reflects the under-funded status of the Company’s qualified pension plans (primarily U.S. qualified plan) resulting from declines in the market value of equity securities and declines in long-term interest rates. Although this non-cash charge impacts reported leverage ratios, it does not affect the Company’s compliance with existing financial debt covenants.
The funded status of the Company’s pension plans is dependent upon many factors, including returns on invested assets and the level of market interest rates. While the Company is not legally required to make a contribution to fund its U.S. pension plan until September 2004, it reviews pension assumptions regularly and may from time to time make contributions to its pension plans. The Company made pension contributions of $26 million to global pension plans in 2002. The Company estimates the present value of its required pension plan contributions over the next 5 years to be approximately $140 million for the U.S. pension plan, its primary plan.
Market Risk
In the normal course of business, the Company is exposed to fluctuations in interest rates, foreign exchange rates and fuel prices. The Company manages such exposures in several ways, including, in certain circumstances, the use of a variety of derivative financial instruments when deemed prudent. The Company does not enter into leveraged derivative financial transactions or use derivative financial instruments for trading purposes.
Exposure to market risk for changes in interest rates relates primarily to debt obligations. The Company’s interest rate risk management program objective is to limit the impact of interest rate changes on earnings and cash flows and to lower overall borrowing costs. The Company manages its exposure to interest rate risk through the proportion of fixed rate and variable rate debt in the total debt portfolio. From time to time, the Company also uses
33
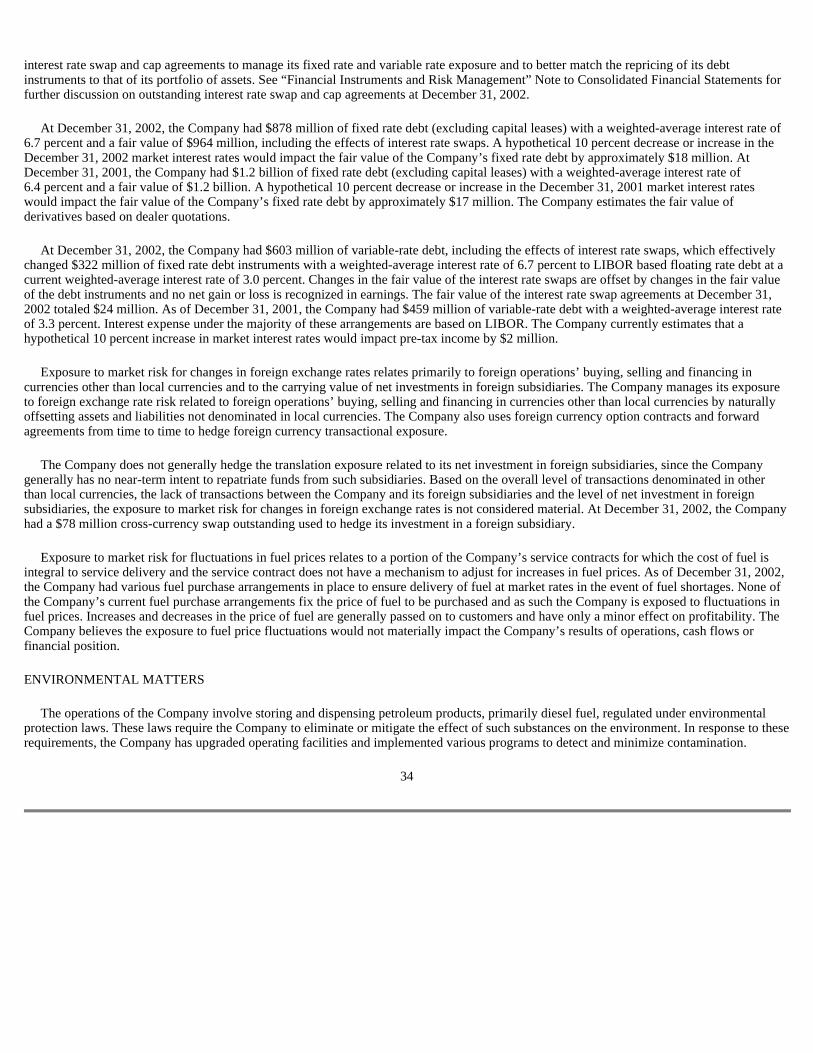
interest rate swap and cap agreements to manage its fixed rate and variable rate exposure and to better match the repricing of its debt instruments to that of its portfolio of assets. See “Financial Instruments and Risk Management” Note to Consolidated Financial Statements for further discussion on outstanding interest rate swap and cap agreements at December 31, 2002.
At December 31, 2002, the Company had $878 million of fixed rate debt (excluding capital leases) with a weighted-average interest rate of 6.7 percent and a fair value of $964 million, including the effects of interest rate swaps. A hypothetical 10 percent decrease or increase in the December 31, 2002 market interest rates would impact the fair value of the Company’s fixed rate debt by approximately $18 million. At December 31, 2001, the Company had $1.2 billion of fixed rate debt (excluding capital leases) with a weighted-average interest rate of 6.4 percent and a fair value of $1.2 billion. A hypothetical 10 percent decrease or increase in the December 31, 2001 market interest rates would impact the fair value of the Company’s fixed rate debt by approximately $17 million. The Company estimates the fair value of derivatives based on dealer quotations.
At December 31, 2002, the Company had $603 million of variable-rate debt, including the effects of interest rate swaps, which effectively changed $322 million of fixed rate debt instruments with a weighted-average interest rate of 6.7 percent to LIBOR based floating rate debt at a current weighted-average interest rate of 3.0 percent. Changes in the fair value of the interest rate swaps are offset by changes in the fair value of the debt instruments and no net gain or loss is recognized in earnings. The fair value of the interest rate swap agreements at December 31, 2002 totaled $24 million. As of December 31, 2001, the Company had $459 million of variable-rate debt with a weighted-average interest rate of 3.3 percent. Interest expense under the majority of these arrangements are based on LIBOR. The Company currently estimates that a hypothetical 10 percent increase in market interest rates would impact pre-tax income by $2 million.
Exposure to market risk for changes in foreign exchange rates relates primarily to foreign operations’ buying, selling and financing in currencies other than local currencies and to the carrying value of net investments in foreign subsidiaries. The Company manages its exposure to foreign exchange rate risk related to foreign operations’ buying, selling and financing in currencies other than local currencies by naturally offsetting assets and liabilities not denominated in local currencies. The Company also uses foreign currency option contracts and forward agreements from time to time to hedge foreign currency transactional exposure.
The Company does not generally hedge the translation exposure related to its net investment in foreign subsidiaries, since the Company generally has no near-term intent to repatriate funds from such subsidiaries. Based on the overall level of transactions denominated in other than local currencies, the lack of transactions between the Company and its foreign subsidiaries and the level of net investment in foreign subsidiaries, the exposure to market risk for changes in foreign exchange rates is not considered material. At December 31, 2002, the Company had a $78 million cross-currency swap outstanding used to hedge its investment in a foreign subsidiary.
Exposure to market risk for fluctuations in fuel prices relates to a portion of the Company’s service contracts for which the cost of fuel is integral to service delivery and the service contract does not have a mechanism to adjust for increases in fuel prices. As of December 31, 2002, the Company had various fuel purchase arrangements in place to ensure delivery of fuel at market rates in the event of fuel shortages. None of the Company’s current fuel purchase arrangements fix the price of fuel to be purchased and as such the Company is exposed to fluctuations in fuel prices. Increases and decreases in the price of fuel are generally passed on to customers and have only a minor effect on profitability. The Company believes the exposure to fuel price fluctuations would not materially impact the Company’s results of operations, cash flows or financial position.
ENVIRONMENTAL MATTERS
The operations of the Company involve storing and dispensing petroleum products, primarily diesel fuel, regulated under environmental protection laws. These laws require the Company to eliminate or mitigate the effect of such substances on the environment. In response to these requirements, the Company has upgraded operating facilities and implemented various programs to detect and minimize contamination.
34
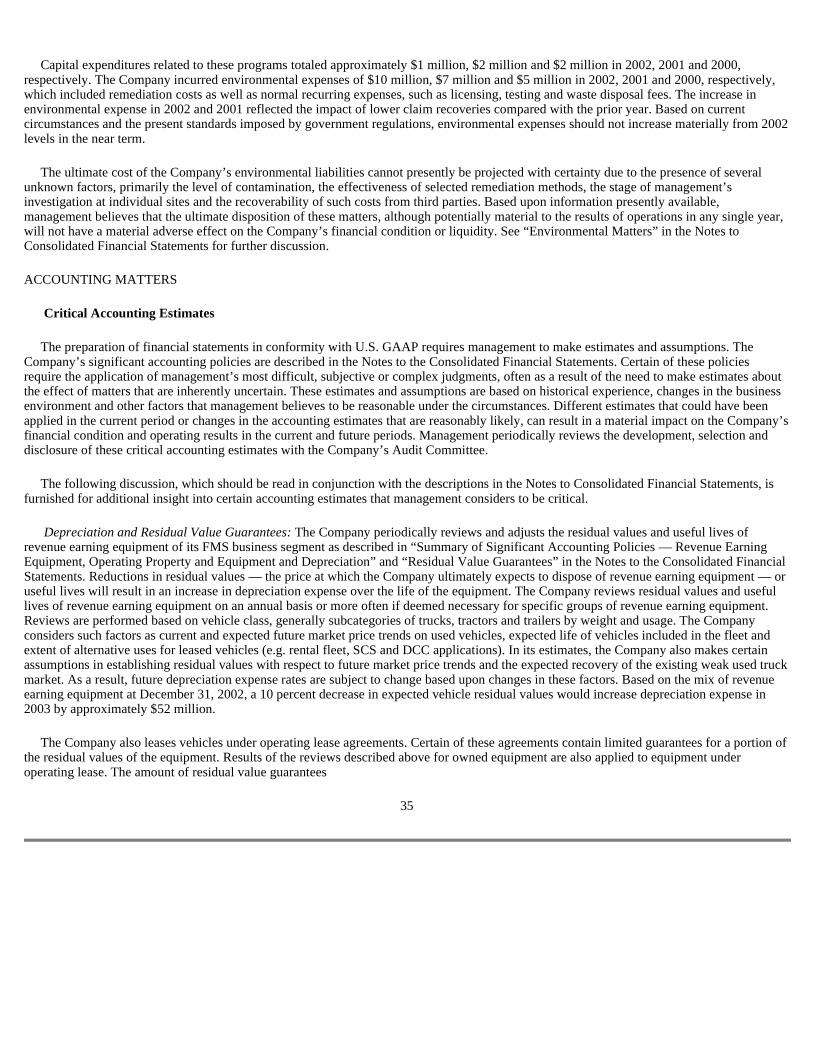
Capital expenditures related to these programs totaled approximately $1 million, $2 million and $2 million in 2002, 2001 and 2000, respectively. The Company incurred environmental expenses of $10 million, $7 million and $5 million in 2002, 2001 and 2000, respectively, which included remediation costs as well as normal recurring expenses, such as licensing, testing and waste disposal fees. The increase in environmental expense in 2002 and 2001 reflected the impact of lower claim recoveries compared with the prior year. Based on current circumstances and the present standards imposed by government regulations, environmental expenses should not increase materially from 2002 levels in the near term.
The ultimate cost of the Company’s environmental liabilities cannot presently be projected with certainty due to the presence of several unknown factors, primarily the level of contamination, the effectiveness of selected remediation methods, the stage of management’s investigation at individual sites and the recoverability of such costs from third parties. Based upon information presently available, management believes that the ultimate disposition of these matters, although potentially material to the results of operations in any single year, will not have a material adverse effect on the Company’s financial condition or liquidity. See “Environmental Matters” in the Notes to Consolidated Financial Statements for further discussion.
ACCOUNTING MATTERS
Critical Accounting Estimates
The preparation of financial statements in conformity with U.S. GAAP requires management to make estimates and assumptions. The Company’s significant accounting policies are described in the Notes to the Consolidated Financial Statements. Certain of these policies require the application of management’s most difficult, subjective or complex judgments, often as a result of the need to make estimates about the effect of matters that are inherently uncertain. These estimates and assumptions are based on historical experience, changes in the business environment and other factors that management believes to be reasonable under the circumstances. Different estimates that could have been applied in the current period or changes in the accounting estimates that are reasonably likely, can result in a material impact on the Company’s financial condition and operating results in the current and future periods. Management periodically reviews the development, selection and disclosure of these critical accounting estimates with the Company’s Audit Committee.
The following discussion, which should be read in conjunction with the descriptions in the Notes to Consolidated Financial Statements, is furnished for additional insight into certain accounting estimates that management considers to be critical.
Depreciation and Residual Value Guarantees: The Company periodically reviews and adjusts the residual values and useful lives of revenue earning equipment of its FMS business segment as described in “Summary of Significant Accounting Policies — Revenue Earning Equipment, Operating Property and Equipment and Depreciation” and “Residual Value Guarantees” in the Notes to the Consolidated Financial Statements. Reductions in residual values — the price at which the Company ultimately expects to dispose of revenue earning equipment — or useful lives will result in an increase in depreciation expense over the life of the equipment. The Company reviews residual values and useful lives of revenue earning equipment on an annual basis or more often if deemed necessary for specific groups of revenue earning equipment. Reviews are performed based on vehicle class, generally subcategories of trucks, tractors and trailers by weight and usage. The Company considers such factors as current and expected future market price trends on used vehicles, expected life of vehicles included in the fleet and extent of alternative uses for leased vehicles (e.g. rental fleet, SCS and DCC applications). In its estimates, the Company also makes certain assumptions in establishing residual values with respect to future market price trends and the expected recovery of the existing weak used truck market. As a result, future depreciation expense rates are subject to change based upon changes in these factors. Based on the mix of revenue earning equipment at December 31, 2002, a 10 percent decrease in expected vehicle residual values would increase depreciation expense in 2003 by approximately $52 million.
The Company also leases vehicles under operating lease agreements. Certain of these agreements contain limited guarantees for a portion of the residual values of the equipment. Results of the reviews described above for owned equipment are also applied to equipment under operating lease. The amount of residual value guarantees
35
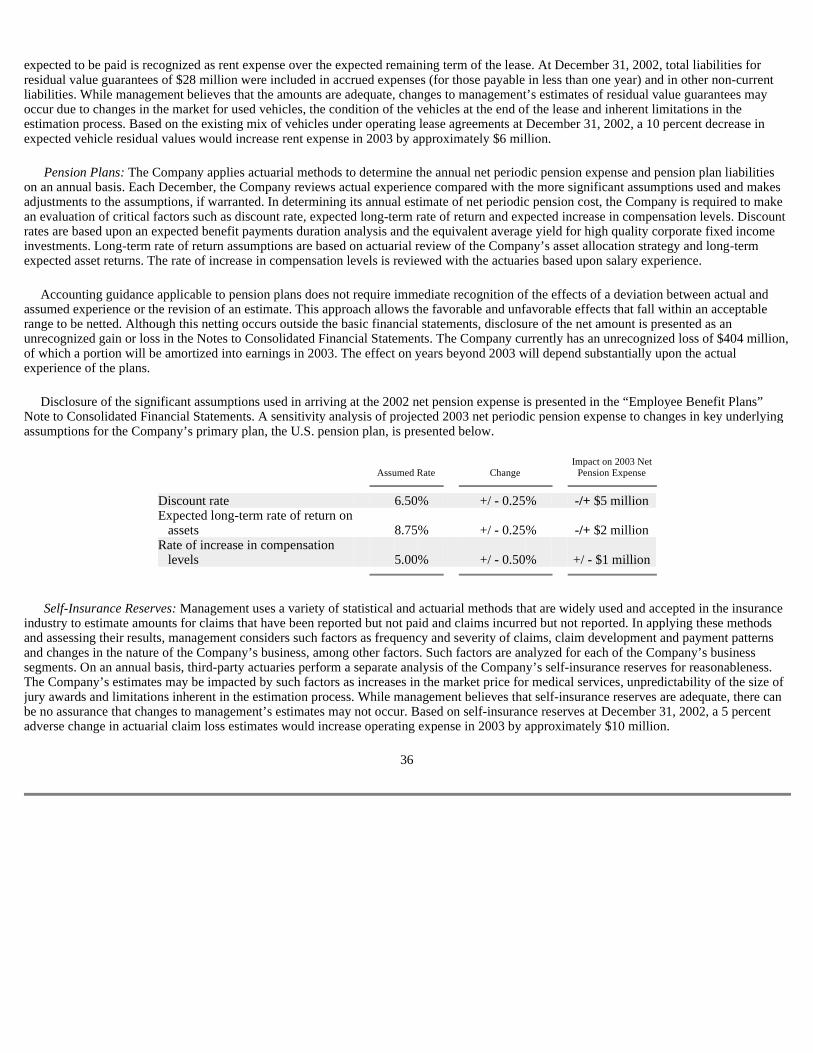
expected to be paid is recognized as rent expense over the expected remaining term of the lease. At December 31, 2002, total liabilities for residual value guarantees of $28 million were included in accrued expenses (for those payable in less than one year) and in other non-current liabilities. While management believes that the amounts are adequate, changes to management’s estimates of residual value guarantees may occur due to changes in the market for used vehicles, the condition of the vehicles at the end of the lease and inherent limitations in the estimation process. Based on the existing mix of vehicles under operating lease agreements at December 31, 2002, a 10 percent decrease in expected vehicle residual values would increase rent expense in 2003 by approximately $6 million.
Pension Plans: The Company applies actuarial methods to determine the annual net periodic pension expense and pension plan liabilities on an annual basis. Each December, the Company reviews actual experience compared with the more significant assumptions used and makes adjustments to the assumptions, if warranted. In determining its annual estimate of net periodic pension cost, the Company is required to make an evaluation of critical factors such as discount rate, expected long-term rate of return and expected increase in compensation levels. Discount rates are based upon an expected benefit payments duration analysis and the equivalent average yield for high quality corporate fixed income investments. Long-term rate of return assumptions are based on actuarial review of the Company’s asset allocation strategy and long-term expected asset returns. The rate of increase in compensation levels is reviewed with the actuaries based upon salary experience.
Accounting guidance applicable to pension plans does not require immediate recognition of the effects of a deviation between actual and assumed experience or the revision of an estimate. This approach allows the favorable and unfavorable effects that fall within an acceptable range to be netted. Although this netting occurs outside the basic financial statements, disclosure of the net amount is presented as an unrecognized gain or loss in the Notes to Consolidated Financial Statements. The Company currently has an unrecognized loss of $404 million, of which a portion will be amortized into earnings in 2003. The effect on years beyond 2003 will depend substantially upon the actual experience of the plans.
Disclosure of the significant assumptions used in arriving at the 2002 net pension expense is presented in the “Employee Benefit Plans” Note to Consolidated Financial Statements. A sensitivity analysis of projected 2003 net periodic pension expense to changes in key underlying assumptions for the Company’s primary plan, the U.S. pension plan, is presented below.
Self-Insurance Reserves: Management uses a variety of statistical and actuarial methods that are widely used and accepted in the insurance industry to estimate amounts for claims that have been reported but not paid and claims incurred but not reported. In applying these methods and assessing their results, management considers such factors as frequency and severity of claims, claim development and payment patterns and changes in the nature of the Company’s business, among other factors. Such factors are analyzed for each of the Company’s business segments. On an annual basis, third-party actuaries perform a separate analysis of the Company’s self-insurance reserves for reasonableness. The Company’s estimates may be impacted by such factors as increases in the market price for medical services, unpredictability of the size of jury awards and limitations inherent in the estimation process. While management believes that self-insurance reserves are adequate, there can be no assurance that changes to management’s estimates may not occur. Based on self-insurance reserves at December 31, 2002, a 5 percent adverse change in actuarial claim loss estimates would increase operating expense in 2003 by approximately $10 million.
36
Impact on 2003 Net Assumed Rate Change Pension Expense
Discount rate 6.50 % +/ - 0.25 % -/+ $5 million Expected long-term rate of return on
assets 8.75 % +/ - 0.25 % -/+ $2 million Rate of increase in compensation
levels 5.00 % +/ - 0.50 % +/ - $1 million

Goodwill Impairment: The Company assesses goodwill for impairment, as described in “Summary of Significant Accounting Policies — Goodwill and Other Intangible Assets” Note to Consolidated Financial Statements, on an annual basis or more often if deemed necessary. To determine whether goodwill impairment indicators exist, the Company is required to assess the fair value of the reporting unit and compare it to the carrying value. A reporting unit is a component of an operating segment for which discrete financial information is available and management regularly reviews its operating performance. The Company’s valuation of fair value for each reporting unit is determined based on a discounted future cash flow model. Estimates of future cash flows are dependent on management’s knowledge and experience about past and current events and assumptions about conditions it expects to exist. These assumptions are based on a number of factors including future operating performance, economic conditions and actions management expects to take. While management believes its estimates of future cash flows are reasonable, there can be no assurance that a deterioration in economic conditions or adverse changes to expectations of future performance will not occur, resulting in a goodwill impairment loss. At December 31, 2002, the total amount of goodwill was $151 million.
Income Taxes: The Company records a valuation allowance for deferred income tax assets to reduce such assets to amounts expected to be realized. In determining the required level of the valuation allowance, the Company considers whether it is more likely than not that all or some portion of deferred tax assets will not be realized. This assessment is based on management’s expectations as to whether sufficient taxable income of an appropriate character will be realized within tax carryback and carryforward periods. Should the Company change its estimate of the amount of its deferred tax assets that it would be able to realize, an adjustment to the valuation allowance would result in an increase or decrease to provision for income taxes in the period such a change in estimate was made. At December 31, 2002, the deferred tax valuation allowance principally attributed to foreign tax loss carryforwards in the SCS business segment was $14 million.
Recent Accounting Pronouncements
In June 2001, the FASB issued SFAS No. 143, “Accounting for Asset Retirement Obligations,” which requires entities to record the fair value of a liability for an asset retirement obligation in the period in which it incurs a legal obligation associated with the retirement of tangible long-lived assets that result from the acquisition, construction, development and/or normal use of the assets. When the liability is initially recorded, the Company is required to capitalize a cost by increasing the carrying amount of the related long-lived asset. Over time, the liability is accreted to its present value each period, and the capitalized cost is depreciated over the useful life of the related asset. SFAS No. 143 is effective for fiscal years beginning after June 15, 2002 and will be adopted by the Company effective January 1, 2003. The Company believes the adoption of SFAS No. 143 will not have a significant impact on its results of operations, cash flows or financial position.
In July 2002, the FASB issued SFAS No. 146, “Accounting for Costs Associated with Exit or Disposal Activities.” The standard requires companies to recognize costs associated with exit (including restructuring) or disposal activities at fair value when they are incurred rather than at the date of a commitment to an exit or disposal plan under current practice. Costs covered by the standard include certain contract termination costs, certain employee termination benefits and other costs to consolidate or close facilities and relocate employees that are associated with an exit activity or disposal of long-lived assets. The new requirements are effective prospectively for exit or disposal activities initiated after December 31, 2002 and will be adopted by the Company effective January 1, 2003. The adoption of SFAS No. 146 is expected to impact the timing of recognition of costs associated with future exit and disposal activities.
In November 2002, the FASB issued Financial Interpretation (“FIN”) No. 45, “Guarantor’s Accounting Disclosure Requirements for Guarantees, Including Indirect Guarantees of Indebtedness of Others.” FIN No. 45 clarifies that a guarantor is required to recognize, at the inception of a guarantee, a liability for the fair value of the obligation undertaken in issuing the guarantee. The initial recognition and initial measurement provisions of FIN No. 45 are applicable on a prospective basis to guarantees issued or modified after December 31, 2002. The disclosure requirements of FIN No. 45 are applicable for financial statements of interim or annual periods ending after December 15, 2002, which is included in the “Guarantees” Note to Consolidated Financial Statements.
37
In December 2002, the FASB issued SFAS No. 148, “Accounting for Stock-Based Compensation-Transition and Disclosure, an amendment of FASB Statement No. 123.” This Statement amends methods of transition for a voluntary change to the fair value method of accounting for stock-based employee compensation. In addition, this Statement amends the disclosure requirements of Statement No. 123 to require prominent disclosures in both annual and interim financial statements. Certain of the disclosure modifications are required for fiscal years ending after December 15, 2002 and are included in the Notes to Consolidated Financial Statements.
In January 2003, the FASB issued FIN No. 46, “Consolidation of Variable Interest Entities” that establishes accounting guidance for identifying variable interest entities (VIEs), including special-purpose entities, and when to include the assets, liabilities, noncontrolling interests and results of activities of VIEs in an enterprise’s consolidated financial statements. FIN No. 46 requires consolidation of VIEs if the primary beneficiary has a variable interest (or combination of variable interests) that will absorb a majority of the entity’s expected losses if the they occur, receive a majority of the entity’s expected residual returns if they occur, or both. The enterprise consolidating the VIE is the primary beneficiary of that entity. FIN No. 46 will be effective immediately for variable interests in VIEs created after January 31, 2003. For a variable interest in a VIE created before February 1, 2003, the recognition provisions of FIN No. 46 shall apply (other than the required disclosures prior to the effective date) to that entity as of the interim period beginning after June 15, 2003.
The Company expects, as a result of the initial recognition provisions of FIN No. 46, to consolidate three VIEs effective July 1, 2003. These VIEs resulted from sale-leaseback transactions entered into in previous years — see “Off-balance Sheet Arrangements” for further discussion on these transactions. The carrying value of the assets and liabilities as of December 31, 2002, attributed to these unconsolidated VIEs was approximately $519 million and $461 million, respectively. The Company’s maximum exposure to loss, at December 31, 2002, as a result of its involvement in these VIEs is approximately $112 million.
For further details regarding the above recent accounting pronouncements, see “Summary of Significant Accounting Policies — Recent Accounting Pronouncements” in the Notes to Consolidated Financial Statements.
Other Accounting Matters
In January 2001, the Company revised its vacation policy in the U.S. Starting January 1, 2001, employees earn vacation based on the calendar year rather than their anniversary date. Additionally, unused earned vacation may not be carried forward into the next calendar year. At December 31, 2000, the Company’s vacation accrual for U.S. employees was approximately $22 million. As a result of the policy change, the balance was approximately $3 million at December 31, 2001 and represents vacation accrual for California and union employees where local law or contractual terms did not permit the adoption of the revised policy.
FORWARD-LOOKING STATEMENTS
This Annual Report contains “forward-looking statements” within the meaning of the Private Securities Litigation Reform Act of 1995. These statements are based on the Company’s current plans and expectations and involve risks and uncertainties that may cause actual results to differ materially from the forward-looking statements. Generally, the words “believe,” “expect,” “intend,” “estimate,” “anticipate,” “will,” “may” and similar expressions identify forward-looking statements.
Important factors that could cause such differences include, among others: general economic conditions in the U.S. and worldwide; the market for the Company’s used equipment; the highly competitive environment applicable to the Company’s operations (including competition in supply chain solutions from other logistics companies as well as from air cargo, shippers, railroads and motor carriers and competition in full service leasing and commercial rental from companies providing similar services as well as truck and trailer manufacturers that provide leasing, extended warranty maintenance, rental and other transportation services); greater than expected expenses associated with the Company’s activities (including increased cost of fuel, freight and transportation) or personnel needs; availability of equipment; adverse changes in debt ratings; changes in accounting assumptions; changes in customers’ business environments (or the loss of a significant customer) or changes in government regulations.
38

The risks included here are not exhaustive. New risk factors emerge from time to time and it is not possible for management to predict all such risk factors or to assess the impact of such risk factors on the Company’s business. Accordingly, the Company undertakes no obligation to publicly update or revise any forward-looking statements, whether as a result of new information, future events or otherwise.
39
ITEM 7A. QUANTITATIVE AND QUALITATIVE DISCLOSURES ABOUT MARKET RISK
The information required by ITEM 7A is included in ITEM 7 (pages 33 through 34) of PART II of this report.
ITEM 8. FINANCIAL STATEMENTS AND SUPPLEMENTARY DATA
FINANCIAL STATEMENTS
All other schedules are omitted because they are not applicable or the required information is shown in the consolidated financial statements or notes thereto.
40
Page No.
Independent Auditors’ Report 41 Consolidated Statements of Earnings 42 Consolidated Balance Sheets 43 Consolidated Statements of Cash Flows 44 Consolidated Statements of Shareholders’ Equity 45 Notes to Consolidated Financial Statements 46 Supplementary Data 80
Consolidated Financial Statement Schedule for the Years Ended December 31,
2002, 2001 and 2000: II — Valuation and Qualifying Accounts 81
INDEPENDENT AUDITORS’ REPORT
THE BOARD OF DIRECTORS AND SHAREHOLDERS OF RYDER SYSTEM, INC.:
We have audited the consolidated financial statements of Ryder System, Inc. and subsidiaries as listed in the accompanying index. In connection with our audits of the consolidated financial statements, we also have audited the consolidated financial statement schedule listed in the accompanying index. These consolidated financial statements and the consolidated financial statement schedule are the responsibility of the Company’s management. Our responsibility is to express an opinion on these consolidated financial statements and consolidated financial statement schedule based on our audits.
We conducted our audits in accordance with auditing standards generally accepted in the United States of America. Those standards require that we plan and perform the audit to obtain reasonable assurance about whether the financial statements are free of material misstatement. An audit includes examining, on a test basis, evidence supporting the amounts and disclosures in the financial statements. An audit also includes assessing the accounting principles used and significant estimates made by management, as well as evaluating the overall financial statement presentation. We believe that our audits provide a reasonable basis for our opinion.
In our opinion, the consolidated financial statements referred to above present fairly, in all material respects, the financial position of Ryder System, Inc. and subsidiaries as of December 31, 2002 and 2001, and the results of their operations and their cash flows for each of the years in the three-year period ended December 31, 2002, in conformity with accounting principles generally accepted in the United States of America. Also in our opinion, the related consolidated financial statement schedule, when considered in relation to the basic consolidated financial statements taken as a whole, presents fairly, in all material respects, the information set forth therein.
As discussed in the notes to the consolidated financial statements, the Company changed its method of accounting for goodwill and other intangible assets in 2002.
/s/ KPMG LLP
Miami, Florida February 6, 2003
41
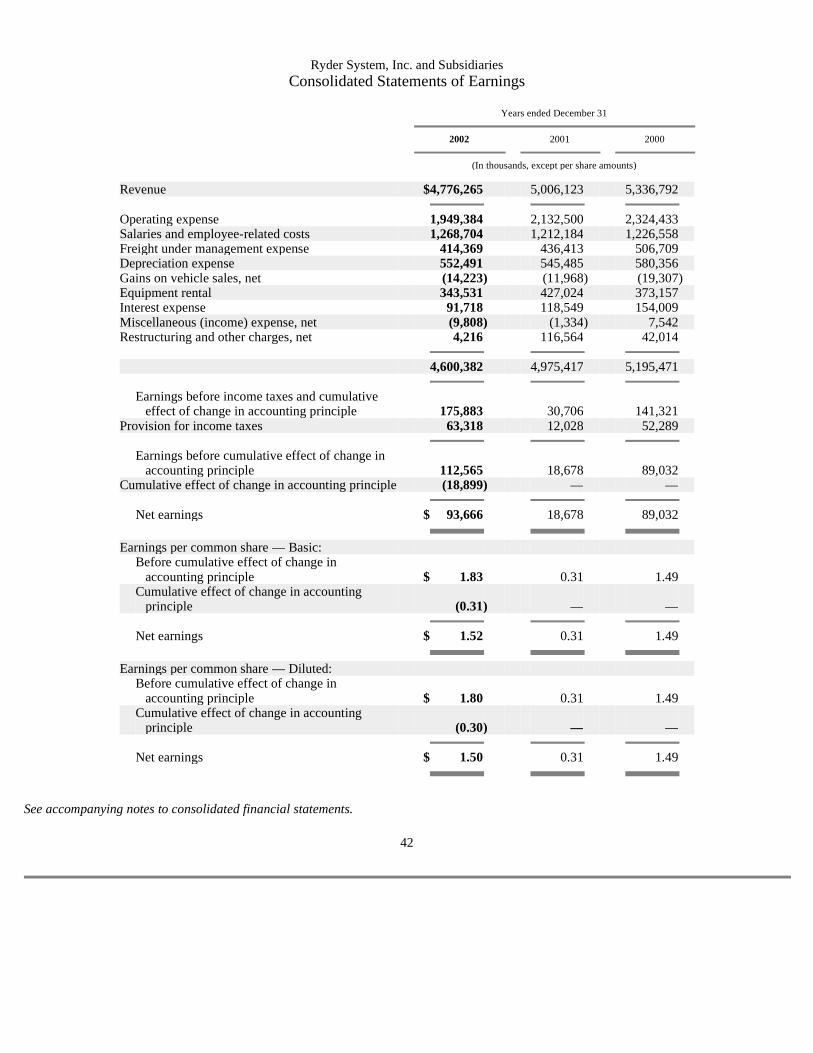
Ryder System, Inc. and Subsidiaries Consolidated Statements of Earnings
See accompanying notes to consolidated financial statements.
42
Years ended December 31
2002 2001 2000
(In thousands, except per share amounts)
Revenue $ 4,776,265 5,006,123 5,336,792 Operating expense 1,949,384 2,132,500 2,324,433 Salaries and employee-related costs 1,268,704 1,212,184 1,226,558 Freight under management expense 414,369 436,413 506,709 Depreciation expense 552,491 545,485 580,356 Gains on vehicle sales, net (14,223 ) (11,968 ) (19,307 ) Equipment rental 343,531 427,024 373,157 Interest expense 91,718 118,549 154,009 Miscellaneous (income) expense, net (9,808 ) (1,334 ) 7,542 Restructuring and other charges, net 4,216 116,564 42,014 4,600,382 4,975,417 5,195,471
Earnings before income taxes and cumulative
effect of change in accounting principle 175,883 30,706 141,321 Provision for income taxes 63,318 12,028 52,289
Earnings before cumulative effect of change in
accounting principle 112,565 18,678 89,032 Cumulative effect of change in accounting principle (18,899 ) — — Net earnings $ 93,666 18,678 89,032 Earnings per common share — Basic:
Before cumulative effect of change in
accounting principle $ 1.83 0.31 1.49
Cumulative effect of change in accounting
principle (0.31 ) — — Net earnings $ 1.52 0.31 1.49 Earnings per common share — Diluted:
Before cumulative effect of change in
accounting principle $ 1.80 0.31 1.49
Cumulative effect of change in accounting
principle (0.30 ) — — Net earnings $ 1.50 0.31 1.49
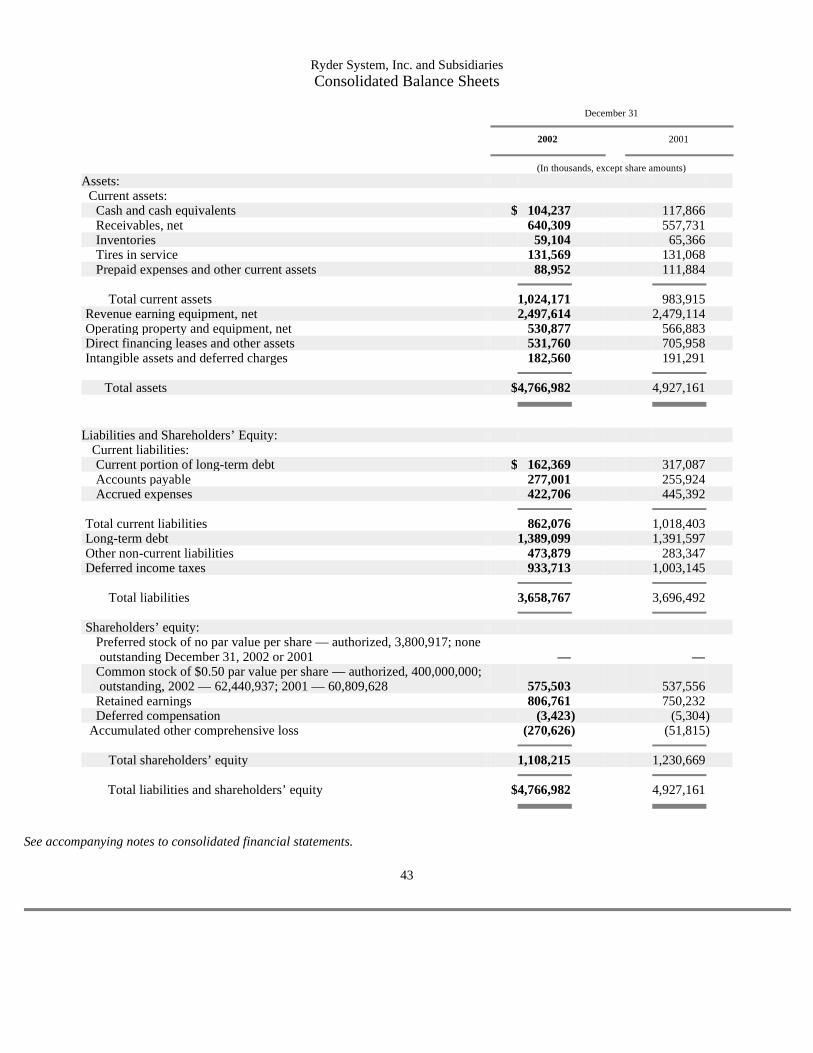
Ryder System, Inc. and Subsidiaries Consolidated Balance Sheets
See accompanying notes to consolidated financial statements.
43
December 31
2002 2001
(In thousands, except share amounts)
Assets: Current assets: Cash and cash equivalents $ 104,237 117,866 Receivables, net 640,309 557,731 Inventories 59,104 65,366 Tires in service 131,569 131,068 Prepaid expenses and other current assets 88,952 111,884 Total current assets 1,024,171 983,915 Revenue earning equipment, net 2,497,614 2,479,114 Operating property and equipment, net 530,877 566,883 Direct financing leases and other assets 531,760 705,958 Intangible assets and deferred charges 182,560 191,291 Total assets $ 4,766,982 4,927,161 Liabilities and Shareholders’ Equity: Current liabilities: Current portion of long-term debt $ 162,369 317,087 Accounts payable 277,001 255,924 Accrued expenses 422,706 445,392 Total current liabilities 862,076 1,018,403 Long-term debt 1,389,099 1,391,597 Other non-current liabilities 473,879 283,347 Deferred income taxes 933,713 1,003,145 Total liabilities 3,658,767 3,696,492 Shareholders’ equity:
Preferred stock of no par value per share — authorized, 3,800,917; none
outstanding December 31, 2002 or 2001 — —
Common stock of $0.50 par value per share — authorized, 400,000,000;
outstanding, 2002 — 62,440,937; 2001 — 60,809,628 575,503 537,556 Retained earnings 806,761 750,232 Deferred compensation (3,423 ) (5,304 ) Accumulated other comprehensive loss (270,626 ) (51,815 ) Total shareholders’ equity 1,108,215 1,230,669 Total liabilities and shareholders’ equity $ 4,766,982 4,927,161
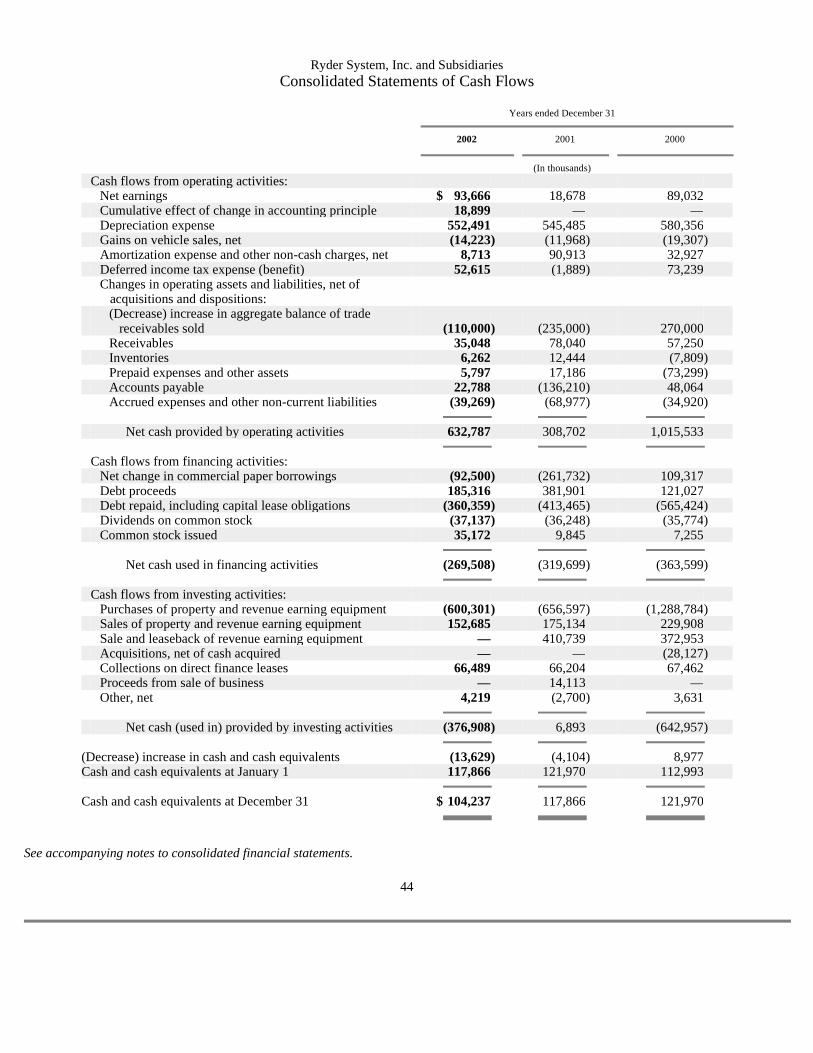
Ryder System, Inc. and Subsidiaries Consolidated Statements of Cash Flows
See accompanying notes to consolidated financial statements.
44
Years ended December 31
2002 2001 2000
(In thousands)
Cash flows from operating activities: Net earnings $ 93,666 18,678 89,032 Cumulative effect of change in accounting principle 18,899 — — Depreciation expense 552,491 545,485 580,356 Gains on vehicle sales, net (14,223 ) (11,968 ) (19,307 ) Amortization expense and other non-cash charges, net 8,713 90,913 32,927 Deferred income tax expense (benefit) 52,615 (1,889 ) 73,239
Changes in operating assets and liabilities, net of
acquisitions and dispositions:
(Decrease) increase in aggregate balance of trade
receivables sold (110,000 ) (235,000 ) 270,000 Receivables 35,048 78,040 57,250 Inventories 6,262 12,444 (7,809 ) Prepaid expenses and other assets 5,797 17,186 (73,299 ) Accounts payable 22,788 (136,210 ) 48,064 Accrued expenses and other non-current liabilities (39,269 ) (68,977 ) (34,920 ) Net cash provided by operating activities 632,787 308,702 1,015,533 Cash flows from financing activities: Net change in commercial paper borrowings (92,500 ) (261,732 ) 109,317 Debt proceeds 185,316 381,901 121,027 Debt repaid, including capital lease obligations (360,359 ) (413,465 ) (565,424 ) Dividends on common stock (37,137 ) (36,248 ) (35,774 ) Common stock issued 35,172 9,845 7,255 Net cash used in financing activities (269,508 ) (319,699 ) (363,599 ) Cash flows from investing activities: Purchases of property and revenue earning equipment (600,301 ) (656,597 ) (1,288,784 ) Sales of property and revenue earning equipment 152,685 175,134 229,908 Sale and leaseback of revenue earning equipment — 410,739 372,953 Acquisitions, net of cash acquired — — (28,127 ) Collections on direct finance leases 66,489 66,204 67,462 Proceeds from sale of business — 14,113 — Other, net 4,219 (2,700 ) 3,631 Net cash (used in) provided by investing activities (376,908 ) 6,893 (642,957 ) (Decrease) increase in cash and cash equivalents (13,629 ) (4,104 ) 8,977 Cash and cash equivalents at January 1 117,866 121,970 112,993 Cash and cash equivalents at December 31 $ 104,237 117,866 121,970
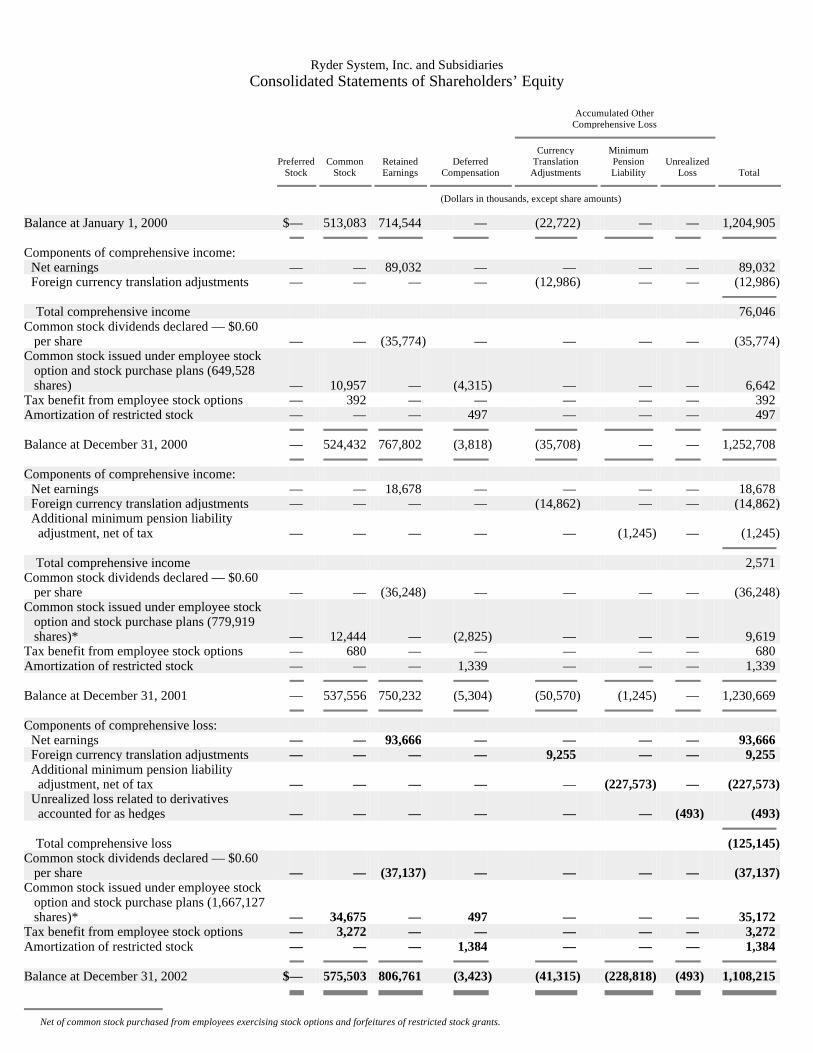
Ryder System, Inc. and Subsidiaries Consolidated Statements of Shareholders’ Equity
Accumulated Other Comprehensive Loss
Currency Minimum
Preferred Common Retained Deferred Translation Pension Unrealized Stock Stock Earnings Compensation Adjustments Liability Loss Total
(Dollars in thousands, except share amounts)
Balance at January 1, 2000 $ — 513,083 714,544 — (22,722 ) — — 1,204,905 Components of comprehensive income: Net earnings — — 89,032 — — — — 89,032 Foreign currency translation adjustments — — — — (12,986 ) — — (12,986 ) Total comprehensive income 76,046 Common stock dividends declared — $0.60
per share — — (35,774 ) — — — — (35,774 ) Common stock issued under employee stock
option and stock purchase plans (649,528 shares) — 10,957 — (4,315 ) — — — 6,642
Tax benefit from employee stock options — 392 — — — — — 392 Amortization of restricted stock — — — 497 — — — 497 Balance at December 31, 2000 — 524,432 767,802 (3,818 ) (35,708 ) — — 1,252,708 Components of comprehensive income: Net earnings — — 18,678 — — — — 18,678 Foreign currency translation adjustments — — — — (14,862 ) — — (14,862 )
Additional minimum pension liability
adjustment, net of tax — — — — — (1,245 ) — (1,245 ) Total comprehensive income 2,571 Common stock dividends declared — $0.60
per share — — (36,248 ) — — — — (36,248 ) Common stock issued under employee stock
option and stock purchase plans (779,919 shares)* — 12,444 — (2,825 ) — — — 9,619
Tax benefit from employee stock options — 680 — — — — — 680 Amortization of restricted stock — — — 1,339 — — — 1,339 Balance at December 31, 2001 — 537,556 750,232 (5,304 ) (50,570 ) (1,245 ) — 1,230,669 Components of comprehensive loss: Net earnings — — 93,666 — — — — 93,666 Foreign currency translation adjustments — — — — 9,255 — — 9,255
Additional minimum pension liability
adjustment, net of tax — — — — — (227,573 ) — (227,573 )
Unrealized loss related to derivatives
accounted for as hedges — — — — — — (493 ) (493 ) Total comprehensive loss (125,145 ) Common stock dividends declared — $0.60
per share — — (37,137 ) — — — — (37,137 ) Common stock issued under employee stock
option and stock purchase plans (1,667,127 shares)* — 34,675 — 497 — — — 35,172
Tax benefit from employee stock options — 3,272 — — — — — 3,272 Amortization of restricted stock — — — 1,384 — — — 1,384 Balance at December 31, 2002 $ — 575,503 806,761 (3,423 ) (41,315 ) (228,818 ) (493 ) 1,108,215
Net of common stock purchased from employees exercising stock options and forfeitures of restricted stock grants.

See accompanying notes to consolidated financial statements.
45
*
Ryder System, Inc. and Subsidiaries Notes to Consolidated Financial Statements
SUMMARY OF SIGNIFICANT ACCOUNTING POLICIES
Basis of Consolidation
The consolidated financial statements include the accounts of Ryder System, Inc. and its subsidiaries (the “Company”). All significant intercompany accounts and transactions have been eliminated.
Use of Estimates
The preparation of financial statements in conformity with accounting principles generally accepted in the United States of America requires management to make estimates and assumptions that affect the amounts reported in the financial statements and accompanying notes. Actual results could differ from those estimates.
Cash Equivalents
All investments in highly liquid debt instruments with maturities of three months or less at the date of purchase are classified as cash equivalents.
Revenue Recognition
The Company recognizes revenue when persuasive evidence of an arrangement exists, delivery has occurred, the revenue amount is fixed or determinable and collectibility is probable. Operating lease and rental revenue is recognized on a straight-line basis as vehicles are used over the terms of the related agreements. Lease and rental agreements do not provide for scheduled rent increases or escalations over the lease term. However, these lease agreements allow for rate changes based upon changes in the Consumer Price Index (CPI). Lease and rental agreements also provide for a fixed time charge plus a fixed per-mile charge. The fixed time charge, the fixed per-mile charge and the changes in rates attributed to changes in the CPI are considered contingent rentals and recognized in earnings as accruable. Direct financing lease revenue is recognized using the interest method over the terms of the lease agreements. Fuel services revenue is recognized when fuel is delivered to customers. Revenue from Supply Chain Solutions (SCS) and Dedicated Contract Carriage (DCC) contracts is recognized as services are provided at billing rates specified in the underlying contracts.
Allowance for Doubtful Accounts
Provisions for losses on customer receivables are generally determined according to the age of the receivables. The allowance is maintained at a level deemed appropriate based on loss experience and other factors affecting collectibility. Accounts are charged against the allowance for doubtful accounts when determined to be uncollectible.
Inventories
Inventories, which consist primarily of fuel, tires and vehicle parts, are valued using the lower of cost (specific identification or average cost) or market.
Tires in Service
The Company allocates a portion of the acquisition costs of revenue earning equipment to tires in service and amortizes such tire costs to expense over the lives of the vehicles and equipment. The cost of replacement tires and tire repairs are expensed as incurred.
Revenue Earning Equipment, Operating Property and Equipment and Depreciation
Revenue earning equipment, principally vehicles, and operating property and equipment are stated at cost. Revenue earning equipment and operating property and equipment under capital lease are stated at the lower of the present value of minimum lease payments or fair value. Vehicle repairs and maintenance that extend the life or increase the value of a vehicle are capitalized, whereas ordinary maintenance and repairs are expensed as incurred. Direct development costs incurred in connection with developing or obtaining internal use software are capitalized. Costs incurred during the preliminary project stage, as well as maintenance and training costs are expensed as incurred.
46
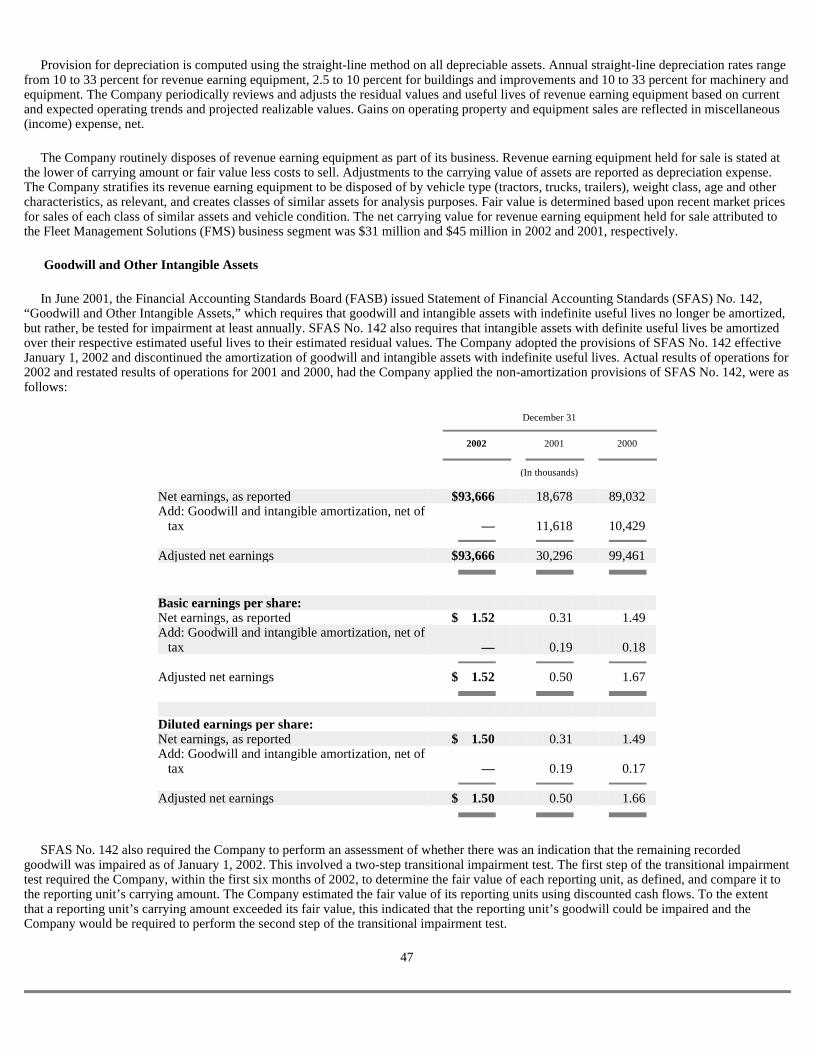
Provision for depreciation is computed using the straight-line method on all depreciable assets. Annual straight-line depreciation rates range from 10 to 33 percent for revenue earning equipment, 2.5 to 10 percent for buildings and improvements and 10 to 33 percent for machinery and equipment. The Company periodically reviews and adjusts the residual values and useful lives of revenue earning equipment based on current and expected operating trends and projected realizable values. Gains on operating property and equipment sales are reflected in miscellaneous (income) expense, net.
The Company routinely disposes of revenue earning equipment as part of its business. Revenue earning equipment held for sale is stated at the lower of carrying amount or fair value less costs to sell. Adjustments to the carrying value of assets are reported as depreciation expense. The Company stratifies its revenue earning equipment to be disposed of by vehicle type (tractors, trucks, trailers), weight class, age and other characteristics, as relevant, and creates classes of similar assets for analysis purposes. Fair value is determined based upon recent market prices for sales of each class of similar assets and vehicle condition. The net carrying value for revenue earning equipment held for sale attributed to the Fleet Management Solutions (FMS) business segment was $31 million and $45 million in 2002 and 2001, respectively.
Goodwill and Other Intangible Assets
In June 2001, the Financial Accounting Standards Board (FASB) issued Statement of Financial Accounting Standards (SFAS) No. 142, “Goodwill and Other Intangible Assets,” which requires that goodwill and intangible assets with indefinite useful lives no longer be amortized, but rather, be tested for impairment at least annually. SFAS No. 142 also requires that intangible assets with definite useful lives be amortized over their respective estimated useful lives to their estimated residual values. The Company adopted the provisions of SFAS No. 142 effective January 1, 2002 and discontinued the amortization of goodwill and intangible assets with indefinite useful lives. Actual results of operations for 2002 and restated results of operations for 2001 and 2000, had the Company applied the non-amortization provisions of SFAS No. 142, were as follows:
SFAS No. 142 also required the Company to perform an assessment of whether there was an indication that the remaining recorded goodwill was impaired as of January 1, 2002. This involved a two-step transitional impairment test. The first step of the transitional impairment test required the Company, within the first six months of 2002, to determine the fair value of each reporting unit, as defined, and compare it to the reporting unit’s carrying amount. The Company estimated the fair value of its reporting units using discounted cash flows. To the extent that a reporting unit’s carrying amount exceeded its fair value, this indicated that the reporting unit’s goodwill could be impaired and the Company would be required to perform the second step of the transitional impairment test.
47
December 31
2002 2001 2000
(In thousands)
Net earnings, as reported $ 93,666 18,678 89,032 Add: Goodwill and intangible amortization, net of
tax — 11,618 10,429 Adjusted net earnings $ 93,666 30,296 99,461 Basic earnings per share: Net earnings, as reported $ 1.52 0.31 1.49 Add: Goodwill and intangible amortization, net of
tax — 0.19 0.18 Adjusted net earnings $ 1.52 0.50 1.67 Diluted earnings per share: Net earnings, as reported $ 1.50 0.31 1.49 Add: Goodwill and intangible amortization, net of
tax — 0.19 0.17 Adjusted net earnings $ 1.50 0.50 1.66
The second step of the transitional impairment test required the Company to compare the implied fair value of the reporting unit’s goodwill, determined by allocating the reporting unit’s fair value to all of its recognized and unrecognized assets and liabilities in a manner similar to a purchase price allocation consistent with SFAS No. 141, “Business Combinations,” to its carrying amount, both of which would be measured as of January 1, 2002. The residual fair value after this allocation was the implicit fair value of the reporting unit’s goodwill.
In June 2002, the Company completed the assessment of all existing goodwill totaling $168 million as of January 1, 2002. As a result of this review, the Company recorded a non-cash charge of $19 million on a before and after-tax basis, or $0.30 per diluted share, associated with the Asian operations of the Company’s Supply Chain Solutions (SCS) business segment. The transitional impairment charge resulted from the application of the new impairment methodology introduced by SFAS No. 142. Prior to the adoption of SFAS No. 142, the Company measured the recoverability of goodwill based upon management’s best estimate of the undiscounted future operating cash flows (excluding interest charges) related to the asset. Under previous requirements, no goodwill impairment would have been recorded on January 1, 2002. In accordance with SFAS No. 142, the transitional impairment was recognized as the cumulative effect of a change in accounting principle in the Company’s Consolidated Statements of Earnings effective January 1, 2002. The impact of this accounting change had no effect on the Company’s operating earnings. The Company completed its annual impairment test for goodwill and intangible assets with indefinite useful lives as of April 1, 2002 and determined that there was no additional impairment. Impairment adjustments recognized after adoption are recognized as operating expenses.
Prior to the adoption of SFAS No. 142, goodwill, which represents the excess of purchase price over fair value of net assets acquired, was amortized on a straight-line basis over appropriate periods ranging from 10 to 40 years. Accumulated amortization was approximately $134 million at December 31, 2002 and 2001. Intangible assets were reviewed for impairment when circumstances indicated the carrying amount of assets may not have been recoverable. The amount of goodwill and other intangible asset impairment, if any, was measured based on projected future operating cash flows, discounted using a rate that reflects the Company’s average cost of funds.
Impairment of Long-Lived Assets
In August 2001, the FASB issued SFAS No. 144, “Accounting for the Impairment or Disposal of Long-Lived Assets.” SFAS No. 144 provides a single accounting model for long-lived assets to be disposed of. SFAS No. 144 also changes the criteria for classifying an asset held for sale; and broadens the scope of businesses to be disposed of that qualify for reporting as discontinued operations and changes the timing of recognizing losses on such operations. The Company adopted the provisions of SFAS No. 144 effective January 1, 2002. Adoption of SFAS No. 144 did not have any impact on the Company’s financial position, cash flows or results of operations.
The Company reviews long-lived assets held and used, excluding indefinite-lived intangible assets (see “Goodwill and Other Intangible Assets”), for impairment when circumstances indicate that the carrying amount of assets may not be recoverable. In accordance with SFAS No. 144, the Company assesses the recoverability of long-lived assets by determining whether the depreciation or amortization of an asset over its remaining life can be recovered based upon management’s best estimate of the undiscounted future operating cash flows (excluding interest charges) related to the long-lived asset or group of assets and liabilities in which the long-lived asset generates cash flows. If the sum of such undiscounted cash flows is less than the carrying value of the asset (group), there is an indicator of impairment. The amount of impairment, if any, represents the excess of the carrying value of the asset (group) over fair value. Fair value is determined by quoted market price, if available, or an estimate of projected future operating cash flows, discounted using a rate that reflects the related operating segment’s average cost of funds. Long-lived assets, including indefinite-lived intangible assets, to be disposed of are reported at the lower of carrying amount or fair value less costs to sell.
48
Self-Insurance Reserves
The Company retains a portion of the accident risk under vehicle liability, workers’ compensation and other insurance programs. Under the Company’s insurance programs, it retains the risk of loss in various amounts up to $1 million on a per occurrence basis. The Company maintains additional insurance at certain amounts in excess of its respective underlying retention.
Reserves have been recorded which reflect the undiscounted estimated liabilities, including claims incurred but not reported. Such liabilities are necessarily based on estimates. While management believes that the amounts are adequate, there can be no assurance that changes to management’s estimates may not occur due to limitations inherent in the estimation process. Changes in the estimates of these reserves are charged or credited to earnings in the period determined. Amounts estimated to be paid within one year have been classified as accrued expenses with the remainder included in other non-current liabilities.
Residual Value Guarantees
The Company periodically enters into agreements for the sale and operating leaseback of revenue earning equipment. These leases contain purchase and/or renewal options as well as limited guarantees of the lessor’s residual value (“residual value guarantees”).
The Company periodically reviews the residual values of revenue earning equipment that it leases from third parties and its exposures under residual value guarantees. The review is conducted in a similar manner to that used to analyze residual values and fair values of revenue earning equipment that the Company owns. The amount of residual value guarantees expected to be paid is recognized as rent expense over the expected remaining term of the lease. Adjustments in the estimate of residual value guarantees are recognized prospectively over the expected remaining lease term. While management believes that the amounts are adequate, changes to management’s estimates of residual value guarantees may occur due to changes in the market for used vehicles, the condition of the vehicles at the end of the lease and inherent limitations in the estimation process.
Income Taxes
Deferred taxes are provided using the asset and liability method for temporary differences between the financial statement carrying amounts of existing assets and liabilities and their respective tax bases.
Environmental Expenditures
Liabilities are recorded for environmental assessments and/or cleanup when it is probable a loss has been incurred and the costs can be reasonably estimated. The liability may include costs such as anticipated site testing, consulting, remediation, disposal, post-remediation monitoring and legal fees, as appropriate. Estimates are not discounted. The liability does not reflect possible recoveries from insurance companies or reimbursement of remediation costs by state agencies, but does include estimates of cost-sharing with other potentially responsible parties. Claims for reimbursement of remediation costs are recorded when recovery is deemed probable.
Derivative Instruments and Hedging Activities
On January 1, 2001, the Company adopted SFAS No. 133, “Accounting for Derivative Instruments and Hedging Activities.” SFAS No. 133, as amended, requires all derivatives, including certain derivatives embedded in other contracts, to be recognized at fair value as either assets or liabilities on the balance sheet and establishes new accounting rules for hedging activities. Adoption of this statement did not have an impact on the Company’s financial position, cash flows or results of operations.
The Company uses financial instruments, including forward exchange contracts, futures, swaps and cap agreements to manage its exposures to movements in interest rates and foreign exchange rates. The use of these financial instruments modifies the exposure of these risks with the intent to reduce the risk or cost to the Company. The Company does not enter into derivative financial instruments for trading purposes. On the date a derivative contract is entered into, the Company formally documents, among other items, the intended hedging designation and relationship, along with the risk management objectives and strategies for entering into the derivative contract. The Company also formally assesses, both at the hedge’s inception and on an ongoing basis, whether the derivatives that are used in hedging transactions are highly effective in offsetting changes in fair values or cash flows of hedged
49
items. When it is determined that a derivative is not highly effective as a hedge or that it has ceased to be a highly effective hedge, the Company discontinues hedge accounting prospectively. Consistent with the provisions of SFAS No. 133, the hedging designation may be classified as follows:
No Hedging Designation: The gain or loss on a derivative instrument not designated as an accounting hedging instrument is recognized currently in earnings.
Fair Value Hedge: A hedge of a recognized asset or liability or an unrecognized firm commitment is considered as a fair value hedge. For fair value hedges, both the effective and ineffective portions of the changes in the fair value of the derivative, along with the gain or loss on the hedged item that is attributable to the hedged risk are recorded in earnings and reported in the Consolidated Statements of Earnings on the same line as the hedged item.
Cash Flow Hedge: A hedge of a forecasted transaction or of the variability of cash flows to be received or paid related to a recognized asset or liability is considered as a cash flow hedge. The effective portion of the change in the fair value of a derivative that is declared as a cash flow hedge is recorded in accumulated other comprehensive loss until earnings are affected by the variability in cash flows of the designated hedged item.
Net Investment Hedge : A hedge of a net investment in a foreign operation is considered as a net investment hedge. The effective portion of the change in the fair value of the derivative used as a net investment hedge of a foreign operation is recorded in the cumulative translation adjustment account within accumulated other comprehensive loss. The ineffective portion on the hedged item that is attributable to the hedged risk are recorded in earnings and reported in the Consolidated Statements of Earnings as miscellaneous (income) expense.
Foreign Currency Translation
The Company’s foreign operations generally use the local currency as their functional currency. Assets and liabilities of these operations are translated at the exchange rates in effect on the balance sheet date. If exchangeability between the functional currency and the U.S. Dollar is temporarily lacking at the balance sheet date, the first subsequent rate at which exchanges can be made is used to translate assets and liabilities. Income statement items are translated at the average exchange rates for the year. The impact of currency fluctuations is included in accumulated other comprehensive income (loss) as a currency translation adjustment. For subsidiaries whose economic environment is highly inflationary, the U.S. Dollar is the functional currency and gains and losses that result from translation are included in earnings.
Stock-based Compensation
At December 31, 2002, the Company had various stock-based employee compensation plans, which are described more fully in the “Employee Stock Option and Stock Purchase Plans” Note. Stock-based compensation is recognized using the intrinsic value method. Under this method, compensation cost is recognized based on the excess, if any, of the quoted market price of the stock at the date of grant (or other measurement date) and the amount an employee must pay to acquire the stock.
50
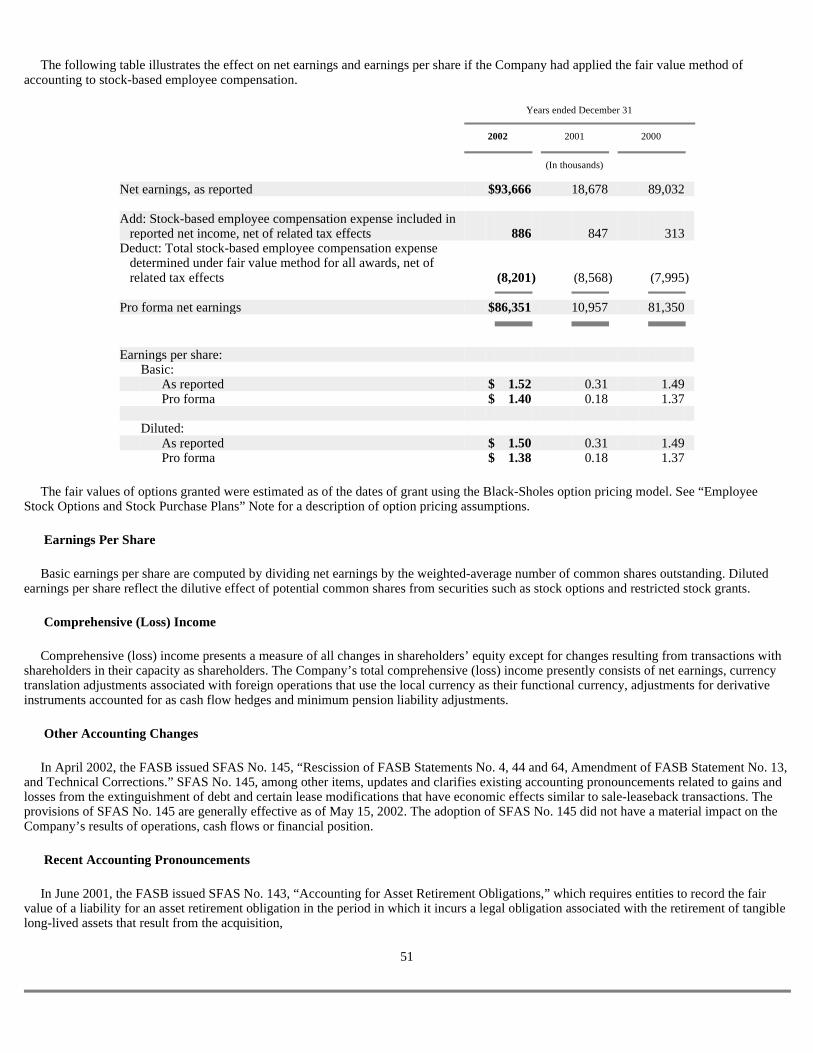
The following table illustrates the effect on net earnings and earnings per share if the Company had applied the fair value method of accounting to stock-based employee compensation.
The fair values of options granted were estimated as of the dates of grant using the Black-Sholes option pricing model. See “Employee Stock Options and Stock Purchase Plans” Note for a description of option pricing assumptions.
Earnings Per Share
Basic earnings per share are computed by dividing net earnings by the weighted-average number of common shares outstanding. Diluted earnings per share reflect the dilutive effect of potential common shares from securities such as stock options and restricted stock grants.
Comprehensive (Loss) Income
Comprehensive (loss) income presents a measure of all changes in shareholders’ equity except for changes resulting from transactions with shareholders in their capacity as shareholders. The Company’s total comprehensive (loss) income presently consists of net earnings, currency translation adjustments associated with foreign operations that use the local currency as their functional currency, adjustments for derivative instruments accounted for as cash flow hedges and minimum pension liability adjustments.
Other Accounting Changes
In April 2002, the FASB issued SFAS No. 145, “Rescission of FASB Statements No. 4, 44 and 64, Amendment of FASB Statement No. 13, and Technical Corrections.” SFAS No. 145, among other items, updates and clarifies existing accounting pronouncements related to gains and losses from the extinguishment of debt and certain lease modifications that have economic effects similar to sale-leaseback transactions. The provisions of SFAS No. 145 are generally effective as of May 15, 2002. The adoption of SFAS No. 145 did not have a material impact on the Company’s results of operations, cash flows or financial position.
Recent Accounting Pronouncements
In June 2001, the FASB issued SFAS No. 143, “Accounting for Asset Retirement Obligations,” which requires entities to record the fair value of a liability for an asset retirement obligation in the period in which it incurs a legal obligation associated with the retirement of tangible long-lived assets that result from the acquisition,
51
Years ended December 31
2002 2001 2000
(In thousands)
Net earnings, as reported $ 93,666 18,678 89,032 Add: Stock-based employee compensation expense included in
reported net income, net of related tax effects 886 847 313 Deduct: Total stock-based employee compensation expense
determined under fair value method for all awards, net of related tax effects (8,201 ) (8,568 ) (7,995 )
Pro forma net earnings $ 86,351 10,957 81,350 Earnings per share: Basic: As reported $ 1.52 0.31 1.49 Pro forma $ 1.40 0.18 1.37 Diluted: As reported $ 1.50 0.31 1.49 Pro forma $ 1.38 0.18 1.37
construction, development and/or normal use of the assets. When the liability is initially recorded, the Company is required to capitalize a cost by increasing the carrying amount of the related long-lived asset. Over time, the liability is accreted to its present value each period, and the capitalized cost is depreciated over the useful life of the related asset. SFAS No. 143 is effective for fiscal years beginning after June 15, 2002 and will be adopted by the Company effective January 1, 2003. The Company believes the adoption of SFAS No. 143 will not have a significant impact on its results of operations, cash flows or financial position.
In July 2002, the FASB issued SFAS No. 146, “Accounting for Costs Associated with Exit or Disposal Activities.” The standard requires companies to recognize costs associated with exit (including restructuring) or disposal activities at fair value when they are incurred rather than at the date of a commitment to an exit or disposal plan under current practice. Costs covered by the standard include certain contract termination costs, certain employee termination benefits and other costs to consolidate or close facilities and relocate employees that are associated with an exit activity or disposal of long-lived assets. The new requirements are effective prospectively for exit or disposal activities initiated after December 31, 2002 and will be adopted by the Company effective January 1, 2003. The adoption of SFAS No. 146 is expected to impact the timing of recognition of costs associated with future exit and disposal activities.
In November 2002, the FASB issued Financial Interpretation (“FIN”) No. 45, “Guarantor’s Accounting Disclosure Requirements for Guarantees, Including Indirect Guarantees of Indebtedness of Others.” FIN No. 45 clarifies that a guarantor is required to recognize, at the inception of a guarantee, a liability for the fair value of the obligation undertaken in issuing the guarantee. The initial recognition and initial measurement provisions of FIN No. 45 are applicable on a prospective basis to guarantees issued or modified after December 31, 2002. The disclosure requirements of FIN No. 45 are applicable for financial statements of interim or annual periods ending after December 15, 2002, which is included in the “Guarantees” Note.
In December 2002, the FASB issued SFAS No. 148, “Accounting for Stock-Based Compensation-Transition and Disclosure, an amendment of FASB Statement No. 123.” This Statement amends methods of transition for a voluntary change to the fair value method of accounting for stock-based employee compensation. In addition, this Statement amends the disclosure requirements of Statement No. 123 to require prominent disclosures in both annual and interim financial statements. Certain of the disclosure modifications are required for fiscal years ending after December 15, 2002 and are included in the accompanying Notes.
In January 2003, the FASB issued FIN No. 46, “Consolidation of Variable Interest Entities” that establishes accounting guidance for identifying variable interest entities (VIEs), including special-purpose entities, and when to include the assets, liabilities, noncontrolling interests and results of activities of VIEs in an enterprise’s consolidated financial statements. FIN No. 46 requires consolidation of VIEs if the primary beneficiary has a variable interest (or combination of variable interests) that will absorb a majority of the entity’s expected losses if they occur, receive a majority of the entity’s expected residual returns if they occur, or both. The enterprise consolidating the VIE is the primary beneficiary of that entity. FIN No. 46 will be effective immediately for variable interests in VIEs created after January 31, 2003. For a variable interest in a VIE created before February 1, 2003, the recognition provisions of FIN No. 46 shall apply (other than the required disclosures prior to the effective date) to that entity as of the interim period beginning after June 15, 2003.
The Company expects, as a result of the initial recognition provisions of FIN No. 46, to consolidate three VIEs effective July 1, 2003. These VIEs resulted from sale-leaseback transactions entered into in previous years. The carrying value of the assets and liabilities as of December 31, 2002, attributed to these unconsolidated VIEs was approximately $519 million and $461 million, respectively. The Company’s maximum exposure to loss, at December 31, 2002, as a result of its involvement in these VIEs is approximately $112 million.
52

Reclassifications
Certain prior year amounts have been reclassified to conform to the current year presentation.
ACQUISITIONS
No acquisitions were completed in 2002 and 2001. In 2000, the Company completed a few immaterial acquisitions, all of which have been accounted for using the purchase method of accounting. The consolidated financial statements reflect the results of operations of the acquired businesses from the acquisition dates. The fair value of assets acquired and liabilities assumed in connection with these acquisitions, and related purchase prices, were as follows:
RESTRUCTURING AND OTHER CHARGES, NET
The components of restructuring and other charges, net are as follows:
53
(In thousands)
Net assets acquired $ 9,024 Goodwill 19,103 Purchase price $ 28,127
Years ended December 31
2002 2001 2000
(In thousands)
Restructuring charges (recoveries), net: Severance and employee-related costs $ 5,198 30,438 (1,077 ) Facilities and related costs 106 6,261 (2,009 ) 5,304 36,699 (3,086 ) Other (recoveries) charges: Asset write-downs (285 ) 40,046 44,487 Goodwill impairment — 24,425 — Strategic consulting fees (64 ) 8,586 958 Loss on sale of business — 3,512 — Contract termination costs (219 ) 8,345 — Insurance reserves — sold business (520 ) (2,920 ) 700 Gain on sale of corporate aircraft — (2,129 ) — Other — — (1,045 ) Total $ 4,216 116,564 42,014
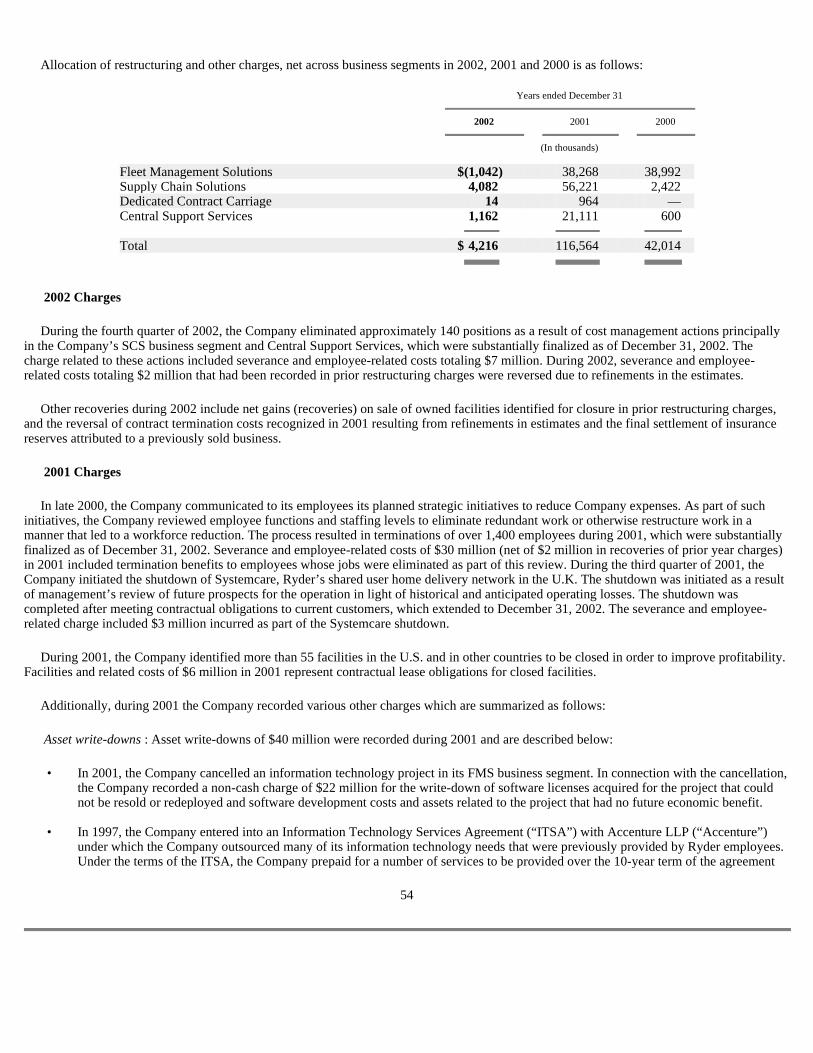
Allocation of restructuring and other charges, net across business segments in 2002, 2001 and 2000 is as follows:
2002 Charges
During the fourth quarter of 2002, the Company eliminated approximately 140 positions as a result of cost management actions principally in the Company’s SCS business segment and Central Support Services, which were substantially finalized as of December 31, 2002. The charge related to these actions included severance and employee-related costs totaling $7 million. During 2002, severance and employee-related costs totaling $2 million that had been recorded in prior restructuring charges were reversed due to refinements in the estimates.
Other recoveries during 2002 include net gains (recoveries) on sale of owned facilities identified for closure in prior restructuring charges, and the reversal of contract termination costs recognized in 2001 resulting from refinements in estimates and the final settlement of insurance reserves attributed to a previously sold business.
2001 Charges
In late 2000, the Company communicated to its employees its planned strategic initiatives to reduce Company expenses. As part of such initiatives, the Company reviewed employee functions and staffing levels to eliminate redundant work or otherwise restructure work in a manner that led to a workforce reduction. The process resulted in terminations of over 1,400 employees during 2001, which were substantially finalized as of December 31, 2002. Severance and employee-related costs of $30 million (net of $2 million in recoveries of prior year charges) in 2001 included termination benefits to employees whose jobs were eliminated as part of this review. During the third quarter of 2001, the Company initiated the shutdown of Systemcare, Ryder’s shared user home delivery network in the U.K. The shutdown was initiated as a result of management’s review of future prospects for the operation in light of historical and anticipated operating losses. The shutdown was completed after meeting contractual obligations to current customers, which extended to December 31, 2002. The severance and employee-related charge included $3 million incurred as part of the Systemcare shutdown.
During 2001, the Company identified more than 55 facilities in the U.S. and in other countries to be closed in order to improve profitability. Facilities and related costs of $6 million in 2001 represent contractual lease obligations for closed facilities.
Additionally, during 2001 the Company recorded various other charges which are summarized as follows:
Asset write-downs : Asset write-downs of $40 million were recorded during 2001 and are described below:
54
Years ended December 31
2002 2001 2000
(In thousands)
Fleet Management Solutions $ (1,042 ) 38,268 38,992 Supply Chain Solutions 4,082 56,221 2,422 Dedicated Contract Carriage 14 964 — Central Support Services 1,162 21,111 600 Total $ 4,216 116,564 42,014
• In 2001, the Company cancelled an information technology project in its FMS business segment. In connection with the cancellation, the Company recorded a non-cash charge of $22 million for the write-down of software licenses acquired for the project that could not be resold or redeployed and software development costs and assets related to the project that had no future economic benefit.
• In 1997, the Company entered into an Information Technology Services Agreement (“ITSA”) with Accenture LLP (“Accenture”)
under which the Company outsourced many of its information technology needs that were previously provided by Ryder employees. Under the terms of the ITSA, the Company prepaid for a number of services to be provided over the 10-year term of the agreement
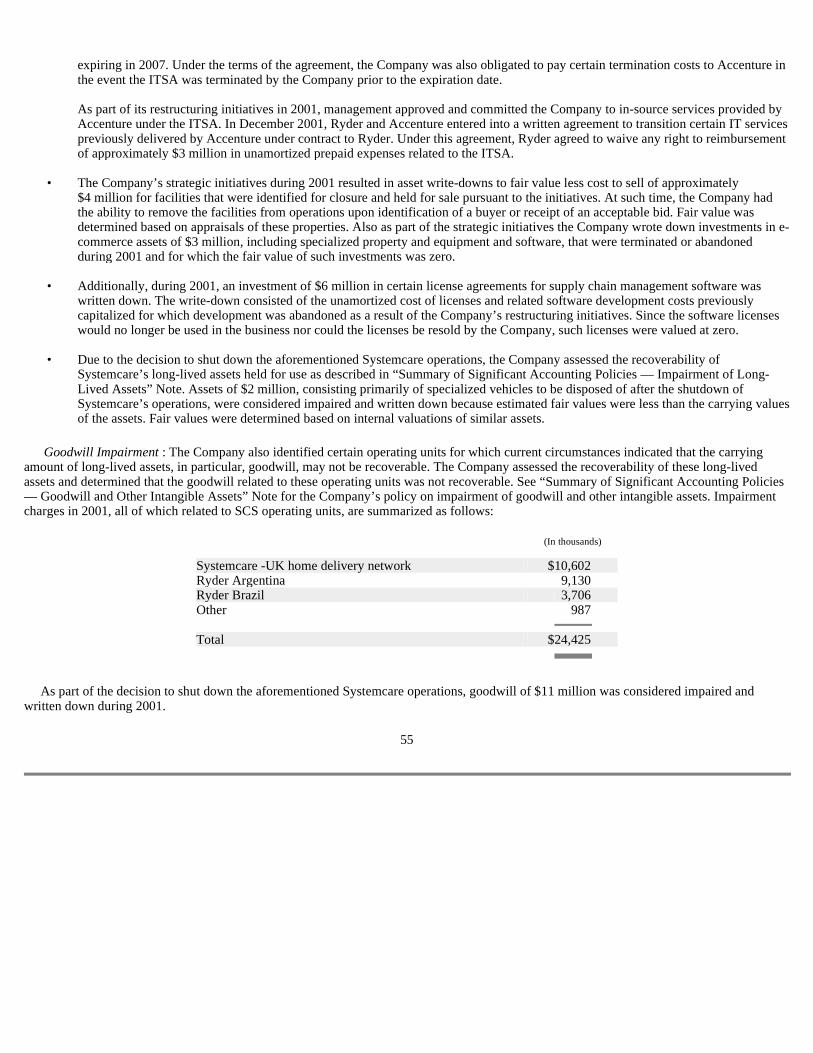
Goodwill Impairment : The Company also identified certain operating units for which current circumstances indicated that the carrying amount of long-lived assets, in particular, goodwill, may not be recoverable. The Company assessed the recoverability of these long-lived assets and determined that the goodwill related to these operating units was not recoverable. See “Summary of Significant Accounting Policies — Goodwill and Other Intangible Assets” Note for the Company’s policy on impairment of goodwill and other intangible assets. Impairment charges in 2001, all of which related to SCS operating units, are summarized as follows:
As part of the decision to shut down the aforementioned Systemcare operations, goodwill of $11 million was considered impaired and written down during 2001.
55
expiring in 2007. Under the terms of the agreement, the Company was also obligated to pay certain termination costs to Accenture in the event the ITSA was terminated by the Company prior to the expiration date.
As part of its restructuring initiatives in 2001, management approved and committed the Company to in-source services provided by
Accenture under the ITSA. In December 2001, Ryder and Accenture entered into a written agreement to transition certain IT services previously delivered by Accenture under contract to Ryder. Under this agreement, Ryder agreed to waive any right to reimbursement of approximately $3 million in unamortized prepaid expenses related to the ITSA.
• The Company’s strategic initiatives during 2001 resulted in asset write-downs to fair value less cost to sell of approximately
$4 million for facilities that were identified for closure and held for sale pursuant to the initiatives. At such time, the Company had the ability to remove the facilities from operations upon identification of a buyer or receipt of an acceptable bid. Fair value was determined based on appraisals of these properties. Also as part of the strategic initiatives the Company wrote down investments in e-commerce assets of $3 million, including specialized property and equipment and software, that were terminated or abandoned during 2001 and for which the fair value of such investments was zero.
• Additionally, during 2001, an investment of $6 million in certain license agreements for supply chain management software was
written down. The write-down consisted of the unamortized cost of licenses and related software development costs previously capitalized for which development was abandoned as a result of the Company’s restructuring initiatives. Since the software licenses would no longer be used in the business nor could the licenses be resold by the Company, such licenses were valued at zero.
• Due to the decision to shut down the aforementioned Systemcare operations, the Company assessed the recoverability of
Systemcare’s long-lived assets held for use as described in “Summary of Significant Accounting Policies — Impairment of Long-Lived Assets” Note. Assets of $2 million, consisting primarily of specialized vehicles to be disposed of after the shutdown of Systemcare’s operations, were considered impaired and written down because estimated fair values were less than the carrying values of the assets. Fair values were determined based on internal valuations of similar assets.
(In thousands)
Systemcare -UK home delivery network $ 10,602 Ryder Argentina 9,130 Ryder Brazil 3,706 Other 987 Total $ 24,425
Goodwill impairment in Ryder Argentina was triggered by the significant adverse change in the business climate in Argentina in the fourth quarter of 2001 that led to a devaluation of the Argentine Peso, breakdowns in the Argentine banking system and repeated turnover in the country’s leadership. These factors, combined with a history of operating losses and anticipated future operating losses, led to goodwill impairment. Goodwill of $9 million was considered impaired and was written down in December 2001.
During the fourth quarter of 2001, the Company reviewed goodwill associated with its remaining investment in Ryder Brazil for impairment. Subsequent to the sale of the contracts and related net assets associated with the disposal of the Company’s outbound auto carriage business (“Vehiculos”) in Ryder Brazil discussed below, the Company made a significant effort to restructure the operations of Ryder Brazil. However, such restructuring was not sufficient to offset the impact of lost business, the impact of the Argentine economic crisis and the marginal historical and anticipated cash flows related to the remaining business. As a result of the Company’s analysis, goodwill of $4 million was considered impaired and was written down in December 2001.
Strategic consulting fees: Strategic consulting fees of $9 million were incurred during 2001 in relation to the aforementioned strategic initiatives. Such consulting fees represented one-time costs of engaging consultants to assist the Company in its restructuring initiatives in 2001.
Loss on sale of business : During March 2001, the Company sold Vehiculos in Ryder Brazil for $14 million and incurred a loss of $4 million on the sale of the business.
Contract termination costs : In connection with the agreement to in-source information technology services provided by Accenture, the Company agreed to pay termination fees and certain demobilization costs of approximately $8 million. Also during 2001, the Company made a decision to terminate a long-term marketing arrangement to reduce marketing costs.
Insurance reserves — sold business : During 2001, the Company recognized $3 million in recoveries from an insurance settlement attributed to a business sold in 1989. The insurance recovery represents an adjustment to the Company’s indemnification reserve for favorable actuarial developments since the time of the sale.
Gain on sale of corporate aircraft: As a direct result of the Company’s 2001 restructuring and cost reduction initiatives, the Company decided to sell its corporate aircraft. The Company sold the aircraft during the first quarter of 2001 and recorded a $2 million gain on the sale.
2000 Charges
In 2000, severance and employee-related costs of $1 million that had been recorded in the 1999 restructuring were reversed due to refinements in estimates. Facilities and related costs reflect $2 million of net gains (recoveries) on sale of owned facilities identified for closure in the 1999 and 1996 restructuring.
In 2000, an asset write-down of $41 million resulted from the rapid industry-wide downturn in the market for new and used “Class 8” vehicles (the largest heavy-duty tractors) which led to a decrease in the market value of used tractors during the second half of 2000. The Company’s unsold Class 8 inventory consists of units previously used by customers of the FMS segment. Approximately $15 million of the charge related to Class 8 tractors held for sale and identified in 2000 as increasingly undesirable and unmarketable due to lower-powered engines or a potential lack of future support for parts and service. The remainder of the charge related to other owned and leased tractors held for sale for which estimated fair value less costs to sell declined below carrying value (or termination value, which represents the final payment due to lessors, in the case of leased units) in 2000. These charges were slightly offset with gains of $1 million on vehicles sold in the U.K. during 2000, for which an impairment charge had been recorded in the 1999 restructuring.
During 2000, the Company settled long-standing litigation with a former customer, OfficeMax, relating to a logistics services agreement that was terminated in 1997. In 2000, asset write-downs include $4 million related to the write-down of certain assets related to the OfficeMax contract.
56
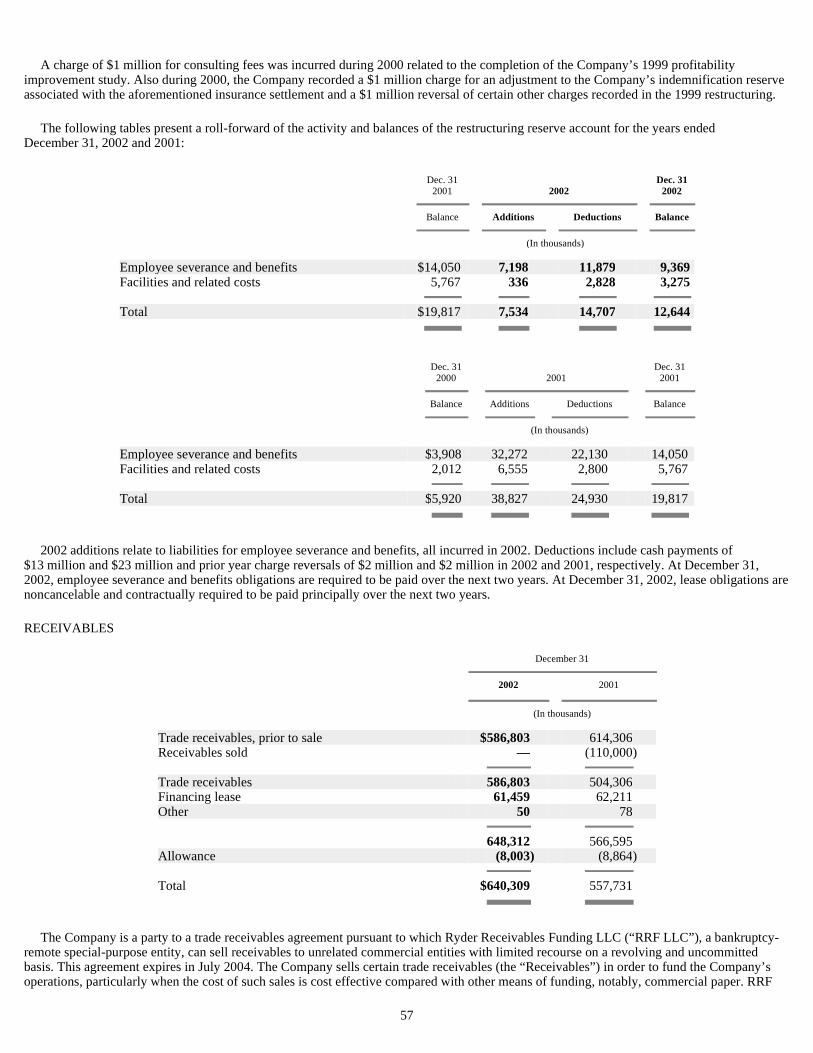
A charge of $1 million for consulting fees was incurred during 2000 related to the completion of the Company’s 1999 profitability improvement study. Also during 2000, the Company recorded a $1 million charge for an adjustment to the Company’s indemnification reserve associated with the aforementioned insurance settlement and a $1 million reversal of certain other charges recorded in the 1999 restructuring.
The following tables present a roll-forward of the activity and balances of the restructuring reserve account for the years ended December 31, 2002 and 2001:
2002 additions relate to liabilities for employee severance and benefits, all incurred in 2002. Deductions include cash payments of $13 million and $23 million and prior year charge reversals of $2 million and $2 million in 2002 and 2001, respectively. At December 31, 2002, employee severance and benefits obligations are required to be paid over the next two years. At December 31, 2002, lease obligations are noncancelable and contractually required to be paid principally over the next two years.
RECEIVABLES
The Company is a party to a trade receivables agreement pursuant to which Ryder Receivables Funding LLC (“RRF LLC”), a bankruptcy-remote special-purpose entity, can sell receivables to unrelated commercial entities with limited recourse on a revolving and uncommitted basis. This agreement expires in July 2004. The Company sells certain trade receivables (the “Receivables”) in order to fund the Company’s operations, particularly when the cost of such sales is cost effective compared with other means of funding, notably, commercial paper. RRF
57
Dec. 31 Dec. 31
2001 2002 2002
Balance Additions Deductions Balance
(In thousands)
Employee severance and benefits $ 14,050 7,198 11,879 9,369 Facilities and related costs 5,767 336 2,828 3,275 Total $ 19,817 7,534 14,707 12,644
Dec. 31 Dec. 31
2000 2001 2001
Balance Additions Deductions Balance
(In thousands)
Employee severance and benefits $ 3,908 32,272 22,130 14,050 Facilities and related costs 2,012 6,555 2,800 5,767 Total $ 5,920 38,827 24,930 19,817
December 31
2002 2001
(In thousands)
Trade receivables, prior to sale $ 586,803 614,306 Receivables sold — (110,000 ) Trade receivables 586,803 504,306 Financing lease 61,459 62,211 Other 50 78 648,312 566,595 Allowance (8,003 ) (8,864 ) Total $ 640,309 557,731

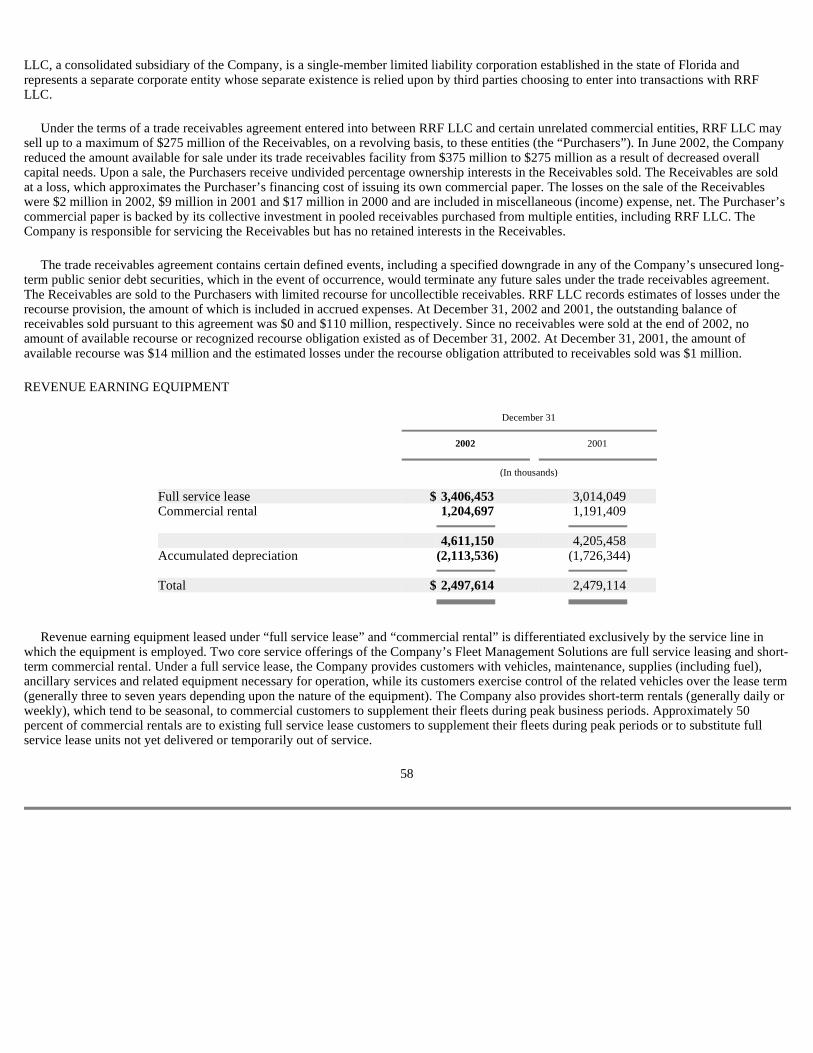
LLC, a consolidated subsidiary of the Company, is a single-member limited liability corporation established in the state of Florida and represents a separate corporate entity whose separate existence is relied upon by third parties choosing to enter into transactions with RRF LLC.
Under the terms of a trade receivables agreement entered into between RRF LLC and certain unrelated commercial entities, RRF LLC may sell up to a maximum of $275 million of the Receivables, on a revolving basis, to these entities (the “Purchasers”). In June 2002, the Company reduced the amount available for sale under its trade receivables facility from $375 million to $275 million as a result of decreased overall capital needs. Upon a sale, the Purchasers receive undivided percentage ownership interests in the Receivables sold. The Receivables are sold at a loss, which approximates the Purchaser’s financing cost of issuing its own commercial paper. The losses on the sale of the Receivables were $2 million in 2002, $9 million in 2001 and $17 million in 2000 and are included in miscellaneous (income) expense, net. The Purchaser’s commercial paper is backed by its collective investment in pooled receivables purchased from multiple entities, including RRF LLC. The Company is responsible for servicing the Receivables but has no retained interests in the Receivables.
The trade receivables agreement contains certain defined events, including a specified downgrade in any of the Company’s unsecured long-term public senior debt securities, which in the event of occurrence, would terminate any future sales under the trade receivables agreement. The Receivables are sold to the Purchasers with limited recourse for uncollectible receivables. RRF LLC records estimates of losses under the recourse provision, the amount of which is included in accrued expenses. At December 31, 2002 and 2001, the outstanding balance of receivables sold pursuant to this agreement was $0 and $110 million, respectively. Since no receivables were sold at the end of 2002, no amount of available recourse or recognized recourse obligation existed as of December 31, 2002. At December 31, 2001, the amount of available recourse was $14 million and the estimated losses under the recourse obligation attributed to receivables sold was $1 million.
REVENUE EARNING EQUIPMENT
Revenue earning equipment leased under “full service lease” and “commercial rental” is differentiated exclusively by the service line in which the equipment is employed. Two core service offerings of the Company’s Fleet Management Solutions are full service leasing and short-term commercial rental. Under a full service lease, the Company provides customers with vehicles, maintenance, supplies (including fuel), ancillary services and related equipment necessary for operation, while its customers exercise control of the related vehicles over the lease term (generally three to seven years depending upon the nature of the equipment). The Company also provides short-term rentals (generally daily or weekly), which tend to be seasonal, to commercial customers to supplement their fleets during peak business periods. Approximately 50 percent of commercial rentals are to existing full service lease customers to supplement their fleets during peak periods or to substitute full service lease units not yet delivered or temporarily out of service.
58
December 31
2002 2001
(In thousands)
Full service lease $ 3,406,453 3,014,049 Commercial rental 1,204,697 1,191,409 4,611,150 4,205,458 Accumulated depreciation (2,113,536 ) (1,726,344 ) Total $ 2,497,614 2,479,114

OPERATING PROPERTY AND EQUIPMENT
DIRECT FINANCING LEASES AND OTHER ASSETS
INTANGIBLE ASSETS AND DEFERRED CHARGES
The carrying amount of goodwill attributable to each reportable business segment with changes therein was as follows:
December 31
2002 2001
(In thousands)
Land $ 106,367 106,441 Buildings and improvements 588,283 574,539 Machinery and equipment 488,650 494,388 Other 74,752 75,722 1,258,052 1,251,090 Accumulated depreciation (727,175 ) (684,207 ) Total $ 530,877 566,883
December 31
2002 2001
(In thousands)
Direct financing leases $ 373,252 413,075 Prepaid pension benefit cost — 159,214 Vehicle securitization credit enhancement 59,938 60,477 Investments held in Rabbi Trust 29,816 37,133 Swap and cap agreements 24,789 — Other 43,965 36,059 Total $ 531,760 705,958
December 31
2002 2001
(In thousands)
Goodwill $ 151,470 168,312 Other intangible assets 21,842 10,600 Deferred charges 9,248 12,379 Total $ 182,560 191,291
Fleet Supply Dedicated Management Chain Contract
Solutions Solutions Carriage Total
(In thousands)
Balance as of December 31, 2001 $ 118,800 44,612 4,900 168,312 Transitional impairment adjustment — (18,899 ) — (18,899 ) Currency translation adjustment 748 1,309 — 2,057 Balance as of December 31, 2002 $ 119,548 27,022 4,900 151,470

The Company’s other intangible assets include the Ryder trade name with a carrying amount of $9 million and intangible assets related to the Company’s defined benefit plans with a carrying amount of $13 million. The Ryder trade name has been identified as having an indefinite useful life and was tested for impairment consistent
59
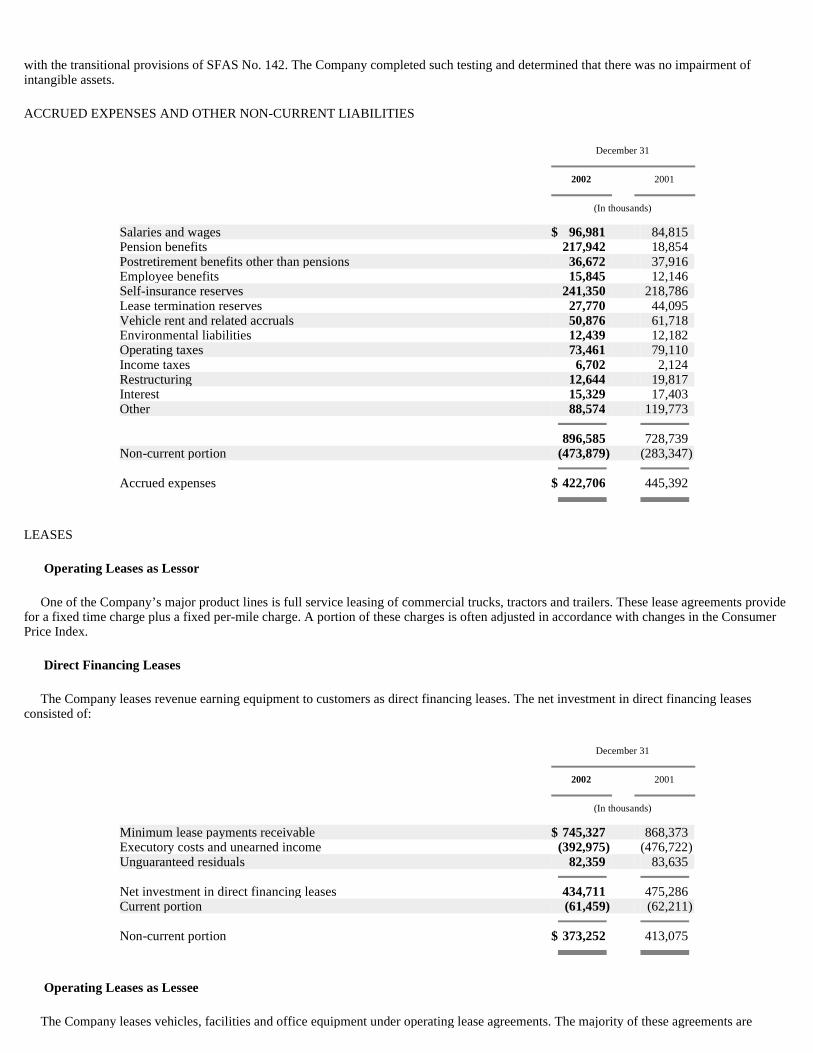
with the transitional provisions of SFAS No. 142. The Company completed such testing and determined that there was no impairment of intangible assets.
ACCRUED EXPENSES AND OTHER NON-CURRENT LIABILITIES
LEASES
Operating Leases as Lessor
One of the Company’s major product lines is full service leasing of commercial trucks, tractors and trailers. These lease agreements provide for a fixed time charge plus a fixed per-mile charge. A portion of these charges is often adjusted in accordance with changes in the Consumer Price Index.
Direct Financing Leases
The Company leases revenue earning equipment to customers as direct financing leases. The net investment in direct financing leases consisted of:
Operating Leases as Lessee
The Company leases vehicles, facilities and office equipment under operating lease agreements. The majority of these agreements are
December 31
2002 2001
(In thousands)
Salaries and wages $ 96,981 84,815 Pension benefits 217,942 18,854 Postretirement benefits other than pensions 36,672 37,916 Employee benefits 15,845 12,146 Self-insurance reserves 241,350 218,786 Lease termination reserves 27,770 44,095 Vehicle rent and related accruals 50,876 61,718 Environmental liabilities 12,439 12,182 Operating taxes 73,461 79,110 Income taxes 6,702 2,124 Restructuring 12,644 19,817 Interest 15,329 17,403 Other 88,574 119,773 896,585 728,739 Non-current portion (473,879 ) (283,347 ) Accrued expenses $ 422,706 445,392
December 31
2002 2001
(In thousands)
Minimum lease payments receivable $ 745,327 868,373 Executory costs and unearned income (392,975 ) (476,722 ) Unguaranteed residuals 82,359 83,635 Net investment in direct financing leases 434,711 475,286 Current portion (61,459 ) (62,211 ) Non-current portion $ 373,252 413,075

vehicle leases which specify that rental payments be adjusted periodically based on changes in interest rates and provide for early termination at stipulated values.
60

During 2001 and 2000, the Company entered into several agreements for the sale and operating leaseback of revenue earning equipment. Proceeds from these transactions totaled, $411 million in 2001 and $373 million in 2000. Under the transactions, the vehicles were sold for approximately their carrying value. Included in the sale-leaseback transaction in 2001 was a vehicle securitization transaction in which the Company sold a beneficial interest in certain vehicles subject to leases to a separately rated and unconsolidated vehicle lease trust. The Company has executed other similar vehicle securitization transactions in previous years. The Company is obligated to make lease payments only to the extent of collections on the related vehicle leases and vehicle sales. The Company retained an interest in the cash flows related to the vehicles in the form of a subordinated note issued at the date of each sale. The Company has provided credit enhancement in the form of cash reserve funds and a pledge of the subordinated notes, including interest thereon, as additional security for the vehicle securitization trusts to the extent that delinquencies and losses on the truck leases and related vehicle sales are incurred. As of December 31, 2002 and 2001, credit enhancements maintained by the Company totaled $60 million and are included in direct financing leases and other assets. The trusts rely on collections from the leases on the vehicles in which the trusts have beneficial ownership, sales proceeds from the disposition of such vehicles and credit enhancements to make payments to investors. The trusts are solely liable for such payments to investors, who are all independent of the Company. Other than the credit enhancements noted above, the Company does not guarantee investors’ interests in the securitization trusts.
Certain leases contain purchase and/or renewal options, as well as limited guarantees for a portion of the lessor’s residual value. The amount of residual value guarantees expected to be paid is recognized as rent expense over the expected remaining term of the lease. Facts and circumstances that impact management’s estimates of residual value guarantees include the market for used equipment, the condition of the equipment at the end of the lease and inherent limitations in the estimation process. The Company’s maximum exposure to guarantees for revenue earning equipment held under operating leases, excluding early lease terminations, was approximately $134 million as of December 31, 2002.
The following table presents the activity of the reserve for residual value guarantees for the years ended December 31, 2002, 2001 and 2000:
2002 Activity:
The overall decline in the reserve activity reflects the decrease in the number of vehicles held under operating leases during 2002 as compared with earlier years. Additionally, improved vehicle market prices in 2002 resulted in higher estimates of vehicle residual values than previously anticipated. During 2002, the number of vehicles held under lease declined 30 percent in comparison to 2001.
2001 Activity:
Vehicle market prices declined further in 2001 which resulted in additional reductions to the Company’s estimates of residual values. The significant amount of reserve deductions was directly attributed to the increased activity of vehicle sales and lease terminations during the year as a result of the increase in the number of vehicles held under operating leases in 2000.
2000 Activity:
The significant build-up during 2000 was in part attributed to the increase in the number of vehicles held under operating leases as a result of leases entered into in late 1999 and 2000. The increase was also attributed to a
61
Beginning Ending Balance Additions Deductions Balance
(In thousands)
2002 $ 44,095 22,060 (38,385 ) 27,770 2001 $ 55,098 41,415 (52,418 ) 44,095 2000 $ 18,920 47,176 (10,998 ) 55,098
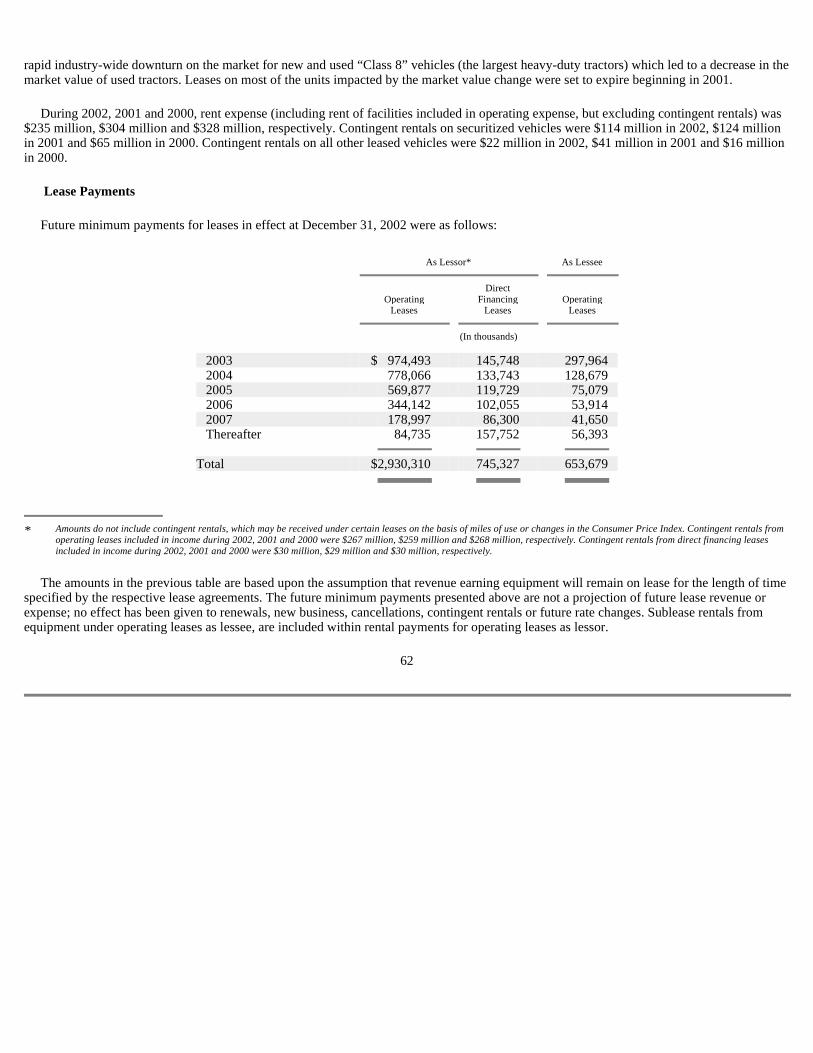
rapid industry-wide downturn on the market for new and used “Class 8” vehicles (the largest heavy-duty tractors) which led to a decrease in the market value of used tractors. Leases on most of the units impacted by the market value change were set to expire beginning in 2001.
During 2002, 2001 and 2000, rent expense (including rent of facilities included in operating expense, but excluding contingent rentals) was $235 million, $304 million and $328 million, respectively. Contingent rentals on securitized vehicles were $114 million in 2002, $124 million in 2001 and $65 million in 2000. Contingent rentals on all other leased vehicles were $22 million in 2002, $41 million in 2001 and $16 million in 2000.
Lease Payments
Future minimum payments for leases in effect at December 31, 2002 were as follows:
The amounts in the previous table are based upon the assumption that revenue earning equipment will remain on lease for the length of time specified by the respective lease agreements. The future minimum payments presented above are not a projection of future lease revenue or expense; no effect has been given to renewals, new business, cancellations, contingent rentals or future rate changes. Sublease rentals from equipment under operating leases as lessee, are included within rental payments for operating leases as lessor.
62
As Lessor* As Lessee
Direct Operating Financing Operating Leases Leases Leases
(In thousands)
2003 $ 974,493 145,748 297,964 2004 778,066 133,743 128,679 2005 569,877 119,729 75,079 2006 344,142 102,055 53,914 2007 178,997 86,300 41,650 Thereafter 84,735 157,752 56,393 Total $ 2,930,310 745,327 653,679
* Amounts do not include contingent rentals, which may be received under certain leases on the basis of miles of use or changes in the Consumer Price Index. Contingent rentals from operating leases included in income during 2002, 2001 and 2000 were $267 million, $259 million and $268 million, respectively. Contingent rentals from direct financing leases included in income during 2002, 2001 and 2000 were $30 million, $29 million and $30 million, respectively.
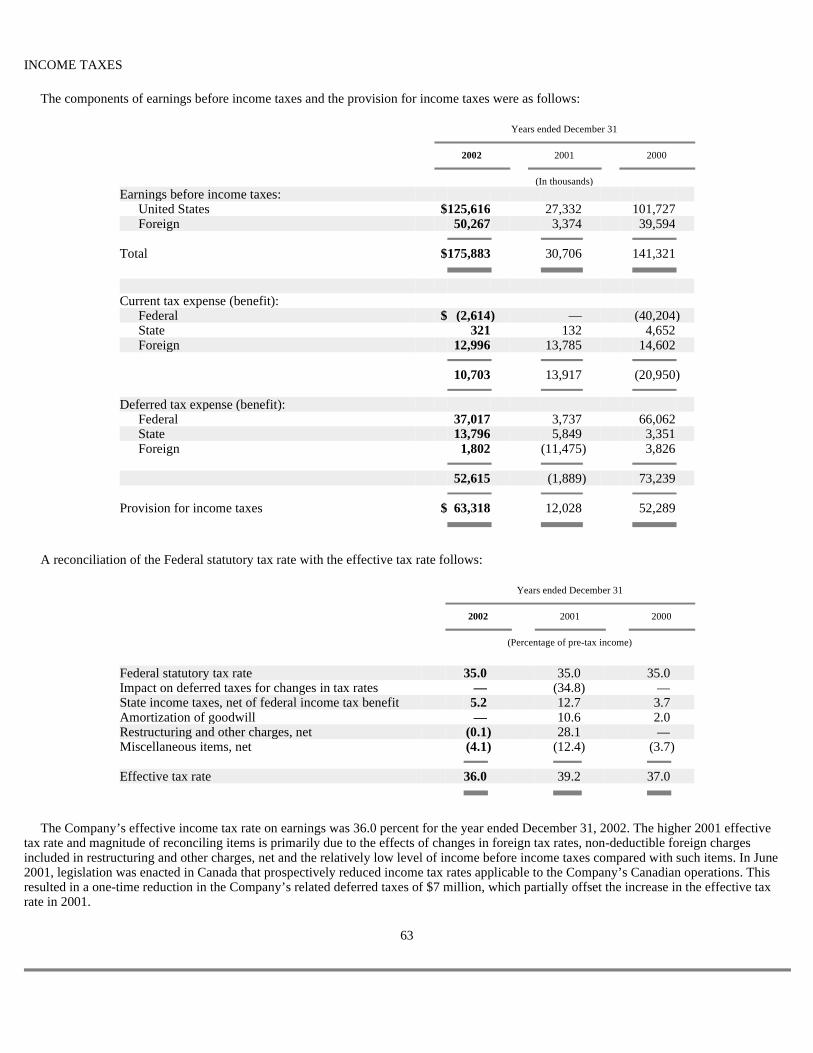
INCOME TAXES
The components of earnings before income taxes and the provision for income taxes were as follows:
A reconciliation of the Federal statutory tax rate with the effective tax rate follows:
The Company’s effective income tax rate on earnings was 36.0 percent for the year ended December 31, 2002. The higher 2001 effective tax rate and magnitude of reconciling items is primarily due to the effects of changes in foreign tax rates, non-deductible foreign charges included in restructuring and other charges, net and the relatively low level of income before income taxes compared with such items. In June 2001, legislation was enacted in Canada that prospectively reduced income tax rates applicable to the Company’s Canadian operations. This resulted in a one-time reduction in the Company’s related deferred taxes of $7 million, which partially offset the increase in the effective tax rate in 2001.
63
Years ended December 31
2002 2001 2000
(In thousands)
Earnings before income taxes: United States $ 125,616 27,332 101,727 Foreign 50,267 3,374 39,594 Total $ 175,883 30,706 141,321 Current tax expense (benefit): Federal $ (2,614 ) — (40,204 ) State 321 132 4,652 Foreign 12,996 13,785 14,602 10,703 13,917 (20,950 ) Deferred tax expense (benefit): Federal 37,017 3,737 66,062 State 13,796 5,849 3,351 Foreign 1,802 (11,475 ) 3,826 52,615 (1,889 ) 73,239 Provision for income taxes $ 63,318 12,028 52,289
Years ended December 31
2002 2001 2000
(Percentage of pre-tax income)
Federal statutory tax rate 35.0 35.0 35.0 Impact on deferred taxes for changes in tax rates — (34.8 ) — State income taxes, net of federal income tax benefit 5.2 12.7 3.7 Amortization of goodwill — 10.6 2.0 Restructuring and other charges, net (0.1 ) 28.1 — Miscellaneous items, net (4.1 ) (12.4 ) (3.7 ) Effective tax rate 36.0 39.2 37.0
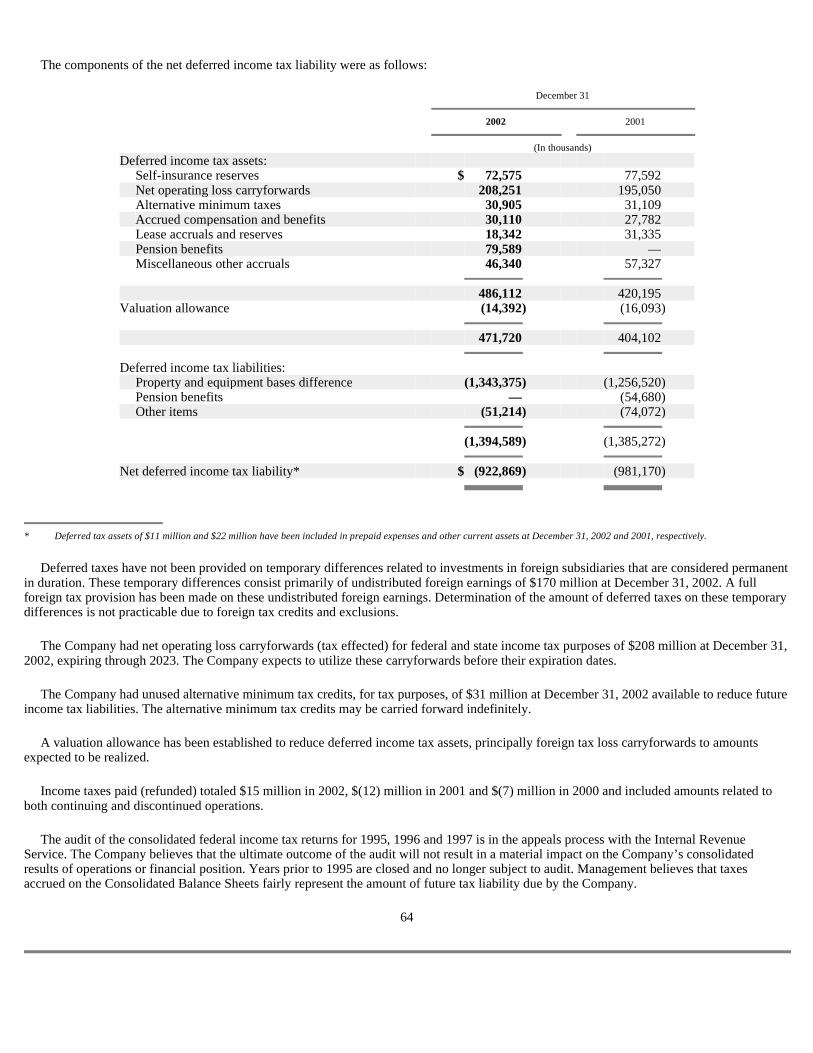
The components of the net deferred income tax liability were as follows:
Deferred taxes have not been provided on temporary differences related to investments in foreign subsidiaries that are considered permanent in duration. These temporary differences consist primarily of undistributed foreign earnings of $170 million at December 31, 2002. A full foreign tax provision has been made on these undistributed foreign earnings. Determination of the amount of deferred taxes on these temporary differences is not practicable due to foreign tax credits and exclusions.
The Company had net operating loss carryforwards (tax effected) for federal and state income tax purposes of $208 million at December 31, 2002, expiring through 2023. The Company expects to utilize these carryforwards before their expiration dates.
The Company had unused alternative minimum tax credits, for tax purposes, of $31 million at December 31, 2002 available to reduce future income tax liabilities. The alternative minimum tax credits may be carried forward indefinitely.
A valuation allowance has been established to reduce deferred income tax assets, principally foreign tax loss carryforwards to amounts expected to be realized.
Income taxes paid (refunded) totaled $15 million in 2002, $(12) million in 2001 and $(7) million in 2000 and included amounts related to both continuing and discontinued operations.
The audit of the consolidated federal income tax returns for 1995, 1996 and 1997 is in the appeals process with the Internal Revenue Service. The Company believes that the ultimate outcome of the audit will not result in a material impact on the Company’s consolidated results of operations or financial position. Years prior to 1995 are closed and no longer subject to audit. Management believes that taxes accrued on the Consolidated Balance Sheets fairly represent the amount of future tax liability due by the Company.
64
December 31
2002 2001
(In thousands)
Deferred income tax assets: Self-insurance reserves $ 72,575 77,592 Net operating loss carryforwards 208,251 195,050 Alternative minimum taxes 30,905 31,109 Accrued compensation and benefits 30,110 27,782 Lease accruals and reserves 18,342 31,335 Pension benefits 79,589 — Miscellaneous other accruals 46,340 57,327 486,112 420,195 Valuation allowance (14,392 ) (16,093 ) 471,720 404,102 Deferred income tax liabilities: Property and equipment bases difference (1,343,375 ) (1,256,520 ) Pension benefits — (54,680 ) Other items (51,214 ) (74,072 ) (1,394,589 ) (1,385,272 ) Net deferred income tax liability* $ (922,869 ) (981,170 )
* Deferred tax assets of $11 million and $22 million have been included in prepaid expenses and other current assets at December 31, 2002 and 2001, respectively.

DEBT
Debt maturities (including sinking fund requirements) during the five years subsequent to December 31, 2002 are as follows:
The Company has established an $860 million global revolving credit facility. The facility is composed of $300 million which matures in May 2003 and is renewable annually and $560 million which matures in May 2006. The primary purposes of the credit facility are to finance working capital and provide support for the issuance of commercial paper. At the Company’s option, the interest rate on borrowings under the credit facility is based on LIBOR, prime, federal funds or local equivalent rates. The credit facility’s annual facility fee ranges from 12.5 to 15.0 basis points applied to the total facility of $860 million based on the Company’s current credit ratings. At December 31, 2002, $674 million was available under this global revolving credit facility. Of this amount, $300 million was available at a maturity of less than one year. Foreign borrowings of $68 million were outstanding under the facility at December 31, 2002. In order to maintain availability of funding, the global revolving credit facility requires the Company to maintain a ratio of debt to consolidated tangible net worth, as defined, of less than or equal to 300 percent. The ratio at December 31, 2002 was 119 percent.
The weighted-average interest rates for outstanding U.S. commercial paper at December 31, 2002 and 2001 were 1.69 percent and 2.83 percent, respectively. U.S. commercial paper is classified as long-term debt since it is backed by the long-term revolving credit facility previously discussed.
During 2002, the Company added capital lease obligations of $67 million in connection with the extension of existing operating leases of revenue earning equipment and other additions.
65
December 31
2002 2001
(In thousands)
U.S. commercial paper $ 117,500 210,000 Unsecured U.S. notes: Debentures, 6.50% to 9.88%, due 2005 to 2017 332,432 325,687 Medium-term notes, 4.50% to 8.10%, due 2003 to 2025 744,606 742,527 Unsecured foreign obligations (principally pound sterling),
4.50% to 10.00%, due 2003 to 2007 229,032 331,306 Other debt, including capital leases 127,898 99,164 Total debt 1,551,468 1,708,684 Current portion (162,369 ) (317,087 ) Long-term debt $ 1,389,099 1,391,597
Debt Maturities
(In thousands)
2003 $ 162,369 2004 203,450 2005 218,350 2006 383,751 2007 235,761
The Company has issued unsecured medium-term notes under various shelf registration statements filed with the Securities and Exchange Commission. In 1998, the Company registered an additional $800 million for future debt issues. As of December 31, 2002, the Company had $187 million of debt securities available for issuance under the latest registration statement. The Company had unamortized original issue discounts of $16 million and $17 million for the medium-term notes and debentures at December 31, 2002 and 2001, respectively.
At December 31, 2002 and 2001, the Company had letters of credit outstanding totaling $152 million and $115 million, respectively, which primarily guarantee various insurance activities. See “Guarantees” Note for further discussion on outstanding letters of credit.
Interest paid totaled $94 million in 2002, $121 million in 2001 and $163 million in 2000.
FINANCIAL INSTRUMENTS AND RISK MANAGEMENT
Interest Rate Risk
From time to time, the Company enters into interest rate swap and cap agreements to manage its fixed and variable interest rate exposure and to better match the repricing of its debt instruments to that of its portfolio of assets. The Company assesses the risk that changes in interest rates will have either on the fair value of its debt obligations or on the amount of its future interest payments by monitoring changes in interest rate exposures and by evaluating hedging opportunities. The Company regularly monitors interest rate risk attributable to both the Company’s outstanding or forecasted debt obligations as well as the Company’s offsetting hedge positions. This risk management process involves the use of analytical techniques, including cash flow sensitivity analysis, to estimate the expected impact of changes in interest rates on the Company’s future cash flows.
During March 2002, the Company entered into interest rate swap agreements designated as fair value hedges whereby it receives fixed interest rate payments in exchange for making variable interest rate payments. The differential to be paid or received is accrued and recognized as interest expense. At December 31, 2002, these interest rate swap agreements effectively changed $322 million of fixed-rate debt instruments with a weighted-average fixed interest rate of 6.7 percent to LIBOR-based floating rate debt at a current weighted-average rate of 3.0 percent. The fair value of the interest rate swap agreements was classified in direct financing leases and other assets. Changes in the fair value of the interest rate swaps are offset by changes in the fair value of the debt instruments and no net gain or loss is recognized in earnings. During 2002, the increase in the fair value of interest rate swaps totaled $24 million. These contracts mature from July 2004 to October 2007.
During March 2002, the Company also entered into two interest rate cap agreements covering a total notional amount of $160 million. These cap agreements mature in October and November of 2005. The interest rate cap agreements serve as an economic hedge against increases in interest rates and have not been designated as hedges for accounting purposes. The fair value of the interest rate cap agreements was classified in direct financing leases and other assets. During 2002, the decrease in the fair value of interest rate caps totaled approximately $2 million and was reflected as interest expense.
In late 2001, the Company entered into an interest rate swap with a notional value of $22 million. The swap was accounted for as a cash flow hedge whereby it receives foreign variable interest payments in exchange for making fixed interest payments. The swap agreement matures in 2004. The fair value of the swap is recognized as an adjustment to accumulated other comprehensive loss. The Company expects that any amounts which will be reclassified to earnings from accumulated other comprehensive loss will be immaterial.
The Company estimates the fair value of derivatives based on dealer quotations. For the years ended December 31, 2002 and 2001, there was no measured ineffectiveness in the Company’s designated hedging transactions.
Currency Risk
From time to time, the Company uses forward exchange contracts and cross-currency swaps to manage its exposure to movements in foreign exchange rates. In November 2002, the Company entered into a five year $78 million cross-currency swap to hedge its investment in a foreign subsidiary. The hedge is effective in eliminating
66
the risk of foreign currency movements on the investment and as such, it is accounted for under the net investment hedging rules. For the year ended December 31, 2002, losses of $2.3 million attributed to the cross-currency swap have been reflected in the currency translation adjustment account within accumulated other comprehensive loss.
Fair Value
The following table represents the carrying amounts and estimated fair values of certain of the Company’s financial instruments at December 31, 2002 and 2001. The fair value of a financial instrument is the amount at which the instrument could be exchanged in a current transaction between willing parties (fair values were based on dealer quotations that represent the discounted future cash flows through maturity or expiration using current rates):
The carrying amounts of all other instruments approximated fair value as of December 31, 2002 and 2001.
GUARANTEES
In the ordinary course of business, the Company provides certain guarantees or indemnifications to third parties as part of certain lease, financing and sales agreements. Certain guarantees and indemnifications, whereby the Company may be contingently required to make a payment to a third-party, are required to be disclosed even if the likelihood of payment is considered remote. The Company’s financial guarantees as of December 31, 2002 consisted of the following:
As more fully described in the “Leases” Note, the Company has entered into transactions for the sale and operating leaseback of revenue earning equipment. The transactions resulted in the Company providing the lessors with residual value guarantees at the end of the lease term. Therefore, to the extent that the sales proceeds from the
67
December 31
2002 2001
Carrying Fair Carrying Fair Amount Value Amount Value
(In thousands)
Total debt (a) $ 1,480,703 1,565,663 1,693,047 1,692,862 Interest rate swaps 23,796 23,796 — — Interest rate caps 500 500 — — Cross-currency swap (2,340 ) (2,340 ) — —
(a) The carrying amount of total debt excludes capital leases of $71 million and $16 million as of December 31, 2002 and 2001, respectively.
Maximum exposure Carrying amount
Guarantee of guarantee of liability
(In millions)
Vehicle residual value guarantees: Sale and leaseback arrangements — end of term guarantees (a) $ 203 19 Finance lease program 4 1 Used vehicle financing 7 4 Standby letters of credit 15 — Total $ 229 24
(a) Amounts exclude contingent rentals associated with residual value guarantees on certain vehicles held under operating leases for which the guarantees are conditional upon early termination of the lease agreement as a result of a vehicle disposal. The Company’s maximum exposure for early lease termination guarantees was approximately $184 million, with $9 million recorded as a liability at December 31, 2002.
final disposition of the assets are lower than the residual value guarantee, the Company is required to make payment for the remaining amount. The Company’s maximum exposure for such guarantees, including credit enhancements on vehicle securitizations, was approximately $203 million, with $19 million recorded as a liability at December 31, 2002.
Under a separate arrangement, the Company also provides vehicle residual value guarantees to an independent third-party relating to a customer finance lease program. To the extent that the sales proceeds from the final disposition of the assets are lower than the residual value guarantee, the Company is required to make payment for the remaining amount. At December 31, 2002, the Company’s maximum exposure under this program was approximately $4 million, of which $1 million was recorded.
The Company maintains an agreement with an independent third-party for the financing of used vehicle purchases by its customers. Under the terms of the agreement, the Company finances the customer’s purchase and immediately sells its rights under the finance contract to the financial institution. The Company provides a guarantee on defaulted contracts up to a maximum of 11 percent of the outstanding principal balances. At the end of 2002, the Company’s maximum exposure under the guarantee was approximately $7 million. The recorded liability under this guarantee at December 31, 2002 was $4 million.
At December 31, 2002, the Company had outstanding letters of credit that primarily guarantee various insurance activities. Certain of these letters of credit guarantee insurance activities associated with insurance claim liabilities transferred in conjunction with the sale of certain businesses reported as discontinued operations in previous years. To date, such insurance claims, representing per claim deductibles payable under third-party insurance policies, have been paid by the companies that assumed such liabilities. However, if all or a portion of such assumed claims are unable to be paid, the third-party insurers may have recourse against certain of the outstanding letters of credit provided by the Company in order to satisfy the unpaid claims deductible. No liability has been recorded by the Company for its guarantee of such claims, however, the total assumed liabilities in which the Company guarantees payment was estimated to be approximately $15 million at December 31, 2002.
SHAREHOLDERS’ EQUITY
At December 31, 2002, the Company had 62,209,277 Preferred Stock Purchase Rights (Rights) outstanding, which expire in March 2006. The Rights contain provisions to protect shareholders in the event of an unsolicited attempt to acquire the Company that is not believed by the Board of Directors to be in the best interest of shareholders. The Rights, evidenced by common stock certificates, are subject to anti-dilution provisions and are not exercisable, transferable or exchangeable apart from the common stock until 10 days after a person, or a group of affiliated or associated persons, acquires beneficial ownership of 10 percent or more or, in the case of exercise or transfer, makes a tender offer for 10 percent or more of the Company’s common stock. The Rights entitle the holder, except such an acquiring person, to purchase at the current exercise price of $100 that number of the Company’s common shares that at the time would have a market value of $200. In the event the Company is acquired in a merger or other business combination (including one in which the Company is the surviving corporation), each Right entitles its holder to purchase at the current exercise price of $100 that number of common shares of the surviving corporation which would then have a market value of $200. In lieu of common shares, Rights holders can purchase 1/100 of a share of Series C Preferred Stock for each Right. The Series C Preferred Stock would be entitled to quarterly dividends equal to the greater of $10 per share or 100 times the common stock dividend per share and have 100 votes per share, voting together with the common stock. By action of the Board of Directors, the Rights may also be exchanged in whole or in part, at an exchange ratio of one share of common stock per Right. The Rights have no voting rights and are redeemable, at the option of the Company, at a price of $0.01 per Right prior to the acquisition by a person or a group of persons affiliated or associated persons of beneficial ownership of 10 percent or more of the common stock.
EMPLOYEE STOCK OPTION AND STOCK PURCHASE PLANS
Option Plans
The Company sponsors various stock option and incentive plans which provide for the granting of options to employees and directors for purchase of common stock at prices equal to fair market value at the time of grant.
68
Options granted under all plans are for terms not exceeding 10 years and are exercisable cumulatively 20 to 50 percent each year based on the terms of the grant.
Key employee plans also provide for the issuance of stock appreciation rights, limited stock appreciation rights, restricted stock or stock units at no cost to the employee. The value of restricted stock, equal to the fair market value at the time of grant, is recorded in shareholders’ equity as deferred compensation and recognized as compensation expense as the restricted stock vests over the periods established for each grant. In 2002, 2001 and 2000, the Company granted 7,000, 167,575 and 194,400 shares of restricted stock at a weighted-average grant date fair value of $26.83, $20.62 and $18.19, respectively. Amortization of restricted stock totaled approximately $1 million in 2002 and 2001 and approximately $500,000 in 2000. Awards under a non-employee director plan may also be granted in tandem with restricted stock units at no cost to the grantee; 4,491 units, 3,502 units and 3,975 units were granted in 2002, 2001 and 2000, respectively. This compensation expense was not significant in 2002, 2001 or 2000. Outstanding restricted stock and the weighted-average grant date fair value of outstanding restricted stock as of December 31, 2002 was 315,756 shares and $20.52 per share, respectively.
The following table summarizes the status of the Company’s stock option plans:
Information about options in various price ranges at December 31, 2002 follows:
Purchase Plans
The Employee Stock Purchase Plan provides for periodic offerings to substantially all U.S. and Canadian employees to subscribe to shares of the Company’s common stock at 85 percent of the fair market value on either the date of offering or the last day of the purchase period, whichever is less. The stock purchase plan currently in effect provides for quarterly purchase periods. The U.K. Stock Purchase Scheme provides for periodic offerings to
69
2002 2001 2000
Weighted- Weighted- Weighted- Average Average Average Exercise Exercise Exercise Shares Price Shares Price Shares Price
(Shares in thousands)
Beginning of year 8,914 $ 24.43 8,772 $ 24.76 6,762 $ 27.77 Granted 1,292 26.91 849 20.45 2,969 18.61 Exercised (1,342 ) 21.92 (233 ) 17.32 (73 ) 14.11 Forfeited (245 ) 24.88 (474 ) 26.80 (886 ) 27.97 End of year 8,619 $ 25.18 8,914 $ 24.43 8,772 $ 24.76 Exercisable at end of year 5,576 $ 26.55 5,007 $ 27.01 4,123 $ 28.25 Available for future grant 4,160 N/A 5,151 N/A 2,477 N/A
Options Options Outstanding Exercisable
Remaining Weighted- Weighted-
Price Life Average Average Ranges Shares (in years) Price Shares Price
(Shares in thousands)
$ 10.00-20.00 1,597 6.7 $ 17.71 883 $ 17.60 20.00-25.00 1,657 6.0 21.49 575 22.47 25.00-30.00 4,346 4.4 26.98 3,100 27.00 30.00-38.00 1,019 4.0 35.25 1,018 35.25 Total 8,619 5.1 $ 25.18 5,576 $ 26.55

substantially all U.K. employees to subscribe to shares of the Company’s common stock at 85 percent of the fair market value on the date of the offering.
The following table summarizes the status of the Company’s stock purchase plans:
The following table sets forth the assumptions used in the Company’s valuation of stock option grants for pro forma disclosures of stock-based compensation determined under the fair value method of accounting:
70
2002 2001 2000
Weighted- Weighted- Weighted- Average Average Average Exercise Exercise Exercise Shares Price Shares Price Shares Price
(Shares in thousands)
Beginning of year 40 $ 30.28 63 $ 26.81 72 $ 27.00 Granted 436 20.53 413 15.44 379 16.03 Exercised (436 ) 20.53 (413 ) 15.44 (379 ) 16.03 Forfeited (40 ) 30.28 (23 ) 20.66 (9 ) 28.34 End of year — $ — 40 $ 30.28 63 $ 26.81 Exercisable at end of year — N/A — N/A 22 $ 20.66 Available for future grant 1,280 N/A 1,676 N/A 2,066 N/A
Years ended December 31
2002 2001 2000
Dividend yield 2.7 % 2.7 % 3.5 % Expected volatility 29.6 % 27.0 % 26.9 % Option plans: Risk-free interest rate 4.7 % 4.9 % 6.3 % Weighted-average expected life 6 years 7 years 7 years
Weighted-average grant-date fair value per
option $ 7.52 $ 5.69 $ 5.01 Purchase plans: Risk-free interest rate 2.0 % 3.3 % 5.8 % Weighted-average expected life .25 year .25 year .25 year
Weighted-average grant-date fair value per
option $ 5.09 $ 3.65 $ 4.08

EARNINGS PER SHARE INFORMATION
A reconciliation of the number of shares used in computing basic and diluted EPS follows:
EMPLOYEE BENEFIT PLANS
Pension Plans
The Company sponsors several defined benefit pension plans covering substantially all employees not covered by union-administered plans, including certain employees in foreign countries. These plans generally provide participants with benefits based on years of service and career-average compensation levels. The funding policy for these plans is to make contributions based on annual service costs plus amortization of unfunded past service liability but not greater than the maximum allowable contribution deductible for Federal income tax purposes. The majority of the plans’ assets are invested in a master trust which, in turn, is primarily invested in listed stocks and bonds. The Company also contributed to various defined benefit, union-administered, multi-employer plans for employees under collective bargaining agreements.
Pension (expense) income was as follows:
71
Years ended December 31
2002 2001 2000
(In thousands)
Weighted-average shares outstanding — Basic 61,571 60,083 59,567 Effect of dilutive options and unvested restricted stock 1,016 582 192 Weighted-average shares outstanding — Diluted 62,587 60,665 59,759 Anti-dilutive options not included above 4,368 6,793 6,446
Years ended December 31
2002 2001 2000
(In thousands)
Company-administered plans: Service cost $ (29,196 ) (26,248 ) (23,836 ) Interest cost (60,330 ) (58,306 ) (54,047 ) Expected return on plan assets 75,731 91,248 97,064 Amortization of transition asset 24 23 3,746 Recognized net actuarial (loss) gain (9,508 ) (514 ) 23,890 Amortization of prior service cost (2,276 ) (2,508 ) (2,501 ) (25,555 ) 3,695 44,316 Union-administered plans (3,384 ) (2,912 ) (2,610 ) Net pension (expense) income $ (28,939 ) 783 41,706

The following table sets forth the actuarial assumptions used for the Company’s dominant plan in determining annual pension expense:
The following table sets forth the balance sheet impact, as well as the benefit obligations, assets and funded status associated with the Company’s pension plans:
72
January 1
2002 2001 2000
Discount rate 7.00 % 7.50 % 7.75 % Rate of increase in compensation levels 5.00 % 5.00 % 5.00 % Expected long-term rate of return on plan assets 8.75 % 9.25 % 9.50 % Transition amortization in years 6 6 6 Gain and loss amortization in years 6 6 6
December 31
2002 2001
(In thousands)
Change in benefit obligations: Benefit obligations at January 1, $ 922,010 820,169 Service cost 29,196 26,248 Interest cost 60,330 58,306 Amendments (55 ) — Actuarial (gain) loss (17,061 ) 8,820 Benefits paid (39,450 ) (37,585 ) Change in discount rate assumption 55,667 49,249 Foreign currency exchange rate changes 12,945 (3,197 ) Benefit obligations at December 31, 1,023,582 922,010 Change in plan assets: Fair value of plan assets at January 1, 881,803 993,493 Actual return on plan assets (124,560 ) (79,472 ) Employer contribution 26,471 6,141 Plan participants’ contributions 2,889 2,631 Benefits paid (39,450 ) (37,585 ) Foreign currency exchange rate changes 9,311 (3,405 ) Fair value of plan assets at December 31, 756,464 881,803 Funded status (267,118 ) (40,207 ) Unrecognized transition asset (237 ) (237 ) Unrecognized prior service cost 13,156 15,412 Unrecognized net actuarial loss 403,750 168,494 Net amount recognized $ 149,551 143,462

Amounts recognized in the balance sheet consist of:
The following table sets forth the actuarial assumptions used for the Company’s dominant plan in determining funded status:
Information related to the Company’s pension plans with accumulated benefit obligations in excess of the fair value of plan assets is as follows:
Savings Plans
The Company also has defined contribution savings plans that cover substantially all eligible employees. Company contributions to the plans, which are based on employee contributions and the level of Company match, totaled approximately $13 million in 2002, $14 million in 2001 and $14 million in 2000.
Supplemental Pension and Deferred Compensation Plans
The Company has a non-qualified supplemental pension plan covering certain employees, which provides for incremental pension payments from the Company’s funds so that total pension payments equal amounts that would have been payable from the Company’s principal pension plans if it were not for limitations imposed by income tax regulations. The accrued pension expense liability related to this plan was $17 million and $16 million at December 31, 2002 and 2001, respectively.
The Company also has deferred compensation plans that permit eligible employees, officers and directors to defer a portion of their compensation. The deferred compensation liability, including Company matching amounts and accumulated earnings, totaled $19 million and $22 million at December 31, 2002 and 2001, respectively.
The Company has established grantor trusts (Rabbi Trusts) to provide funding for benefits payable under the supplemental pension plan and deferred compensation plans. The assets held in the trusts at December 31, 2002 and 2001 amounted to $30 million and $37 million, respectively. The Rabbi Trusts’ assets consist of short-term cash investments and a managed portfolio of equity securities, including the Company’s common stock. These assets, except for the investment in the Company’s common stock, are included in direct financing leases and other assets in the accompanying balance sheets because they are available to the general creditors of the Company in the event of the Company’s insolvency. The equity securities are classified as trading assets and stated at fair value. Both realized and unrealized gains and losses are included in miscellaneous (income) expense, net. The Rabbi
December 31
2002 2001
(In thousands)
Prepaid pension benefit cost (other assets) $ — 159,214 Accrued benefit liability (accrued expenses) (217,942 ) (18,854 ) Intangible assets 13,156 1,857 Accumulated other comprehensive loss (pre-tax) 354,337 1,245 Net amount recognized $ 149,551 143,462
December 31
2002 2001
Discount rate 6.50 % 7.00 % Rate of increase in compensation levels 5.00 % 5.00 %
December 31
2002 2001
(In thousands)
Projected benefit obligation $ 1,023,582 21,401 Accumulated benefit obligation 973,996 19,946 Fair value of plan assets 756,464 —

73
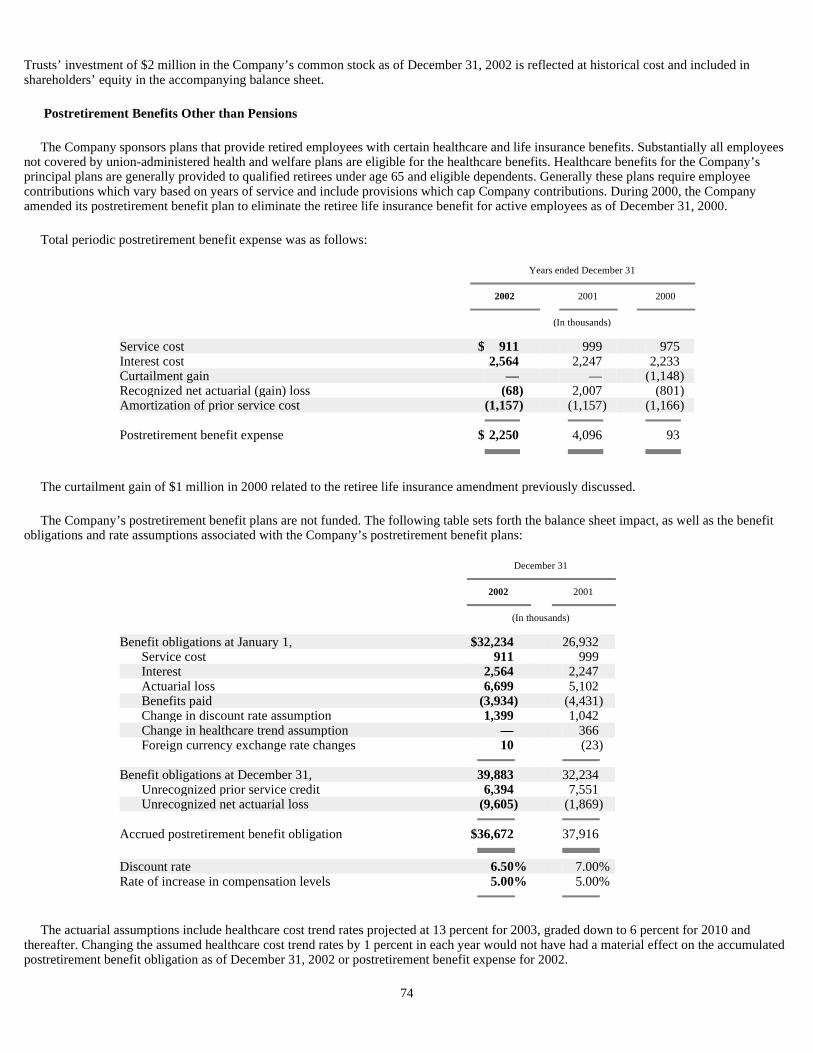
Trusts’ investment of $2 million in the Company’s common stock as of December 31, 2002 is reflected at historical cost and included in shareholders’ equity in the accompanying balance sheet.
Postretirement Benefits Other than Pensions
The Company sponsors plans that provide retired employees with certain healthcare and life insurance benefits. Substantially all employees not covered by union-administered health and welfare plans are eligible for the healthcare benefits. Healthcare benefits for the Company’s principal plans are generally provided to qualified retirees under age 65 and eligible dependents. Generally these plans require employee contributions which vary based on years of service and include provisions which cap Company contributions. During 2000, the Company amended its postretirement benefit plan to eliminate the retiree life insurance benefit for active employees as of December 31, 2000.
Total periodic postretirement benefit expense was as follows:
The curtailment gain of $1 million in 2000 related to the retiree life insurance amendment previously discussed.
The Company’s postretirement benefit plans are not funded. The following table sets forth the balance sheet impact, as well as the benefit obligations and rate assumptions associated with the Company’s postretirement benefit plans:
The actuarial assumptions include healthcare cost trend rates projected at 13 percent for 2003, graded down to 6 percent for 2010 and thereafter. Changing the assumed healthcare cost trend rates by 1 percent in each year would not have had a material effect on the accumulated postretirement benefit obligation as of December 31, 2002 or postretirement benefit expense for 2002.
74
Years ended December 31
2002 2001 2000
(In thousands)
Service cost $ 911 999 975 Interest cost 2,564 2,247 2,233 Curtailment gain — — (1,148 ) Recognized net actuarial (gain) loss (68 ) 2,007 (801 ) Amortization of prior service cost (1,157 ) (1,157 ) (1,166 ) Postretirement benefit expense $ 2,250 4,096 93
December 31
2002 2001
(In thousands)
Benefit obligations at January 1, $ 32,234 26,932 Service cost 911 999 Interest 2,564 2,247 Actuarial loss 6,699 5,102 Benefits paid (3,934 ) (4,431 ) Change in discount rate assumption 1,399 1,042 Change in healthcare trend assumption — 366 Foreign currency exchange rate changes 10 (23 ) Benefit obligations at December 31, 39,883 32,234 Unrecognized prior service credit 6,394 7,551 Unrecognized net actuarial loss (9,605 ) (1,869 ) Accrued postretirement benefit obligation $ 36,672 37,916 Discount rate 6.50 % 7.00 % Rate of increase in compensation levels 5.00 % 5.00 %

ENVIRONMENTAL MATTERS
The Company’s operations involve storing and dispensing petroleum products, primarily diesel fuel. In 1988, the Environmental Protection Agency (EPA) issued regulations that established requirements for testing and replacing underground storage tanks. During 1998, the Company completed its tank replacement program to comply with the regulations. In addition, the Company has received notices from the EPA and others that it has been identified as a potentially responsible party under the Comprehensive Environmental Response, Compensation and Liability Act, the Superfund Amendments and Reauthorization Act and similar state statutes and may be required to share in the cost of cleanup of 26 identified disposal sites.
The Company’s environmental expenses, which included remediation costs as well as normal recurring expenses such as licensing, testing and waste disposal fees, were $10 million in 2002, $7 million in 2001 and $5 million in 2000. The carrying amount of the Company’s environmental liabilities was $12 million at December 31, 2002 and 2001.
The ultimate cost of the Company’s environmental liabilities cannot presently be projected with certainty due to the presence of several unknown factors, primarily the level of contamination, the effectiveness of selected remediation methods, the stage of investigation at individual sites, the determination of the Company’s liability in proportion to other responsible parties and the recoverability of such costs from third parties. Based on information presently available, management believes that the ultimate disposition of these matters, although potentially material to the results of operations in any one year, will not have a material adverse effect on the Company’s financial condition or liquidity.
OTHER MATTERS
In 2000, the Company settled long-standing litigation with a former customer, OfficeMax, relating to a logistics services agreement that was terminated in 1997. In the final settlement, OfficeMax is paying the Company a total of $5 million over the five years following the settlement. The Company will not pay anything to OfficeMax. Further, the settlement is backed by a $5 million letter of credit, obtained by OfficeMax, naming the Company as the beneficiary.
The Company is also a party to various other claims, legal actions and complaints arising in the ordinary course of business. While any proceeding or litigation has an element of uncertainty, management believes that the disposition of these matters will not have a material impact on the consolidated financial position, liquidity or results of operations of the Company.
SEGMENT REPORTING
The Company’s operating segments are aggregated into reportable business segments based primarily upon similar economic characteristics, products, services and delivery methods. The Company operates in three reportable business segments: (1) FMS, which provides full service leasing, commercial rental and programmed maintenance of trucks, tractors and trailers to customers, principally in the U.S., Canada and the U.K.; (2) SCS, which provides comprehensive supply chain consulting and lead logistics management solutions that support customers’ entire supply chains, from inbound raw materials through distribution of finished goods throughout North America, in Latin America, Europe and Asia; and (3) DCC, which provides vehicles and drivers as part of a dedicated transportation solution, principally in North America.
Beginning in the first quarter of 2002, the primary measurement of segment financial performance, defined as “Net Before Taxes” (NBT), includes an allocation of Central Support Services (CSS) and excludes goodwill impairment, goodwill amortization and restructuring and other charges, net. CSS represents those costs incurred to support all business segments, including sales and marketing, human resources, finance, corporate services, shared management information systems, customer solutions, health and safety, legal and communications. The objective of the NBT measurement is to provide clarity on the profitability of each business segment and, ultimately, to hold leadership of
75
each business segment and each operating segment within each business segment accountable for their allocated share of CSS costs. To facilitate the comparison of 2002 business segment NBT to prior periods, prior-year goodwill amortization (see “Summary of Significant Accounting Policies — Goodwill and Other Intangible Assets”) is now treated as a corporate, rather than segment, cost and is segregated as such. Prior year segment results have been restated to conform to the new measurement of segment financial performance.
Certain costs are considered to be overhead not attributable to any segment and as such, remain unallocated in CSS. Included among the unallocated overhead remaining within CSS are the costs for investor relations, corporate communications, public affairs and certain executive compensation.
CSS costs attributable to the business segments are generally allocated to FMS, SCS and DCC as follows:
The FMS segment leases revenue earning equipment and provides fuel, maintenance and other ancillary services to the SCS and DCC segments. Inter-segment revenues and NBT are accounted for at approximate fair value as if the transactions were made with independent third parties. NBT related to inter-segment equipment and services billed to customers (equipment contribution) is included in both FMS and the business segment which served the customer, then eliminated (presented as “Eliminations”). Equipment contribution included in SCS NBT was $16 million in 2002, $17 million in 2001 and $20 million in 2000. Equipment contribution included in DCC NBT was $19 million in 2002, $20 million in 2001 and $22 million in 2000. Interest expense is primarily allocated to the FMS business segment since such borrowings are used principally to fund the purchase of revenue earning equipment used in FMS; however, with the availability of segment balance sheet information in 2002 (including targeted segment leverage ratios), interest expense (income) is also reflected in SCS and DCC.
76
• Sales and marketing, finance, corporate services and health and safety — allocated based upon estimated and planned resource utilization.
• Human resources — individual costs within this category are allocated in several ways, including allocation based on estimated
utilization and number of personnel supported. • Information Technology — allocated principally based upon utilization-related metrics such as number of users or minutes of CPU
time. • Customer Solutions — represents project costs and expenses incurred in excess of amounts billable to customers during the period.
Expenses are allocated to the business segment responsible for the project. • Other — represents purchasing, legal, and other centralized costs and expenses including certain incentive compensation costs.
Expenses, where allocated, are based primarily on the number of personnel supported.
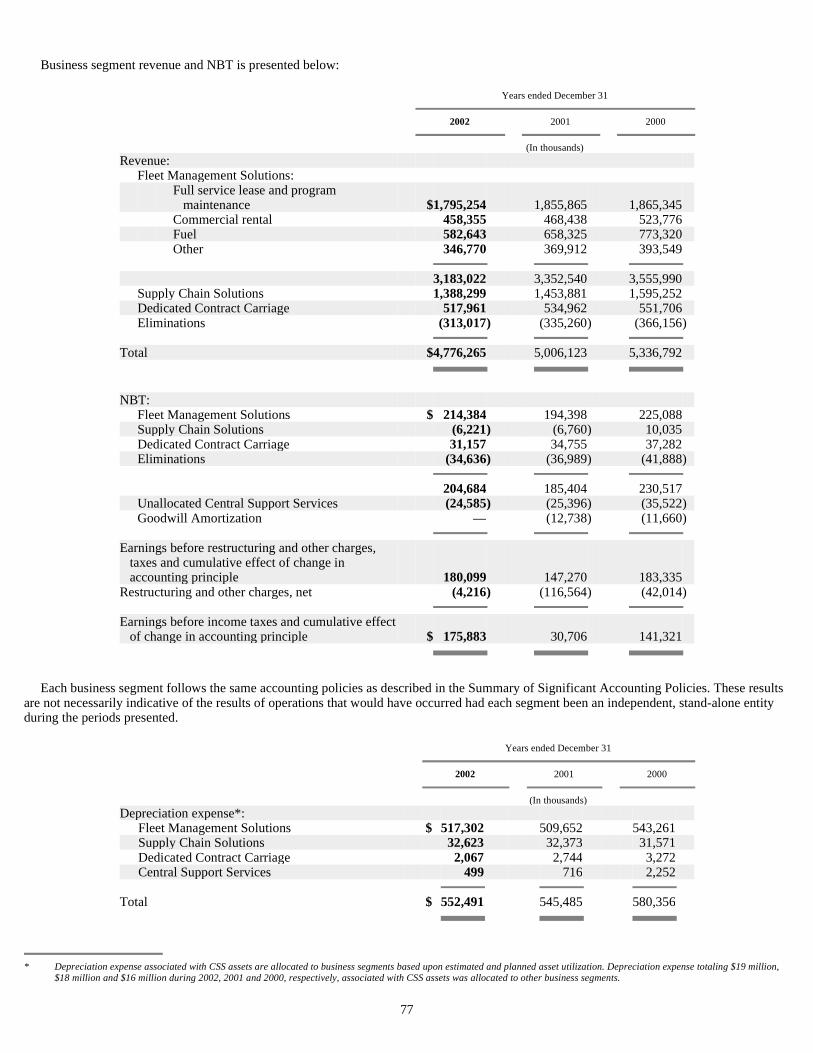
Business segment revenue and NBT is presented below:
Each business segment follows the same accounting policies as described in the Summary of Significant Accounting Policies. These results are not necessarily indicative of the results of operations that would have occurred had each segment been an independent, stand-alone entity during the periods presented.
77
Years ended December 31
2002 2001 2000
(In thousands)
Revenue: Fleet Management Solutions:
Full service lease and program
maintenance $ 1,795,254 1,855,865 1,865,345 Commercial rental 458,355 468,438 523,776 Fuel 582,643 658,325 773,320 Other 346,770 369,912 393,549 3,183,022 3,352,540 3,555,990 Supply Chain Solutions 1,388,299 1,453,881 1,595,252 Dedicated Contract Carriage 517,961 534,962 551,706 Eliminations (313,017 ) (335,260 ) (366,156 ) Total $ 4,776,265 5,006,123 5,336,792 NBT: Fleet Management Solutions $ 214,384 194,398 225,088 Supply Chain Solutions (6,221 ) (6,760 ) 10,035 Dedicated Contract Carriage 31,157 34,755 37,282 Eliminations (34,636 ) (36,989 ) (41,888 ) 204,684 185,404 230,517 Unallocated Central Support Services (24,585 ) (25,396 ) (35,522 ) Goodwill Amortization — (12,738 ) (11,660 ) Earnings before restructuring and other charges,
taxes and cumulative effect of change in accounting principle 180,099 147,270 183,335
Restructuring and other charges, net (4,216 ) (116,564 ) (42,014 ) Earnings before income taxes and cumulative effect
of change in accounting principle $ 175,883 30,706 141,321
Years ended December 31
2002 2001 2000
(In thousands)
Depreciation expense*: Fleet Management Solutions $ 517,302 509,652 543,261 Supply Chain Solutions 32,623 32,373 31,571 Dedicated Contract Carriage 2,067 2,744 3,272 Central Support Services 499 716 2,252 Total $ 552,491 545,485 580,356
* Depreciation expense associated with CSS assets are allocated to business segments based upon estimated and planned asset utilization. Depreciation expense totaling $19 million, $18 million and $16 million during 2002, 2001 and 2000, respectively, associated with CSS assets was allocated to other business segments.

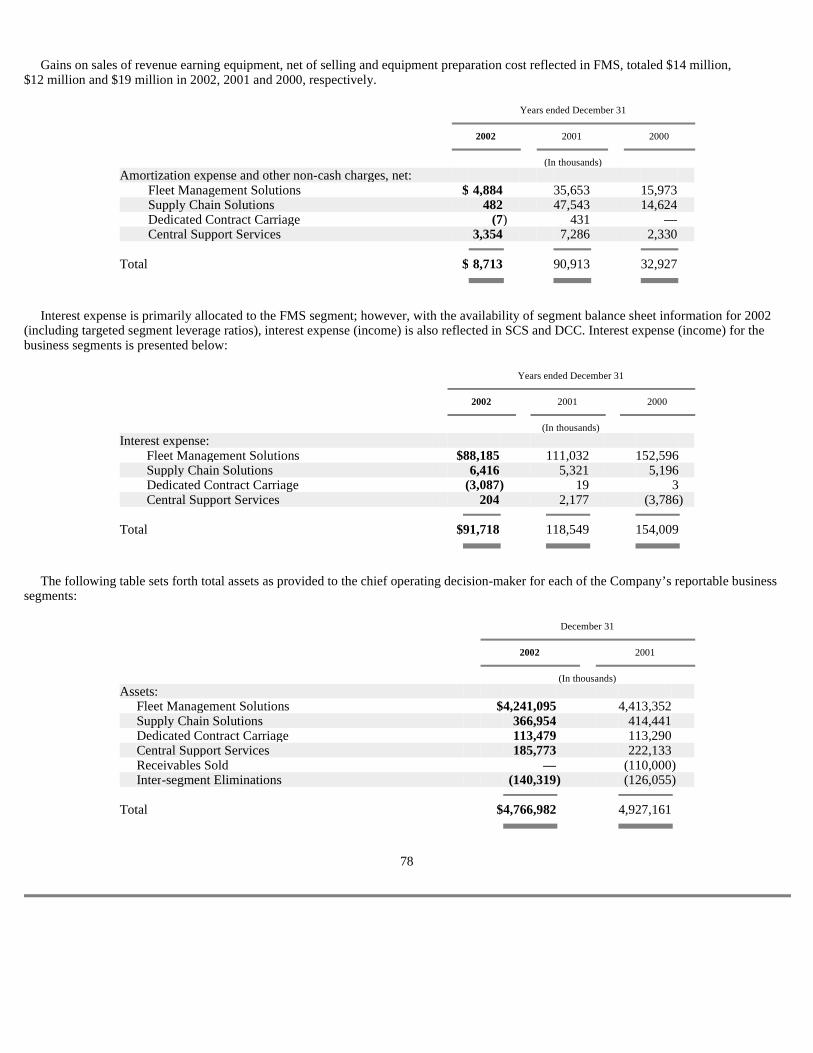
Gains on sales of revenue earning equipment, net of selling and equipment preparation cost reflected in FMS, totaled $14 million, $12 million and $19 million in 2002, 2001 and 2000, respectively.
Interest expense is primarily allocated to the FMS segment; however, with the availability of segment balance sheet information for 2002 (including targeted segment leverage ratios), interest expense (income) is also reflected in SCS and DCC. Interest expense (income) for the business segments is presented below:
The following table sets forth total assets as provided to the chief operating decision-maker for each of the Company’s reportable business segments:
78
Years ended December 31
2002 2001 2000
(In thousands)
Amortization expense and other non-cash charges, net: Fleet Management Solutions $ 4,884 35,653 15,973 Supply Chain Solutions 482 47,543 14,624 Dedicated Contract Carriage (7 ) 431 — Central Support Services 3,354 7,286 2,330 Total $ 8,713 90,913 32,927
Years ended December 31
2002 2001 2000
(In thousands)
Interest expense: Fleet Management Solutions $ 88,185 111,032 152,596 Supply Chain Solutions 6,416 5,321 5,196 Dedicated Contract Carriage (3,087 ) 19 3 Central Support Services 204 2,177 (3,786 ) Total $ 91,718 118,549 154,009
December 31
2002 2001 (In thousands)
Assets: Fleet Management Solutions $ 4,241,095 4,413,352 Supply Chain Solutions 366,954 414,441 Dedicated Contract Carriage 113,479 113,290 Central Support Services 185,773 222,133 Receivables Sold — (110,000 ) Inter-segment Eliminations (140,319 ) (126,055 ) Total $ 4,766,982 4,927,161
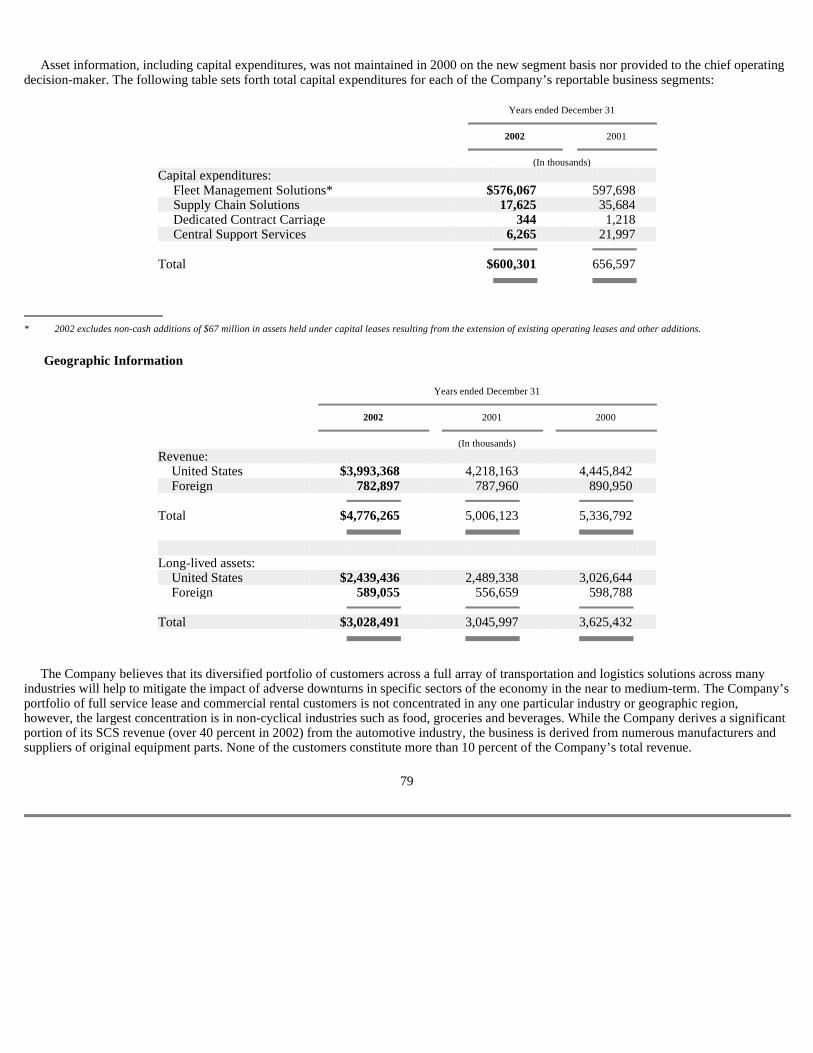
Asset information, including capital expenditures, was not maintained in 2000 on the new segment basis nor provided to the chief operating decision-maker. The following table sets forth total capital expenditures for each of the Company’s reportable business segments:
Geographic Information
The Company believes that its diversified portfolio of customers across a full array of transportation and logistics solutions across many industries will help to mitigate the impact of adverse downturns in specific sectors of the economy in the near to medium-term. The Company’s portfolio of full service lease and commercial rental customers is not concentrated in any one particular industry or geographic region, however, the largest concentration is in non-cyclical industries such as food, groceries and beverages. While the Company derives a significant portion of its SCS revenue (over 40 percent in 2002) from the automotive industry, the business is derived from numerous manufacturers and suppliers of original equipment parts. None of the customers constitute more than 10 percent of the Company’s total revenue.
79
Years ended December 31
2002 2001
(In thousands)
Capital expenditures: Fleet Management Solutions* $ 576,067 597,698 Supply Chain Solutions 17,625 35,684 Dedicated Contract Carriage 344 1,218 Central Support Services 6,265 21,997 Total $ 600,301 656,597
* 2002 excludes non-cash additions of $67 million in assets held under capital leases resulting from the extension of existing operating leases and other additions.
Years ended December 31
2002 2001 2000
(In thousands)
Revenue: United States $ 3,993,368 4,218,163 4,445,842 Foreign 782,897 787,960 890,950 Total $ 4,776,265 5,006,123 5,336,792 Long-lived assets: United States $ 2,439,436 2,489,338 3,026,644 Foreign 589,055 556,659 598,788 Total $ 3,028,491 3,045,997 3,625,432
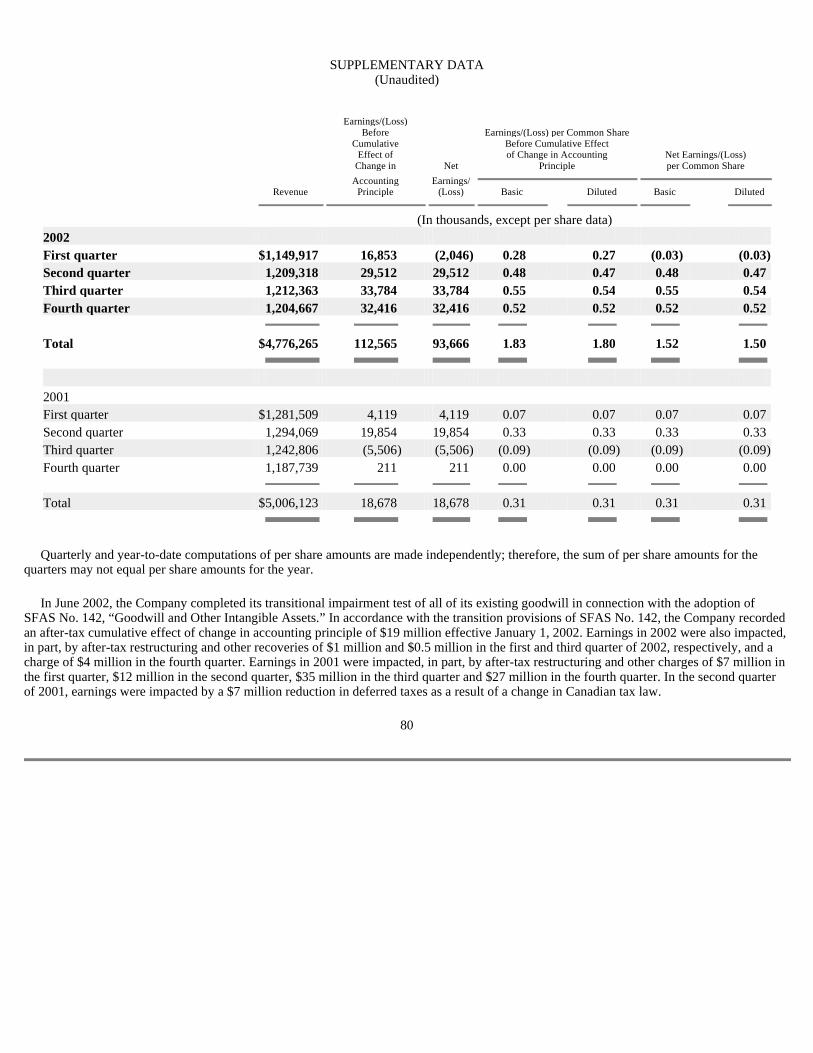
SUPPLEMENTARY DATA (Unaudited)
Quarterly and year-to-date computations of per share amounts are made independently; therefore, the sum of per share amounts for the quarters may not equal per share amounts for the year.
In June 2002, the Company completed its transitional impairment test of all of its existing goodwill in connection with the adoption of SFAS No. 142, “Goodwill and Other Intangible Assets.” In accordance with the transition provisions of SFAS No. 142, the Company recorded an after-tax cumulative effect of change in accounting principle of $19 million effective January 1, 2002. Earnings in 2002 were also impacted, in part, by after-tax restructuring and other recoveries of $1 million and $0.5 million in the first and third quarter of 2002, respectively, and a charge of $4 million in the fourth quarter. Earnings in 2001 were impacted, in part, by after-tax restructuring and other charges of $7 million in the first quarter, $12 million in the second quarter, $35 million in the third quarter and $27 million in the fourth quarter. In the second quarter of 2001, earnings were impacted by a $7 million reduction in deferred taxes as a result of a change in Canadian tax law.
80
Earnings/(Loss) Before Earnings/(Loss) per Common Share Cumulative Before Cumulative Effect Effect of of Change in Accounting Net Earnings/(Loss) Change in Net Principle per Common Share
Accounting Earnings/ Revenue Principle (Loss) Basic Diluted Basic Diluted
(In thousands, except per share data) 2002 First quarter $ 1,149,917 16,853 (2,046 ) 0.28 0.27 (0.03 ) (0.03 ) Second quarter 1,209,318 29,512 29,512 0.48 0.47 0.48 0.47 Third quarter 1,212,363 33,784 33,784 0.55 0.54 0.55 0.54 Fourth quarter 1,204,667 32,416 32,416 0.52 0.52 0.52 0.52
Total $ 4,776,265 112,565 93,666 1.83 1.80 1.52 1.50
2001 First quarter $ 1,281,509 4,119 4,119 0.07 0.07 0.07 0.07 Second quarter 1,294,069 19,854 19,854 0.33 0.33 0.33 0.33 Third quarter 1,242,806 (5,506 ) (5,506 ) (0.09 ) (0.09 ) (0.09 ) (0.09 ) Fourth quarter 1,187,739 211 211 0.00 0.00 0.00 0.00
Total $ 5,006,123 18,678 18,678 0.31 0.31 0.31 0.31
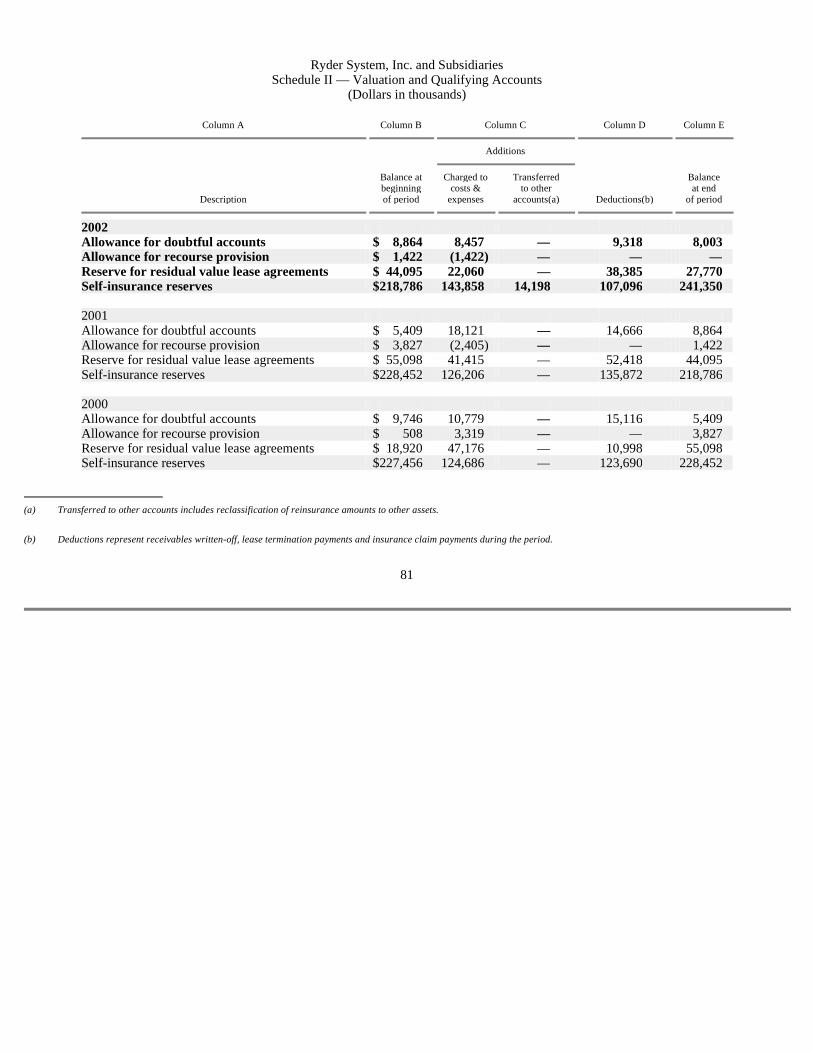
Ryder System, Inc. and Subsidiaries Schedule II — Valuation and Qualifying Accounts
(Dollars in thousands)
81
Column A Column B Column C Column D Column E
Additions
Balance at Charged to Transferred Balance beginning costs & to other at end
Description of period expenses accounts(a) Deductions(b) of period
2002 Allowance for doubtful accounts $ 8,864 8,457 — 9,318 8,003 Allowance for recourse provision $ 1,422 (1,422 ) — — — Reserve for residual value lease agreements $ 44,095 22,060 — 38,385 27,770 Self-insurance reserves $ 218,786 143,858 14,198 107,096 241,350 2001 Allowance for doubtful accounts $ 5,409 18,121 — 14,666 8,864 Allowance for recourse provision $ 3,827 (2,405 ) — — 1,422 Reserve for residual value lease agreements $ 55,098 41,415 — 52,418 44,095 Self-insurance reserves $ 228,452 126,206 — 135,872 218,786 2000 Allowance for doubtful accounts $ 9,746 10,779 — 15,116 5,409 Allowance for recourse provision $ 508 3,319 — — 3,827 Reserve for residual value lease agreements $ 18,920 47,176 — 10,998 55,098 Self-insurance reserves $ 227,456 124,686 — 123,690 228,452
(a) Transferred to other accounts includes reclassification of reinsurance amounts to other assets.
(b) Deductions represent receivables written-off, lease termination payments and insurance claim payments during the period.
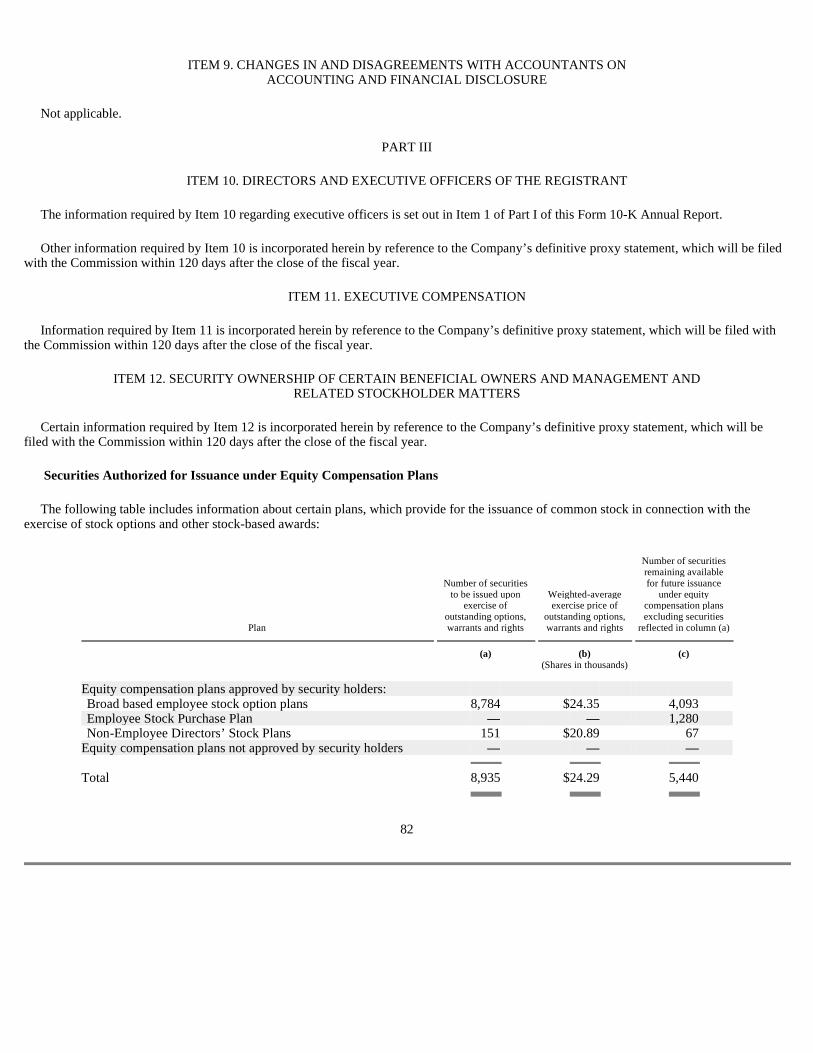
ITEM 9. CHANGES IN AND DISAGREEMENTS WITH ACCOUNTANTS ON ACCOUNTING AND FINANCIAL DISCLOSURE
Not applicable.
PART III
ITEM 10. DIRECTORS AND EXECUTIVE OFFICERS OF THE REGISTRANT
The information required by Item 10 regarding executive officers is set out in Item 1 of Part I of this Form 10-K Annual Report.
Other information required by Item 10 is incorporated herein by reference to the Company’s definitive proxy statement, which will be filed with the Commission within 120 days after the close of the fiscal year.
ITEM 11. EXECUTIVE COMPENSATION
Information required by Item 11 is incorporated herein by reference to the Company’s definitive proxy statement, which will be filed with the Commission within 120 days after the close of the fiscal year.
ITEM 12. SECURITY OWNERSHIP OF CERTAIN BENEFICIAL OWNERS AND MANAGEMENT AND RELATED STOCKHOLDER MATTERS
Certain information required by Item 12 is incorporated herein by reference to the Company’s definitive proxy statement, which will be filed with the Commission within 120 days after the close of the fiscal year.
Securities Authorized for Issuance under Equity Compensation Plans
The following table includes information about certain plans, which provide for the issuance of common stock in connection with the exercise of stock options and other stock-based awards:
82
Number of securities remaining available Number of securities for future issuance to be issued upon Weighted-average under equity exercise of exercise price of compensation plans outstanding options, outstanding options, excluding securities
Plan warrants and rights warrants and rights reflected in column (a)
(a) (b) (c) (Shares in thousands)
Equity compensation plans approved by security holders: Broad based employee stock option plans 8,784 $ 24.35 4,093 Employee Stock Purchase Plan — — 1,280 Non-Employee Directors’ Stock Plans 151 $ 20.89 67 Equity compensation plans not approved by security holders — — — Total 8,935 $ 24.29 5,440

ITEM 13. CERTAIN RELATIONSHIPS AND RELATED TRANSACTIONS
Information required by Item 13 is incorporated herein by reference to the Company’s definitive proxy statement, which will be filed with the Commission within 120 days after the close of the fiscal year.
ITEM 14. CONTROLS AND PROCEDURES
Within the 90 days prior to the filing date of this Annual Report, the Company carried out an evaluation, under the supervision and with the participation of the Company’s management, including the Company’s Chief Executive Officer and Chief Financial Officer, of the effectiveness of the design and operation of the Company’s disclosure controls and procedures (as defined in Rules 13a-14(c) and 15d-14(c) under the Securities Exchange Act of 1934). Based upon that evaluation, the Chief Executive Officer and Chief Financial Officer concluded that the Company’s disclosure controls and procedures are effective in ensuring that information required to be disclosed in the reports the Company files and submits under the Exchange Act are recorded, processed, summarized and reported as and when required.
There were no significant changes in the Company’s internal controls or in other factors that could significantly affect such internal controls subsequent to the date of the evaluation described in the paragraph above, including any corrective actions with regard to significant deficiencies and material weaknesses.
83
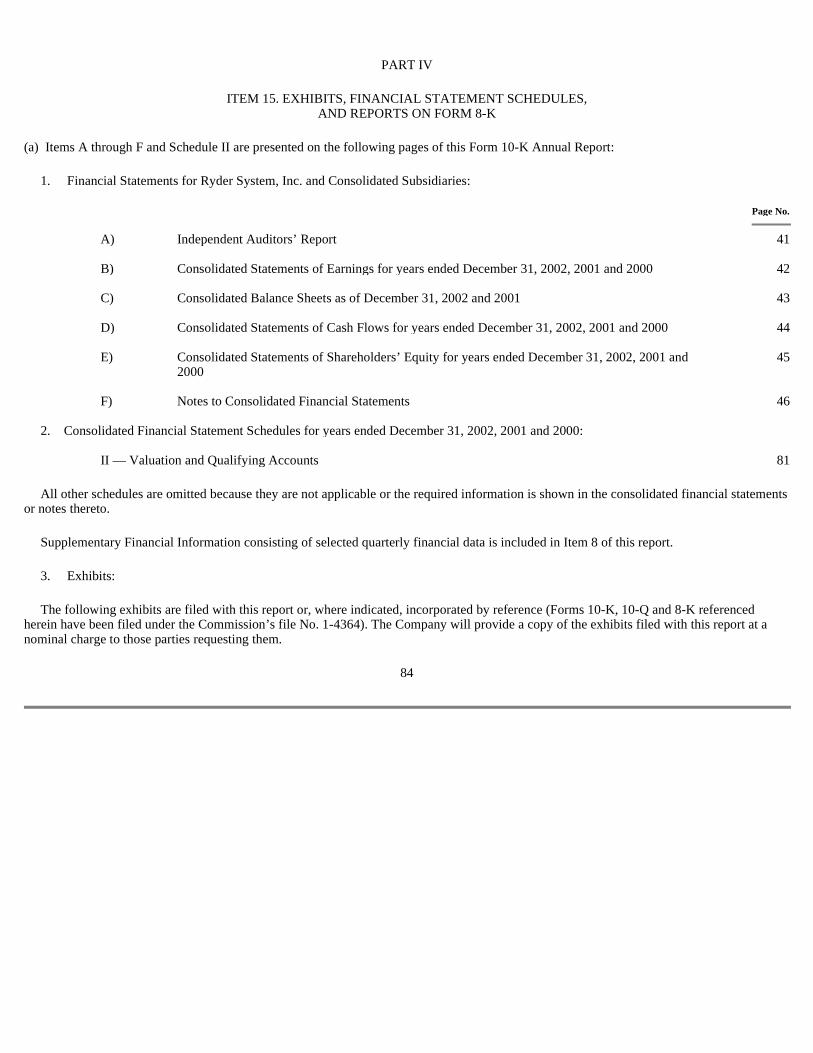
PART IV
ITEM 15. EXHIBITS, FINANCIAL STATEMENT SCHEDULES, AND REPORTS ON FORM 8-K
(a) Items A through F and Schedule II are presented on the following pages of this Form 10-K Annual Report:
1. Financial Statements for Ryder System, Inc. and Consolidated Subsidiaries:
All other schedules are omitted because they are not applicable or the required information is shown in the consolidated financial statements or notes thereto.
Supplementary Financial Information consisting of selected quarterly financial data is included in Item 8 of this report.
3. Exhibits:
The following exhibits are filed with this report or, where indicated, incorporated by reference (Forms 10-K, 10-Q and 8-K referenced herein have been filed under the Commission’s file No. 1-4364). The Company will provide a copy of the exhibits filed with this report at a nominal charge to those parties requesting them.
84
Page No.
A) Independent Auditors’ Report 41 B) Consolidated Statements of Earnings for years ended December 31, 2002, 2001 and 2000 42 C) Consolidated Balance Sheets as of December 31, 2002 and 2001 43 D) Consolidated Statements of Cash Flows for years ended December 31, 2002, 2001 and 2000 44
E)
Consolidated Statements of Shareholders’ Equity for years ended December 31, 2002, 2001 and 2000
45
F) Notes to Consolidated Financial Statements 46 2. Consolidated Financial Statement Schedules for years ended December 31, 2002, 2001 and 2000: II — Valuation and Qualifying Accounts 81

EXHIBIT INDEX
85
Exhibit Number Description
3.1
The Ryder System, Inc. Restated Articles of Incorporation, dated November 8, 1985, as amended through May 18, 1990, previously filed with the Commission as an exhibit to the Company’s Annual Report on Form 10-K for the year ended December 31, 1990, are incorporated by reference into this report.
3.2
The Ryder System, Inc. By-Laws, as amended through February 16, 2001, previously filed with the Commission as an exhibit to the Company’s Annual Report on Form 10-K for the year ended December 31, 2000, are incorporated by reference into this report.
4.1
The Company hereby agrees, pursuant to paragraph (b)(4)(iii) of Item 601 of Regulation S-K, to furnish the Commission with a copy of any instrument defining the rights of holders of long-term debt of the Company, where such instrument has not been filed as an exhibit hereto and the total amount of securities authorized thereunder does not exceed 10 percent of the total assets of the Company and its subsidiaries on a consolidated basis.
4.2(a)
The Form of Indenture between Ryder System, Inc. and The Chase Manhattan Bank (National Association) dated as of June 1, 1984, filed with the Commission on November 19, 1985 as an exhibit to the Company’s Registration Statement on Form S-3 (No. 33-1632), is incorporated by reference into this report.
4.2(b)
The First Supplemental Indenture between Ryder System, Inc. and The Chase Manhattan Bank (National Association) dated October 1, 1987, previously filed with the Commission as an exhibit to the Company’s Annual Report on Form 10-K for the year ended December 31, 1994, is incorporated by reference into this report.
4.3
The Form of Indenture between Ryder System, Inc. and The Chase Manhattan Bank (National Association) dated as of May 1, 1987, and supplemented as of November 15, 1990 and June 24, 1992, filed with the Commission on July 30, 1992 as an exhibit to the Company’s Registration Statement on Form S-3 (No. 33-50232), is incorporated by reference into this report.
4.4
The Rights Agreement between Ryder System, Inc. and Boston Equiserve, L.P., dated as of March 8, 1996, filed with the Commission on April 3, 1996 as an exhibit to the Company’s Registration Statement on Form 8-A is incorporated by reference into this report.
10.1
The form of change of control severance agreement for executive officers effective as of May 1, 1996, previously filed with the Commission as an exhibit to the Company’s Annual Report on Form 10-K for the year ended December 31, 1996, is incorporated by reference to this report.
10.2
The form of severance agreement for executive officers effective as of May 1, 1996, previously filed with the Commission as an exhibit to the Company’s Annual Report on Form 10-K for the year ended December 31, 1996, is incorporated by reference to this report.
10.3(a)
The Ryder System, Inc. 1997 Incentive Compensation Plan for Headquarters Executive Management Levels MS 11 and Higher, previously filed with the Commission as an exhibit to the Company’s Annual Report on Form 10-K for the year ended December 31, 1996, is incorporated by reference to this report.
10.3(b)
The Ryder System, Inc. 1998 Incentive Compensation Plan for Headquarters Executive Management Level MS 11 and Higher, previously filed with the Commission as an exhibit to the Company’s Annual

86
Exhibit Number Description
Report on Form 10-K for the year ended December 31, 1997, is incorporated by reference into this report.
10.3(c)
The Ryder System, Inc. 1999 Incentive Compensation Plan for Headquarters Executive Management Levels MS 11 and Higher, previously filed with the Commission as an exhibit to the Company’s Annual Report on Form 10-K for the year ended December 31, 1998, is incorporated by reference into this report.
10.3(d)
The Ryder System, Inc. 2000 Incentive Compensation Plan for Headquarters Executive Management Levels MS 11 and Higher, previously filed with the Commission as an exhibit to the Company’s Annual Report on Form 10-K for the year ended December 31, 2000, is incorporated by reference into this report.
10.4(a)
The Ryder System, Inc. 1980 Stock Incentive Plan, as amended and restated as of August 15, 1996, previously filed with the Commission as an exhibit to the Company’s Annual Report on Form 10-K for the year ended December 31, 1997, is incorporated by reference into this report.
10.4(b)
The form of Ryder System, Inc. 1980 Stock Incentive Plan, United Kingdom Section, dated May 4, 1995, previously filed with the Commission as an exhibit to the Company’s Annual Report on Form 10-K for the year ended December 31, 1995, is incorporated by reference into this report.
10.4(c)
The form of Ryder System, Inc. 1980 Stock Incentive Plan, United Kingdom Section, dated October 3, 1995, previously filed with the Commission as an exhibit to the Company’s Annual Report on Form 10-K for the year ended December 31, 1995, is incorporated by reference into this report.
10.4(d)
The Ryder System, Inc. 1995 Stock Incentive Plan, as amended and restated as of August 15, 1996, previously filed with the Commission as an exhibit to the Company’s Annual Report on Form 10-K for the year ended December 31, 1997, is incorporated by reference into this report.
10.4(e)
The Ryder System, Inc. 1995 Stock Incentive Plan, as amended and restated as of May 5, 2000, previously filed with the Commission as an exhibit to the Company’s Annual Report or Form 10-K for the year ended 2000, is incorporated by reference into this report.
10.4(f)
The Ryder System, Inc. 1995 Stock Incentive Plan, as amended and restated at May 4, 2001, previously filed with the Commission as an exhibit to the Company’s report on Form 10-Q for the quarter ended September 30, 2001, is incorporated by reference into this report.
10.5(a)
The Ryder System, Inc. Directors Stock Plan, as amended and restated as of December 17, 1993, previously filed with the Commission as an exhibit to the Company’s Annual Report on Form 10-K for the year ended December 31, 1993, is incorporated by reference into this report.
10.5(b)
The Ryder System, Inc. Directors Stock Award Plan dated as of May 2, 1997, as amended and restated as of December 17, 1998, previously filed with the Commission as an exhibit to the Company’s Annual Report on Form 10-K for the year ended December 31, 1997, is incorporated by reference into this report.
10.5(c)
The Ryder System, Inc. Directors Stock Plan, as amended and restated at May 4, 2001, previously filed with the Commission as an Exhibit to the Company’s Report on Form 10-Q for the quarter ended September 30, 2001, is incorporated by reference into this report.
10.6(a)
The Ryder System Benefit Restoration Plan, effective January 1, 1985, previously filed with the Commission as an exhibit to the Company’s Annual Report on Form 10-K for the year ended December 31, 1992, is incorporated by reference into this report.

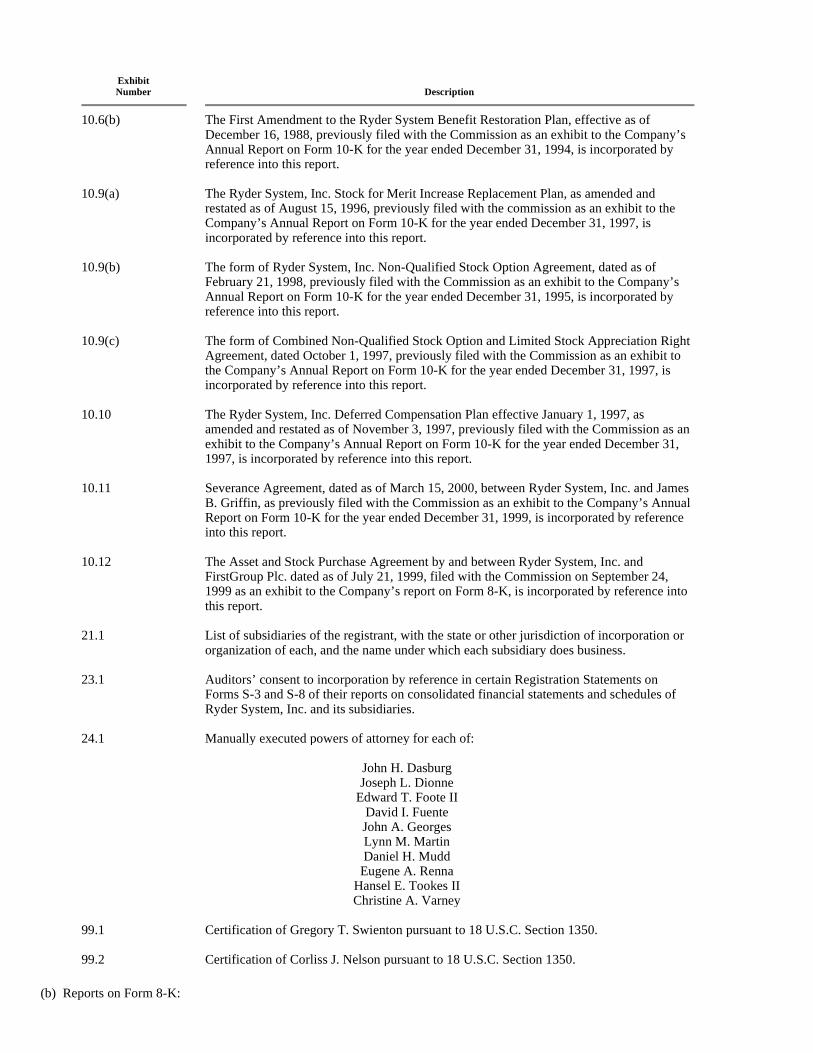
(b) Reports on Form 8-K:
Exhibit Number Description
10.6(b)
The First Amendment to the Ryder System Benefit Restoration Plan, effective as of December 16, 1988, previously filed with the Commission as an exhibit to the Company’s Annual Report on Form 10-K for the year ended December 31, 1994, is incorporated by reference into this report.
10.9(a)
The Ryder System, Inc. Stock for Merit Increase Replacement Plan, as amended and restated as of August 15, 1996, previously filed with the commission as an exhibit to the Company’s Annual Report on Form 10-K for the year ended December 31, 1997, is incorporated by reference into this report.
10.9(b)
The form of Ryder System, Inc. Non-Qualified Stock Option Agreement, dated as of February 21, 1998, previously filed with the Commission as an exhibit to the Company’s Annual Report on Form 10-K for the year ended December 31, 1995, is incorporated by reference into this report.
10.9(c)
The form of Combined Non-Qualified Stock Option and Limited Stock Appreciation Right Agreement, dated October 1, 1997, previously filed with the Commission as an exhibit to the Company’s Annual Report on Form 10-K for the year ended December 31, 1997, is incorporated by reference into this report.
10.10
The Ryder System, Inc. Deferred Compensation Plan effective January 1, 1997, as amended and restated as of November 3, 1997, previously filed with the Commission as an exhibit to the Company’s Annual Report on Form 10-K for the year ended December 31, 1997, is incorporated by reference into this report.
10.11
Severance Agreement, dated as of March 15, 2000, between Ryder System, Inc. and James B. Griffin, as previously filed with the Commission as an exhibit to the Company’s Annual Report on Form 10-K for the year ended December 31, 1999, is incorporated by reference into this report.
10.12
The Asset and Stock Purchase Agreement by and between Ryder System, Inc. and FirstGroup Plc. dated as of July 21, 1999, filed with the Commission on September 24, 1999 as an exhibit to the Company’s report on Form 8-K, is incorporated by reference into this report.
21.1
List of subsidiaries of the registrant, with the state or other jurisdiction of incorporation or organization of each, and the name under which each subsidiary does business.
23.1
Auditors’ consent to incorporation by reference in certain Registration Statements on Forms S-3 and S-8 of their reports on consolidated financial statements and schedules of Ryder System, Inc. and its subsidiaries.
24.1 Manually executed powers of attorney for each of:
John H. Dasburg Joseph L. Dionne
Edward T. Foote II David I. Fuente John A. Georges Lynn M. Martin Daniel H. Mudd Eugene A. Renna
Hansel E. Tookes II Christine A. Varney
99.1 Certification of Gregory T. Swienton pursuant to 18 U.S.C. Section 1350. 99.2 Certification of Corliss J. Nelson pursuant to 18 U.S.C. Section 1350.

87
(c) Executive Compensation Plans and Arrangements:
Please refer to the description of Exhibits 10.1 through 10.12 set forth under Item 15(a)3 of this report for a listing of all management contracts and compensation plans and arrangements filed with this report pursuant to Item 601(b)(10) of Regulation S-K.
88
(i) The Company filed a report on Form 8-K on November 19, 2002 relating to a presentation on its pension plans and certain related information.
(ii) The Company filed a report on Form 8-K on December 20, 2002 relating to its 2003 earnings forecast and a presentation made by the
Company in connection therewith.
SIGNATURES
Pursuant to the requirements of Section 13 or 15(d) of the Securities Exchange Act of 1934, the registrant has duly caused this report to be signed on its behalf by the undersigned, thereunto duly authorized.
Pursuant to the requirements of the Securities Exchange Act of 1934, this report has been signed below by the following persons on behalf of the registrant and in the capacities and on the dates indicated.
89
Date: March 3, 2003 RYDER SYSTEM, INC. By: /S/ Gregory T. Swienton
Gregory T. Swienton Chairman, President and Chief Executive Officer
Date: March 3, 2003 By: /S/ Gregory T. Swienton
Gregory T. Swienton Chairman, President and Chief Executive Officer (Principal Executive Officer)
Date: March 3, 2003 By: /S/ Corliss J. Nelson
Corliss J. Nelson Senior Executive Vice President and Chief Financial Officer (Principal Financial Officer)
Date: March 3, 2003 By: /S/ Art A. Garcia
Art A. Garcia Vice President and Controller (Principal Accounting Officer)
Date: March 3, 2003 By: /S/ John H. Dasburg *
John H. Dasburg Director
Date: March 3, 2003 By: /S/ Joseph L. Dionne *
Joseph L. Dionne Director
Date: March 3, 2003 By: /S/ Edward T. Foote II *
Edward T. Foote II Director
Date: March 3, 2003 By: /S/ David I. Fuente *
David I. Fuente Director
Date: March 3, 2003 By: /S/ John A. Georges *
John A. Georges Director
90
Date: March 3, 2003 By: /S/ Lynn M. Martin *
Lynn M. Martin Director
Date: March 3, 2003 By: /S/ Daniel H. Mudd *
Daniel H. Mudd Director
Date: March 3, 2003 By: /S/ Eugene A. Renna *
Eugene A. Renna Director
Date: March 3, 2003 By: /S/ Hansel E. Tookes II *
Hansel E. Tookes II Director
Date: March 3, 2003 By: /S/ Christine A. Varney *
Christine A. Varney Director
Date: March 3, 2003 *By: /S/ Richard H. Siegel
Richard H. Siegel Attorney-in-Fact
CERTIFICATION
I, Gregory T. Swienton, certify that:
91
1. I have reviewed this annual report on Form 10-K of Ryder System, Inc.;
2.
Based on my knowledge, this annual report does not contain any untrue statement of a material fact or omit to state a material fact necessary to make the statements made, in light of the circumstances under which such statements were made, not misleading with respect to the period covered by this annual report;
3.
Based on my knowledge, the financial statements, and other financial information included in this annual report, fairly present in all material respects the financial condition, results of operations and cash flows of the registrant as of, and for, the periods presented in this annual report;
4.
The registrant’s other certifying officers and I are responsible for establishing and maintaining disclosure controls and procedures (as defined in Exchange Act Rules 13a-14 and 15d-14) for the registrant and have:
a)
designed such disclosure controls and procedures to ensure that material information relating to the registrant, including its consolidated subsidiaries, is made known to us by others within those entities, particularly during the period in which this annual report is being prepared;
b)
evaluated the effectiveness of the registrant’s disclosure controls and procedures as of a date within 90 days prior to the filing date of this annual report (the “Evaluation Date” ); and
c)
presented in this annual report our conclusions about the effectiveness of the disclosure controls and procedures based on our evaluation as of the Evaluation Date;
5.
The registrant’s other certifying officers and I have disclosed, based on our most recent evaluation, to the registrant’s auditors and the audit committee of registrant’s board of directors (or persons performing the equivalent functions):
a)
all significant deficiencies in the design or operation of internal controls which could adversely affect the registrant’s ability to record, process, summarize and report financial data and have identified for the registrant’s auditors any material weaknesses in internal controls; and
b)
any fraud, whether or not material, that involves management or other employees who have a significant role in the registrant’s internal controls; and
6.
The registrant’s other certifying officers and I have indicated in this annual report whether there were significant changes in internal controls or in other factors that could significantly affect internal controls subsequent to the date of our most recent evaluation, including any corrective actions with regard to significant deficiencies and material weaknesses.
Date: March 3, 2003 /S/ Gregory T. Swienton
Gregory T. Swienton Chairman, President and Chief Executive Officer
CERTIFICATION
I, Corliss J. Nelson, certify that:
92
1. I have reviewed this annual report on Form 10-K of Ryder System, Inc.;
2.
Based on my knowledge, this annual report does not contain any untrue statement of a material fact or omit to state a material fact necessary to make the statements made, in light of the circumstances under which such statements were made, not misleading with respect to the period covered by this annual report;
3.
Based on my knowledge, the financial statements, and other financial information included in this annual report, fairly present in all material respects the financial condition, results of operations and cash flows of the registrant as of, and for, the periods presented in this annual report;
4.
The registrant’s other certifying officers and I are responsible for establishing and maintaining disclosure controls and procedures (as defined in Exchange Act Rules 13a-14 and 15d-14) for the registrant and have:
a)
designed such disclosure controls and procedures to ensure that material information relating to the registrant, including its consolidated subsidiaries, is made known to us by others within those entities, particularly during the period in which this annual report is being prepared;
b)
evaluated the effectiveness of the registrant’s disclosure controls and procedures as of a date within 90 days prior to the filing date of this annual report (the “Evaluation Date” ); and
c)
presented in this annual report our conclusions about the effectiveness of the disclosure controls and procedures based on our evaluation as of the Evaluation Date;
5.
The registrant’s other certifying officers and I have disclosed, based on our most recent evaluation, to the registrant’s auditors and the audit committee of registrant’s board of directors (or persons performing the equivalent functions):
b)
all significant deficiencies in the design or operation of internal controls which could adversely affect the registrant’s ability to record, process, summarize and report financial data and have identified for the registrant’s auditors any material weaknesses in internal controls; and
c)
any fraud, whether or not material, that involves management or other employees who have a significant role in the registrant’s internal controls; and
6.
The registrant’s other certifying officers and I have indicated in this annual report whether there were significant changes in internal controls or in other factors that could significantly affect internal controls subsequent to the date of our most recent evaluation, including any corrective actions with regard to significant deficiencies and material weaknesses.
Date: March 3, 2003 /S/ Corliss J. Nelson
Corliss J. Nelson Senior Executive Vice President and Chief Financial Officer

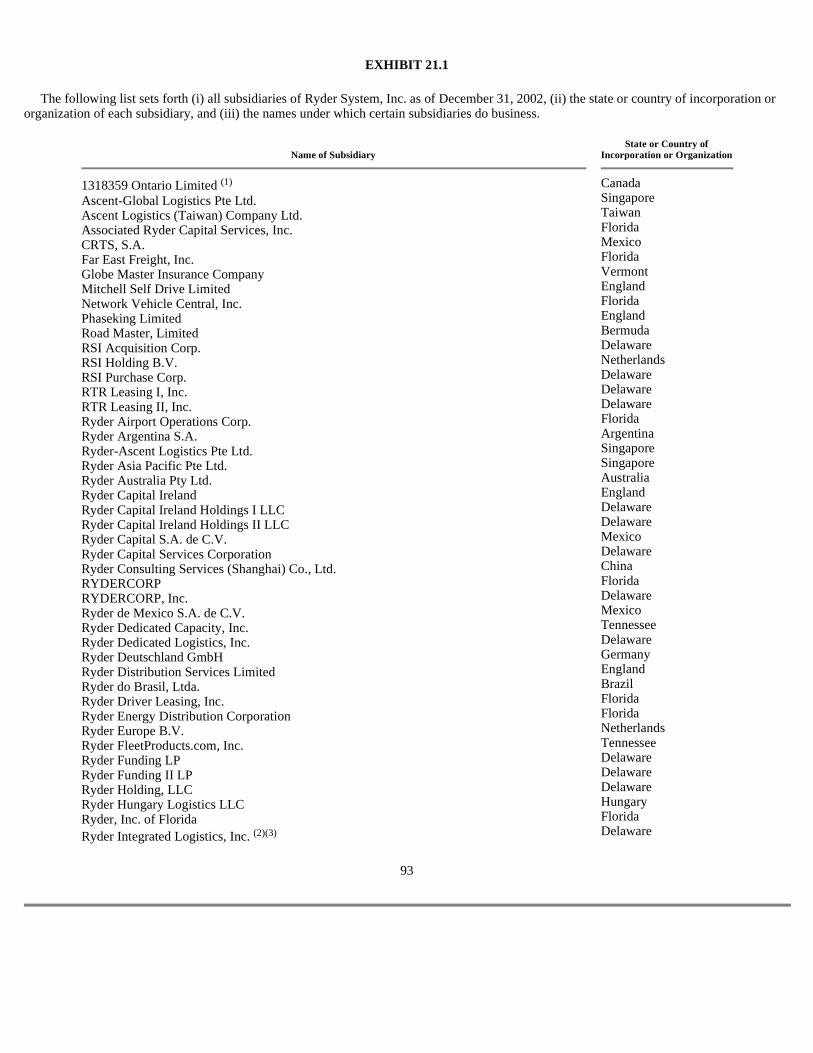
EXHIBIT 21.1
The following list sets forth (i) all subsidiaries of Ryder System, Inc. as of December 31, 2002, (ii) the state or country of incorporation or organization of each subsidiary, and (iii) the names under which certain subsidiaries do business.
93
State or Country of
Name of Subsidiary Incorporation or Organization
1318359 Ontario Limited (1) Ascent-Global Logistics Pte Ltd. Ascent Logistics (Taiwan) Company Ltd. Associated Ryder Capital Services, Inc. CRTS, S.A. Far East Freight, Inc. Globe Master Insurance Company Mitchell Self Drive Limited Network Vehicle Central, Inc. Phaseking Limited Road Master, Limited RSI Acquisition Corp. RSI Holding B.V. RSI Purchase Corp. RTR Leasing I, Inc. RTR Leasing II, Inc. Ryder Airport Operations Corp. Ryder Argentina S.A. Ryder-Ascent Logistics Pte Ltd. Ryder Asia Pacific Pte Ltd. Ryder Australia Pty Ltd. Ryder Capital Ireland Ryder Capital Ireland Holdings I LLC Ryder Capital Ireland Holdings II LLC Ryder Capital S.A. de C.V. Ryder Capital Services Corporation Ryder Consulting Services (Shanghai) Co., Ltd. RYDERCORP RYDERCORP, Inc. Ryder de Mexico S.A. de C.V. Ryder Dedicated Capacity, Inc. Ryder Dedicated Logistics, Inc. Ryder Deutschland GmbH Ryder Distribution Services Limited Ryder do Brasil, Ltda. Ryder Driver Leasing, Inc. Ryder Energy Distribution Corporation Ryder Europe B.V. Ryder FleetProducts.com, Inc. Ryder Funding LP Ryder Funding II LP Ryder Holding, LLC Ryder Hungary Logistics LLC Ryder, Inc. of Florida Ryder Integrated Logistics, Inc. (2)(3)
Canada Singapore Taiwan Florida Mexico Florida Vermont England Florida England Bermuda Delaware Netherlands Delaware Delaware Delaware Florida Argentina Singapore Singapore Australia England Delaware Delaware Mexico Delaware China Florida Delaware Mexico Tennessee Delaware Germany England Brazil Florida Florida Netherlands Tennessee Delaware Delaware Delaware Hungary Florida Delaware
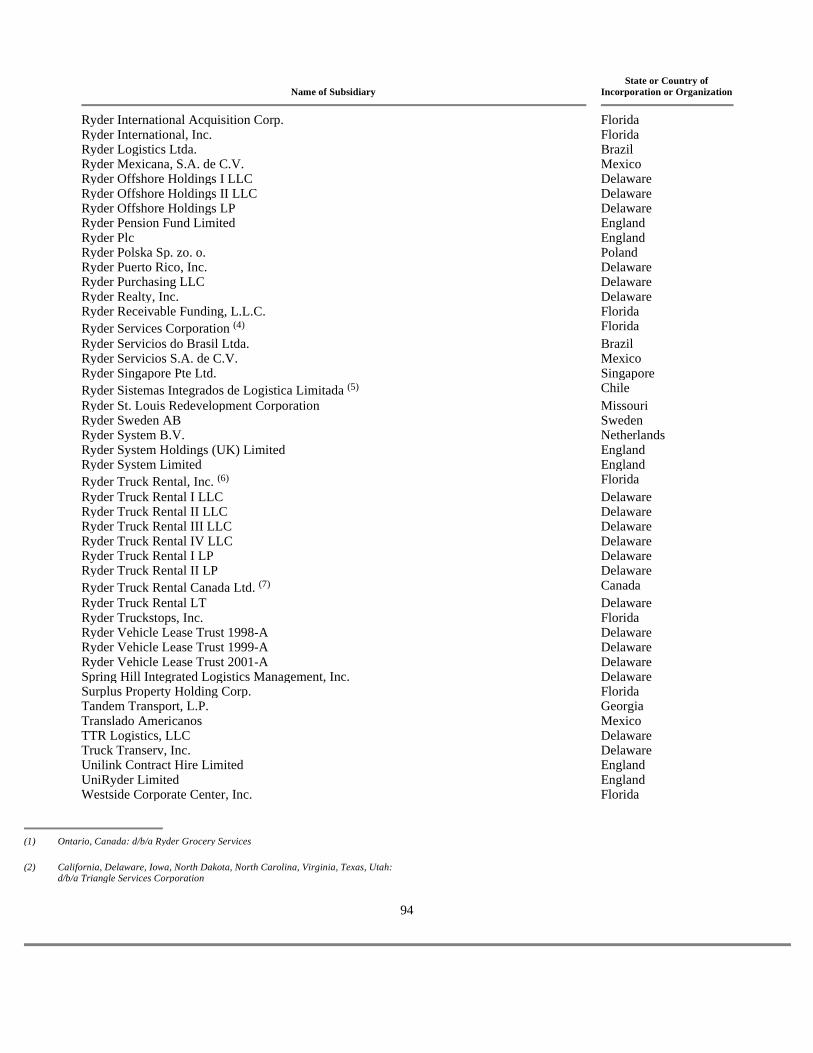
94
State or Country of
Name of Subsidiary Incorporation or Organization
Ryder International Acquisition Corp. Florida Ryder International, Inc. Florida Ryder Logistics Ltda. Brazil Ryder Mexicana, S.A. de C.V. Mexico Ryder Offshore Holdings I LLC Delaware Ryder Offshore Holdings II LLC Delaware Ryder Offshore Holdings LP Delaware Ryder Pension Fund Limited England Ryder Plc England Ryder Polska Sp. zo. o. Poland Ryder Puerto Rico, Inc. Delaware Ryder Purchasing LLC Delaware Ryder Realty, Inc. Delaware Ryder Receivable Funding, L.L.C. Florida Ryder Services Corporation (4) Florida Ryder Servicios do Brasil Ltda. Brazil Ryder Servicios S.A. de C.V. Mexico Ryder Singapore Pte Ltd. Singapore Ryder Sistemas Integrados de Logistica Limitada (5) Chile Ryder St. Louis Redevelopment Corporation Missouri Ryder Sweden AB Sweden Ryder System B.V. Netherlands Ryder System Holdings (UK) Limited England Ryder System Limited England Ryder Truck Rental, Inc. (6) Florida Ryder Truck Rental I LLC Delaware Ryder Truck Rental II LLC Delaware Ryder Truck Rental III LLC Delaware Ryder Truck Rental IV LLC Delaware Ryder Truck Rental I LP Delaware Ryder Truck Rental II LP Delaware Ryder Truck Rental Canada Ltd. (7) Canada Ryder Truck Rental LT Delaware Ryder Truckstops, Inc. Florida Ryder Vehicle Lease Trust 1998-A Delaware Ryder Vehicle Lease Trust 1999-A Delaware Ryder Vehicle Lease Trust 2001-A Delaware Spring Hill Integrated Logistics Management, Inc. Delaware Surplus Property Holding Corp. Florida Tandem Transport, L.P. Georgia Translado Americanos Mexico TTR Logistics, LLC Delaware Truck Transerv, Inc. Delaware Unilink Contract Hire Limited England UniRyder Limited England Westside Corporate Center, Inc. Florida
(1) Ontario, Canada: d/b/a Ryder Grocery Services
(2) California, Delaware, Iowa, North Dakota, North Carolina, Virginia, Texas, Utah:
d/b/a Triangle Services Corporation
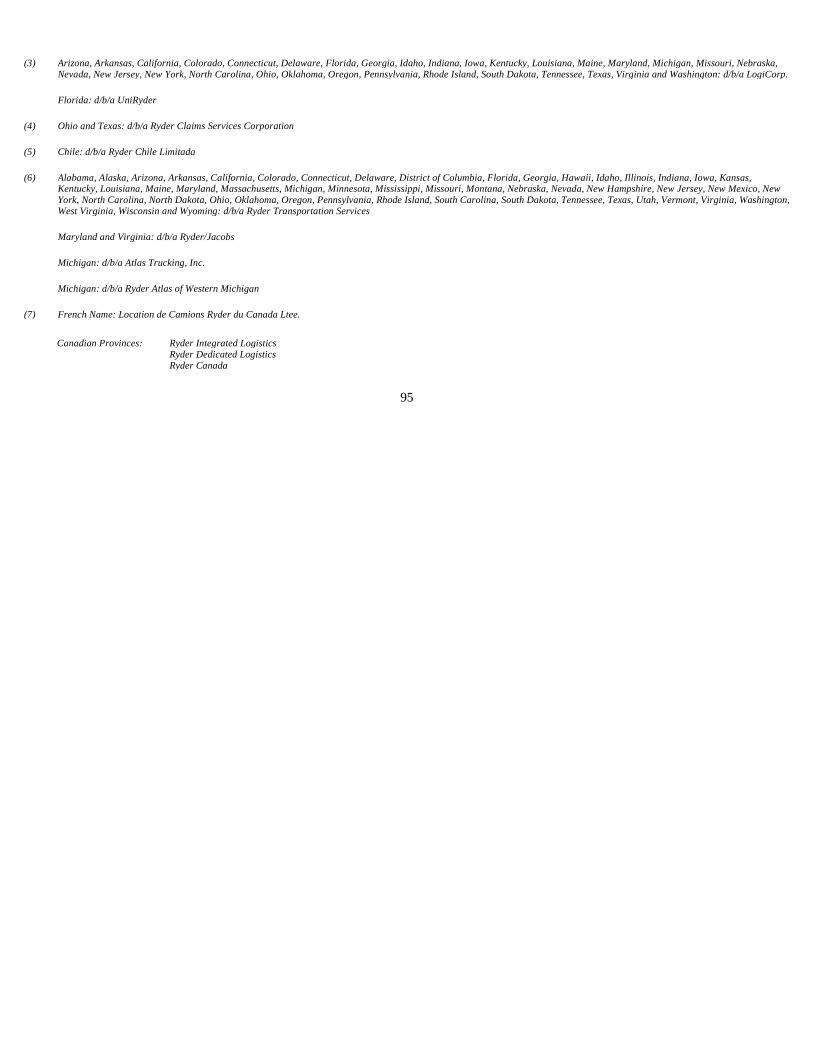
95
(3) Arizona, Arkansas, California, Colorado, Connecticut, Delaware, Florida, Georgia, Idaho, Indiana, Iowa, Kentucky, Louisiana, Maine, Maryland, Michigan, Missouri, Nebraska, Nevada, New Jersey, New York, North Carolina, Ohio, Oklahoma, Oregon, Pennsylvania, Rhode Island, South Dakota, Tennessee, Texas, Virginia and Washington: d/b/a LogiCorp.
Florida: d/b/a UniRyder
(4) Ohio and Texas: d/b/a Ryder Claims Services Corporation
(5) Chile: d/b/a Ryder Chile Limitada
(6) Alabama, Alaska, Arizona, Arkansas, California, Colorado, Connecticut, Delaware, District of Columbia, Florida, Georgia, Hawaii, Idaho, Illinois, Indiana, Iowa, Kansas,
Kentucky, Louisiana, Maine, Maryland, Massachusetts, Michigan, Minnesota, Mississippi, Missouri, Montana, Nebraska, Nevada, New Hampshire, New Jersey, New Mexico, New York, North Carolina, North Dakota, Ohio, Oklahoma, Oregon, Pennsylvania, Rhode Island, South Carolina, South Dakota, Tennessee, Texas, Utah, Vermont, Virginia, Washington, West Virginia, Wisconsin and Wyoming: d/b/a Ryder Transportation Services
Maryland and Virginia: d/b/a Ryder/Jacobs
Michigan: d/b/a Atlas Trucking, Inc.
Michigan: d/b/a Ryder Atlas of Western Michigan
(7) French Name: Location de Camions Ryder du Canada Ltee.
Canadian Provinces:
Ryder Integrated Logistics Ryder Dedicated Logistics Ryder Canada

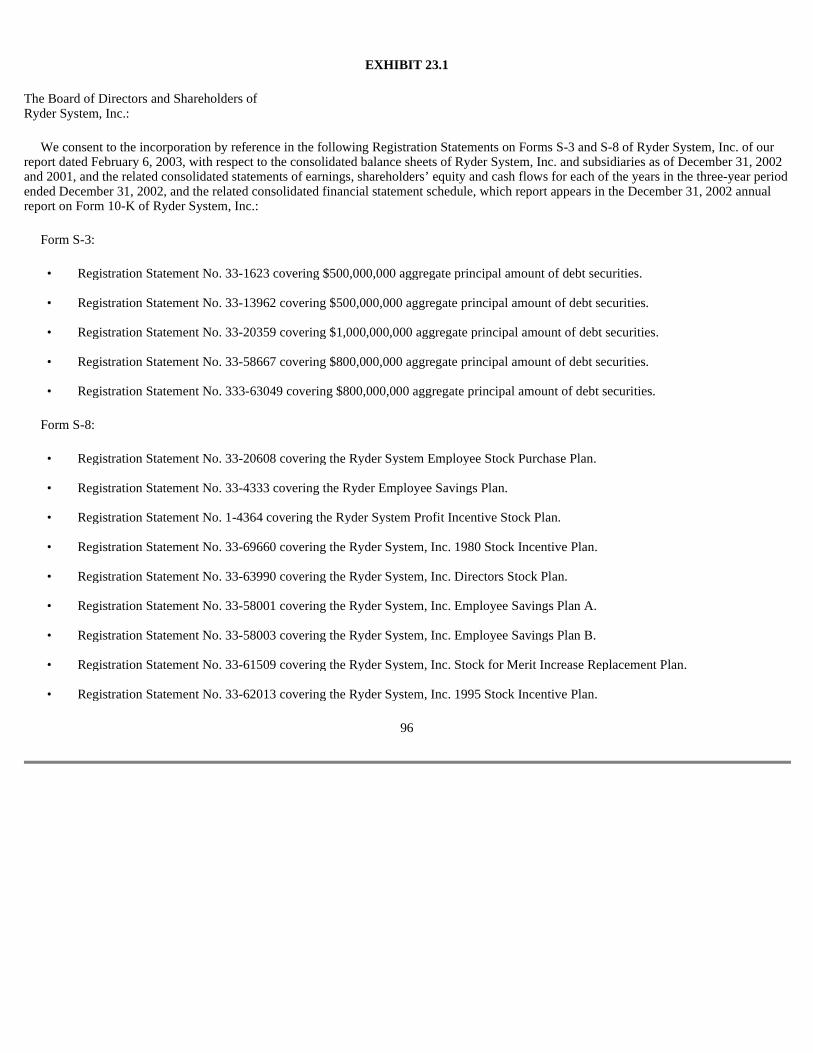
EXHIBIT 23.1
The Board of Directors and Shareholders of Ryder System, Inc.:
We consent to the incorporation by reference in the following Registration Statements on Forms S-3 and S-8 of Ryder System, Inc. of our report dated February 6, 2003, with respect to the consolidated balance sheets of Ryder System, Inc. and subsidiaries as of December 31, 2002 and 2001, and the related consolidated statements of earnings, shareholders’ equity and cash flows for each of the years in the three-year period ended December 31, 2002, and the related consolidated financial statement schedule, which report appears in the December 31, 2002 annual report on Form 10-K of Ryder System, Inc.:
Form S-3:
Form S-8:
96
• Registration Statement No. 33-1623 covering $500,000,000 aggregate principal amount of debt securities. • Registration Statement No. 33-13962 covering $500,000,000 aggregate principal amount of debt securities. • Registration Statement No. 33-20359 covering $1,000,000,000 aggregate principal amount of debt securities. • Registration Statement No. 33-58667 covering $800,000,000 aggregate principal amount of debt securities. • Registration Statement No. 333-63049 covering $800,000,000 aggregate principal amount of debt securities.
• Registration Statement No. 33-20608 covering the Ryder System Employee Stock Purchase Plan. • Registration Statement No. 33-4333 covering the Ryder Employee Savings Plan. • Registration Statement No. 1-4364 covering the Ryder System Profit Incentive Stock Plan. • Registration Statement No. 33-69660 covering the Ryder System, Inc. 1980 Stock Incentive Plan. • Registration Statement No. 33-63990 covering the Ryder System, Inc. Directors Stock Plan. • Registration Statement No. 33-58001 covering the Ryder System, Inc. Employee Savings Plan A. • Registration Statement No. 33-58003 covering the Ryder System, Inc. Employee Savings Plan B. • Registration Statement No. 33-61509 covering the Ryder System, Inc. Stock for Merit Increase Replacement Plan. • Registration Statement No. 33-62013 covering the Ryder System, Inc. 1995 Stock Incentive Plan.
/s/ KPMG LLP
Miami, Florida March 3, 2003
97
• Registration Statement No. 333-19515 covering the Ryder System, Inc. 1997 Deferred Compensation Plan. • Registration Statement No. 333-26653 covering the Ryder System, Inc. Board of Directors Stock Award Plan. • Registration Statement No. 333-57593 covering the Ryder System, Inc. Stock Purchase Plan for Employees. • Registration Statement No. 333-57595 covering the Ryder System, Inc. 1995 Stock Incentive Plan. • Registration Statement No. 333-69626 covering the Ryder System, Inc. 1995 Stock Incentive Plan. • Registration Statement No. 333-69628 covering the Ryder System, Inc. Directors Stock Plan.

EXHIBIT 24.1
POWER OF ATTORNEY
KNOW ALL MEN BY THESE PRESENTS, that the person whose signature appears below constitutes and appoints Vicki A. O’Meara, Richard H. Siegel and David M. Beilin, and each of them, his or her true and lawful attorney-in-fact and agent, with full power of substitution and resubstitution, for the undersigned and in his or her name, place and stead, in any and all capacities, to sign the Ryder System, Inc. Form 10-K (Annual Report pursuant to the Securities Exchange Act of 1934) for the fiscal year ended December 31, 2002 (the “Form 10-K”), and any and all amendments thereto, and to file the same, with all exhibits thereto and other documents in connection therewith, with the Securities and Exchange Commission and with the New York Stock Exchange, Chicago Stock Exchange and Pacific Stock Exchange, granting unto each said attorney-in-fact and agent full power and authority to perform every act requisite and necessary to be done in connection with the execution and filing of the Form 10-K and any and all amendments thereto, as fully for all intents and purposes as he or she might or could do in person, hereby ratifying all that each said attorney-in-fact and agent, or his or her substitute or substitutes, may lawfully do or cause to be done by virtue thereof.
Before me appeared John H. Dasburg, personally known to me and known to me to be the person described in and who executed the foregoing instrument, and acknowledged to and before me this 14th day of February, 2003 that he or she executed said instrument for the purposes therein expressed.
98
/s/ JOHN H. DASBURG John H. Dasburg STATE OF FLORIDA
) ) ss:
COUNTY OF DADE )
Witness my hand and official seal: /s/ JANICE JOHNSON Notary Public My commission expires March 23, 2004

POWER OF ATTORNEY
KNOW ALL MEN BY THESE PRESENTS, that the person whose signature appears below constitutes and appoints Vicki A. O’Meara, Richard H. Siegel and David M. Beilin, and each of them, his or her true and lawful attorney-in-fact and agent, with full power of substitution and resubstitution, for the undersigned and in his or her name, place and stead, in any and all capacities, to sign the Ryder System, Inc. Form 10-K (Annual Report pursuant to the Securities Exchange Act of 1934) for the fiscal year ended December 31, 2002 (the “Form 10-K”), and any and all amendments thereto, and to file the same, with all exhibits thereto and other documents in connection therewith, with the Securities and Exchange Commission and with the New York Stock Exchange, Chicago Stock Exchange and Pacific Stock Exchange, granting unto each said attorney-in-fact and agent full power and authority to perform every act requisite and necessary to be done in connection with the execution and filing of the Form 10-K and any and all amendments thereto, as fully for all intents and purposes as he or she might or could do in person, hereby ratifying all that each said attorney-in-fact and agent, or his or her substitute or substitutes, may lawfully do or cause to be done by virtue thereof.
Before me appeared Joseph L. Dionne, personally known to me and known to me to be the person described in and who executed the foregoing instrument, and acknowledged to and before me this 14th day of February, 2003 that he or she executed said instrument for the purposes therein expressed.
99
/s/ JOSEPH L. DIONNE Joseph L. Dionne STATE OF FLORIDA
) )
ss:
COUNTY OF DADE )
Witness my hand and official seal: /s/ JANICE JOHNSON Notary Public My commission expires March 23, 2004
POWER OF ATTORNEY
KNOW ALL MEN BY THESE PRESENTS, that the person whose signature appears below constitutes and appoints Vicki A. O’Meara, Richard H. Siegel and David M. Beilin, and each of them, his or her true and lawful attorney-in-fact and agent, with full power of substitution and resubstitution, for the undersigned and in his or her name, place and stead, in any and all capacities, to sign the Ryder System, Inc. Form 10-K (Annual Report pursuant to the Securities Exchange Act of 1934) for the fiscal year ended December 31, 2002 (the “Form 10-K”), and any and all amendments thereto, and to file the same, with all exhibits thereto and other documents in connection therewith, with the Securities and Exchange Commission and with the New York Stock Exchange, Chicago Stock Exchange and Pacific Stock Exchange, granting unto each said attorney-in-fact and agent full power and authority to perform every act requisite and necessary to be done in connection with the execution and filing of the Form 10-K and any and all amendments thereto, as fully for all intents and purposes as he or she might or could do in person, hereby ratifying all that each said attorney-in-fact and agent, or his or her substitute or substitutes, may lawfully do or cause to be done by virtue thereof.
Before me appeared Edward T. Foote II, personally known to me and known to me to be the person described in and who executed the foregoing instrument, and acknowledged to and before me this 14th day of February, 2003 that he or she executed said instrument for the purposes therein expressed.
100
/s/ EDWARD T. FOOTE II Edward T. Foote II STATE OF FLORIDA
) )
ss:
COUNTY OF DADE )
Witness my hand and official seal: /s/ JANICE JOHNSON Notary Public My commission expires March 23, 2004

POWER OF ATTORNEY
KNOW ALL MEN BY THESE PRESENTS, that the person whose signature appears below constitutes and appoints Vicki A. O’Meara, Richard H. Siegel and David M. Beilin, and each of them, his or her true and lawful attorney-in-fact and agent, with full power of substitution and resubstitution, for the undersigned and in his or her name, place and stead, in any and all capacities, to sign the Ryder System, Inc. Form 10-K (Annual Report pursuant to the Securities Exchange Act of 1934) for the fiscal year ended December 31, 2002 (the “Form 10-K”), and any and all amendments thereto, and to file the same, with all exhibits thereto and other documents in connection therewith, with the Securities and Exchange Commission and with the New York Stock Exchange, Chicago Stock Exchange and Pacific Stock Exchange, granting unto each said attorney-in-fact and agent full power and authority to perform every act requisite and necessary to be done in connection with the execution and filing of the Form 10-K and any and all amendments thereto, as fully for all intents and purposes as he or she might or could do in person, hereby ratifying all that each said attorney-in-fact and agent, or his or her substitute or substitutes, may lawfully do or cause to be done by virtue thereof.
Before me appeared David I. Fuente, personally known to me and known to me to be the person described in and who executed the foregoing instrument, and acknowledged to and before me this 14th day of February, 2003 that he or she executed said instrument for the purposes therein expressed.
101
/s/ DAVID I. FUENTE David I. Fuente STATE OF FLORIDA
) )
ss:
COUNTY OF DADE )
Witness my hand and official seal: /s/ JANICE JOHNSON Notary Public My commission expires March 23, 2004

POWER OF ATTORNEY
KNOW ALL MEN BY THESE PRESENTS, that the person whose signature appears below constitutes and appoints Vicki A. O’Meara, Richard H. Siegel and David M. Beilin, and each of them, his or her true and lawful attorney-in-fact and agent, with full power of substitution and resubstitution, for the undersigned and in his or her name, place and stead, in any and all capacities, to sign the Ryder System, Inc. Form 10-K (Annual Report pursuant to the Securities Exchange Act of 1934) for the fiscal year ended December 31, 2002 (the “Form 10-K”), and any and all amendments thereto, and to file the same, with all exhibits thereto and other documents in connection therewith, with the Securities and Exchange Commission and with the New York Stock Exchange, Chicago Stock Exchange and Pacific Stock Exchange, granting unto each said attorney-in-fact and agent full power and authority to perform every act requisite and necessary to be done in connection with the execution and filing of the Form 10-K and any and all amendments thereto, as fully for all intents and purposes as he or she might or could do in person, hereby ratifying all that each said attorney-in-fact and agent, or his or her substitute or substitutes, may lawfully do or cause to be done by virtue thereof.
Before me appeared John A. Georges, personally known to me and known to me to be the person described in and who executed the foregoing instrument, and acknowledged to and before me this 14th day of February, 2003 that he or she executed said instrument for the purposes therein expressed.
102
/s/ JOHN A. GEORGES John A. Georges STATE OF FLORIDA
) )
ss:
COUNTY OF DADE )
Witness my hand and official seal: /s/ JANICE JOHNSON Notary Public My commission expires March 23, 2004

POWER OF ATTORNEY
KNOW ALL MEN BY THESE PRESENTS, that the person whose signature appears below constitutes and appoints Vicki A. O’Meara, Richard H. Siegel and David M. Beilin, and each of them, his or her true and lawful attorney-in-fact and agent, with full power of substitution and resubstitution, for the undersigned and in his or her name, place and stead, in any and all capacities, to sign the Ryder System, Inc. Form 10-K (Annual Report pursuant to the Securities Exchange Act of 1934) for the fiscal year ended December 31, 2002 (the “Form 10-K”), and any and all amendments thereto, and to file the same, with all exhibits thereto and other documents in connection therewith, with the Securities and Exchange Commission and with the New York Stock Exchange, Chicago Stock Exchange and Pacific Stock Exchange, granting unto each said attorney-in-fact and agent full power and authority to perform every act requisite and necessary to be done in connection with the execution and filing of the Form 10-K and any and all amendments thereto, as fully for all intents and purposes as he or she might or could do in person, hereby ratifying all that each said attorney-in-fact and agent, or his or her substitute or substitutes, may lawfully do or cause to be done by virtue thereof.
Before me appeared Lynn M. Martin, personally known to me and known to me to be the person described in and who executed the foregoing instrument, and acknowledged to and before me this 14th day of February, 2003 that he or she executed said instrument for the purposes therein expressed.
103
/s/ LYNN M. MARTIN Lynn M. Martin STATE OF FLORIDA
) )
ss:
COUNTY OF DADE )
Witness my hand and official seal: /s/ JANICE JOHNSON Notary Public My commission expires March 23, 2004

POWER OF ATTORNEY
KNOW ALL MEN BY THESE PRESENTS, that the person whose signature appears below constitutes and appoints Vicki A. O’Meara, Richard H. Siegel and David M. Beilin, and each of them, his or her true and lawful attorney-in-fact and agent, with full power of substitution and resubstitution, for the undersigned and in his or her name, place and stead, in any and all capacities, to sign the Ryder System, Inc. Form 10-K (Annual Report pursuant to the Securities Exchange Act of 1934) for the fiscal year ended December 31, 2002 (the “Form 10-K”), and any and all amendments thereto, and to file the same, with all exhibits thereto and other documents in connection therewith, with the Securities and Exchange Commission and with the New York Stock Exchange, Chicago Stock Exchange and Pacific Stock Exchange, granting unto each said attorney-in-fact and agent full power and authority to perform every act requisite and necessary to be done in connection with the execution and filing of the Form 10-K and any and all amendments thereto, as fully for all intents and purposes as he or she might or could do in person, hereby ratifying all that each said attorney-in-fact and agent, or his or her substitute or substitutes, may lawfully do or cause to be done by virtue thereof.
Before me appeared Daniel H. Mudd, personally known to me and known to me to be the person described in and who executed the foregoing instrument, and acknowledged to and before me this 14th day of February, 2003 that he or she executed said instrument for the purposes therein expressed.
104
/s/ DANIEL H. MUDD Daniel H. Mudd STATE OF FLORIDA
) )
ss:
COUNTY OF DADE )
Witness my hand and official seal: /s/ JANICE JOHNSON Notary Public My commission expires March 23, 2004
POWER OF ATTORNEY
KNOW ALL MEN BY THESE PRESENTS, that the person whose signature appears below constitutes and appoints Vicki A. O’Meara, Richard H. Siegel and David M. Beilin, and each of them, his or her true and lawful attorney-in-fact and agent, with full power of substitution and resubstitution, for the undersigned and in his or her name, place and stead, in any and all capacities, to sign the Ryder System, Inc. Form 10-K (Annual Report pursuant to the Securities Exchange Act of 1934) for the fiscal year ended December 31, 2002 (the “Form 10-K”), and any and all amendments thereto, and to file the same, with all exhibits thereto and other documents in connection therewith, with the Securities and Exchange Commission and with the New York Stock Exchange, Chicago Stock Exchange and Pacific Stock Exchange, granting unto each said attorney-in-fact and agent full power and authority to perform every act requisite and necessary to be done in connection with the execution and filing of the Form 10-K and any and all amendments thereto, as fully for all intents and purposes as he or she might or could do in person, hereby ratifying all that each said attorney-in-fact and agent, or his or her substitute or substitutes, may lawfully do or cause to be done by virtue thereof.
Before me appeared Eugene A. Renna, personally known to me and known to me to be the person described in and who executed the foregoing instrument, and acknowledged to and before me this 14th day of February, 2003 that he or she executed said instrument for the purposes therein expressed.
105
/s/ EUGENE A. RENNA Eugene A. Renna STATE OF FLORIDA
) ) ss:
COUNTY OF DADE )
Witness my hand and official seal: /s/ JANICE JOHNSON Notary Public My commission expires March 23, 2004

POWER OF ATTORNEY
KNOW ALL MEN BY THESE PRESENTS, that the person whose signature appears below constitutes and appoints Vicki A. O’Meara, Richard H. Siegel and David M. Beilin, and each of them, his or her true and lawful attorney-in-fact and agent, with full power of substitution and resubstitution, for the undersigned and in his or her name, place and stead, in any and all capacities, to sign the Ryder System, Inc. Form 10-K (Annual Report pursuant to the Securities Exchange Act of 1934) for the fiscal year ended December 31, 2002 (the “Form 10-K”), and any and all amendments thereto, and to file the same, with all exhibits thereto and other documents in connection therewith, with the Securities and Exchange Commission and with the New York Stock Exchange, Chicago Stock Exchange and Pacific Stock Exchange, granting unto each said attorney-in-fact and agent full power and authority to perform every act requisite and necessary to be done in connection with the execution and filing of the Form 10-K and any and all amendments thereto, as fully for all intents and purposes as he or she might or could do in person, hereby ratifying all that each said attorney-in-fact and agent, or his or her substitute or substitutes, may lawfully do or cause to be done by virtue thereof.
Before me appeared Hansel E. Tookes II, personally known to me and known to me to be the person described in and who executed the foregoing instrument, and acknowledged to and before me this 14th day of February, 2003 that he or she executed said instrument for the purposes therein expressed.
106
/s/ HANSEL E. TOOKES II Hansel E. Tookes II STATE OF FLORIDA
) )
ss:
COUNTY OF DADE )
Witness my hand and official seal: /s/ JANICE JOHNSON Notary Public My commission expires March 23, 2004

POWER OF ATTORNEY
KNOW ALL MEN BY THESE PRESENTS, that the person whose signature appears below constitutes and appoints Vicki A. O’Meara, Richard H. Siegel and David M. Beilin, and each of them, his or her true and lawful attorney-in-fact and agent, with full power of substitution and resubstitution, for the undersigned and in his or her name, place and stead, in any and all capacities, to sign the Ryder System, Inc. Form 10-K (Annual Report pursuant to the Securities Exchange Act of 1934) for the fiscal year ended December 31, 2002 (the “Form 10-K”), and any and all amendments thereto, and to file the same, with all exhibits thereto and other documents in connection therewith, with the Securities and Exchange Commission and with the New York Stock Exchange, Chicago Stock Exchange and Pacific Stock Exchange, granting unto each said attorney-in-fact and agent full power and authority to perform every act requisite and necessary to be done in connection with the execution and filing of the Form 10-K and any and all amendments thereto, as fully for all intents and purposes as he or she might or could do in person, hereby ratifying all that each said attorney-in-fact and agent, or his or her substitute or substitutes, may lawfully do or cause to be done by virtue thereof.
Before me appeared Christine A. Varney, personally known to me and known to me to be the person described in and who executed the foregoing instrument, and acknowledged to and before me this 14th day of February, 2003 that he or she executed said instrument for the purposes therein expressed.
107
/s/ CHRISTINE A. VARNEY Christine A. Varney STATE OF FLORIDA
) )
ss:
COUNTY OF DADE )
Witness my hand and official seal: /s/ JANICE JOHNSON Notary Public My commission expires March 23, 2004


EXHIBIT 99.1
CERTIFICATION PURSUANT TO 18 U.S.C. SECTION 1350,
AS ADOPTED PURSUANT TO SECTION 906 OF THE SARBANES-OXLEY ACT OF 2002
In connection with the Annual Report of Ryder System, Inc. (the “Company”) on Form 10-K for the period ending December 31, 2002, as filed with the Securities and Exchange Commission on the date hereof (the “Report”), I, Gregory T. Swienton, Chief Executive Officer of the Company, certify pursuant to 18 U.S.C. Section 1350, as adopted pursuant to Section 906 of the Sarbanes-Oxley Act of 2002, that:
108
(1)
The Report fully complies with the requirements of section 13(a) or 15(d) of the Securities Exchange Act of 1934; and
(2)
The information contained in the Report fairly presents, in all material respects, the financial condition and results of operations of the Company.
/S/ Gregory T. Swienton
Gregory T. Swienton Chairman, President and Chief Executive Officer March 3, 2003

EXHIBIT 99.2
CERTIFICATION PURSUANT TO 18 U.S.C. SECTION 1350,
AS ADOPTED PURSUANT TO SECTION 906 OF THE SARBANES-OXLEY ACT OF 2002
In connection with the Annual Report of Ryder System, Inc. (the “Company”) on Form 10-K for the period ending December 31, 2002, as filed with the Securities and Exchange Commission on the date hereof (the “Report”), I, Corliss J. Nelson, Chief Financial Officer of the Company, certify pursuant to 18 U.S.C. Section 1350, as adopted pursuant to Section 906 of the Sarbanes-Oxley Act of 2002, that:
109
(1)
The Report fully complies with the requirements of section 13(a) or 15(d) of the Securities Exchange Act of 1934; and
(2)
The information contained in the Report fairly presents, in all material respects, the financial condition and results of operations of the Company.
/S/ Corliss J. Nelson
Corliss J. Nelson Senior Executive Vice President and Chief Financial Officer March 3, 2003