rz newsletter2016 en 160111 - lauterbach · nexus gdb android linux infineon mcds arm®...
TRANSCRIPT
Nexus
GDB
AndroidAndroid
Linux
Infineon MCDSInfineon MCDSInfineon MCDSInfineon MCDSInfineon MCDS
AARMRMR ® CoreSighCoreSighCoreSight™
Unit TestingUnit Testing
Timing ToolsTiming Tools
Windows 10Windows 10Windows 10AUTOSARAUTOSAR
Requirements AnalysisRequirements AnalysisRequirements Analysis
PIL Simulation
Reverse Debugging
Target Communication Framework
Intel ® Trace Hub
NEWS 2016
CONTENTSPIL Simulation with TRACE32
New TRACE32 Base Modules
TRACE32 PowerTrace Serial
Support for Intel ® Trace Hub
TRACE32 as a TCF-AgentWind River WorkbenchEclipse
TRACE32 as an UndoDB Front End
2
4
5
6
7
8
2
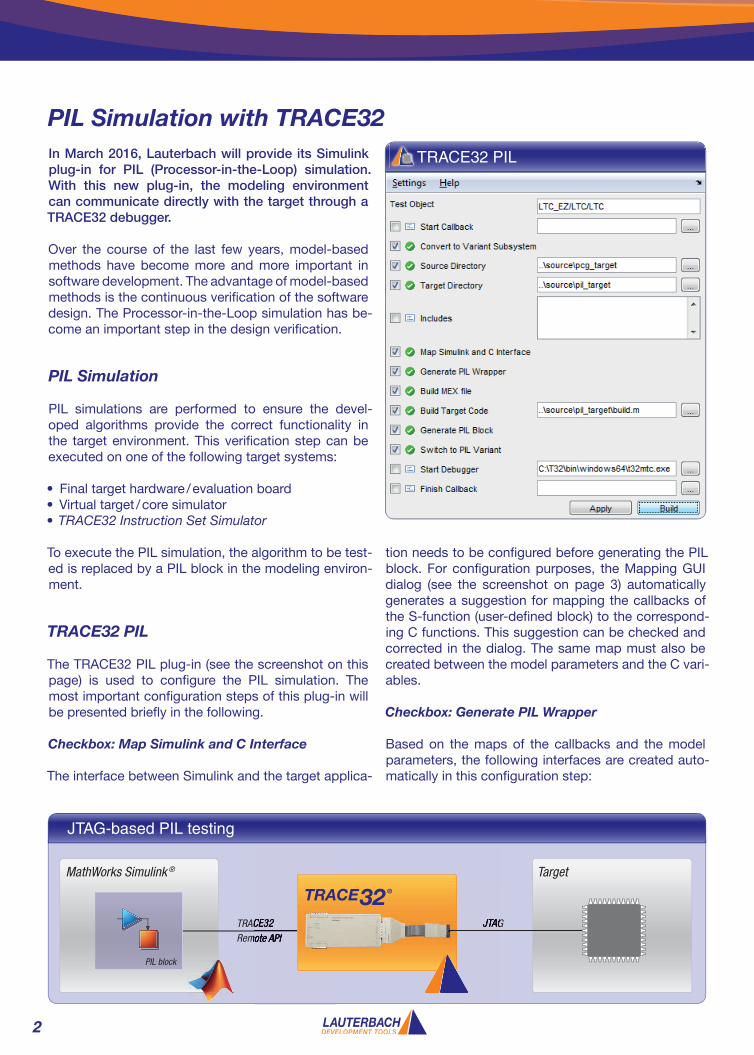
TargetMathWorks Simulink ®
TRACE32 Remote API
JTAGTRACE32 Remote API
JTAG
PIL block
JTAG-based PIL testing
PIL Simulation with TRACE32In March 2016, Lauterbach will provide its Simulink plug-in for PIL (Processor-in-the-Loop) simulation. With this new plug-in, the modeling environment can communicate directly with the target through a TRACE32 debugger.
Over the course of the last few years, model-based methods have become more and more important in software development. The advantage of model-based methods is the continuous verifi cation of the software design. The Processor-in-the-Loop simulation has be-come an important step in the design verifi cation.
PIL Simulation
PIL simulations are performed to ensure the devel-oped algorithms provide the correct functionality in the target environment. This verifi cation step can be executed on one of the following target systems:
• Final target hardware / evaluation board• Virtual target / core simulator • TRACE32 Instruction Set Simulator
To execute the PIL simulation, the algorithm to be test-ed is replaced by a PIL block in the modeling environ-ment.
TRACE32 PIL
The TRACE32 PIL plug-in (see the screenshot on this page) is used to confi gure the PIL simulation. The most important confi guration steps of this plug-in will be presented briefl y in the following.
Checkbox: Map Simulink and C Interface
The interface between Simulink and the target applica-
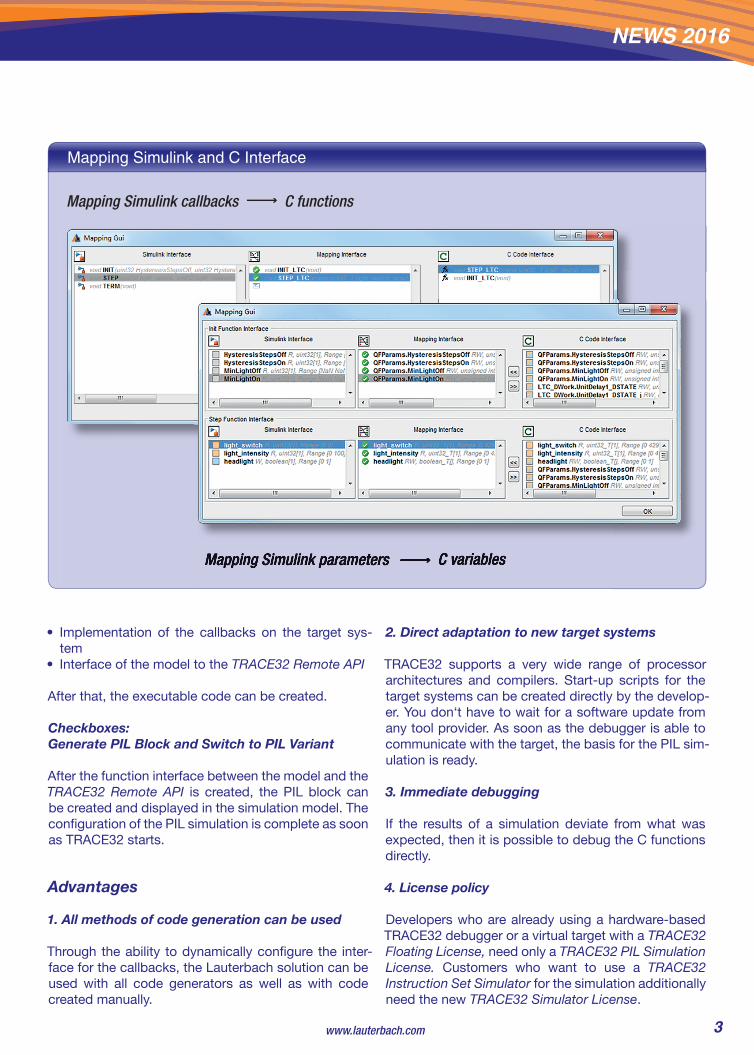
tion needs to be confi gured before generating the PIL block. For confi guration purposes, the Mapping GUI dialog (see the screenshot on page 3) automatically generates a suggestion for mapping the callbacks of the S-function (user-defi ned block) to the correspond-ing C functions. This suggestion can be checked and corrected in the dialog. The same map must also be created between the model parameters and the C vari-ables.
Checkbox: Generate PIL Wrapper
Based on the maps of the callbacks and the model parameters, the following interfaces are created auto-matically in this confi guration step:
TRACE32 PIL TRACE32 PIL TRACE32 PIL
www.lauterbach.com 3
NEWS 2016
Mapping Simulink callbacks C functions
Mapping Simulink parameters C variablesMapping Simulink parameters C variables
• Implementation of the callbacks on the target sys-tem
• Interface of the model to the TRACE32 Remote API
After that, the executable code can be created.
Checkboxes: Generate PIL Block and Switch to PIL Variant
After the function interface between the model and the TRACE32 Remote API is created, the PIL block can be created and displayed in the simulation model. The confi guration of the PIL simulation is complete as soon as TRACE32 starts.
Advantages
1. All methods of code generation can be used
Through the ability to dynamically confi gure the inter-face for the callbacks, the Lauterbach solution can be used with all code generators as well as with code created manually.
2. Direct adaptation to new target systems
TRACE32 supports a very wide range of processor architectures and compilers. Start-up scripts for the target systems can be created directly by the develop-er. You don‘t have to wait for a software update from any tool provider. As soon as the debugger is able to communicate with the target, the basis for the PIL sim-ulation is ready.
3. Immediate debugging
If the results of a simulation deviate from what was expected, then it is possible to debug the C functions directly.
4. License policy
Developers who are already using a hardware-based TRACE32 debugger or a virtual target with a TRACE32 Floating License, need only a TRACE32 PIL Simulation License. Customers who want to use a TRACE32 Instruction Set Simulator for the simulation additionally need the new TRACE32 Simulator License.
Mapping Simulink and C Interface
4
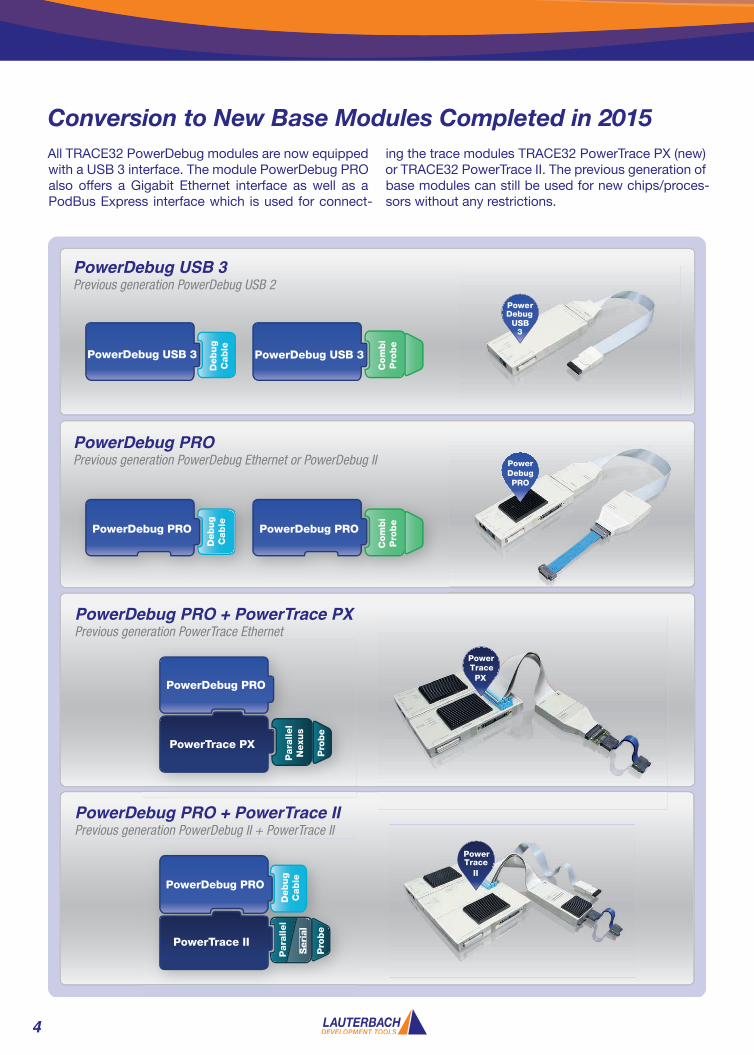
All TRACE32 PowerDebug modules are now equipped with a USB 3 interface. The module PowerDebug PRO also offers a Gigabit Ethernet interface as well as a PodBus Express interface which is used for connect-
ing the trace modules TRACE32 PowerTrace PX (new) or TRACE32 PowerTrace II. The previous generation of base modules can still be used for new chips/proces-sors without any restrictions.
Conversion to New Base Modules Completed in 2015
PowerDebug USB 3
Deb
ug
Cab
le
Pro
be
PowerTrace PX
Para
llel
Nexu
s
PowerDebug PRO
PowerTracePX
PowerDebug PRO
Debug
Cable
PowerDebug USB 3Previous generation PowerDebug USB 2
PowerDebug PROPrevious generation PowerDebug Ethernet or PowerDebug II
PowerDebug PRO + PowerTrace PXPrevious generation PowerTrace Ethernet
PowerDebug PRO + PowerTrace IIPrevious generation PowerDebug II + PowerTrace II
PowerDebug USB 3
Com
bi
Pro
be
PowerDebug PRO
Com
bi
Pro
be
Pro
be
PowerTrace II
PowerDebug PRO
Debug
Cable
Para
llel
Seri
al
Seri
al
PowerDebug
USB3
PowerDebugPRO
PowerTrace
II
www.lauterbach.com 5
NEWS 2016
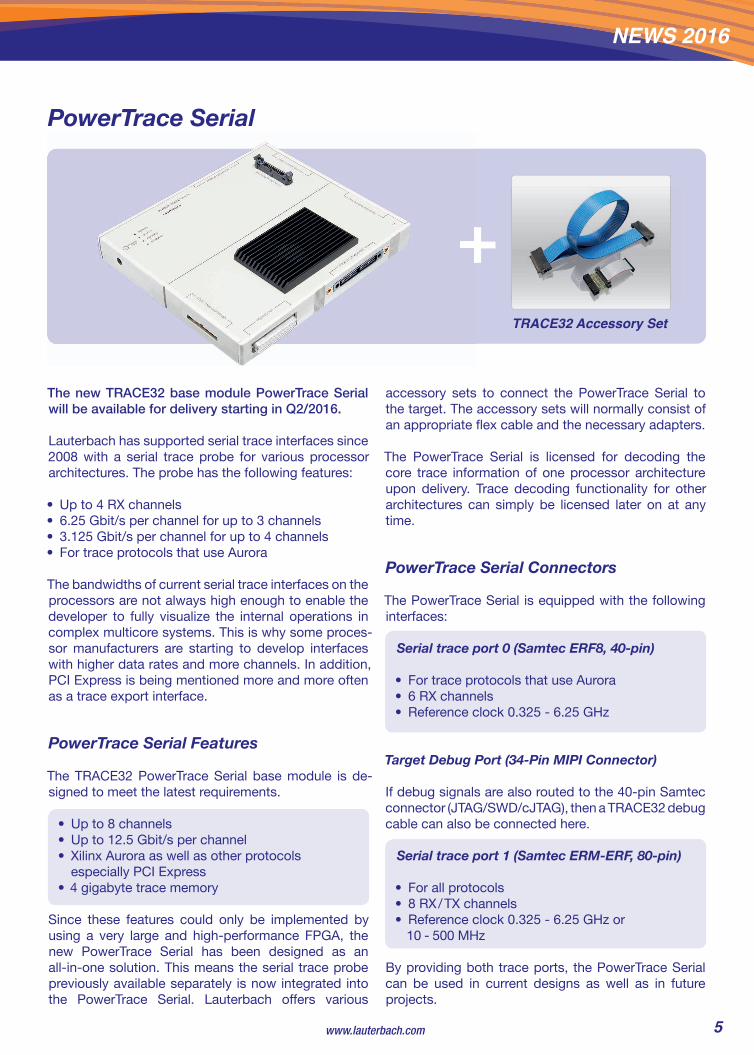
The new TRACE32 base module PowerTrace Serial will be available for delivery starting in Q2/2016.
Lauterbach has supported serial trace interfaces since 2008 with a serial trace probe for various processor architectures. The probe has the following features:
• Up to 4 RX channels• 6.25 Gbit/s per channel for up to 3 channels• 3.125 Gbit/s per channel for up to 4 channels• For trace protocols that use Aurora
The bandwidths of current serial trace interfaces on the processors are not always high enough to enable the developer to fully visualize the internal operations in complex multicore systems. This is why some proces-sor manufacturers are starting to develop interfaceswith higher data rates and more channels. In addition, PCI Express is being mentioned more and more often as a trace export interface.
PowerTrace Serial Features
The TRACE32 PowerTrace Serial base module is de-signed to meet the latest requirements.
• Up to 8 channels• Up to 12.5 Gbit/s per channel• Xilinx Aurora as well as other protocols
especially PCI Express• 4 gigabyte trace memory
Since these features could only be implemented by using a very large and high-performance FPGA, the new PowerTrace Serial has been designed as an all-in-one solution. This means the serial trace probe previously available separately is now integrated into the PowerTrace Serial. Lauterbach offers various
accessory sets to connect the PowerTrace Serial to the target. The accessory sets will normally consist of an appropriate fl ex cable and the necessary adapters.
The PowerTrace Serial is licensed for decoding the core trace information of one processor architecture upon delivery. Trace decoding functionality for other architectures can simply be licensed later on at any time.
PowerTrace Serial Connectors
The PowerTrace Serial is equipped with the following interfaces:
Serial trace port 0 (Samtec ERF8, 40-pin)
• For trace protocols that use Aurora• 6 RX channels• Reference clock 0.325 - 6.25 GHz
Target Debug Port (34-Pin MIPI Connector)
If debug signals are also routed to the 40-pin Samtec connector (JTAG/SWD/cJTAG), then a TRACE32 debug cable can also be connected here.
Serial trace port 1 (Samtec ERM-ERF, 80-pin)
• For all protocols• 8 RX / TX channels• Reference clock 0.325 - 6.25 GHz or
10 - 500 MHz
By providing both trace ports, the PowerTrace Serial can be used in current designs as well as in future projects.
PowerTrace Serial
TRACE32 Accessory Set
6
Support for Intel ® Trace Hub
In May 2016, TRACE32 will support the Intel ® Trace Hub and its associated framework.
Intel ® Trace Hub
Intel ® Trace Hub (Intel ® TH) is the name of the trace infrastructure Intel provides in its new hardware plat-forms. This trace infrastructure makes it possible:
1. To provide a common timestamp to Intel ® Proces-sor Trace data from individual cores and System Trace information from a variety of sources.
2. To merge all data into a single trace stream by using the MIPI STPv2.1 protocol.
3. To convey this stream to the selected trace destina-tion.
To enable debug and trace tools such as TRACE32 to support this trace infrastructure easily, Intel also pro-vides a software framework.
Intel ® Trace Hub Confi guration API
The aim of the Intel ® Trace Hub Confi guration API is to simplify the confi guration of the trace infrastructure through the debug tool. TRACE32 does not have to
know the platform-specifi c programming sequence, but can send a confi guration request to the Intel ® TH Confi guration API instead. The API then provides the appropriate programming sequence, and TRACE32 writes this sequence to the control registers via the JTAG interface.
Intel ® Trace Hub Library
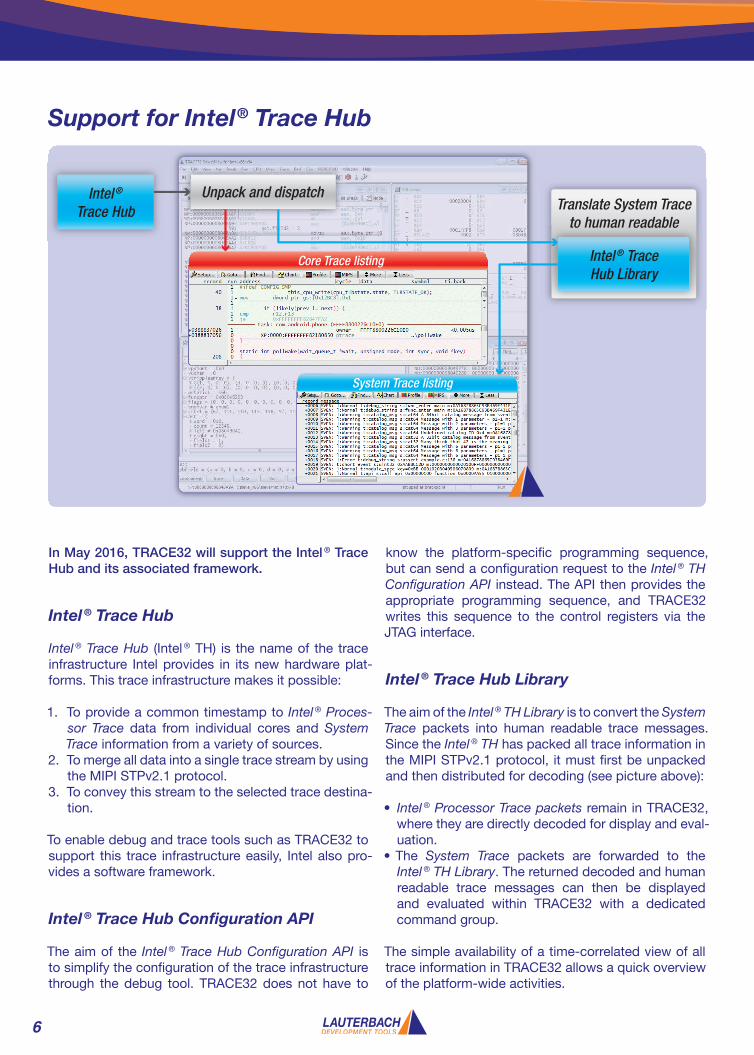
The aim of the Intel ® TH Library is to convert the System Trace packets into human readable trace messages. Since the Intel ® TH has packed all trace information in the MIPI STPv2.1 protocol, it must fi rst be unpacked and then distributed for decoding (see picture above):
• Intel ® Processor Trace packets remain in TRACE32, where they are directly decoded for display and eval-uation.
• The System Trace packets are forwarded to the Intel ® TH Library. The returned decoded and human readable trace messages can then be displayed and evaluated within TRACE32 with a dedicated command group.
The simple availability of a time-correlated view of all trace information in TRACE32 allows a quick overview of the platform-wide activities.
Unpack and dispatch
Intel ® Trace Hub Library
Translate System Trace to human readable
Intel ® Trace Hub
Core Trace listing
System Trace listing
www.lauterbach.com 7
NEWS 2016
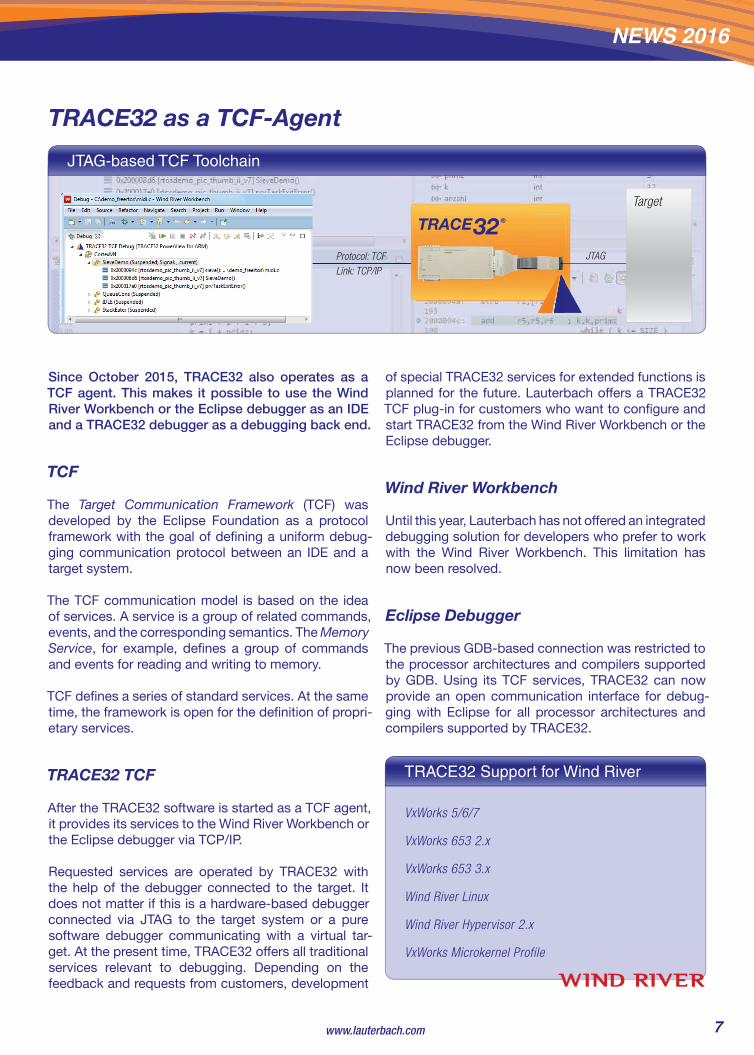
Protocol: TCFLink: TCP/IP
JTAG
Target
TRACE32 as a TCF-Agent
Since October 2015, TRACE32 also operates as a TCF agent. This makes it possible to use the Wind River Workbench or the Eclipse debugger as an IDE and a TRACE32 debugger as a debugging back end.
TCF
The Target Communication Framework (TCF) was developed by the Eclipse Foundation as a protocol framework with the goal of defi ning a uniform debug-ging communication protocol between an IDE and a target system.
The TCF communication model is based on the idea of services. A service is a group of related commands, events, and the corresponding semantics. The Memory Service, for example, defi nes a group of commands and events for reading and writing to memory.
TCF defi nes a series of standard services. At the same time, the framework is open for the defi nition of propri-etary services.
TRACE32 TCF
After the TRACE32 software is started as a TCF agent, it provides its services to the Wind River Workbench or the Eclipse debugger via TCP/IP.
Requested services are operated by TRACE32 with the help of the debugger connected to the target. It does not matter if this is a hardware-based debugger connected via JTAG to the target system or a pure software debugger communicating with a virtual tar-get. At the present time, TRACE32 offers all traditionalservices relevant to debugging. Depending on the feedback and requests from customers, development
of special TRACE32 services for extended functions is planned for the future. Lauterbach offers a TRACE32 TCF plug-in for customers who want to confi gure and start TRACE32 from the Wind River Workbench or the Eclipse debugger.
Wind River Workbench
Until this year, Lauterbach has not offered an integrateddebugging solution for developers who prefer to work with the Wind River Workbench. This limitation has now been resolved.
Eclipse Debugger
The previous GDB-based connection was restricted to the processor architectures and compilers supported by GDB. Using its TCF services, TRACE32 can now provide an open communication interface for debug-ging with Eclipse for all processor architectures and compilers supported by TRACE32.
VxWorks 5/6/7
VxWorks 653 2.x
VxWorks 653 3.x
Wind River Linux
Wind River Hypervisor 2.x
VxWorks Microkernel Profile
TRACE32 Support for Wind River
JTAG-based TCF Toolchain
If your address has changed or you do not want to receive a newsletter from us any more, please send a brief email to the following address:
TRACE32 as a Front End for UndoDBTRACE32 can be used as a front end for the UndoDB reversible debugger since the middle of 2015. The ARM/Cortex as well as Intel® x86/x64 architectures are supported.
With the UndoDB target server, Linux developers have a tool available that allows them to debug an applica-tion process as well as to record details of its execu-tion.
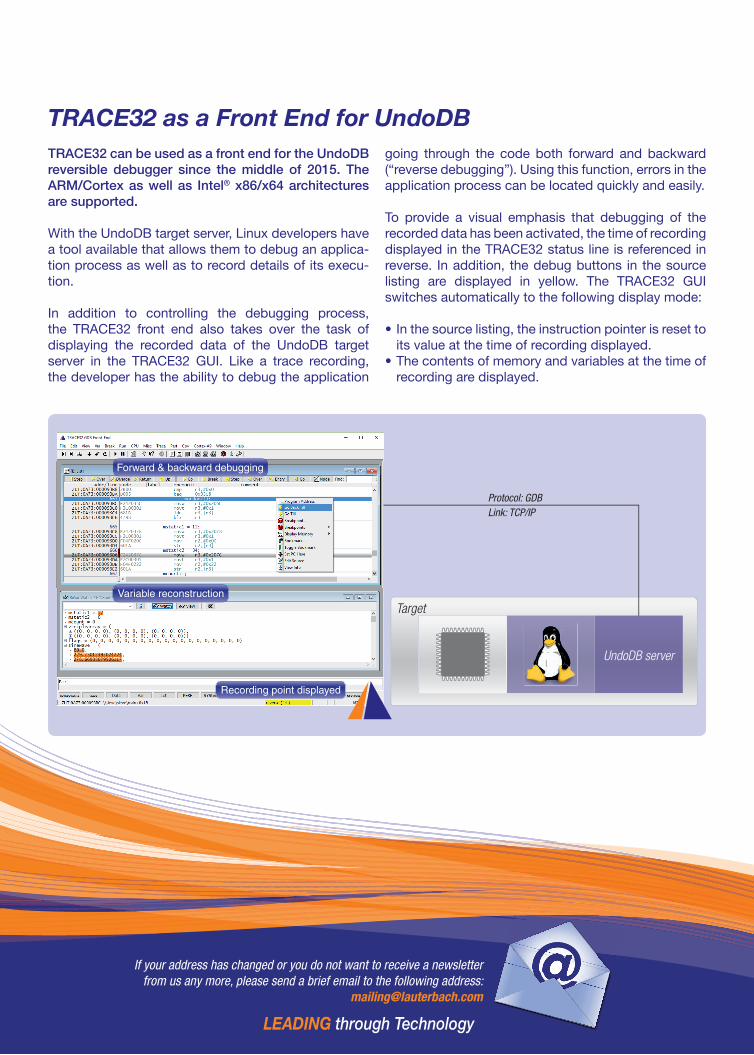
In addition to controlling the debugging process, the TRACE32 front end also takes over the task of displaying the recorded data of the UndoDB target server in the TRACE32 GUI. Like a trace recording, the developer has the ability to debug the application
going through the code both forward and backward (“reverse debugging”). Using this function, errors in the application process can be located quickly and easily.
To provide a visual emphasis that debugging of the recorded data has been activated, the time of recording displayed in the TRACE32 status line is referenced in reverse. In addition, the debug buttons in the source listing are displayed in yellow. The TRACE32 GUI switches automatically to the following display mode:
• In the source listing, the instruction pointer is reset to its value at the time of recording displayed.
• The contents of memory and variables at the time of recording are displayed.
Recording point displayed
Variable reconstruction
Forward & backward debugging
Target
UndoDB server
Protocol: GDBLink: TCP/IP