s c m for sale
TRANSCRIPT

South Cooper MtnHeights SubdivisionSW Scholls Ferry Rd & SW 175th Ave, Beaverton OR
For Sale198 Lots
Call for Price
Development Site
0 5 . 1 6 . 2 0 1 9
FOR SALE: 198 Fully-Engineered Ready-to-Build Lots
Permits Ready at City • Cost Estimates Completed • Contractor Bid for Summer ‘19 Construction
George N. [email protected]
0 5 . 1 6 . 2 0 1 9© 2019 Real Estate Investment Group Inc. | 2839 SW 2nd Avenue, Portland OR 97201 | 503.222.1655 | www.reig.com
Licensed in OR & WA
SHOVEL-READY LOTS
SOUTH COOPER MOUNTAIN EAST NEIGHBORHOOD
Nicholas G. [email protected]
SW SCHOLLS FERRY RD
THE HEIGHTS AT SCM
SW 1
75th
AVE
RIVER TERRACE HOMES
H I G H S C H O O L S C M H E I G H T SM U LT I FA M I LY L A N D
3 1 0 U N I T S
S I N G L E FA M I LYF I N I S H E D L O T S
4 9 L O T S
S I N G L E FA M I LYF I N I S H E D L O T S
3 3 L O T SS C M t o w n h o m e L O T S110 FINISHED & APPROVED LOTS
S O L D
S O L D
S O L D
S C M T O W N H O M E SF I N I S H E D L O T S
1 1 0 L O T S
S O L D
F O R S A L E
165 TOTAL LOTS
F O R S A L E
33 TOTAL LOTS

PAGE 2The information contained herein has been obtained from sources we deem reliable. We cannot, however, guarantee its accuracy.
SCM Heights Subdivison SW Scholls Ferry Rd & SW 175th Ave, Beaverton OR
198 FULLY ENGINEERED LOTSPresented Exclusively by Real Estate Investment Group
Sale Offering
SALE HIGHLIGHTS
Property Features• 198 Total Fully-Engineered, Ready-to-Build Detached Lots - Permits Ready for Pickup at City• Onsite Cost Estimates Completed - Contractor Bid Ready for Construction Summer 2019• Road Extensions to Subdivisions Immediately Adjacent to Site
Asset Description• RESIDENTIAL SUBDIVISION LAND: 198 Total Lots- Engineered & Ready-to-Build
Sale Price• Contact Broker for Pricing
Location Features• East Neighborhood of the South Cooper Mountain Master Planning Area Across from Mountainside High• Minutes to Retail at Progress Ridge Townsquare, Murray Scholls Town Center• Nearby Highlights Include Mountainside High School, Scholls Heights Elementary, PETCO, Ace Hardware, Cinetopia, New Seasons Market, Walgreens, Starbucks, Five Guys, 24-Hour Fitness
George N. Diamond503.222.2178
Nicholas G. Diamond503.222.2655
SOUTH COOPER MOUNTAIN OPPORTUNITY
SUBDIVISION LOTS READY FOR CONSTRUCTION

PAGE 3The information contained herein has been obtained from sources we deem reliable. We cannot, however, guarantee its accuracy.
SCM Heights Subdivison SW Scholls Ferry Rd & SW 175th Ave, Beaverton OR
SUBDIVISION OPPORTUNITY198 Total Final-Engineered Build-Ready Lots at South Cooper MountainLast Opportunity in the East Neighborhood
AREA PLAN
H I G H S C H O O L
S C M H E I G H T SM U LT I FA M I LY L A N D
3 1 0 U N I T S
S I N G L E FA M I LYF I N I S H E D L O T S
4 9 L O T S
S I N G L E FA M I LYF I N I S H E D L O T S
3 3 L O T S
S O L D
S O L D
S O L D
S C M T O W N H O M E SF I N I S H E D L O T S
1 1 0 L O T S
S O L D
P H A S E 333 LOTS
P H A S E 2 a86 LOTS
P H A S E 2 B79 LOTS
The above map is for illustrative purposes only and should not be considered a reliable source regarding the final layout or number of lots of the subject propertie(s). Please consult the full plat diagrams on the following pages.
THE HEIGHTS AT SCM

PAGE 4The information contained herein has been obtained from sources we deem reliable. We cannot, however, guarantee its accuracy.
SCM Heights Subdivison SW Scholls Ferry Rd & SW 175th Ave, Beaverton OR
SCM EAST NEIGHBORHOOD
Tile Flat Road
Scholls Ferry Road
SW
NbhdPark
SW
SW
SW
SW
SW
SW
SW
SW.30ac
.37ac
0 50 100 150
4.0 ac.
NORTH
SCM HEIGHTSCRESCENT GROVE - WESTDYCHES - EAST
PHASE 182 lot (SF)43 lots (TH)
PHASE 467 lots (TH)
PHASE 2A81 lots (SF)
PHASE 2B85 lots (SF)
PHASE 333 lots (SF)
MULTIFAMILY340 units
THE RIDGE AT SCM(LOLICH-BELLAIRS)
81 lots (SF)29 lots (TH)
SCHOLLS HEIGHTSAT SCM
Multifamily(~275 units)
SCHOLLS HEIGHTS AT SCM(BIERLY)
~510 lots (SF)~190 lots (TH)
SCHOLLS HEIGHTSAT SCM
Multifamily(~ 200 units)
16" W
24" W
Option A - in collector(per Master Plan)
Option B - inScholls FerryRoad (interim)
Existing 24" Wstub at westside of HighSchool property
H I G H S C H O O L
THE HEIGHTS AT SCM
RIVER TERRACERIVER TERRACE
South Cooper Mountain Featured Developers
(Click on Logo)

PAGE 5The information contained herein has been obtained from sources we deem reliable. We cannot, however, guarantee its accuracy.
SCM Heights Subdivison SW Scholls Ferry Rd & SW 175th Ave, Beaverton OR
SUBJECT PHASE MAP

PAGE 6The information contained herein has been obtained from sources we deem reliable. We cannot, however, guarantee its accuracy.
SCM Heights Subdivison SW Scholls Ferry Rd & SW 175th Ave, Beaverton OR
PHASE
2A

PAGE 7The information contained herein has been obtained from sources we deem reliable. We cannot, however, guarantee its accuracy.
SCM Heights Subdivison SW Scholls Ferry Rd & SW 175th Ave, Beaverton OR
PHASE
2A

PAGE 8The information contained herein has been obtained from sources we deem reliable. We cannot, however, guarantee its accuracy.
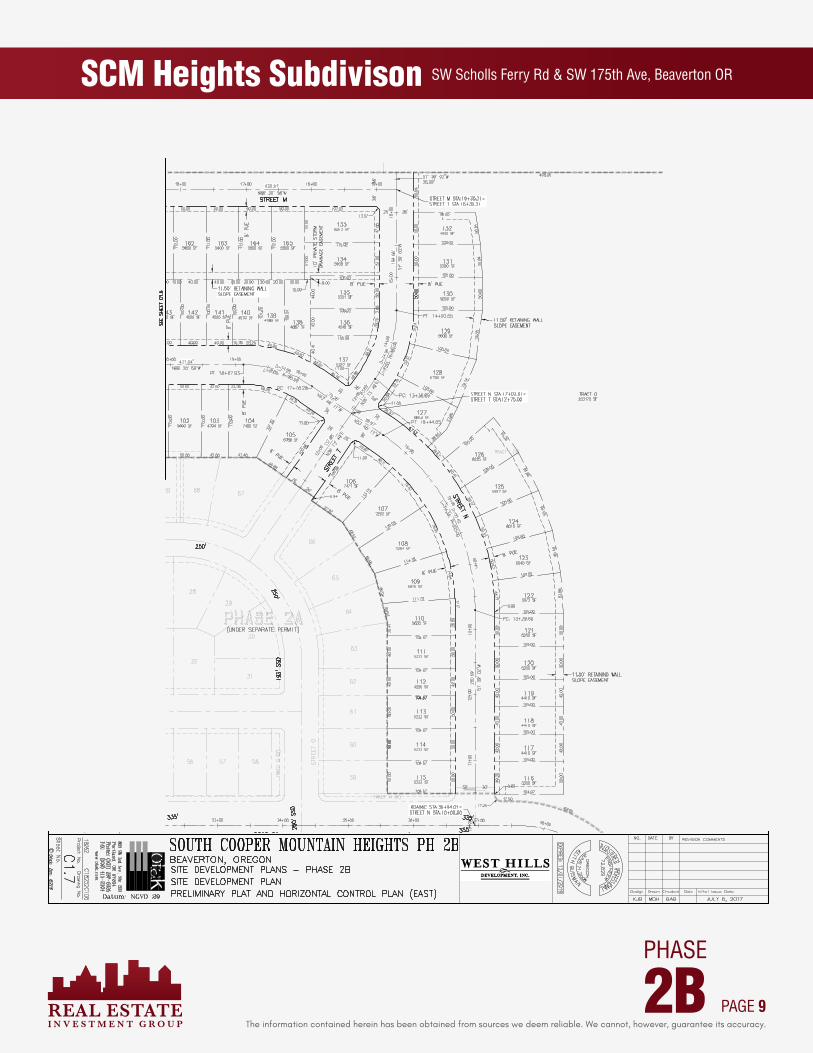
SCM Heights Subdivison SW Scholls Ferry Rd & SW 175th Ave, Beaverton OR
PHASE
2B
PAGE 9The information contained herein has been obtained from sources we deem reliable. We cannot, however, guarantee its accuracy.
SCM Heights Subdivison SW Scholls Ferry Rd & SW 175th Ave, Beaverton OR
PHASE
2B

PAGE 10The information contained herein has been obtained from sources we deem reliable. We cannot, however, guarantee its accuracy.
SCM Heights Subdivison SW Scholls Ferry Rd & SW 175th Ave, Beaverton OR
PHASE
3

PAGE 11The information contained herein has been obtained from sources we deem reliable. We cannot, however, guarantee its accuracy.
SCM Heights Subdivison SW Scholls Ferry Rd & SW 175th Ave, Beaverton OR
R E G I O N A L A E R I A L
NEARBY HIGHLIGHTS
S W S C H O L L S F E R R Y R D .S W B A R R O W S R D .
HIGH SCHOOL
SOUTH COOPER MOUNTAIN SOUTHWEST, WEST,
NORTHWEST, NORTHEAST & MAIN NEIGHBORHOODS
SOUTH COOPER MOUNTAIN EAST NEIGHBORHOOD
M U R R A Y H I L LM A R K E T P L A C E
M U R R A Y S C H O L L ST O W N C E N T E R
P R O G R E S S R I D G ET O W N S Q U A R E
The South Cooper Mountain Community Plan encompasses approximately 544 acres located at the southwest edge of the City of Beaverton (see image to left). This area, referred to in this plan as the Community Plan area, was added to the Urban Growth Boundary in 2011 and was annexed by the City of Beaverton in 2013.
The Community Plan area sits at the base of the south slope of Cooper Mountain. The topography gradually climbs up in elevation moving north from Scholls Ferry Road (at approxi-mately 300’ elevation), with several small hills and hummocks. There are four distinct high points that present constraints with respect to road connectivity, but also provide opportu-nities for viewpoints and the shaping of development pat-terns. Views are primarily to the southwest, capturing the scenic vista of Chehalem Ridge. Views of Mt. Hood to the east are available from the central high point.
https://www.beavertonoregon.gov/DocumentCenter/View/10643
https://www.beavertonoregon.gov/DocumentCenter/View/10120
AREA PROFILE
SUBJECTPROPERTY
PAGE 12The information contained herein has been obtained from sources we deem reliable. We cannot, however, guarantee its accuracy.
SCM Heights Subdivison SW Scholls Ferry Rd & SW 175th Ave, Beaverton OR
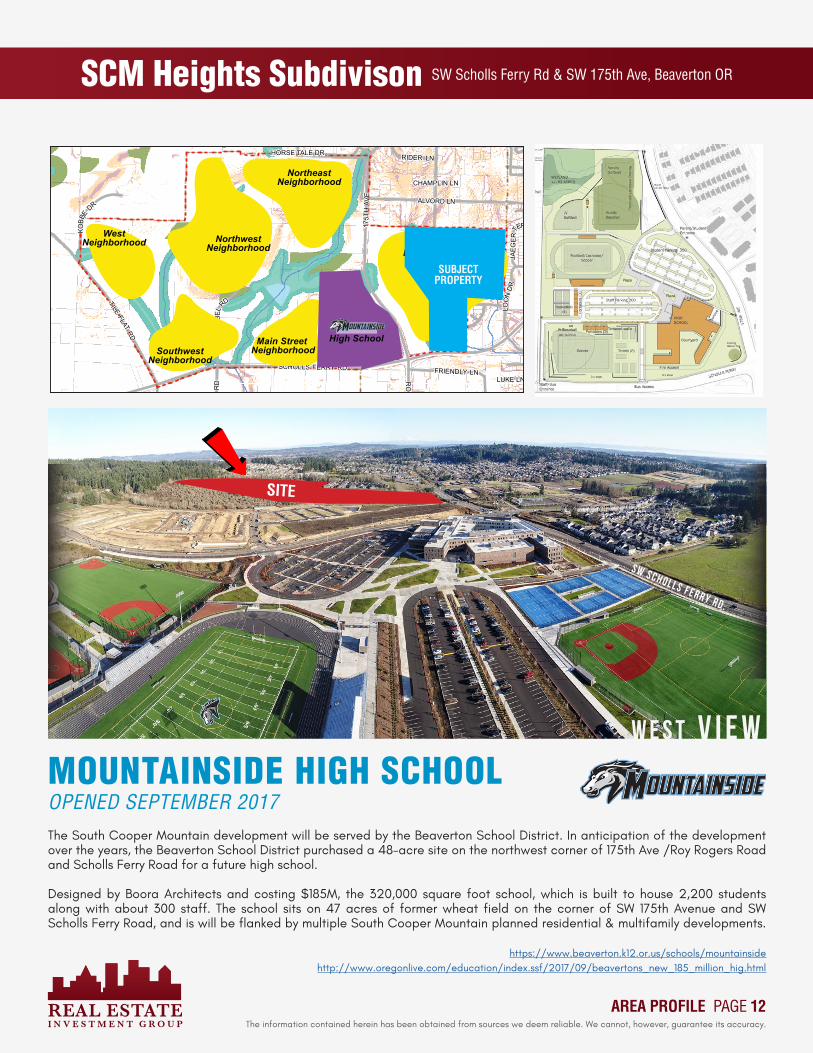
The South Cooper Mountain development will be served by the Beaverton School District. In anticipation of the development over the years, the Beaverton School District purchased a 48-acre site on the northwest corner of 175th Ave /Roy Rogers Road and Scholls Ferry Road for a future high school.
Designed by Boora Architects and costing $185M, the 320,000 square foot school, which is built to house 2,200 students along with about 300 staff. The school sits on 47 acres of former wheat field on the corner of SW 175th Avenue and SW Scholls Ferry Road, and is will be flanked by multiple South Cooper Mountain planned residential & multifamily developments.
https://www.beaverton.k12.or.us/schools/mountainsidehttp://www.oregonlive.com/education/index.ssf/2017/09/beavertons_new_185_million_hig.html
South Cooper Mountain Concept Plan | Land Use Framework 27
Figure 4 - Annexation Area Neighborhood Framework
Land Use PatternsThe patterns of recommended land use are described below by landscape area.
SCMAAThe land use patterns proposed for the SCMAA are responsive to the area’s physical setting and existing conditions. The area is well suited for the proposed walkable urban community because it is:
� Comprised of gently rolling fields, hummocks, and small tributaries.
� Relatively free of physical constraints.
� Close to existing water, sanitary sewer, and transportation infrastructure.
� Anchored by a major civic land use – the new high school.
� Adjacent to existing water, sanitary sewer, and transportation infrastructure, currently being upgraded to serve SCM and the adjacent River Terrace community plan area to the south.
Residential Neighborhoods and DensitiesThe Concept Plan organizes residential land uses into six new neighborhoods that are intended to be walkable, anchored by parks and schools, have easy access to neighborhood shops and services, and connected to natural areas. Each neighborhood is approximately 1/4 mile (or less) from center to edge, which facilitates a comfortable 5 to 10 minute walk to all parts of the neighborhood. The proposed connected pattern of streets and trails is integral to creating a walkable setting that has direct and convenient routes for pedestrians, bicyclists and motorists alike.
TILEFLAT
RD
SCHOLLS FERRY RD
LEEDING LN
RO
SH
AK
RD
RO
YR
OG
ER
SRD
HIGH HILL LN
KO
BBE
DR
HORSE TALE DROUTLOOK LN
ALVORD LN
GLE
N O
AK
PL
VAN
DE
RM
OS
T R
DS
TRO
BEL
RD
FRIENDLY LN
SILER RIDGE LN
LOO
ND
R
175T
H A
VE
1 75T
HAV
E
J AE
GE
RTER
RIDER LN
STAHL DR
CHAMPLIN LN
LUKE LN
STEERE DR
HORSE TALE DR
PLEASANT VALLEY RD
SKYLINE WOODS LN
South Cooper Mountain Concept & Community Plans SCM Community Plan Neighborhoods
Date: 6/18/2014
Prepared By: Angelo Planning Group
0 1,000 2,000500Feet
NDISCLAIMERThis map is intended for informational purposes only. It is not intended for legal, engineering, or surveying purposes. While this map represents the best data available at the time of publication, the City of Beaverton makes no claims, representations, or warranties as to its accuracy or completeness. Metadata available upon request.Coordinate System: NAD 1983 HARN StatePlane Oregon North FIPS 3601 Feet Intl
South Cooper MountainCommunity Plan BoundaryUrban Growth BoundaryExisting RoadsTaxlotsStreamsOpen Water
Wetland/Probable WetlandRiparian & Wetland BuffersUpland Wildlife HabitatClass A15-25% slope (buildable butchallenging)
>25% slope (unbuildable)
SouthwestNeighborhood
Main Street Neighborhood
NorthwestNeighborhood
NortheastNeighborhood
WestNeighborhood
East Neighborhood
PlannedHigh School
Conceptual Annexation Area Neighborhoods
Planned High School Site
MOUNTAINSIDE HIGH SCHOOLOPENED SEPTEMBER 2017
W E S T V I E W
SW SCHOLLS FERRY RD.
AREA PROFILE
SUBJECTPROPERTY
SITE

PAGE 13The information contained herein has been obtained from sources we deem reliable. We cannot, however, guarantee its accuracy.
SCM Heights Subdivison SW Scholls Ferry Rd & SW 175th Ave, Beaverton OR
This
repo
rt w
as p
rodu
ced
usin
g da
ta fr
om p
rivat
e an
d go
vern
men
t sou
rces
dee
med
to b
e re
liabl
e. T
he in
form
atio
n he
rein
is p
rovi
ded
with
out r
epre
sent
atio
n or
war
rant
y.
FULL PROFILE2000-2010 Census, 2019 Estimates with 2024 ProjectionsCalculated using Weighted Block Centroid from Block Groups
Lat/Lon: 45.4264/-122.8535RF1
SW Scholls Ferry & SW 175th1 mi radius 3 mi radius 5 mi radius
Beaverton, OR 97007
POPU
LATI
ON
2019 Estimated Population 0 T 6,818 76,529 217,5562024 Projected Population 0 T 7,158 80,254 228,0062010 Census Population 0 T 6,154 69,522 198,1262000 Census Population 0 T 4,565 56,342 169,324Projected Annual Growth 2019 to 2024 - 1.0% 1.0% 1.0%Historical Annual Growth 2000 to 2019 - 2.6% 1.9% 1.5%
HO
USE
HO
LDS
2019 Estimated Households 0 T 2,453 29,695 85,8052024 Projected Households 0 T 2,614 31,606 91,3672010 Census Households 0 T 2,189 26,776 77,4532000 Census Households 0 T 1,673 21,180 66,138Projected Annual Growth 2019 to 2024 - 1.3% 1.3% 1.3%Historical Annual Growth 2000 to 2019 - 2.5% 2.1% 1.6%
AG
E
2019 Est. Population Under 10 Years - 13.8% 11.7% 12.0%2019 Est. Population 10 to 19 Years - 14.5% 13.2% 12.4%2019 Est. Population 20 to 29 Years - 10.8% 11.3% 12.7%2019 Est. Population 30 to 44 Years - 26.6% 22.4% 22.0%2019 Est. Population 45 to 59 Years - 21.3% 22.3% 20.2%2019 Est. Population 60 to 74 Years - 10.3% 14.1% 14.5%2019 Est. Population 75 Years or Over - 2.8% 5.1% 6.2%2019 Est. Median Age 35.6 38.9 38.4
MA
RIT
AL
STA
TUS
& G
END
ER
2019 Est. Male Population - 48.9% 48.6% 48.8%2019 Est. Female Population - 51.1% 51.4% 51.2%
2019 Est. Never Married - 26.2% 28.5% 29.7%2019 Est. Now Married - 60.6% 54.5% 50.1%2019 Est. Separated or Divorced - 11.3% 13.6% 16.3%2019 Est. Widowed - 1.8% 3.3% 3.8%
INC
OM
E
2019 Est. HH Income $200,000 or More - 11.2% 11.2% 7.4%2019 Est. HH Income $150,000 to $199,999 - 22.0% 15.7% 10.7%2019 Est. HH Income $100,000 to $149,999 - 31.3% 21.5% 18.4%2019 Est. HH Income $75,000 to $99,999 - 13.5% 14.8% 15.7%2019 Est. HH Income $50,000 to $74,999 - 9.9% 14.4% 17.4%2019 Est. HH Income $35,000 to $49,999 - 6.2% 9.0% 11.0%2019 Est. HH Income $25,000 to $34,999 - 2.2% 5.0% 6.8%2019 Est. HH Income $15,000 to $24,999 - 1.1% 4.4% 6.5%2019 Est. HH Income Under $15,000 - 2.6% 4.1% 6.1%2019 Est. Average Household Income $0 T $137,137 $116,902 $95,1582019 Est. Median Household Income $0 T $124,623 $101,842 $81,9672019 Est. Per Capita Income $0 T $49,337 $45,403 $37,614
2019 Est. Total Businesses 0 T 129 1,047 8,4062019 Est. Total Employees 0 T 912 7,156 77,102
©2019, Sites USA, Chandler, Arizona, 480-491-1112 page 1 of 3 Demographic Source: Applied Geographic Solutions 4/2019, TIGER Geography
This
repo
rt w
as p
rodu
ced
usin
g da
ta fr
om p
rivat
e an
d go
vern
men
t sou
rces
dee
med
to b
e re
liabl
e. T
he in
form
atio
n he
rein
is p
rovi
ded
with
out r
epre
sent
atio
n or
war
rant
y.
This
repo
rt w
as p
rodu
ced
usin
g da
ta fr
om p
rivat
e an
d go
vern
men
t sou
rces
dee
med
to b
e re
liabl
e. T
he in
form
atio
n he
rein
is p
rovi
ded
with
out r
epre
sent
atio
n or
war
rant
y.
FULL PROFILE2000-2010 Census, 2019 Estimates with 2024 ProjectionsCalculated using Weighted Block Centroid from Block Groups
Lat/Lon: 45.4264/-122.8535RF1
SW Scholls Ferry & SW 175th1 mi radius 3 mi radius 5 mi radius
Beaverton, OR 97007
POPU
LATI
ON
2019 Estimated Population 0 T 6,818 76,529 217,5562024 Projected Population 0 T 7,158 80,254 228,0062010 Census Population 0 T 6,154 69,522 198,1262000 Census Population 0 T 4,565 56,342 169,324Projected Annual Growth 2019 to 2024 - 1.0% 1.0% 1.0%Historical Annual Growth 2000 to 2019 - 2.6% 1.9% 1.5%
HO
USE
HO
LDS
2019 Estimated Households 0 T 2,453 29,695 85,8052024 Projected Households 0 T 2,614 31,606 91,3672010 Census Households 0 T 2,189 26,776 77,4532000 Census Households 0 T 1,673 21,180 66,138Projected Annual Growth 2019 to 2024 - 1.3% 1.3% 1.3%Historical Annual Growth 2000 to 2019 - 2.5% 2.1% 1.6%
AG
E
2019 Est. Population Under 10 Years - 13.8% 11.7% 12.0%2019 Est. Population 10 to 19 Years - 14.5% 13.2% 12.4%2019 Est. Population 20 to 29 Years - 10.8% 11.3% 12.7%2019 Est. Population 30 to 44 Years - 26.6% 22.4% 22.0%2019 Est. Population 45 to 59 Years - 21.3% 22.3% 20.2%2019 Est. Population 60 to 74 Years - 10.3% 14.1% 14.5%2019 Est. Population 75 Years or Over - 2.8% 5.1% 6.2%2019 Est. Median Age 35.6 38.9 38.4
MA
RIT
AL
STA
TUS
& G
END
ER
2019 Est. Male Population - 48.9% 48.6% 48.8%2019 Est. Female Population - 51.1% 51.4% 51.2%
2019 Est. Never Married - 26.2% 28.5% 29.7%2019 Est. Now Married - 60.6% 54.5% 50.1%2019 Est. Separated or Divorced - 11.3% 13.6% 16.3%2019 Est. Widowed - 1.8% 3.3% 3.8%
INC
OM
E
2019 Est. HH Income $200,000 or More - 11.2% 11.2% 7.4%2019 Est. HH Income $150,000 to $199,999 - 22.0% 15.7% 10.7%2019 Est. HH Income $100,000 to $149,999 - 31.3% 21.5% 18.4%2019 Est. HH Income $75,000 to $99,999 - 13.5% 14.8% 15.7%2019 Est. HH Income $50,000 to $74,999 - 9.9% 14.4% 17.4%2019 Est. HH Income $35,000 to $49,999 - 6.2% 9.0% 11.0%2019 Est. HH Income $25,000 to $34,999 - 2.2% 5.0% 6.8%2019 Est. HH Income $15,000 to $24,999 - 1.1% 4.4% 6.5%2019 Est. HH Income Under $15,000 - 2.6% 4.1% 6.1%2019 Est. Average Household Income $0 T $137,137 $116,902 $95,1582019 Est. Median Household Income $0 T $124,623 $101,842 $81,9672019 Est. Per Capita Income $0 T $49,337 $45,403 $37,614
2019 Est. Total Businesses 0 T 129 1,047 8,4062019 Est. Total Employees 0 T 912 7,156 77,102
©2019, Sites USA, Chandler, Arizona, 480-491-1112 page 1 of 3 Demographic Source: Applied Geographic Solutions 4/2019, TIGER GeographyTh
is re
port
was
pro
duce
d us
ing
data
from
priv
ate
and
gove
rnm
ent s
ourc
es d
eem
ed to
be
relia
ble.
The
info
rmat
ion
here
in is
pro
vide
d w
ithou
t rep
rese
ntat
ion
or w
arra
nty.
This
repo
rt w
as p
rodu
ced
usin
g da
ta fr
om p
rivat
e an
d go
vern
men
t sou
rces
dee
med
to b
e re
liabl
e. T
he in
form
atio
n he
rein
is p
rovi
ded
with
out r
epre
sent
atio
n or
war
rant
y.
FULL PROFILE2000-2010 Census, 2019 Estimates with 2024 ProjectionsCalculated using Weighted Block Centroid from Block Groups
Lat/Lon: 45.4264/-122.8535RF1
SW Scholls Ferry & SW 175th1 mi radius 3 mi radius 5 mi radius
Beaverton, OR 97007
POPU
LATI
ON
2019 Estimated Population 0 T 6,818 76,529 217,5562024 Projected Population 0 T 7,158 80,254 228,0062010 Census Population 0 T 6,154 69,522 198,1262000 Census Population 0 T 4,565 56,342 169,324Projected Annual Growth 2019 to 2024 - 1.0% 1.0% 1.0%Historical Annual Growth 2000 to 2019 - 2.6% 1.9% 1.5%
HO
USE
HO
LDS
2019 Estimated Households 0 T 2,453 29,695 85,8052024 Projected Households 0 T 2,614 31,606 91,3672010 Census Households 0 T 2,189 26,776 77,4532000 Census Households 0 T 1,673 21,180 66,138Projected Annual Growth 2019 to 2024 - 1.3% 1.3% 1.3%Historical Annual Growth 2000 to 2019 - 2.5% 2.1% 1.6%
AG
E
2019 Est. Population Under 10 Years - 13.8% 11.7% 12.0%2019 Est. Population 10 to 19 Years - 14.5% 13.2% 12.4%2019 Est. Population 20 to 29 Years - 10.8% 11.3% 12.7%2019 Est. Population 30 to 44 Years - 26.6% 22.4% 22.0%2019 Est. Population 45 to 59 Years - 21.3% 22.3% 20.2%2019 Est. Population 60 to 74 Years - 10.3% 14.1% 14.5%2019 Est. Population 75 Years or Over - 2.8% 5.1% 6.2%2019 Est. Median Age 35.6 38.9 38.4
MA
RIT
AL
STA
TUS
& G
END
ER
2019 Est. Male Population - 48.9% 48.6% 48.8%2019 Est. Female Population - 51.1% 51.4% 51.2%
2019 Est. Never Married - 26.2% 28.5% 29.7%2019 Est. Now Married - 60.6% 54.5% 50.1%2019 Est. Separated or Divorced - 11.3% 13.6% 16.3%2019 Est. Widowed - 1.8% 3.3% 3.8%
INC
OM
E
2019 Est. HH Income $200,000 or More - 11.2% 11.2% 7.4%2019 Est. HH Income $150,000 to $199,999 - 22.0% 15.7% 10.7%2019 Est. HH Income $100,000 to $149,999 - 31.3% 21.5% 18.4%2019 Est. HH Income $75,000 to $99,999 - 13.5% 14.8% 15.7%2019 Est. HH Income $50,000 to $74,999 - 9.9% 14.4% 17.4%2019 Est. HH Income $35,000 to $49,999 - 6.2% 9.0% 11.0%2019 Est. HH Income $25,000 to $34,999 - 2.2% 5.0% 6.8%2019 Est. HH Income $15,000 to $24,999 - 1.1% 4.4% 6.5%2019 Est. HH Income Under $15,000 - 2.6% 4.1% 6.1%2019 Est. Average Household Income $0 T $137,137 $116,902 $95,1582019 Est. Median Household Income $0 T $124,623 $101,842 $81,9672019 Est. Per Capita Income $0 T $49,337 $45,403 $37,614
2019 Est. Total Businesses 0 T 129 1,047 8,4062019 Est. Total Employees 0 T 912 7,156 77,102
©2019, Sites USA, Chandler, Arizona, 480-491-1112 page 1 of 3 Demographic Source: Applied Geographic Solutions 4/2019, TIGER Geography
This
repo
rt w
as p
rodu
ced
usin
g da
ta fr
om p
rivat
e an
d go
vern
men
t sou
rces
dee
med
to b
e re
liabl
e. T
he in
form
atio
n he
rein
is p
rovi
ded
with
out r
epre
sent
atio
n or
war
rant
y.
PORTLAND AREA JOB GROWTHT H E P O R T L A N D - V A N C O U V E R - H I L L S B O R O A R E AR E C O R D E D A T O T A L E M P L O Y M E N T S T A T I S T I CO F O V E R 1 , 2 7 3 , 0 0 0 J O B S F I L L E D A S O F J A N u a r y2 0 1 9 , A C H A N G E O F + 1 9 . 1 % F R O M 1 0 Y E A R S P R I O R .
JAN 2009: 1 ,069,533 | JAN 2019: 1 ,273,796
C H A N G E0.8%3.2%3.8%5.2%5.3%6.7%8.1%10.3%12.0%12.6%13.3%13.8%14.7%15.2%18.4%
Figures Provided by Bureau of Labor Statistics and Department of Numbers
Bureau ofLabor
Statistics 1/09 1/10 1/11 1/12 1/13 1/14 1/15 1/16 1/17 1/18 1/19
1,300,000
1,200,000
1,100,000
E M P L OY M E N T P O R T L A N D -VA N C O U V E R - H I L L S B O R O
AREA
DEM
OGRA
PHIC
S
DEMOGRAPHICS
*Demographic Information, Traffic Counts, and Merchant Locations are Provided by REGIS Online at SitesUSA.com
H I G H S C H O O L
R I V E R T E R R A C EH O M E S
R I V E R T E R R A C EH O M E S
SW SCHOLLS FERRY RD.
SW 175TH AVE
P R O G R E S S R I D G ET O W N S Q U A R E
M U R R A Y S C H O L L ST O W N C E N T E R
S C H O L L S H E I G H T SE L E M E N TA R Y
M U R R A Y H I L LM A R K E T P L A C E
SITE
S O U T H C O O P E R M O U N TA I NE A S T N E I G H B O R H O O D