s esponsiv ot fusog chitectur yoblas fusion
TRANSCRIPT
Articleshttps://doi.org/10.1038/s41556-018-0106-3
1Department of Molecular Biology and Genetics, Johns Hopkins University School of Medicine, Baltimore, MD, USA. 2Department of Cell Biology, Johns Hopkins University School of Medicine, Baltimore, MD, USA. 3Department of Molecular Biology, UT Southwestern Medical Center, Dallas, TX, USA. 4Department of Bioengineering, University of California, Berkeley, Berkeley, CA, USA. 5Departments of Biology and of Biochemistry and Molecular Biology, Penn State University, University Park, PA, USA. 6Department of Modern Mechanics, University of Science and Technology of China, Hefei, China. 7Present address: Laboratory of Regenerative Medicine in Sports Science, School of Sports Science, South China Normal University, Guangzhou, China. 8These authors contributed equally: Rui Duan, Ji Hoon Kim, Khurts Shilagardi. *e-mail: [email protected]
The mechanical properties of cells are dynamically controlled in many cellular processes, such as cell division, fusion, migra-tion, invasion and shape change. Spectrin is best known as a
membrane skeletal protein that is critical for maintaining cell shape and providing mechanical support for the plasma membrane1–3. The functional unit of spectrin is a flexible, chain-like heterotetra-mer composed of two antiparallel heterodimers of α -spectrin and β -spectrin that interact head to head to form a tetramer1–3. Whereas vertebrates have two α -spectrins (α I and α II) and five β -spectrins (β I–β V), invertebrates encode one α -spectrin and two β -spec-trins (β and β Heavy (β H)). In erythrocytes and neurons, spectrins, together with actin, ankyrin and associated proteins, form either a static polygonal lattice structure4–6 or an ordered periodic longi-tudinal array7 underneath the plasma membrane to protect cells from mechanical damage8. Such a mechanoprotective function of spectrin is made possible by holding the spectrin network under constitutive tension9. However, in many cellular processes, mechan-ical tension is generated upon transient cell–cell interactions. How spectrins, which are expressed in most eukaryotic cells, respond to transient mechanical stimuli in dynamic cellular processes remains largely unknown.
Cell–cell fusion is a dynamic process that occurs in fertiliza-tion, immune response, bone resorption, placenta formation and skeletal muscle development and regeneration10,11. Studies in vari-ous cell fusion events from Drosophila to mammals have demon-strated that cell fusion is an asymmetric process12–17. At the site of fusion, known as the fusogenic synapse, an attacking fusion partner invades its receiving fusion partner with actin-propelled membrane
protrusions12–14,16,17, whereas the receiving fusion partner mounts a myosin II (MyoII)-mediated mechanosensory response14. The pushing and resisting forces from the two fusion partners bring the two cell membranes into close proximity and put the fusogenic syn-apse under high mechanical tension to promote fusogen engage-ment and cell membrane merger13,14. Although multiple long and narrow invasive protrusions from the attacking fusion partner are known to be required for cell–cell fusion12,13,18,19, it is unclear how these protrusions are spatially constricted and shaped to generate high mechanical tension at the fusogenic synapse.
Resultsα/βH-Spectrin is required for Drosophila myoblast fusion. In a deficiency screen for genes required for myoblast fusion, we uncov-ered Df(3L)1226. Genetic analyses of candidate genes within this deficiency led to the identification of βH-spectrin (also known as karst or kst)20,21. Zygotic null mutants of α-spectrin or βH-spectrin exhibited minor myoblast fusion defects (Fig. 1Aa–Ad,B), probably owing to maternal contribution. The α/βH-spectrin double mutant showed a severe fusion defect (Fig. 1Ae,B), which suggests that α /β H-spectrin heterotetramer formation was significantly compro-mised when the concentrations of both α -spectrin and β H-spectrin were low. The functional specificity of α /β H-spectrin in myoblast fusion was demonstrated by a genetic rescue experiment, in which full-length β H-spectrin expressed in all muscle cells rescued the fusion defect in the βH-spectrin mutant (Fig. 1Ag,B). By contrast, overexpressing dominant-negative β H-spectrin (mini-β H-spectrin; deleting 15 of the 29 spectrin repeats)22 or β -spectrin containing 17
Spectrin is a mechanoresponsive protein shaping fusogenic synapse architecture during myoblast fusionRui Duan1,7,8, Ji Hoon Kim1,8, Khurts Shilagardi1,8, Eric S. Schiffhauer2, Donghoon M. Lee3, Sungmin Son4, Shuo Li1, Claire Thomas5, Tianzhi Luo6, Daniel A. Fletcher 4, Douglas N. Robinson2 and Elizabeth H. Chen 1,3*
Spectrin is a membrane skeletal protein best known for its structural role in maintaining cell shape and protecting cells from mechanical damage. Here, we report that α /β H-spectrin (β H is also called karst) dynamically accumulates and dissolves at the fusogenic synapse between fusing Drosophila muscle cells, where an attacking fusion partner invades its receiving partner with actin-propelled protrusions to promote cell fusion. Using genetics, cell biology, biophysics and mathematical modelling, we demonstrate that spectrin exhibits a mechanosensitive accumulation in response to shear deformation, which is highly elevated at the fusogenic synapse. The transiently accumulated spectrin network functions as a cellular fence to restrict the diffusion of cell-adhesion molecules and a cellular sieve to constrict the invasive protrusions, thereby increasing the mechanical tension of the fusogenic synapse to promote cell membrane fusion. Our study reveals a function of spectrin as a mechanore-sponsive protein and has general implications for understanding spectrin function in dynamic cellular processes.
© 2018 Macmillan Publishers Limited, part of Springer Nature. All rights reserved.
NATuRE CELL BioLogy | VOL 20 | JUNE 2018 | 688–698 | www.nature.com/naturecellbiology688

ArticlesNATUre Cell BiOlOgy
spectrin repeats23 in muscle cells exacerbated the fusion defect of the βH-spectrin mutant (Fig. 1Af,B and Supplementary Fig. 1a) and caused a minor fusion defect in wild-type embryos (Supplementary Fig. 1a). Thus, both mini-β H-spectrin and β -spectrin interfere with α /β H-spectrin heterotetramer formation and disrupt the
α /β H-spectrin network. Moreover, β H-spectrin expression specifi-cally in the receiving fusion partners (muscle founder cells), but not in the attacking cells (fusion-competent myoblasts (FCMs)), rescued the fusion defect (Fig. 1Ah,Ai), demonstrating that α /β H- spectrin functions specifically in founder cells.
α-spec–/–
Num
ber
of n
ucle
iin
DA
1 m
uscl
e
MHCWT βH-spec–/–
βH-spec
WT
V5
WT
F-actin Duf
α-spec
Merge
V5
Flag
βH-spec–/Df(3L)1266
α-spec–/–
βH-spec–/–βH-spec–/–;twi::mini-βH-spec
βH-spec–/–;twi::βH-spec
βH-spec–/–;rP298::βH-spec
βH-spec–/–;sns::βH-spec
A C
B
WT
α-spec
–/–
β H-sp
ec–/–
β H-sp
ec– / D
f(3L)1266
α-spec
–/– , β H-sp
ec–/–
β H-sp
ec–/– ; tw
i::mini-β H
-spec
β H-sp
ec–/– ; tw
i::β H-sp
ec
β H-sp
ec–/– ; s
ns::β H
-spec
β H-sp
ec–/– ; rP
298::β H-sp
ec
β H-s
pec
trap
line
MI0
3134
rP29
8::
V5-
β H-s
pec
sltr
–/– ;
sns:
:V5-
β H-s
pec
β H-s
pec
trap
line
CP
TI0
0226
6
0
2
4
6
8
10
12
14
16
18P < 0.0001
P < 0.0001P < 0.0001
GFP
Transgenic rescue
P < 0.0001
a b c
d e f
g h i
c
b
a
d
e
f
P = 0.3874
P = 0.1081
Fig. 1 | α/βH-Spectrin is required for myoblast fusion and is enriched at the fusogenic synapse in founder cells. A, Myoblast fusion phenotype in the α/βH-spectrin mutant. Stage 15 embryos immunolabelled with anti-muscle MHC. Ventral lateral muscles of three hemisegments are shown in each panel. Unfused myoblasts are indicated by arrowheads. A wild-type (WT) embryo is shown (Aa). A minor fusion defect is demonstrated in the α-spectrin (α-spec–/–) (Ab), βH-spectrin (βH-spec–/–) (Ac) and transheterozygous βH-spec–/Df(3 L)1266 (Ad) mutants. A severe fusion defect is shown in the α/βH-spectrin–/– (α-spec–/– βH-spec–/–) double mutant (Ae). Expressing mini-β H-spectrin (mini-β H-spec) in all muscle cells with twi-GAL4 exacerbated the fusion defect in the βH-spec–/– mutant (Af). The fusion defect in the βH-spec–/– mutant was rescued by expressing βH-spectrin in all muscle cells with twi-GAL4 (Ag), in founder cells with rP298-GAL4 (Ah), but not in FCMs with sns-GAL4 (Ai). For each genotype, 10 embryos (biologically independent samples) were imaged with similar results. Scale bar, 20 μ m. B, Quantification of the fusion index. The number of Eve-positive nuclei in the dorsal acute muscle 1 (DA1) was counted for each genotype in A. The number of DA1 analysed for each genotype: n = 42, 17, 45, 45, 55, 45, 42, 42 and 42 (left to right). The red horizontal bars indicate the mean values. Significance was determined by the two-tailed Student’s t-test. C, Localization of α /β H-spectrin at the fusogenic synapse. Confocal images of side-by-side pairs of FCM (outlined with dashed lines in the merge panels) and the founder cell in stage 13–14 embryos triple labelled with phalloidin (F-actin), anti-Duf, and anti-α -spectrin (Ca), anti-β H-spectrin (Cb), anti-Flag (GFP/Flag trap line; Cc), anti-GFP (YFP trap line; Cd), or anti-V5 (V5-β H-spectrin expressed in founder cells with rP298-GAL4 (Ce) or FCMs with sns-GAL4 (Cf)). The expression of β H-spectrin in FCMs was visualized in the fusion-defective sltr mutant without β H-spectrin diffusion from FCMs to founder cells. Note the enrichment of α -spectrin (Ca) and β H-spectrin (Cb–Cd) at the fusogenic synapse (arrowheads) and specifically in founder cells (Ce), but not in FCMs (Cf). For each genotype, 20 fusogenic synapses (biologically independent samples) were imaged with similar results. Scale bar, 5 μ m.
© 2018 Macmillan Publishers Limited, part of Springer Nature. All rights reserved.
NATuRE CELL BioLogy | VOL 20 | JUNE 2018 | 688–698 | www.nature.com/naturecellbiology 689

Articles NATUre Cell BiOlOgy
α/βH-Spectrin enrichment at the fusogenic synapse in founder cells. To determine the subcellular localization of α /β H-spectrin, we performed antibody-labelling experiments using anti-α -spectrin and anti-β H-spectrin in wild-type embryos (Fig. 1Ca,Cb), and anti-Flag and anti-green fluorescent protein (GFP) in two protein trap lines, kstMI03134 (Fig. 1Cc) and kstCPTI002266 (Fig. 1Cd). Both α -spectrin and β H-spectrin were enriched at the fusogenic synapse, largely co-localizing with Dumbfounded (Duf), an immunoglobulin domain-containing founder cell-adhesion molecule (CAM)24, and closely associating with the FCM-specific F-actin focus, which is part of an invasive podosome-like structure (PLS)4. By contrast, β -spectrin was not detected in muscle cells, despite its high expression in epi-thelial cells (Supplementary Fig. 1b). Ectopically expressed β -spec-trin in muscle cells did not enrich at the fusogenic synapse as did α /β H-spectrin and mini-β H-spectrin (Fig. 1C and Supplementary Fig. 1e,f). In addition, two of the major accessory proteins that are known to stabilize spectrin–actin interactions, adducin25 and
protein 4.1 (refs 26,27), were also absent at the fusogenic synapse (Supplementary Fig. 1c,d). An amino-terminal-tagged, func-tional β H-spectrin (V5-β H-spectrin) that was specifically expressed in founder cells, but not in FCMs, was enriched at the fusogenic synapse (Fig. 1Ce,Cf), supporting the functional requirement for α /β H-spectrin in founder cells.
Dynamic accumulation of α/βH-spectrin at the fusogenic syn-apse. To investigate whether α /β H-spectrin forms a stable mem-brane skeletal network at the fusogenic synapse, we performed live-imaging experiments in Drosophila embryos. Surprisingly, instead of forming a static network, mCherry-β H-spectrin exhib-ited dynamic accumulation and dissolution at the fusogenic syn-apse accompanying the appearance and disappearance of the FCM-specific F-actin focus (lifespan: 6–30 min, average: ~12 min28) (Fig. 2a,b and Supplementary Video 1). The amount of β H-spectrin accumulation correlated with the density and invasiveness of the
fe
120 s 240 s 360 s 480 sPre-bleach Post-bleach
βH-spec FRAP at the fusogenic synapse
Time (s)
Nor
mal
ized
fluo
resc
ence
inte
nsity
(%
)
GF
P-a
ctin
mC
herr
y-β
H-s
pec
Mer
ge
0
20
40
60
80
100
0 100 200 300 400 5000
20
40
60
80
100
0
20
40
60
80
160
Rec
over
y (%
)
Hal
f-tim
e (s
)
100
120
140
WT
dpak3
210 s 270 s 330 s 390 s 450 s180 s
30 s 150 s 270 s 600 s 720 s 930 s
0 255
0 255
66.51 63.38 67.97 66.41 43.22 25.98
33.85 12.9633.57 33.32 29.95 17.86
36.4 24.633.5
10.514.313.712.215.923.9
29.732.951.6
aG
FP
-act
in
mC
herr
y-β
H-s
pec
Mer
geb
dc
GF
P-a
ctin
mC
herr
y-β
H-s
pec
Mer
ge
Fig. 2 | α/βH-Spectrin dynamically accumulates at the fusogenic synapse in response to PLS invasion. a–d, Time-lapse stills of stage 14 WT (a,b) or dpak3-mutant (c,d) embryos expressing GFP-actin and mCherry-β H-spectrin. The fluorescence intensity of F-actin foci and β H-spectrin accumulation is displayed by heatmaps (b,d) on a scale from 0 to 255. The dashed outlines (b,d) delineate F-actin foci and β H-spectrin accumulation at the fusogenic synapse. The mean fluorescence intensity in the outlined area is shown in each panel. Note the dynamic changes in the intensity and morphology of β H-spectrin accumulation correlating with those of the F-actin foci. For each genotype, 10 fusogenic synapses were live imaged with similar results. Scale bars, 5 μ m. e,f, FRAP of β H-spectrin at the fusogenic synapse. Time-lapse stills of a representative FRAP experiment in a stage 14 WT embryo expressing GFP-actin and mCherry-β H-spectrin (e). Arrowhead indicates the photobleached region. Scale bar, 5 μ m. Recovery kinetics of the mCherry fluorescence after photobleaching are shown (f). The curve on the left shows the fluorescence recovery of mCherry-β H-spectrin in panel e. The recovery t1/2 and percentage were quantified from multiple experiments. Each data point represents a fusogenic synapse; n = 18 fusogenic synapses were analysed by FRAP. The horizontal bars represent the median value. The average t1/2 was 66 ± 35 s (median: 55 s) and the average percentage recovery was 67 ± 14% (median: 68%).
© 2018 Macmillan Publishers Limited, part of Springer Nature. All rights reserved.
NATuRE CELL BioLogy | VOL 20 | JUNE 2018 | 688–698 | www.nature.com/naturecellbiology690

ArticlesNATUre Cell BiOlOgy
F-actin foci, with a higher accumulation in wild-type embryos (Fig. 2a,b and Supplementary Video 1) and an overall weaker accumulation in the dpak3 mutant, in which actin foci are loosely packed and less invasive19 (Fig. 2c,d and Supplementary Video 2). Thus, spectrin forms a transient and dynamic structure that rap-idly changes its density and morphology corresponding to the invasiveness of the PLS. The dynamic behaviour of β H-spectrin at the fusogenic synapse was confirmed by fluorescence recovery after photobleaching (FRAP). The fluorescence of photobleached mCherry-β H-spectrin rapidly recovered with an average half-time (t1/2) of 66 ± 35 s, similar to that of the F-actin foci in FCMs (70 ± 18 s)12, and eventually reached 67 ± 14% of the pre-bleaching level (Fig. 2e,f and Supplementary Video 3). Thus, PLS invasion and α /β H-spectrin accumulation were temporally coordinated and new α /β H-spectrin heterotetramers were continuously recruited to the fusogenic synapse in response to PLS invasion. Moreover, FRAP analysis of mCherry-β H-spectrin expressed in epithelial cells showed fluorescence recovery to a similar level, albeit at a slower rate, probably due to the different mechanical properties of the two cellular environments (Supplementary Fig. 2 and Supplementary Video 4). Taken together, the dynamic behaviour of β H-spectrin is not restricted to muscle cells and is a general feature of this protein.
α/βH-Spectrin accumulates at the fusogenic synapse in the absence of chemical signalling. Given the correlation between spectrin accumulation and PLS invasiveness, we tested whether β H-spectrin accumulation at the fusogenic synapse is triggered by the protrusive force from FCMs or recruited by the founder-cell CAMs, Duf and its functionally redundant paralogue Roughest (Rst)24,29. Remarkably, β H-spectrin still accumulated at fusogenic synapses in the duf, rst double mutant expressing Duf that lacks its entire intracellular domain (DufΔ intra) (Fig. 3A,Ba,Bb,C). DufΔ intra does not transduce chemical signals but functions normally
to attract the FCM-specific immunoglobulin domain-containing CAM, Sticks and stones (Sns)30–32. The overall weaker accumulation of β H-spectrin in these mutant embryos corresponds to a partial rescue of myoblast fusion33 (Fig. 3C). By contrast, Antisocial (Ants; also known as Rols7), a founder cell-specific adaptor protein that binds to the intracellular domain of Duf34–37, did not accumulate at the fusogenic synapse (Fig. 3Ba,Bc,C). Thus, β H-spectrin accumula-tion in founder cells can be triggered by invasive forces from the PLS, independent of chemical signalling from CAMs. Furthermore, β H-spectrin accumulated at the fusogenic synapse in cultured Drosophila S2R+ cells that were induced to fuse by co-express-ing Sns and the Caenorhabditis elegans fusogen Eff-1 (refs 13,38). Specifically, the F-actin foci in the attacking cells were always asso-ciated with β H-spectrin accumulation in the receiving cells, despite the lack of endogenous Duf and Rst in these cells13 (Fig. 3D).
α/βH-Spectrin exhibits mechanosensitive accumulation. To test directly whether β H-spectrin exhibits mechanosensitive accu-mulation, we performed micropipette aspiration (MPA) assays, in which a pulling force is applied to Drosophila S2 cells by a micropipette. GFP-β H-spectrin showed rapid mechanosensitive accumulation at the base area of the aspirated portion of the cell (Fig. 4A,D), in contrast to the previously demonstrated tip accu-mulation of the mechanosensory protein MyoII14. This effect was not due to an increased amount of membranous materials, F-actin or adaptor proteins at the base area, as a red fluorescent protein (RFP)-tagged PtdIns(4,5)P2-interacting pleckstrin homology (PH) domain39, GFP-actin or Ants did not accumulate at this area (Fig. 4Ba,Bb,D and Supplementary Fig. 3ai,b). In addition, no accu-mulation was observed for GFP-β H-spectrin-Δ C, which deleted a carboxy-terminal fragment containing the tetramerization domain40 (Fig. 4Bc,D and Supplementary Fig. 4a), or GFP-β H-spectrin-Δ N, which deleted an amino-terminal fragment containing the
DufΔintraSns
Actin focus
FCM
Founder cell
A
duf r
st;
twi::
Duf
Δint
ra-F
lag
+ V
5-β H
-spe
c
Merge
Ants
Ants
Pro
tein
acc
umul
atio
n (
fuso
geni
c sy
naps
e/ad
jace
nt c
orte
x)
I
IIGFP F-actin
I
II
F-actinV5
Duf
B C
Ddu
f rst
;tw
i::D
ufΔi
ntra
-Fla
g+
V5-
β H-s
pec
twi::
Duf
Δint
ra-F
lag
+ V
5-β H
-spe
c
AntsβH-spec
0
1
2
3
4
5
6
7
8 P = 0.025
P < 0.0001
a
b
c
twi::D
ufΔint
ra-F
lag
+ V5-
β H-s
pec
duf r
st;
twi::D
ufΔint
ra-F
lag
+ V5-
β H-s
pec
twi::D
ufΔint
ra-F
lag
+ V5-
β H-s
pec
duf r
st;
twi::D
ufΔint
ra-F
lag
+ V5-
β H-s
pec
Fig. 3 | α/βH-Spectrin accumulates at the fusogenic synapse in the absence of chemical signalling from CAMs. A, Schematic diagram of the fusogenic synapse showing truncated Duf in the founder cell interacting with Sns in the FCM to induce the formation of an invasive F-actin focus. B, Co-expression of DufΔ intra-Flag and V5-β H-spectrin in all muscle cells with twi-GAL4 in WT (Ba) or duf rst double-mutant (Bb,Bc) embryos. Representative images of fusogenic synapses in stage 13–14 embryos triple labelled with anti-V5 (β H-spec), phalloidin (F-actin) and anti-Ants or anti-Duf (DufΔ intra-Flag). FCMs are outlined (dashed lines) in the merge panels. Note the β H-spectrin accumulation (Bb,Bc) and the lack of Ants accumulation (Bc) at the fusogenic synapse (arrowheads) in the absence of Duf intracellular signalling. Scale bar, 5 μ m. C, Quantification of the relative intensity of β H-spectrin and Ants enrichment at the fusogenic synapse in WT and duf, rst double-mutant embryos expressing DufΔ intra. The fluorescence intensity at the fusogenic synapse was compared with that in the adjacent cortical area to calculate the relative protein intensity ratio. Each data point represents a fusogenic synapse; n = 52, 111, 51 and 43 (left to right) fusogenic synapses were analysed. The horizontal bars represent the mean values. Significance was determined by the two-tailed Student’s t-test. D, β H-Spectrin enrichment at the fusogenic synapse in S2R+ cells. GFP-β H-spectrin in the receiving cell (I; outlined in the left panel; co-expressing GFP-β H-spectrin and Eff-1) accumulated at the fusogenic synapse (arrowhead) in response to the F-actin-propelled invasive protrusions (arrow) from the attacking cell (II; outlined in the right panel; co-expressing Sns and Eff-1). Thirty-five fusogenic synapses were examined with similar results. Scale bar, 5 μ m.
© 2018 Macmillan Publishers Limited, part of Springer Nature. All rights reserved.
NATuRE CELL BioLogy | VOL 20 | JUNE 2018 | 688–698 | www.nature.com/naturecellbiology 691

Articles NATUre Cell BiOlOgy
actin-binding domain40 (Fig. 4Bd,D and Supplementary Fig. 4a,b), suggesting that tetramerization and actin-binding activities are required for β H-spectrin accumulation. α -Spectrin only exhibited mechanosensitive accumulation when co-expressed with β H-spectrin, but not when expressed alone, in S2 cells (Supplementary Fig. 3ai,ii,b), which is consistent with the higher expression of endogenous β -spectrin than β H-spectrin in these cells (FlyBase)41, the former of which was not mechanosensitive, as demonstrated by MPA assays (Supplementary Fig. 3aiii,b). Notably, the mechanosensitive accumulation of β H-spectrin is time and force dependent, which increased linearly over time until reaching its peak level at 80–90 s after the onset of aspiration (Supplementary Fig. 3c) and increased proportionally to applied pressure (Supplementary Fig. 3d). These results indicate that α /β H-spectrin binding to the actin network depends on the number of binding sites at a given time rather than the additional cooperative activity of the previously bound tetra-mers, and that the mechanical force applied to the cortical actin network leads to an increase in the number of binding sites for the α /β H-spectrin heterotetramers.
α/βH-Spectrin responds to shear deformation. It is intriguing that α /β H-spectrin and MyoII show distinct patterns of mechanosensi-tive accumulation revealed by MPA. Previous coarse-grained mod-elling suggests that the tip of an aspirated cell corresponds to an area of maximal actin network dilation (or radial expansion), whereas the base area corresponds to the maximal shear deformation (or shape change)42. MPA analyses suggest that MyoII is a mechano-sensory protein for actin network dilation, whereas α /β H-spectrin responds specifically to shear deformation. Consistent with the distinct areas of mechanosensitive accumulation of MyoII and spectrin, β H-spectrin remained at the base area in cells treated with Y27632, a small molecule that decreases MyoII activity by inhibiting Rho-associated protein kinase (ROCK), the upstream activator of MyoII (compare Fig. 4Ca and Fig. 4Cb; Fig. 4D), and MyoII (RFP-Zip14) remained at the tip of β H-spectrin knockdown cells (compare Fig. 4Ca and Fig. 4Cc; Fig. 4E). At late time points, weak β H-spectrin accumulation was observed at the neck and tip areas of aspirated cells in a MyoII-dependent manner (Fig. 4A, 85 s; Supplementary Fig. 3aiii), suggesting that MyoII-mediated cortical contraction at the tip may gradually create shear deformation along the aspirated portion of the cell.
The distinct domains of mechanosensitive accumulation of MyoII and spectrin induced by pulling forces prompted us to ask whether they exhibit a similar response to pushing forces. Course-grained modelling of cells invaded by protrusions with a 5-μ m diameter predicted clear separation of dilation versus shear domains along the invasive protrusion, with maximal dilation corresponding to the tip and maximal shear deformation corresponding to the base
(Fig. 4F). However, when the invasive protrusions became narrower (~400-nm diameter), there was a gradual increase of shear deforma-tion at the tip, where the dilation deformation remained largely the same (Fig. 4G–J). This model predicted that the mechanosensitive accumulations of β H-spectrin and MyoII induced by narrow protru-sions may no longer be clearly separated. To test this directly, we performed atomic force microscopy (AFM) experiments, in which a pushing force was applied to cells expressing GFP-β H-spectrin and RFP-MyoII by a cantilever with a tip diameter of ~200 nm, which mimics the length scale of the invasion protrusions at a mature fusogenic synapse (Fig. 4K). When indented at a depth of 2–5 μ m, β H-spectrin and MyoII exhibited rapid and largely overlapping domains of accumulation to the indented area (Fig. 4L and Supplementary Video 5), consistent with the pattern of mechano-sensitive response predicted by the course-grained model and the enrichment of both β H-spectrin and MyoII at the fusogenic synapse in Drosophila embryos14 (Fig. 1C).
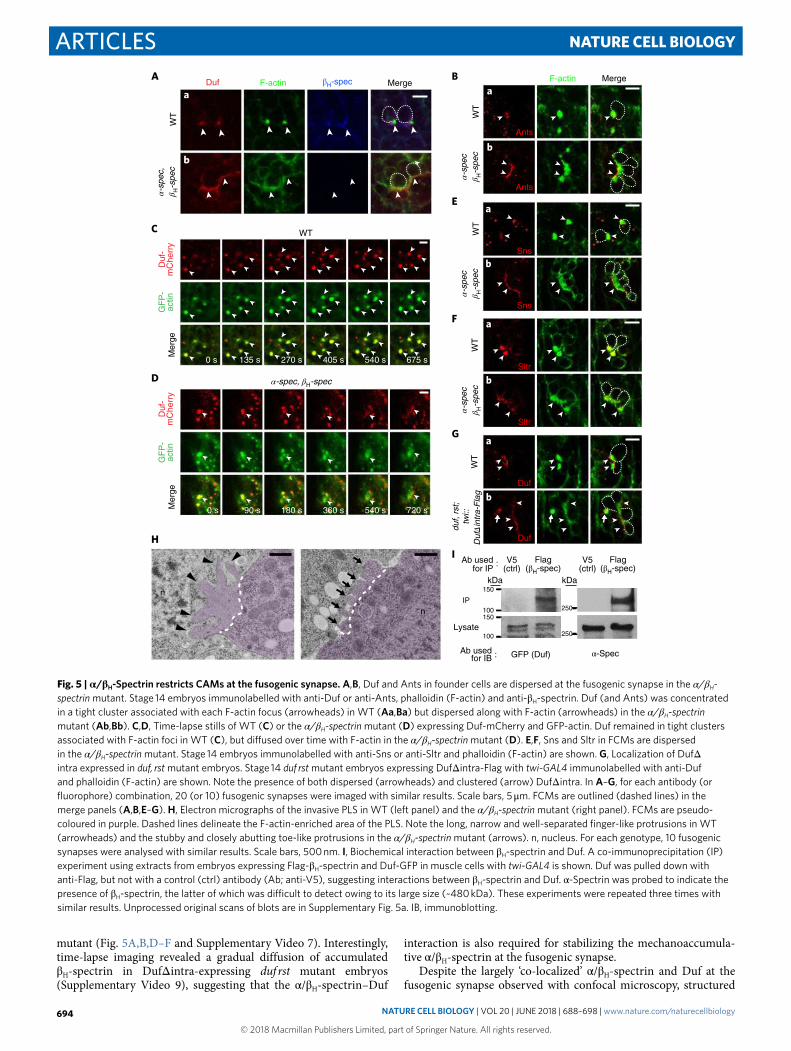
α/βH-Spectrin restricts CAMs at the fusogenic synapse. What are the biological functions of spectrin accumulation at the fusogenic synapse? In the α/βH-spectrin double mutant, the founder-cell CAM Duf and its interacting protein Ants were both dispersed at the fuso-genic synapse, instead of forming a tight aggregate as in wild-type cells (Fig. 5A,B). Time-lapse imaging revealed the dynamic disper-sion of Duf in these mutant embryos (Supplementary Video 6), compared to the tight Duf cluster associated with dense F-actin foci in wild-type embryos (Fig. 5C and Supplementary Video 7). Occasional Duf aggregates in mutant embryos gradually diffused over time, suggesting that α /β H-spectrin is required for the main-tenance, but not the initiation, of the Duf clusters (Fig. 5D and Supplementary Video 6).
As Duf and Sns interact in trans31, we tested whether Duf dis-persal in founder cells of the α/βH-spectrin mutant affects Sns dis-tribution in FCMs. Indeed, Sns was also dispersed at the fusogenic synapse in these embryos (Fig. 5E), and so did the actin nucleation-promoting factors and their interacting proteins, such as WASP-interacting protein (WIP; also known as Solitary (Sltr)), which is recruited by Sns to the fusogenic synapse43,44 (Fig. 5F). The diffusion of actin nucleation-promoting factors resulted in a fuzzy F-actin structure in the FCM (Fig. 5A,B,D–F), with an average fluorescence intensity of 61 ± 19 per focus on a 0–255 scale (n = 35), compared to 170 ± 15 per focus (n = 28) in wild-type embryos. The low inten-sity of F-actin indicates a low filament density, which generated stubby and closely abutting toe-like protrusions, instead of the long, narrow and well-separated finger-like protrusions in wild-type embryos12,18,19 (Fig. 5H). Thus, Duf restriction by α /β H-spectrin in founder cells regulates Sns localization and the distribution of actin filaments at the fusogenic synapse in FCMs.
Fig. 4 | α/βH-Spectrin exhibits mechanosensitive accumulation to shear deformation. A–E, Mechanosensitive accumulation of β H-spectrin revealed by MPA. Representative images of MPA experiments in which an S2 cell expressing a fluorescent protein was aspirated with a micropipette (diameter: ~5 μ m) (A–C). DIC, differential interference contrast. Arrowheads indicate enrichment of GFP-β H-spectrin at the base of the aspirated portion in A, Ca and the Y27632-treated cell in Cb; enrichment of RFP-MyoII at the tip in Ca and the β H-spectrin knockdown (KD) cell in Cc, but no enrichment of the probes or proteins in B. Scale bars, 5 μ m. Protein accumulation at the base (D) or the tip (E) of aspirated cells from A–C. Background-subtracted fluorescence intensities at the base (Ib) (D) or the tip (It) (E) and at the opposite pole of the cell body (Io) were measured, and the ratio (Ib/Io) (D) or (It/Io) (E) was calculated. The number of independent experiments: n = 21, 9, 11, 16, 15 and 14 (D, left to right) and n = 10, 11 and 14 (E, left to right). The black horizontal lines represent the mean values. Analysis of variance (ANOVA) was with Fisher’s least significant difference test. F–J, Coarse-grained simulation of mechanical deformation in the receiving cell triggered by invasive protrusions. A schematic diagram of a cell invaded by a protrusion (F) and heatmaps of simulated dilation or shear deformation (F,g) caused by protrusions of different radii (r0) are shown. Close-up views are shown in g. Plots of dilation and shear deformation along 2-μ m protrusions with an r0 of 500 nm (H) or 200 nm (i) are shown. n = 4 independent measurements of deformation along the protrusions, mean ± s.e.m. Shear deformation increases at the tip in panel i compared to panel H. Dilation and shear deformations at the tip (normalized position: 0.0–0.2) of protrusions with different r0 are shown (J). Shear deformation increases with smaller radius. K,L, β H-Spectrin accumulation in response to pushing forces revealed by AFM. A schematic diagram of the AFM experiments is displayed (K). A cantilever applied a pushing force to the periphery of a S2R+ cell. A S2R+ cell expressing GFP-β H-spectrin and RFP-MyoII is shown (L). Both proteins rapidly accumulated to the indented area generated by the cantilever (arrowheads) in 24 out of 42 cells tested. Scale bar, 10 μ m.
© 2018 Macmillan Publishers Limited, part of Springer Nature. All rights reserved.
NATuRE CELL BioLogy | VOL 20 | JUNE 2018 | 688–698 | www.nature.com/naturecellbiology692

ArticlesNATUre Cell BiOlOgy
α/βH-Spectrin maintains Duf enrichment at the fusogenic syn-apse via biochemical interactions. To investigate how spectrin restricts Duf at the fusogenic synapse, we performed co-immu-noprecipitation experiments using Drosophila embryos expressing Flag-β H-spectrin and Duf-GFP in muscle cells. An antibody against Flag, but not a control antibody, co-precipitated α -spectrin and Duf-GFP, suggesting that the α /β H-spectrin heterotetramers interact
with Duf (Fig. 5I and Supplementary Fig. 5a). Moreover, DufΔ intra, which can no longer interact with α /β H-spectrin, appeared to be dif-fused at many fusogenic synapses in the duf rst mutant, similar to Duf diffusion in the α/βH-spectrin mutant (Fig. 5G). As a conse-quence, the F-actin foci that formed initially due to the trans-inter-actions between DufΔ intra and Sns also gradually dispersed at the fusogenic synapse (Supplementary Video 8), as in the α/βH-spectrin
Normalized positionalong the protrusion
Dila
tion S
hear
0
1
3
2
0.0 0.2 0.4 0.6 0.8 1.0
0.0 0.2 0.4 0.6 0.8 1.0
Dila
tion
0
1
2
3
Shear
0.00.2
0.4
0.6
200 300 400 500
Shear
0.0
0.2
0.4
0.6
Dila
tion
0
1
2
3
l = 2 µm
0.8
1.0
Normalized positionalong the protrusion
Radius of protrusion (nm)
GFP-βH-spec
RFP-MyoII
35 s 35 s
60 s 60 s
90 s 90 s
120 s 120 s
Dilation Shear
DIC
GF
P-β
H-s
pec
GFP-βH-spec
5 s 25 s 45 s 65 s 85 s
Pea
k I b/
I o
DIC RFP/GFP
GF
P-
β H-s
pec∆
CR
FP
-PH
GF
P-
Ant
s
DIC RFP-MyoII
A
B
F
G H L
K
I J
C
E
D
Dilation(rotated view)
Shear(rotated view)
Schematicdiagram
0.8
1.0
GF
P-
β H-s
pec∆
N
β H-s
pec
KD
+ Y
2763
2
Pea
k I t/I
o
P < 0.0001
P < 0.0001P = 0.54
P = 0.08
P = 0.80P = 0.33
RFP-Myo
II
RFP-Myo
II
+ β H
-spe
c KD
RFP-Myo
II
+ Y27
632
r0 = 2.5 μm
3.0
2.4
1.8
1.2
0.7
0.9
0.5
0.3
0.1
r0 = 200 nm
r0 = 200 nm, l = 2 µm
r0 = 500 nm, l = 2 µm
aa
b
c
c
b
d
0.5
1.5
2.5
1.0
2.0
0.0
GFP-β H-s
pec
GFP-β H-s
pec
+ Y27
632
GFP-β H-s
pec∆
C
GFP-β H-s
pec∆
N
RFP-PH
GFP-Ant
s
3.0
0.5
1.5
2.5
1.0
2.0
0.0
3.0
3.5
4.0
2.5 1.0
0.8
0.6
0.4
0.2
0.0
2.0
1.5
1.0
0.5
0.6
0.0
0.2
0.4
0.8
1.0
R
lr0
© 2018 Macmillan Publishers Limited, part of Springer Nature. All rights reserved.
NATuRE CELL BioLogy | VOL 20 | JUNE 2018 | 688–698 | www.nature.com/naturecellbiology 693
Articles NATUre Cell BiOlOgy
mutant (Fig. 5A,B,D–F and Supplementary Video 7). Interestingly, time-lapse imaging revealed a gradual diffusion of accumulated β H-spectrin in DufΔ intra-expressing duf rst mutant embryos (Supplementary Video 9), suggesting that the α /β H-spectrin–Duf
interaction is also required for stabilizing the mechanoaccumula-tive α /β H-spectrin at the fusogenic synapse.
Despite the largely ‘co-localized’ α /β H-spectrin and Duf at the fusogenic synapse observed with confocal microscopy, structured
F-actinDuf MergeA
WT
α-sp
ec,
β H-s
pec
α-sp
ecβ H
-spe
cα-
spec
β H-s
pec
α-sp
ecβ H
-spe
c
Duf
-m
Che
rry
GF
P-
actin
Mer
ge
WT
0 s 90 s 180 s 360 s 540 s 720 s
0 s 135 s 270 s 405 s 540 s 675 s
C
IP
Flag(βH-spec)
GFP (Duf) α-Spec
V5(ctrl)
Lysate
Ab usedfor IP
Sns
B
Sltr
Ants
MergeF-actin
α-spec, βH-spec
Duf
-m
Che
rry
GF
P-
actin
Mer
ge
Ants
Sns
Sltr
WT
WT
WT
Flag(βH-spec)
V5(ctrl)
n
G
n
H
D
E
F
WT
duf,
rst;
twi::
Duf
Δint
ra-F
lag
I
Duf
Duf
a
b
a
b
a
b
a
b
a
b
100
100
Ab usedfor IB
:
:
kDa
250
250
kDa150
150
βH-spec
Fig. 5 | α/βH-Spectrin restricts CAMs at the fusogenic synapse. A,B, Duf and Ants in founder cells are dispersed at the fusogenic synapse in the α/βH-spectrin mutant. Stage 14 embryos immunolabelled with anti-Duf or anti-Ants, phalloidin (F-actin) and anti-β H-spectrin. Duf (and Ants) was concentrated in a tight cluster associated with each F-actin focus (arrowheads) in WT (Aa,Ba) but dispersed along with F-actin (arrowheads) in the α/βH-spectrin mutant (Ab,Bb). C,D, Time-lapse stills of WT (C) or the α/βH-spectrin mutant (D) expressing Duf-mCherry and GFP-actin. Duf remained in tight clusters associated with F-actin foci in WT (C), but diffused over time with F-actin in the α/βH-spectrin mutant (D). E,F, Sns and Sltr in FCMs are dispersed in the α/βH-spectrin mutant. Stage 14 embryos immunolabelled with anti-Sns or anti-Sltr and phalloidin (F-actin) are shown. g, Localization of DufΔ intra expressed in duf, rst mutant embryos. Stage 14 duf rst mutant embryos expressing DufΔ intra-Flag with twi-GAL4 immunolabelled with anti-Duf and phalloidin (F-actin) are shown. Note the presence of both dispersed (arrowheads) and clustered (arrow) DufΔ intra. In A–g, for each antibody (or fluorophore) combination, 20 (or 10) fusogenic synapses were imaged with similar results. Scale bars, 5 μ m. FCMs are outlined (dashed lines) in the merge panels (A,B,E–g). H, Electron micrographs of the invasive PLS in WT (left panel) and the α/βH-spectrin mutant (right panel). FCMs are pseudo-coloured in purple. Dashed lines delineate the F-actin-enriched area of the PLS. Note the long, narrow and well-separated finger-like protrusions in WT (arrowheads) and the stubby and closely abutting toe-like protrusions in the α/βH-spectrin mutant (arrows). n, nucleus. For each genotype, 10 fusogenic synapses were analysed with similar results. Scale bars, 500 nm. i, Biochemical interaction between β H-spectrin and Duf. A co-immunoprecipitation (IP) experiment using extracts from embryos expressing Flag-β H-spectrin and Duf-GFP in muscle cells with twi-GAL4 is shown. Duf was pulled down with anti-Flag, but not with a control (ctrl) antibody (Ab; anti-V5), suggesting interactions between β H-spectrin and Duf. α -Spectrin was probed to indicate the presence of β H-spectrin, the latter of which was difficult to detect owing to its large size (~480 kDa). These experiments were repeated three times with similar results. Unprocessed original scans of blots are in Supplementary Fig. 5a. IB, immunoblotting.
© 2018 Macmillan Publishers Limited, part of Springer Nature. All rights reserved.
NATuRE CELL BioLogy | VOL 20 | JUNE 2018 | 688–698 | www.nature.com/naturecellbiology694

ArticlesNATUre Cell BiOlOgy
illumination microscopy (SIM) revealed distinct microdomains occupied by these proteins at early stages of the fusogenic synapse marked by small actin foci (Fig. 6Aa), suggesting that Duf does not directly recruit β H-spectrin in founder cells. β H-Spectrin appeared to surround the actin focus, which is consistent with the mechano-sensitive accumulation of α /β H-spectrin to the base areas of invasive protrusions. At late stages of the fusogenic synapse, characterized by large actin foci and a ring-like structure formed by β H-spectrin and Duf, these two proteins exhibited closer association, probably medi-ated by the α /β H-spectrin–Duf interaction (Fig. 6Ab). Strikingly, α /β H-spectrin was mostly seen at the outer rim of the ring (Fig. 6Ab), indicating that the spectrin network functions as a cel-lular fence to restrict Duf diffusion.
α/βH-Spectrin network functions as a cellular sieve to constrict the invasive protrusions. The closely abutting morphology of the invasive protrusions in the α/βH-spectrin mutant prompted us to ask whether spectrin is involved in shaping the invasive structure to well-separated, long and narrow protrusions. At early stages of the fusogenic synapse, actin polymerization in the FCM propelled wide protrusions that triggered mechanosensitive accumulation of β H-spectrin at the base (Fig. 6Ba,Bb). As foci grew, more β H-spectrin accumulated at the fusogenic synapse, resulting in an uneven spec-
trin network with smaller spectrin-free domains (Fig. 6Bc). At the late stage, only narrow protrusions were seen penetrating through spectrin-free microdomains (Fig. 6Bc–Be and Supplementary Video 10). Thus, the spectrin network in the founder cell functions as a ‘cellular sieve’ to constrict the diameters of the invasive protru-sions from the FCM. The resulting long and narrow protrusions put the fusogenic synapse under high mechanical tension to promote plasma membrane fusion12,14.
βV-spectrin is required for mouse myoblast fusion. The require-ment for β H-spectrin in Drosophila myoblast fusion led us to test whether the mammalian orthologue of β H-spectrin, β V-spectrin (also known as Sptbn5), is involved in myoblast fusion. Knocking down β V-spectrin with two independent short interfering RNAs (siRNAs) in mouse C2C12 myoblasts significantly decreased C2C12 cell fusion (Fig. 7A–C). This was not due to a failure in muscle cell differentiation, as the expression level of myogenic regulatory fac-tors—MyoD and myogenin—remained similar in knockdown ver-sus control cells (Fig. 7D,E and Supplementary Fig. 5b). In addition, the expression of skeletal muscle myosin heavy chain (skMHC) was not affected by the knockdown (Fig. 7E). Consistent with the normal expression of these proteins, the β V-spectrin-knockdown cells had a normal, elongated morphology and were MHC positive,
βH-specβH-spec Duf F-actin MergeA
Top
vie
wS
ide
view
Top
vie
wS
ide
view
Late
sta
geE
arly
sta
ge
Late
sta
geE
arly
sta
ge
F-actin MergeB
a a
bb
d
e
c
F-actin
βH-spec
C
FCM
FCM
FCM
Fig. 6 | The α/βH-spectrin network restricts the CAM Duf and constricts actin-propelled invasive protrusions. SIM images of fusogenic synapses in stage 14 embryos of a βH-spec trap line. In A and the ‘top view’ panels in B, the imaging plane was perpendicular to the axis of FCM invasion. In the ‘side view’ panels in B, the imaging plane was parallel to the axis of FCM invasion. A, The α /β H-spectrin network restricts Duf. An early-stage (Aa) and a late-stage (Ab) fusogenic synapse labelled with β H-spectrin, Duf and phalloidin (F-actin) are shown. Note the distinct microdomains occupied by β H-spectrin (arrowhead) and Duf (arrow) at the early stage (Aa) and the ring-like structure formed by β H-spectrin and Duf at the late stage, where these two proteins were closely associated with each other (Ab). In addition, note that β H-spectrin was localized at the outer rim of the ring structure that kept most of the Duf clusters inside (Ab). Twenty-five fusogenic synapses were imaged with similar results. Scale bars, 1 μ m. B, The α /β H-spectrin network constricts invasive protrusions. Side view (Ba,Bd,Be) and top view (Bb,Bc) of early-stage (Ba,Bb) and late-stage (Bc–Be) fusogenic synapses, labelled with β H-spectrin and phalloidin (F-actin). Accumulated β H-spectrin (arrowhead) locally blocked protrusions shown on this focal plane (Ba,Bd,Be). Actin-propelled protrusions triggered β H-spectrin accumulation at the base areas (Bb,Bc). These protrusions appeared wider at the early stage (Bb) than at the late stage (Bc). The dashed circle (Bc, middle panel) outlines the cross-section of a narrow protrusion. Two examples of late-stage fusogenic synapses, showing spectrin-enriched patches (arrowheads) blocking protrusions, as well as long and narrow protrusions from the FCM penetrating through spectrin-free microdomains (Bd,Be). Note that these protrusions triggered further accumulation of β H-spectrin at their tips and/or sides. Forty fusogenic synapses were imaged with similar results. Scale bars, 1 μ m. C, Three-dimensional reconstruction of the fusogenic synapse shown in Bc. Note the actin-propelled protrusions penetrating through the spectrin-free microdomains. Ten fusogenic synapses were reconstructed with similar results.
© 2018 Macmillan Publishers Limited, part of Springer Nature. All rights reserved.
NATuRE CELL BioLogy | VOL 20 | JUNE 2018 | 688–698 | www.nature.com/naturecellbiology 695

Articles NATUre Cell BiOlOgy
despite containing fewer nuclei than the control myofibres (Fig. 7A). Thus, like its Drosophila counterpart, β V-spectrin promotes mam-malian myoblast fusion.
DiscussionThis study has revealed a dynamic mechanoresponsive property of α /β H-spectrin in response to invasive forces during cell–cell fusion. The mechanosensitive accumulation of α /β H-spectrin in the receiv-ing fusion partner establishes a transient and uneven spectrin-enriched network at the fusogenic synapse, which functions both as a cellular fence to restrict CAMs and a cellular sieve to constrict the invasive protrusions from the attacking cell. Through these actions,
spectrin helps to build a fusogenic synapse under high mechanical tension to facilitate cell membrane fusion.
An intercellular mechanoresponsive feedback loop at the fuso-genic synapse. The fusogenic synapse is established by trans-inter-actions between cell-type-specific CAMs, which initiate a series of downstream cellular events in both cell types15,45–47. In FCMs, Sns recruits the Arp2/3 nucleation-promoting factors to activate actin polymerization and generate invasive protrusions, which triggers mechanosensitive accumulation of α /β H-spectrin in the apposing founder cells. The accumulated α /β H-spectrin keeps Duf at the fuso-genic synapse, which recruits additional Duf by lateral diffusion
Fus
ion
inde
x (%
)
20
40
60
0
P < 0.0001
Control
βV-spectrin siRNA1
Myogenin
skMHC
α-Tubulin
GM
DM-1
DM-3
DM-5 GM
DM-1
DM-3
DM-5
Control βV-spectrin KD
A B C E
GMDM
-1DM
-3DM
-5 GMDM
-1DM
-3DM
-5
GMDM
-1DM
-3DM
-5 GMDM
-1DM
-3DM
-5
0
0
1
2
Rel
ativ
e pr
otei
n le
vel
Control
Myogenin
skMHC
3
1
2
3
4
MyoD
0
1
2
3
GMDM
-1DM
-3DM
-5 GMDM
-1DM
-3DM
-5
MyoD
D
Contro
lβV
-spe
ctrin
siRNA1
βV-s
pect
rinre
lativ
e m
RN
A le
vel (
%)
50
100
150
0
P < 0.0001
P = 0.0153
P = 0.0028
P = 0.0571
βV-spectrin siRNA2
βV-s
pectr
insiR
NA2
Contro
lβV
-spe
ctrin
siRNA1
βV-s
pectr
insiR
NA2
βV-spectrinKD
a
b
c
P = 0.7388
P = 0.7776
kDa
40
35
55
170
Fig. 7 | βV-spectrin, the mammalian homologue of Drosophila βH-spectrin, is required for C2C12 myoblast fusion. A, Confocal images of C2C12 cells treated with either transfection reagent alone (Aa) or two individual siRNAs against β V-spectrin (Ab,Ac). Cells were fixed on day 6 post-differentiation and stained with anti-MHC (green) and DAPI (red) to visualize differentiated muscle cells. Note the thinner myofibres in Ab and Ac than in Aa. These experiments were repeated three times with similar results. Scale bar, 50 μ m. B, siRNA knockdown (KD) of β V-spectrin analysed by qRT–PCR. The mRNA level of β V-spectrin in KD cells was normalized against control in n = 3 independent experiments. C, The fusion index was calculated as the percentage of nuclei in multinucleated syncytia versus the total number of nuclei per microscopic field. Each data point represents the fusion index of a random × 20 microscopic fields; n = 34 fields pooled from three independent C2C12 cell differentiation experiments. Note that β V-spectrin KD significantly decreased the fusion index. D,E, β V-spectrin KD did not inhibit myoblast differentiation. Western blot analyses showed no significant difference in the expression levels of myogenic differentiation markers (MyoD, myogenin and skMHC) between control and β V-spectrin KD cells (D). The cell lysates used for SDS–PAGE were derived from the same experiment and the gels/blots were processed in parallel. α -Tubulin was used as a loading control. Unprocessed original scans of blots are in Supplementary Fig. 5b. The quantification of protein expression from panel D is displayed (E). In the graphs, the y axes indicate the measured band intensity ratio of each protein relative to the loading control (α -tubulin). n = 3 independent experiments. Each data point represents the relative protein expression level measured in a single experiment. In B,C,E, the red horizontal bars indicate the mean values, and significance was determined by the two-tailed Student’s t-test. GM, growth medium; DM, differentiation medium.
© 2018 Macmillan Publishers Limited, part of Springer Nature. All rights reserved.
NATuRE CELL BioLogy | VOL 20 | JUNE 2018 | 688–698 | www.nature.com/naturecellbiology696

ArticlesNATUre Cell BiOlOgy
and oligomerization. Newly recruited Duf and transiently stabilized Sns sets off additional rounds of protrusion formation, mechano-sensitive accumulation of α /β H-spectrin and the recruitment of additional CAMs. Through such a positive-feedback loop, a mature fusogenic synapse forms with appropriate levels and localization of CAMs, actin and spectrin. The absence of α /β H-spectrin in founder cells breaks the positive-feedback loop, such that Duf and Sns can-not maintain or increase their concentrations at the fusogenic syn-apse and the structure eventually falls apart. Thus, the intercellular mechanoresponsive feedback loop is critical for the growth and sta-bilization of the fusogenic synapse.
α/βH-Spectrin as a dynamic mechanoresponsive protein for shear deformation. Spectrin has long been thought as a scaffold-ing protein that stably links the plasma membrane and the actin cytoskeleton. Our study revealed a mechanosensitive behaviour of α /β H-spectrin in response to shear stress (Supplementary Fig. 6a). Under shear stress, the actin network’s shape/angle change leads to changes in the distances between actin crosslinker-binding sites. Whereas shorter and stiffer crosslinkers are prone to dissociating from the network, α /β H-spectrin heterotetramers, each with 29 spectrin repeats and flexible linker regions, can accommodate a range of angle/distance changes by folding or unfolding the spectrin repeats and stay bound to the shear-deformed actin network for an extended period of time. In this regard, it has been demonstrated that spectrin heterotetramers in red blood cells unfold their spectrin repeats under shear stress48. FRAP analyses revealed a fraction of α /β H-spectrin that remains associated with the actin network at the fusogenic synapse, consistent with the prolonged binding of some spectrin heterotetramers. We propose that the extensibility and flex-ibility of α /β H-spectrin heterotetramers are the two major properties enabling its transient stable association with the shear-deformed actin network. In support of this, filamin, an actin crosslinker orga-nized as flexible and extensible V-shaped dimers (having immu-noglobulin-like folds49 instead of spectrin repeats), also exhibited mechanosensitive accumulation under shear stress42.
Once the shear stress is removed from the cell cortex, the actin network is no longer under strain and α /β H-spectrin dissociates from the actin network, generating a pool of free α /β H-spectrin heterotetramers that are available for future mechanosensitive responses. Two factors may influence the dynamic dissociation of spectrin from actin: accessory proteins and the actin-binding affin-ity of spectrin. The absence of adducin and protein 4.1 in embry-onic muscle cells suggests that the α /β H-spectrin–actin interaction is relatively unstable compared to that in erythrocytes and axons, such that α /β H-spectrin is more likely to dissociate from the actin network in muscle cells. Although the actin-binding affinities of the structurally similar β H-spectrin and β -spectrin are not known, the difference in their mechanoresponsive behaviours suggests that β -spectrin, similar in size to mini-β H-spectrin, may bind to F-actin with a higher affinity than β H-spectrin or mini-β H-spectrin. Thus, most β -spectrin proteins are stably integrated into the α /β -spec-trin heterotetramers at the cell cortex, leaving few free β -spectrin available for transient mechanosensitive response at the fusogenic synapse. In this regard, α -actinin-1, which has a 90-fold higher actin-binding affinity than α -actinin-4, does not show mechano-sensitive accumulation, whereas α -actinin-4 does50.
The α/βH-spectrin network functions as a cellular fence and a cel-lular sieve. The mechanoaccumulative spectrin network serves at least two functions at the fusogenic synapse. In founder cells, the accumulated spectrin builds a cellular fence to restrict Duf diffusion, probably through two complementary mechanisms (Supplementary Fig. 6b). First, biochemical interactions between Duf and spectrin could prevent Duf clusters from lateral diffusion when they encoun-ter spectrin-enriched patches. Second, the spectrin heterotetramers
are linked to the plasma membrane via the PH domain of β H-spectrin and may collide with the cytoplasmic domain of Duf to block Duf diffusion. A similar role for spectrin in restricting transmembrane protein diffusion has been demonstrated in mouse erythrocytes, in which the transmembrane protein band 3 diffuses faster in spectrin-deficient mutant erythrocytes than in normal cells51 and the cyto-plasmic portion of band 3 slows down the diffusion of the protein52. Spectrin also functions as a cellular sieve to constrict the invasive protrusions from the FCM (Supplementary Fig. 6b). The build-up of the sieve is a dynamic process involving continuous mechanical stimulation and mechanosensitive accumulation. The early mecha-nosensitive accumulations of spectrin in founder cells locally block future protrusions from the FCM, forcing new protrusions to pene-trate through neighbouring spectrin-free areas, thus triggering addi-tional spectrin accumulation. Eventually, large areas of the fusogenic synapse will be populated by spectrin heterotetramers, forming an uneven spectrin network with a few spectrin-free microdomains. Only narrow protrusions that have sufficient mechanical stiffness can ‘squeeze’ through these microdomains to invade the founder cell deeply (Supplementary Fig. 6b). Thus, the dynamically accumu-lated spectrin network gradually constricts the invasive protrusions from the FCM and increases the mechanical tension at the fusogenic synapse to promote cell–cell fusion. Given the widespread expres-sion of spectrin in most eukaryotic cell types, our characterization of α /β H-spectrin as a dynamic mechanoresponsive protein in fusogenic cells has broad implications for understanding spectrin functions in many dynamic cellular processes beyond cell–cell fusion.
MethodsMethods, including statements of data availability and any asso-ciated accession codes and references, are available at https://doi.org/10.1038/s41556-018-0106-3.
Received: 3 May 2017; Accepted: 18 April 2018; Published online: 25 May 2018
References 1. Bennett, V. & Lorenzo, D. N. Spectrin- and ankyrin-based membrane
domains and the evolution of vertebrates. Curr. Top. Membr. 72, 1–37 (2013).
2. Bennett, V. & Lorenzo, D. N. An adaptable spectrin/ankyrin-based mechanism for long-range organization of plasma membranes in vertebrate tissues. Curr. Top. Membr. 77, 143–184 (2016).
3. Machnicka, B. et al. Spectrins: a structural platform for stabilization and activation of membrane channels, receptors and transporters. Biochim. Biophys. Acta 1838, 620–634 (2014).
4. Liu, S. C., Derick, L. H. & Palek, J. Visualization of the hexagonal lattice in the erythrocyte membrane skeleton. J. Cell Biol. 104, 527–536 (1987).
5. Pielage, J. et al. A presynaptic giant ankyrin stabilizes the NMJ through regulation of presynaptic microtubules and transsynaptic cell adhesion. Neuron 58, 195–209 (2008).
6. Byers, T. J. & Branton, D. Visualization of the protein associations in the erythrocyte membrane skeleton. Proc. Natl Acad. Sci. USA 82, 6153–6157 (1985).
7. Xu, K., Zhong, G. & Zhuang, X. Actin, spectrin, and associated proteins form a periodic cytoskeletal structure in axons. Science 339, 452–456 (2013).
8. Hammarlund, M., Jorgensen, E. M. & Bastiani, M. J. Axons break in animals lacking β -spectrin. J. Cell Biol. 176, 269–275 (2007).
9. Krieg, M., Dunn, A. R. & Goodman, M. B. Mechanical control of the sense of touch by β -spectrin. Nat. Cell Biol. 16, 224–233 (2014).
10. Chen, E. H. & Olson, E. N. Unveiling the mechanisms of cell–cell fusion. Science 308, 369–373 (2005).
11. Aguilar, P. S. et al. Genetic basis of cell–cell fusion mechanisms. Trends Genet. 29, 427–437 (2013).
12. Sens, K. L. et al. An invasive podosome-like structure promotes fusion pore formation during myoblast fusion. J. Cell Biol. 191, 1013–1027 (2010).
13. Shilagardi, K. et al. Actin-propelled invasive membrane protrusions promote fusogenic protein engagement during cell–cell fusion. Science 340, 359–363 (2013).
14. Kim, J. H. et al. Mechanical tension drives cell membrane fusion. Dev. Cell 32, 561–573 (2015).
© 2018 Macmillan Publishers Limited, part of Springer Nature. All rights reserved.
NATuRE CELL BioLogy | VOL 20 | JUNE 2018 | 688–698 | www.nature.com/naturecellbiology 697
Articles NATUre Cell BiOlOgy
15. Kim, J. H., Jin, P., Duan, R. & Chen, E. H. Mechanisms of myoblast fusion during muscle development. Curr. Opin. Genet. Dev. 32, 162–170 (2015).
16. Shin, N. Y. et al. Dynamin and endocytosis are required for the fusion of osteoclasts and myoblasts. J. Cell Biol. 207, 73–89 (2014).
17. Haralalka, S. et al. Asymmetric Mbc, active Rac1 and F-actin foci in the fusion-competent myoblasts during myoblast fusion in Drosophila. Development 138, 1551–1562 (2011).
18. Jin, P. et al. Competition between Blown Fuse and WASP for WIP binding regulates the dynamics of WASP-dependent actin polymerization in vivo. Dev. Cell 20, 623–638 (2011).
19. Duan, R. et al. Group I PAKs function downstream of Rac to promote podosome invasion during myoblast fusion in vivo. J. Cell Biol. 199, 169–185 (2012).
20. Dubreuil, R. R., Byers, T. J., Stewart, C. T. & Kiehart, D. P. A β -spectrin isoform from Drosophila (β H) is similar in size to vertebrate dystrophin. J. Cell Biol. 111, 1849–1858 (1990).
21. Thomas, G. H. & Kiehart, D. P. β Heavy-spectrin has a restricted tissue and subcellular distribution during Drosophila embryogenesis. Development 120, 2039–2050 (1994).
22. Tjota, M. et al. Annexin B9 binds to β H-spectrin and is required for multivesicular body function in Drosophila. J. Cell Sci. 124, 2914–2926 (2011).
23. Mazock, G. H., Das, A., Base, C. & Dubreuil, R. R. Transgene rescue identifies an essential function for Drosophila β spectrin in the nervous system and a selective requirement for ankyrin-2-binding activity. Mol. Biol. Cell 21, 2860–2868 (2010).
24. Ruiz-Gomez, M., Coutts, N., Price, A., Taylor, M. V. & Bate, M. Drosophila Dumbfounded: a myoblast attractant essential for fusion. Cell 102, 189–198 (2000).
25. Gardner, K. & Bennett, V. Modulation of spectrin–actin assembly by erythrocyte adducin. Nature 328, 359–362 (1987).
26. Ungewickell, E., Bennett, P. M., Calvert, R., Ohanian, V. & Gratzer, W. B. In vitro formation of a complex between cytoskeletal proteins of the human erythrocyte. Nature 280, 811–814 (1979).
27. Bennett, V. & Baines, A. J. Spectrin and ankyrin-based pathways: metazoan inventions for integrating cells into tissues. Physiol. Rev. 81, 1353–1392 (2001).
28. Richardson, B. E., Beckett, K., Nowak, S. J. & Baylies, M. K. SCAR/WAVE and Arp2/3 are crucial for cytoskeletal remodeling at the site of myoblast fusion. Development 134, 4357–4367 (2007).
29. Strunkelnberg, M. et al. rst and its paralogue kirre act redundantly during embryonic muscle development in Drosophila. Development 128, 4229–4239 (2001).
30. Bour, B. A., Chakravarti, M., West, J. M. & Abmayr, S. M. Drosophila SNS, a member of the immunoglobulin superfamily that is essential for myoblast fusion. Genes Dev. 14, 1498–1511 (2000).
31. Galletta, B. J., Chakravarti, M., Banerjee, R. & Abmayr, S. M. SNS: adhesive properties, localization requirements and ectodomain dependence in S2 cells and embryonic myoblasts. Mech. Dev. 121, 1455–1468 (2004).
32. Shelton, C., Kocherlakota, K. S., Zhuang, S. & Abmayr, S. M. The immunoglobulin superfamily member Hbs functions redundantly with Sns in interactions between founder and fusion-competent myoblasts. Development 136, 1159–1168 (2009).
33. Bulchand, S., Menon, S. D., George, S. E. & Chia, W. The intracellular domain of Dumbfounded affects myoblast fusion efficiency and interacts with Rolling pebbles and Loner. PLoS ONE 5, e9374 (2010).
34. Chen, E. H. & Olson, E. N. Antisocial, an intracellular adaptor protein, is required for myoblast fusion in Drosophila. Dev. Cell 1, 705–715 (2001).
35. Menon, S. D. & Chia, W. Drosophila Rolling pebbles: a multidomain protein required for myoblast fusion that recruits D-Titin in response to the myoblast attractant Dumbfounded. Dev. Cell 1, 691–703 (2001).
36. Rau, A. et al. rolling pebbles (rols) is required in Drosophila muscle precursors for recruitment of myoblasts for fusion. Development 128, 5061–5073 (2001).
37. Menon, S. D., Osman, Z., Chenchill, K. & Chia, W. A positive feedback loop between Dumbfounded and Rolling pebbles leads to myotube enlargement in Drosophila. J. Cell Biol. 169, 909–920 (2005).
38. Mohler, W. A. et al. The type I membrane protein EFF-1 is essential for developmental cell fusion. Dev. Cell 2, 355–362 (2002).
39. Stauffer, T. P., Ahn, S. & Meyer, T. Receptor-induced transient reduction in plasma membrane PtdIns(4,5)P2 concentration monitored in living cells. Curr. Biol. 8, 343–346 (1998).
40. Bennett, V. & Healy, J. Membrane domains based on ankyrin and spectrin associated with cell–cell interactions. Cold Spring Harb. Perspect. Biol. 1, a003012 (2009).
41. Graveley, B. R. et al. The developmental transcriptome of Drosophila melanogaster. Nature 471, 473–479 (2011).
42. Luo, T., Mohan, K., Iglesias, P. A. & Robinson, D. N. Molecular mechanisms of cellular mechanosensing. Nat. Mater. 12, 1064–1071 (2013).
43. Kim, S. et al. A critical function for the actin cytoskeleton in targeted exocytosis of prefusion vesicles during myoblast fusion. Dev. Cell 12, 571–586 (2007).
44. Massarwa, R., Carmon, S., Shilo, B. Z. & Schejter, E. D. WIP/WASp-based actin-polymerization machinery is essential for myoblast fusion in Drosophila. Dev. Cell 12, 557–569 (2007).
45. Abmayr, S. M. & Pavlath, G. K. Myoblast fusion: lessons from flies and mice. Development 139, 641–656 (2012).
46. Schejter, E. D. Myoblast fusion: experimental systems and cellular mechanisms. Semin. Cell Dev. Biol. 60, 112–120 (2016).
47. Deng, S., Azevedo, M. & Baylies, M. Acting on identity: myoblast fusion and the formation of the syncytial muscle fiber. Semin. Cell Dev. Biol. 72, 45–55 (2017).
48. Johnson, C. P., Tang, H.-Y., Carag, C., Speicher, D. W. & Discher, D. E. Forced unfolding of proteins within cells. Science 317, 663–666 (2007).
49. Popowicz, G. M., Schleicher, M., Noegel, A. A. & Holak, T. A. Filamins: promiscuous organizers of the cytoskeleton. Trends Biochem. Sci. 31, 411–419 (2006).
50. Schiffhauer, E. S. et al. Mechanoaccumulative elements of the mammalian actin cytoskeleton. Curr. Biol. 26, 1473–1479 (2016).
51. Sheetz, M. P., Schindler, M. & Koppel, D. E. Lateral mobility of integral membrane proteins is increased in spherocytic erythrocytes. Nature 285, 510–511 (1980).
52. Tsuji, A. & Ohnishi, S. Restriction of the lateral motion of band 3 in the erythrocyte membrane by the cytoskeletal network: dependence on spectrin association state. Biochemistry 25, 6133–6139 (1986).
AcknowledgementsWe thank the Bloomington Stock Center for fly stocks, B. Paterson for the MHC antibody, F. Li for technical assistance, G. Zhang for help with the high-pressure freezing and freeze substitution method, J. Nathans for sharing confocal microscopes and D. Pan for critically reading the manuscript. This work was supported by the NIH grants (R01 AR053173 and R01 GM098816), the American Heart Association Established Investigator Award and the HHMI Faculty Scholar Award to E.H.C.; the NIH grants (R01 GM66817 and R01 GM109863) to D.N.R.; the NIH grants (R01 GM074751 and R01 GM114671) and the Chan Zucherberg Biohub Investigator Award to D.A.F.; the NSF grant MCB-1122013 to C.T.; the NSFC grant 11572316 to T.L.; and the NSFC grant 31771256 to R.D. R.D. was supported by an American Heart Association postdoctoral fellowship, K.S. by an American Heart Association Scientist Development Grant, D.M.L. by a Canadian Institute of Health Research postdoctoral fellowship and S.S. by a Life Sciences Research Foundation postdoctoral fellowship.
Author contributionsR.D. initiated the project. R.D., J.H.K., K.S. and E.H.C. planned the project, performed the experiments in Figs. 1–3,5,7, Supplementary Figs. 1,2,4,6 and Supplementary Videos 1–4,6–9, and discussed the data. J.H.K. and E.H.C. collaborated with E.S. and D.N.R. on the MPA experiments in Fig. 4A–E and Supplementary Fig. 3, and with S.S. and D.A.F. on the AFM experiments in Fig. 4K–L and Supplementary Video 5. D.M.L. carried out the SIM experiments in Fig. 6 and Supplementary Video 10. S.L. carried out the electron microscopy experiments in Fig. 5H. T.L. developed the coarse-grained models in Fig. 4F–J and Supplementary Fig. 5. C.T. contributed spectrin constructs. R.D., J.K., K.S., D.M.L., E.S., T.L., D.N.R. and E.H.C. generated the figures. J.H.K. and E.H.C. wrote the paper. All authors commented on the manuscript.
Competing interestsThe authors declare no competing interests.
Additional informationSupplementary information is available for this paper at https://doi.org/10.1038/s41556-018-0106-3.
Reprints and permissions information is available at www.nature.com/reprints.
Correspondence and requests for materials should be addressed to E.H.C.
Publisher’s note: Springer Nature remains neutral with regard to jurisdictional claims in published maps and institutional affiliations.
© 2018 Macmillan Publishers Limited, part of Springer Nature. All rights reserved.
NATuRE CELL BioLogy | VOL 20 | JUNE 2018 | 688–698 | www.nature.com/naturecellbiology698

ArticlesNATUre Cell BiOlOgy
MethodsFly stocks and genetics. The following strains were obtained from the Bloomington Drosophila Stock Center: fly stocks w1118 (wild type), α-specrg41 (α-spec mutant), kstMI03134 (βH-spec trap line tagged by GFP and 3× Flag; labelling the two longer protein isoforms: PE and PG), twi-GAL4, mef2-GAL4, 69B-GAL4, UAS-GFP-actin and UAS-actin-mRFP. kstCPTI002266 (βH-spec trap line tagged by yellow fluorescent protein (YFP); labelling the five shorter protein isoforms: PA, PB, PC, PF and PH) was obtained from the Kyoto Stock Center. Other stocks used were: kst14.1 (βH-spec mutant)53, Df(3L)1226 (βH-spec deficiency line)53, UAS-mini-βH-spec54, UAS-Myc-β-spec23, UAS-DufΔintra-Flag33, dpak3zyg(del) (ref. 19), sltrS1946 (ref. 43), sns-GAL4 (ref. 55) and rP298-GAL4 (ref. 35). Transgenic flies carrying UAS-V5-βH-spec, UAS-mCherry-βH-spec, UAS-Duf-GFP and UAS-Duf-mCherry were generated by P-element-mediated germline transformation. To express genes in fly embryos, females carrying the transgene under the control of an UAS promoter were crossed with twi-GAL4 (all muscle cells), mef2-GAL4 (all muscle cells), rP298-GAL4 (founder cells), sns-GAL4 (FCMs) and 69B-GAL4 (epithelial cells) males, respectively. The expression of β H-spectrin in FCMs was performed in a fusion-defective sltr mutant43 to prevent the diffusion of ectopically expressed β H-spectrin from FCMs to founder cells following myoblast fusion events, such as in wild-type embryos. The α/βH-spectrin double mutant α-specrg41 kst14.1/TM6 (labelled as α-spec−/− βH-spec−/− in the figures) was generated using standard genetic methods.
Molecular biology. Full-length βH-spec was amplified by PCR (with or without a tag) from cDNAs generated from the mRNA of stage 11–15 w1118 flies. Owing to the large size of the βH-spec gene, three fragments were individually amplified using the primers as follows:(1) β H-spec-5′ : GACCGGTCAACATGACCCAGCGGGACGGCATC(2) β H-spec-3721-3′ : CTCCACGAATTCGGTGTCATG(3) β H-spec-3721-5′ : CATGACACCGAATTCGTGGAG(4) β H-spec-8214-3′ : CTCACCCTCTAGAATGCTATTG(5) β H-spec-8214-5′ : CAATAGCATTCTAGAGGGTGAG(6) β H-spec-3′ : CCAAGCGGCCGCTCACTGTGGCGGGACTTGACTC
The three PCR fragments were then subcloned into the Drosophila transformation vector pUAST. To generate the UAS-β H-specΔ N and UAS-β H-specΔ C constructs, the following primers were used:(1) β H-spec-3865-5′ : GGAATTCCAACATGGTGTGTCGATCTGCAAATGTTC(2) β H-spec-8028-3′ : GGTCTAGATCACAGCTGATGGGCCTCAGTTAG
To generate the pDEST-β H-spec constructs for glutathione S-transferase (GST) fusion proteins for the F-actin co-sedimentation assays, the Gateway cloning system (Invitrogen) was used with the following primers:(1) β H-spec-1-C:GGGGACAAGTTTGTACAAAAAAGC AGGCTTCATGACCCAGCGGGACGGCATC(2) β H-spec-1-K:GGGGACCACTTTGTACAAGAAAG CTGGGTTTTACTTCTTGCGATCTGCGTCCAT(3) β H-spec-29-C:GGGGACAAGTTTGTACAAAAAAG CAGGCTTCGGAGCCAAACAAGTCCACGTC(4) β H-spec-31-K:GGGGACCACTTTGTACAAGAAAG CTGGGTTTTATTGGGACGCCGCATTCTGGCG(5) β H-spec-34-C:GGGGACAAGTTTGTACAAAAAAG CAGGCTTCCCGAACATGCAACTGCTTAGC(6) β H-spec-34-K:GGGGACCAC TTTGTACAAGAAAGCTGGGTTT TATCACTGTGGCGGGACTTGACT
Full-length β-spec was amplified by PCR from the UAST-Myc-β -spec plasmid23. The original construct lacks nine residues at the N terminus, which was restored in this subcloning. Owing to the large size of the β-spec transgene, two fragments were individually amplified using the primers as follows:(1) β -spec-5′ : TCGAACGCTGCTATACGATCGG GCGGCCGCATGACGACGGACATTTCGATTGTTCGCTGGGATC CCAGCCAGGGTCCTGGCA(2) β -spec-int-3′ : GTTGTCGATCTCCTCGCGGATCG(3) β -spec-int-5′ : CGATCCGCGAGGAGATCGACAAC(4) β -spec-3′ : accttcgaaccgcgggcccTCTAGATTACTTTTTCTT TAAAGTAAAAAACGATCTGCGCT
The two PCR fragments were then subcloned into a Drosophila vector pAc-mCherry (N) by Gibson assembly. pAc-mCherry (N) was modified from the pAc5.1/V5-His vector (Invitrogen), into which mCherry was PCR cloned between the KpnI and NotI sites, using the primers as follows:(1) mCherry-5′ : CGTGGTACCATGGTGAGCAAGGGCGAGG-3′ (forward)(2) mCherry-linker-GCAGCGGCCGCCCGATCGTATA GCAGCGTTCGACTTGTACAGCTCGTCCATGC. The resulting linker residues between the N-terminal mCherry and β -spectrin are SNAAIRSGGR.
N-terminally mCherry-tagged full-length α -spectrin was generated by inserting mCherry into the pBSK-α -spectrin construct (from C.T.) by Gibson
assembly. This created a de novo AgeI site upstream of the Kozak sequence (GCC ACC) followed by the mCherry sequence, the flexible linker sequence and the full-length α -spectrin. The AgeI–NotI piece containing mCherry and the full-length α -spectrin was subsequently subcloned into the fly expression vector pAc-V5-His (Invitrogen). The primer pair used to create the mCherry-linker tag for Gibson assembly is as follows:(1) mCh-α -spec-For: GAG CTC CAC CGC GGT GGC GGC CGC ACC GGT GCC AAC ATG GTG AGC AAG GGC GAG GAG(2) mCh-α -spec-Rev: CAC CTC TTT GGG TGT AAA GTT CTC CAT CGA TCG TAT AGC AGC ATT CGA CTT GTA CAG CTC GTC CAT GCC
dsRNAs were synthesized by in vitro transcription with gene-specific primers containing the T7 promoter sequence (TTAATACGACTCACTATAGGGAGA) at the 5′ end (MEGAscript; Ambion). Synthesized dsRNAs were purified using NucAway Spin Columns (Ambion).
Immunofluorescent staining and imaging. Fly embryos were fixed and stained as described previously4,43. The following primary antibodies were used: rabbit anti-muscle MHC (1:1,000)56, rabbit anti-β H-spectrin (1:100)21, rabbit anti-β -spectrin (1:400)57, mouse anti-α -spectrin (1:1; 3A9, Developmental Studies Hybridoma Bank (DSHB)), guinea pig anti-Duf (1:500)4, guinea pig anti-Ants (1:1,000)34, rat anti-Sltr (1:30)43, rat anti-Sns (1:500)30, mouse anti-Eve (1:30; 3C10, DSHB), mouse anti-adducin (1:400; 1B1, DSHB), mouse anti-protein 4.1 (1:400; C566.9, DSHB), rabbit anti-GFP (1:500; A-11122, Invitrogen), mouse anti-Flag (1:200; F3165, Sigma), mouse anti-Myc (1;100; MA1-980, Thermo Fisher Scientific) and mouse anti-V5 (1:200; R960-25, Invitrogen). The following secondary antibodies were used at 1:200: Alexa 488-, Alexa 568- and Alexa 647-conjugated (Invitrogen) and -biotinylated (Vector Laboratories) antibodies made in goats. For phalloidin staining, FITC- or Alexa 568-conjugated phalloidin (Invitrogen) were used at 1:200. Fluorescent images were obtained on a LSM 700 Meta confocal microscope (Zeiss), acquired with LSM Image Browser software (Zeiss) and Zen software (Zeiss), and processed using Adobe Photoshop CS. For quantification of fluorescent signals, the signal intensities of the cellular area of interest and the control area were measured and processed for presentation by the ImageJ program (http://imagej.nih.gov/ij/).
Drosophila cell culture. S2 and S2R+ cells were cultured in Schneider’s medium (Gibco) supplemented with 10% FBS (Gibco) and penicillin/streptomycin (Sigma). Cells were transfected using Effectene (Qiagen) per the manufacturer’s instructions. For immunofluorescent staining, cells were fixed with 4% formaldehyde in PBS, washed in PBST (PBS with 0.1% Triton X-100) and PBSBT (PBST with 0.2% BSA) consecutively and stained with the following antibodies in PBSBT: mouse α -V5 (1:2,000; R960-25, Invitrogen) and rabbit α -GFP (1:1,000; A-11122, Invitrogen). Secondary Alexa 488-, Alexa 568- or Alexa 647-conjugated antibodies were used at 1:400 (Invitrogen). To visualize F-actin, FITC- or Alexa 568-conjugated phalloidin (Invitrogen) was used at 1:500 in PBST.
Mouse C2C12 myoblast culture. A pair of predesigned siRNAs against the mouse β V-spectrin gene (siRNA1, β V-spectrin-1: CAGGATGGGCTTCGAACCCTA; siRNA2, β V-spectrin-2: AAAGACGATTTCAAGCCCTAA) were obtained from Qiagen. RNA interference was performed per the manufacturer’s instructions. Briefly, approximately 3 × 10⁵ cells were seeded on each well of a 6-well tissue culture dish and transfected with the individual siRNAs against β V-spectrin (10 µ M final concentration) using HiPerFect transfection reagent (Qiagen). On day 2, the cells were transfected again and differentiated, and cells that were treated in parallel were subjected to qRT–PCR to access the knockdown level. Five days post-differentiation, cells were fixed and stained with anti-skeletal muscle myosin antibody (1:100; F59, sc-32732, Santa Cruz Biotechnology) to identify differentiated cells. Cells were mounted using Prolong Gold antifade reagent with 4,6-diamidino-2-phenylindole (DAPI; Molecular Probes, Invitrogen) to visualize the nuclei. The fusion index was calculated as the percentage of nuclei in multinucleated syncytia versus the total number of nuclei per × 20 microscopic fields under LSM 810 (Zeiss). Cells in at least 10 random fields were counted in each experiment and three independent experiments were performed.
For western blot analyses and quantifications, transfected control and siRNA-treated C2C12 cells were collected at different time points and washed and lysed in cell lysis buffer (0.5% SDS, 1% NP-40, 1% sodium deoxycholate, 150 mM NaCl, 2 mM EDTA and 10 mM sodium phosphate, pH 7.2) containing protease inhibitors. The cell lysates were briefly sonicated, centrifuged and analysed by SDS–PAGE and western blotting with antibodies against MyoD (1:100; sc-377460), myogenin (1:100; sc-52903), skeletal muscle myosin (1:100; sc-32732) and α -tubulin (1:100; sc-58666) from Santa Cruz Biotechnology. Protein quantification was performed using Photoshop image software (Adobe). The chemiluminal emission from both the protein of interest and the loading control were manually tested to be within the linear range. For each experiment, three independent preparations were examined.
Time-lapse imaging and FRAP. Time-lapse imaging of embryos was performed as previously described4. Briefly, embryos expressing fluorescently tagged proteins in muscle or epithelial cells were collected and dechorionated in 50%
© 2018 Macmillan Publishers Limited, part of Springer Nature. All rights reserved.
NATuRE CELL BioLogy | www.nature.com/naturecellbiology
Articles NATUre Cell BiOlOgy
bleach. Subsequently, embryos were washed in water, placed onto a double-sided tape (3 m) and covered with a layer of Halocarbon oil 700/27 (2:1; Sigma). Time-lapse image acquisition was carried out on an LSM 700 Meta confocal microscope (Zeiss).
The FRAP experiments were performed using the same conditions described previously, which allowed full fluorescence recovery of GFP-actin, GFP-WASP and Sltr-mCherry18. Specifically, the solid 488-nm laser output was set to 2% to avoid general photobleaching and phototoxicity. A region of interest was manually selected and imaged in 3–5 frames every 30 s to record the original fluorescent intensity (pre-bleach). Then, the region of interest was quickly photobleached to a level of ~20% of its original fluorescence intensity by 5–10 times of consecutive 3-s laser scans with 2% laser output and subsequently imaged every 30 s to record fluorescence recovery (post-bleach). The fluorescence intensities of the pre-bleached and post-bleached region of interest were measured using the ImageJ program. The Prism software was used to determine the maximal recovery level (that is, the percentage recovery compared to the pre-bleach level) and the half-time of recovery using a kinetic curve fit with an exponential decay equation.
SIM. Stage 13–14 embryos were fixed and stained as described above. The samples were then mounted in Prolong Gold (Molecular Probes) and imaged with an inverted microscope (Ti-E; Nikon) equipped with a × 100 oil NA 1.49 CFI SR Apochromat TIRF objective lens and an ORCA-Flash 4.0 sCMOS camera (Hamamatsu Photonics K.K.). The images were processed using Adobe Photoshop CS6.
Electron microscopy. Embryos were fixed by the high-pressure freezing and freeze substitution method, as previously described4,58. Briefly, a Bal-Tec device was used to freeze stage 12–14 embryos. Freeze substitution was performed with 1% osmium tetroxide, 0.1% uranyl acetate in 98% acetone and 2% methanol on dry ice. Fixed embryos were embedded in Epon (Sigma-Aldrich) and cut into thin sections with an ultramicrotome (Ultracut R; Leica). The sections were mounted on copper grids and post-stained with 2% uranyl acetate for 10 min and Sato’s lead solution59 for 1 min to improve image contrast. Images were acquired on a transmission electron microscope (CM120; Philips).
Recombinant protein purification and F-actin co-sedimentation assay. To purify GST-fused β H-spectrin fragments from BL21-DE3 cells (NEB), protein expression was induced with 0.2 mM isopropyl-β -d-thiogalactoside (IPTG) at room temperature for 12–15 h. Cells were harvested and lysed by sonication in the lysis buffer: PBS (pH 7.4), 1% Triton X-100, 5 mM dithiothreitol, 1 mM phenylmethyl sulfonyl fluoride and cOmplete Mini Protease Inhibitor Cocktail (Roche). After centrifugation, the supernatant was collected and incubated with pre-equilibrated glutathione agarose resin at 4 °C for 2–3 h. After washing in the lysis buffer, β H-spectrin protein was eluted with the elution buffer: 50 mM Tris (pH 7.5), 150 mM NaCl, 5 mM dithiothreitol and 10 mM glutathione (Sigma).
The F-actin co-sedimentation assay was performed following the manufacturer’s protocol (Cytoskeleton). Briefly, 0.5–1 μ M purified protein was incubated with 4 μ M F-actin assembled from monomeric actin for 1 h in F buffer: 5 mM Tris-HCl (pH 8.0), 0.2 mM CaCl2, 50 mM KCl, 2 mM MgCl2 and 1 mM ATP. The F-actin–protein mixtures were centrifuged at 140,000g for 30 min, and supernatants and pellets were separated and analysed by SDS–PAGE and Coomassie Blue staining.
Co-immunoprecipitation. Embryos expressing GFP-tagged Duf and Flag-tagged β H-spectrin (kstMI03134/twi-GAL4; UAS-Duf-GFP/+) were collected and dechorionated in 50% bleach. Embryos were frozen in liquid nitrogen and then dissociated in cold extraction buffer (50 mM Tris-HCl (pH 8.5), 150 mM NaCl and 0.5% sodium deoxycholate) with 20 strokes in a Dounce homogenizer. After centrifugation at 16,000g for 20 min, supernatants were removed and incubated with either anti-V5 (control) or anti-Flag (β H-spectrin) antibodies at 4 °C for 2–3 h. Protein G Sepharose beads (Roche) were used to pull down proteins. Precipitated proteins were analysed by SDS–PAGE and western blotting analysis.
MPA. MPA was performed as previously described60. Briefly, a pressure difference was generated by adjusting the height of a motor-driven water manometer. A fixed pressure of 0.4 nN per μ m2 was applied instantly to the cell cortex of S2 cells with a polished glass pipette ~2–2.5 μ m in radius. Images were collected in Schneider’s medium supplemented with 10% FBS on an Olympus IX81 microscope with a × 40 (1.3 NA) objective and a × 1.6 optovar, utilizing MetaMorph software and analysed using ImageJ. After background correction, the fluorescence intensity at the sites of protein accumulation was normalized against the opposite cortex of the cell (Ib/Io or It/Io, where Ib, It and Io is the intensity in the cortex at the base, tip or opposite side of the cell being aspirated). An analysis of variance (ANOVA) with Fisher’s least significant difference was applied to determine significance.
AFM. S2R+ cells were plated on glass coverslips coated with concanavalin A (Sigma) and transfected to express fluorescently tagged MyoII and β H-spectrin using Effectene (Qiagen), per the manufacturer’s instructions. Lateral indentation experiments were conducted 2 days after transfection with a modified Catalyst
AFM integrated with an Axio Observer fluorescence microscope (Zeiss). To determine the effect of a localized mechanical force on MyoII and β H-spectrin localization, the cantilever (MLCT with a pyramidal tip; Bruker) was first brought into full contact, at ~50 nN setpoint force, with the glass surface on a cell-free area within 10 μ m from a target cell. Next, the cell was laterally translated into the stationary cantilever using the piezoelectric XY stage and the NanoScope software (Bruker). The cantilever tip indented the edge of the cell by 2–5 µ m. Cells were simultaneously imaged with a plan-apochromat × 63/1.4 NA oil immersion objective (Zeiss). Time-lapse images were taken at 5-s intervals using the Micro-Manager software (http://micro-manager.org/wiki/Micro-Manager).
Coarse-grained molecular mechanics modelling. In the coarse-grained model, the membrane–cortex composite is represented by a triangulated network where the nodes denote the crosslinking positions and the triangles resemble the meshes in the actin network, which is a network structure composed of proteins, such as actin, actin crosslinkers and MyoII. The system energy of the composite at the coarse-grained molecular level is calculated by:
= + + +−E E E E E , (1)ystem ending n plane urface olumes b i s v
where Ebending is the bending energy from the plasma membrane, Ein-plane is the in-plane elastic energy associated with the deformation of actin crosslinkers and the dilation of each mesh, Esurface is the surface energy of the whole cell and Evolume is the energy associated with the volume conservation of the cell42,61,62. Specifically, the bending energy mainly contributed by the plasma membrane is written as:
∑ θ θ= − −E k12
(1 cos( )) , (2)endingi j
end i ib,
b0
where k endb is the bending modulus, θi j, is the angle between the surface normal to the elements i and j, and θi
0 is the reference value of θi at equilibrium. The in-plane free energy has the form of:
∑ ∑= + − .−E V l k A A( ) 12
( ) (3)n planei
LC ii
ilation i ii W d0 2
The first term V l( )LC iW is the worm-like-chain energy due to the intermolecular and intramolecular deformations of actin cytoskeletal proteins associated with the edge, li. The force in the worm-like-chain (fWLC) model is:
= −∂
∂= −
−− + = ∈
f lV l
xnk T
p xx x l
l( )
( ) 14(1 )
14
, (0, 1) , (4)LCLC B
WW
2max
where kB is the Boltzmann constant, T is the temperature, n is the number of functional actin crosslinkers between two connected nodes, lmax is the maximum length of the edge l and p is the average persistence length of the actin crosslinkers. The second term in equation (3) is the energy due to the dilation/shrinking of the individual mesh of area Ai with the initial value Ai
0 and a dilation modulus, k ilationd . E urfaces is the energy associated with the conservation of the global surface area and is written as:
= −E k A A12
( ) , (5)urface urface otal otals s t t0 2
where k urfaces is the global area modulus, A otalt is the total area of the membrane–cortex composite and A otalt
0 is the initial total area. Similarly, E olumev is the energy associated with the conservation of the global volume and has the form of:
= − .E k V V12
( ) (6)olume olume otal otalv v t t0 2
k olumev is the global volume modulus. Votalt and V otalt0 are the total volume of the
cell and its corresponding equilibrium value, respectively. A surface mesh with 10,000 nodes and 19,996 triangles was created for a spherical cell with a radius of 5 μ m. As a result, the average length of the edges is 70-nm long. For equation (4), the average persistence length of actin crosslinkers is on the order of 40 nm and the average number of actin crosslinkers, n, is 1. The values of the remaining parameters are: k endb = 100 kBT, θi
0 = 0, k ilationd = 100 kBT, k urfaces = 1,000 kBT and k olumev = 1,000 kBT. The motion of the nodes is calculated by Brownian dynamics equation, in which the driving force is the derivative of the system energy with respect to the local position.
The initial configuration of the system was thermally annealed at room temperature until the fluctuation of the system energy was negligible. This configuration was then mapped to the shape of a receiving cell. For simplicity, the protrusion has a cylindrical shape with the radius r0 and length l on the surface of a cell with a diameter of 10 μ m. The tip of the protrusion was a spherical cap of a radius r0. The final state of the system was achieved after 20 s of Brownian dynamics simulation with a time-step of 10−5 s. The area dilation of each node was determined by averaging of the dilation of the triangles with which the node
© 2018 Macmillan Publishers Limited, part of Springer Nature. All rights reserved.
NATuRE CELL BioLogy | www.nature.com/naturecellbiology

ArticlesNATUre Cell BiOlOgy
of interest was associated. The shear deformation of each node was calculated in a similar way. The contour of the deformation on the protrusion was plotted by the software Tecplot (Supplementary Fig. 7). The deformations along the length direction of the protrusion were obtained by the extraction tool of the software.
Statistics and reproducibility. Statistical significance was assessed using two-tailed Student’s t-test and ANOVA with Fisher’s least significant difference. P values were obtained using the Microsoft Excel 2010, GraphPad Prism 5 and Kaleidagraph 4.1 softwares. The number of biological replicates for each experiment is indicated in the figure legends. Immunofluorescence images were representative of at least ten independent samples, MPA images of at least eight independent cells and western blots of three independent experiments.
Reporting Summary. Further information on experimental design is available in the Nature Research Reporting Summary linked to this article.
Code availability. The C programs for the computation of the energy of the cells with protrusions are available from: https://pan.baidu.com/s/1wjroHIyh7eXZQ3IjHGfRUA.
Data availability. The main data supporting the findings of this study are available within the article and its Supplementary Information files. All other data supporting the findings of this study are available from the corresponding author upon reasonable request.
References 53. Thomas, G. H. et al. Drosophila β Heavy-spectrin is essential for development and
contributes to specific cell fates in the eye. Development 125, 2125–2134 (1998).
54. Lee, S. K. & Thomas, G. H. Rac1 modulation of the apical domain is negatively regulated by β Heavy-spectrin. Mech. Dev. 128, 116–128 (2011).
55. Kocherlakota, K. S., Wu, J. M., McDermott, J. & Abmayr, S. M. Analysis of the cell adhesion molecule sticks-and-stones reveals multiple redundant functional domains, protein-interaction motifs and phosphorylated tyrosines that direct myoblast fusion in Drosophila melanogaster. Genetics 178, 1371–1383 (2008).
56. Wei, Q., Rong, Y. & Paterson, B. M. Stereotypic founder cell patterning and embryonic muscle formation in Drosophila require nautilus (MyoD) gene function. Proc. Natl Acad. Sci. USA 104, 5461–5466 (2007).
57. Byers, T. J., Brandin, E., Lue, R. A., Winograd, E. & Branton, D. The complete sequence of Drosophila β -spectrin reveals supra-motifs comprising eight 106-residue segments. Proc. Natl Acad. Sci. USA 89, 6187–6191 (1992).
58. Zhang, S. & Chen, E. H. in Cell Fusion: Overviews and Methods (ed. Chen, E. H.) 275–297 (Humana Press, Totowa, NJ, 2008).
59. Sato, T. A modified method for lead staining of thin sections. J. Electron Microsc. (Tokyo) 17, 158–159 (1968).
60. Kee, Y. S. & Robinson, D. N. Micropipette aspiration for studying cellular mechanosensory responses and mechanics. Methods Mol. Biol. 983, 367–382 (2013).
61. Discher, D. E., Boal, D. H. & Boey, S. K. Simulations of the erythrocyte cytoskeleton at large deformation. II. Micropipette aspiration. Biophys. J. 75, 1584–1597 (1998).
62. Li, J., Dao, M., Lim, C. T. & Suresh, S. Spectrin-level modeling of the cytoskeleton and optical tweezers stretching of the erythrocyte. Biophys. J. 88, 3707–3719 (2005).
© 2018 Macmillan Publishers Limited, part of Springer Nature. All rights reserved.
NATuRE CELL BioLogy | www.nature.com/naturecellbiology

1
nature research | reporting summ
aryApril 2018
Corresponding author(s): Elizabeth Chen
Reporting SummaryNature Research wishes to improve the reproducibility of the work that we publish. This form provides structure for consistency and transparency in reporting. For further information on Nature Research policies, see Authors & Referees and the Editorial Policy Checklist.
Statistical parametersWhen statistical analyses are reported, confirm that the following items are present in the relevant location (e.g. figure legend, table legend, main text, or Methods section).
n/a Confirmed
The exact sample size (n) for each experimental group/condition, given as a discrete number and unit of measurement
An indication of whether measurements were taken from distinct samples or whether the same sample was measured repeatedly
The statistical test(s) used AND whether they are one- or two-sided Only common tests should be described solely by name; describe more complex techniques in the Methods section.
A description of all covariates tested
A description of any assumptions or corrections, such as tests of normality and adjustment for multiple comparisons
A full description of the statistics including central tendency (e.g. means) or other basic estimates (e.g. regression coefficient) AND variation (e.g. standard deviation) or associated estimates of uncertainty (e.g. confidence intervals)
For null hypothesis testing, the test statistic (e.g. F, t, r) with confidence intervals, effect sizes, degrees of freedom and P value noted Give P values as exact values whenever suitable.
For Bayesian analysis, information on the choice of priors and Markov chain Monte Carlo settings
For hierarchical and complex designs, identification of the appropriate level for tests and full reporting of outcomes
Estimates of effect sizes (e.g. Cohen's d, Pearson's r), indicating how they were calculated
Clearly defined error bars State explicitly what error bars represent (e.g. SD, SE, CI)
Our web collection on statistics for biologists may be useful.
Software and codePolicy information about availability of computer code
Data collection Fluorescent images were acquired with LSM Image Browser software (Zeiss) and Zen software (Zeiss).
Data analysis For imaging analyses, Image J software from NIH and Adobe photoshop CS5 were used. For statistical analyses, Microsoft Excel 2010, GraphPad Prism 5 and KaleidaGraph 4.1 softwares were used.
For manuscripts utilizing custom algorithms or software that are central to the research but not yet described in published literature, software must be made available to editors/reviewers upon request. We strongly encourage code deposition in a community repository (e.g. GitHub). See the Nature Research guidelines for submitting code & software for further information.
DataPolicy information about availability of data
All manuscripts must include a data availability statement. This statement should provide the following information, where applicable: - Accession codes, unique identifiers, or web links for publicly available datasets - A list of figures that have associated raw data - A description of any restrictions on data availability
The main data supporting the findings of this study are available within the article and its Supplementary Information files. All other data supporting the findings of this study are available from the corresponding author upon reasonable request.

2
nature research | reporting summ
aryApril 2018
Field-specific reportingPlease select the best fit for your research. If you are not sure, read the appropriate sections before making your selection.
Life sciences Behavioural & social sciences Ecological, evolutionary & environmental sciences
For a reference copy of the document with all sections, see nature.com/authors/policies/ReportingSummary-flat.pdf
Life sciences study designAll studies must disclose on these points even when the disclosure is negative.
Sample size No statistical method was used to predetermine sample size. Sample sizes were determined based on previous studies in the field to enable statistical analyses and ensure reproducibility.
Data exclusions No data were excluded from this study.
Replication Sample sizes have been increased wherever possible. Immunofluorescence images were representative of at least ten independent samples, MPA images of at least eight independent cells, and western blots of three independent experiments. All attempts for replication were successful.
Randomization Experiments described here were not randomized.
Blinding The investigators were not blinded to group allocation during experiments and outcome assessment, because all data were acquired from cell or tissue samples of specific genotypes or with designated genetic or chemical manipulations.
Reporting for specific materials, systems and methods
Materials & experimental systemsn/a Involved in the study
Unique biological materials
Antibodies
Eukaryotic cell lines
Palaeontology
Animals and other organisms
Human research participants
Methodsn/a Involved in the study
ChIP-seq
Flow cytometry
MRI-based neuroimaging
Unique biological materialsPolicy information about availability of materials
Obtaining unique materials There is no restriction on availability of materials used in this study.
AntibodiesAntibodies used All antibodies are listed in Methods under "Immunofluorescent staining and imaging" with species, company/catalog#, clone,
dilution used per application, and published references if applicable. The following primary antibodies were used: rabbit alpha-muscle myosin heavy chain (1:1000) rabbit anti-betaH-spectrin (1:100) rabbit anti-bata-spectrin (1:400) mouse anti-alpha-spectrin (1:1; DSHB; 3A9) guinea pig anti-Duf (1:500) guinea pig anti-Ants (1:1000), rat anti-Sltr (1:30) rat anti-Sns (1:500) mouse anti-Eve (1:30; DSHB; 3C10) mouse anti-adducin (1:400; DSHB; 1B1) mouse anti-protein 4.1 (1:400; DSHB; C566.9)

3
nature research | reporting summ
aryApril 2018
rabbit anti-GFP (1:500; Invitrogen; A-11122) mouse anti-V5 (1:200; Invitrogen; R960-25) mouse anti-Flag (1:200; Sigma; F3165) mouse anti-Myc (1;100; Thermo Fisher Scientific; MA1-980) mouse anti-skeletal muscle myosin (1:100; Santa Cruz Biotechnology; sc-32732) mouse anti-MyoD (1:100; Santa Cruz Biotechnology; sc-377460), mouse anti-Myogenin (1:100; Santa Cruz Biotechnology; sc-52903), mouse anti-skeletal muscle myosin (1:100; Santa Cruz Biotechnology; sc-32732) mouse anti-alpha-tubulin (1:100; Santa Cruz Biotechnology; sc-58666) f The following secondary antibodies were used at 1:200: Alexa488-, Alexa568-, and Alexa647-conjugated (Invitrogen) and biotinylated (Vector Laboratories) antibodies made in goats.
Validation These antibodies have either been validated in published literatures, which are cited in the Methods, or are widely used for similar experiments by other researchers worldwide.
Eukaryotic cell linesPolicy information about cell lines
Cell line source(s) Drosophila S2R+ cell line from Dr. P. Beachy; Drosophila S2 cell line from Drosophila Genomics Resource Center; Mouse C2C12 cell line from ATCC.
Authentication The Drosophila cells lines were authenticated based on their morphology, growth condition, and specific gene expression. The C2C12 cells were authenticated by their morphology and their ability to differentiate into multinucleated myotubes.
Mycoplasma contamination All three cell lines were tested with a PCR based kit from Sigma #MP0035, and no mycoplasma contamination was found.
Commonly misidentified lines(See ICLAC register)
No commonly misidentified cell lines were used.
PalaeontologySpecimen provenance No animal-derived materials were used.
Specimen deposition N/A
Dating methods N/A
Tick this box to confirm that the raw and calibrated dates are available in the paper or in Supplementary Information.
Animals and other organismsPolicy information about studies involving animals; ARRIVE guidelines recommended for reporting animal research
Laboratory animals No laboratory animals were used.
Wild animals N/A
Field-collected samples N/A
Human research participantsPolicy information about studies involving human research participants
Population characteristics The study did not involve human research participants.
Recruitment N/A
ChIP-seqData deposition
Confirm that both raw and final processed data have been deposited in a public database such as GEO.
Confirm that you have deposited or provided access to graph files (e.g. BED files) for the called peaks.
Data access links May remain private before publication.
For "Initial submission" or "Revised version" documents, provide reviewer access links. For your "Final submission" document, provide a link to the deposited data.

4
nature research | reporting summ
aryApril 2018
Files in database submission Provide a list of all files available in the database submission.
Genome browser session (e.g. UCSC)
Provide a link to an anonymized genome browser session for "Initial submission" and "Revised version" documents only, to enable peer review. Write "no longer applicable" for "Final submission" documents.
Methodology
Replicates Describe the experimental replicates, specifying number, type and replicate agreement.
Sequencing depth Describe the sequencing depth for each experiment, providing the total number of reads, uniquely mapped reads, length of reads and whether they were paired- or single-end.
Antibodies Describe the antibodies used for the ChIP-seq experiments; as applicable, provide supplier name, catalog number, clone name, and lot number.
Peak calling parameters Specify the command line program and parameters used for read mapping and peak calling, including the ChIP, control and index files used.
Data quality Describe the methods used to ensure data quality in full detail, including how many peaks are at FDR 5% and above 5-fold enrichment.
Software Describe the software used to collect and analyze the ChIP-seq data. For custom code that has been deposited into a community repository, provide accession details.
Flow CytometryPlots
Confirm that:
The axis labels state the marker and fluorochrome used (e.g. CD4-FITC).
The axis scales are clearly visible. Include numbers along axes only for bottom left plot of group (a 'group' is an analysis of identical markers).
All plots are contour plots with outliers or pseudocolor plots.
A numerical value for number of cells or percentage (with statistics) is provided.
Methodology
Sample preparation Describe the sample preparation, detailing the biological source of the cells and any tissue processing steps used.
Instrument Identify the instrument used for data collection, specifying make and model number.
Software Describe the software used to collect and analyze the flow cytometry data. For custom code that has been deposited into a community repository, provide accession details.
Cell population abundance Describe the abundance of the relevant cell populations within post-sort fractions, providing details on the purity of the samples and how it was determined.
Gating strategy Describe the gating strategy used for all relevant experiments, specifying the preliminary FSC/SSC gates of the starting cell population, indicating where boundaries between "positive" and "negative" staining cell populations are defined.
Tick this box to confirm that a figure exemplifying the gating strategy is provided in the Supplementary Information.
Magnetic resonance imagingExperimental design
Design type Indicate task or resting state; event-related or block design.
Design specifications Specify the number of blocks, trials or experimental units per session and/or subject, and specify the length of each trial or block (if trials are blocked) and interval between trials.
Behavioral performance measures State number and/or type of variables recorded (e.g. correct button press, response time) and what statistics were used to establish that the subjects were performing the task as expected (e.g. mean, range, and/or standard deviation across subjects).

5
nature research | reporting summ
aryApril 2018
Acquisition
Imaging type(s) Specify: functional, structural, diffusion, perfusion.
Field strength Specify in Tesla
Sequence & imaging parameters Specify the pulse sequence type (gradient echo, spin echo, etc.), imaging type (EPI, spiral, etc.), field of view, matrix size, slice thickness, orientation and TE/TR/flip angle.
Area of acquisition State whether a whole brain scan was used OR define the area of acquisition, describing how the region was determined.
Diffusion MRI Used Not used
Preprocessing
Preprocessing software Provide detail on software version and revision number and on specific parameters (model/functions, brain extraction, segmentation, smoothing kernel size, etc.).
Normalization If data were normalized/standardized, describe the approach(es): specify linear or non-linear and define image types used for transformation OR indicate that data were not normalized and explain rationale for lack of normalization.
Normalization template Describe the template used for normalization/transformation, specifying subject space or group standardized space (e.g. original Talairach, MNI305, ICBM152) OR indicate that the data were not normalized.
Noise and artifact removal Describe your procedure(s) for artifact and structured noise removal, specifying motion parameters, tissue signals and physiological signals (heart rate, respiration).
Volume censoring Define your software and/or method and criteria for volume censoring, and state the extent of such censoring.
Statistical modeling & inference
Model type and settings Specify type (mass univariate, multivariate, RSA, predictive, etc.) and describe essential details of the model at the first and second levels (e.g. fixed, random or mixed effects; drift or auto-correlation).
Effect(s) tested Define precise effect in terms of the task or stimulus conditions instead of psychological concepts and indicate whether ANOVA or factorial designs were used.
Specify type of analysis: Whole brain ROI-based Both
Statistic type for inference(See Eklund et al. 2016)
Specify voxel-wise or cluster-wise and report all relevant parameters for cluster-wise methods.
Correction Describe the type of correction and how it is obtained for multiple comparisons (e.g. FWE, FDR, permutation or Monte Carlo).
Models & analysis
n/a Involved in the studyFunctional and/or effective connectivity
Graph analysis
Multivariate modeling or predictive analysis
Functional and/or effective connectivity Report the measures of dependence used and the model details (e.g. Pearson correlation, partial correlation, mutual information).
Graph analysis Report the dependent variable and connectivity measure, specifying weighted graph or binarized graph, subject- or group-level, and the global and/or node summaries used (e.g. clustering coefficient, efficiency, etc.).
Multivariate modeling and predictive analysis Specify independent variables, features extraction and dimension reduction, model, training and evaluation metrics.