s200 open - impex.no
TRANSCRIPT
1
User Manual S200 Open
Update September 2019
S200 Open
User Manual
2
User Manual S200 Open
Update September 2019
AQUALABO
Registered office:
AQUALABO - 90 rue du Professeur Paul MILLIEZ - 94500 CHAMPIGNY SUR MARNE – FRANCE
PLC with capital of 1,492,900 Euros – SIRET (Business registration number) 499 665 230 00011- RCS (Trade & Corporate Register) Créteil – NAF (Business subsector ID number) 2651B - Intra-Community VAT: FR 91 499665230
www.aqualabo.fr Hotline: +33 (0)5.62.75.95.70
E-mail: [email protected] Website: www.aqualabo.fr
Subject to technical amendments. Errors and omissions excepted.
3
User Manual S200 Open
Update September 2019
Contents
1 General information ................................................................................................................. 7
1.1 General overview .............................................................................................................. 7
1.2 Notes in bold print ............................................................................................................. 7
1.3 Warranty ........................................................................................................................... 7
1.4 Electrical connection ......................................................................................................... 8
1.5 Safety Instructions ............................................................................................................. 8
1.6 Damage due to transport ................................................................................................... 8
2 Technical data ......................................................................................................................... 9
2.1 General overview .............................................................................................................. 9
2.2 Variable measurements .................................................................................................. 10
3 Description ............................................................................................................................ 11
4 Operation .............................................................................................................................. 12
4.1 Controls .......................................................................................................................... 12
4.2 Display ............................................................................................................................ 13
4.2.1 Graphic symbol ......................................................................................................... 13
4.2.2 General menu: .......................................................................................................... 14
4.2.3 Example of access to a sub-menu, selection of "Temperature Compensation” menu15
5 Installation ............................................................................................................................. 17
5.1 Assignment of terminals .................................................................................................. 17
5.1.1 Assignment of pins .................................................................................................... 17
6 Access and display ................................................................................................................ 22
6.1 How to use menus .......................................................................................................... 22
6.1.1 Codes ....................................................................................................................... 22
6.2 LCD display adjustments ................................................................................................. 22
6.2.1 Contrast adjustment .................................................................................................. 22
6.2.2 Adjusting the backlight .............................................................................................. 23
6.3 Display - Loss of communication ..................................................................................... 23
7 Use of measurements provided by a Modbus RS485 sensor ................................................ 24
7.1 OPTOD digital optical sensor for measuring dissolved oxygen ........................................ 24
7.1.1 Reminder of connection to the terminal: .................................................................... 24
7.1.2 Setting / configuring of displayed measurements ...................................................... 24
7.1.3 Sensor information .................................................................................................... 26
4
User Manual S200 Open
Update September 2019
7.1.4 Oxygen measurement configuration .......................................................................... 27
7.1.5 Calibration methods .................................................................................................. 28
7.1.6 One-point calibration sequence ................................................................................. 29
7.1.7 Two-point calibration ................................................................................................. 29
7.1.8 Calibration of zero point – detailed procedure ........................................................... 30
7.1.9 Calibration of the final point - detailed procedure ...................................................... 31
7.1.10 Error calibration – message .................................................................................... 32
7.2 Digital sensor for measuring nephelometric turbidity ....................................................... 33
7.2.1 General information about the turbidity probe ........................................................... 33
7.2.2 Setting / configuring of displayed measurements ...................................................... 34
7.2.3 Sensor information .................................................................................................... 36
7.2.4 Configuration of the nephelometric turbidity measurement ........................................ 36
7.2.5 Method for calibrating nephelometric turbidity ........................................................... 37
7.3 Digital sensor for measuring pH and temperature ........................................................... 43
7.3.1 General information about the sensor ....................................................................... 43
7.3.2 Setting / configuring of displayed measurements ...................................................... 44
7.3.3 Sensor information .................................................................................................... 46
7.3.4 Method for calibrating the pH parameter ................................................................... 46
7.4 Digital 4-electrode sensor for measuring conductivity and temperature ........................... 49
7.4.1 General information about the turbidity probe ........................................................... 49
7.4.2 Setting / configuring of displayed measurements ...................................................... 50
7.4.3 Sensor information .................................................................................................... 51
7.4.4 Method for calibrating the conductivity parameter ..................................................... 52
7.5 Digital sensor for measuring ORP ................................................................................... 56
7.5.1 General information about the ................................................................................... 56
ORP sensor ....................................................................................................................... 56
7.5.2 Setting / configuring of displayed measurements ...................................................... 57
7.5.3 Sensor information .................................................................................................... 58
7.5.4 Method for calibrating the ORP parameter ................................................................ 59
7.6 Digital sensor for measuring suspended solids, turbidity and sludge blanket ................... 62
7.6.1 General information about the suspended ................................................................. 62
solids sensor ...................................................................................................................... 62
7.6.2 Setting / Configuring the measurements displayed ................................................... 63
5
User Manual S200 Open
Update September 2019
7.6.3 Sensor information .................................................................................................... 64
7.6.4 Detailed configuring of the display ............................................................................ 65
7.6.5 Method of calibrating the sludge blanket parameter .................................................. 65
7.6.6 Method to calibrate the turbidity parameter under attenuation ................................... 66
7.6.7 Method to calibrate the suspended solids parameter ................................................ 68
8 Controller adjustments .......................................................................................................... 71
8.1 Allocation of controller values .......................................................................................... 71
8.2 Controller action direction ................................................................................................ 71
8.3 Assignment of controller output ....................................................................................... 71
8.4 Pulse frequency .............................................................................................................. 72
8.5 Checking the pulse frequency ......................................................................................... 72
8.6 Minimum pulse ................................................................................................................ 73
8.7 Controller parameter settings .......................................................................................... 73
8.7.1 Standard point adjustment ........................................................................................ 74
8.7.2 Proportional band (P band) ....................................................................................... 74
8.7.3 Integral action time (integral gain) ............................................................................. 74
8.7.4 Hysteresis ................................................................................................................. 74
8.7.5 Max./min. limit value ................................................................................................. 75
8.7.6 Alarm period ............................................................................................................. 75
8.7.7 Dosage monitoring .................................................................................................... 75
8.8 Example of configuration for a single temperature control ............................................... 75
8.9 Example of configuration for control with hysteresis ........................................................ 77
8.9.1 Introduction ............................................................................................................... 77
8.9.2 Expected operation: .................................................................................................. 77
8.9.3 Detail of the display/transmitter setup steps: ............................................................. 77
8.10 Manual operating mode ................................................................................................. 85
8.10.1 Manual controller mode ........................................................................................... 85
8.10.2 Automatic controller mode....................................................................................... 85
8.11 Date and time ................................................................................................................ 86
8.12 Analog outputs .............................................................................................................. 86
8.12.1 Assignment of measured values ............................................................................. 86
8.12.2 Definition of current active range ............................................................................. 87
8.12.3 Setting the range ..................................................................................................... 87
6
User Manual S200 Open
Update September 2019
8.13 Power on delay ............................................................................................................. 87
8.14 Service menu ................................................................................................................ 87
8.14.1 Device data ............................................................................................................. 88
8.14.2 Analog inputs .......................................................................................................... 88
8.14.3 Measurement from a digital sensor ......................................................................... 88
8.14.4 Deleting data / return to factory settings .................................................................. 88
8.15 Languages .................................................................................................................... 88
9 Initial commissioning ............................................................................................................. 89
9.1 Checking the hardware installation .................................................................................. 89
9.2 Basic settings of the equipment ....................................................................................... 89
10 Maintenance and servicing .................................................................................................. 90
10.1 General overview .......................................................................................................... 90
10.2 Cleaning and calibration of probes ................................................................................ 90
11 Alarm messages.................................................................................................................. 91
11.1 List of error messages ................................................................................................... 91
12 MODBUS RTU .................................................................................................................... 92
12.1 Shielding ....................................................................................................................... 92
12.2 Communication parameters .......................................................................................... 92
12.3 MODBUS functions used .............................................................................................. 92
12.4 MODBUS S200 registry list ........................................................................................... 93
13 Sensor - Actuator bus (MODBUS RTU) ............................................................................... 97
13.1 Shielding ....................................................................................................................... 97
13.2 Communication parameters .......................................................................................... 97
14 Appendix ............................................................................................................................. 98
14.1 What to do in the event of a power failure ..................................................................... 98
14.2 Battery .......................................................................................................................... 98
15 Spare parts and wear parts ................................................................................................. 99
15.1 Wear parts .................................................................................................................... 99
16 Electrical connection ......................................................................................................... 100
16.1 Assignment of terminals .............................................................................................. 100
17 Hotline-Aftersales Service contact details .......................................................................... 102
7
User Manual S200 Open
Update September 2019
1 General information
1.1 General overview
This technical manual contains instructions for installing, commissioning, maintaining and repairing the S200 Open measurement and monitoring device.
Please follow the safety instructions and notes in bold print at all times!
1.2 Notes in bold print
Titles in bold print, alerts and warnings have the following meaning, in this technical manual:
Important:
This alert is used in the event of non-compliance with functional or operating instructions, or when the recommended procedures or misinterpretation of these instructions may cause an accident or injury.
Warning:
This entry is used in the event of non-compliance with functional or operating instructions, or when the recommended procedures or misinterpretation of these instructions may damage the equipment.
Note:
This section is used to highlight key points.
1.3 Warranty
The manufacturer shall ensure the operational safety and reliability of the system when, and only when, the following conditions have been met:
- Installation, connection, adjustment, maintenance and repairs are carried out exclusively by qualified and authorized expert staff.
- Only original spare parts are used for repairs.
- The measuring and monitoring device shall be used in accordance with the information and instructions set out in this manual.
Warning:
The warranty shall not apply if the device is not used as intended.
Note:
Wear parts are not under warranty (see table at end of manual).
8
User Manual S200 Open
Update September 2019
1.4 Electrical connection
Warning:
Only use the power supply specified on the nameplate to run the S200 measurement and monitoring device!
The device is delivered to run, by default, on a 230V/50Hz or 110V/50Hz power supply.
1.5 Safety Instructions
S200 Open measuring and monitoring devices are manufactured and tested according to standards DIN EN 61010-1 / VDE 0411-1. This device left the factory in good condition. In order to maintain this condition, and to ensure the safety during use, the user must comply with the information and warnings given in this manual. If it is suspected that operating in total safety is no longer possible, we recommend that you turn off the device and disable it to prevent any accidental operation.
Follow these instructions:
- if the system shows visible signs of deterioration - if the system is apparently no longer operational
- after an extended period of storage under poor conditions.
1.6 Damage due to transport
We carefully pack the S200 Open measuring and monitoring devices for transport. Please check that the content of the delivery is complete and in good condition. Any damage due to transport must be reported immediately (carrier).
The device must never be exposed to temperatures outside the range of -20 to +70°C (transport and intermediate storage).
Subject to technical amendments. Subject to changing the assembly of components.
9
User Manual S200 Open
Update September 2019
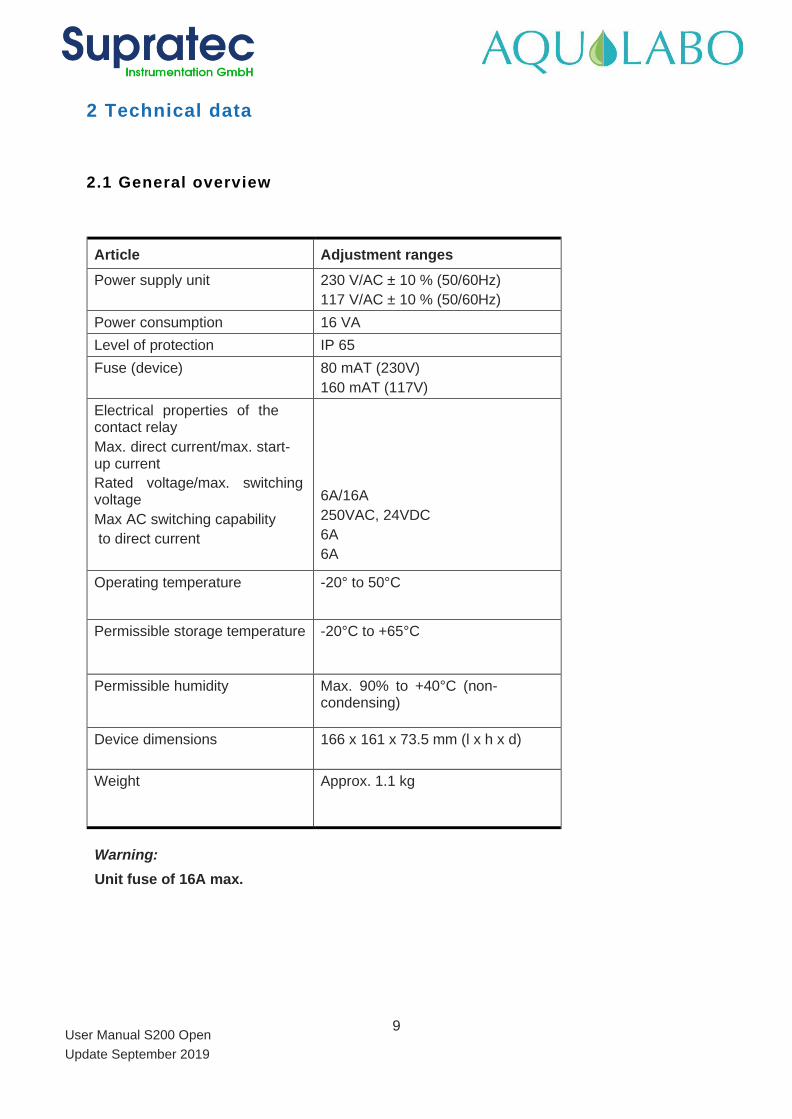
2 Technical data
2.1 General overview
Article Adjustment ranges
Power supply unit 230 V/AC ± 10 % (50/60Hz)
117 V/AC ± 10 % (50/60Hz)
Power consumption 16 VA
Level of protection IP 65
Fuse (device) 80 mAT (230V)
160 mAT (117V)
Electrical properties of the contact relay
Max. direct current/max. start-up current
Rated voltage/max. switching voltage
Max AC switching capability
to direct current
6A/16A
250VAC, 24VDC
6A
6A
Operating temperature -20° to 50°C
Permissible storage temperature -20°C to +65°C
Permissible humidity Max. 90% to +40°C (non-condensing)
Device dimensions 166 x 161 x 73.5 mm (l x h x d)
Weight Approx. 1.1 kg
Warning:
Unit fuse of 16A max.
10
User Manual S200 Open
Update September 2019
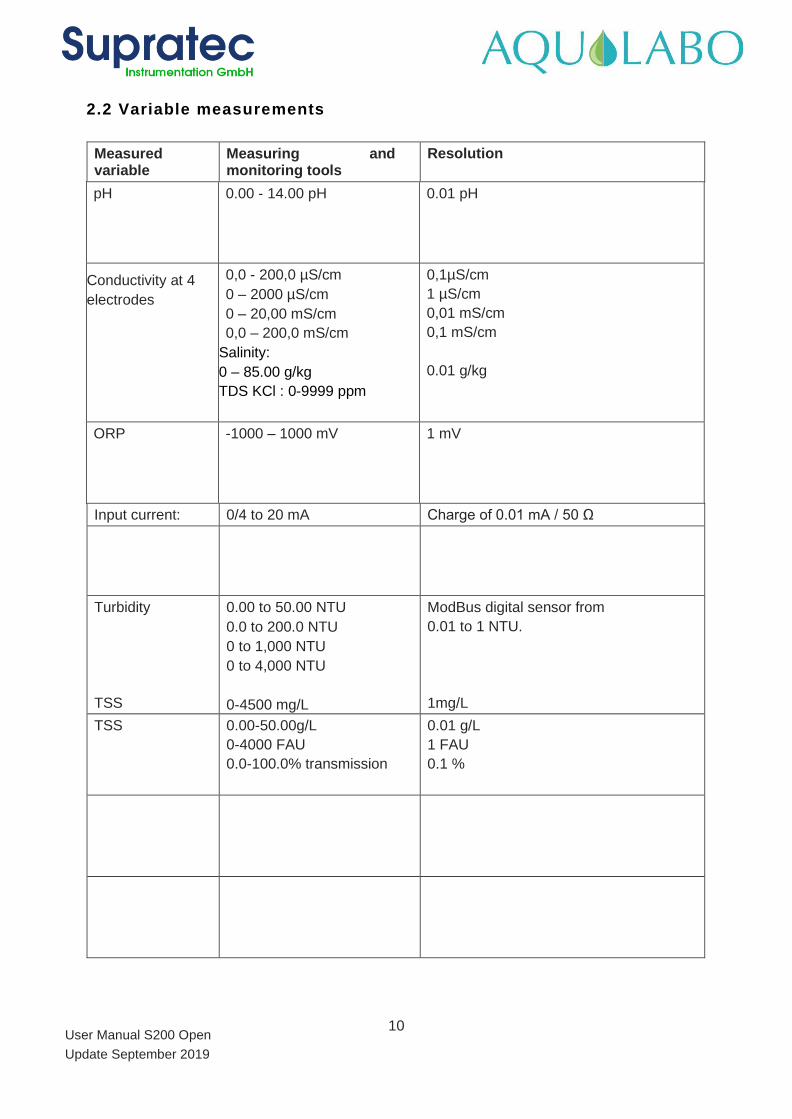
2.2 Variable measurements
Measured variable
Measuring and monitoring tools
Resolution
pH 0.00 - 14.00 pH 0.01 pH
Conductivity at 4
electrodes
0,0 - 200,0 µS/cm
0 – 2000 µS/cm
0 – 20,00 mS/cm
0,0 – 200,0 mS/cm
Salinity:
0 – 85.00 g/kg
TDS KCl : 0-9999 ppm
De 0 NTU à 4000 NTU
0,1µS/cm
1 µS/cm
0,01 mS/cm
0,1 mS/cm
0.01 g/kg
ORP -1000 – 1000 mV 1 mV
Input current: 0/4 to 20 mA Charge of 0.01 mA / 50 Ω
Turbidity
TSS
0.00 to 50.00 NTU
0.0 to 200.0 NTU
0 to 1,000 NTU
0 to 4,000 NTU
0-4500 mg/L
ModBus digital sensor from
0.01 to 1 NTU.
1mg/L
TSS 0.00-50.00g/L
0-4000 FAU
0.0-100.0% transmission
0.01 g/L
1 FAU
0.1 %
11
User Manual S200 Open
Update September 2019
3 Description
The S200 Open measuring and monitoring device is easy to use.
Equipment:
• Backlit display
• Cursor-controlled operation with only 5 keys
• Browser menu in plain text
• Up to 6 different settings simultaneously (depending on the type of code)
• Password protected access
• Ease of integration into process technology via the existing Modbus RTU
• Connection for digital probes, including power supply
• 2 digital outputs for controlling frequency metering pumps
• 3 relay outputs
• 2 digital inputs, switching input or frequency input
• 2 electrically insulated ModBus RTU interfaces
• 2 electrically insulated 0/4 - 20mA outputs
• Up to 4 adjustable individual PI controls (depending on the type of code)
• Retroactive control via an additional 0/4-20 mA analog input
• Real-time clock with backup battery
• Additional housing for sensors
12
User Manual S200 Open
Update September 2019
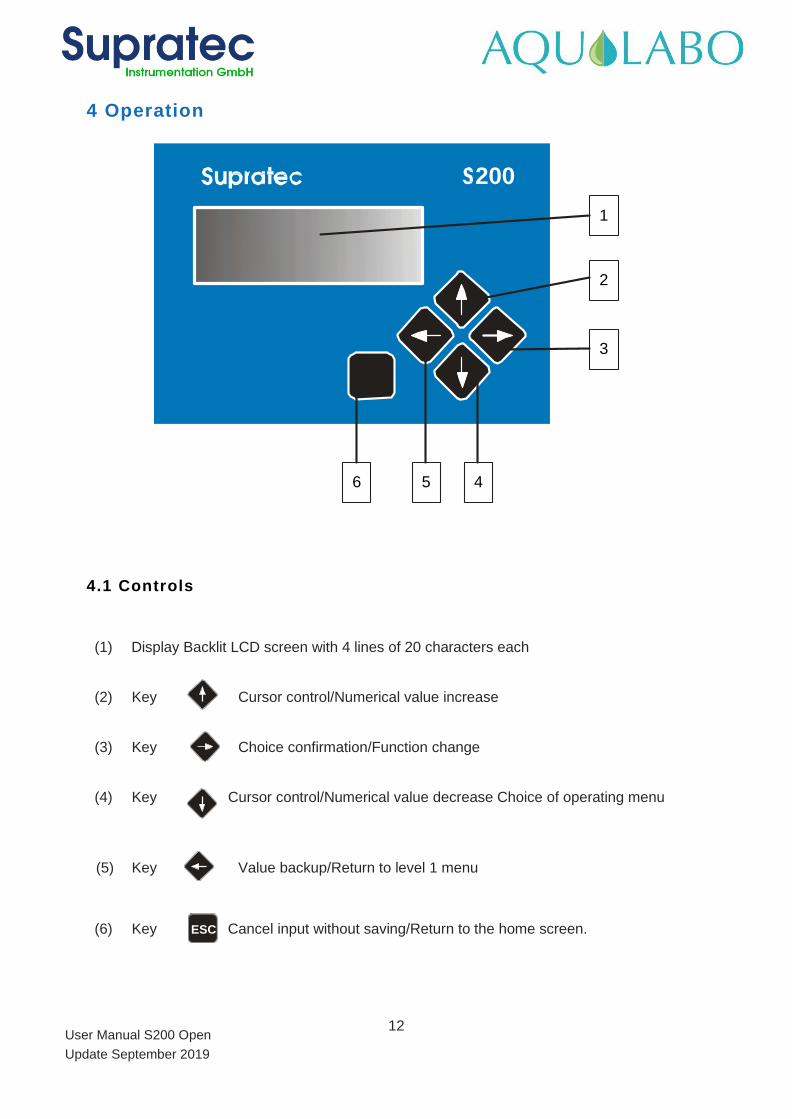
4 Operation
4.1 Controls
(1) Display Backlit LCD screen with 4 lines of 20 characters each
(2) Key Cursor control/Numerical value increase
(3) Key Choice confirmation/Function change
(4) Key Cursor control/Numerical value decrease Choice of operating menu
(5) Key Value backup/Return to level 1 menu
(6) Key Cancel input without saving/Return to the home screen.
6
1
5 4
3
2
200
ESC
13
User Manual S200 Open
Update September 2019
4.2 Display
4.2.1 Graphic symbol
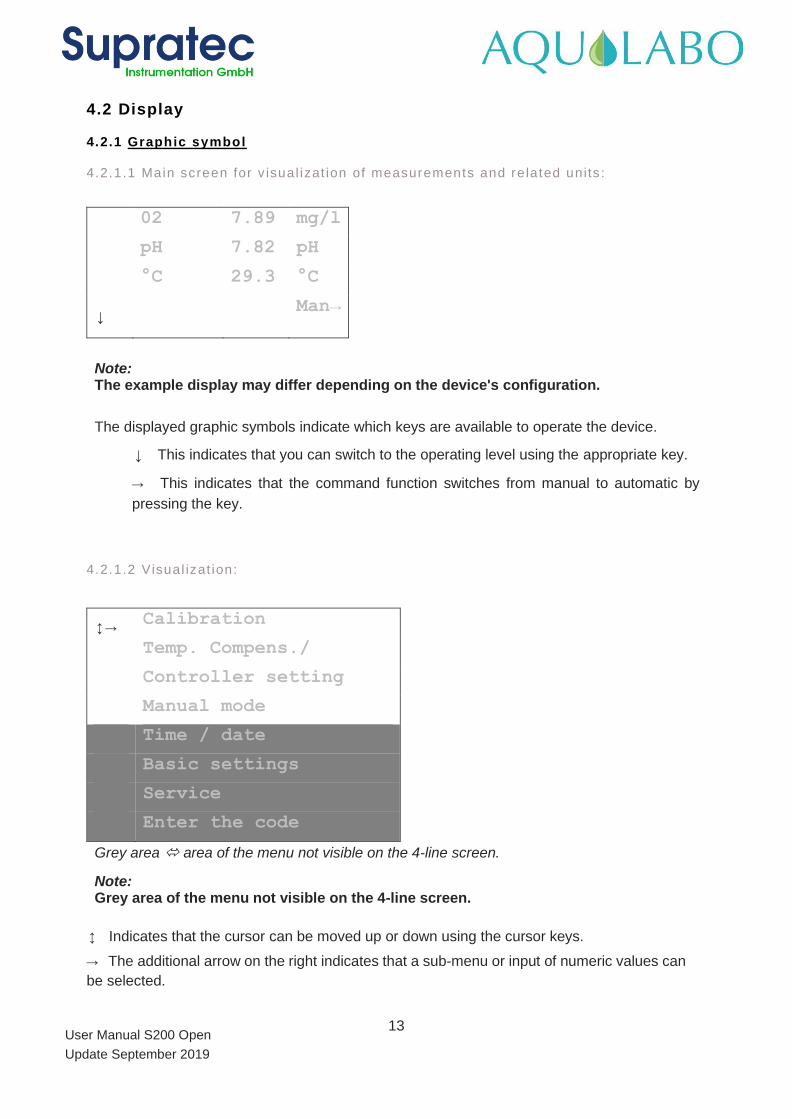
4.2.1.1 Main screen for v isual izat ion of measurements and re lated units :
02 7.89 mg/l
pH 7.82 pH
°C 29.3 °C
↓ Man→
Note: The example display may differ depending on the device's configuration.
The displayed graphic symbols indicate which keys are available to operate the device.
↓ This indicates that you can switch to the operating level using the appropriate key.
→ This indicates that the command function switches from manual to automatic by
pressing the key.
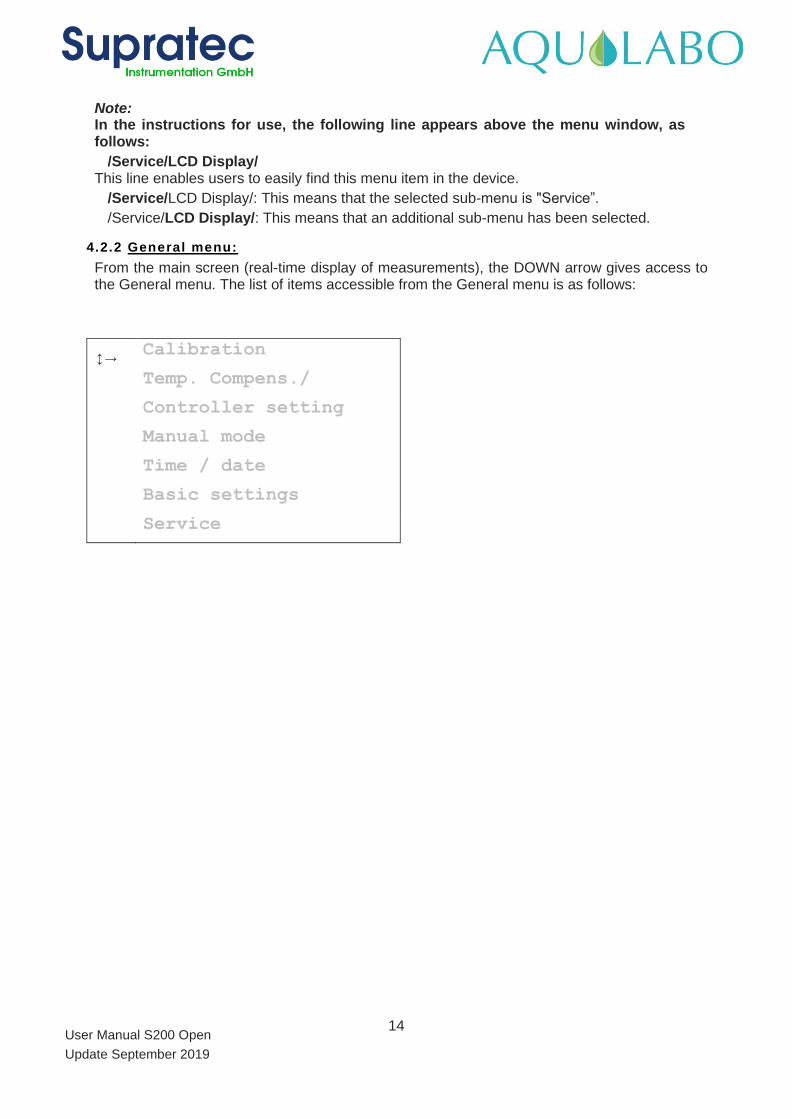
4.2.1.2 Visual izat ion:
→ Calibration
Temp. Compens./
Controller setting
Manual mode
Time / date
Basic settings
Service
Enter the code
Grey area area of the menu not visible on the 4-line screen.
Note: Grey area of the menu not visible on the 4-line screen.
Indicates that the cursor can be moved up or down using the cursor keys.
→ The additional arrow on the right indicates that a sub-menu or input of numeric values can
be selected.
14
User Manual S200 Open
Update September 2019
Note: In the instructions for use, the following line appears above the menu window, as follows:
/Service/LCD Display/ This line enables users to easily find this menu item in the device.
/Service/LCD Display/: This means that the selected sub-menu is "Service”.
/Service/LCD Display/: This means that an additional sub-menu has been selected.
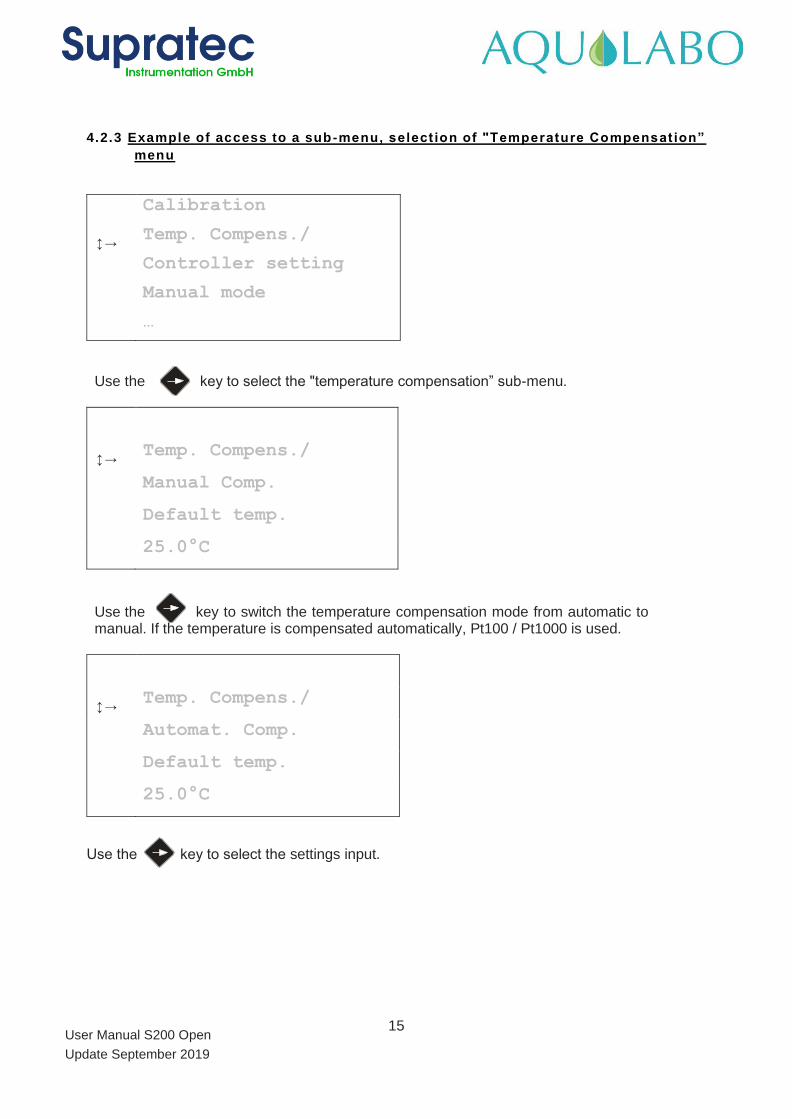
4.2.2 General menu:
From the main screen (real-time display of measurements), the DOWN arrow gives access to the General menu. The list of items accessible from the General menu is as follows:
→ Calibration
Temp. Compens./
Controller setting
Manual mode
Time / date
Basic settings
Service
15
User Manual S200 Open
Update September 2019
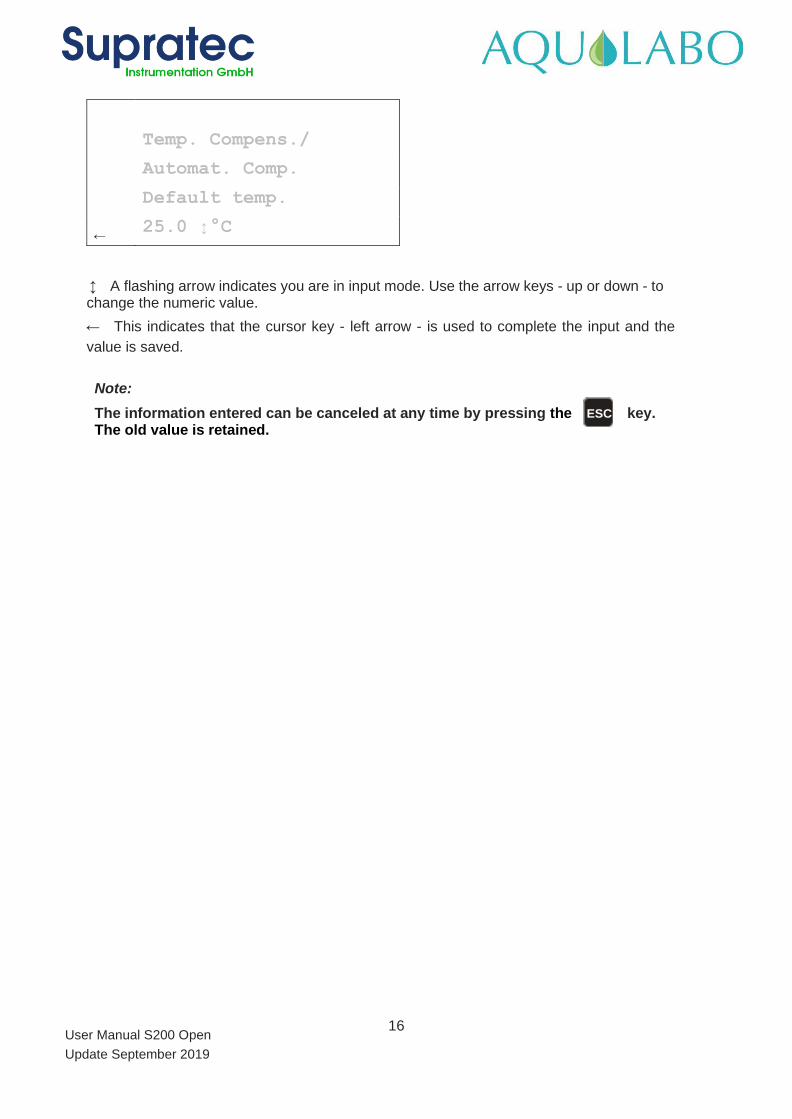
4.2.3 Example of access to a sub-menu, select ion of "Temperature Compensat ion”
menu
Calibration
→ Temp. Compens./
Controller setting
Manual mode
…
Use the key to select the "temperature compensation” sub-menu.
→ Temp. Compens./
Manual Comp.
Default temp.
25.0°C
Use the key to switch the temperature compensation mode from automatic to manual. If the temperature is compensated automatically, Pt100 / Pt1000 is used.
→ Temp. Compens./
Automat. Comp.
Default temp.
25.0°C
Use the … key to select the settings input.
16
User Manual S200 Open
Update September 2019
Temp. Compens./
Automat. Comp.
Default temp.
← 25.0 °C
A flashing arrow indicates you are in input mode. Use the arrow keys - up or down - to change the numeric value.
← This indicates that the cursor key - left arrow - is used to complete the input and the
value is saved.
Note:
The information entered can be canceled at any time by pressing the key. The old value is retained.
ESC
17
User Manual S200 Open
Update September 2019
5 Installation
WARNING
Potential risk of electrocution: Always shut off power to the equipment when
connecting it. The lower part of the housing, protective cover of the housing may only
be removed after switching off the device.
CAUTION
Potential damage to the device: The internal electronic components of the device
may be damaged by static electricity which in turn may adversely affect its
performance and function.
Discharge static electricity from your body before working on the equipment.
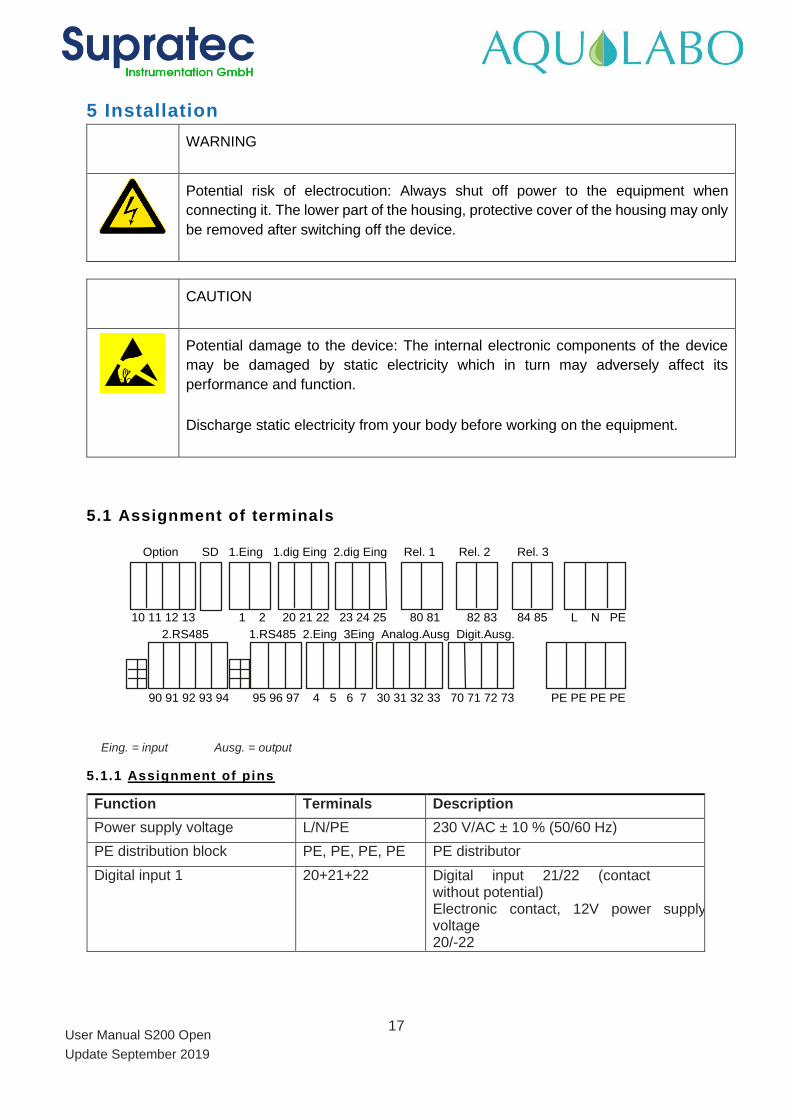
5.1 Assignment of terminals
Option SD 1.Eing 1.dig Eing 2.dig Eing Rel. 1 Rel. 2 Rel. 3
10 11 12 13 1 2 20 21 22 23 24 25 80 81 82 83 84 85 L N PE
90 91 92 93 94 95 96 97 4 5 6 7 30 31 32 33 70 71 72 73 PE PE PE PE
2.RS485 1.RS485 2.Eing 3Eing Analog.Ausg Digit.Ausg.
Eing. = input Ausg. = output
5.1.1 Assignment of pins
Function Terminals Description
Power supply voltage L/N/PE 230 V/AC ± 10 % (50/60 Hz)
PE distribution block PE, PE, PE, PE PE distributor
Digital input 1 20+21+22 Digital input 21/22 (contact without potential) Electronic contact, 12V power supply voltage 20/-22 Pulse 21
18
User Manual S200 Open
Update September 2019
Digital input 2 23+24+25 Digital input 24/25 (contact without potential) Electronic contact, 12V power supply voltage +23/-25 Pulse 24 Analog output 1
0 / 4-20 mA max. load 500Ω 30+31 -30/+31
Analog output 2 0 / 4-20 mA max. load 500Ω
32+33 -32/+33
Digital output 1 Max. load 200 mA / 30V
70+71 Digital output for electronic monitoring Dosing pumps
Digital output 2 Max. load 200 mA / 30V
72+73 Digital output for electronic monitoring Dosing pumps
Switching from output relay 1
80+81 Potential-free contact
Switching from output relay 2 82+83 Potential-free contact
Switching from output relay 3 84+85 Potential-free contact
Union Terminals Description
Modbus RS485 interface for connecting digital probes
12VDC power supply voltage
12 V DC max. 200 mA
90+91+92+93+94 90 = 0 V, 91 = +12 V,
92 = B, communication
93 = A, communication
94 = shielding Modbus RS485 interface for communication with the
management system
95+96+97 95 = B
96 = A 97 = shielding
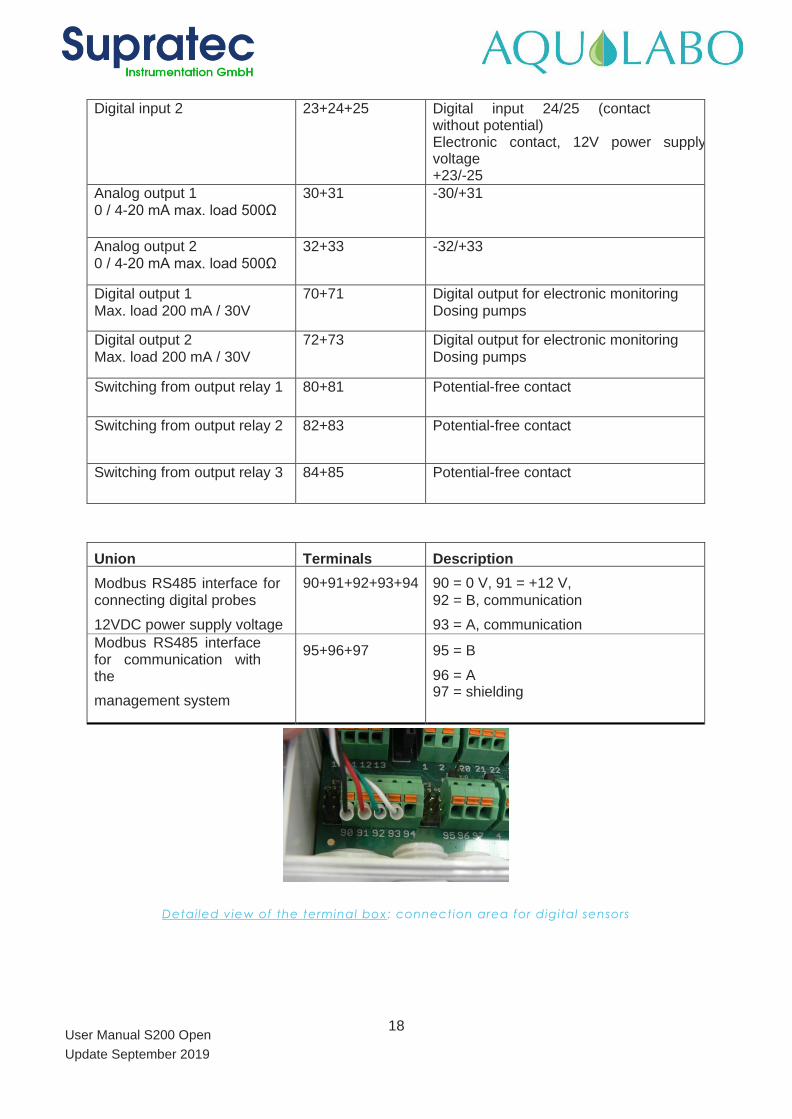
Detailed view of the terminal box: connection area for digital sensors
19
User Manual S200 Open
Update September 2019
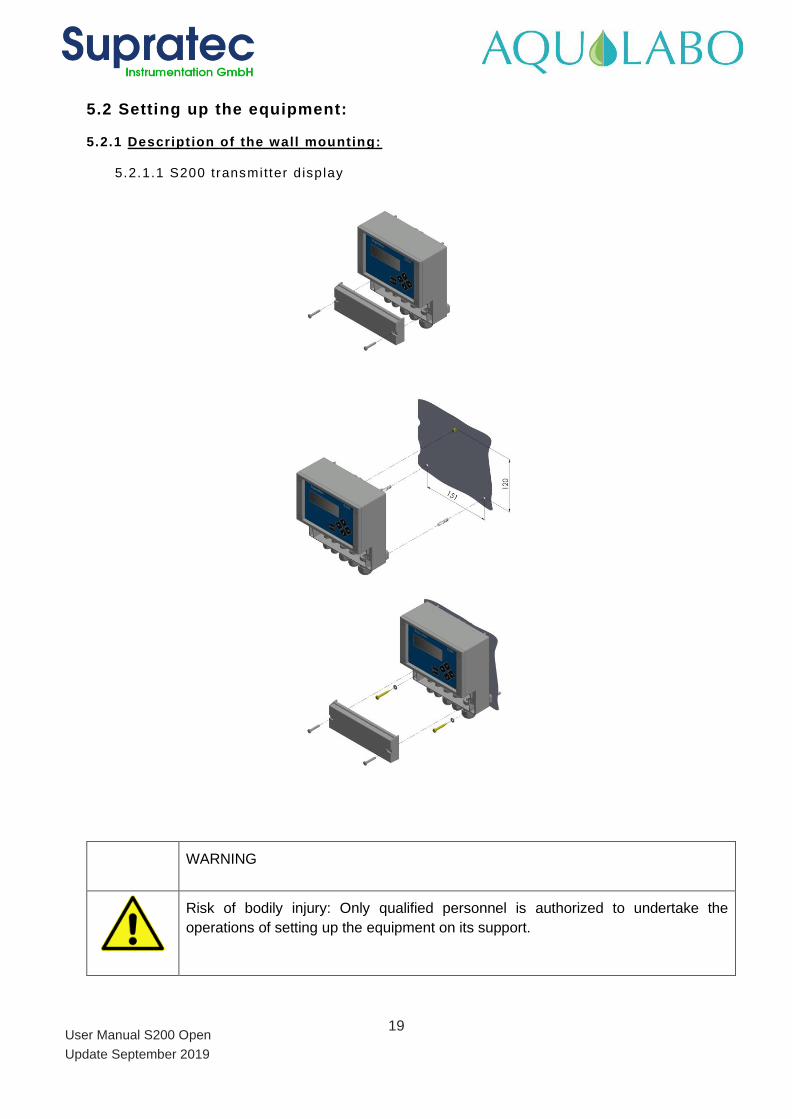
5.2 Setting up the equipment:
5.2.1 Descript ion of the wall mounting:
5.2.1.1 S200 transmitter d isplay
WARNING
Risk of bodily injury: Only qualified personnel is authorized to undertake the
operations of setting up the equipment on its support.
20
User Manual S200 Open
Update September 2019
Improper fastening = risk of equipment falling, deterioration of equipment and risk for
operators.
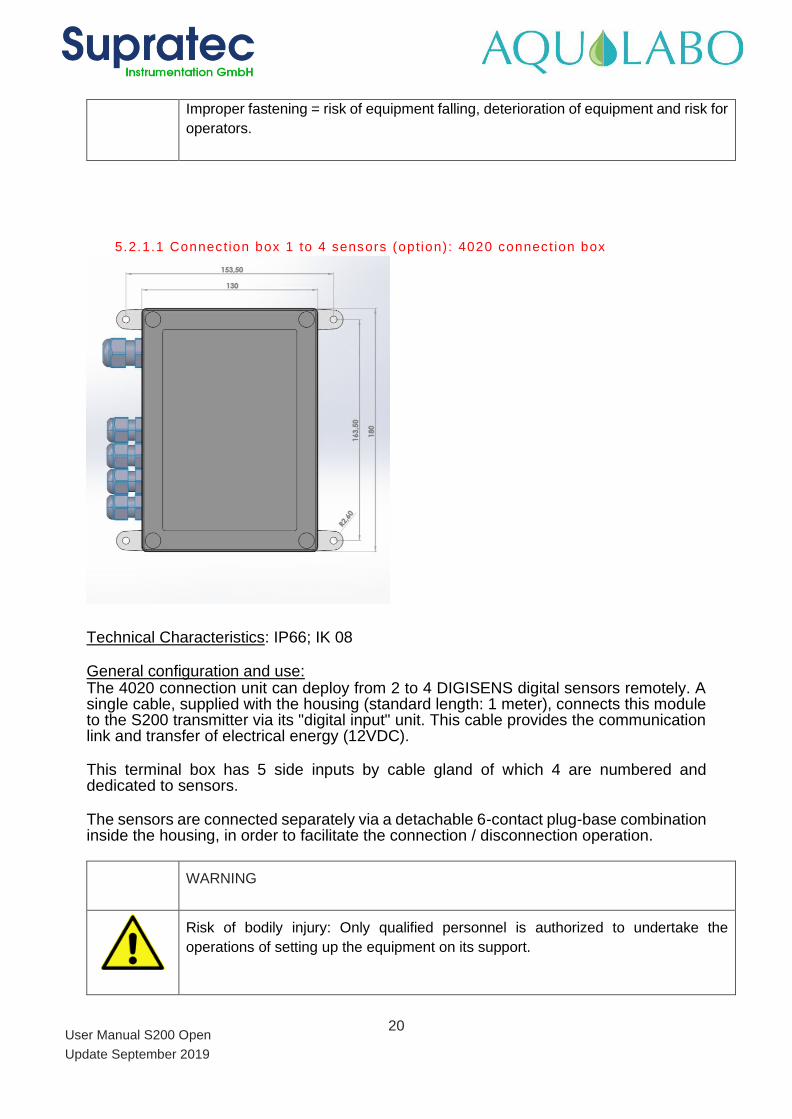
5.2.1.1 Connect ion box 1 to 4 sensors (opt ion): 4020 connect ion box
Technical Characteristics: IP66; IK 08
General configuration and use: The 4020 connection unit can deploy from 2 to 4 DIGISENS digital sensors remotely. A single cable, supplied with the housing (standard length: 1 meter), connects this module to the S200 transmitter via its "digital input" unit. This cable provides the communication link and transfer of electrical energy (12VDC). This terminal box has 5 side inputs by cable gland of which 4 are numbered and dedicated to sensors. The sensors are connected separately via a detachable 6-contact plug-base combination inside the housing, in order to facilitate the connection / disconnection operation.
WARNING
Risk of bodily injury: Only qualified personnel is authorized to undertake the
operations of setting up the equipment on its support.
21
User Manual S200 Open
Update September 2019
Improper fastening = risk of equipment falling, deterioration of equipment and risk for
operators.
22
User Manual S200 Open
Update September 2019
6 Access and display
6.1 How to use menus
All settings are accessible via a menu. Changing a defined value (for example).
Note: This manual includes all available menu items. Depending on the selected code (see the specific “Codes” paragraph), all menu items cannot be displayed, and/or, all menu items cannot be selected.
6.1.1 Codes
There are 3 access levels to provide access using codes that protect the device from unauthorized operation.
A) Code A - 00: all entries are locked, except codes B, C and D
B) Code B - 15: user code
C) Code C - 55: maintenance code
D) Code D - NN: code for factory service
6.2 LCD display adjustments
6.2.1 Contrast adjustment
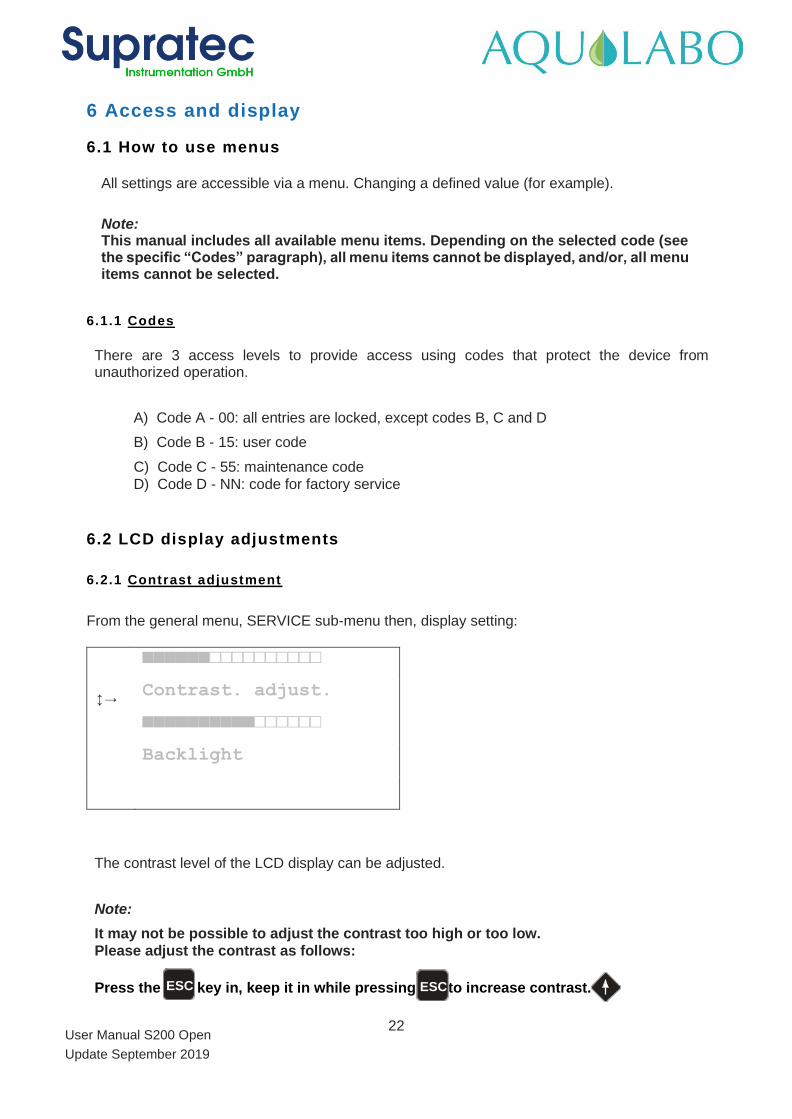
From the general menu, SERVICE sub-menu then, display setting:
→ Contrast. adjust.
Backlight
The contrast level of the LCD display can be adjusted.
Note:
It may not be possible to adjust the contrast too high or too low.
Please adjust the contrast as follows:
Press the key in, keep it in while pressing to increase contrast.
ESC ESC
23
User Manual S200 Open
Update September 2019
To decrease contrast, press the key while pressing
at the same time. This function may need to be adjusted after a factory reset.
6.2.2 Adjust ing the backlight
The intensity of the backlight can be changed using the "backlight” menu.
Note: Backlight intensity: it should be as bright as required. A backlight that is too bright reduces the useful life of the display.
6.3 Display - Loss of communication
If communication with a Modbus RS485 digital sensor is lost, the parameter display, e.g. oxygen
in mg/L for an OPTOD sensor, will flash until communication is restored.
24
User Manual S200 Open
Update September 2019
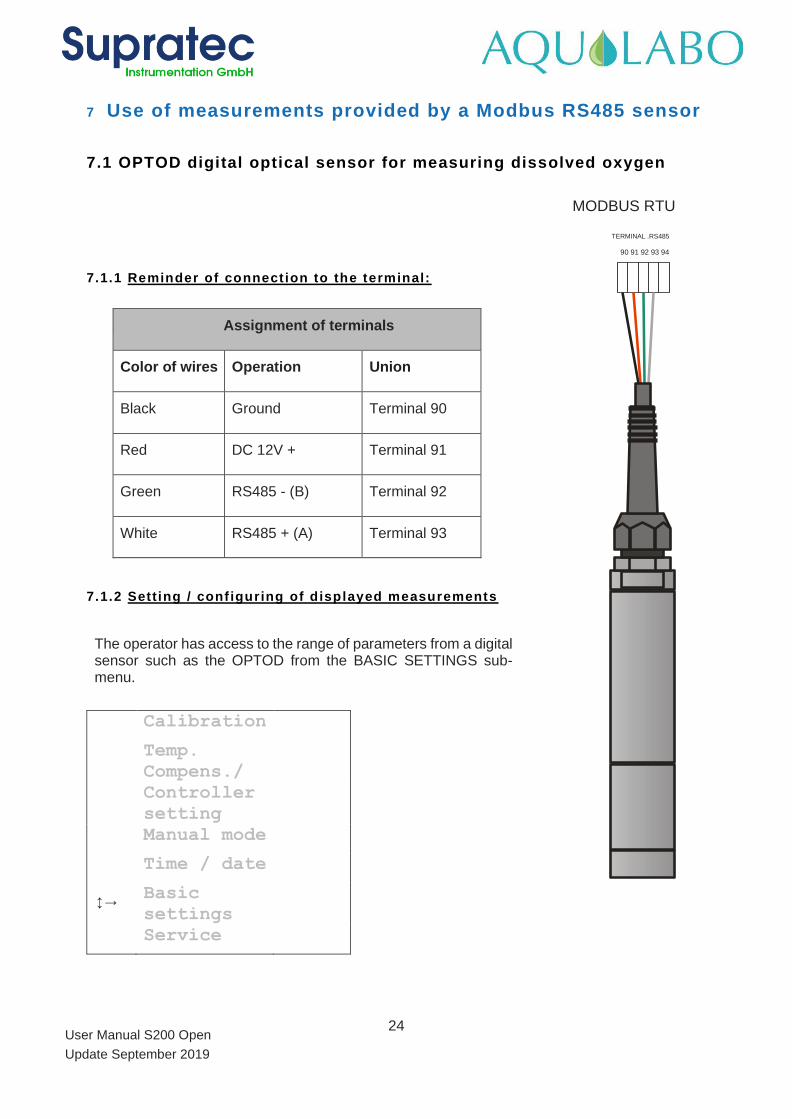
Assignment of terminals
Color of wires Operation Union
Black Ground Terminal 90
Red DC 12V + Terminal 91
Green RS485 - (B) Terminal 92
White RS485 + (A) Terminal 93
7 Use of measurements provided by a Modbus RS485 sensor
7.1 OPTOD digital optical sensor for measuring dissolved oxygen
MODBUS RTU
TERMINAL .RS485
90 91 92 93 94
7.1.1 Reminder of connect ion to the terminal:
7.1.2 Sett ing / conf iguring of displayed measurements
The operator has access to the range of parameters from a digital sensor such as the OPTOD from the BASIC SETTINGS sub-menu.
Calibration
Temp.
Compens./
Controller
setting
Manual mode
Time / date
→ Basic
settings
Service
25
User Manual S200 Open
Update September 2019
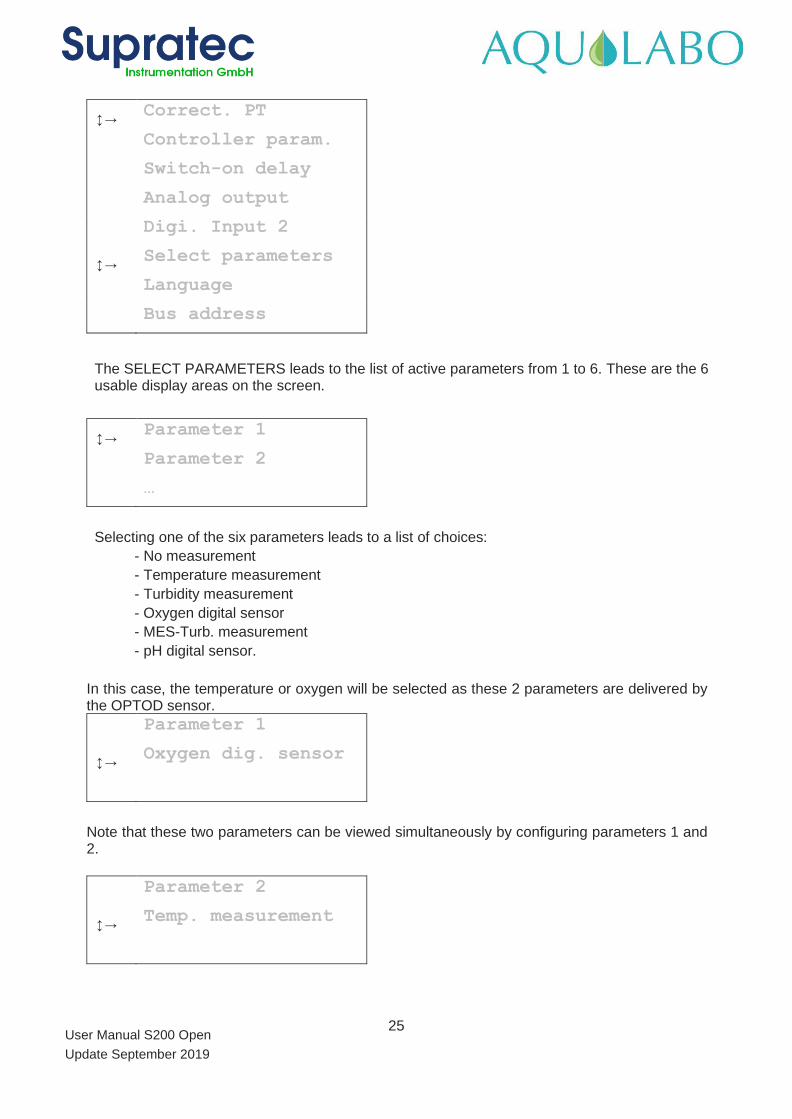
→ Correct. PT
Controller param.
Switch-on delay
Analog output
Digi. Input 2
→ Select parameters
Language
Bus address
The SELECT PARAMETERS leads to the list of active parameters from 1 to 6. These are the 6 usable display areas on the screen.
→ Parameter 1
Parameter 2
…
Selecting one of the six parameters leads to a list of choices:
- No measurement
- Temperature measurement
- Turbidity measurement
- Oxygen digital sensor
- MES-Turb. measurement
- pH digital sensor.
In this case, the temperature or oxygen will be selected as these 2 parameters are delivered by the OPTOD sensor.
Parameter 1
→ Oxygen dig. sensor
Note that these two parameters can be viewed simultaneously by configuring parameters 1 and 2.
Parameter 2
→ Temp. measurement
26
User Manual S200 Open
Update September 2019
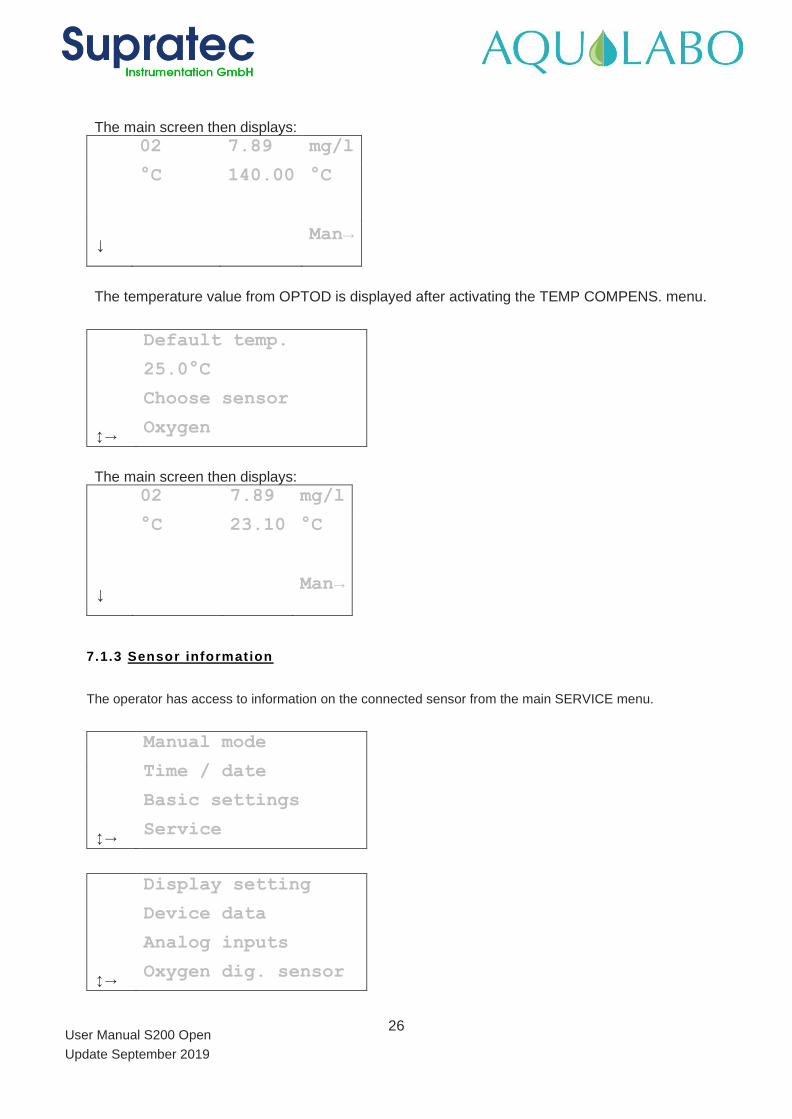
The main screen then displays:
02 7.89 mg/l
°C 140.00 °C
↓ Man→
The temperature value from OPTOD is displayed after activating the TEMP COMPENS. menu.
Default temp.
25.0°C
Choose sensor
→ Oxygen
The main screen then displays:
02 7.89 mg/l
°C 23.10 °C
↓ Man→
7.1.3 Sensor information
The operator has access to information on the connected sensor from the main SERVICE menu.
Manual mode
Time / date
Basic settings
→ Service
Display setting
Device data
Analog inputs
→ Oxygen dig. sensor
27
User Manual S200 Open
Update September 2019
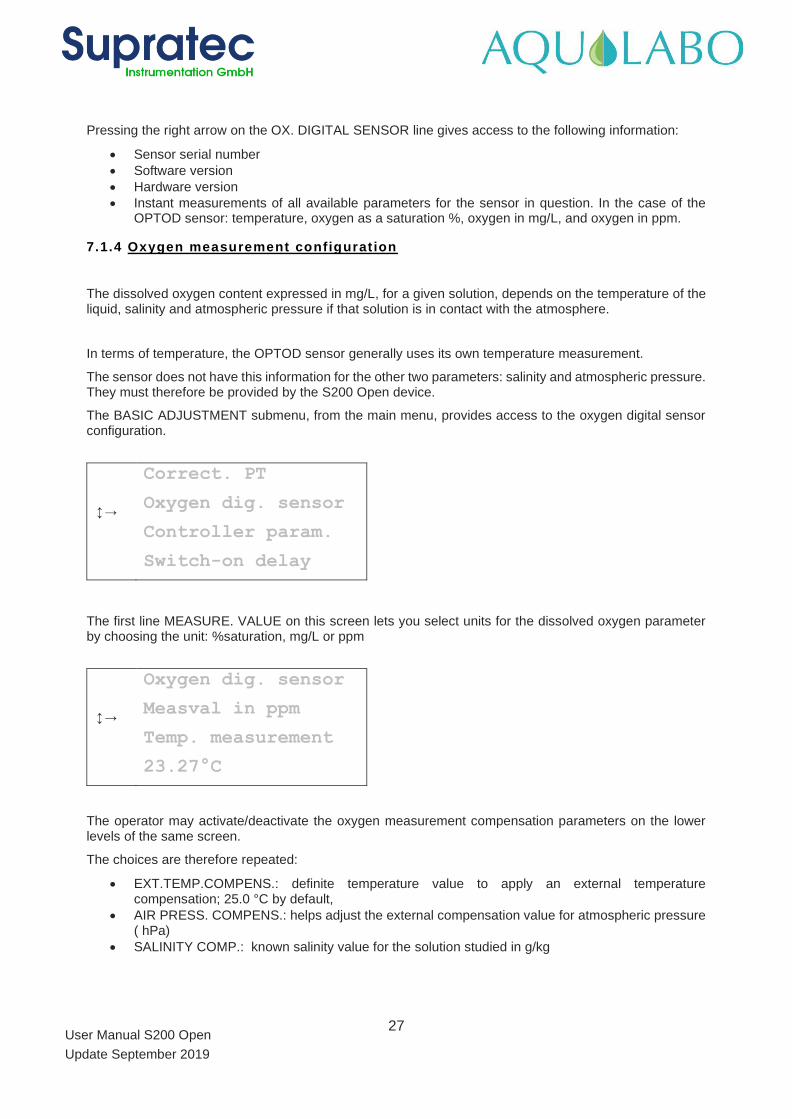
Pressing the right arrow on the OX. DIGITAL SENSOR line gives access to the following information:
• Sensor serial number
• Software version
• Hardware version
• Instant measurements of all available parameters for the sensor in question. In the case of the OPTOD sensor: temperature, oxygen as a saturation %, oxygen in mg/L, and oxygen in ppm.
7.1.4 Oxygen measurement configurat ion
The dissolved oxygen content expressed in mg/L, for a given solution, depends on the temperature of the liquid, salinity and atmospheric pressure if that solution is in contact with the atmosphere.
In terms of temperature, the OPTOD sensor generally uses its own temperature measurement.
The sensor does not have this information for the other two parameters: salinity and atmospheric pressure. They must therefore be provided by the S200 Open device.
The BASIC ADJUSTMENT submenu, from the main menu, provides access to the oxygen digital sensor configuration.
Correct. PT
→ Oxygen dig. sensor
Controller param.
Switch-on delay
The first line MEASURE. VALUE on this screen lets you select units for the dissolved oxygen parameter by choosing the unit: %saturation, mg/L or ppm
Oxygen dig. sensor
→ Measval in ppm
Temp. measurement
23.27°C
The operator may activate/deactivate the oxygen measurement compensation parameters on the lower levels of the same screen.
The choices are therefore repeated:
• EXT.TEMP.COMPENS.: definite temperature value to apply an external temperature compensation; 25.0 °C by default,
• AIR PRESS. COMPENS.: helps adjust the external compensation value for atmospheric pressure ( hPa)
• SALINITY COMP.: known salinity value for the solution studied in g/kg
28
User Manual S200 Open
Update September 2019
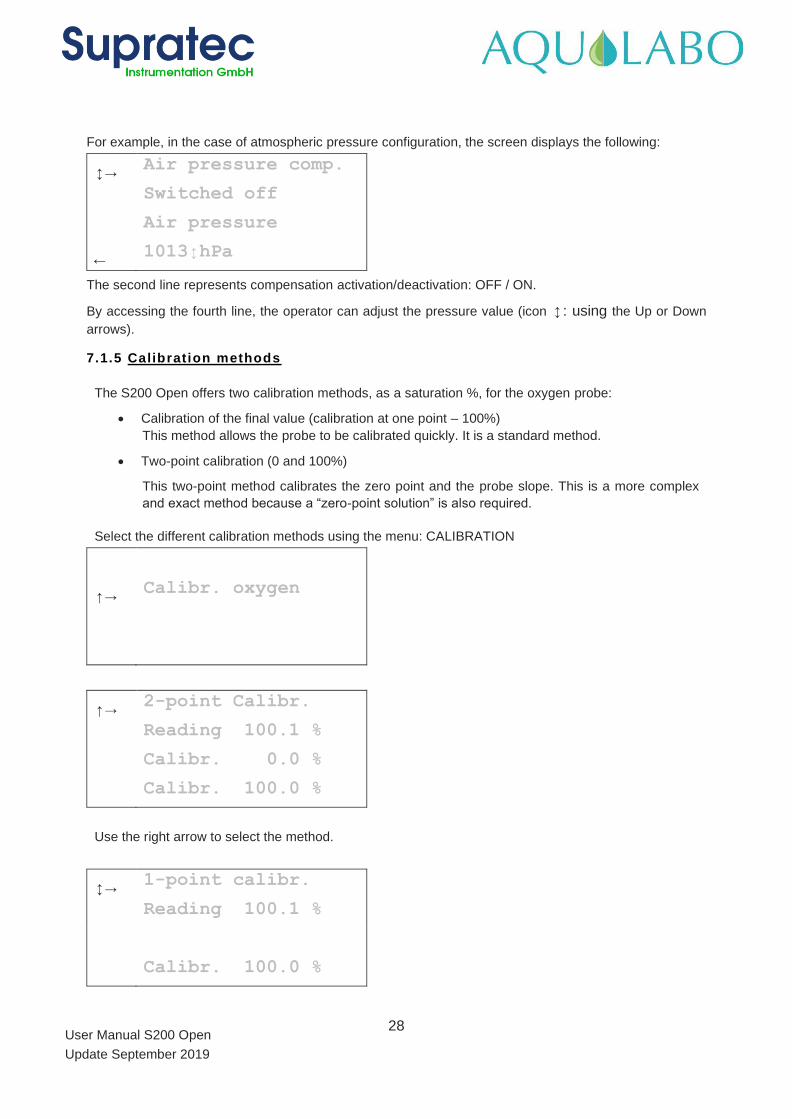
For example, in the case of atmospheric pressure configuration, the screen displays the following:
→ Air pressure comp.
Switched off
Air pressure
← 1013hPa
The second line represents compensation activation/deactivation: OFF / ON.
By accessing the fourth line, the operator can adjust the pressure value (icon : using the Up or Down
arrows).
7.1.5 Calibration methods
The S200 Open offers two calibration methods, as a saturation %, for the oxygen probe:
• Calibration of the final value (calibration at one point – 100%)
This method allows the probe to be calibrated quickly. It is a standard method.
• Two-point calibration (0 and 100%)
This two-point method calibrates the zero point and the probe slope. This is a more complex
and exact method because a “zero-point solution” is also required.
Select the different calibration methods using the menu: CALIBRATION
↑→ Calibr. oxygen
↑→ 2-point Calibr.
Reading 100.1 %
Calibr. 0.0 %
Calibr. 100.0 %
Use the right arrow to select the method.
→ 1-point calibr.
Reading 100.1 %
Calibr. 100.0 %
29
User Manual S200 Open
Update September 2019
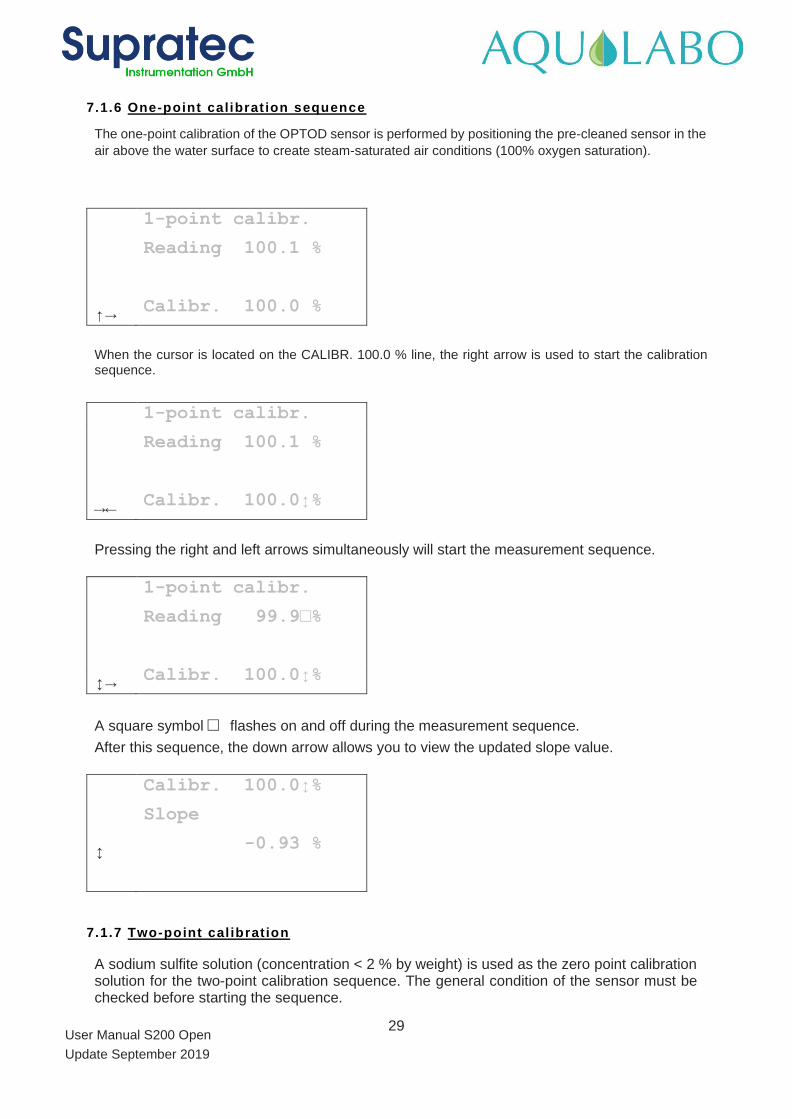
7.1.6 One-point calibrat ion sequence
The one-point calibration of the OPTOD sensor is performed by positioning the pre-cleaned sensor in the
air above the water surface to create steam-saturated air conditions (100% oxygen saturation).
1-point calibr.
Reading 100.1 %
↑→ Calibr. 100.0 %
When the cursor is located on the CALIBR. 100.0 % line, the right arrow is used to start the calibration sequence.
1-point calibr.
Reading 100.1 %
→← Calibr. 100.0%
Pressing the right and left arrows simultaneously will start the measurement sequence.
1-point calibr.
Reading 99.9%
→ Calibr. 100.0%
A square symbol flashes on and off during the measurement sequence.
After this sequence, the down arrow allows you to view the updated slope value.
Calibr. 100.0%
Slope
-0.93 %
7.1.7 Two-point cal ibration
A sodium sulfite solution (concentration < 2 % by weight) is used as the zero point calibration solution for the two-point calibration sequence. The general condition of the sensor must be checked before starting the sequence.
30
User Manual S200 Open
Update September 2019
Note:
The oxygen probe must be checked periodically (depending on the proportion of impurities present). It is important to rinse the probe and pellet before each check. Organic deposits on the active pellet, such as mud or biofilm, may result in measurement errors. These deposits can be removed by carefully using hot soapy water and a sponge. Never use an abrasive cleaner.
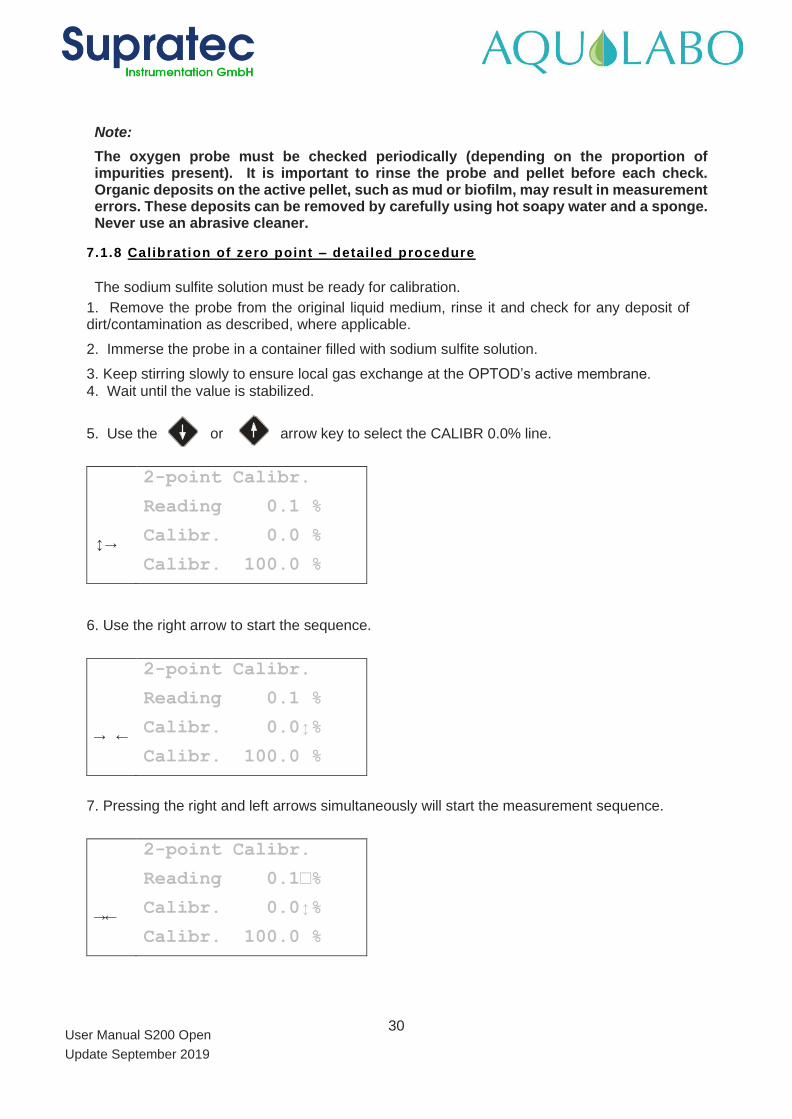
7.1.8 Calibration of zero point – detailed procedure
The sodium sulfite solution must be ready for calibration.
1. Remove the probe from the original liquid medium, rinse it and check for any deposit of dirt/contamination as described, where applicable.
2. Immerse the probe in a container filled with sodium sulfite solution.
3. Keep stirring slowly to ensure local gas exchange at the OPTOD’s active membrane.
4. Wait until the value is stabilized.
5. Use the or arrow key to select the CALIBR 0.0% line.
2-point Calibr.
Reading 0.1 %
→ Calibr. 0.0 %
Calibr. 100.0 %
6. Use the right arrow to start the sequence.
2-point Calibr.
Reading 0.1 %
→ ← Calibr. 0.0%
Calibr. 100.0 %
7. Pressing the right and left arrows simultaneously will start the measurement sequence.
2-point Calibr.
Reading 0.1%
→← Calibr. 0.0%
Calibr. 100.0 %
31
User Manual S200 Open
Update September 2019
A flashing square behind the displayed value indicates that the automatic calibration process is in progress. This display turns off when zero point calibration is complete.
8. Thoroughly rinse the probe with clear water and wipe the sensor.
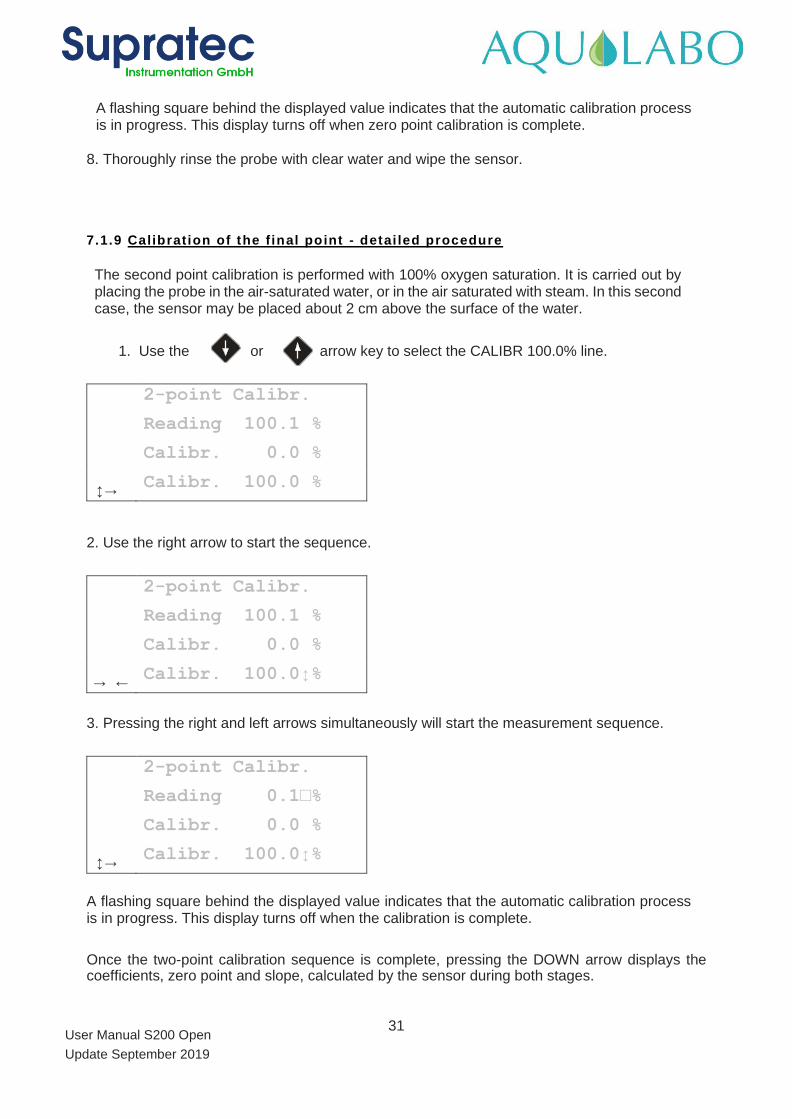
7.1.9 Calibration of the f inal point - detai led procedure
The second point calibration is performed with 100% oxygen saturation. It is carried out by placing the probe in the air-saturated water, or in the air saturated with steam. In this second case, the sensor may be placed about 2 cm above the surface of the water.
1. Use the or arrow key to select the CALIBR 100.0% line.
2-point Calibr.
Reading 100.1 %
Calibr. 0.0 %
→ Calibr. 100.0 %
2. Use the right arrow to start the sequence.
2-point Calibr.
Reading 100.1 %
Calibr. 0.0 %
→ ← Calibr. 100.0%
3. Pressing the right and left arrows simultaneously will start the measurement sequence.
2-point Calibr.
Reading 0.1%
Calibr. 0.0 %
→ Calibr. 100.0%
A flashing square behind the displayed value indicates that the automatic calibration process is in progress. This display turns off when the calibration is complete.
Once the two-point calibration sequence is complete, pressing the DOWN arrow displays the coefficients, zero point and slope, calculated by the sensor during both stages.
32
User Manual S200 Open
Update September 2019
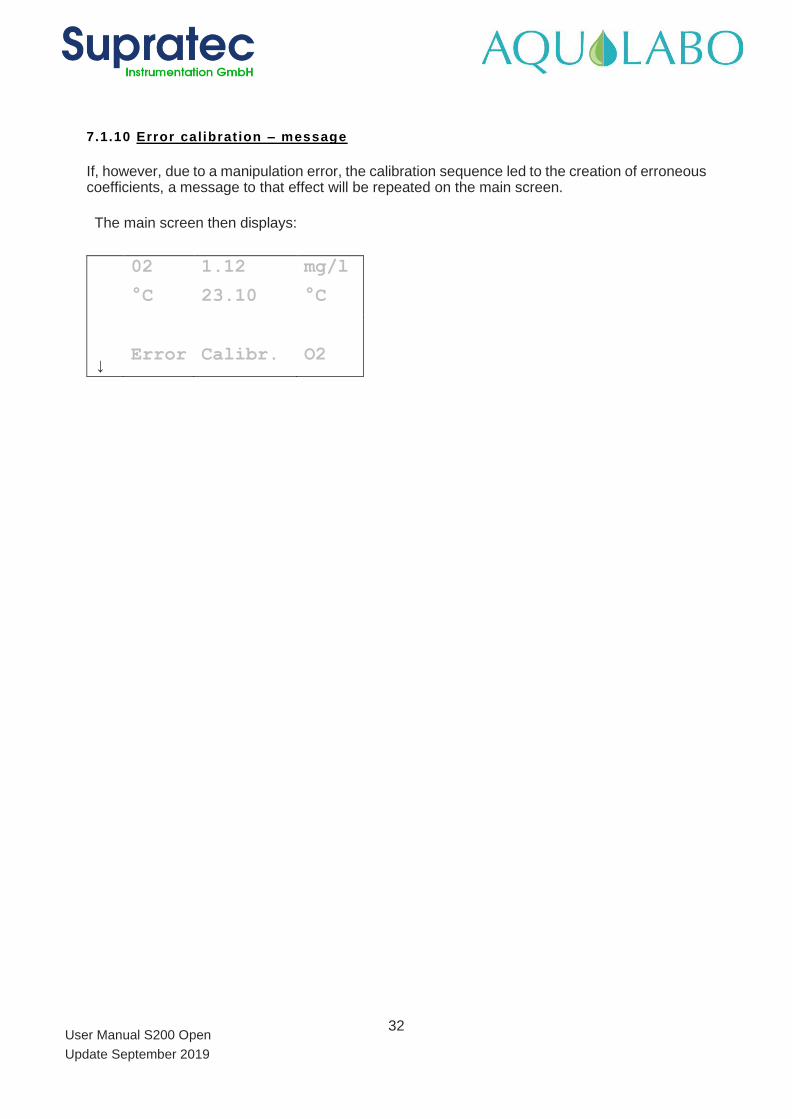
7.1.10 Error calibrat ion – message
If, however, due to a manipulation error, the calibration sequence led to the creation of erroneous coefficients, a message to that effect will be repeated on the main screen.
The main screen then displays:
02 1.12 mg/l
°C 23.10 °C
↓ Error Calibr. O2
33
User Manual S200 Open
Update September 2019
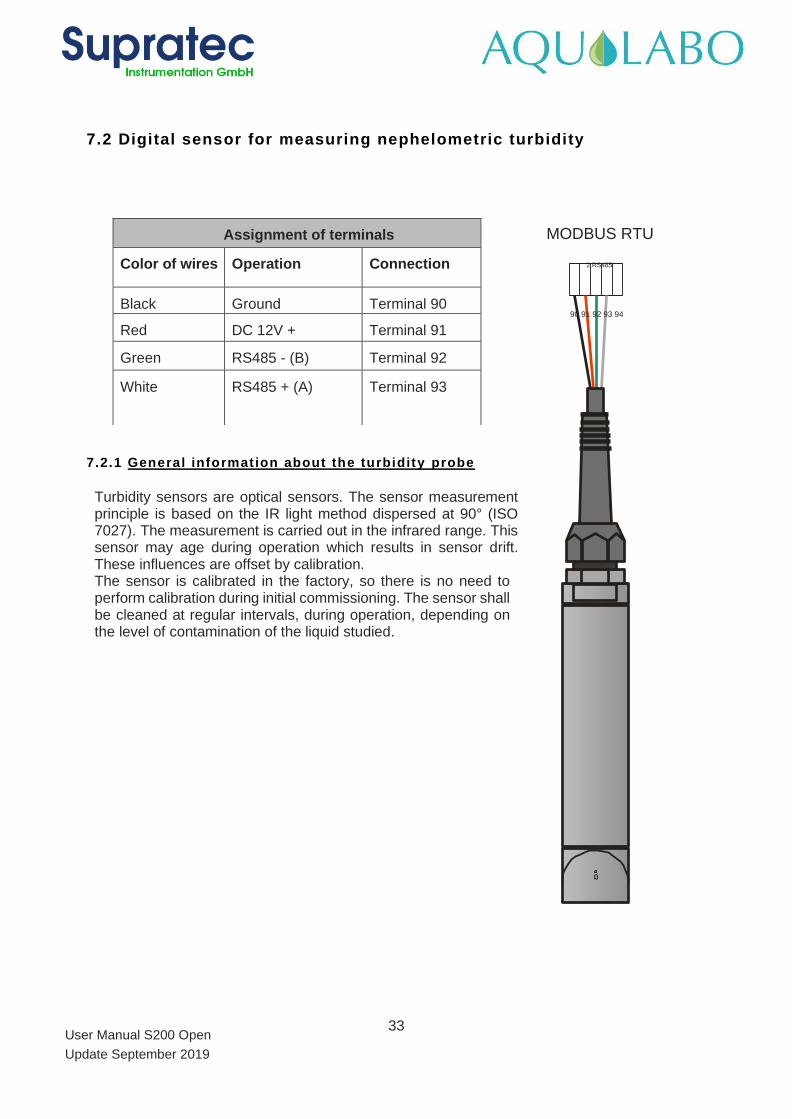
Assignment of terminals
Color of wires Operation Connection
Black Ground Terminal 90
Red DC 12V + Terminal 91
Green RS485 - (B) Terminal 92
White RS485 + (A) Terminal 93
7.2 Digital sensor for measuring nephelometric turbidity
MODBUS RTU
2.RS485
90 91 92 93 94
7.2.1 General information about the turbidity probe
Turbidity sensors are optical sensors. The sensor measurement principle is based on the IR light method dispersed at 90° (ISO 7027). The measurement is carried out in the infrared range. This sensor may age during operation which results in sensor drift. These influences are offset by calibration. The sensor is calibrated in the factory, so there is no need to perform calibration during initial commissioning. The sensor shall be cleaned at regular intervals, during operation, depending on the level of contamination of the liquid studied.

34
User Manual S200 Open
Update September 2019
7.2.2 Sett ing / conf iguring of displayed measurements
The operator has access to the choice of parameters coming from a digital sensor in the BASIC ADJUSTMENT submenu.
Calibration
Temp. Compens./
Controller setting
Manual mode
Time / date
→ Basic settings
Service
Correct. PT
Controller param.
Switch-on delay
Analog output
Digi. Input 2
→ Select parameters
Language
Bus address
The SELECT PARAMETERS choice leads to the list of active parameters from 1 to 6. These are the 6 usable display areas on the screen.
→ Parameter 1
Parameter 2
…
Selecting one of the six parameters leads to a list of choices:
- No measurement
- Temperature measurement
- Turbidity measurement
- Oxygen digital sensor
- MES-Turb. measurement
- pH digital sensor.
35
User Manual S200 Open
Update September 2019
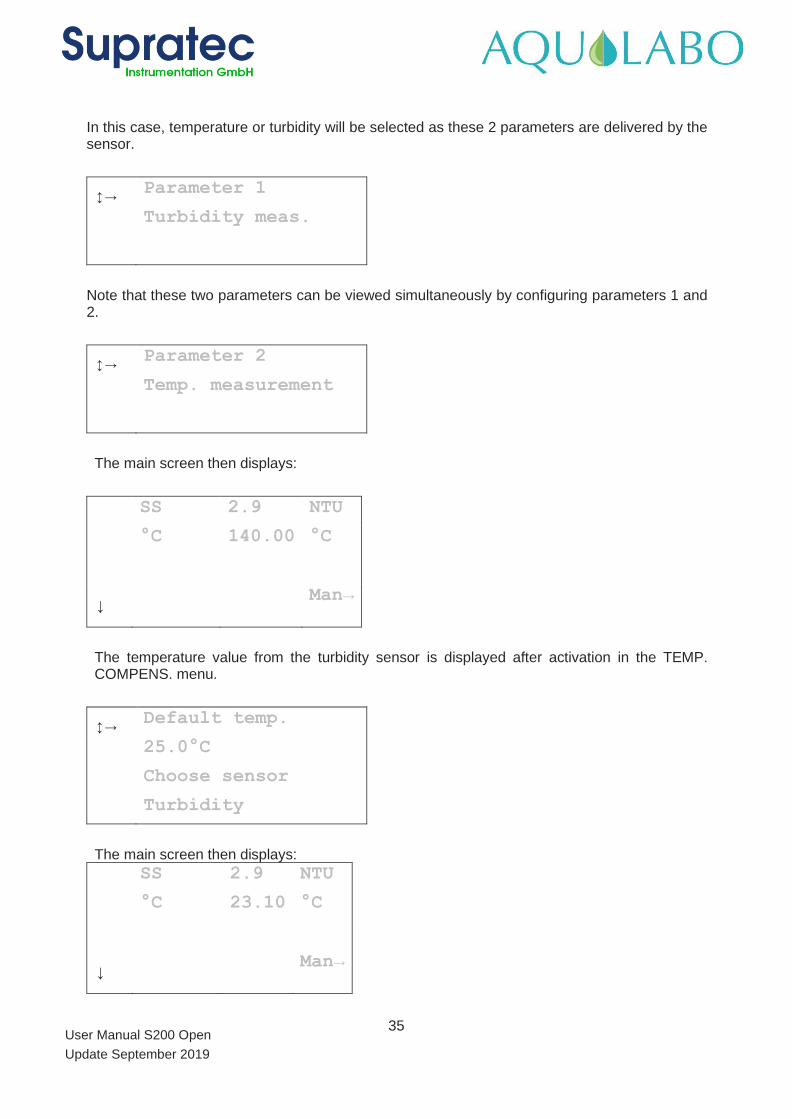
In this case, temperature or turbidity will be selected as these 2 parameters are delivered by the sensor.
→ Parameter 1
Turbidity meas.
Note that these two parameters can be viewed simultaneously by configuring parameters 1 and 2.
→ Parameter 2
Temp. measurement
The main screen then displays:
SS 2.9 NTU
°C 140.00 °C
↓ Man→
The temperature value from the turbidity sensor is displayed after activation in the TEMP. COMPENS. menu.
→ Default temp.
25.0°C
Choose sensor
Turbidity
The main screen then displays:
SS 2.9 NTU
°C 23.10 °C
↓ Man→
36
User Manual S200 Open
Update September 2019
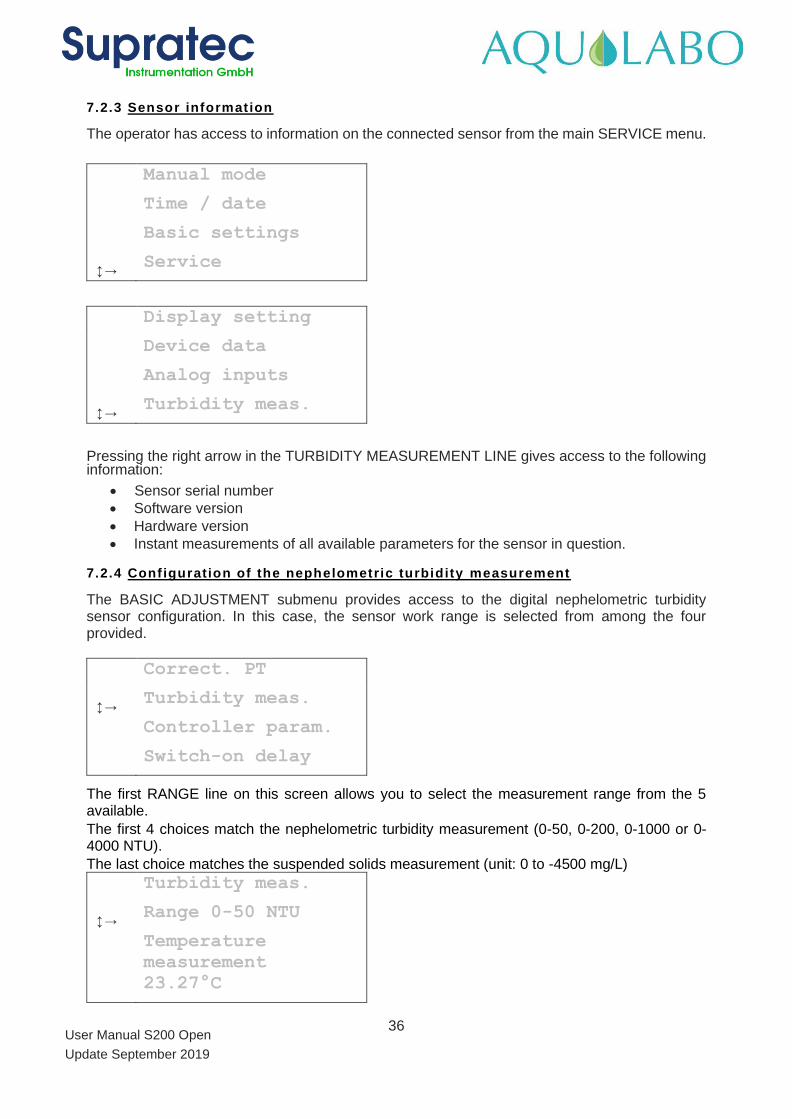
7.2.3 Sensor information
The operator has access to information on the connected sensor from the main SERVICE menu.
Manual mode
Time / date
Basic settings
→ Service
Display setting
Device data
Analog inputs
→ Turbidity meas.
Pressing the right arrow in the TURBIDITY MEASUREMENT LINE gives access to the following information:
• Sensor serial number
• Software version
• Hardware version
• Instant measurements of all available parameters for the sensor in question.
7.2.4 Conf iguration of the nephelometric turbidity measurement
The BASIC ADJUSTMENT submenu provides access to the digital nephelometric turbidity sensor configuration. In this case, the sensor work range is selected from among the four provided.
Correct. PT
→ Turbidity meas.
Controller param.
Switch-on delay
The first RANGE line on this screen allows you to select the measurement range from the 5 available.
The first 4 choices match the nephelometric turbidity measurement (0-50, 0-200, 0-1000 or 0-4000 NTU).
The last choice matches the suspended solids measurement (unit: 0 to -4500 mg/L)
Turbidity meas.
→ Range 0-50 NTU
Temperature
measurement
23.27°C
37
User Manual S200 Open
Update September 2019
Note:
After having selected the measurement range and in the event of overstepping when the S200 device returns to measurement mode, the measurement will remain frozen in the form of a series of 9s (e.g. 999.9). In this case, return to the menu so as to select the measurement range and opt for a wider range.
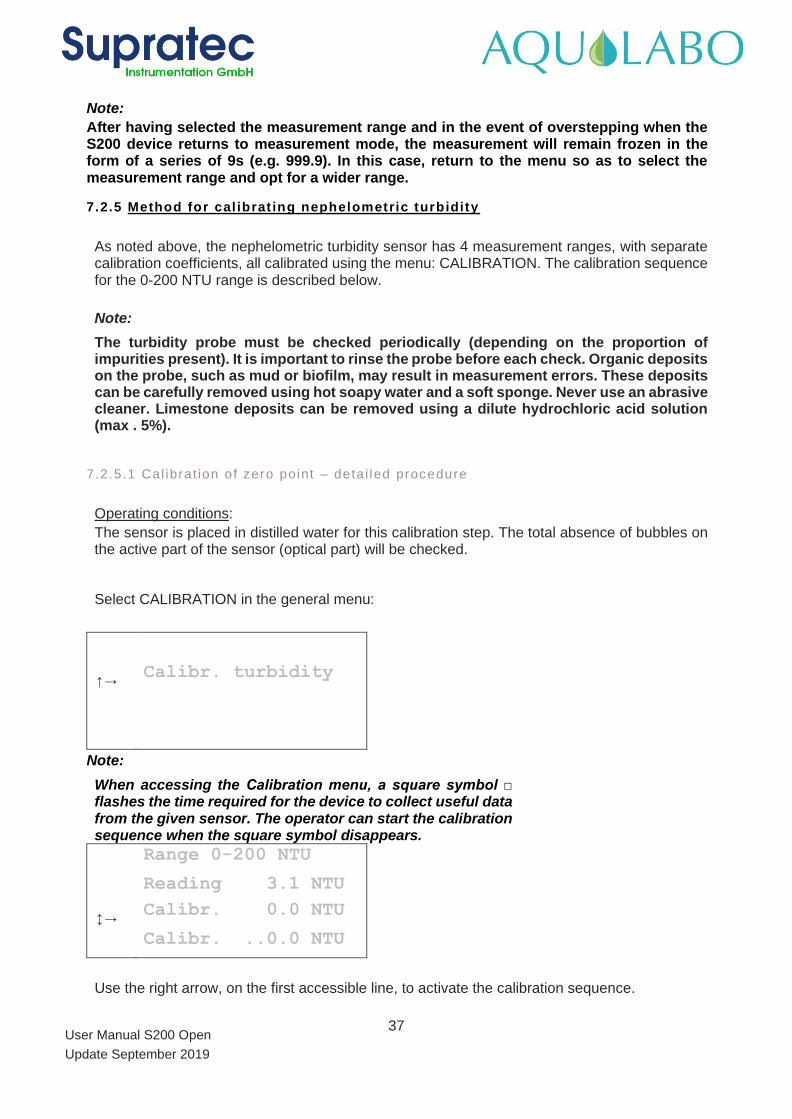
7.2.5 Method for cal ibrat ing nephelometric turbidity
As noted above, the nephelometric turbidity sensor has 4 measurement ranges, with separate calibration coefficients, all calibrated using the menu: CALIBRATION. The calibration sequence for the 0-200 NTU range is described below.
Note:
The turbidity probe must be checked periodically (depending on the proportion of impurities present). It is important to rinse the probe before each check. Organic deposits on the probe, such as mud or biofilm, may result in measurement errors. These deposits can be carefully removed using hot soapy water and a soft sponge. Never use an abrasive cleaner. Limestone deposits can be removed using a dilute hydrochloric acid solution (max . 5%).
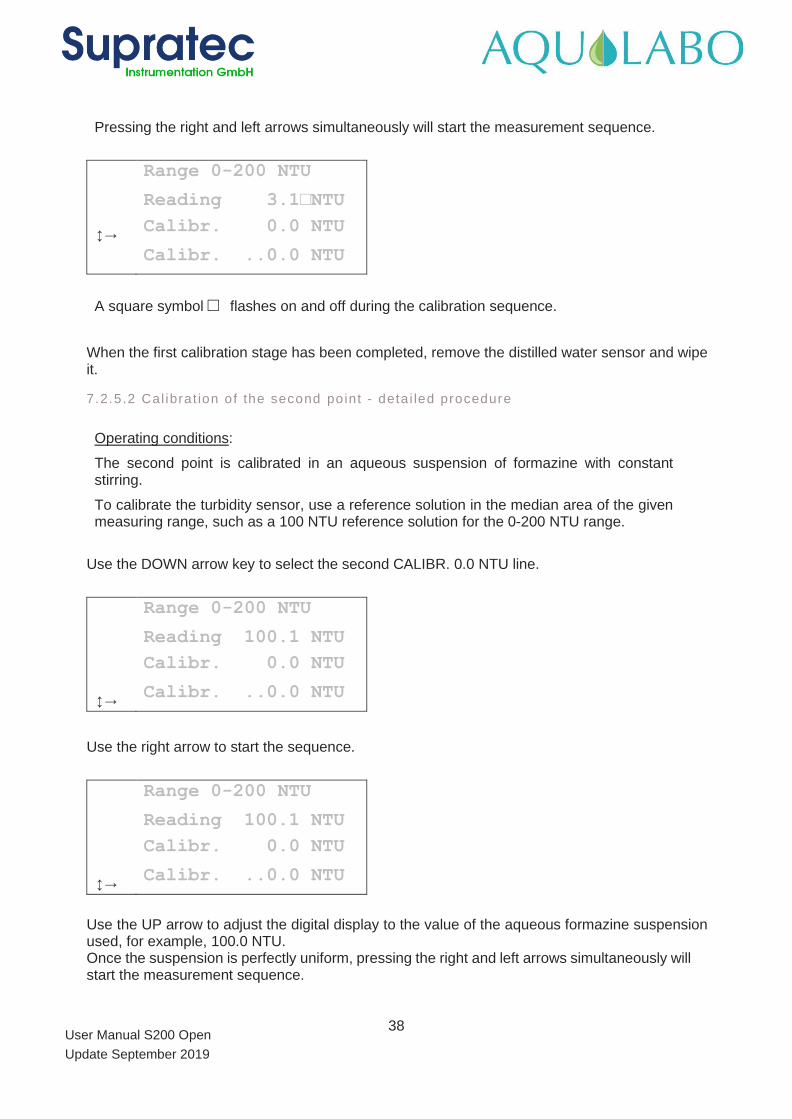
7.2.5.1 Cal ibrat ion of zero point – deta i led procedure
Operating conditions:
The sensor is placed in distilled water for this calibration step. The total absence of bubbles on the active part of the sensor (optical part) will be checked.
Select CALIBRATION in the general menu:
↑→ Calibr. turbidity
Note:
When accessing the Calibration menu, a square symbol flashes the time required for the device to collect useful data from the given sensor. The operator can start the calibration sequence when the square symbol disappears.
Range 0-200 NTU
Reading 3.1 NTU
→ Calibr. 0.0 NTU
Calibr. ..0.0 NTU
Use the right arrow, on the first accessible line, to activate the calibration sequence.
38
User Manual S200 Open
Update September 2019
Pressing the right and left arrows simultaneously will start the measurement sequence.
Range 0-200 NTU
Reading 3.1NTU
→ Calibr. 0.0 NTU
Calibr. ..0.0 NTU
A square symbol flashes on and off during the calibration sequence.
When the first calibration stage has been completed, remove the distilled water sensor and wipe it.
7.2.5.2 Cal ibrat ion of the second point - deta i led procedure
Operating conditions:
The second point is calibrated in an aqueous suspension of formazine with constant stirring.
To calibrate the turbidity sensor, use a reference solution in the median area of the given measuring range, such as a 100 NTU reference solution for the 0-200 NTU range.
Use the DOWN arrow key to select the second CALIBR. 0.0 NTU line.
Range 0-200 NTU
Reading 100.1 NTU
Calibr. 0.0 NTU
→ Calibr. ..0.0 NTU
Use the right arrow to start the sequence.
Range 0-200 NTU
Reading 100.1 NTU
Calibr. 0.0 NTU
→ Calibr. ..0.0 NTU
Use the UP arrow to adjust the digital display to the value of the aqueous formazine suspension used, for example, 100.0 NTU. Once the suspension is perfectly uniform, pressing the right and left arrows simultaneously will start the measurement sequence.
39
User Manual S200 Open
Update September 2019
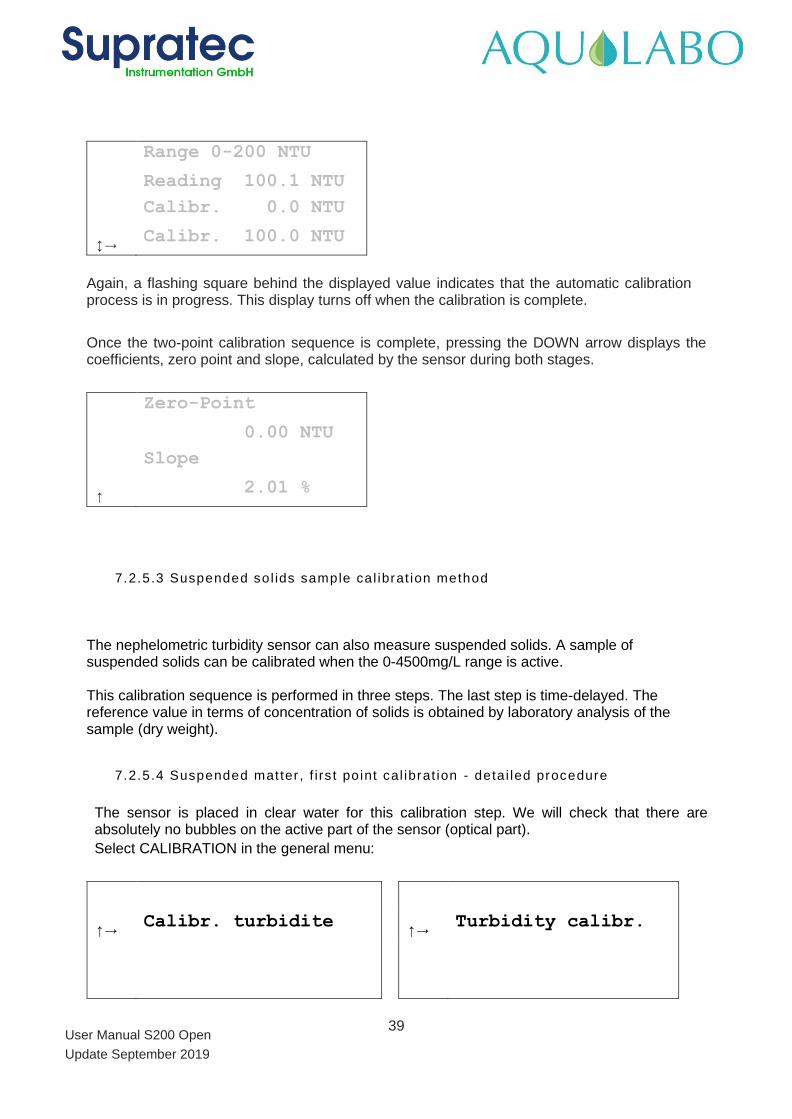
Range 0-200 NTU
Reading 100.1 NTU
Calibr. 0.0 NTU
→ Calibr. 100.0 NTU
Again, a flashing square behind the displayed value indicates that the automatic calibration process is in progress. This display turns off when the calibration is complete.
Once the two-point calibration sequence is complete, pressing the DOWN arrow displays the coefficients, zero point and slope, calculated by the sensor during both stages.
Zero-Point
0.00 NTU
Slope
↑ 2.01 %
7.2.5.3 Suspended sol ids sample cal ibrat ion method
The nephelometric turbidity sensor can also measure suspended solids. A sample of suspended solids can be calibrated when the 0-4500mg/L range is active. This calibration sequence is performed in three steps. The last step is time-delayed. The reference value in terms of concentration of solids is obtained by laboratory analysis of the sample (dry weight).
7.2.5.4 Suspended mat ter , f i rs t point cal ibrat ion - deta i led procedure
The sensor is placed in clear water for this calibration step. We will check that there are absolutely no bubbles on the active part of the sensor (optical part).
Select CALIBRATION in the general menu:
↑→ Calibr. turbidite
↑→ Turbidity calibr.
40
User Manual S200 Open
Update September 2019
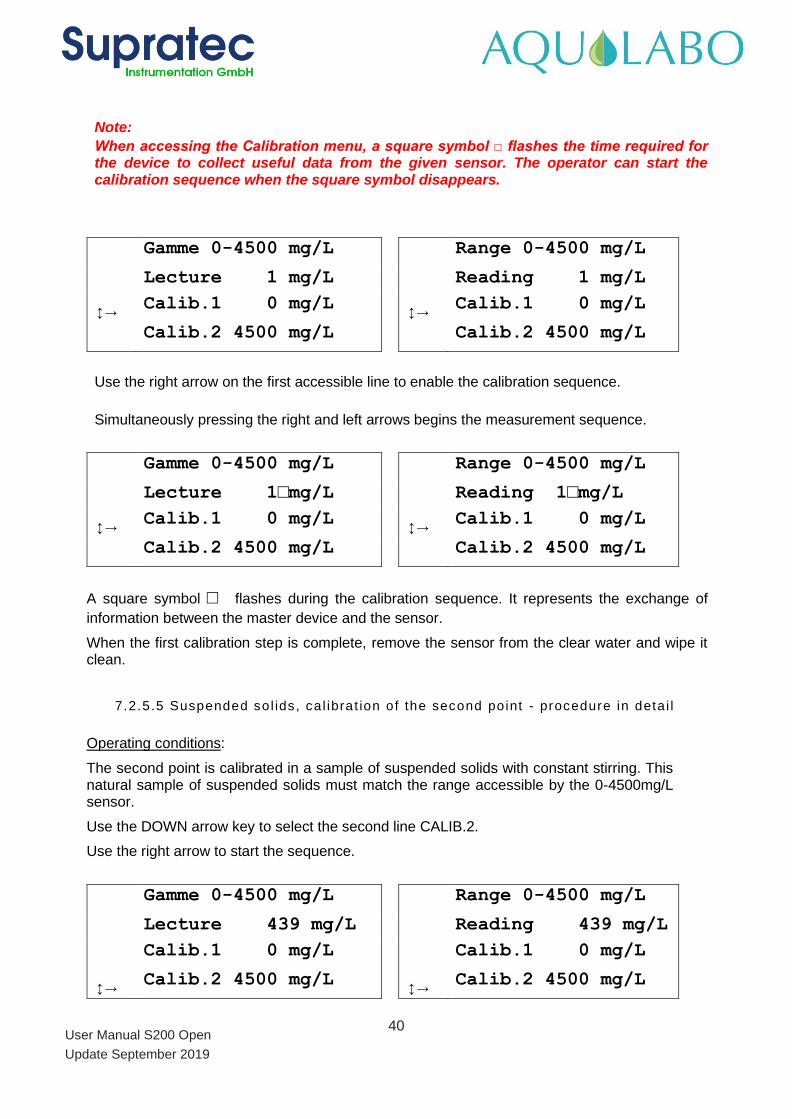
Note:
When accessing the Calibration menu, a square symbol flashes the time required for the device to collect useful data from the given sensor. The operator can start the calibration sequence when the square symbol disappears.
Gamme 0-4500 mg/L
Range 0-4500 mg/L
Lecture 1 mg/L Reading 1 mg/L
→ Calib.1 0 mg/L
→ Calib.1 0 mg/L
Calib.2 4500 mg/L
Calib.2 4500 mg/L
Use the right arrow on the first accessible line to enable the calibration sequence.
Simultaneously pressing the right and left arrows begins the measurement sequence.
Gamme 0-4500 mg/L
Range 0-4500 mg/L
Lecture 1mg/L Reading 1mg/L
→ Calib.1 0 mg/L
→ Calib.1 0 mg/L
Calib.2 4500 mg/L
Calib.2 4500 mg/L
A square symbol flashes during the calibration sequence. It represents the exchange of
information between the master device and the sensor.
When the first calibration step is complete, remove the sensor from the clear water and wipe it clean.
7.2.5.5 Suspended sol ids , ca l ibrat ion of the second point - procedure in deta i l
Operating conditions:
The second point is calibrated in a sample of suspended solids with constant stirring. This natural sample of suspended solids must match the range accessible by the 0-4500mg/L sensor.
Use the DOWN arrow key to select the second line CALIB.2.
Use the right arrow to start the sequence.
Gamme 0-4500 mg/L
Range 0-4500 mg/L
Lecture 439 mg/L Reading 439 mg/L
Calib.1 0 mg/L
Calib.1 0 mg/L
→ Calib.2 4500 mg/L
→ Calib.2 4500 mg/L
41
User Manual S200 Open
Update September 2019
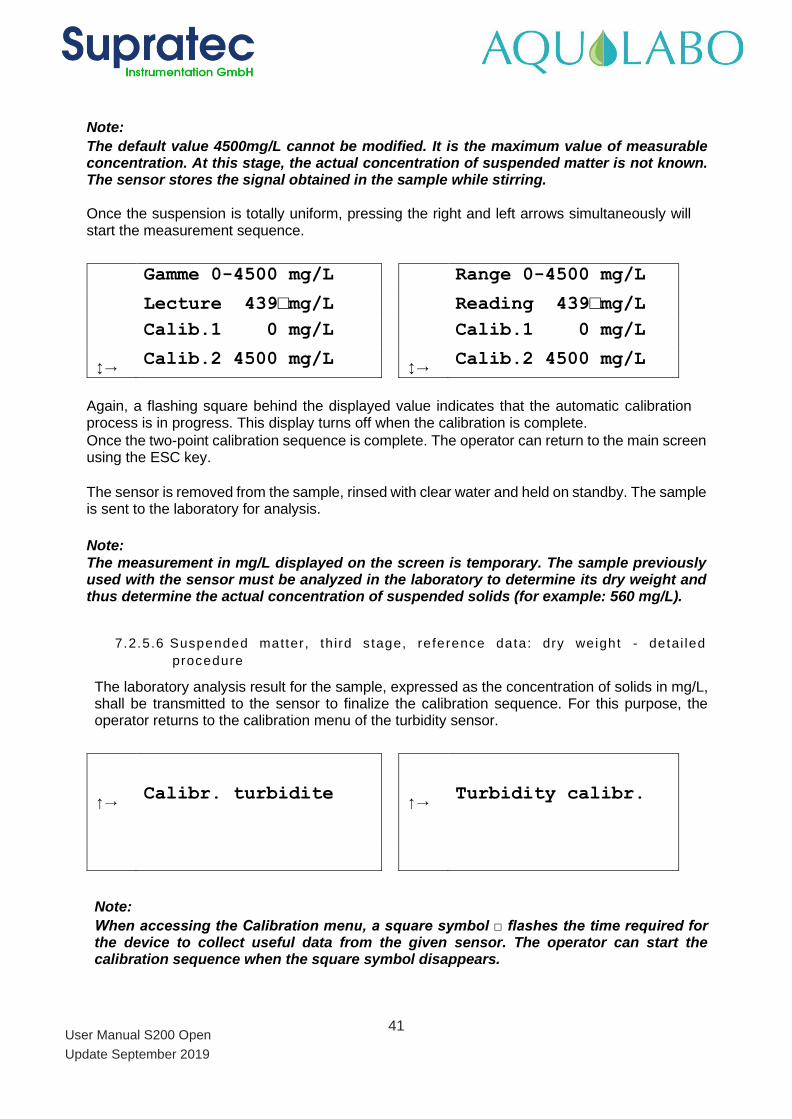
Note:
The default value 4500mg/L cannot be modified. It is the maximum value of measurable concentration. At this stage, the actual concentration of suspended matter is not known. The sensor stores the signal obtained in the sample while stirring. Once the suspension is totally uniform, pressing the right and left arrows simultaneously will start the measurement sequence.
Gamme 0-4500 mg/L
Range 0-4500 mg/L
Lecture 439mg/L Reading 439mg/L
Calib.1 0 mg/L
Calib.1 0 mg/L
→ Calib.2 4500 mg/L
→ Calib.2 4500 mg/L
Again, a flashing square behind the displayed value indicates that the automatic calibration process is in progress. This display turns off when the calibration is complete.
Once the two-point calibration sequence is complete. The operator can return to the main screen using the ESC key.
The sensor is removed from the sample, rinsed with clear water and held on standby. The sample is sent to the laboratory for analysis.
Note:
The measurement in mg/L displayed on the screen is temporary. The sample previously used with the sensor must be analyzed in the laboratory to determine its dry weight and thus determine the actual concentration of suspended solids (for example: 560 mg/L).
7.2.5.6 Suspended matter, th ird s tage, reference data: dry weight - detai led
procedure
The laboratory analysis result for the sample, expressed as the concentration of solids in mg/L, shall be transmitted to the sensor to finalize the calibration sequence. For this purpose, the operator returns to the calibration menu of the turbidity sensor.
↑→ Calibr. turbidite
↑→ Turbidity calibr.
Note:
When accessing the Calibration menu, a square symbol flashes the time required for the device to collect useful data from the given sensor. The operator can start the calibration sequence when the square symbol disappears.
42
User Manual S200 Open
Update September 2019
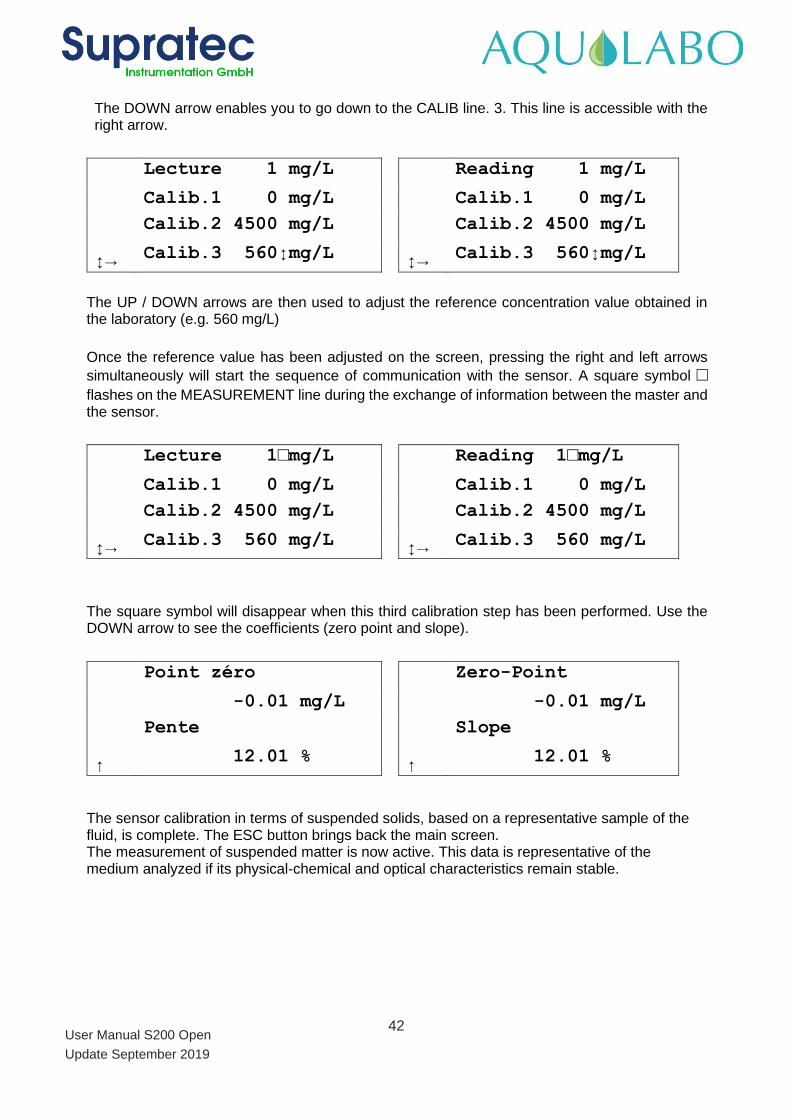
The DOWN arrow enables you to go down to the CALIB line. 3. This line is accessible with the right arrow.
Lecture 1 mg/L
Reading 1 mg/L
Calib.1 0 mg/L Calib.1 0 mg/L
Calib.2 4500 mg/L
Calib.2 4500 mg/L
→ Calib.3 560mg/L
→ Calib.3 560mg/L
The UP / DOWN arrows are then used to adjust the reference concentration value obtained in the laboratory (e.g. 560 mg/L)
Once the reference value has been adjusted on the screen, pressing the right and left arrows
simultaneously will start the sequence of communication with the sensor. A square symbol flashes on the MEASUREMENT line during the exchange of information between the master and the sensor.
Lecture 1mg/L
Reading 1mg/L
Calib.1 0 mg/L Calib.1 0 mg/L
Calib.2 4500 mg/L
Calib.2 4500 mg/L
→ Calib.3 560 mg/L
→ Calib.3 560 mg/L
The square symbol will disappear when this third calibration step has been performed. Use the DOWN arrow to see the coefficients (zero point and slope).
Point zéro
Zero-Point
-0.01 mg/L -0.01 mg/L
Pente
Slope
↑ 12.01 %
↑ 12.01 %
The sensor calibration in terms of suspended solids, based on a representative sample of the fluid, is complete. The ESC button brings back the main screen. The measurement of suspended matter is now active. This data is representative of the medium analyzed if its physical-chemical and optical characteristics remain stable.
43
User Manual S200 Open
Update September 2019
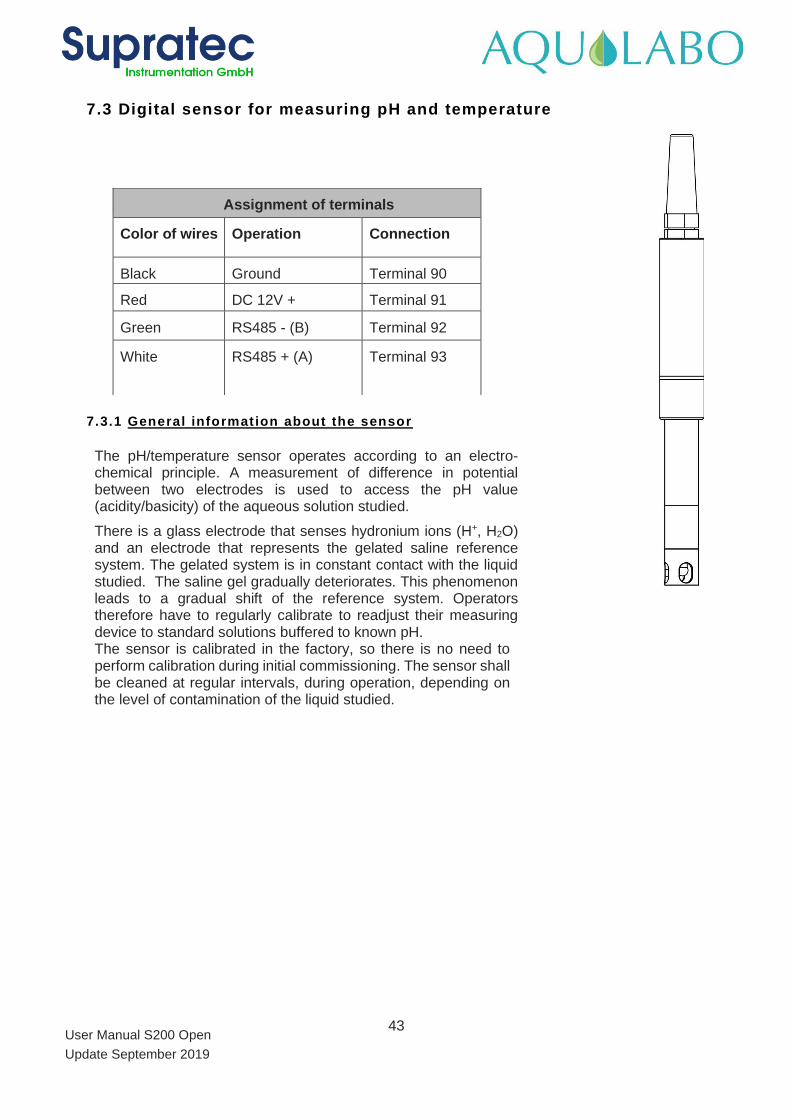
Assignment of terminals
Color of wires Operation Connection
Black Ground Terminal 90
Red DC 12V + Terminal 91
Green RS485 - (B) Terminal 92
White RS485 + (A) Terminal 93
7.3 Digital sensor for measuring pH and temperature
7.3.1 General information about the sensor
The pH/temperature sensor operates according to an electro-chemical principle. A measurement of difference in potential between two electrodes is used to access the pH value (acidity/basicity) of the aqueous solution studied.
There is a glass electrode that senses hydronium ions (H+, H2O) and an electrode that represents the gelated saline reference system. The gelated system is in constant contact with the liquid studied. The saline gel gradually deteriorates. This phenomenon leads to a gradual shift of the reference system. Operators therefore have to regularly calibrate to readjust their measuring device to standard solutions buffered to known pH. The sensor is calibrated in the factory, so there is no need to perform calibration during initial commissioning. The sensor shall be cleaned at regular intervals, during operation, depending on the level of contamination of the liquid studied.
44
User Manual S200 Open
Update September 2019
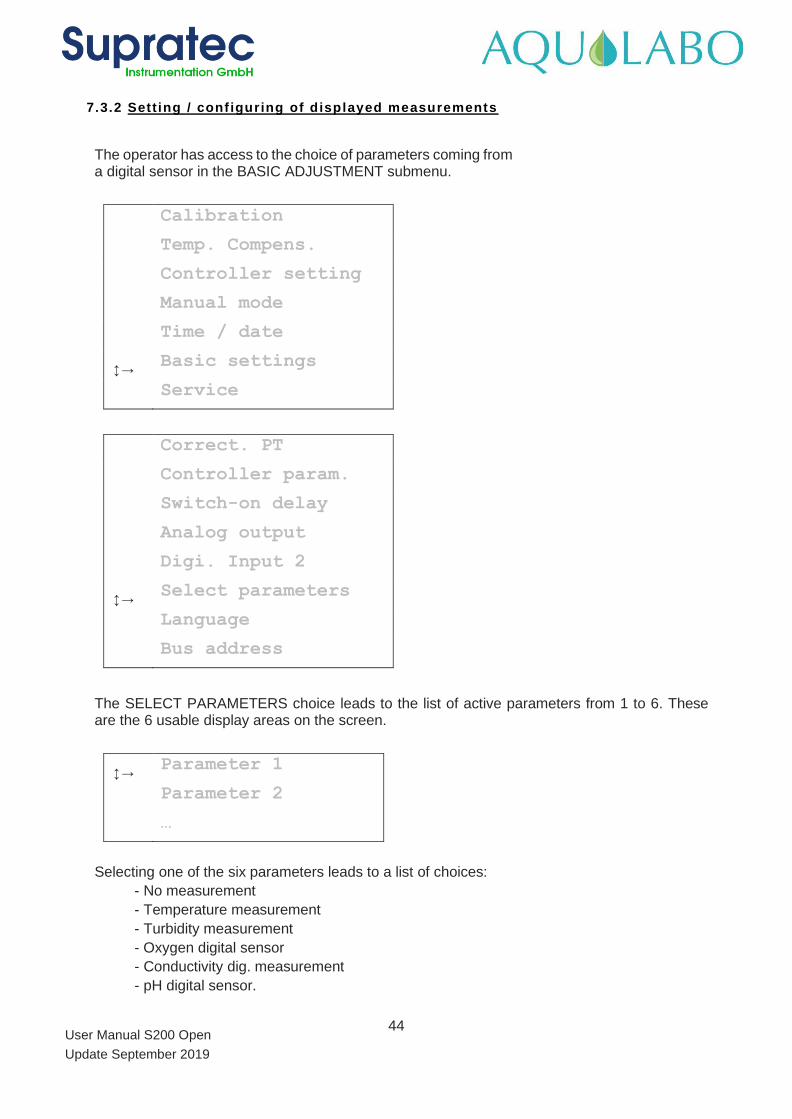
7.3.2 Sett ing / conf iguring of displayed measurements
The operator has access to the choice of parameters coming from a digital sensor in the BASIC ADJUSTMENT submenu.
Calibration
Temp. Compens.
Controller setting
Manual mode
Time / date
→ Basic settings
Service
Correct. PT
Controller param.
Switch-on delay
Analog output
Digi. Input 2
→ Select parameters
Language
Bus address
The SELECT PARAMETERS choice leads to the list of active parameters from 1 to 6. These are the 6 usable display areas on the screen.
→ Parameter 1
Parameter 2
…
Selecting one of the six parameters leads to a list of choices:
- No measurement
- Temperature measurement
- Turbidity measurement
- Oxygen digital sensor
- Conductivity dig. measurement
- pH digital sensor.
45
User Manual S200 Open
Update September 2019
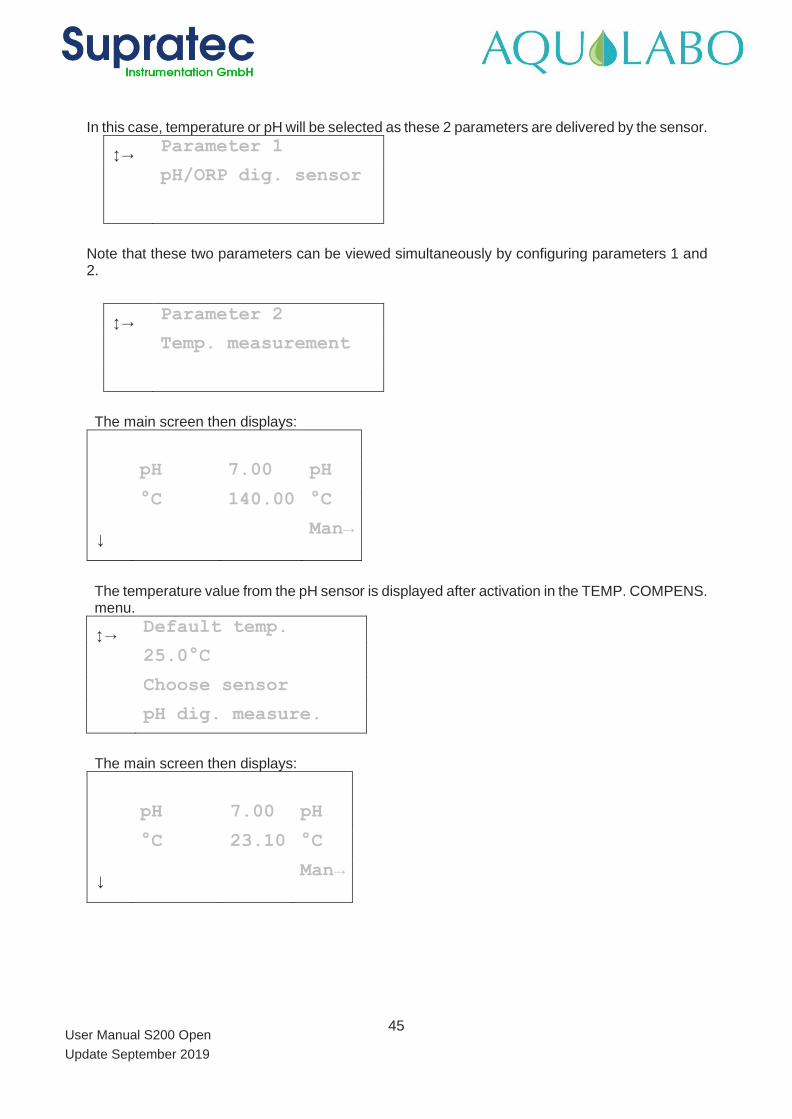
In this case, temperature or pH will be selected as these 2 parameters are delivered by the sensor.
→ Parameter 1
pH/ORP dig. sensor
Note that these two parameters can be viewed simultaneously by configuring parameters 1 and 2.
→ Parameter 2
Temp. measurement
The main screen then displays:
pH 7.00 pH
°C 140.00 °C
↓ Man→
The temperature value from the pH sensor is displayed after activation in the TEMP. COMPENS. menu.
→ Default temp.
25.0°C
Choose sensor
pH dig. measure.
The main screen then displays:
pH 7.00 pH
°C 23.10 °C
↓ Man→
46
User Manual S200 Open
Update September 2019
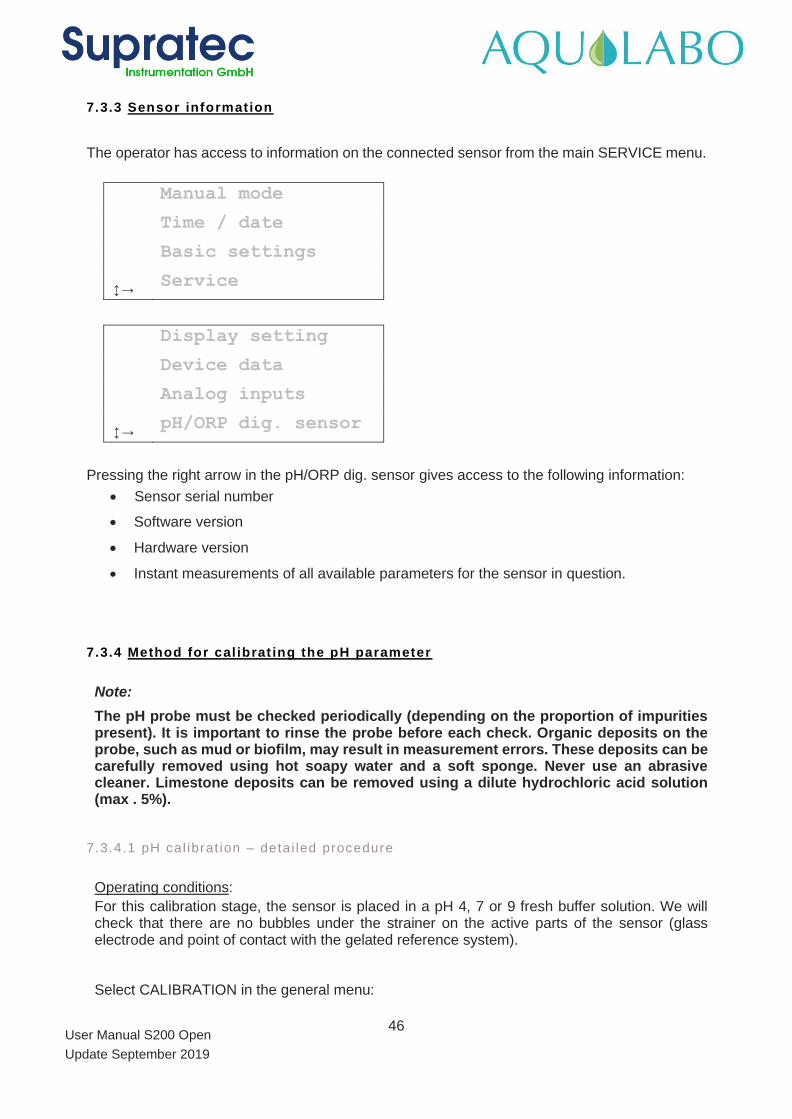
7.3.3 Sensor information
The operator has access to information on the connected sensor from the main SERVICE menu.
Manual mode
Time / date
Basic settings
→ Service
Display setting
Device data
Analog inputs
→ pH/ORP dig. sensor
Pressing the right arrow in the pH/ORP dig. sensor gives access to the following information:
• Sensor serial number
• Software version
• Hardware version
• Instant measurements of all available parameters for the sensor in question.
7.3.4 Method for cal ibrat ing the pH parameter
Note:
The pH probe must be checked periodically (depending on the proportion of impurities present). It is important to rinse the probe before each check. Organic deposits on the probe, such as mud or biofilm, may result in measurement errors. These deposits can be carefully removed using hot soapy water and a soft sponge. Never use an abrasive cleaner. Limestone deposits can be removed using a dilute hydrochloric acid solution (max . 5%).
7.3.4.1 pH cal ibrat ion – deta i led procedure
Operating conditions:
For this calibration stage, the sensor is placed in a pH 4, 7 or 9 fresh buffer solution. We will check that there are no bubbles under the strainer on the active parts of the sensor (glass electrode and point of contact with the gelated reference system).
Select CALIBRATION in the general menu:
47
User Manual S200 Open
Update September 2019
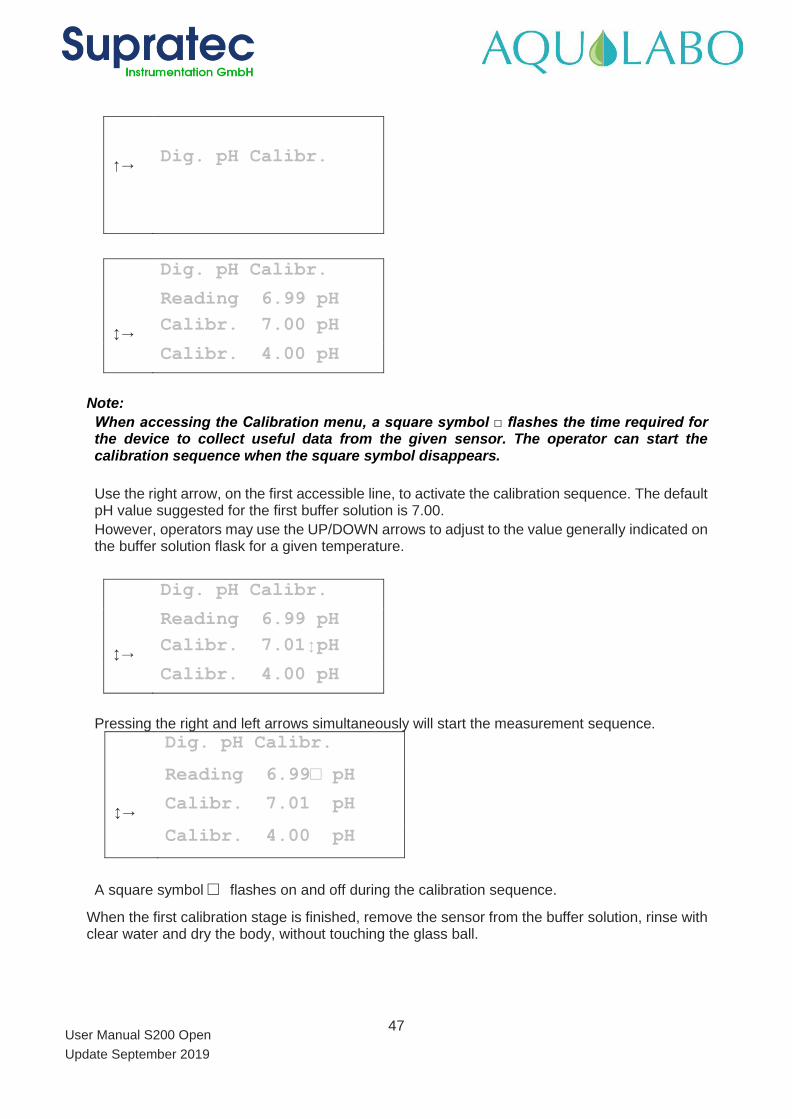
↑→ Dig. pH Calibr.
Dig. pH Calibr.
Reading 6.99 pH
→ Calibr. 7.00 pH
Calibr. 4.00 pH
Note:
When accessing the Calibration menu, a square symbol flashes the time required for the device to collect useful data from the given sensor. The operator can start the calibration sequence when the square symbol disappears.
Use the right arrow, on the first accessible line, to activate the calibration sequence. The default pH value suggested for the first buffer solution is 7.00.
However, operators may use the UP/DOWN arrows to adjust to the value generally indicated on the buffer solution flask for a given temperature.
Dig. pH Calibr.
Reading 6.99 pH
→ Calibr. 7.01pH
Calibr. 4.00 pH
Pressing the right and left arrows simultaneously will start the measurement sequence.
Dig. pH Calibr.
Reading 6.99 pH
→ Calibr. 7.01 pH
Calibr. 4.00 pH
A square symbol flashes on and off during the calibration sequence.
When the first calibration stage is finished, remove the sensor from the buffer solution, rinse with clear water and dry the body, without touching the glass ball.
48
User Manual S200 Open
Update September 2019
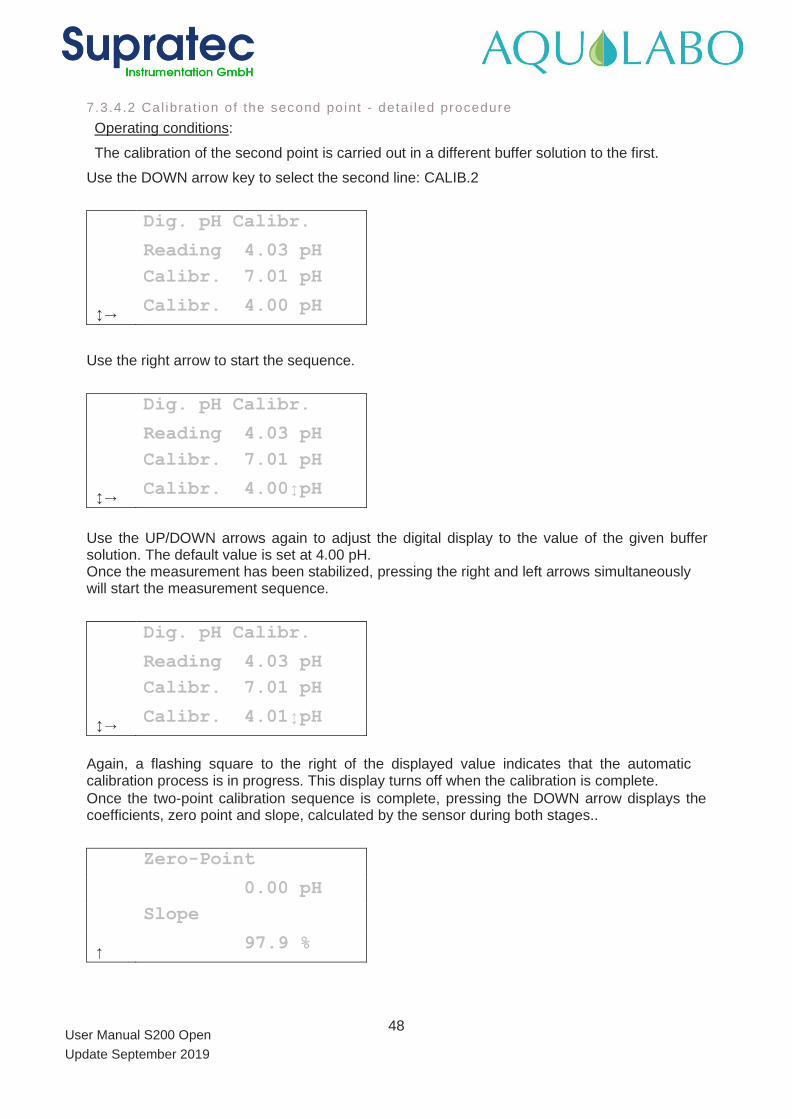
7.3.4.2 Cal ibrat ion of the second point - deta i led procedure
Operating conditions:
The calibration of the second point is carried out in a different buffer solution to the first.
Use the DOWN arrow key to select the second line: CALIB.2
Dig. pH Calibr.
Reading 4.03 pH
Calibr. 7.01 pH
→ Calibr. 4.00 pH
Use the right arrow to start the sequence.
Dig. pH Calibr.
Reading 4.03 pH
Calibr. 7.01 pH
→ Calibr. 4.00pH
Use the UP/DOWN arrows again to adjust the digital display to the value of the given buffer solution. The default value is set at 4.00 pH. Once the measurement has been stabilized, pressing the right and left arrows simultaneously will start the measurement sequence.
Dig. pH Calibr.
Reading 4.03 pH
Calibr. 7.01 pH
→ Calibr. 4.01pH
Again, a flashing square to the right of the displayed value indicates that the automatic calibration process is in progress. This display turns off when the calibration is complete.
Once the two-point calibration sequence is complete, pressing the DOWN arrow displays the coefficients, zero point and slope, calculated by the sensor during both stages..
Zero-Point
0.00 pH
Slope
↑ 97.9 %
49
User Manual S200 Open
Update September 2019
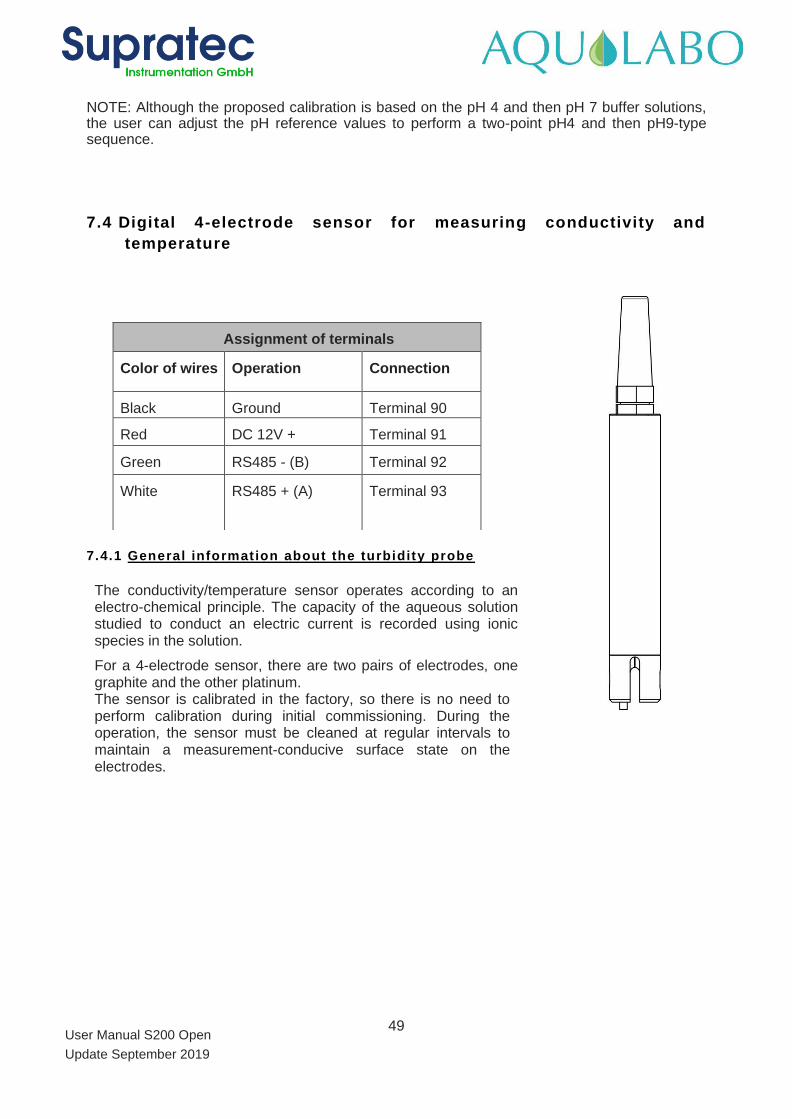
Assignment of terminals
Color of wires Operation Connection
Black Ground Terminal 90
Red DC 12V + Terminal 91
Green RS485 - (B) Terminal 92
White RS485 + (A) Terminal 93
NOTE: Although the proposed calibration is based on the pH 4 and then pH 7 buffer solutions, the user can adjust the pH reference values to perform a two-point pH4 and then pH9-type sequence.
7.4 Digital 4-electrode sensor for measuring conductivity and
temperature
7.4.1 General information about the turbidity probe
The conductivity/temperature sensor operates according to an electro-chemical principle. The capacity of the aqueous solution studied to conduct an electric current is recorded using ionic species in the solution.
For a 4-electrode sensor, there are two pairs of electrodes, one graphite and the other platinum. The sensor is calibrated in the factory, so there is no need to perform calibration during initial commissioning. During the operation, the sensor must be cleaned at regular intervals to maintain a measurement-conducive surface state on the electrodes.
50
User Manual S200 Open
Update September 2019
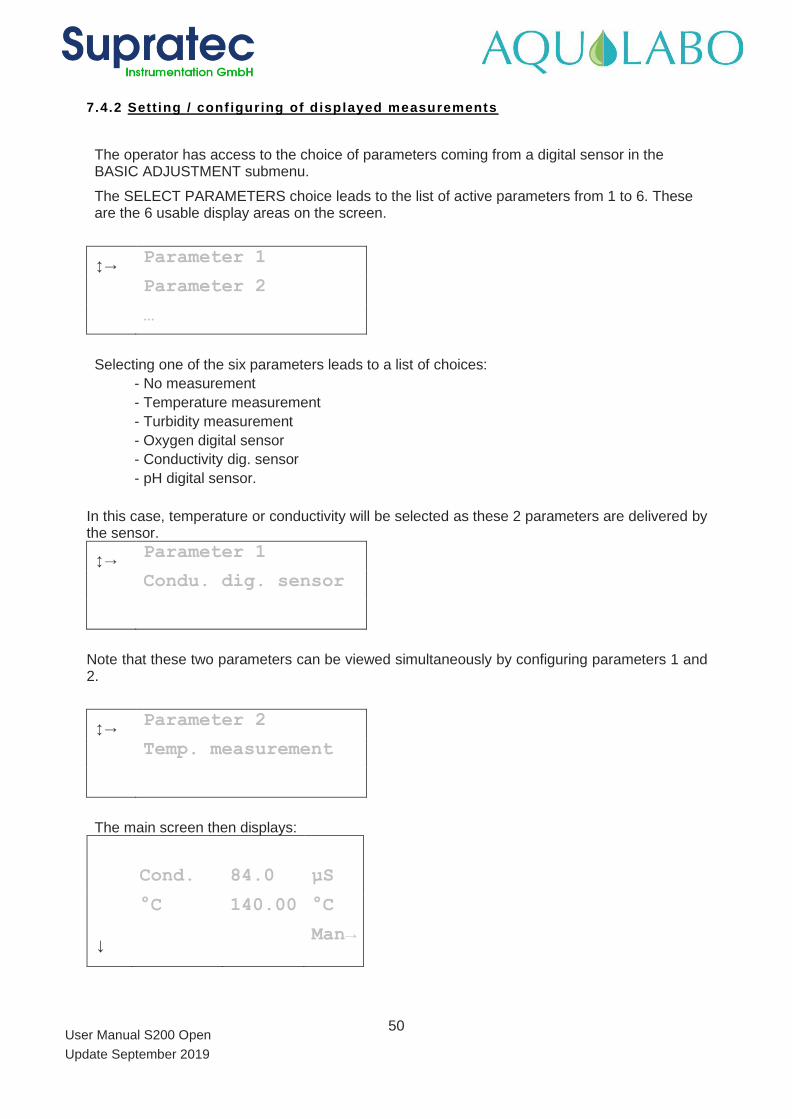
7.4.2 Sett ing / conf iguring of displayed measurements
The operator has access to the choice of parameters coming from a digital sensor in the BASIC ADJUSTMENT submenu.
The SELECT PARAMETERS choice leads to the list of active parameters from 1 to 6. These are the 6 usable display areas on the screen.
→ Parameter 1
Parameter 2
…
Selecting one of the six parameters leads to a list of choices:
- No measurement
- Temperature measurement
- Turbidity measurement
- Oxygen digital sensor
- Conductivity dig. sensor
- pH digital sensor.
In this case, temperature or conductivity will be selected as these 2 parameters are delivered by the sensor.
→ Parameter 1
Condu. dig. sensor
Note that these two parameters can be viewed simultaneously by configuring parameters 1 and 2.
→ Parameter 2
Temp. measurement
The main screen then displays:
Cond. 84.0 µS
°C 140.00 °C
↓ Man→
51
User Manual S200 Open
Update September 2019
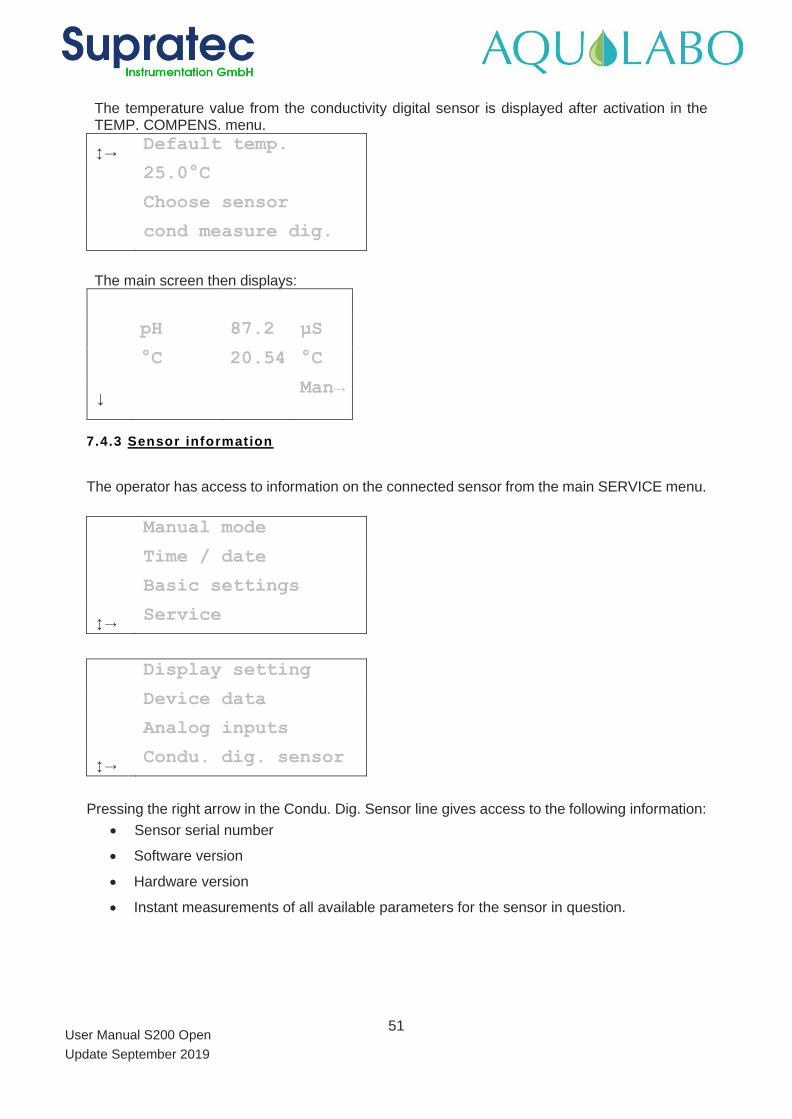
The temperature value from the conductivity digital sensor is displayed after activation in the TEMP. COMPENS. menu.
→ Default temp.
25.0°C
Choose sensor
cond measure dig.
The main screen then displays:
pH 87.2 µS
°C 20.54 °C
↓ Man→
7.4.3 Sensor information
The operator has access to information on the connected sensor from the main SERVICE menu.
Manual mode
Time / date
Basic settings
→ Service
Display setting
Device data
Analog inputs
→ Condu. dig. sensor
Pressing the right arrow in the Condu. Dig. Sensor line gives access to the following information:
• Sensor serial number
• Software version
• Hardware version
• Instant measurements of all available parameters for the sensor in question.
52
User Manual S200 Open
Update September 2019
7.4.4 Selecting the displayed parameter, conductivi ty/salinity/TDS-KCl
The 4-electrode conductivity sensor not only delivers conductivity and temperature but also offers
two parameters deduced from the conductivity: salinity (unit: g/kg) and dissolved salt
concentration expressed as potassium chloride TDS-KCl (unit: ppm).
The user can choose to view one of these 3 parameters (conductivity, salinity, or TDS-KCl). This
is selected from the sub-menu of the digital conductivity sensor accessible in the BASIC
SETTING/DIGITAL CONDUC. SENSOR menu.
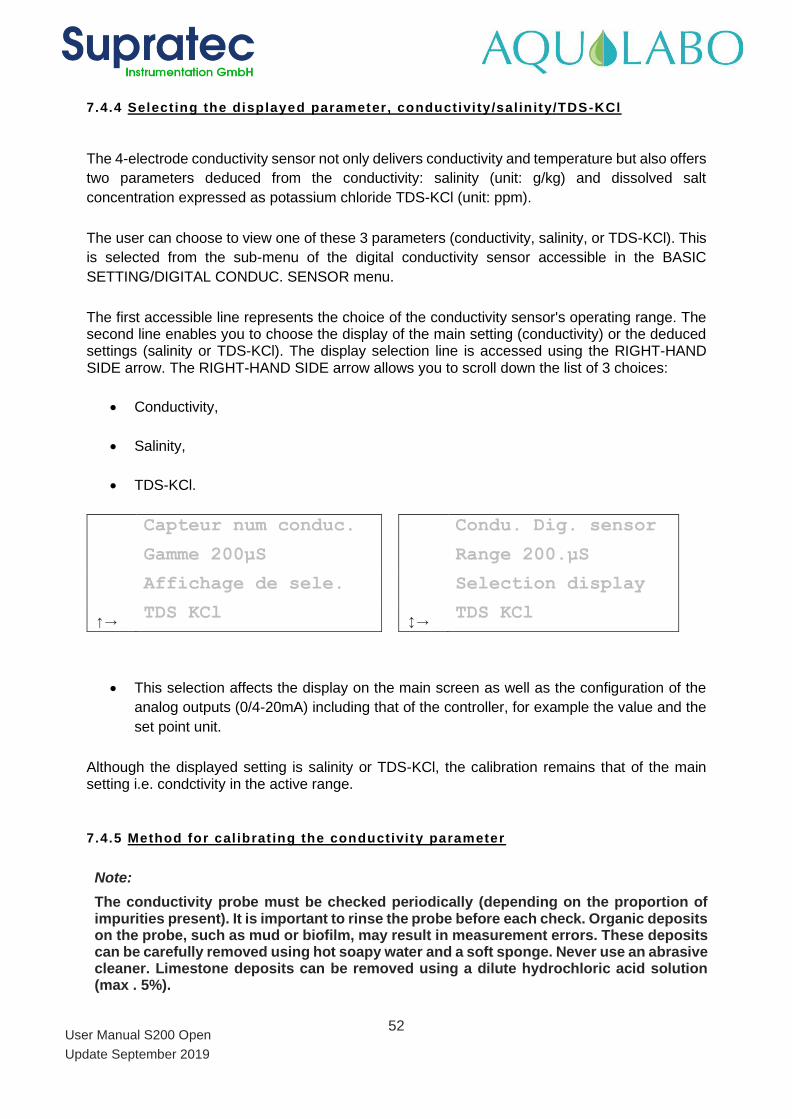
The first accessible line represents the choice of the conductivity sensor's operating range. The second line enables you to choose the display of the main setting (conductivity) or the deduced settings (salinity or TDS-KCl). The display selection line is accessed using the RIGHT-HAND SIDE arrow. The RIGHT-HAND SIDE arrow allows you to scroll down the list of 3 choices:
• Conductivity,
• Salinity,
• TDS-KCl.
Capteur num conduc.
Condu. Dig. sensor
Gamme 200µS
Range 200.µS
Affichage de sele.
Selection display
↑→ TDS KCl
→ TDS KCl
• This selection affects the display on the main screen as well as the configuration of the
analog outputs (0/4-20mA) including that of the controller, for example the value and the
set point unit.
Although the displayed setting is salinity or TDS-KCl, the calibration remains that of the main setting i.e. condctivity in the active range.
7.4.5 Method for cal ibrat ing the conductivity parameter
Note:
The conductivity probe must be checked periodically (depending on the proportion of impurities present). It is important to rinse the probe before each check. Organic deposits on the probe, such as mud or biofilm, may result in measurement errors. These deposits can be carefully removed using hot soapy water and a soft sponge. Never use an abrasive cleaner. Limestone deposits can be removed using a dilute hydrochloric acid solution (max . 5%).
53
User Manual S200 Open
Update September 2019
7.4.5.1 Conduct iv i ty cal ibrat ion – deta i led procedure
Definition of the active range:
The conductivity sensor has four working ranges that allow you to better tailor the conductivity expected in the observed fluid.
Ranges available:
0 - 200 µS/cm (default active range)
0 - 2000 µS/cm
0 - 20 mS/cm
0 - 200 mS/cm
Each range has its own set of coefficients. The calibration is thus performed for the active range.
The range is chosen from the four available in the submenu: BASE/CONDU. DIG. SENSOR SETTING The range line is accessed using the right-hand side arrow. This same arrow is used to scroll through the ranges.
Operating conditions:
The calibration of a conductivity range is performed in two stages. Potassium chloride (KCl) standard aqueous solutions are used.
The total lack of bubbles in the active parts in the sensor's head slot will be checked.
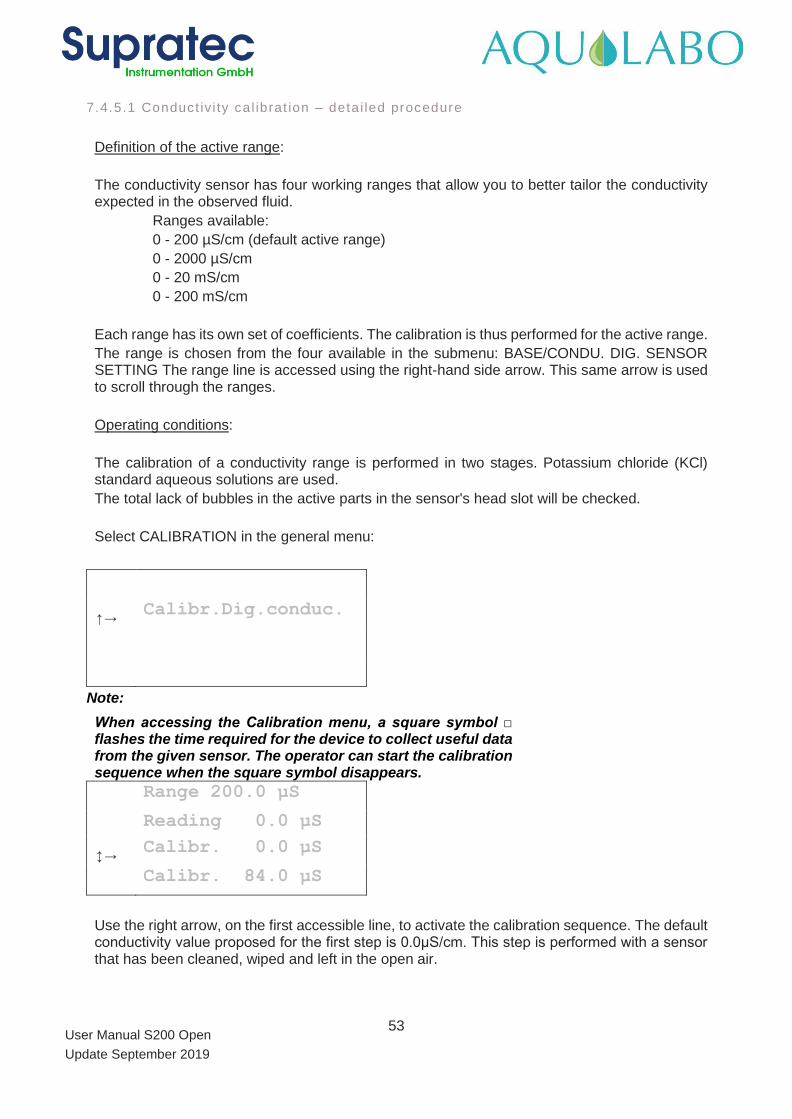
Select CALIBRATION in the general menu:
↑→ Calibr.Dig.conduc.
Note:
When accessing the Calibration menu, a square symbol flashes the time required for the device to collect useful data from the given sensor. The operator can start the calibration sequence when the square symbol disappears.
Range 200.0 µS
Reading 0.0 µS
→ Calibr. 0.0 µS
Calibr. 84.0 µS
Use the right arrow, on the first accessible line, to activate the calibration sequence. The default conductivity value proposed for the first step is 0.0μS/cm. This step is performed with a sensor that has been cleaned, wiped and left in the open air.
54
User Manual S200 Open
Update September 2019
Range 200.0 µS
Reading 0.0 µS
→ Calibr. 0.0 µS
Calibr. 84.0 µS
Pressing the right and left arrows simultaneously will start the measurement sequence.
Range 200.0 µS
Reading 0.1 µS
→ Calibr. 0.0 µS
Calibr. 84.0 µS
A square symbol flashes on and off during the calibration sequence. When the first calibration
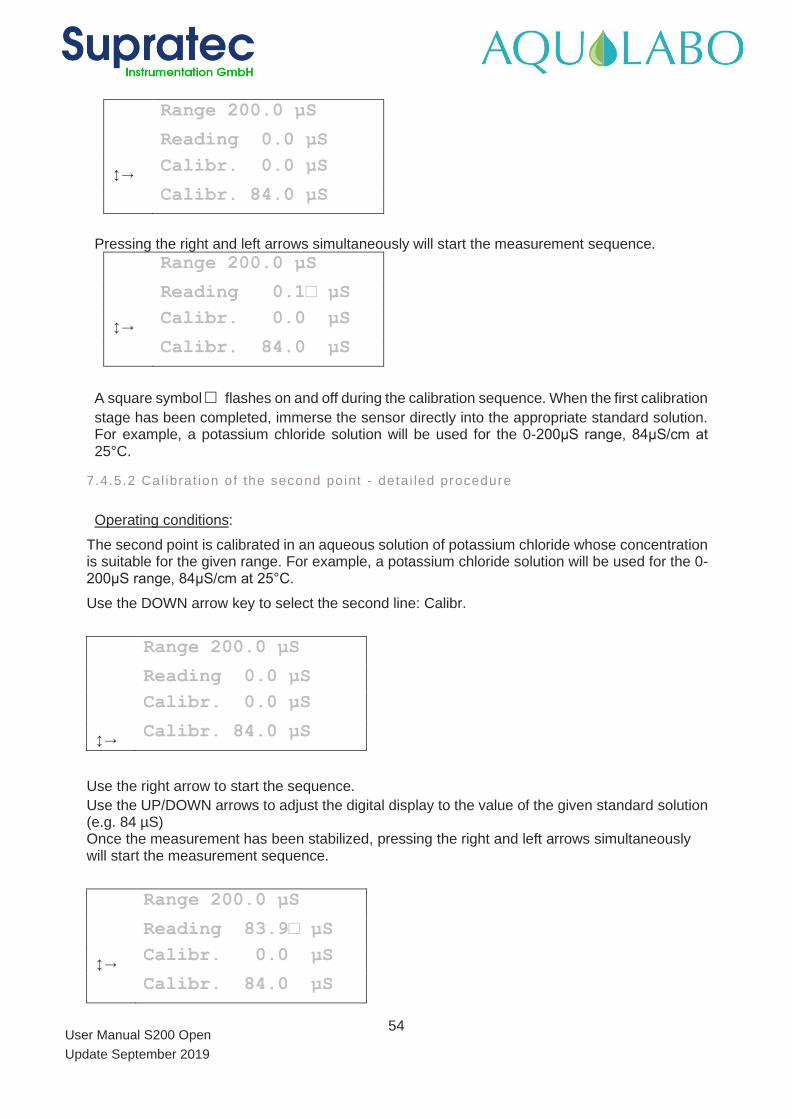
stage has been completed, immerse the sensor directly into the appropriate standard solution. For example, a potassium chloride solution will be used for the 0-200μS range, 84μS/cm at 25°C.
7.4.5.2 Cal ibrat ion of the second point - deta i led procedure
Operating conditions:
The second point is calibrated in an aqueous solution of potassium chloride whose concentration is suitable for the given range. For example, a potassium chloride solution will be used for the 0-200μS range, 84μS/cm at 25°C.
Use the DOWN arrow key to select the second line: Calibr.
Range 200.0 µS
Reading 0.0 µS
Calibr. 0.0 µS
→ Calibr. 84.0 µS
Use the right arrow to start the sequence.
Use the UP/DOWN arrows to adjust the digital display to the value of the given standard solution (e.g. 84 µS) Once the measurement has been stabilized, pressing the right and left arrows simultaneously will start the measurement sequence.
Range 200.0 µS
Reading 83.9 µS
→ Calibr. 0.0 µS
Calibr. 84.0 µS

55
User Manual S200 Open
Update September 2019
Again, a flashing square to the right of the displayed value indicates that the automatic calibration process is in progress. This display turns off when the calibration is complete.
Once the two-point calibration sequence is complete, pressing the DOWN arrow displays the coefficients, zero point and slope, calculated by the sensor during both stages..
Zero-Point
0 µS
Slope
↑ -1.9 %
56
User Manual S200 Open
Update September 2019
Assignment of terminals
Color of wires Operation Connection
Black Ground Terminal 90
Red DC 12V + Terminal 91
Green RS485 - (B) Terminal 92
White RS485 + (A) Terminal 93
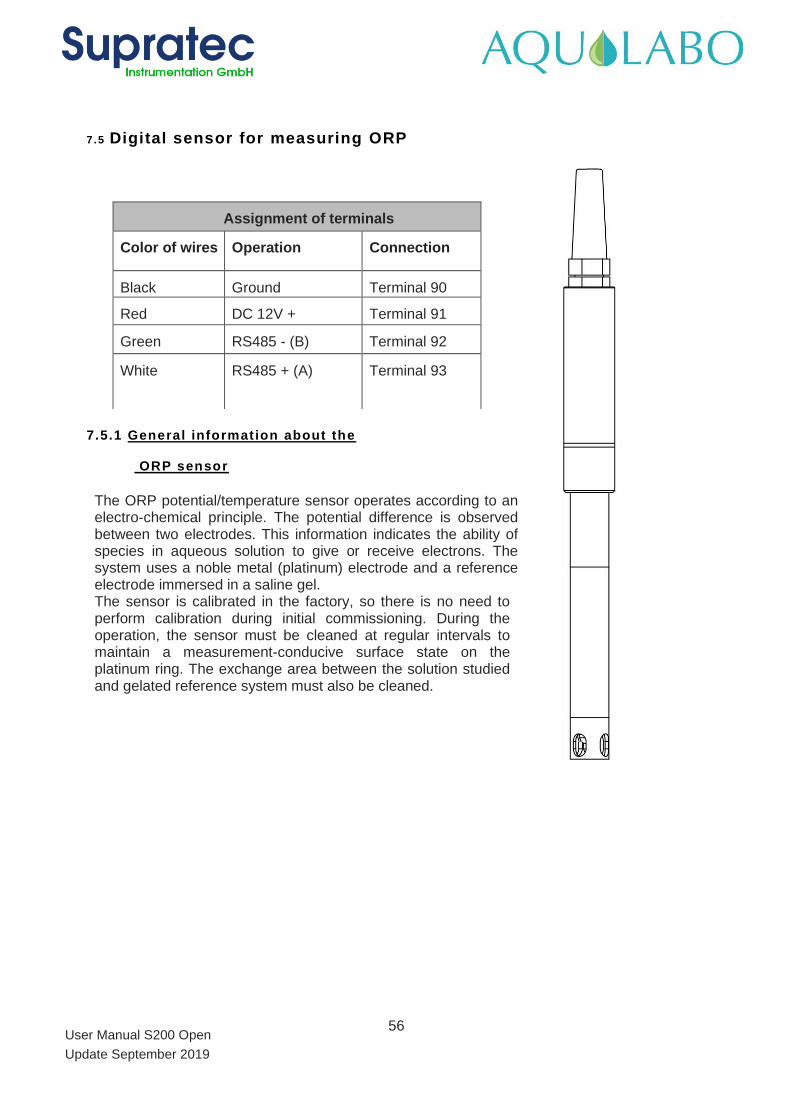
7.5 Digital sensor for measuring ORP
7.5.1 General information about the
ORP sensor
The ORP potential/temperature sensor operates according to an electro-chemical principle. The potential difference is observed between two electrodes. This information indicates the ability of species in aqueous solution to give or receive electrons. The system uses a noble metal (platinum) electrode and a reference electrode immersed in a saline gel. The sensor is calibrated in the factory, so there is no need to perform calibration during initial commissioning. During the operation, the sensor must be cleaned at regular intervals to maintain a measurement-conducive surface state on the platinum ring. The exchange area between the solution studied and gelated reference system must also be cleaned.
57
User Manual S200 Open
Update September 2019
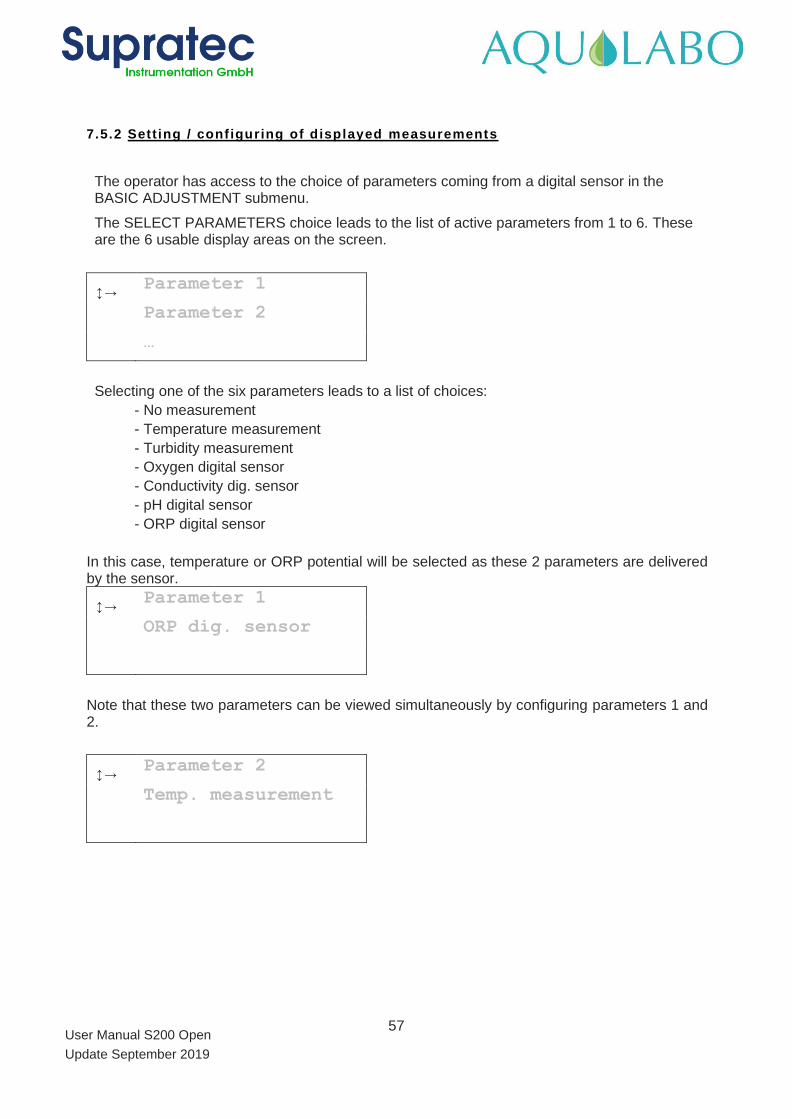
7.5.2 Sett ing / conf iguring of displayed measurements
The operator has access to the choice of parameters coming from a digital sensor in the BASIC ADJUSTMENT submenu.
The SELECT PARAMETERS choice leads to the list of active parameters from 1 to 6. These are the 6 usable display areas on the screen.
→ Parameter 1
Parameter 2
…
Selecting one of the six parameters leads to a list of choices:
- No measurement
- Temperature measurement
- Turbidity measurement
- Oxygen digital sensor
- Conductivity dig. sensor
- pH digital sensor
- ORP digital sensor
In this case, temperature or ORP potential will be selected as these 2 parameters are delivered by the sensor.
→ Parameter 1
ORP dig. sensor
Note that these two parameters can be viewed simultaneously by configuring parameters 1 and 2.
→ Parameter 2
Temp. measurement
58
User Manual S200 Open
Update September 2019
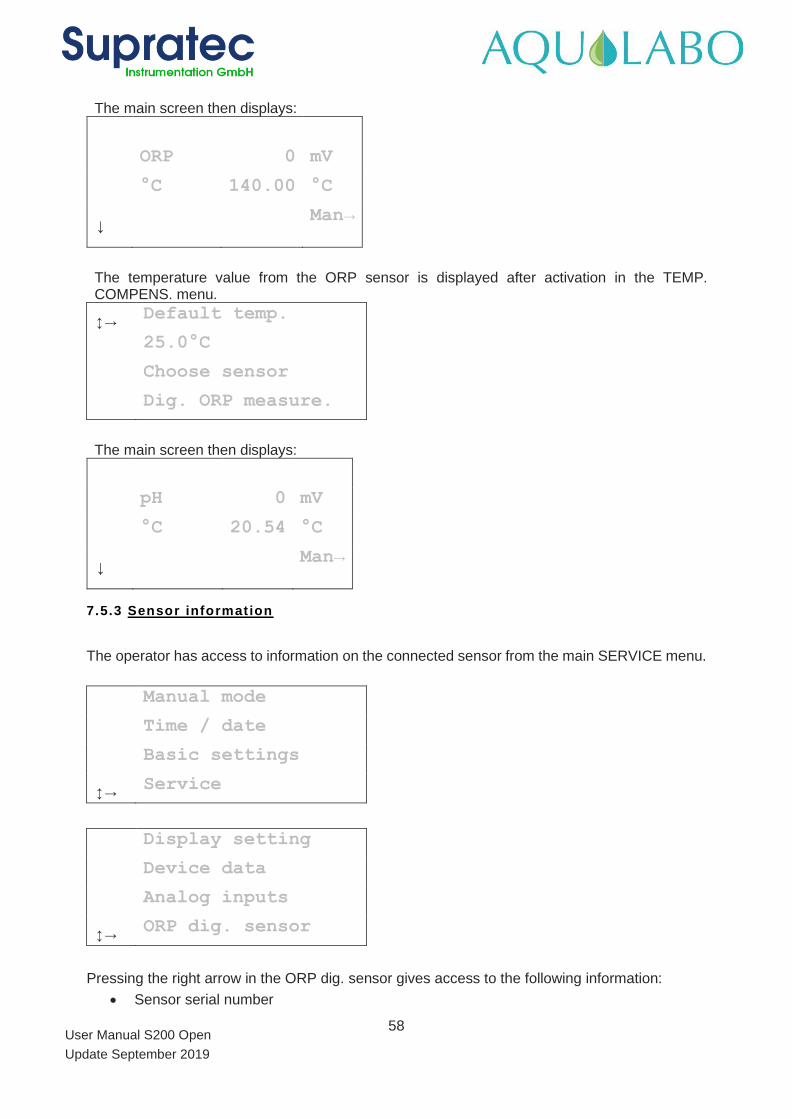
The main screen then displays:
ORP 0 mV
°C 140.00 °C
↓ Man→
The temperature value from the ORP sensor is displayed after activation in the TEMP. COMPENS. menu.
→ Default temp.
25.0°C
Choose sensor
Dig. ORP measure.
The main screen then displays:
pH 0 mV
°C 20.54 °C
↓ Man→
7.5.3 Sensor information
The operator has access to information on the connected sensor from the main SERVICE menu.
Manual mode
Time / date
Basic settings
→ Service
Display setting
Device data
Analog inputs
→ ORP dig. sensor
Pressing the right arrow in the ORP dig. sensor gives access to the following information:
• Sensor serial number
59
User Manual S200 Open
Update September 2019
• Software version
• Hardware version
• Instant measurements of all available parameters for the sensor in question.
7.5.4 Method for cal ibrat ing the ORP parameter
Note:
The ORP sensor must be checked periodically (depending on the proportion of impurities present). It is important to rinse the probe before each check. Organic deposits on the probe, such as mud or biofilm, may result in measurement errors. These deposits can be carefully removed using hot soapy water and a soft sponge. Never use an abrasive cleaner. Limestone deposits can be removed using a dilute hydrochloric acid solution (max . 5%).
7.5.4.1 Conduct iv i ty cal ibrat ion – deta i led procedure
Operating conditions:
ORP potential is calibrated in two stages. For this purpose, a specific aqueous standard will be used.
The total lack of bubbles in the active parts located under the sensor's head strainer will be checked. The operator can unscrew this strainer during equipment maintenance operations.
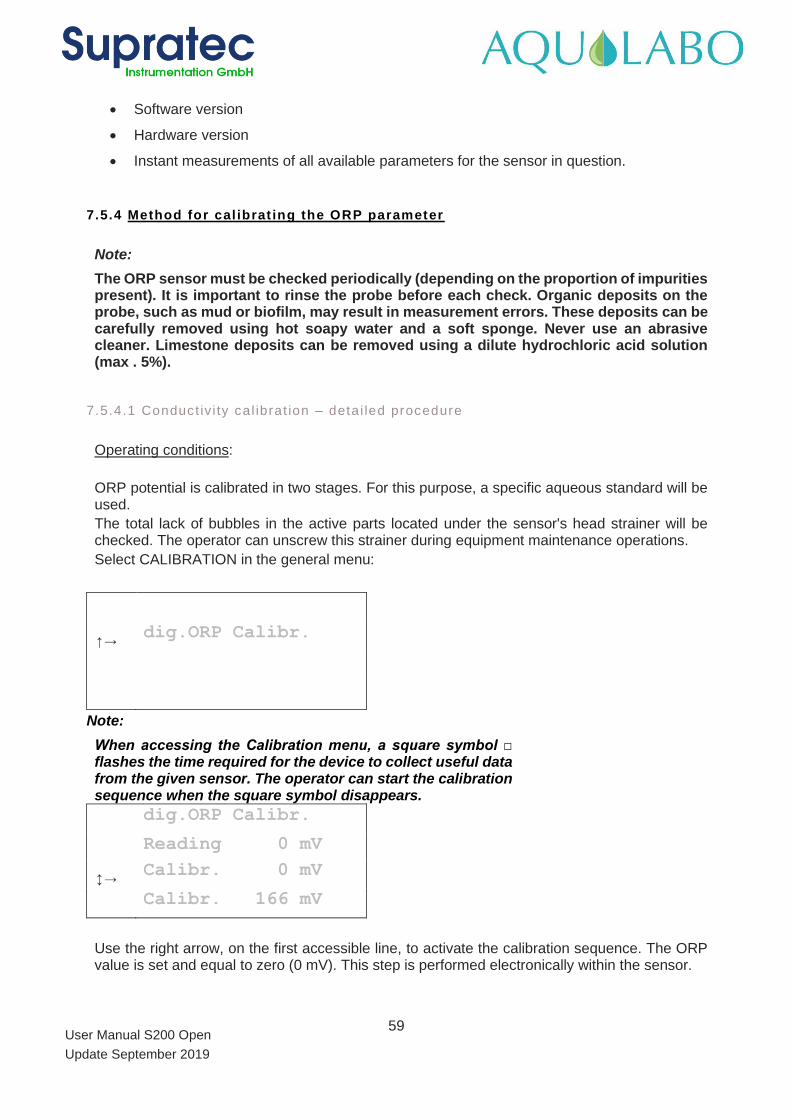
Select CALIBRATION in the general menu:
↑→ dig.ORP Calibr.
Note:
When accessing the Calibration menu, a square symbol flashes the time required for the device to collect useful data from the given sensor. The operator can start the calibration sequence when the square symbol disappears.
dig.ORP Calibr.
Reading 0 mV
→ Calibr. 0 mV
Calibr. 166 mV
Use the right arrow, on the first accessible line, to activate the calibration sequence. The ORP value is set and equal to zero (0 mV). This step is performed electronically within the sensor.
60
User Manual S200 Open
Update September 2019
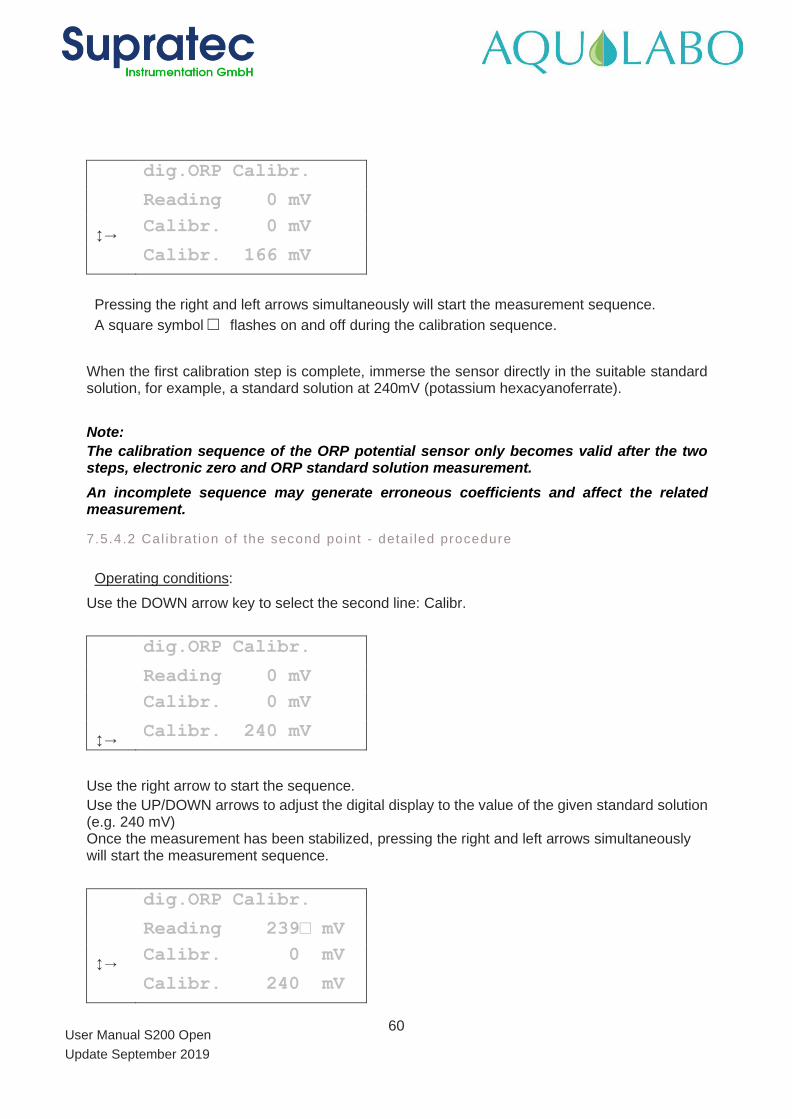
dig.ORP Calibr.
Reading 0 mV
→ Calibr. 0 mV
Calibr. 166 mV
Pressing the right and left arrows simultaneously will start the measurement sequence.
A square symbol flashes on and off during the calibration sequence.
When the first calibration step is complete, immerse the sensor directly in the suitable standard solution, for example, a standard solution at 240mV (potassium hexacyanoferrate).
Note:
The calibration sequence of the ORP potential sensor only becomes valid after the two steps, electronic zero and ORP standard solution measurement.
An incomplete sequence may generate erroneous coefficients and affect the related measurement.
7.5.4.2 Cal ibrat ion of the second point - deta i led procedure
Operating conditions:
Use the DOWN arrow key to select the second line: Calibr.
dig.ORP Calibr.
Reading 0 mV
Calibr. 0 mV
→ Calibr. 240 mV
Use the right arrow to start the sequence.
Use the UP/DOWN arrows to adjust the digital display to the value of the given standard solution (e.g. 240 mV) Once the measurement has been stabilized, pressing the right and left arrows simultaneously will start the measurement sequence.
dig.ORP Calibr.
Reading 239 mV
→ Calibr. 0 mV
Calibr. 240 mV
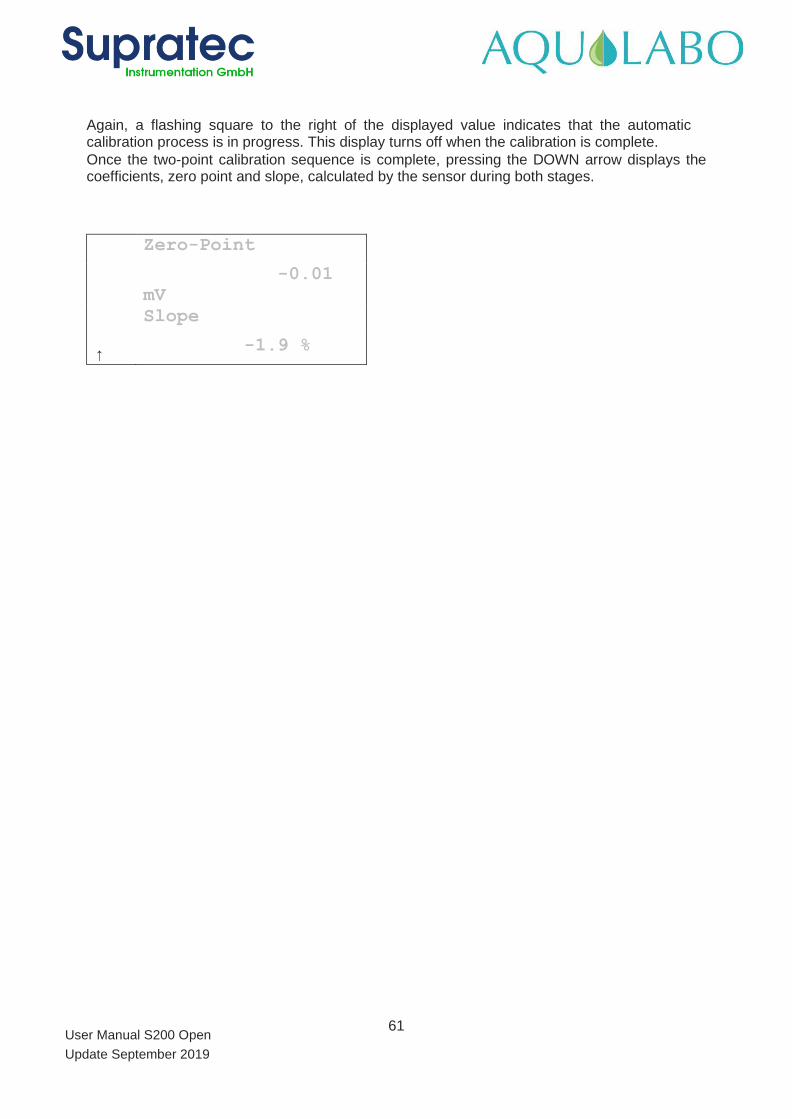
61
User Manual S200 Open
Update September 2019
Again, a flashing square to the right of the displayed value indicates that the automatic calibration process is in progress. This display turns off when the calibration is complete.
Once the two-point calibration sequence is complete, pressing the DOWN arrow displays the coefficients, zero point and slope, calculated by the sensor during both stages.
Zero-Point
-0.01
mV
Slope
↑ -1.9 %

62
User Manual S200 Open
Update September 2019
Allocation of terminals
Wire color Operation Connector
Black Ground Terminal 90
Red DC 12V + Terminal 91
Green RS485 - (B) Terminal 92
White RS485 + (A) Terminal 93
7.6 Digital sensor for measuring suspended solids, turbidity and sludge blanket
7.6.1 General information about the suspended
sol ids sensor
7.6.1.1 General informat ion on the sensor:
This optical sensor measures the infra-red radiation transmitted through the liquid studied. An optical path of 5mm is set by the geometry of the measuring zone and fork-shaped sensor head.
7.6.1.2 Sludge b lanket measurement :
The infra-red radiation optical sensor delivers a signal as a percentage (range 0-100%) so that the value delivered decreases from a 100% transmission in clear water.
7.6.1.3 Measurement of turb id ity under attenuat ion (FAU
uni t) :
The optical sensor measures the transmission of light, 180° compared to the infra-red light source. Turbidity is measured using an aqueous suspension of formazin as standard. The measurement range is 0-4000 FAU.
7.6.1.4 Measurement of suspended sol ids
The sensor delivers a concentration of suspended solids, unit G/L, based on two points of measures. A solution devoid of suspended matter "Clear water" and an actual sample of loaded fluid. The concentration of solids in this sample is determined in the laboratory (dry weight).
The sensor is calibrated at the factory for all available parameters (temperature, sludge blanket, turbidity, suspended solids), so there is no need to perform a calibration during its initial commissioning. When in operation, the sensor must be cleaned at regular intervals in order to keep the surface of the optical glass in a condition conducive to measuring.
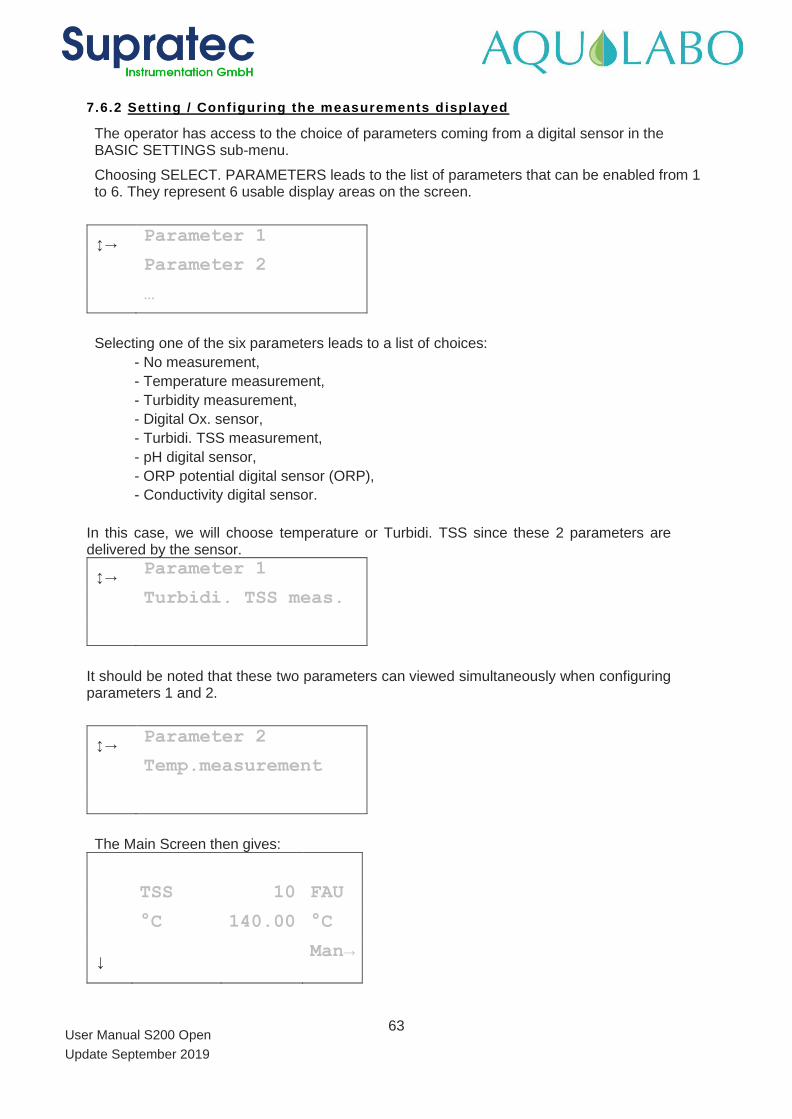
63
User Manual S200 Open
Update September 2019
7.6.2 Sett ing / Conf iguring the measurements displayed
The operator has access to the choice of parameters coming from a digital sensor in the BASIC SETTINGS sub-menu.
Choosing SELECT. PARAMETERS leads to the list of parameters that can be enabled from 1 to 6. They represent 6 usable display areas on the screen.
→ Parameter 1
Parameter 2
…
Selecting one of the six parameters leads to a list of choices:
- No measurement,
- Temperature measurement,
- Turbidity measurement,
- Digital Ox. sensor,
- Turbidi. TSS measurement,
- pH digital sensor,
- ORP potential digital sensor (ORP),
- Conductivity digital sensor.
In this case, we will choose temperature or Turbidi. TSS since these 2 parameters are delivered by the sensor.
→ Parameter 1
Turbidi. TSS meas.
It should be noted that these two parameters can viewed simultaneously when configuring parameters 1 and 2.
→ Parameter 2
Temp.measurement
The Main Screen then gives:
TSS 10 FAU
°C 140.00 °C
↓ Man→
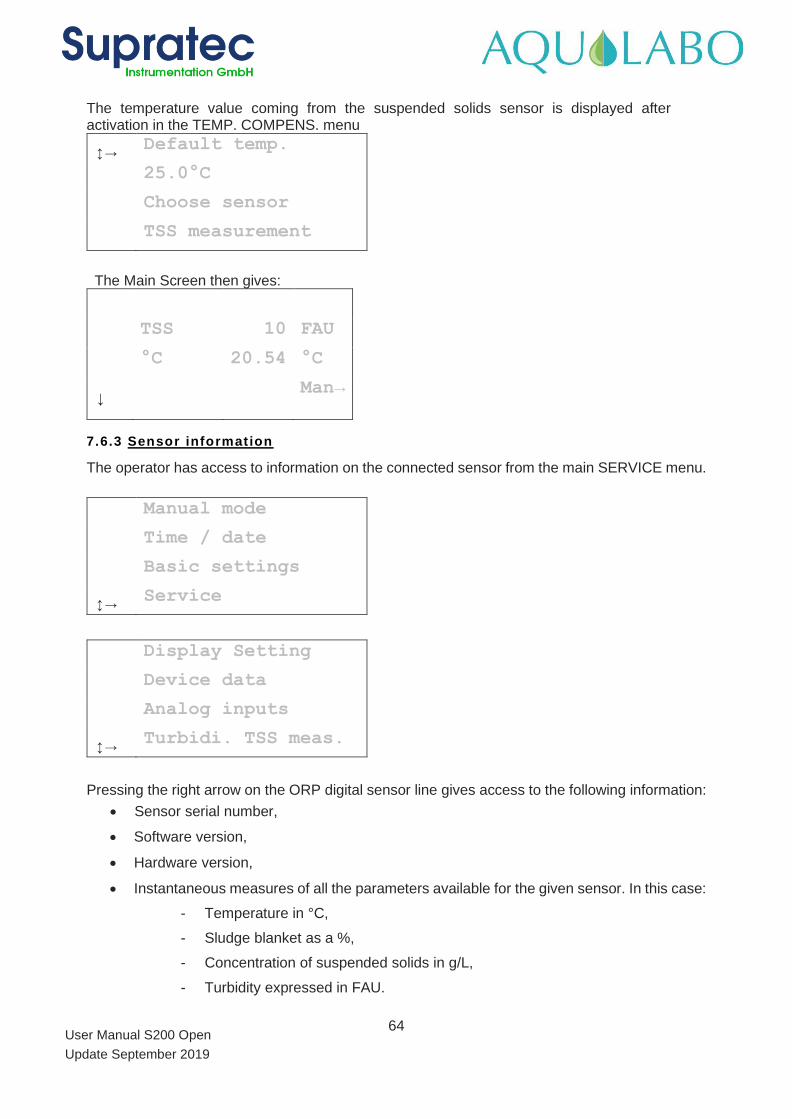
64
User Manual S200 Open
Update September 2019
The temperature value coming from the suspended solids sensor is displayed after activation in the TEMP. COMPENS. menu
→ Default temp.
25.0°C
Choose sensor
TSS measurement
The Main Screen then gives:
TSS 10 FAU
°C 20.54 °C
↓ Man→
7.6.3 Sensor information
The operator has access to information on the connected sensor from the main SERVICE menu.
Manual mode
Time / date
Basic settings
→ Service
Display Setting
Device data
Analog inputs
→ Turbidi. TSS meas.
Pressing the right arrow on the ORP digital sensor line gives access to the following information:
• Sensor serial number,
• Software version,
• Hardware version,
• Instantaneous measures of all the parameters available for the given sensor. In this case:
- Temperature in °C,
- Sludge blanket as a %,
- Concentration of suspended solids in g/L,
- Turbidity expressed in FAU.
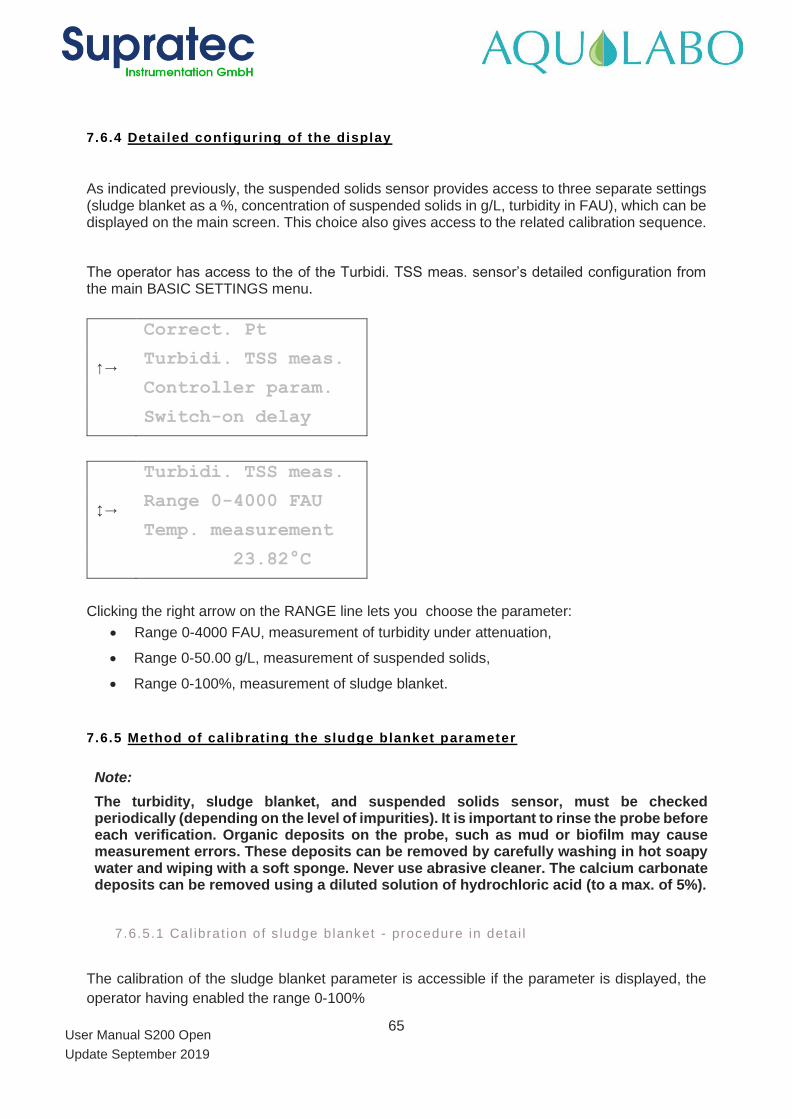
65
User Manual S200 Open
Update September 2019
7.6.4 Detai led configuring of the display
As indicated previously, the suspended solids sensor provides access to three separate settings (sludge blanket as a %, concentration of suspended solids in g/L, turbidity in FAU), which can be displayed on the main screen. This choice also gives access to the related calibration sequence.
The operator has access to the of the Turbidi. TSS meas. sensor’s detailed configuration from the main BASIC SETTINGS menu.
Correct. Pt
↑→ Turbidi. TSS meas.
Controller param.
Switch-on delay
Turbidi. TSS meas.
→ Range 0-4000 FAU
Temp. measurement
23.82°C
Clicking the right arrow on the RANGE line lets you choose the parameter:
• Range 0-4000 FAU, measurement of turbidity under attenuation,
• Range 0-50.00 g/L, measurement of suspended solids,
• Range 0-100%, measurement of sludge blanket.
7.6.5 Method of cal ibrating the sludge blanket parameter
Note:
The turbidity, sludge blanket, and suspended solids sensor, must be checked periodically (depending on the level of impurities). It is important to rinse the probe before each verification. Organic deposits on the probe, such as mud or biofilm may cause measurement errors. These deposits can be removed by carefully washing in hot soapy water and wiping with a soft sponge. Never use abrasive cleaner. The calcium carbonate deposits can be removed using a diluted solution of hydrochloric acid (to a max. of 5%).
7.6.5.1 Cal ibrat ion of s ludge b lanket - procedure in deta i l
The calibration of the sludge blanket parameter is accessible if the parameter is displayed, the
operator having enabled the range 0-100%
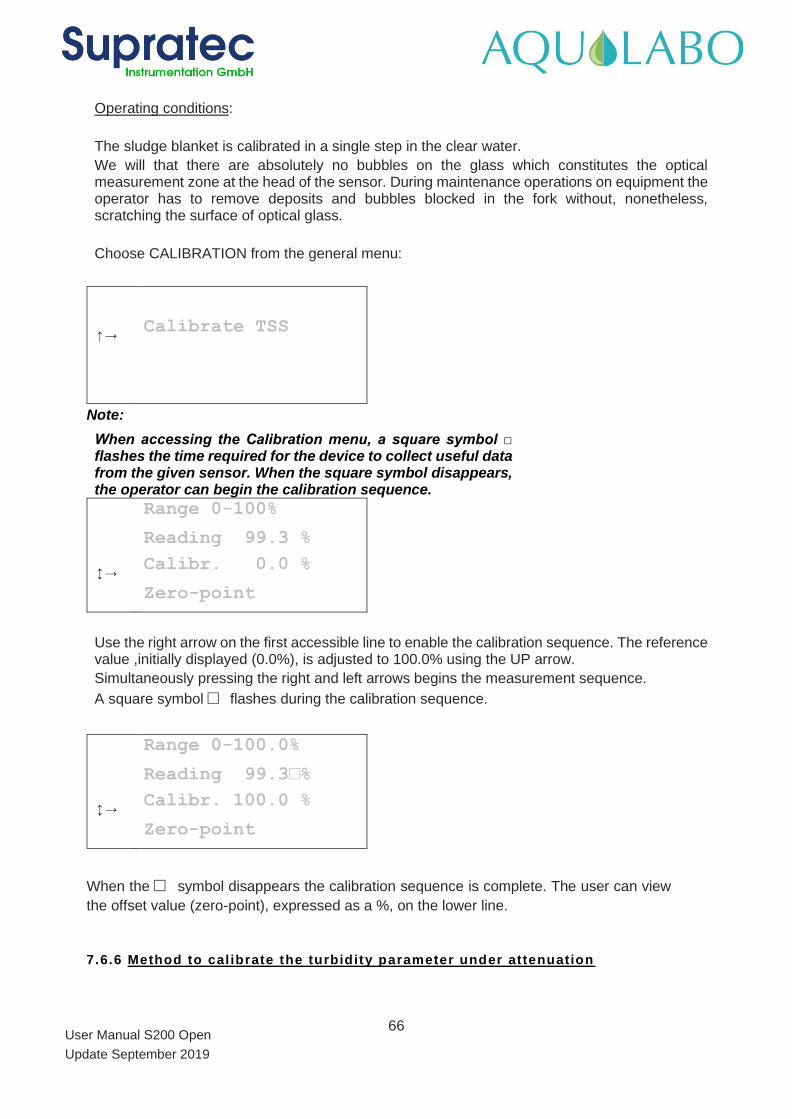
66
User Manual S200 Open
Update September 2019
Operating conditions:
The sludge blanket is calibrated in a single step in the clear water.
We will that there are absolutely no bubbles on the glass which constitutes the optical measurement zone at the head of the sensor. During maintenance operations on equipment the operator has to remove deposits and bubbles blocked in the fork without, nonetheless, scratching the surface of optical glass.
Choose CALIBRATION from the general menu:
↑→ Calibrate TSS
Note:
When accessing the Calibration menu, a square symbol flashes the time required for the device to collect useful data from the given sensor. When the square symbol disappears, the operator can begin the calibration sequence.
Range 0-100%
Reading 99.3 %
→ Calibr. 0.0 %
Zero-point
Use the right arrow on the first accessible line to enable the calibration sequence. The reference value ,initially displayed (0.0%), is adjusted to 100.0% using the UP arrow.
Simultaneously pressing the right and left arrows begins the measurement sequence.
A square symbol flashes during the calibration sequence.
Range 0-100.0%
Reading 99.3%
→ Calibr. 100.0 %
Zero-point
When the symbol disappears the calibration sequence is complete. The user can view
the offset value (zero-point), expressed as a %, on the lower line.
7.6.6 Method to cal ibrate the turbidity parameter under attenuation
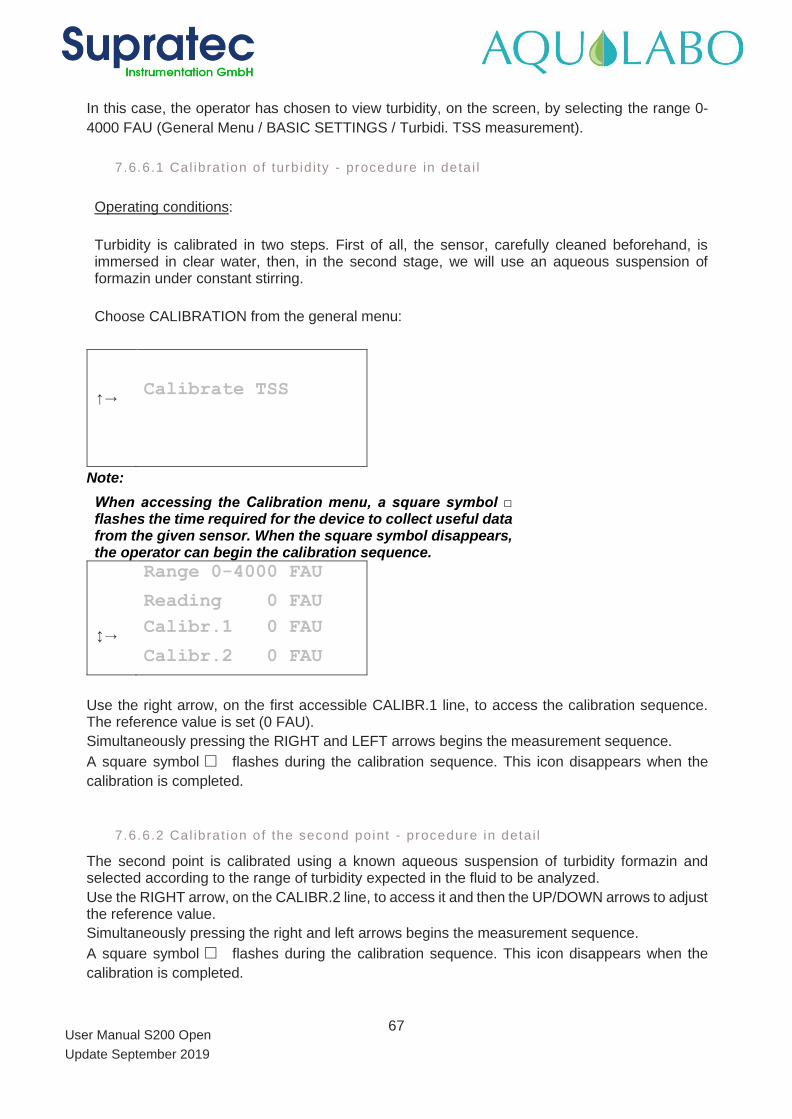
67
User Manual S200 Open
Update September 2019
In this case, the operator has chosen to view turbidity, on the screen, by selecting the range 0-
4000 FAU (General Menu / BASIC SETTINGS / Turbidi. TSS measurement).
7.6.6.1 Cal ibrat ion of turb id ity - procedure in deta i l
Operating conditions:
Turbidity is calibrated in two steps. First of all, the sensor, carefully cleaned beforehand, is immersed in clear water, then, in the second stage, we will use an aqueous suspension of formazin under constant stirring.
Choose CALIBRATION from the general menu:
↑→ Calibrate TSS
Note:
When accessing the Calibration menu, a square symbol flashes the time required for the device to collect useful data from the given sensor. When the square symbol disappears, the operator can begin the calibration sequence.
Range 0-4000 FAU
Reading 0 FAU
→ Calibr.1 0 FAU
Calibr.2 0 FAU
Use the right arrow, on the first accessible CALIBR.1 line, to access the calibration sequence. The reference value is set (0 FAU).
Simultaneously pressing the RIGHT and LEFT arrows begins the measurement sequence.
A square symbol flashes during the calibration sequence. This icon disappears when the
calibration is completed.
7.6.6.2 Cal ibrat ion of the second point - procedure in deta i l
The second point is calibrated using a known aqueous suspension of turbidity formazin and selected according to the range of turbidity expected in the fluid to be analyzed.
Use the RIGHT arrow, on the CALIBR.2 line, to access it and then the UP/DOWN arrows to adjust the reference value.
Simultaneously pressing the right and left arrows begins the measurement sequence.
A square symbol flashes during the calibration sequence. This icon disappears when the
calibration is completed.
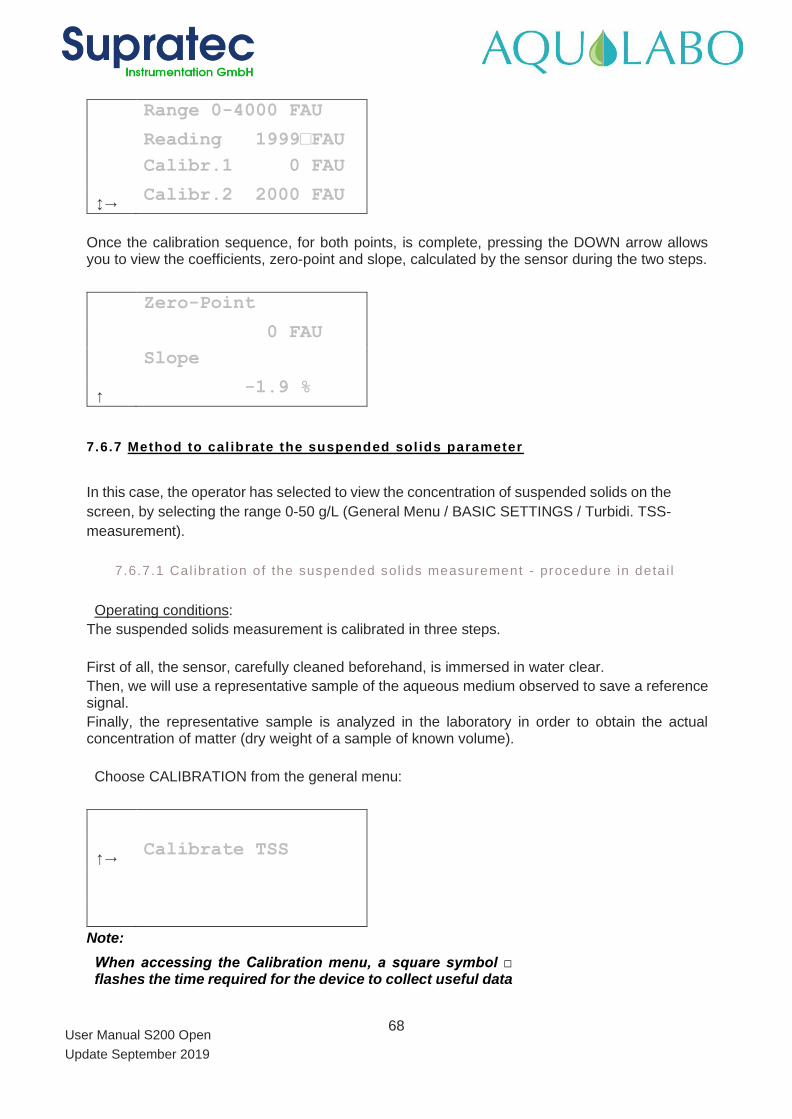
68
User Manual S200 Open
Update September 2019
Range 0-4000 FAU
Reading 1999FAU
Calibr.1 0 FAU
→ Calibr.2 2000 FAU
Once the calibration sequence, for both points, is complete, pressing the DOWN arrow allows you to view the coefficients, zero-point and slope, calculated by the sensor during the two steps.
Zero-Point
0 FAU
Slope
↑ -1.9 %
7.6.7 Method to cal ibrate the suspended sol ids parameter
In this case, the operator has selected to view the concentration of suspended solids on the
screen, by selecting the range 0-50 g/L (General Menu / BASIC SETTINGS / Turbidi. TSS-
measurement).
7.6.7.1 Cal ibrat ion of the suspended sol ids measurement - procedure in deta i l
Operating conditions:
The suspended solids measurement is calibrated in three steps.
First of all, the sensor, carefully cleaned beforehand, is immersed in water clear.
Then, we will use a representative sample of the aqueous medium observed to save a reference signal.
Finally, the representative sample is analyzed in the laboratory in order to obtain the actual concentration of matter (dry weight of a sample of known volume).
Choose CALIBRATION from the general menu:
↑→ Calibrate TSS
Note:
When accessing the Calibration menu, a square symbol flashes the time required for the device to collect useful data
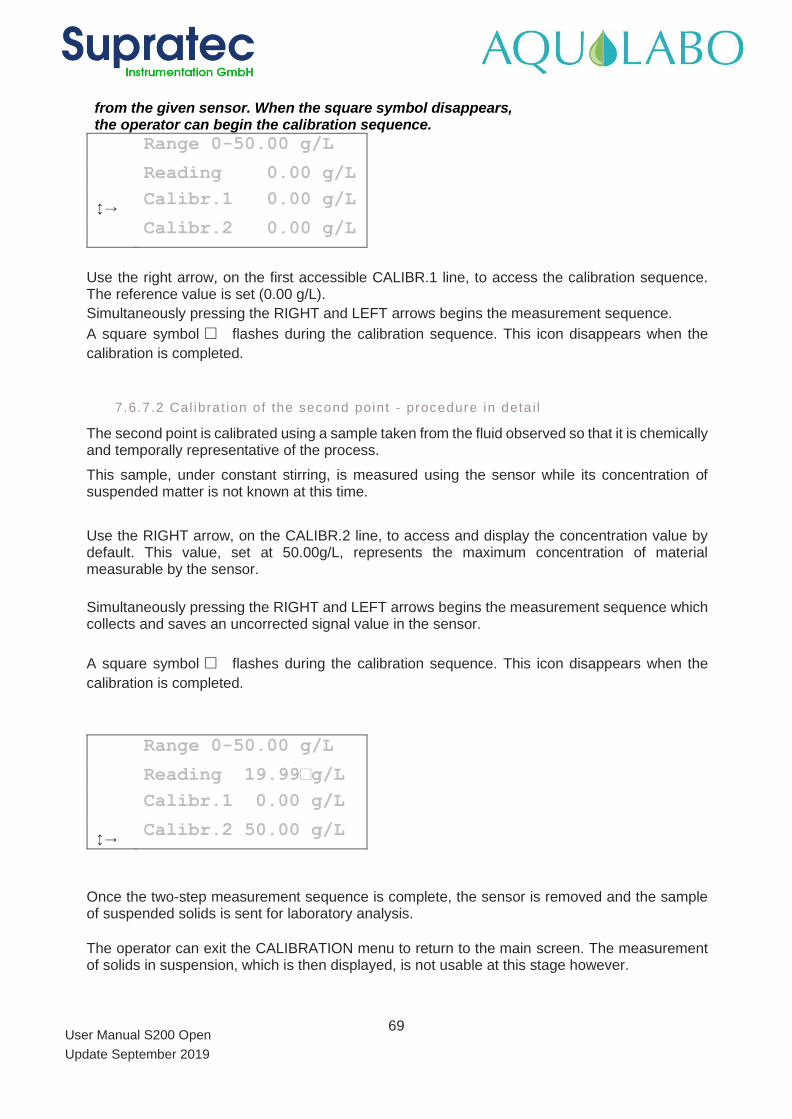
69
User Manual S200 Open
Update September 2019
from the given sensor. When the square symbol disappears, the operator can begin the calibration sequence.
Range 0-50.00 g/L
Reading 0.00 g/L
→ Calibr.1 0.00 g/L
Calibr.2 0.00 g/L
Use the right arrow, on the first accessible CALIBR.1 line, to access the calibration sequence. The reference value is set (0.00 g/L).
Simultaneously pressing the RIGHT and LEFT arrows begins the measurement sequence.
A square symbol flashes during the calibration sequence. This icon disappears when the
calibration is completed.
7.6.7.2 Cal ibrat ion of the second point - procedure in deta i l
The second point is calibrated using a sample taken from the fluid observed so that it is chemically and temporally representative of the process.
This sample, under constant stirring, is measured using the sensor while its concentration of suspended matter is not known at this time.
Use the RIGHT arrow, on the CALIBR.2 line, to access and display the concentration value by default. This value, set at 50.00g/L, represents the maximum concentration of material measurable by the sensor.
Simultaneously pressing the RIGHT and LEFT arrows begins the measurement sequence which collects and saves an uncorrected signal value in the sensor.
A square symbol flashes during the calibration sequence. This icon disappears when the
calibration is completed.
Range 0-50.00 g/L
Reading 19.99g/L
Calibr.1 0.00 g/L
→ Calibr.2 50.00 g/L
Once the two-step measurement sequence is complete, the sensor is removed and the sample of suspended solids is sent for laboratory analysis.
The operator can exit the CALIBRATION menu to return to the main screen. The measurement of solids in suspension, which is then displayed, is not usable at this stage however.
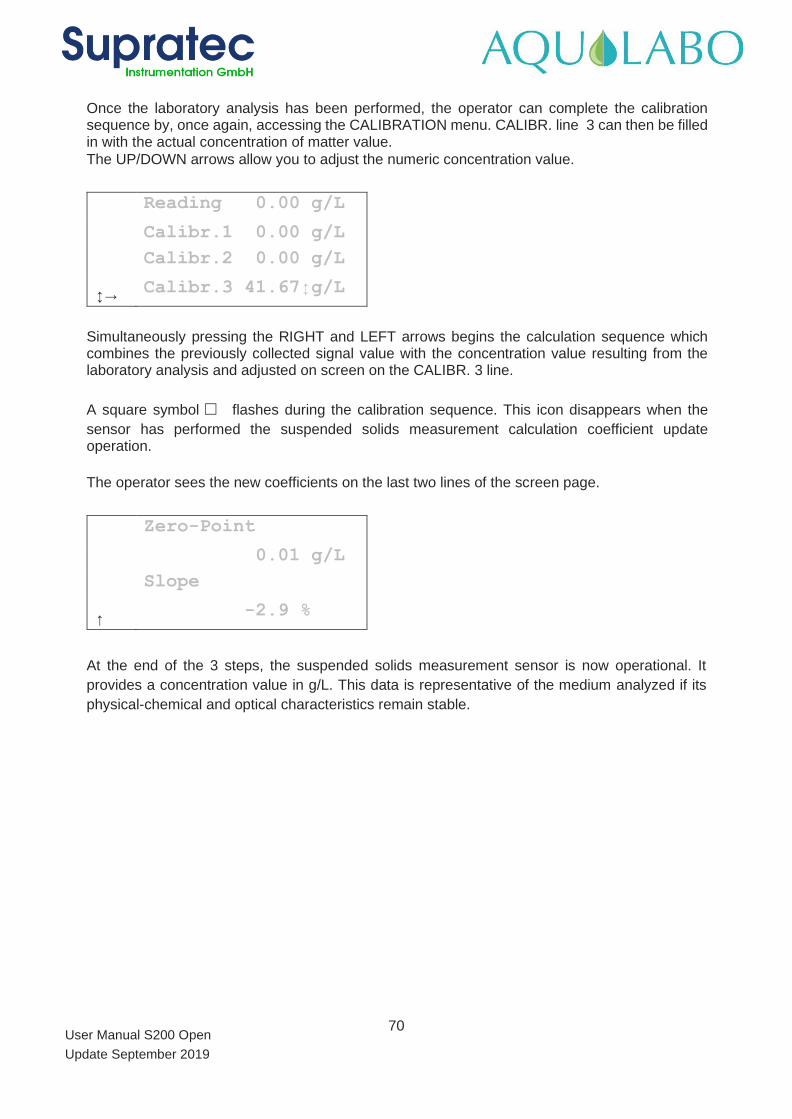
70
User Manual S200 Open
Update September 2019
Once the laboratory analysis has been performed, the operator can complete the calibration sequence by, once again, accessing the CALIBRATION menu. CALIBR. line 3 can then be filled in with the actual concentration of matter value.
The UP/DOWN arrows allow you to adjust the numeric concentration value.
Reading 0.00 g/L
Calibr.1 0.00 g/L
Calibr.2 0.00 g/L
→ Calibr.3 41.67g/L
Simultaneously pressing the RIGHT and LEFT arrows begins the calculation sequence which combines the previously collected signal value with the concentration value resulting from the laboratory analysis and adjusted on screen on the CALIBR. 3 line.
A square symbol flashes during the calibration sequence. This icon disappears when the
sensor has performed the suspended solids measurement calculation coefficient update operation.
The operator sees the new coefficients on the last two lines of the screen page.
Zero-Point
0.01 g/L
Slope
↑ -2.9 %
At the end of the 3 steps, the suspended solids measurement sensor is now operational. It
provides a concentration value in g/L. This data is representative of the medium analyzed if its
physical-chemical and optical characteristics remain stable.
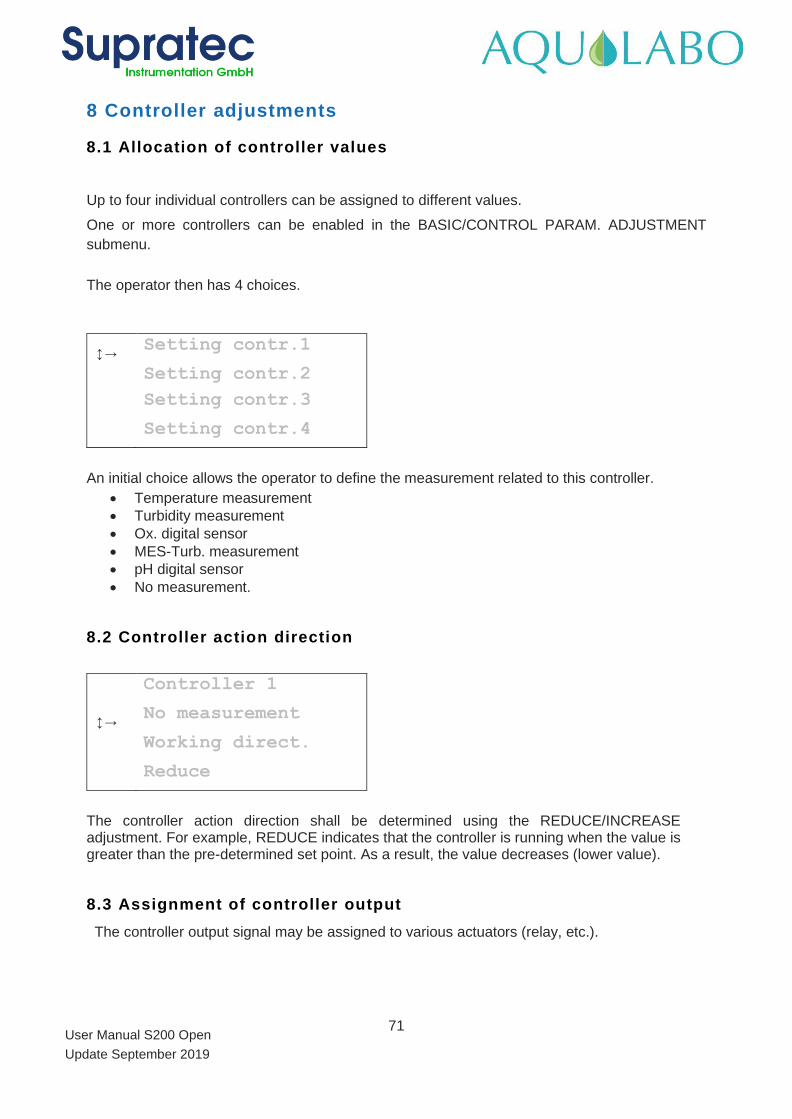
71
User Manual S200 Open
Update September 2019
8 Controller adjustments
8.1 Allocation of controller values
Up to four individual controllers can be assigned to different values.
One or more controllers can be enabled in the BASIC/CONTROL PARAM. ADJUSTMENT
submenu.
The operator then has 4 choices.
→ Setting contr.1
Setting contr.2
Setting contr.3
Setting contr.4
An initial choice allows the operator to define the measurement related to this controller.
• Temperature measurement
• Turbidity measurement
• Ox. digital sensor
• MES-Turb. measurement
• pH digital sensor
• No measurement.
8.2 Controller action direction
Controller 1
→ No measurement
Working direct.
Reduce
The controller action direction shall be determined using the REDUCE/INCREASE adjustment. For example, REDUCE indicates that the controller is running when the value is greater than the pre-determined set point. As a result, the value decreases (lower value).
8.3 Assignment of controller output
The controller output signal may be assigned to various actuators (relay, etc.).
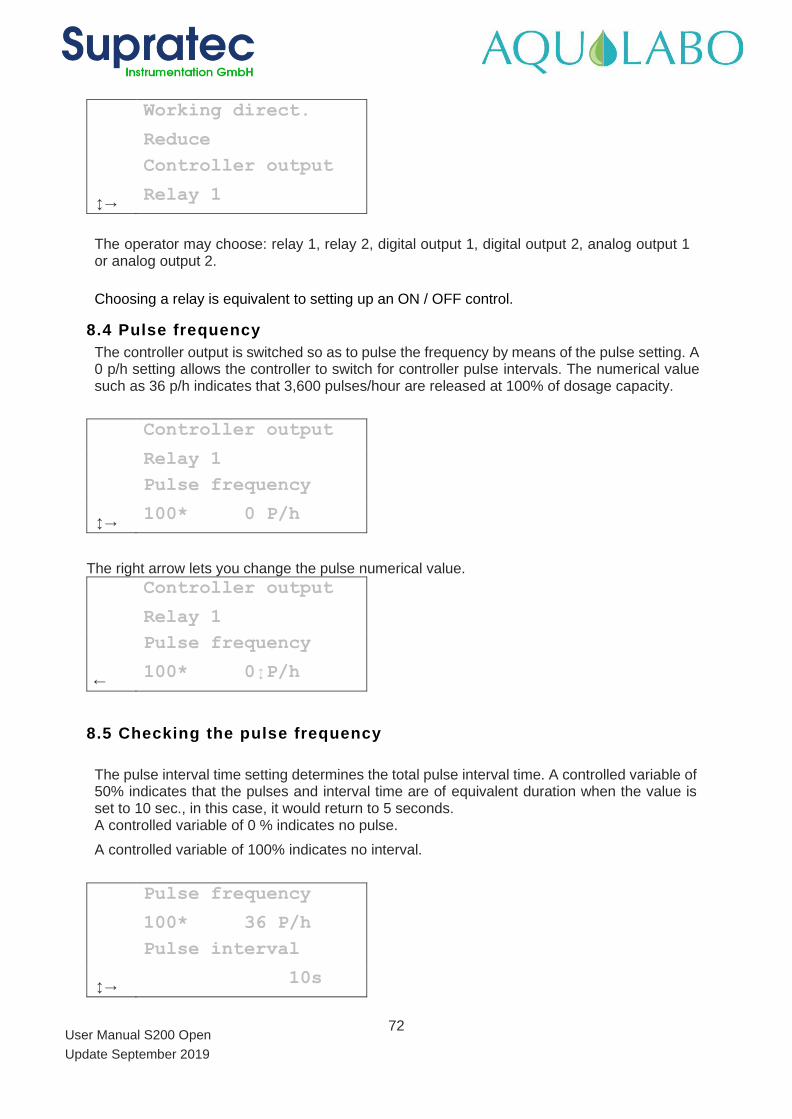
72
User Manual S200 Open
Update September 2019
Working direct.
Reduce
Controller output
→ Relay 1
The operator may choose: relay 1, relay 2, digital output 1, digital output 2, analog output 1 or analog output 2.
Choosing a relay is equivalent to setting up an ON / OFF control.
8.4 Pulse frequency
The controller output is switched so as to pulse the frequency by means of the pulse setting. A 0 p/h setting allows the controller to switch for controller pulse intervals. The numerical value such as 36 p/h indicates that 3,600 pulses/hour are released at 100% of dosage capacity.
Controller output
Relay 1
Pulse frequency
→ 100* 0 P/h
The right arrow lets you change the pulse numerical value.
Controller output
Relay 1
Pulse frequency
← 100* 0P/h
8.5 Checking the pulse frequency
The pulse interval time setting determines the total pulse interval time. A controlled variable of 50% indicates that the pulses and interval time are of equivalent duration when the value is set to 10 sec., in this case, it would return to 5 seconds. A controlled variable of 0 % indicates no pulse.
A controlled variable of 100% indicates no interval.
Pulse frequency
100* 36 P/h
Pulse interval
→ 10s
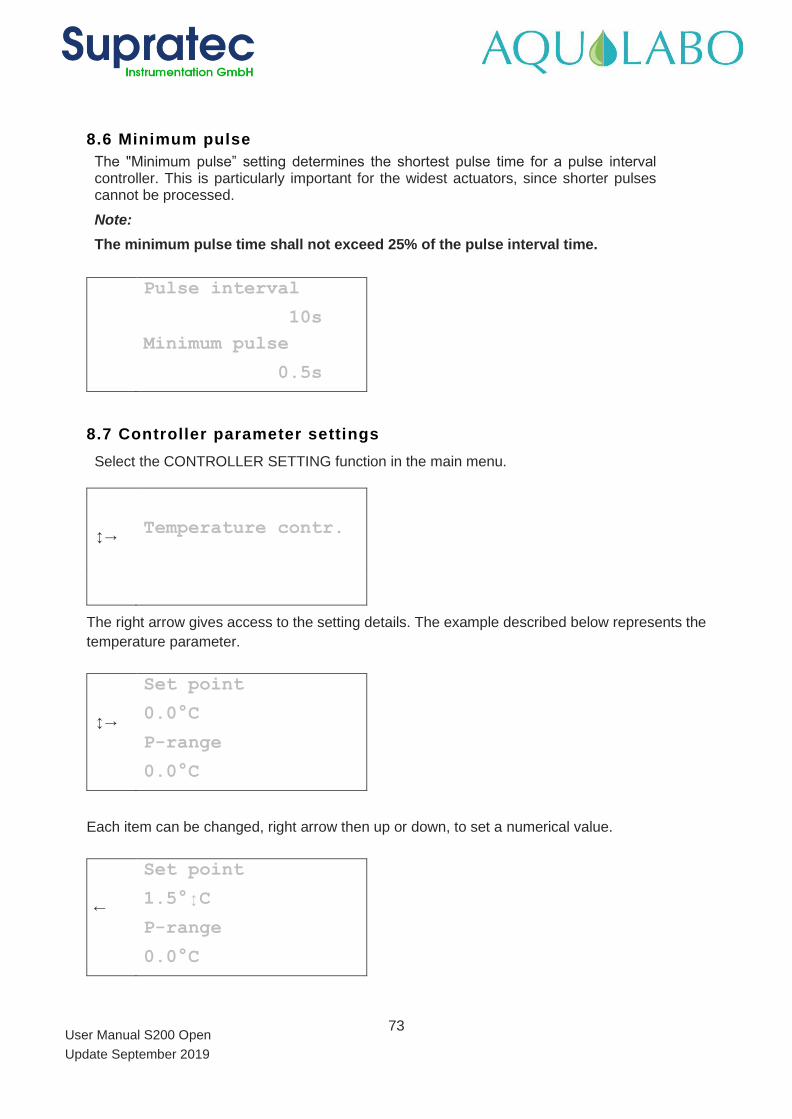
73
User Manual S200 Open
Update September 2019
8.6 Minimum pulse
The "Minimum pulse” setting determines the shortest pulse time for a pulse interval controller. This is particularly important for the widest actuators, since shorter pulses cannot be processed.
Note:
The minimum pulse time shall not exceed 25% of the pulse interval time.
Pulse interval
10s
Minimum pulse
0.5s
8.7 Controller parameter settings
Select the CONTROLLER SETTING function in the main menu.
→ Temperature contr.
The right arrow gives access to the setting details. The example described below represents the
temperature parameter.
Set point
→ 0.0°C
P-range
0.0°C
Each item can be changed, right arrow then up or down, to set a numerical value.
Set point
← 1.5°C
P-range
0.0°C
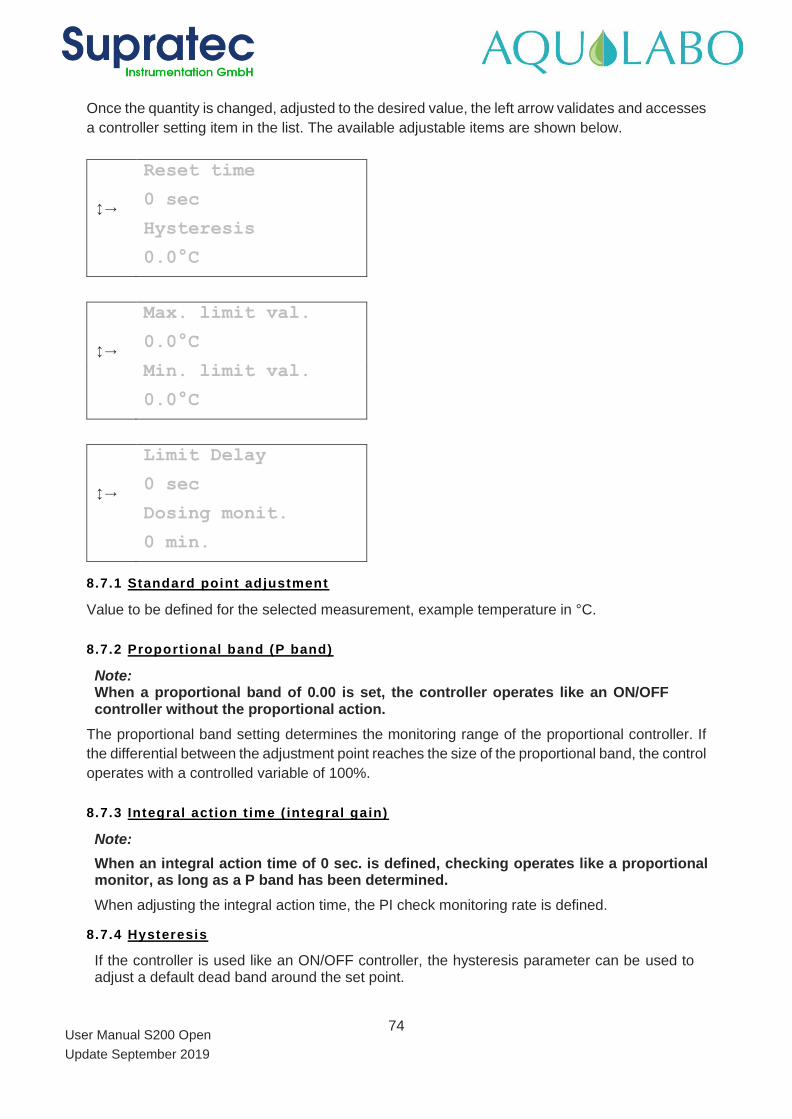
74
User Manual S200 Open
Update September 2019
Once the quantity is changed, adjusted to the desired value, the left arrow validates and accesses
a controller setting item in the list. The available adjustable items are shown below.
Reset time
→ 0 sec
Hysteresis
0.0°C
Max. limit val.
→ 0.0°C
Min. limit val.
0.0°C
Limit Delay
→ 0 sec
Dosing monit.
0 min.
8.7.1 Standard point adjustment
Value to be defined for the selected measurement, example temperature in °C.
8.7.2 Proport ional band (P band)
Note: When a proportional band of 0.00 is set, the controller operates like an ON/OFF controller without the proportional action.
The proportional band setting determines the monitoring range of the proportional controller. If
the differential between the adjustment point reaches the size of the proportional band, the control
operates with a controlled variable of 100%.
8.7.3 Integral action t ime ( integral gain)
Note:
When an integral action time of 0 sec. is defined, checking operates like a proportional monitor, as long as a P band has been determined.
When adjusting the integral action time, the PI check monitoring rate is defined.
8.7.4 Hysteresis
If the controller is used like an ON/OFF controller, the hysteresis parameter can be used to adjust a default dead band around the set point.
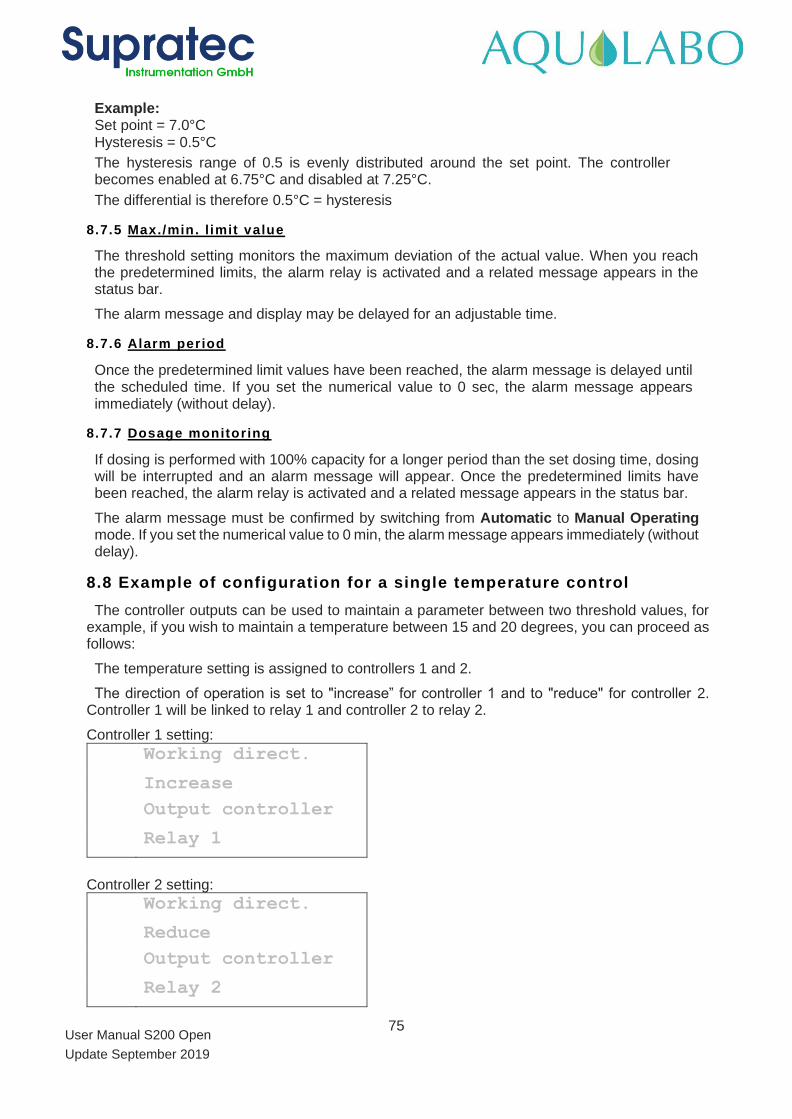
75
User Manual S200 Open
Update September 2019
Example: Set point = 7.0°C Hysteresis = 0.5°C
The hysteresis range of 0.5 is evenly distributed around the set point. The controller becomes enabled at 6.75°C and disabled at 7.25°C.
The differential is therefore 0.5°C = hysteresis
8.7.5 Max./min. l imit value
The threshold setting monitors the maximum deviation of the actual value. When you reach the predetermined limits, the alarm relay is activated and a related message appears in the status bar.
The alarm message and display may be delayed for an adjustable time.
8.7.6 Alarm period
Once the predetermined limit values have been reached, the alarm message is delayed until the scheduled time. If you set the numerical value to 0 sec, the alarm message appears immediately (without delay).
8.7.7 Dosage monitoring
If dosing is performed with 100% capacity for a longer period than the set dosing time, dosing will be interrupted and an alarm message will appear. Once the predetermined limits have been reached, the alarm relay is activated and a related message appears in the status bar.
The alarm message must be confirmed by switching from Automatic to Manual Operating mode. If you set the numerical value to 0 min, the alarm message appears immediately (without delay).
8.8 Example of configuration for a single temperature control
The controller outputs can be used to maintain a parameter between two threshold values, for example, if you wish to maintain a temperature between 15 and 20 degrees, you can proceed as follows:
The temperature setting is assigned to controllers 1 and 2.
The direction of operation is set to "increase” for controller 1 and to "reduce" for controller 2. Controller 1 will be linked to relay 1 and controller 2 to relay 2.
Controller 1 setting:
Working direct.
Increase
Output controller
Relay 1
Controller 2 setting:
Working direct.
Reduce
Output controller
Relay 2
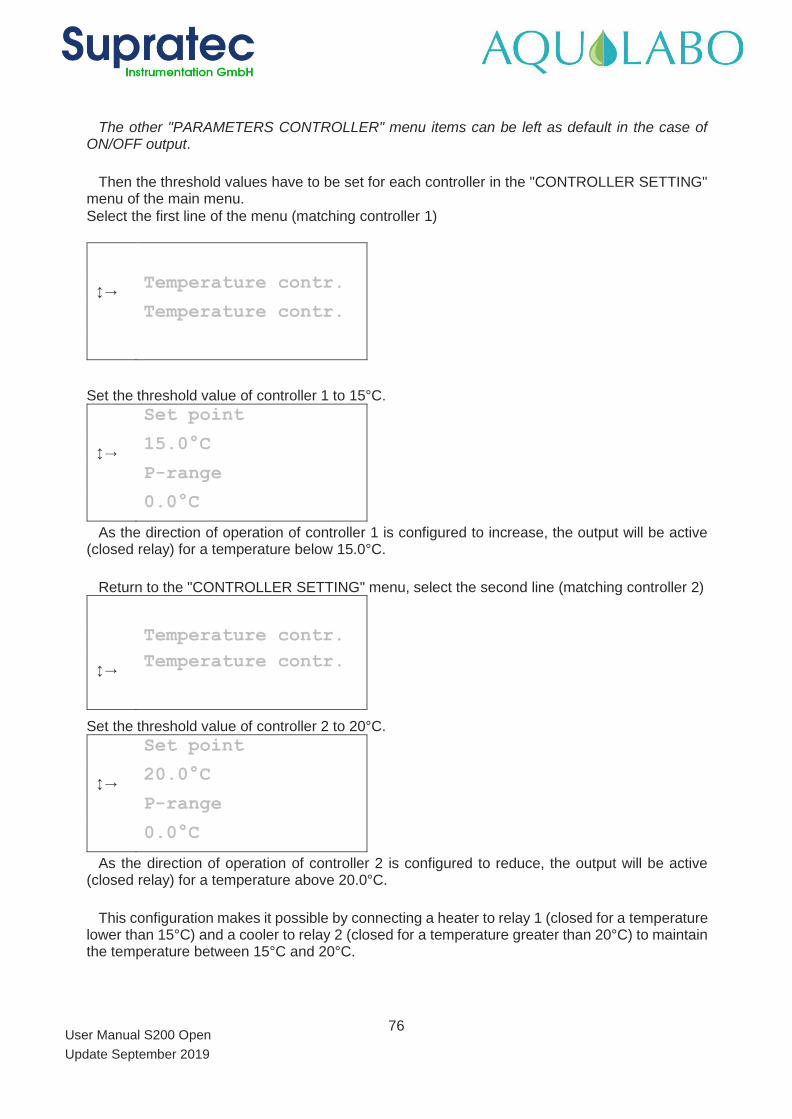
76
User Manual S200 Open
Update September 2019
The other "PARAMETERS CONTROLLER" menu items can be left as default in the case of ON/OFF output.
Then the threshold values have to be set for each controller in the "CONTROLLER SETTING" menu of the main menu.
Select the first line of the menu (matching controller 1)
→ Temperature contr.
Temperature contr.
Set the threshold value of controller 1 to 15°C.
Set point
→ 15.0°C
P-range
0.0°C
As the direction of operation of controller 1 is configured to increase, the output will be active (closed relay) for a temperature below 15.0°C.
Return to the "CONTROLLER SETTING" menu, select the second line (matching controller 2)
Temperature contr.
→ Temperature contr.
Set the threshold value of controller 2 to 20°C.
Set point
→ 20.0°C
P-range
0.0°C
As the direction of operation of controller 2 is configured to reduce, the output will be active (closed relay) for a temperature above 20.0°C.
This configuration makes it possible by connecting a heater to relay 1 (closed for a temperature lower than 15°C) and a cooler to relay 2 (closed for a temperature greater than 20°C) to maintain the temperature between 15°C and 20°C.
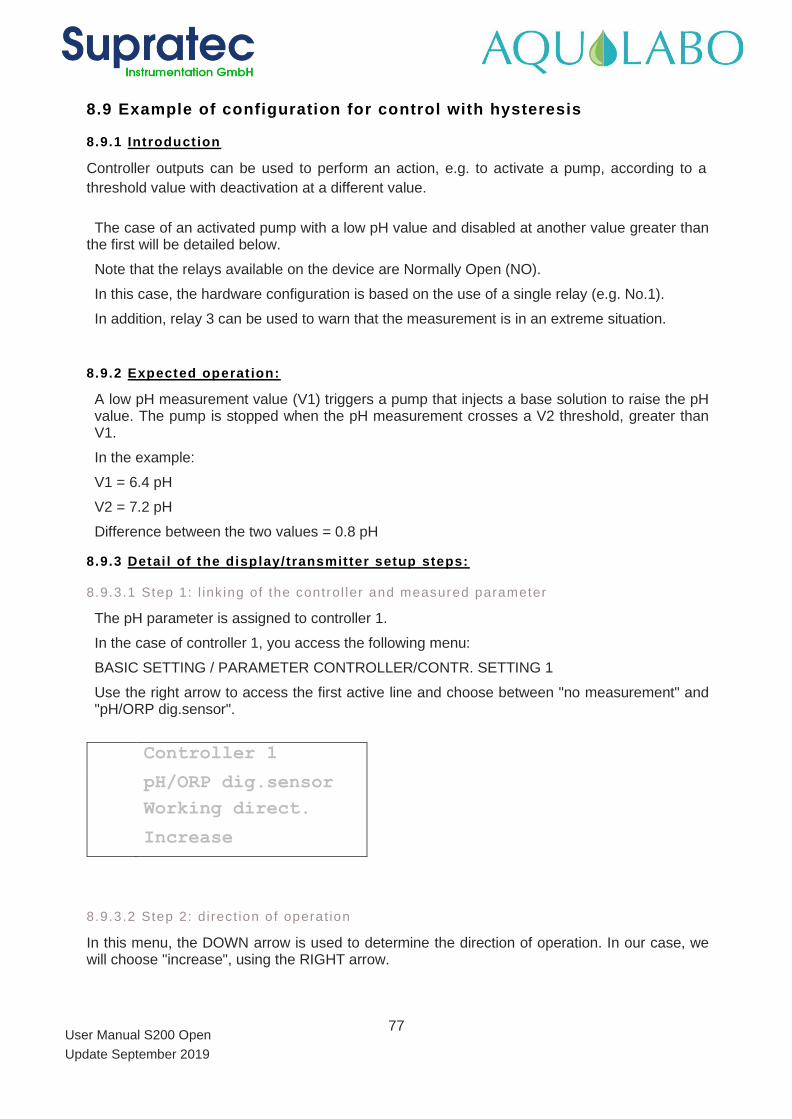
77
User Manual S200 Open
Update September 2019
8.9 Example of configuration for control with hysteresis
8.9.1 Introduct ion
Controller outputs can be used to perform an action, e.g. to activate a pump, according to a
threshold value with deactivation at a different value.
The case of an activated pump with a low pH value and disabled at another value greater than the first will be detailed below.
Note that the relays available on the device are Normally Open (NO).
In this case, the hardware configuration is based on the use of a single relay (e.g. No.1).
In addition, relay 3 can be used to warn that the measurement is in an extreme situation.
8.9.2 Expected operat ion:
A low pH measurement value (V1) triggers a pump that injects a base solution to raise the pH value. The pump is stopped when the pH measurement crosses a V2 threshold, greater than V1.
In the example:
V1 = 6.4 pH
V2 = 7.2 pH
Difference between the two values = 0.8 pH
8.9.3 Detai l of the display/transmitter setup steps:
8.9.3.1 Step 1: l ink ing of the control ler and measured parameter
The pH parameter is assigned to controller 1.
In the case of controller 1, you access the following menu:
BASIC SETTING / PARAMETER CONTROLLER/CONTR. SETTING 1
Use the right arrow to access the first active line and choose between "no measurement" and "pH/ORP dig.sensor".
Controller 1
pH/ORP dig.sensor
Working direct.
Increase
8.9.3.2 Step 2: di rec t ion of operat ion
In this menu, the DOWN arrow is used to determine the direction of operation. In our case, we will choose "increase", using the RIGHT arrow.
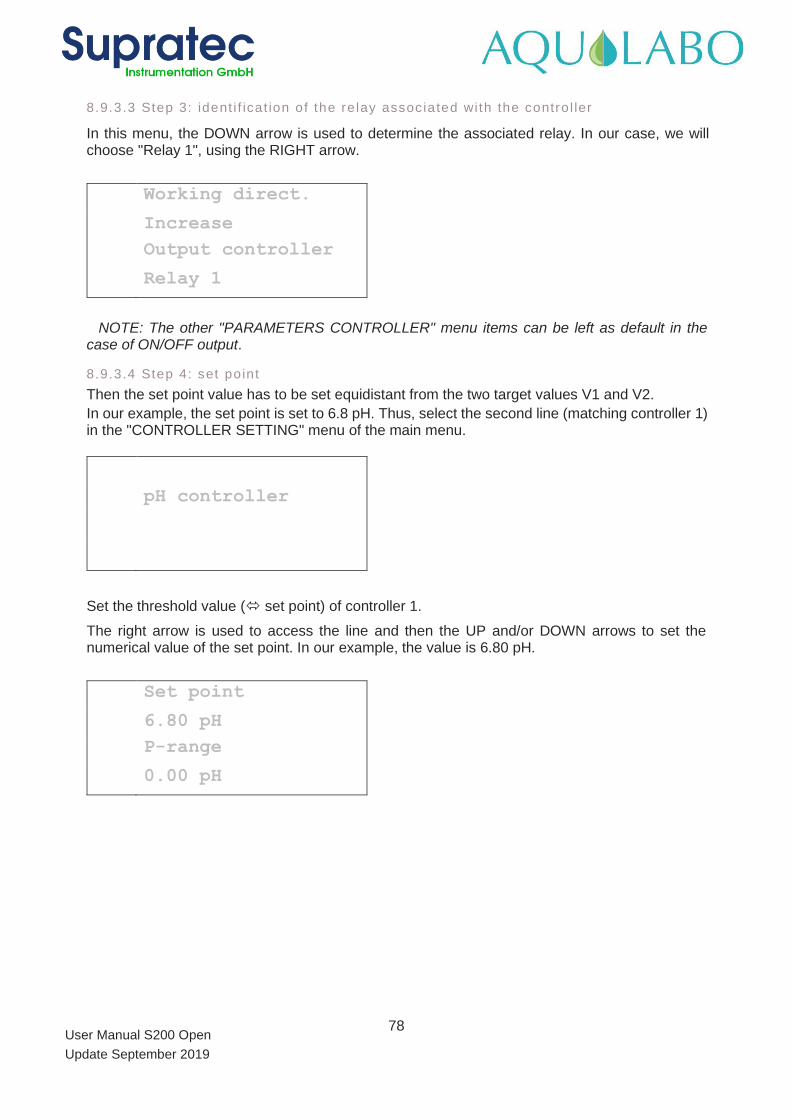
78
User Manual S200 Open
Update September 2019
8.9.3.3 Step 3: ident i f icat ion of the re lay assoc iated wi th the contro l ler
In this menu, the DOWN arrow is used to determine the associated relay. In our case, we will choose "Relay 1", using the RIGHT arrow.
Working direct.
Increase
Output controller
Relay 1
NOTE: The other "PARAMETERS CONTROLLER" menu items can be left as default in the case of ON/OFF output.
8.9.3.4 Step 4: set point
Then the set point value has to be set equidistant from the two target values V1 and V2.
In our example, the set point is set to 6.8 pH. Thus, select the second line (matching controller 1) in the "CONTROLLER SETTING" menu of the main menu.
pH controller
Set the threshold value ( set point) of controller 1.
The right arrow is used to access the line and then the UP and/or DOWN arrows to set the numerical value of the set point. In our example, the value is 6.80 pH.
Set point
6.80 pH
P-range
0.00 pH
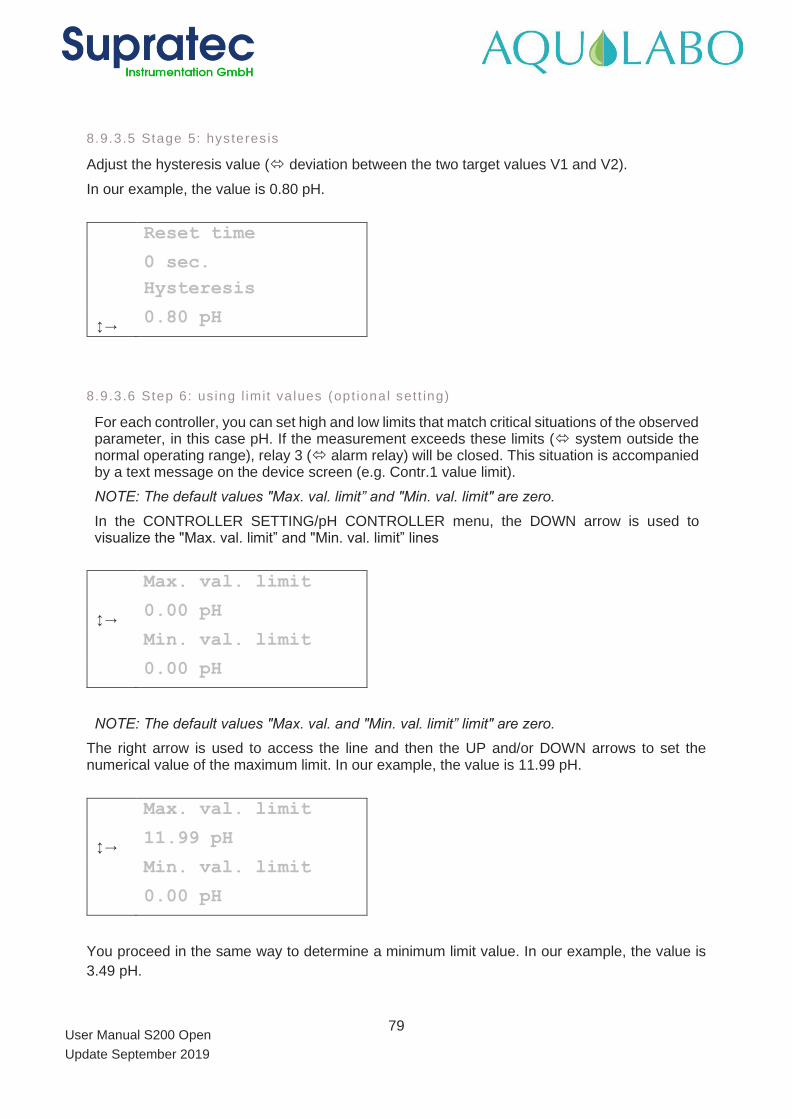
79
User Manual S200 Open
Update September 2019
8.9.3.5 Stage 5: hysteres is
Adjust the hysteresis value ( deviation between the two target values V1 and V2).
In our example, the value is 0.80 pH.
Reset time
0 sec.
Hysteresis
→ 0.80 pH
8.9.3.6 Step 6: using l imit va lues (opt ional set t ing)
For each controller, you can set high and low limits that match critical situations of the observed parameter, in this case pH. If the measurement exceeds these limits ( system outside the normal operating range), relay 3 ( alarm relay) will be closed. This situation is accompanied by a text message on the device screen (e.g. Contr.1 value limit).
NOTE: The default values "Max. val. limit” and "Min. val. limit" are zero.
In the CONTROLLER SETTING/pH CONTROLLER menu, the DOWN arrow is used to visualize the "Max. val. limit” and "Min. val. limit” lines
Max. val. limit
→ 0.00 pH
Min. val. limit
0.00 pH
NOTE: The default values "Max. val. and "Min. val. limit” limit" are zero.
The right arrow is used to access the line and then the UP and/or DOWN arrows to set the numerical value of the maximum limit. In our example, the value is 11.99 pH.
Max. val. limit
→ 11.99 pH
Min. val. limit
0.00 pH
You proceed in the same way to determine a minimum limit value. In our example, the value is
3.49 pH.
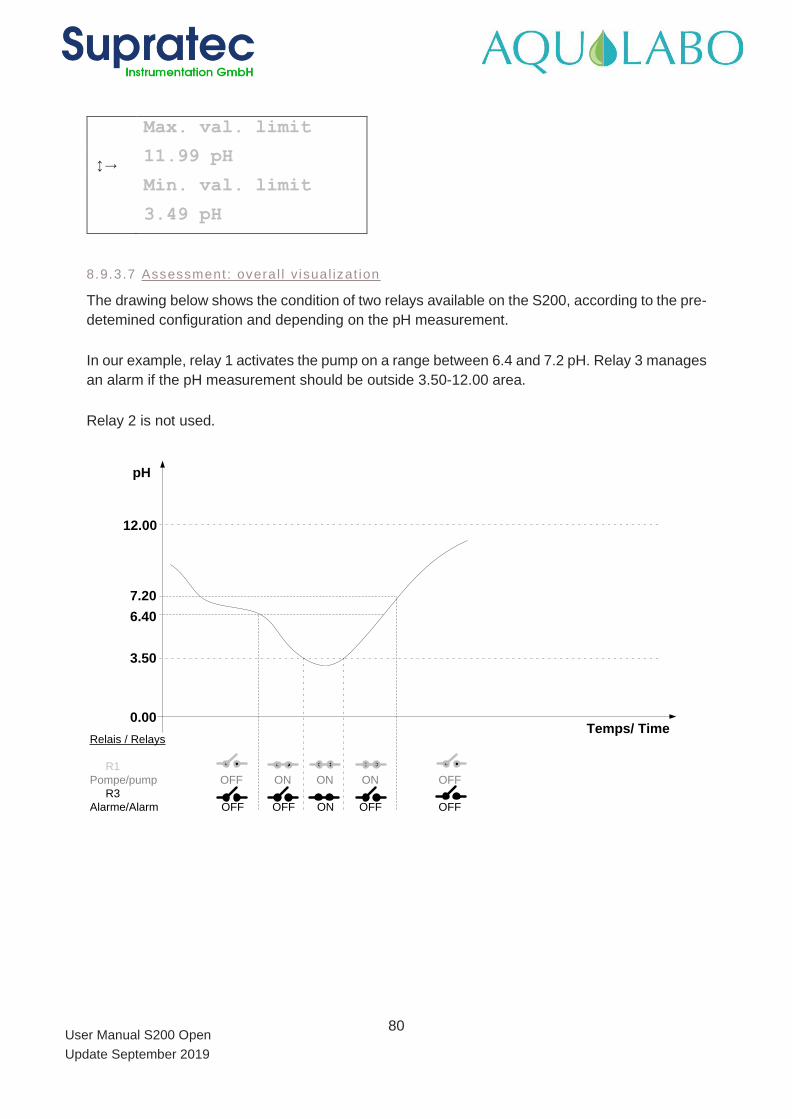
80
User Manual S200 Open
Update September 2019
Max. val. limit
→ 11.99 pH
Min. val. limit
3.49 pH
8.9.3.7 Assessment : overal l v isual izat ion
The drawing below shows the condition of two relays available on the S200, according to the pre-
detemined configuration and depending on the pH measurement.
In our example, relay 1 activates the pump on a range between 6.4 and 7.2 pH. Relay 3 manages
an alarm if the pH measurement should be outside 3.50-12.00 area.
Relay 2 is not used.
pH
Temps/ Time0.00
3.50
12.00
6.40
7.20
Relais / Relays
R1
Pompe/pump OFF ON ON ON OFF
R3
Alarme/Alarm OFF OFF ON OFF OFF
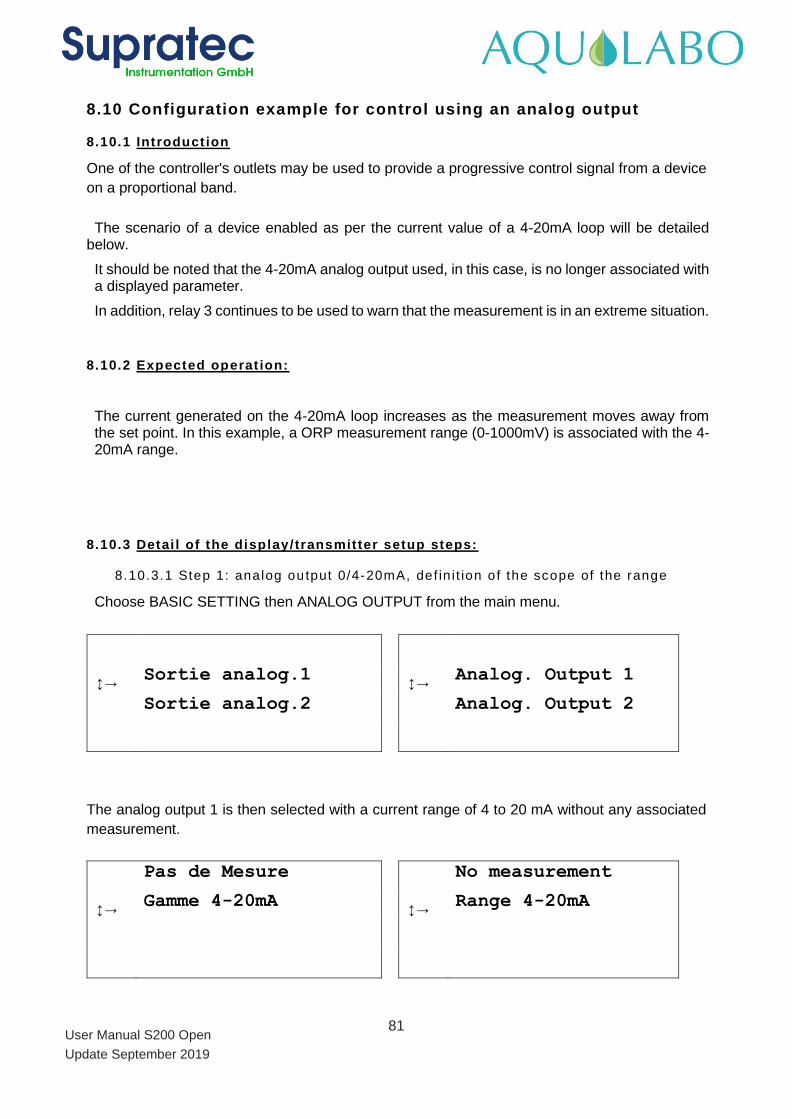
81
User Manual S200 Open
Update September 2019
8.10 Configuration example for control using an analog output
8.10.1 Introduct ion
One of the controller's outlets may be used to provide a progressive control signal from a device
on a proportional band.
The scenario of a device enabled as per the current value of a 4-20mA loop will be detailed below.
It should be noted that the 4-20mA analog output used, in this case, is no longer associated with a displayed parameter.
In addition, relay 3 continues to be used to warn that the measurement is in an extreme situation.
8.10.2 Expected operat ion:
The current generated on the 4-20mA loop increases as the measurement moves away from the set point. In this example, a ORP measurement range (0-1000mV) is associated with the 4-20mA range.
8.10.3 Detai l of the display/transmitter setup steps:
8.10.3.1 Step 1: analog ou tput 0/4-20mA, def in i t ion of the scope of the range
Choose BASIC SETTING then ANALOG OUTPUT from the main menu.
→ Sortie analog.1 →
Analog. Output 1
Sortie analog.2
Analog. Output 2
The analog output 1 is then selected with a current range of 4 to 20 mA without any associated
measurement.
Pas de Mesure
No measurement
→ Gamme 4-20mA →
Range 4-20mA
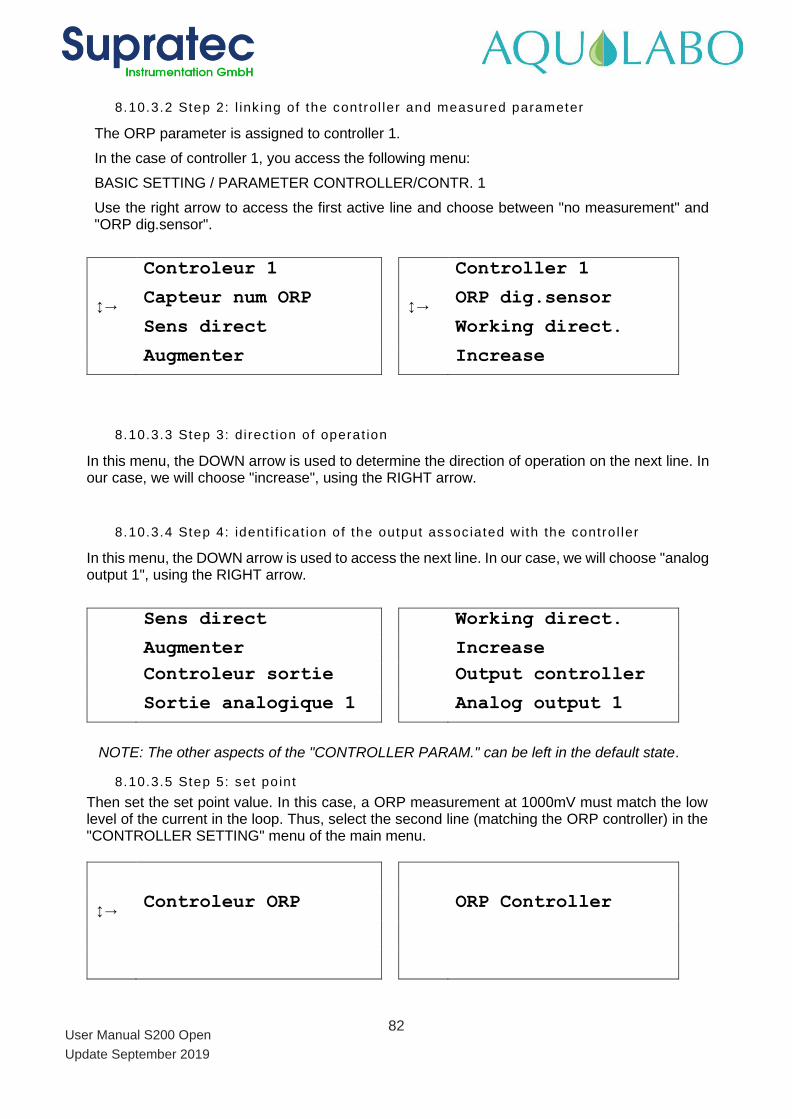
82
User Manual S200 Open
Update September 2019
8.10.3.2 Step 2: l ink ing of the control ler and measured parameter
The ORP parameter is assigned to controller 1.
In the case of controller 1, you access the following menu:
BASIC SETTING / PARAMETER CONTROLLER/CONTR. 1
Use the right arrow to access the first active line and choose between "no measurement" and "ORP dig.sensor".
Controleur 1
Controller 1
→ Capteur num ORP →
ORP dig.sensor
Sens direct
Working direct.
Augmenter
Increase
8.10.3.3 Step 3: di rec t ion of operat ion
In this menu, the DOWN arrow is used to determine the direction of operation on the next line. In our case, we will choose "increase", using the RIGHT arrow.
8.10.3.4 Step 4: ident i f icat ion of the output assoc iated with the contro l ler
In this menu, the DOWN arrow is used to access the next line. In our case, we will choose "analog output 1", using the RIGHT arrow.
Sens direct
Working direct.
Augmenter Increase
Controleur sortie
Output controller
Sortie analogique 1
Analog output 1
NOTE: The other aspects of the "CONTROLLER PARAM." can be left in the default state.
8.10.3.5 Step 5: set point
Then set the set point value. In this case, a ORP measurement at 1000mV must match the low level of the current in the loop. Thus, select the second line (matching the ORP controller) in the "CONTROLLER SETTING" menu of the main menu.
→ Controleur ORP ORP Controller
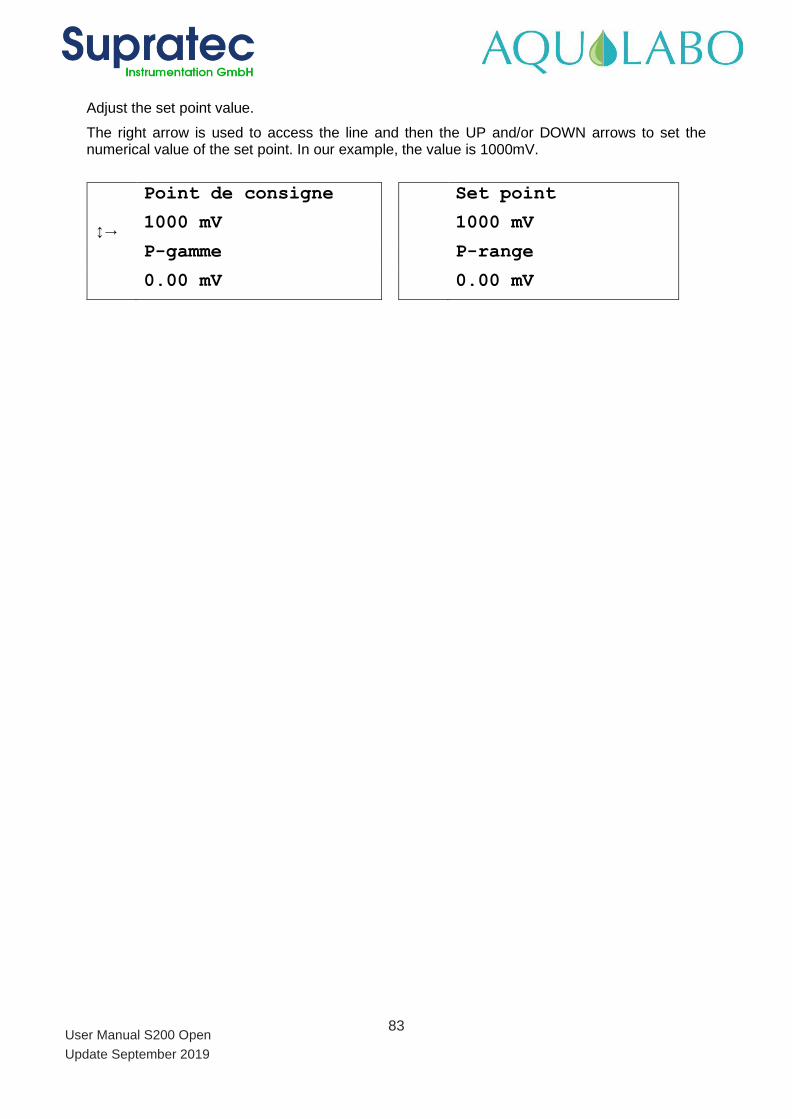
83
User Manual S200 Open
Update September 2019
Adjust the set point value.
The right arrow is used to access the line and then the UP and/or DOWN arrows to set the numerical value of the set point. In our example, the value is 1000mV.
Point de consigne
Set point
→ 1000 mV 1000 mV
P-gamme
P-range
0.00 mV
0.00 mV
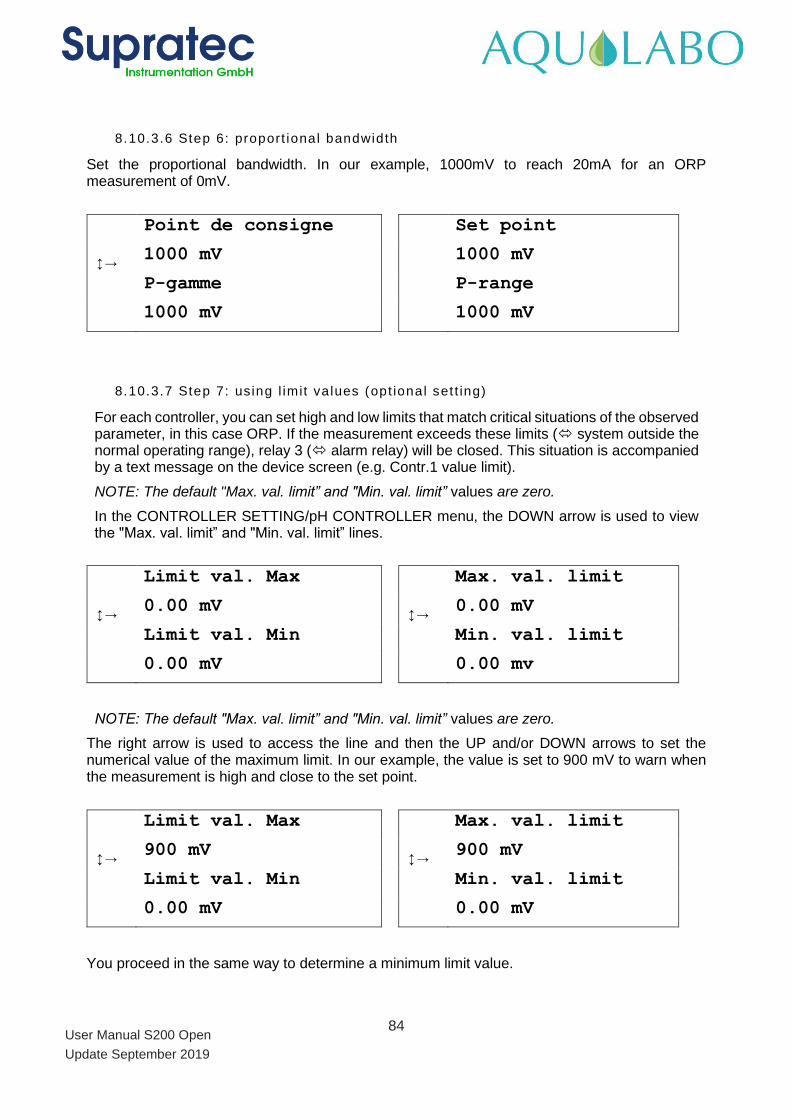
84
User Manual S200 Open
Update September 2019
8.10.3.6 Step 6: proport ional bandwidth
Set the proportional bandwidth. In our example, 1000mV to reach 20mA for an ORP measurement of 0mV.
Point de consigne
Set point
→ 1000 mV 1000 mV
P-gamme
P-range
1000 mV
1000 mV
8.10.3.7 Step 7: using l imit va lues (opt ional set t ing)
For each controller, you can set high and low limits that match critical situations of the observed parameter, in this case ORP. If the measurement exceeds these limits ( system outside the normal operating range), relay 3 ( alarm relay) will be closed. This situation is accompanied by a text message on the device screen (e.g. Contr.1 value limit).
NOTE: The default "Max. val. limit” and "Min. val. limit” values are zero.
In the CONTROLLER SETTING/pH CONTROLLER menu, the DOWN arrow is used to view the "Max. val. limit” and "Min. val. limit” lines.
Limit val. Max
Max. val. limit
→ 0.00 mV →
0.00 mV
Limit val. Min
Min. val. limit
0.00 mV
0.00 mv
NOTE: The default "Max. val. limit” and "Min. val. limit” values are zero.
The right arrow is used to access the line and then the UP and/or DOWN arrows to set the numerical value of the maximum limit. In our example, the value is set to 900 mV to warn when the measurement is high and close to the set point.
Limit val. Max
Max. val. limit
→ 900 mV →
900 mV
Limit val. Min
Min. val. limit
0.00 mV
0.00 mV
You proceed in the same way to determine a minimum limit value.
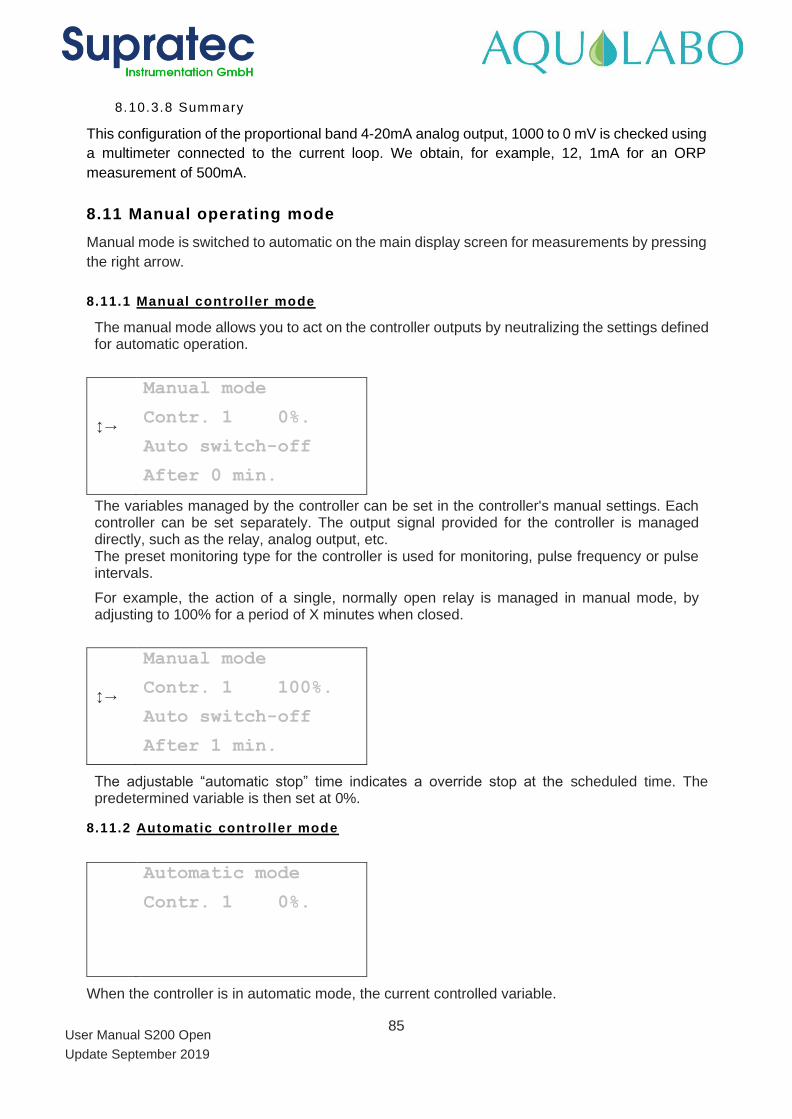
85
User Manual S200 Open
Update September 2019
8.10.3.8 Summary
This configuration of the proportional band 4-20mA analog output, 1000 to 0 mV is checked using
a multimeter connected to the current loop. We obtain, for example, 12, 1mA for an ORP
measurement of 500mA.
8.11 Manual operating mode
Manual mode is switched to automatic on the main display screen for measurements by pressing
the right arrow.
8.11.1 Manual control ler mode
The manual mode allows you to act on the controller outputs by neutralizing the settings defined for automatic operation.
Manual mode
→ Contr. 1 0%.
Auto switch-off
After 0 min.
The variables managed by the controller can be set in the controller's manual settings. Each controller can be set separately. The output signal provided for the controller is managed directly, such as the relay, analog output, etc. The preset monitoring type for the controller is used for monitoring, pulse frequency or pulse intervals.
For example, the action of a single, normally open relay is managed in manual mode, by adjusting to 100% for a period of X minutes when closed.
Manual mode
→ Contr. 1 100%.
Auto switch-off
After 1 min.
The adjustable “automatic stop” time indicates a override stop at the scheduled time. The predetermined variable is then set at 0%.
8.11.2 Automatic controller mode
Automatic mode
Contr. 1 0%.
When the controller is in automatic mode, the current controlled variable.
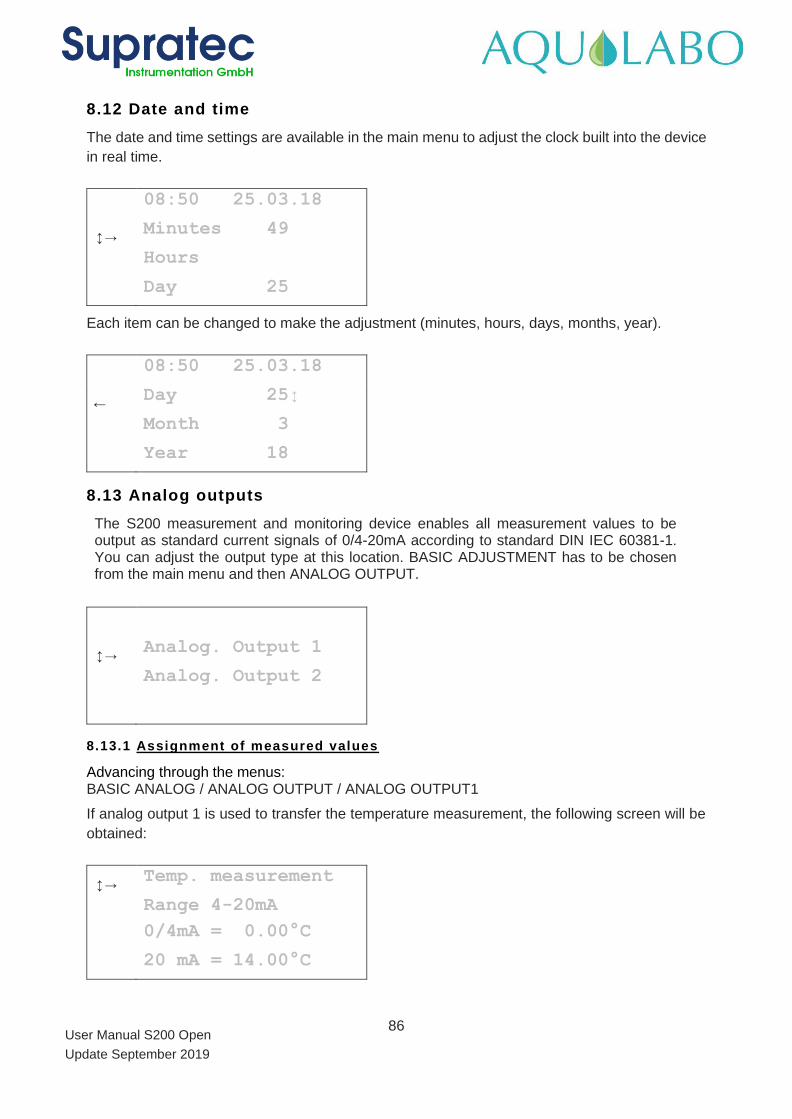
86
User Manual S200 Open
Update September 2019
8.12 Date and time
The date and time settings are available in the main menu to adjust the clock built into the device
in real time.
08:50 25.03.18
→ Minutes 49
Hours
Day 25
Each item can be changed to make the adjustment (minutes, hours, days, months, year).
08:50 25.03.18
← Day 25
Month 3
Year 18
8.13 Analog outputs
The S200 measurement and monitoring device enables all measurement values to be output as standard current signals of 0/4-20mA according to standard DIN IEC 60381-1. You can adjust the output type at this location. BASIC ADJUSTMENT has to be chosen from the main menu and then ANALOG OUTPUT.
→ Analog. Output 1
Analog. Output 2
8.13.1 Assignment of measured values
Advancing through the menus: BASIC ANALOG / ANALOG OUTPUT / ANALOG OUTPUT1
If analog output 1 is used to transfer the temperature measurement, the following screen will be
obtained:
→ Temp. measurement
Range 4-20mA
0/4mA = 0.00°C
20 mA = 14.00°C
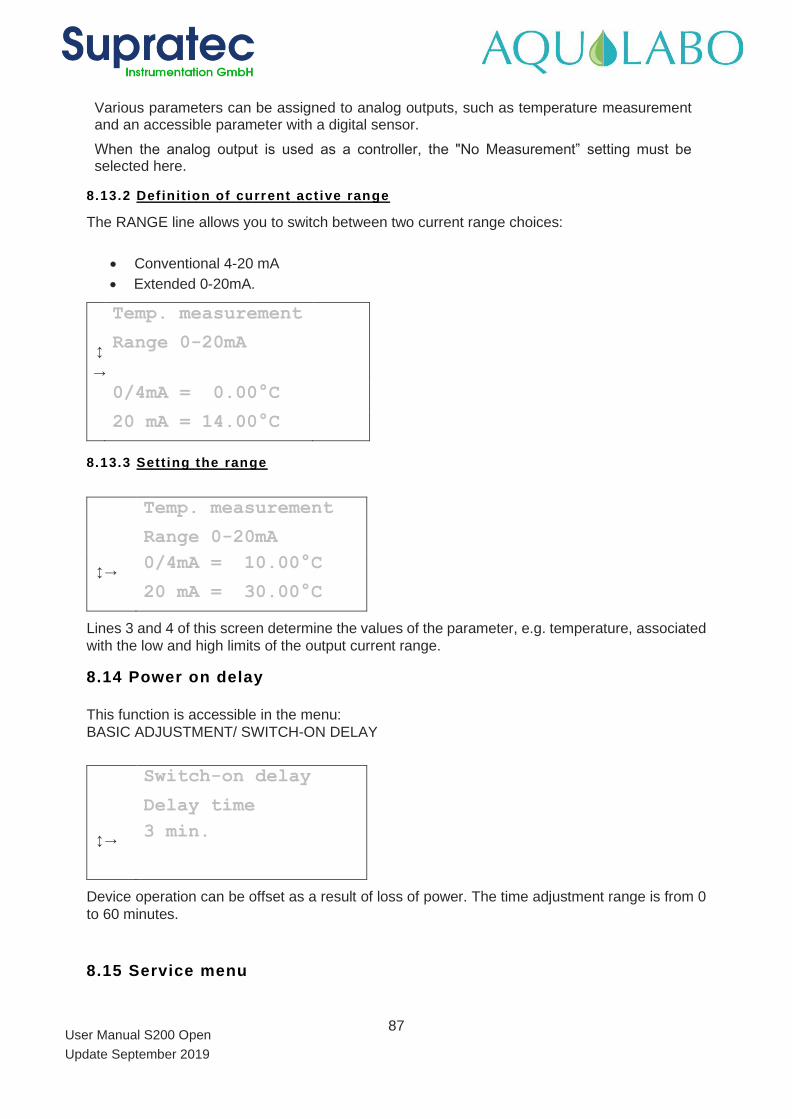
87
User Manual S200 Open
Update September 2019
Various parameters can be assigned to analog outputs, such as temperature measurement and an accessible parameter with a digital sensor.
When the analog output is used as a controller, the "No Measurement” setting must be selected here.
8.13.2 Def init ion of current act ive range
The RANGE line allows you to switch between two current range choices:
• Conventional 4-20 mA
• Extended 0-20mA.
Temp. measurement
→
Range 0-20mA
0/4mA = 0.00°C
20 mA = 14.00°C
8.13.3 Sett ing the range
Temp. measurement
Range 0-20mA
→ 0/4mA = 10.00°C
20 mA = 30.00°C
Lines 3 and 4 of this screen determine the values of the parameter, e.g. temperature, associated
with the low and high limits of the output current range.
8.14 Power on delay
This function is accessible in the menu:
BASIC ADJUSTMENT/ SWITCH-ON DELAY
Switch-on delay
Delay time
→ 3 min.
Device operation can be offset as a result of loss of power. The time adjustment range is from 0
to 60 minutes.
8.15 Service menu
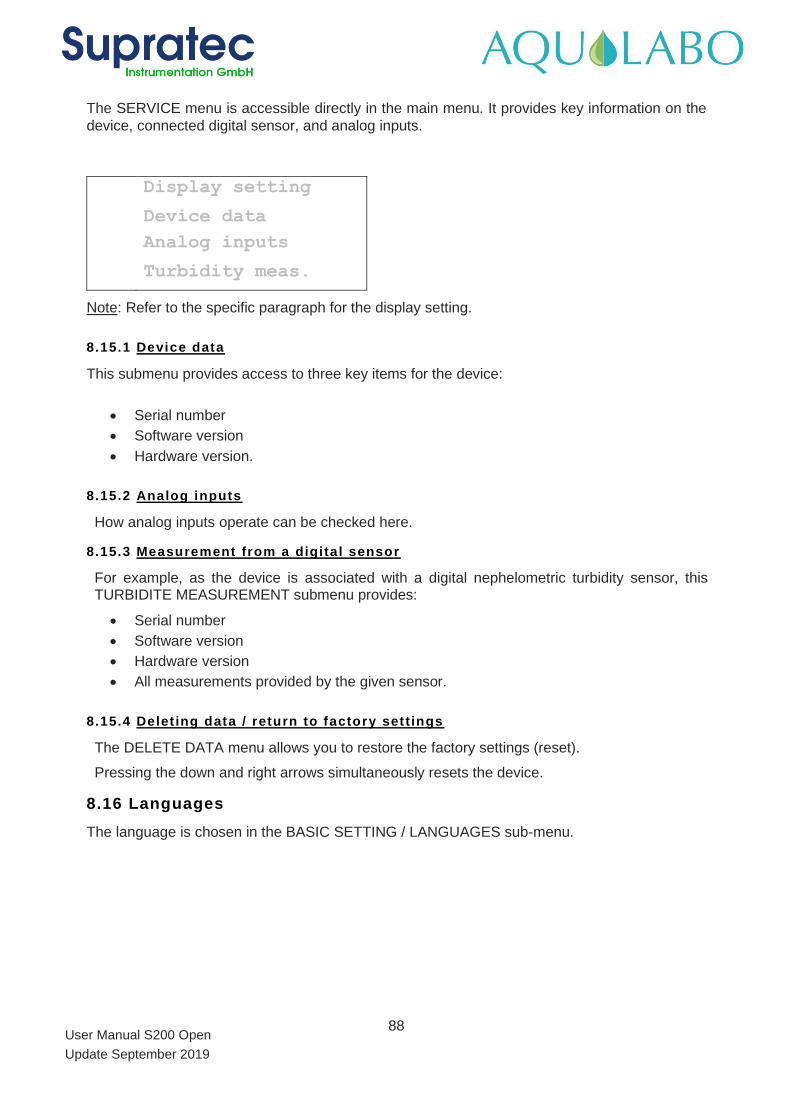
88
User Manual S200 Open
Update September 2019
The SERVICE menu is accessible directly in the main menu. It provides key information on the
device, connected digital sensor, and analog inputs.
Display setting
Device data
Analog inputs
Turbidity meas.
Note: Refer to the specific paragraph for the display setting.
8.15.1 Device data
This submenu provides access to three key items for the device:
• Serial number
• Software version
• Hardware version.
8.15.2 Analog inputs
How analog inputs operate can be checked here.
8.15.3 Measurement from a digital sensor
For example, as the device is associated with a digital nephelometric turbidity sensor, this TURBIDITE MEASUREMENT submenu provides:
• Serial number
• Software version
• Hardware version
• All measurements provided by the given sensor.
8.15.4 Delet ing data / return to factory sett ings
The DELETE DATA menu allows you to restore the factory settings (reset).
Pressing the down and right arrows simultaneously resets the device.
8.16 Languages
The language is chosen in the BASIC SETTING / LANGUAGES sub-menu.
89
User Manual S200 Open
Update September 2019
9 Initial commissioning
9.1 Checking the hardware installation
Warning:
Before connecting the power supply to the device, check the supply voltage with respect to the data plate and compare them.
Check the wiring of the device with respect to the wiring diagram.
9.2 Basic settings of the equipment
Firstly, set the display language for the various menus.
Note that the BASIC SETTING submenu is accessible only after you have entered the Level 3 code, see CODES paragraph.
Refer to the specific paragraphs, using the contents, to define the read and displayed parameters, as well as the entire configuration of the controller, analog outputs, etc.
9.3 External connection module
The 90-94 housing is used for the connection of digital sensors for 12VDC power supply and
RS485 communication. When the S200 device is associated with several sensors, the sensor
connection area can be moved out of the S200 box into an external module (JUNCTION BOX
4020). This external module is then connected to the S200 via a hard-wired connection (energy
and communication).
90
User Manual S200 Open
Update September 2019
10 Maintenance and servicing
10.1 General overview
Be sure to use only a damp cloth to clean the casing. The use of strong, caustic or abrasive cleaning agents (acid cleaners, etc.) is not recommended! The S200 measurement and monitoring device is easy to service, but ensure that a qualified technician checks it and performs maintenance at regular intervals. Please contact us for any other questions regarding our measurement, monitoring and metering system.
10.2 Cleaning and calibration of probes
Depending on the water quality, the probes should be cleaned at intervals of 1 to 6 months (or sooner if required). Calibration is required according to the type of probe.
Warning:
Disable the metering function before removing the probes.
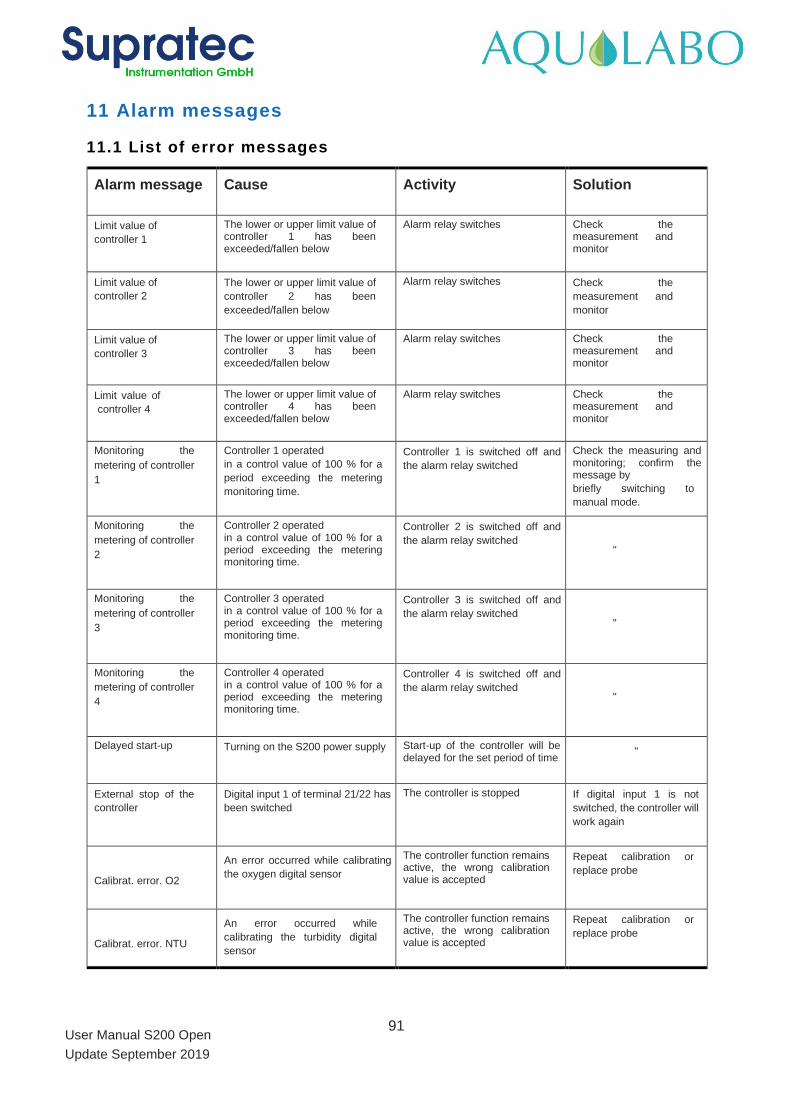
91
User Manual S200 Open
Update September 2019
11 Alarm messages
11.1 List of error messages
Alarm message Cause Activity Solution
Limit value of
controller 1
The lower or upper limit value of controller 1 has been exceeded/fallen below
Alarm relay switches Check the measurement and monitor
Limit value of
controller 2
The lower or upper limit value of
controller 2 has been
exceeded/fallen below
Alarm relay switches Check the
measurement and
monitor
Limit value of
controller 3
The lower or upper limit value of controller 3 has been exceeded/fallen below
Alarm relay switches Check the measurement and monitor
Limit value of
controller 4
The lower or upper limit value of controller 4 has been exceeded/fallen below
Alarm relay switches Check the measurement and monitor
Monitoring the
metering of controller
1
Controller 1 operated
in a control value of 100 % for a
period exceeding the metering
monitoring time.
Controller 1 is switched off and
the alarm relay switched
Check the measuring and monitoring; confirm the message by
briefly switching to
manual mode.
Monitoring the
metering of controller
2
Controller 2 operated in a control value of 100 % for a period exceeding the metering monitoring time.
Controller 2 is switched off and
the alarm relay switched
"
Monitoring the
metering of controller
3
Controller 3 operated in a control value of 100 % for a period exceeding the metering monitoring time.
Controller 3 is switched off and
the alarm relay switched
"
Monitoring the
metering of controller
4
Controller 4 operated in a control value of 100 % for a period exceeding the metering monitoring time.
Controller 4 is switched off and
the alarm relay switched
"
Delayed start-up Turning on the S200 power supply Start-up of the controller will be delayed for the set period of time
"
External stop of the
controller
Digital input 1 of terminal 21/22 has
been switched
The controller is stopped If digital input 1 is not
switched, the controller will
work again
Calibrat. error. O2
An error occurred while calibrating
the oxygen digital sensor
The controller function remains active, the wrong calibration value is accepted
Repeat calibration or
replace probe
Calibrat. error. NTU
An error occurred while
calibrating the turbidity digital
sensor
The controller function remains active, the wrong calibration value is accepted
Repeat calibration or
replace probe
92
User Manual S200 Open
Update September 2019
12 MODBUS RTU
The S200 measurement and control device is equipped with a Modbus RTU interface. This piece of equipment has an RS 485 interface.
Shielding = Terminal 97
A = + Terminal 96
B = - Terminal 95
12.1 Shielding
The use of shielded cables provides high protection against electromagnetic interference, especially high frequencies. However, the effectiveness of the shield depends on the careful installation of the cable. The shielding is located near the main ModBus.
12.2 Communication parameters
Transmission speed: 9,600 bps Data bits: 8
Start-up bits: 1 Shutdown bits: 1
Parity: none
12.3 MODBUS functions used
The following MODBUS functions are used: • 04 (0x04) Querying registry values - max. reading 40 registers
• 06 (0x06) Single registry writing - writing 1 register.
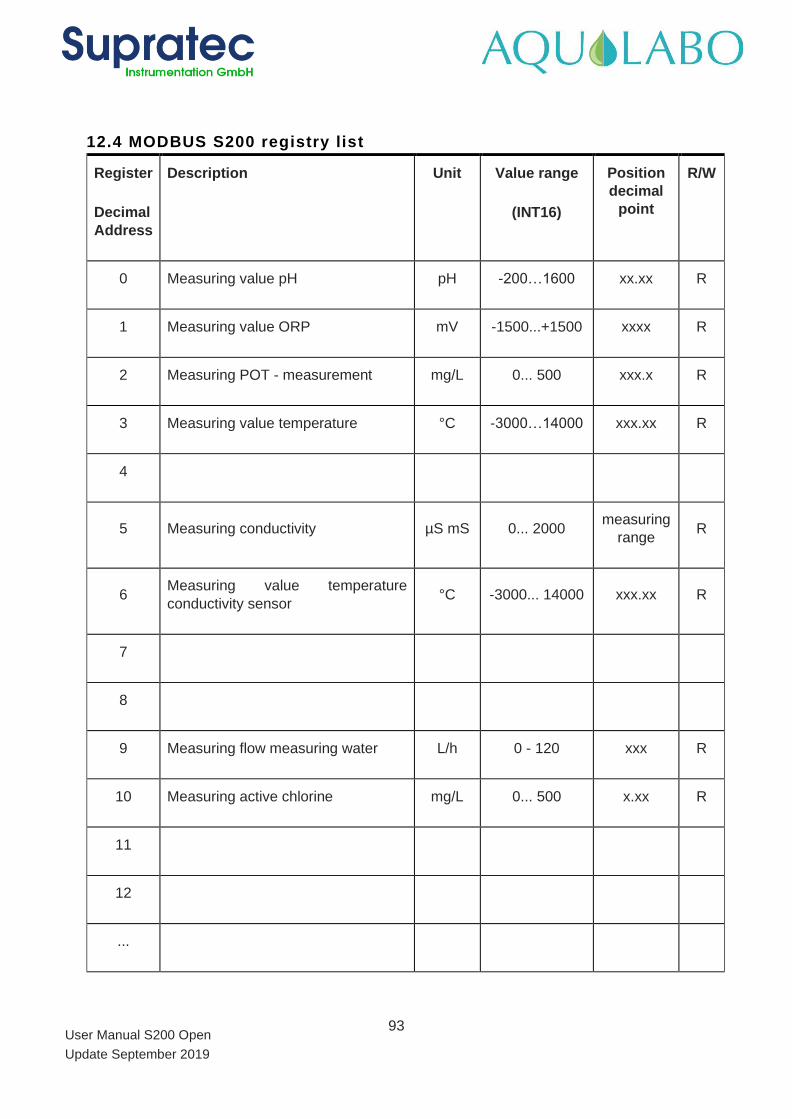
93
User Manual S200 Open
Update September 2019
12.4 MODBUS S200 registry list
Register
Decimal
Address
Description Unit Value range
(INT16)
Position
decimal
point
R/W
0 Measuring value pH pH -200…1600 xx.xx R
1 Measuring value ORP mV -1500...+1500 xxxx R
2 Measuring POT - measurement mg/L 0... 500 xxx.x R
3 Measuring value temperature °C -3000…14000 xxx.xx R
4
5 Measuring conductivity µS mS 0... 2000 measuring
range R
6 Measuring value temperature
conductivity sensor °C -3000... 14000 xxx.xx R
7
8
9 Measuring flow measuring water L/h 0 - 120 xxx R
10 Measuring active chlorine mg/L 0... 500 x.xx R
11
12
...
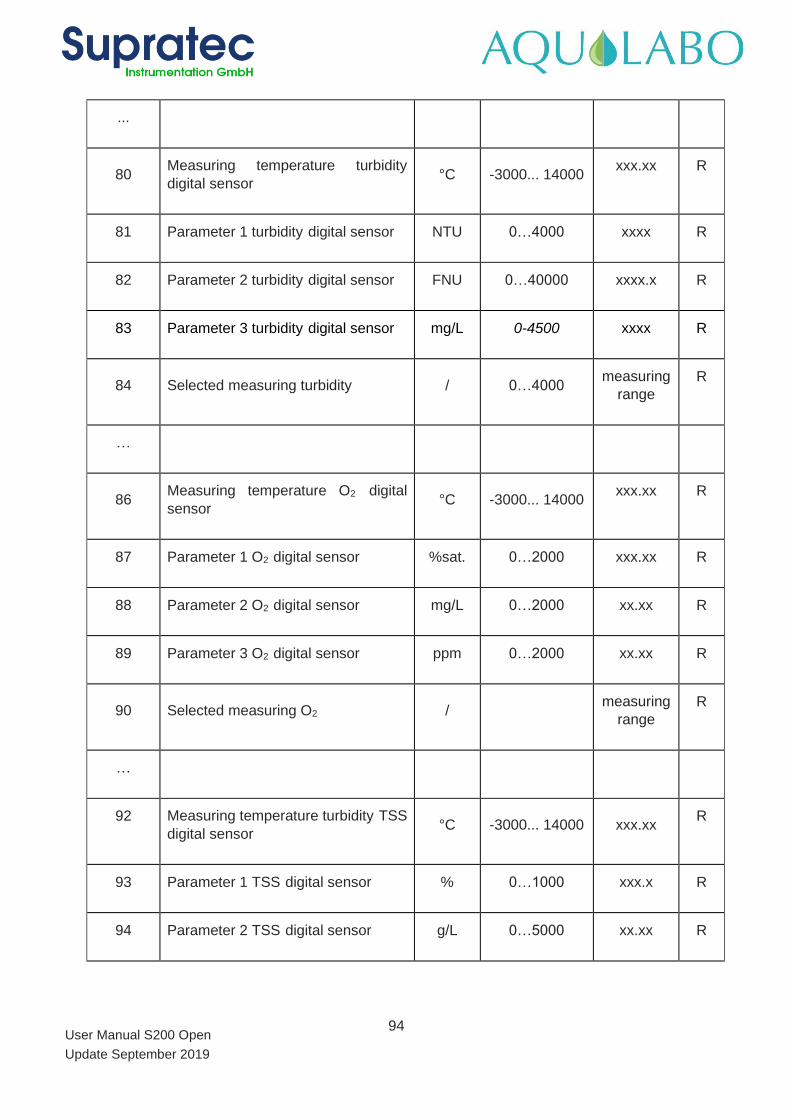
94
User Manual S200 Open
Update September 2019
...
80 Measuring temperature turbidity digital sensor
°C -3000... 14000 xxx.xx R
81 Parameter 1 turbidity digital sensor NTU 0…4000 xxxx R
82 Parameter 2 turbidity digital sensor FNU 0…40000 xxxx.x R
83 Parameter 3 turbidity digital sensor mg/L 0-4500 xxxx R
84 Selected measuring turbidity / 0…4000 measuring
range
R
…
86 Measuring temperature O2 digital
sensor °C -3000... 14000
xxx.xx R
87 Parameter 1 O2 digital sensor %sat. 0…2000 xxx.xx R
88 Parameter 2 O2 digital sensor mg/L 0…2000 xx.xx R
89 Parameter 3 O2 digital sensor ppm 0…2000 xx.xx R
90 Selected measuring O2 / measuring
range
R
…
92 Measuring temperature turbidity TSS
digital sensor °C -3000... 14000 xxx.xx
R
93 Parameter 1 TSS digital sensor % 0…1000 xxx.x R
94 Parameter 2 TSS digital sensor g/L 0…5000 xx.xx R
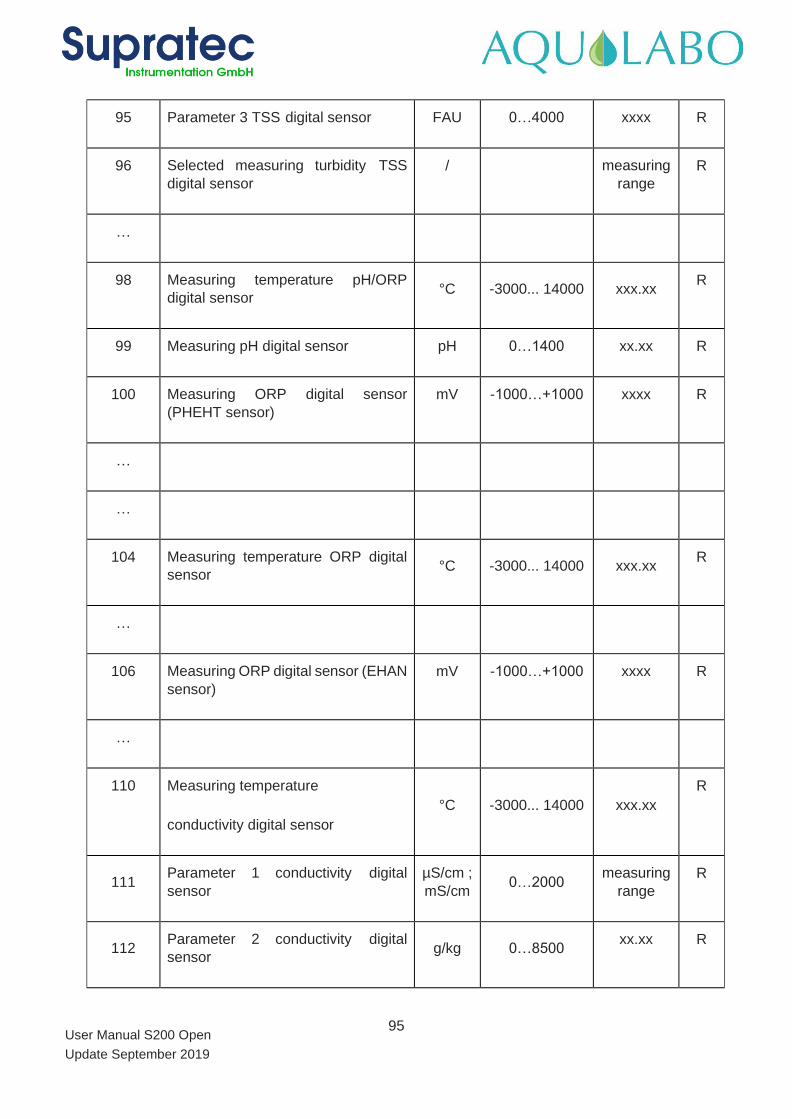
95
User Manual S200 Open
Update September 2019
95 Parameter 3 TSS digital sensor FAU 0…4000 xxxx R
96 Selected measuring turbidity TSS
digital sensor
/ measuring
range
R
…
98 Measuring temperature pH/ORP
digital sensor °C -3000... 14000 xxx.xx
R
99 Measuring pH digital sensor pH 0…1400 xx.xx R
100 Measuring ORP digital sensor
(PHEHT sensor)
mV -1000…+1000 xxxx R
…
…
104 Measuring temperature ORP digital
sensor °C -3000... 14000 xxx.xx
R
…
106 Measuring ORP digital sensor (EHAN
sensor)
mV -1000…+1000 xxxx R
…
110 Measuring temperature
conductivity digital sensor
°C -3000... 14000 xxx.xx
R
111 Parameter 1 conductivity digital
sensor
µS/cm ;
mS/cm 0…2000
measuring
range
R
112 Parameter 2 conductivity digital
sensor g/kg 0…8500
xx.xx R
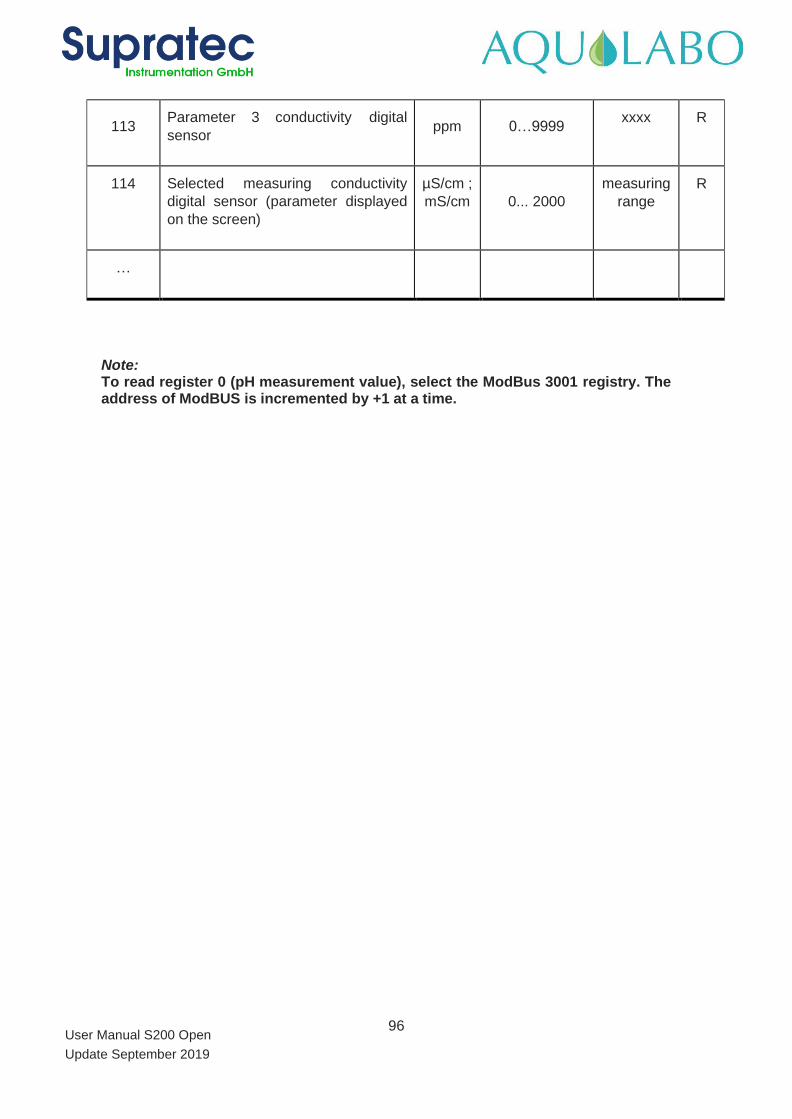
96
User Manual S200 Open
Update September 2019
113 Parameter 3 conductivity digital
sensor ppm 0…9999
xxxx R
114 Selected measuring conductivity
digital sensor (parameter displayed
on the screen)
µS/cm ;
mS/cm 0... 2000
measuring
range
R
…
Note: To read register 0 (pH measurement value), select the ModBus 3001 registry. The address of ModBUS is incremented by +1 at a time.
97
User Manual S200 Open
Update September 2019
13 Sensor - Actuator bus (MODBUS RTU)
The S200 measurement and monitoring device is equipped with a sensor - actuator bus. The Modbus RTU protocol is used. This piece of equipment has an RS 485 interface. Shielding = Terminal 94
A = + Terminal 93
B = - Terminal 92
+12V = terminal 91
0V = terminal 90
A max. load of 200mA is allowed for a 12V power supply.
13.1 Shielding
The use of shielded cables provides high protection against electromagnetic interference, especially high frequencies. However, the effectiveness of the shield depends on the careful installation of the cable.
The shielding is located near the main ModBus.
13.2 Communication parameters
Transmission speed: 9,600 bps
Data bits: 8 Start-up bits: 1
Shutdown bits: 1
Parity: none
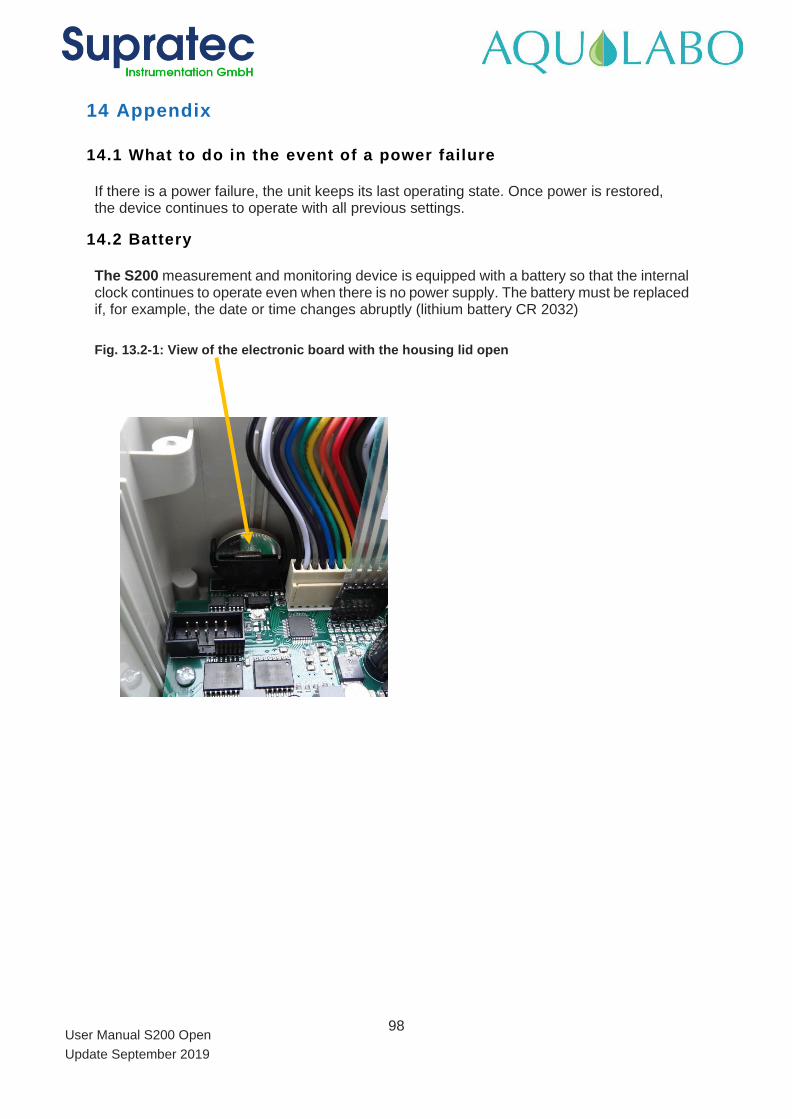
98
User Manual S200 Open
Update September 2019
14 Appendix
14.1 What to do in the event of a power failure
If there is a power failure, the unit keeps its last operating state. Once power is restored, the device continues to operate with all previous settings.
14.2 Battery
The S200 measurement and monitoring device is equipped with a battery so that the internal clock continues to operate even when there is no power supply. The battery must be replaced if, for example, the date or time changes abruptly (lithium battery CR 2032)
Fig. 13.2-1: View of the electronic board with the housing lid open
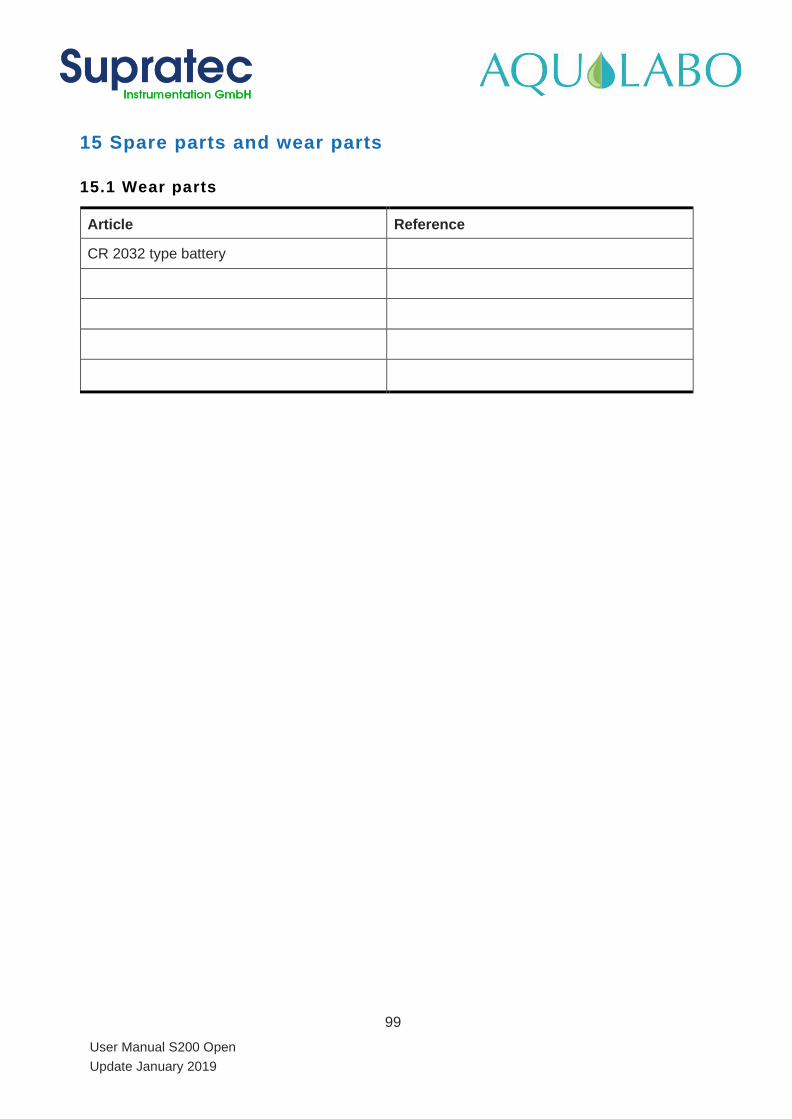
99
User Manual S200 Open
Update January 2019
15 Spare parts and wear parts
15.1 Wear parts
Article Reference
CR 2032 type battery
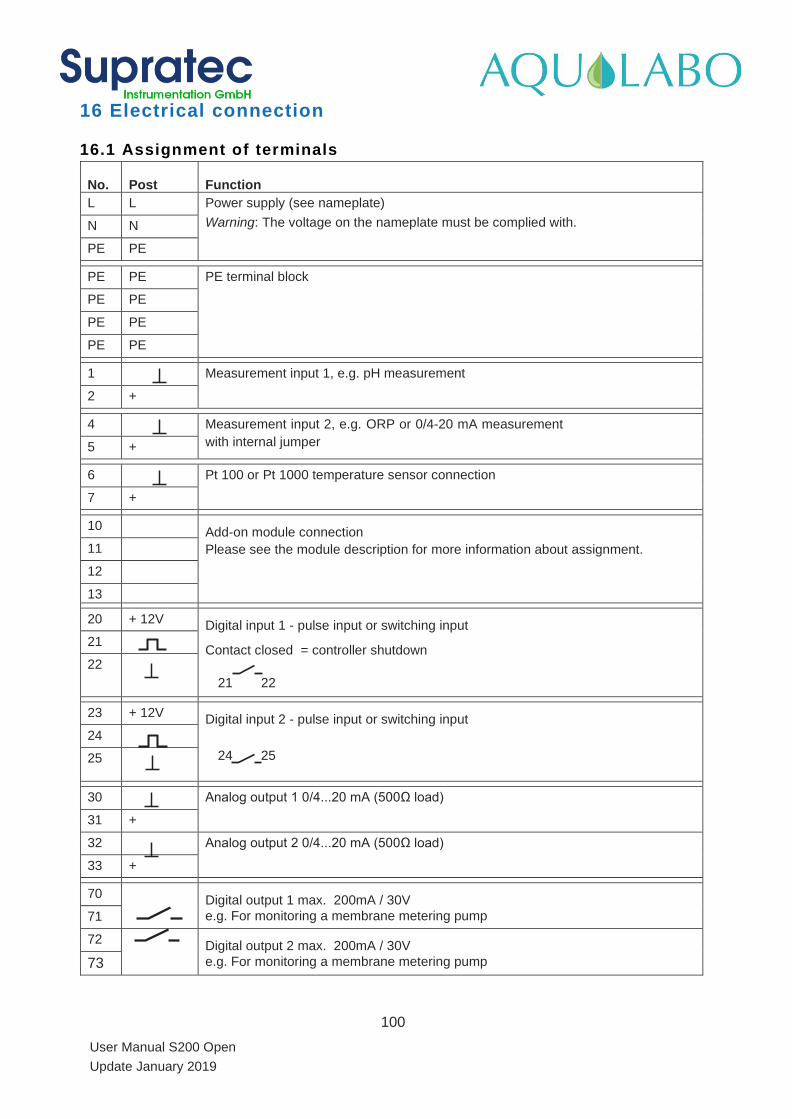
100
User Manual S200 Open
Update January 2019
16 Electrical connection
16.1 Assignment of terminals
No.
Post
Function
L L Power supply (see nameplate)
Warning: The voltage on the nameplate must be complied with. N N
PE PE
PE PE PE terminal block
PE PE
PE PE
PE PE
1 Measurement input 1, e.g. pH measurement
2 +
4 Measurement input 2, e.g. ORP or 0/4-20 mA measurement
with internal jumper 5 +
6 Pt 100 or Pt 1000 temperature sensor connection
7 +
10 Add-on module connection
Please see the module description for more information about assignment. 11
12
13
20 + 12V Digital input 1 - pulse input or switching input
Contact closed = controller shutdown
21 22
21
22
23 + 12V Digital input 2 - pulse input or switching input
24 25
24
25
30 Analog output 1 0/4...20 mA (500Ω load)
31 +
32 Analog output 2 0/4...20 mA (500Ω load)
33 +
70 Digital output 1 max. 200mA / 30V
e.g. For monitoring a membrane metering pump 71
72 Digital output 2 max. 200mA / 30V
e.g. For monitoring a membrane metering pump
73
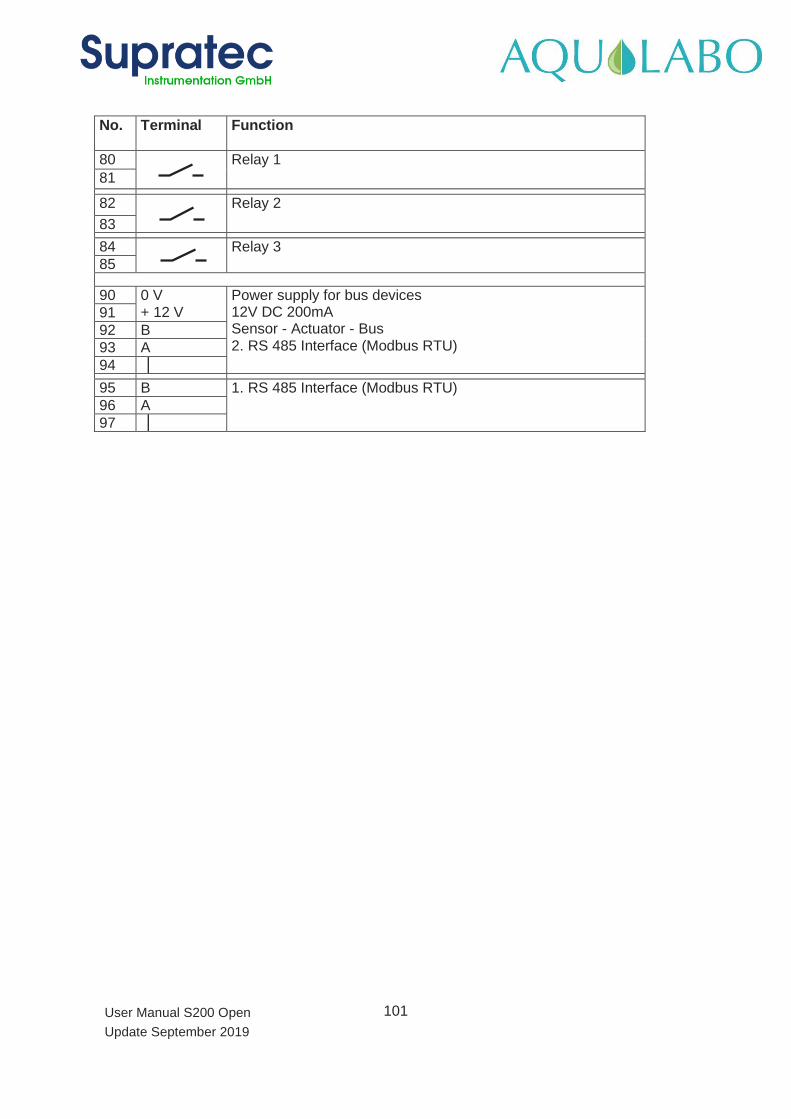
101
User Manual S200 Open
Update September 2019
No. Terminal Function
80 Relay 1
81
82 Relay 2
83
84 Relay 3
85
90 0 V
+ 12 V Power supply for bus devices 12V DC 200mA Sensor - Actuator - Bus 2. RS 485 Interface (Modbus RTU)
91
92 B
93 A
94
95 B 1. RS 485 Interface (Modbus RTU)
96 A
97
102
User Manual S200 Open
Update January 2019
17 Hotline-Aftersales Service contact details
AQUALABO
ZA de Bellevue
115 Rue Michel Marion
56850 CAUDAN
FRANCE
Hotline: +33 (0) 4.11.71.97.41