sabina kramar mechanical and microstructural vilma …
TRANSCRIPT
Chemical Industry & Chemical Engineering Quarterly
Available on line at
Association of the Chemical Engineers of Serbia AChE www.ache.org.rs/CICEQ
Chem. Ind. Chem. Eng. Q. 21 (1) 13−22 (2015) CI&CEQ
13
SABINA KRAMAR VILMA DUCMAN
Slovenian National Building and Civil Engineering Institute,
Ljubljana, Slovenia
SCIENTIFIC PAPER
UDC 662.613.13:66:543.42
DOI 10.2298/CICEQ130725042K
MECHANICAL AND MICROSTRUCTURAL CHARACTERIZATION OF GEOPOLYMER SYNTHESIZED FROM LOW CALCIUM FLY ASH
Article Highlights • Fly ash geopolymer cured under ambient conditions reached compressive strength up
to 53 MPa • The compressive strength of geopolymers significantly increased with the decrease of
water content • SEM, MIP and BET analysis showed that with a lower w/s factor the structure is
denser Abstract
This study deals with the mechanical and microstructural characterization of geopolymers synthesized from locally available fly ash. A low calcium fly ash was activated using a sodium silicate solution. Samples were characterized by means of flexural and compressive tests, Fourier transform infrared (FTIR) spectroscopy, X-ray powder diffraction (XRD), and scanning electron mic-roscopy (SEM). Porosity and pore size distributions were identified using mer-cury intrusion porosimetry and gas sorption. The compressive strength of the produced geopolymers, which is in the range of 1.6 to 53.3 N/mm2, is strongly related to the water content as well as SiO2/Na2O mass ratio of an alkali acti-vator. The compressive strength significantly increased with decreases in the water content and increased silicon concentration used for the synthesis of geopolymers.
Keywords: geopolymers, fly ash, microstructure, mechanical properties.
Geopolymers are a very promising kind of material, since they have been shown to offer an envi-ronmentally friendly, technically competitive alternat-ive to ordinary Portland cement (OPC) [1–3]. Geopoly-mer binders possess many advanced properties such as fast setting and hardening, excellent bond strength, good long-term properties and durability [4], good ability to immobilize toxic metals [5], and better fire [6] and acid resistance [7]. Besides metakaolin as a typical raw material, geopolymers provide the pot-ential to prepare building materials from waste mater-ials such as fly ash or slag [8]. The choice of the source material for making geopolymers depends on
Correspondence: S. Kramar, Slovenian National Building and Civil Engineering Institute, Dimičeva 12, 1000 Ljubljana, Slo-venia. E-mail: [email protected] Paper received: 25 July, 2013 Paper revised: 22 October, 2013 Paper accepted: 21 December, 2013
factors such as availability, cost, type of application, and specific requirements of the end users.
The use of fly ash as a starting material provides cost and environmental benefits in comparison with other thermally prepared natural raw materials (e.g., metakaolin), since it has a lower incorporated energy and low CO2 emission [9]. Fly ash appears to be the most promising precursor for large-scale industrial production of geopolymer products due to its high workability and low water demand [10]. Besides, as a by-product it is available in huge amounts. Fly ash disposal for coal power stations is an ongoing prob-lem; although fly ash is usually employed in the cement industry as pozzolanic additives, a high per-centage of it is still disposed of in landfills, which results in high management costs. For instance, in Slovenia there are two sources of fly ash (the thermal power plants at Trbovlje and Šoštanj) with over 500,000 tons of fly ash produced per year. Some of it is used as an additive in the cement industry to pro-
S. KRAMAR, V. DUCMAN: MECHANICAL AND MICROSTRUCTURAL… Chem. Ind. Chem. Eng. Q. 21 (1) 13−22 (2015)
14
duce blended cements as well as directly in the pro-duction of concrete, but a vast amount is still available for further processing.
The properties of fly ash geopolymer have been tailored for applications such as replacing ordinary Portland cement [11,12] or ceramic-like materials [13]. The tests conducted on geopolymer mortars reported that most of the 28-day strength was gained during the first two days of curing [14]. Although initial curing at elevated temperatures (between 40 and 95 °C) improves geopolymerization, leading to greater compressive strength of the geopolymer [15], fly ash geopolymers with good mechanical properties can be synthesized at ambient temperature, with high com-pressive strength of up to 65 MPa [16]. Being able to cure at ambient temperature is very important in terms of practical application. The suitability of fly ash as a source material for geopolymers is mainly influ-enced by the content of reactive silica and alumina, Fe2O3 and CaO content, content of vitreous phase, and particle size [17,18]. Low-calcium fly ash (CaO < < 10%) is preferred to high calcium fly ash for the formation of geopolymers, as the presence of calcium in high amounts may affect the polymerization pro-cess [19]. However, the final properties of geopoly-mers are affected by the concentration and type of alkaline solution, curing method and temperature, water content, and ratio of fly ash to alkaline solution [20,21]. It was reported that the type of alkaline liquid is a significant factor affecting the mechanical strength, and that the combination of sodium silicate and sodium hydroxide gave the highest compressive strength [22]. Sometimes, the composition could be optimized by adding sources of alumina or calcium or
by mechanical activation of fly ashes, resulting in higher compressive strength especially in the early ages [14,23–25].
The aim of this research is to investigate the effects of activator concentration (sodium silicate modulus) and water/solid ratio on the mechanical and microstructural properties of fly ash-based geopoly-mer cured under ambient conditions.
EXPERIMENTAL
Materials
Geopolymer samples were prepared from fly ash supplied by a Slovenian thermal power plant, Trbovlje. The chemical composition of the fly ash, determined by chemical analyses according to EN 196-2 [26] and EN 450-1 [27], is given in Table 1. According to EN 197-1 [28], the fly ash is classified as siliceous fly ash. It contains 80.7% particles smaller than 0.045 mm (EN 450-1[27]). The BET surface area of fly ash is 2.31 m2/g. Commercial grade sodium hydroxide (pellets, p.a. 98%, Kemika d.d., Croatia) and aqueous solution of sodium silicate–water glass (modulus n = SiO2/Na2O = 2, ρ = 1.50 g/cm3, Na2O, 15%, SiO2, 30%, H2O, 55%, Silkem d.d., Slovenia) were used as alkali activators for the synthesis of the geopolymeric materials. The sodium silicate solution is the most common alkaline liquid used in geopoly-merization.
Experiment details
Geopolymer pastes were prepared by mixing fly ash with the alkali solution at room temperature. The mix proportions are shown in Table 2. Three different
Table 1. Chemical composition of the fly ash (wt.%), insoluble residue: residue insoluble in hydrochloric acid and potassium hydroxide
SiO2 Al2O3 Fe2O3 CaO MgO SO3 K2O Na2O LOI Insoluble residue
47.11 24.75 10.90 6.31 1.96 2.39 2.27 1.52 2.67 19.44
Table 2. Composition of geopolymer pastes with compressive and flexural strengths of geopolymer pastes after seven days (values areaverages of three measurements)
Sample SiO2/Na2O
of alkali aktivator w/s Fly ash, g Na silicate, g NaOH, g H2O, g
Flexural strength N/mm2
Compressive strengthN/mm2
1 0.45 0.3 45.44 4.7 3.15 11.7 1.8±3.0 14.3±1.9
2 0.85 0.3 43.84 9.44 2.46 9.25 10.6±0.9 40.0±2.8
3 1.48 0.3 40.96 17.98 1.23 4.84 13.0±0.6 48.6±1.1
4 0.45 0.4 45.44 4.7 3.15 16.7 2.0±0.3 1.6±0.3
5 0.85 0.4 43.84 9.44 2.46 14.25 4.3±0.3 20.3±2.5
6 1.48 0.4 40.96 17.98 1.23 9.84 10.5±0.6 28.3±3.7
7 0.45 0.25 45.44 4.7 3.15 9.2 7.7±0.5 28.7±2.0 8 0.85 0.25 43.84 9.44 2.46 6.75 10.9±1.2 53.3±1.2 9 1.48 0.25 40.96 17.98 1.23 2.34 7.8±0.5 39.5±1.0
S. KRAMAR, V. DUCMAN: MECHANICAL AND MICROSTRUCTURAL… Chem. Ind. Chem. Eng. Q. 21 (1) 13−22 (2015)
15
SiO2/Na2O mass ratios (n) of alkaline activators and three different water/solid (w/s) ratios were used. The addition of sodium silicate solution and NaOH was calculated accordingly. The total water in a system includes water from sodium silicate and extra added distilled water. In the preparation of the mixtures, solid NaOH was first dissolved in sodium silicate solution, followed by the addition of water. The solution was then mixed with fly ash for 5 min. Mixtures were cast in molds of 10×10×60 mm3, demolded after one day, and cured at room temperature of 20±1 °C and rel-ative humidity of 60±10%.
Methods
The compressive and flexural strength of the investigated samples was analyzed after seven days using a ToniNORM ID 3100299. Measurements were carried out on three samples per mixture on 10×10×60 mm3 prisms.
The mineral composition of fly ash and selected geopolymer samples was determined by X-Ray powder diffraction (XRD) using a Philips PW3710 X-ray diffractometer equipped with CuKα radiation and a secondary graphite monochromator. Data were collected at 40 kV and a current of 30 mA in the 2θ range from 5 to 70° with a speed of 3.4 °/min. The results were analyzed by X'PertHighScore Plus dif-fraction software using PAN-ICSD (PW3213) powder diffraction files. The samples were ground in an agate mortar to a particle size of less than 50 µm prior to XRD analysis.
The Fourier transform infrared spectroscopy (FTIR) spectra of fly ash and selected geopolymer samples were recorded using a Perkin Elmer Spec-trum 100 spectrometer. Sixty-four signal-averaged scans of the samples were acquired. Powder pellets were pressed from mixtures of samples with KBr at a ratio of about 1:200. The FTIR spectra were recorded with a spectral resolution of 4 cm−1 in the range of 4000–370 cm−1.
The microstructure and chemical composition of the polished cross-sections of the samples were exa-mined by the back-scattered electrons (BSE) image mode of a JEOL 5500 LV low vacuum scanning elec-tron microscope (SEM).
The porosity and pore size distributions of the investigated samples were determined by means of mercury intrusion porosity (MIP). Small blocks, approximately 1 cm3 in size, were dried in an oven for 24 h at 105 °C and analyzed on a Micromeritics Autopore IV 9500 model. Samples were analyzed in the range of 0 to 414 MPa using solid penetrometers.
The N2 sorption isotherms were obtained at 77 K on a Micromeritics ASAP-2020 analyzer under con-tinuous adsorption conditions. Prior to these mea-surements, chip samples (about 1 g) were heated at 200 °C for 2 h and outgassed to 10−3 Torr using Mic-romeritics Flowprep equipment. Gas adsorption anal-ysis in the relative pressure range of 0.05 to 0.3 was used to determine the total specific area – the Brun-auer-Emmett-Teller (BET) surface area of the samp-les [29]. The total pore volume and micropore volume of the samples were calculated using t-plot analysis. The Barrett-Joyner-Halenda (BJH) method was used to obtain pore size distribution curves [30].
RESULTS AND DISCUSSION
Compressive and flexural strength
The compressive and flexural strengths of the geopolymer pastes are given in Table 2. Values of compressive and flexural strength ranged from 1.6 to 52.3 N/mm2 and 1.8 to 13.0 N/mm2, respectively (Table 2). As seen from Figure 1, these values inc-rease with the increase of the SiO2/Na2O mass ratio of alkali activator and decrease significantly with increases in water content (water/solid ratio). Thus, samples with the lowest SiO2/Na2O mass ratio have the lowest values of compressive strength, which, however, decrease with the w/s ratio. For example, the compressive strength of sample 8 with a w/s ratio 0.25 is 53.3 N/mm2, while the compressive strength of specimen 5 with a w/s ratio of 0.4 is 20.3 N/mm2. If samples 1–3, 4–6, and 7–9 are compared, it is evident that the presence of dissolved silicon in the aqueous solution of sodium silicate contributes to the increase of compressive strength. An increase in the SiO2/ /Na2O mass ratio from 0.45 to 0.85 causes a per-ceptible increase of the compressive strength, but further increases in the silicon concentration do not influence the compressive strength significantly. The higher concentration of dissolved silicon in the system normally led to higher strength, but only up to a cer-tain value [22,31]. The further increase in the con-centration of silicon led to a decrease in the com-pressive strength, as observed in sample 9 in our case. This could be a result of the amount of unre-acted material, which increases with silicon concen-tration and has a deleterious effect on the mechanical strength of geopolymers [32]. Moreover, it could be connected to the viscosity of sodium silicate solution, as it increases with the SiO2/Na2O increase and w/s decrease and thus hindered mass transport through solution. Besides, these results indicate that the w/s ratio played an important role in the development of

S. KRAMAR, V. DUCMAN: MECHANICAL AND MICROSTRUCTURAL… Chem. Ind. Chem. Eng. Q. 21 (1) 13−22 (2015)
16
compressive strength, illustrating the effect of the w/s ratio on geopolymer strength development, which is similar to OPC concrete. A similar trend is also observed for samples 7, 4 and 1, as well as for samples 9, 6, and 3.
XRD and FTIR spectroscopy
The basic material of the fly ash based geopolymer is of a prevailingly amorphous character. The XRD patterns of the geopolymers are clearly dif-ferent from that of the original fly ash (Figure 2). Besides the amorphous phase (broad hump due to the glass content, appearing at around 25° 2θ),
quartz, mullite, anorthite, haematite, anhydrite and maghaemite are present in the source material. After the process of geopolymerization, the original broad peak of fly ash is shifted to the higher values of 2θ angles (30° 2θ), indicating the dissolution of the fly ash amorphous phase and the formation of a new amorphous phase in the geopolymer [33].
The FTIR spectra for fly ash and geopolymer pastes are shown in Figure 3. The main feature of the FTIR spectra was the central band at around 1078 cm-1, which is attributed to the Si–O–Si or Al–O–Si asymmetric stretching mode. The main spectral band
Figure 1. Compressive strength of geopolymer pastes as a function of w/s and SiO2/Na2O mass ratios.
Figure 2. XRD Patterns of fly ash and geopolymer pastes.

S. KRAMAR, V. DUCMAN: MECHANICAL AND MICROSTRUCTURAL… Chem. Ind. Chem. Eng. Q. 21 (1) 13−22 (2015)
17
originally appearing in fly ash at about 1078 cm-1 shifted to lower frequencies after geopolymerization took place. The larger the shift, the higher the degree of penetration of Al from the glassy part of the fly ash into the (SiO4)
4- net [34,35]. An increase in the SiO2/ /Na2O mass ratios (samples 1–3) contributed to a dec-rease in the main band at 1078 cm-1 in fly ash to 1015 cm-1 in sample 3. On the other hand, this decrease ranged between 48 and 69 cm-1 depending on the w/s ratio (samples 2, 5 and 8). This indicates that the geopolymerization process is influenced by both para-meters. Significant broad bands were observed at approximately 3450 and 1640 cm-1 for the O–H stretch-ing mode and O-H bending mode. The presence of quartz is shown by a characteristic doublet at around
796 and 776 cm-1 and it is present in all samples. Another spectral band at around 1440 cm-1 appeared in all the geopolymer samples, but is absent in the fly ash. This band is characteristic of the asymmetric CO3 stretching mode, which suggests the presence of sodium carbonate as a result of the reaction between excess sodium and atmospheric carbon dioxide [9,35]. Excess sodium content can form sodium car-bonate by atmospheric carbonation and may disrupt
the polymerization process [36]. Particularly in the case of low-Ca alkali activated materials, carbonation tends to form sodium carbonates and bicarbonates, which are more soluble than the CaCO3 formed by carbonation of OPC and may therefore act as an alkali sink and/or play a buffering role in the pore sol-ution [37].
SEM
The microstructure of fly ash-based geopolymer is characterised by the heterogeneous matrix of geo-polymeric gel and unreacted fly ash particles. Closed spherical pores are present, formed either as a result of the dissolution of original fly ash particles (part of the particle is still present), or by the air entrained during the preparation. Fly ash is known to contain a significant proportion of particles with hollow spheres. When these hollow spherical particles are partially dissolved they create porosity in the matrix, which thus contains highly dispersed small sized pores [8]. When compared samples with the same w/s ratio, in sample with the lowest Na2O/SiO2 mass ratio of the alkali activator poor connection among the grains was observed due to the small amount of matrix, whereas
Figure 3. FTIR Spectra of fly ash and geopolymer pastes.

S. KRAMAR, V. DUCMAN: MECHANICAL AND MICROSTRUCTURAL… Chem. Ind. Chem. Eng. Q. 21 (1) 13−22 (2015)
18
samples with higher activator concentration showed compact matrix (Figure 4). On the other hand, micro-cracks that occur within the matrix and at the interface grains/matrix are abundant in sample with highest SiO2/Na2O mass ratio (sample 3). Furthermore, at constant activator concentration, the sample with the highest w/s ratio showed a more porous matrix with respect to the samples with lower w/s ratio.
Hg-porosimetry and gas sorption
Table 3 shows the parameters that were deter-mined by mercury intrusion porosimetry and gas sorp-tion, while Figure 5 shows the representative pore size distribution for selected geopolymer pastes.
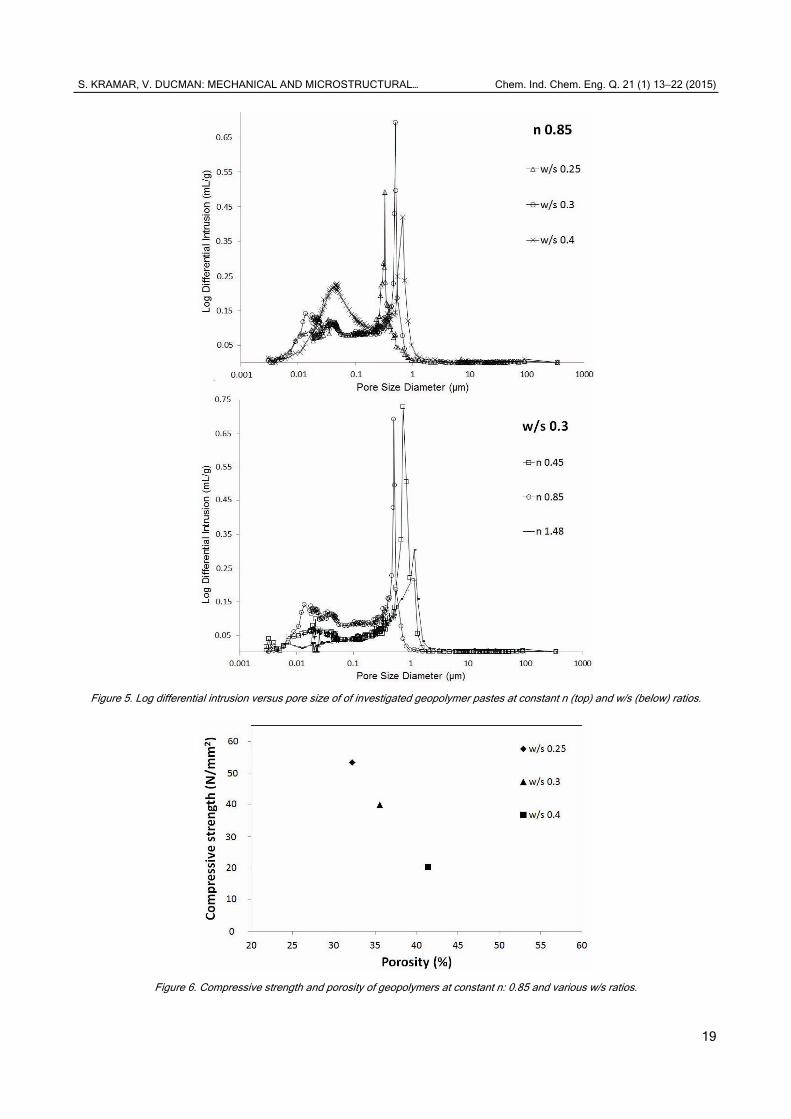
The geopolymers exhibited a rather high por-osity, with porosity values ranging from 30.4 to 41.4%. Similar to the case of compressive strength, the porosity of the geopolymers is influenced sub-stantially by the value of the water/solid ratio [38] as well as by the SiO2/Na2O mass ratio. The porosity of
the geopolymers prepared by increased silicon con-centration was substantially smaller, but larger w/s ratio increased the porosity and a shift toward larger pore sizes could be observed. For instance, sample 8 (w/s = 0.25) developed a porosity of 32.2%, while sample 5 (w/s = 0.4) had a higher porosity of 41.4%. Moreover, the value of porosity of sample 1 with lowest SiO2/Na2O mass ratio (n: 0.45) was 36.2% and that of sample 3 (n: 1.48) was 30.4%. While there were no significant differences in the porosity of samples 1 and 2, a further increase in the SiO2/Na2O mass ratio reduced the porosity, as observed in sample 3. The result showed that even small w/s variation had a strong influence on the porosity values and consequently to the compressive strength. As shown in Figure 6, the porosity and compressive strength of geopolymers are in negative correlation at constant SiO2/Na2O mass ratio and various w/s ratios. The same trend is observed for average pore dia-meter, which ranged from 0.0376 to 0.0773 µm and is
Figure 4. Electron micrographs of fly ash-based geopolymer at constant w/s and various n ratios: a) 0.45, sample 1, b) 0.85, sample 2 and c) 1.48, sample 3.
Table 3. Results of the mercury intrusion measurements and the N2 adsorption measurements of the geopolymer samples investigated
Hg-porosimetry
Sample SiO2/Na2O
of alkali aktivator w/s
Porosity %
Average pore diameter µm
Median pore diameter, µm
Bulk density g/mL
Apparent densityg/mL
1 0.45 0.3 36.18 0.053 0.666 1.44 2.26
2 0.85 0.3 35.53 0.041 0.124 1.49 2.31 3 1.48 0.3 30.41 0.077 0.659 1.58 2.27
5 0.85 0.4 41.44 0.056 0.116 1.36 2.31 8 0.85 0.25 32.20 0.038 0.107 1.58 2.33 9 1.48 0.25 27.86 0.023 0.084 1.67 2.32
N2-adsorption
Sample SiO2/Na2O
of alkali aktivator w/s
BET surface aream2/g
Total pore volume cm3/g
Average pore diameter, nm
Micropore volume, cm3/g
1 0.45 0.3 7.88 0.026 13.26 b.d.l.
2 0.85 0.3 18.53 0.074 15.91 0.000756
3 1.48 0.3 7.98 0.018 9.05 0.000570
5 0.85 0.4 17.12 0.084 19.56 0.000448
8 0.85 0.25 16.00 0.064 15.96 0.000689
S. KRAMAR, V. DUCMAN: MECHANICAL AND MICROSTRUCTURAL… Chem. Ind. Chem. Eng. Q. 21 (1) 13−22 (2015)
19
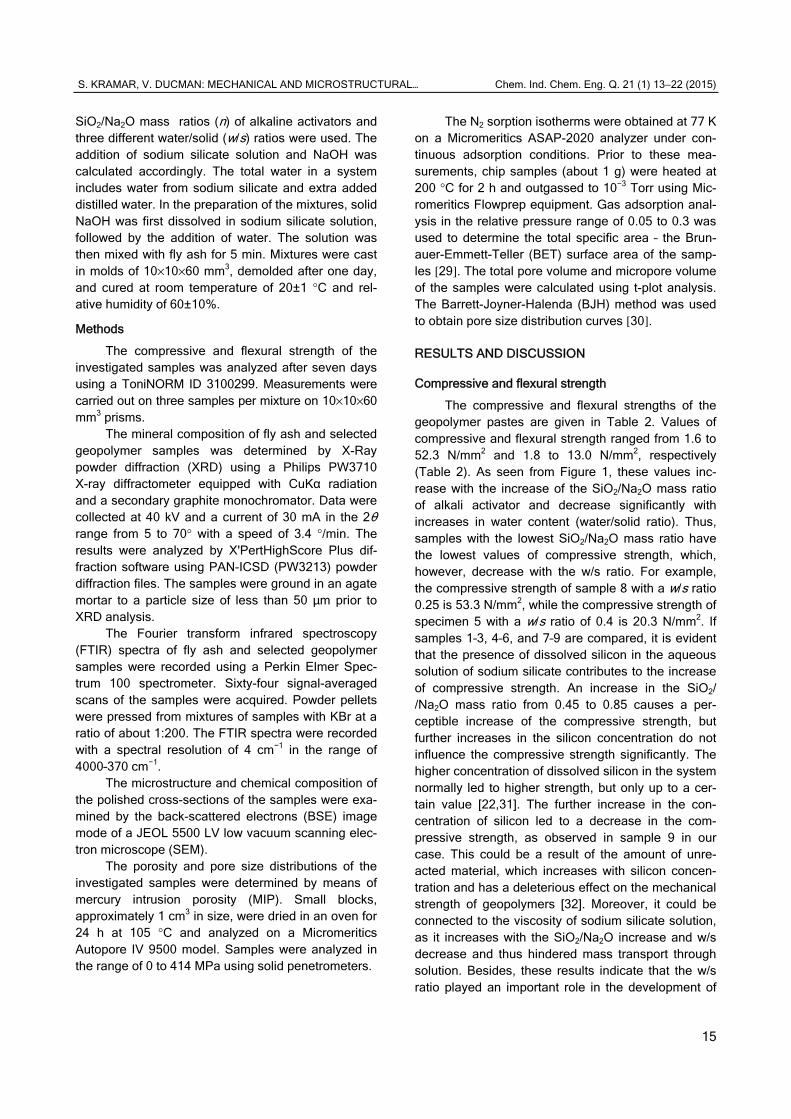
Figure 5. Log differential intrusion versus pore size of of investigated geopolymer pastes at constant n (top) and w/s (below) ratios.
Figure 6. Compressive strength and porosity of geopolymers at constant n: 0.85 and various w/s ratios.
S. KRAMAR, V. DUCMAN: MECHANICAL AND MICROSTRUCTURAL… Chem. Ind. Chem. Eng. Q. 21 (1) 13−22 (2015)
20
smallest for the lowest SiO2/Na2O mass and w/s ratios. The bulk densities of the samples were within the range of 1.36 to 1.58 g/mL, while the apparent densities were within the range of 2.26 to 2.33 g/mL.
The pore size distribution of the geopolymer pastes is unimodally distributed in samples 1 and 3. Samples with different w/s ratios at the same SiO2/Na2O mass ratio of alkali activator all showed bimodal pore size distribution. As shown in Figure 5, at the same SiO2/Na2O mass ratio, the larger intrusion peak is shifted towards smaller pores with decreases of the w/s ratio, that is, from 0.3 (sample 8) to 0.5 µm (sample 5). On the contrary, on changing the SiO2/ /Na2O mass ratio, the larger intrusion peak shifted first towards lower pores and then with further inc-reases of silicon to the higher pores.
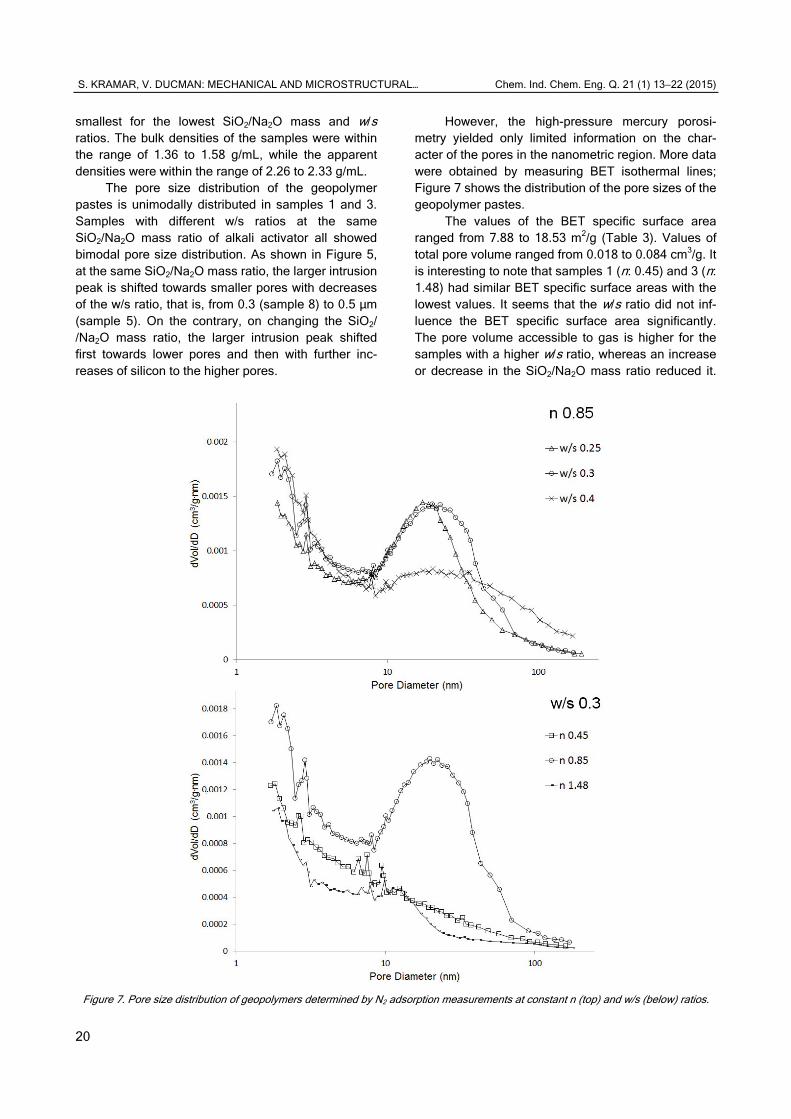
However, the high-pressure mercury porosi-metry yielded only limited information on the char-acter of the pores in the nanometric region. More data were obtained by measuring BET isothermal lines; Figure 7 shows the distribution of the pore sizes of the geopolymer pastes.
The values of the BET specific surface area ranged from 7.88 to 18.53 m2/g (Table 3). Values of total pore volume ranged from 0.018 to 0.084 cm3/g. It is interesting to note that samples 1 (n: 0.45) and 3 (n: 1.48) had similar BET specific surface areas with the lowest values. It seems that the w/s ratio did not inf-luence the BET specific surface area significantly. The pore volume accessible to gas is higher for the samples with a higher w/s ratio, whereas an increase or decrease in the SiO2/Na2O mass ratio reduced it.
Figure 7. Pore size distribution of geopolymers determined by N2 adsorption measurements at constant n (top) and w/s (below) ratios.
S. KRAMAR, V. DUCMAN: MECHANICAL AND MICROSTRUCTURAL… Chem. Ind. Chem. Eng. Q. 21 (1) 13−22 (2015)
21
Values of average pore diameter ranged from 9.05 to 19.56 nm, the highest being for a w/s ratio of 0.4 and the lowest for the highest SiO2/Na2O mass ratio.
Samples 2 and 8 showed a pore size distribution with a clear maximum at around 20 nm (shifted to higher values for sample 8), while sample 5 had a broad peak in the range of 10–80 nm. The pore size diameter was reduced when a higher SiO2/Na2O mass ratio of alkali activator was used (sample 3), while sample 1, for which the lowest modulus (n: 0.45) was used, did not show a clear maximum. These two samples also had the lowest total pore volume. The volume ratio of small pores (< 50 nm) also seemed to be affected by the w/s ratio, which confirmed that decreasing the w/s can reduce the porosity of the geopolymer, as was also found by Zhang et al. [38]. The mesopores (3.6–50 nm) repre-sent the main porous structure, which is the cluster(s) of aluminosilicate particles that constitute the Si-O-Al
network, as shown by Sindhunata et al. [39].
CONCLUSION
Geopolymer based on fly ash was obtained by alkali activation cured under ambient conditions. High strength of fly ash-based geopolymer was obtained by optimizing both sodium silicate solution modulus (n) and water/solid (w/s) ratio. Maximum geopolymer strength of 53 N/mm2 was obtained by using sodium silicate modulus n: 0.85 and w/s: 0.25. An increase in the SiO2/Na2O mass ratio from 0.45 to 0.85 caused a perceptible increase of the compressive strength, but further increasing of the silicon concentration (n: 1.48) did not influence the compressive strength signi-ficantly. This was probably due to the increased vis-cosity of sodium silicate solution with higher modulus, which hindered mass transport through solution and affected strength development. However, the com-pressive strength was reduced significantly with the increase in water/solid ratio; at constant sodium sili-cate solution modulus 0.85 a decrease of w/s ratio from 0.4 to 0.25 increased the compressive strength from 20.3 to 53.3 N/mm2. Microstructural results obtained by SEM, MIP and BET analysis showed that with a lower w/s ratio or higher SiO2/Na2O mass ratio the structure is denser and that the porosity lies in the mesoporous range. Porosity of geopolymer was dec-reased by higher silicon concentration, but larger w/s ratio increased the porosity and a shift toward larger pore sizes could be observed. BET specific surface area is influenced by SiO2/Na2O mass ratio with samples with n = 0.85 having the highest values, whereas w/s ratio did not affect it significantly. A con-
siderable shift in FTIR analysis for the band at around 1078 cm-1, which is attributed to the Si–O–Si or Al–O–Si asymmetric stretching mode, was noticed for all samples, but was highest in the most geopolymerized one, sample 8, as a result of the higher degree of penetration of Al from the glassy part of the fly ash into (SiO4)
4- net. The FTIR results are in good correl-ation with the XRD analysis, where it is also observed that the original broad peak of fly ash representing the glassy phase is shifted to the the higher values of 2θ angles, indicating the dissolution of the fly ash amor-phous phase and the formation of a new amorphous phase in the geopolymer.
Acknowledgements
This work was financially supported by ARRS – Programme group – P2-0273.
REFERENCES
[1] P. Duxon, A. Fernandez-Jimenez, J.L. Provis, G.C. Lukey, A. Palomo, J.S.J. van Deventer, J. Mater. Sci. 42 (2007) 2917–2933
[2] P. Duxon, J.L. Provis, G.C. Lukey, J.S.J. van Deventer, Cem. Concr. Res. 37 (2007) 1590–1597
[3] J.S.J. van Deventer, J.L. Provis, P. Duxon, Miner. Eng. 29 (2012) 89–104
[4] T. Bakharev, Cem. Concr. Res. 35 (2005) 1233–1246
[5] J.Z. Zhang, J.L.Provis, D. Feng, J.S.J. van Deventer, J. Hazard. Mater. 157 (2008) 587–598
[6] T.W. Cheng, J.P. Chiu, Miner. Eng. 16 (2003) 205–210
[7] T. Bakharev, Cem. Concr. Res. 35 (2005) 658–670
[8] D.L.Y. Kong, J.G. Sanjayan, K. Sagoe-Crentsil, Cem. Concr. Res. 37 (2007) 1583–1589
[9] S. Andini, R. Cioffi, F. Colangelo, T. Grieco, F. Montag-naro, L. Sanotor, Waste Manage. 28 (2008) 416–423
[10] J.L. Provis, P. Duxon, J.S.J. van Deventer, Adv. Powder Technol. 21(1) (2010) 2–7
[11] M. Olivia, H.R. Nikraz, ARPN J. Eng. Appl. Sci. 6(7) (2011) 70–78
[12] J. Temuujin, A. van Riessen, K.J.D. MacKenzie, Constr. Build. Mater. 24 (2010) 1906–1910
[13] C. Kaps, M. Hohmann, Adv. Sci. Tech. 69 (2010) 31–40
[14] K. Srinivasan, A. Sivakumar, ARPN J. Eng. Appl. Sci. 7(11) (2012) 1436–1445
[15] S.E.Wallah, Mod. Appl. Sci. 3(12) (2009) 14–21
[16] P. Chindaprasirt, S. Rukzon, V. Sirivivatnanon, Constr. Build. Mater. 22 (2008) 932–938
[17] A. Fernandez-Jimenez, A. Palomo, Fuel 82(18) (2003) 2295–2265
[18] A. Fernandez-Jimenez, I. Garcia-Lodeiro, A. Palomo, J. Mater. Sci. 42 (2007) 3055–3065.
[19] J.T. Gourley, Geopolymers; opportunities for environ-mentally friendly construction materials, Materials 2003 Conference: Adaptive Materials for Modern Society,

S. KRAMAR, V. DUCMAN: MECHANICAL AND MICROSTRUCTURAL… Chem. Ind. Chem. Eng. Q. 21 (1) 13−22 (2015)
22
Sydney, Australia, 2003, Institute of Materials Engineering Australasia, Melbourne, 2003
[20] D. Hardjito, S.E. Wallah, D.M.J. Sumajouw, B.V. Rangan, ACI Mater. J. 101(6) (2004) 467–472
[21] J.G.S. Van Jaarsveld, J.S.J. Van Deventer, G.C. Lukey, Chem. Eng. J. 89(1–3) (2002) 63–73
[22] A. Palomo, M. W. Grutzeck, M.T. Blanco, Cem. Concr. Res. 29(8) (1999) 1323–1329
[23] J.G.S. Van Jaarsveld, J.S.J Van Deventer, G.C. Lukey, Mater. Lett. 57 (2003) 1272–1280
[24] J. Temuujin, R.P Williams, A. van Riessen, J. Mater. Process. Technol. 209 (2009) 5276–5280
[25] E. Obonyo, E. Kamseu, U.C. Melo, C. Leonelli, Sus-tainability 3 (2011) 410–423
[26] EN 196-2, Methods of testing cement – Part 2: Chemical analysis of cement, 2005
[27] EN 450-1, Fly ash for concrete – Part 1: Definition, specifications and conformity criteria, 2013
[28] EN197-1, Cement – Part 1: Composition, specifications and conformity criteria for common cements, 2002
[29] R.W. Adamson, A.P. Gast, in Physical chemistry of surfaces, 6th ed., Wiley, New York, 1997, Ch. 17
[30] E.P. Barrett, J.G. Joyner, P.P. Halenda, J. Am. Chem. Soc. 73 (1951) 373–380
[31] M. Komljenović, Z. Baščarević, V. Bradić, J. Hazard. Mater. 181 (2010) 35–42
[32] P. Duxon, J.L. Provis, G.C. Lukey, S.W. Mallicoat, W.M. Kriven, J.S.J. van Deventer, Colloids Surfaces, A 269 (2005) 47–58
[33] P. De Silva, K. Sagoe-Crenstil, V. Sirivivatnanon, Cem. Concr. Res. 37 (2007) 512–518
[34] D. Khale, R. Chaudhary, J. Mater. Sci. 42 (2007) 729–746
[35] E. Alvarez-Ayuso, X. Querol, F. Plana, A. Alastuey, N. Moreno, M. Izquierdo, O. Font, T. Moreno, S. Fiez, E. Vazquez, M. Barra, J. Hazard. Mater. 154 (2008) 175–183
[36] V.F.F. Barbosa, K.J.D. MacKenzie, Mater. Lett. 57(9–10) (2003) 1477–1482
[37] M. Criado, A. Palomo, A. Fernández-Jiménez, Fuel 84 (2005) 2048–2054
[38] Z. Zhang, X. Yao, H. Zhu, Appl. Clay Sci. 49 (2010) 7–12
[39] Sindthunata, J.S.J. van Deventer, G.C. Lukey, H. Xu, Ind. Eng. Chem. Res. 45 (2006) 3559–3568.
SABINA KRAMAR
VILMA DUCMAN
Slovenian National Building and Civil Engineering Institute, Ljubljana,
Slovenia
NAUČNI RAD
MEHANIČKA I MIKROSTRUKTURNA KARAKTERIZACIJA GEOPOLIMERA SINTETISANOG IZ LETEĆEG PEPELA SA MALIM SADRŽAJEM KALCIJUMA
U ovom radu je izvršena mehanička i mikrostrukturna karakterizacija geopolimera,
sintetisanih iz lokalno dostupnog letećeg pepela. Pepeo sa malim sadržajem kalcijuma je
aktiviran pomoću rastvora natrijum-silikata. Uzorci su okarakterisani pomoću testa savi-
janja i kompresije, FTIR spektroskopijom, rentgenskom difrakcijom i SEM mikroskopijom.
Poroznost i distribucija pora su identifikovani živinom porozimetrijom i sorpcijom gasa.
Čvrstoća proizvedenih geopolimera, koja je u opsegu od 1,6 do 53,3 N/mm2, usko je
povezana sa sadržajem vode, kao i sa masenim odnosom alkalnog aktivatora SiO2/Na2O.
Čvrstoća značajno raste sa smanjenjem sadržaja vode i povećanjem koncentracije
silicijuma korišćenog za sintezu geopolimera.
Ključne reči: geopolimeri, leteći pepeo, mikrostruktura, mehaničke osobine.