safaricom ltd - daily business
TRANSCRIPT

Safaricom Ltd FY 2011 Results Announcement
18th May 2011
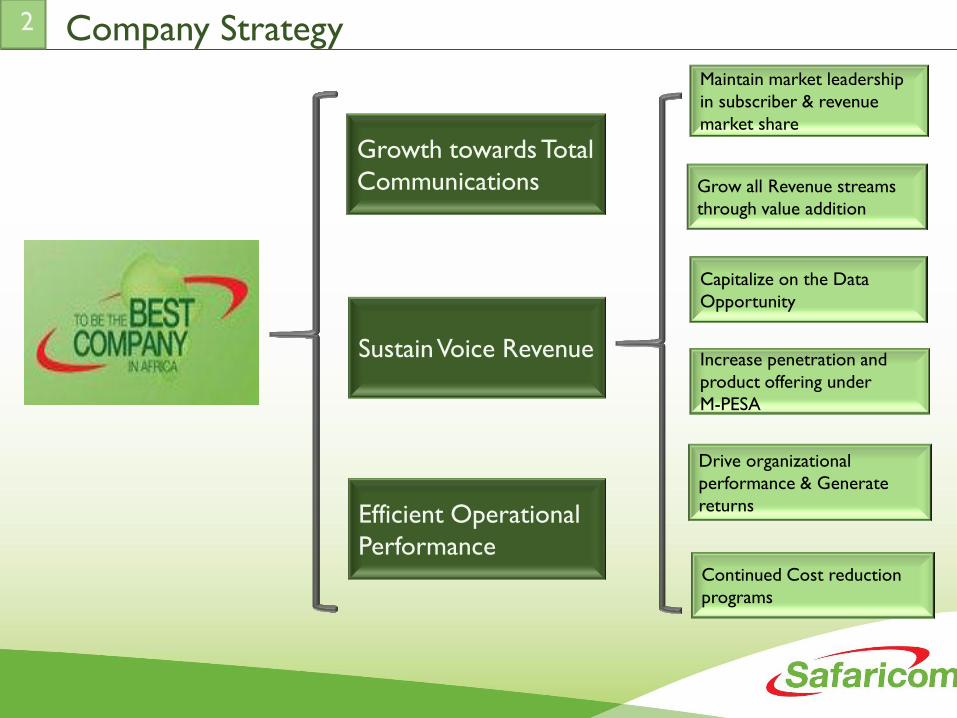
Company Strategy
Continued Cost reduction
programs
Drive organizational
performance & Generate
returns
Grow all Revenue streams
through value addition
Maintain market leadership
in subscriber & revenue
market share
Increase penetration and
product offering under
M-PESA
Capitalize on the Data
Opportunity
Growth towards Total
Communications
Sustain Voice Revenue
Efficient Operational
Performance
2
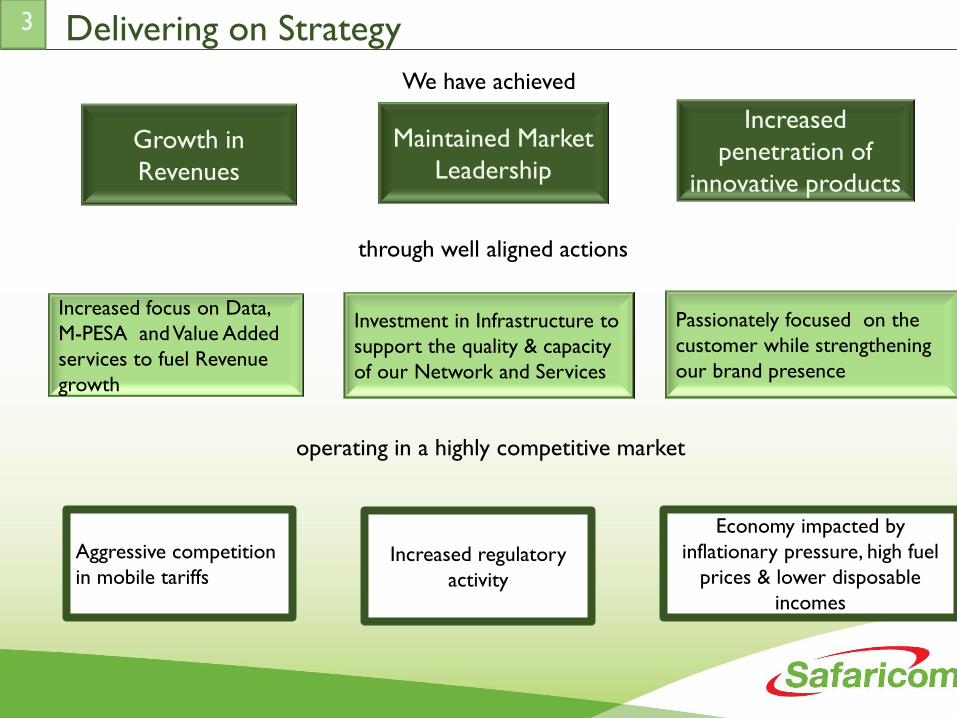
Growth in
Revenues
Maintained Market
Leadership
Increased
penetration of
innovative products
Passionately focused on the
customer while strengthening
our brand presence
Increased focus on Data,
M-PESA and Value Added
services to fuel Revenue
growth
Investment in Infrastructure to
support the quality & capacity
of our Network and Services
We have achieved
through well aligned actions
operating in a highly competitive market
Increased regulatory
activity
Economy impacted by
inflationary pressure, high fuel
prices & lower disposable
incomes
Aggressive competition
in mobile tariffs
Delivering on Strategy 3
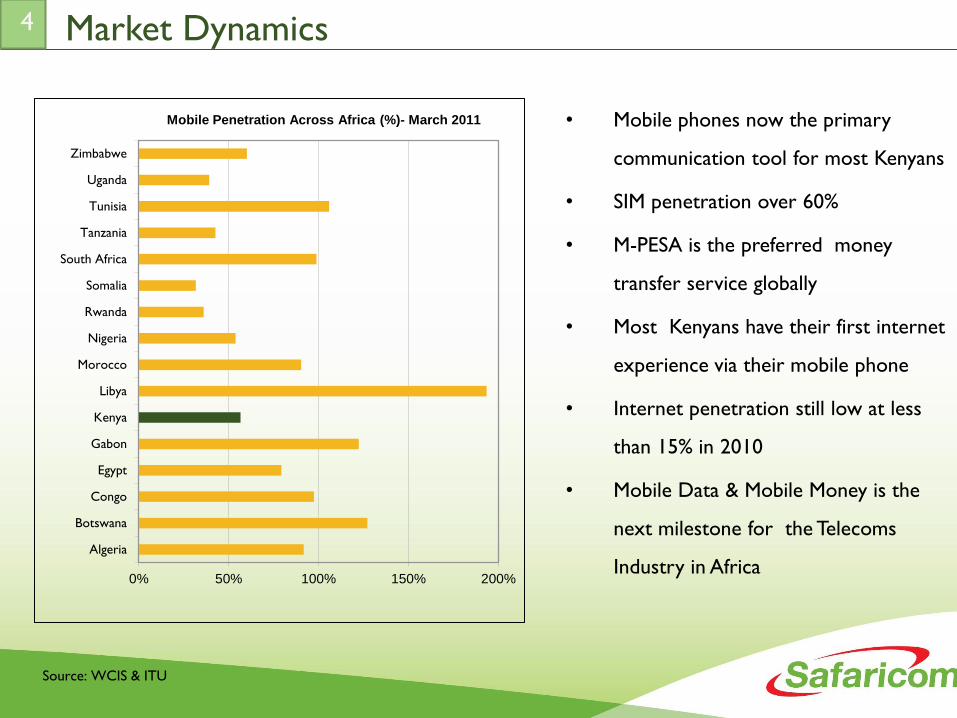
Market Dynamics
Source: WCIS & ITU
4
• Mobile phones now the primary
communication tool for most Kenyans
• SIM penetration over 60%
• M-PESA is the preferred money
transfer service globally
• Most Kenyans have their first internet
experience via their mobile phone
• Internet penetration still low at less
than 15% in 2010
• Mobile Data & Mobile Money is the
next milestone for the Telecoms
Industry in Africa 0% 50% 100% 150% 200%
Algeria
Botswana
Congo
Egypt
Gabon
Kenya
Libya
Morocco
Nigeria
Rwanda
Somalia
South Africa
Tanzania
Tunisia
Uganda
Zimbabwe
Mobile Penetration Across Africa (%)- March 2011
COMPANY PERFORMANCE

Revenue Growth
Mobile & Fixed
Data Revenue
8.0%
SMS
Revenue
5.7%
M-PESA
Revenue
12.4%
45.3%
12.9% growth in Turnover to Ksh. 94.83 bn
9.8% growth in Ongoing Revenue to Ksh. 88.20 bn
Ksh. 5.37bn Ksh. 7.54bn Ksh. 11.78bn
56.0%
80.3%
6
81.2.%
Ksh. 6.64bn
Acquisition
Revenue
7.0%
Voice
Revenue
66.9%
Ksh. 63.5bn
% of Total
Revenue
(1.7%)
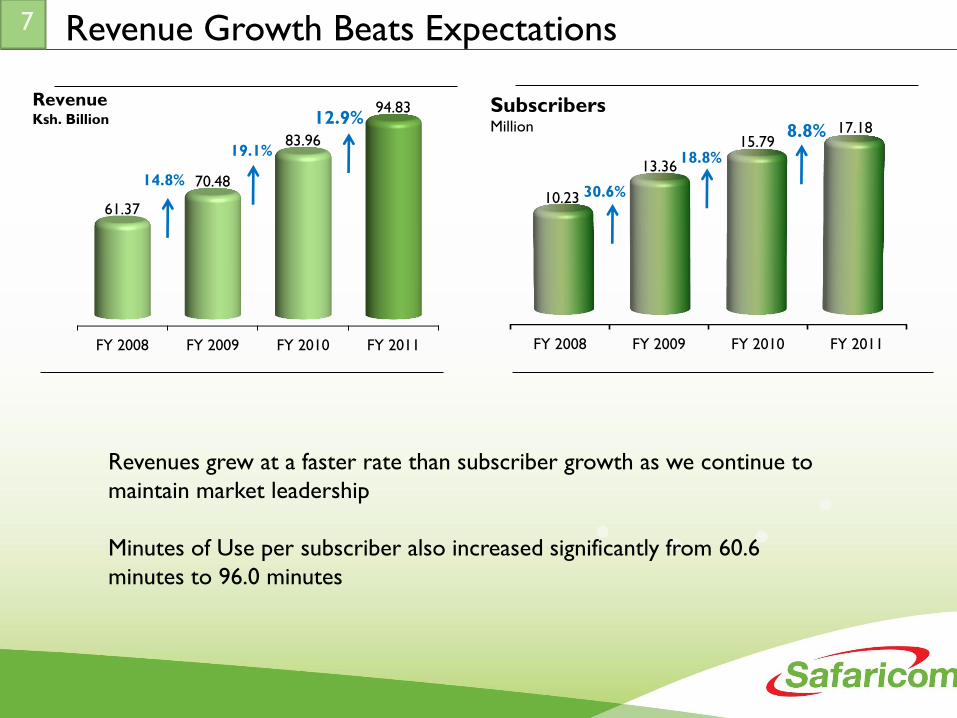
Revenue Growth Beats Expectations
FY 2008 FY 2009 FY 2010 FY 2011
61.37
70.48
83.96
94.83 Revenue Ksh. Billion
14.8%
7
FY 2008 FY 2009 FY 2010 FY 2011
10.23
13.36
15.79 17.18
Subscribers Million 8.8%
12.9%
19.1%
30.6%
18.8%
Revenues grew at a faster rate than subscriber growth as we continue to
maintain market leadership
Minutes of Use per subscriber also increased significantly from 60.6
minutes to 96.0 minutes
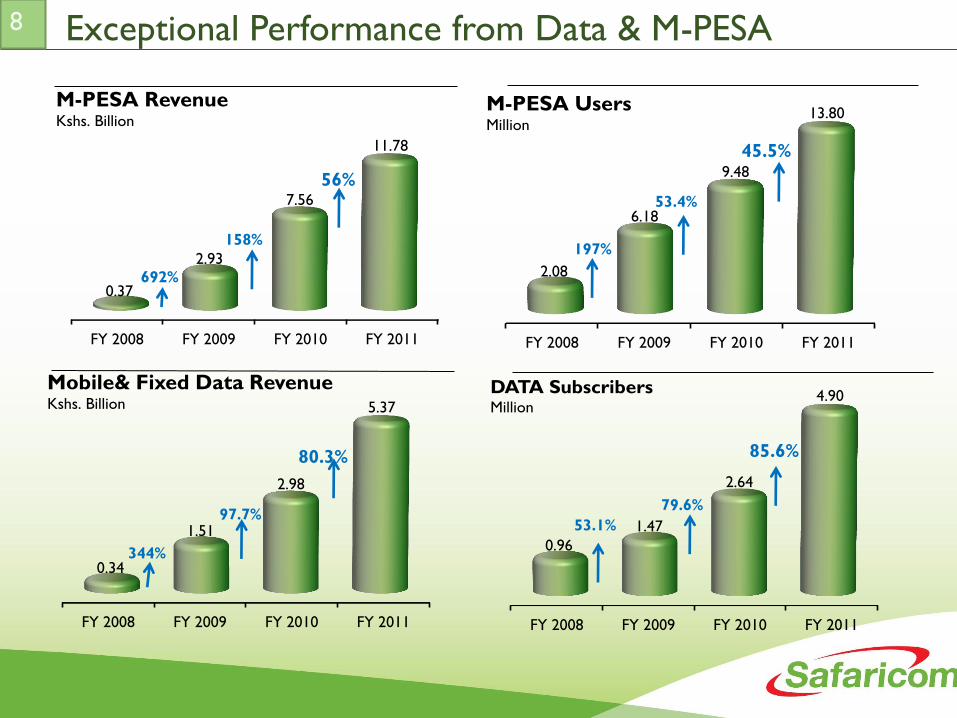
FY 2008 FY 2009 FY 2010 FY 2011
0.37
2.93
7.56
11.78
M-PESA Revenue Kshs. Billion
56%
FY 2008 FY 2009 FY 2010 FY 2011
2.08
6.18
9.48
13.80 M-PESA Users Million
45.5%
Exceptional Performance from Data & M-PESA
FY 2008 FY 2009 FY 2010 FY 2011
0.96
1.47
2.64
4.90 DATA Subscribers Million
8
FY 2008 FY 2009 FY 2010 FY 2011
0.34
1.51
2.98
5.37
Mobile& Fixed Data Revenue Kshs. Billion
80.3%
97.7%
158%
53.4%
79.6%
85.6%
692%
197%
344%
53.1%
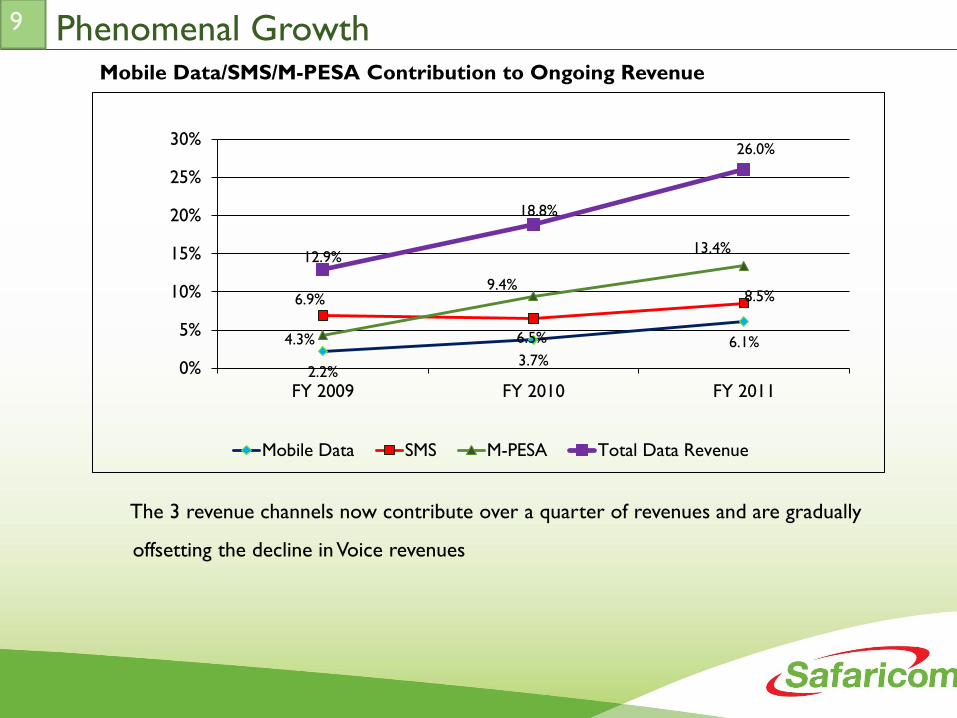
Phenomenal Growth 9
The 3 revenue channels now contribute over a quarter of revenues and are gradually
offsetting the decline in Voice revenues
2.2% 3.7%
6.1%
6.9%
6.5%
8.5%
4.3%
9.4%
13.4% 12.9%
18.8%
26.0%
0%
5%
10%
15%
20%
25%
30%
FY 2009 FY 2010 FY 2011
Mobile Data SMS M-PESA Total Data Revenue
Mobile Data/SMS/M-PESA Contribution to Ongoing Revenue
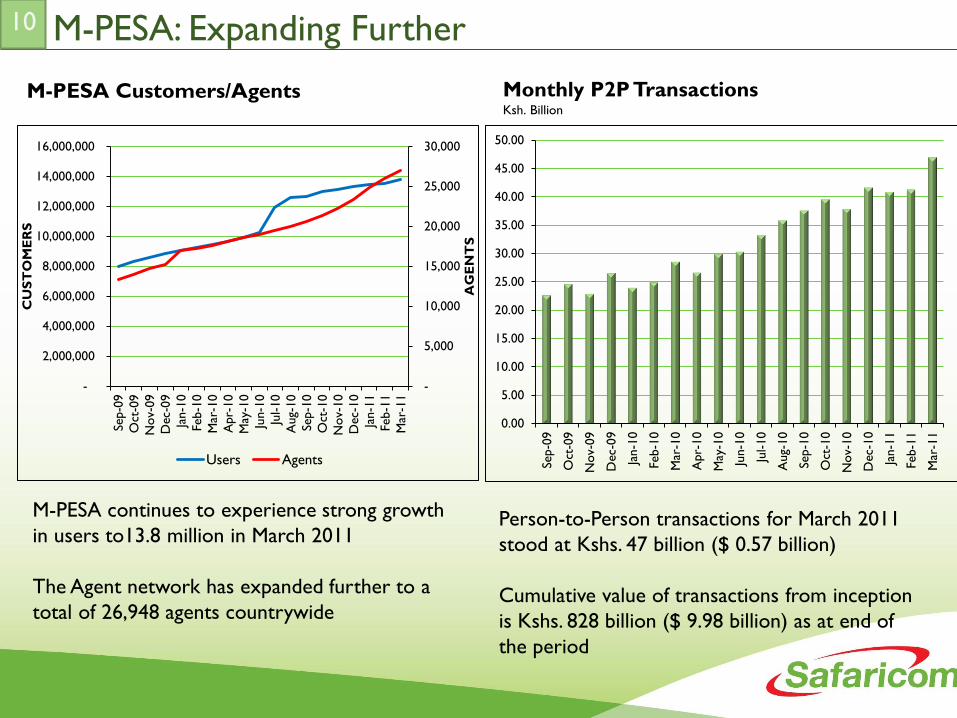
M-PESA: Expanding Further
M-PESA Customers/Agents Monthly P2P Transactions Ksh. Billion
M-PESA continues to experience strong growth
in users to13.8 million in March 2011
The Agent network has expanded further to a
total of 26,948 agents countrywide
Person-to-Person transactions for March 2011
stood at Kshs. 47 billion ($ 0.57 billion)
Cumulative value of transactions from inception
is Kshs. 828 billion ($ 9.98 billion) as at end of
the period
-
5,000
10,000
15,000
20,000
25,000
30,000
-
2,000,000
4,000,000
6,000,000
8,000,000
10,000,000
12,000,000
14,000,000
16,000,000
Sep-0
9
Oct
-09
Nov-
09
Dec-
09
Jan-1
0
Feb-1
0
Mar
-10
Apr-
10
May
-10
Jun-1
0
Jul-10
Aug-
10
Sep-1
0
Oct
-10
Nov-
10
Dec-
10
Jan-1
1
Feb-1
1
Mar
-11
AG
EN
TS
CU
ST
OM
ER
S
Users Agents
10
0.00
5.00
10.00
15.00
20.00
25.00
30.00
35.00
40.00
45.00
50.00
Sep-0
9
Oct
-09
Nov-
09
Dec-
09
Jan-1
0
Feb-1
0
Mar
-10
Apr-
10
May
-10
Jun-1
0
Jul-10
Aug-
10
Sep-1
0
Oct
-10
Nov-
10
Dec-
10
Jan-1
1
Feb-1
1
Mar
-11
Sustained Voice
• Voice remain the biggest revenue stream with Ksh. 63.5 bn generated by March 2011
• Declining prices and potential further reductions in mobile termination rates
• Declining Voice ARPU
Firming up Voice Revenues
• Continued focus on the Customer to understand and satisfy their needs
• Attractive pricing
• Easy access to airtime for our customers by expanding our distribution channels
• Promotional activities aimed at stimulating usage and spending
• Further investment in the network to guarantee quality and reach
• Building on brand awareness and loyalty
11

Acquisition
• Relative high cost of handsets and data
enabled the main inhibitor to Data
penetration in Kenya
• Over 500, 000 data enabled handsets and
laptops sold within the financial year
• Acquisition revenues increased by 81.2% to
Ksh. 6.64 bn (Ksh.3.66 bn in March’10)
• Growing demand for Smart devices and
faster internet speeds
• 35 retail shops countrywide and an
expansive dealer network with over 230,000
touch-points
12

FINANCIALS
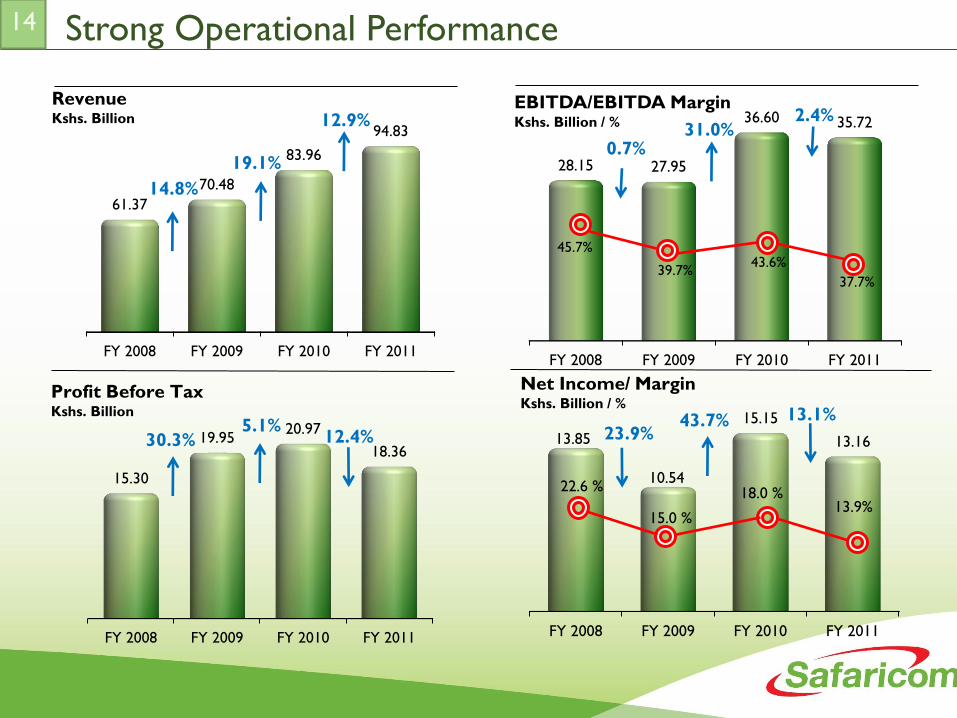
FY 2008 FY 2009 FY 2010 FY 2011
28.15 27.95
36.60 35.72
FY 2008 FY 2009 FY 2010 FY 2011
13.85
10.54
15.15
13.16
FY 2008 FY 2009 FY 2010 FY 2011
61.37
70.48
83.96
94.83
Revenue Kshs. Billion
19.1%
14.8%
Strong Operational Performance
EBITDA/EBITDA Margin Kshs. Billion / % 12.9% 2.4%
Net Income/ Margin Kshs. Billion / %
13.1%
13.9% 18.0 %
FY 2008 FY 2009 FY 2010 FY 2011
15.30
19.95 20.97
18.36
Profit Before Tax Kshs. Billion
12.4%
14
45.7%
39.7% 37.7%
43.6%
22.6 %
15.0 %
31.0% 0.7%
5.1% 30.3%
43.7% 23.9%
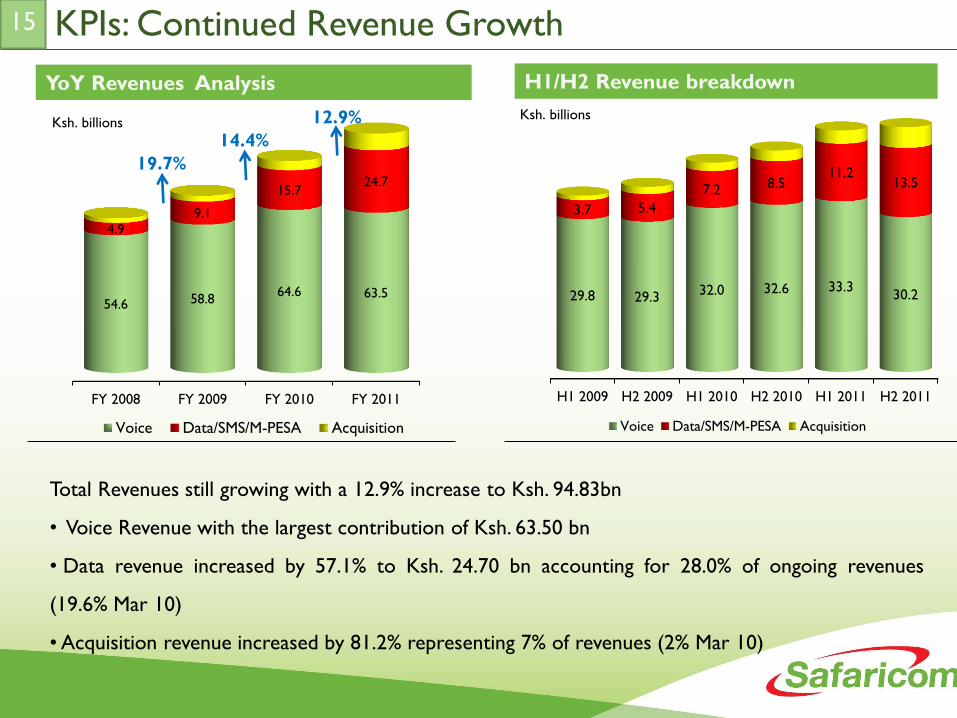
KPIs: Continued Revenue Growth
Total Revenues still growing with a 12.9% increase to Ksh. 94.83bn
• Voice Revenue with the largest contribution of Ksh. 63.50 bn
• Data revenue increased by 57.1% to Ksh. 24.70 bn accounting for 28.0% of ongoing revenues
(19.6% Mar 10)
• Acquisition revenue increased by 81.2% representing 7% of revenues (2% Mar 10)
YoY Revenues Analysis H1/H2 Revenue breakdown
FY 2008 FY 2009 FY 2010 FY 2011
54.6 58.8 64.6 63.5
4.9 9.1
15.7 24.7
Voice Data/SMS/M-PESA Acquisition
Ksh. billions
H1 2009 H2 2009 H1 2010 H2 2010 H1 2011 H2 2011
29.8 29.3 32.0 32.6 33.3
30.2
3.7 5.4
7.2 8.5 11.2
13.5
Voice Data/SMS/M-PESA Acquisition
Ksh. billions
15
12.9%
14.4%
19.7%
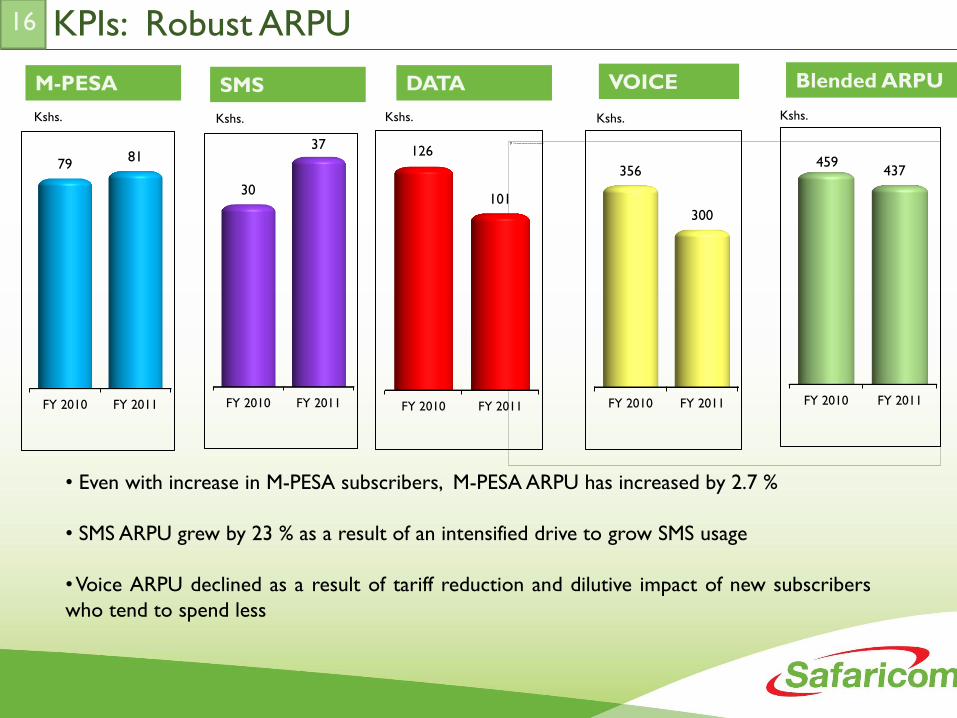
KPIs: Robust ARPU
• Even with increase in M-PESA subscribers, M-PESA ARPU has increased by 2.7 %
• SMS ARPU grew by 23 % as a result of an intensified drive to grow SMS usage
• Voice ARPU declined as a result of tariff reduction and dilutive impact of new subscribers
who tend to spend less
Kshs.
FY 2010 FY 2011
79 81
FY 2010 FY 2011
126
101
FY 2010 FY 2011
356
300
FY 2010 FY 2011
459 437
M-PESA DATA VOICE Blended ARPU
Kshs. Kshs. Kshs.
16
Kshs.
SMS
FY 2010 FY 2011
30
37
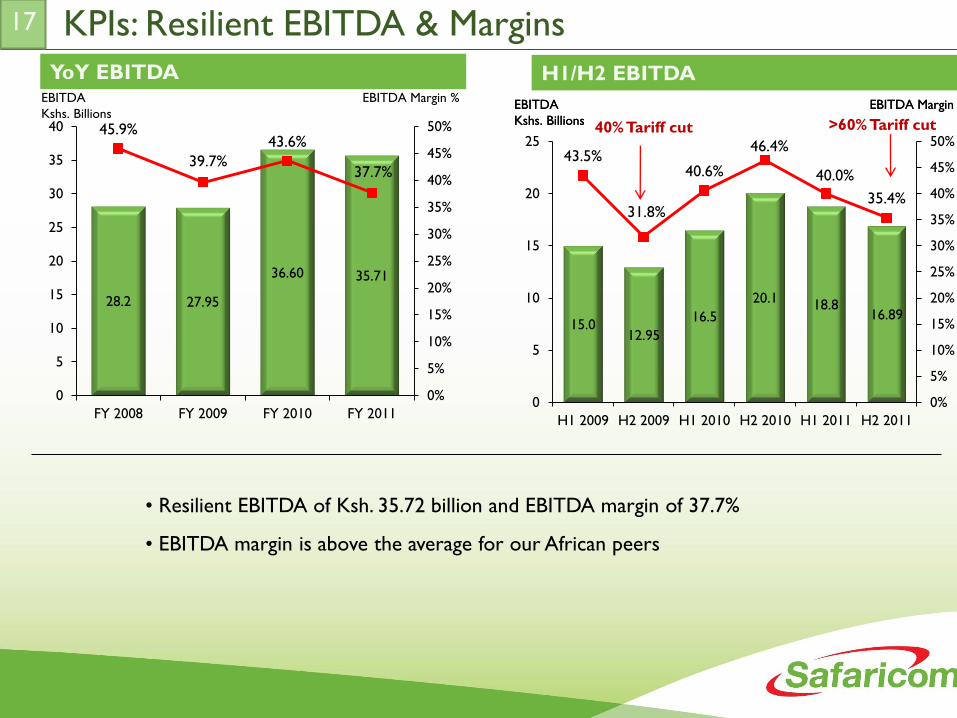
KPIs: Resilient EBITDA & Margins
• Resilient EBITDA of Ksh. 35.72 billion and EBITDA margin of 37.7%
• EBITDA margin is above the average for our African peers
H1/H2 EBITDA
15.0 12.95
16.5
20.1 18.8
16.89
43.5%
31.8%
40.6%
46.4%
40.0%
35.4%
0%
5%
10%
15%
20%
25%
30%
35%
40%
45%
50%
0
5
10
15
20
25
H1 2009 H2 2009 H1 2010 H2 2010 H1 2011 H2 2011
EBITDA
Kshs. Billions
EBITDA Margin % EBITDA
Kshs. Billions
EBITDA Margin %
28.2 27.95
36.60 35.71
45.9%
39.7%
43.6%
37.7%
0%
5%
10%
15%
20%
25%
30%
35%
40%
45%
50%
0
5
10
15
20
25
30
35
40
FY 2008 FY 2009 FY 2010 FY 2011
EBITDA
Kshs. Billions
EBITDA Margin %
YoY EBITDA
17
40% Tariff cut >60% Tariff cut

Stable Cost Structure: OPEX
YoY Operating Expenses H1/H2 OPEX Breakdown
Ksh. millions
H1 2009 H2 2009 H1 2010 H2 2010 H1 2011 H2 2011
1.5 2.7 2.2 2.3 2.3 3.2
8.1
9.6 10.5 9.1
11.6 12.5
3.8
3.8 4.0 4.0
4.1
4.1
2.0
1.4 2.1
2.3
3.6
4.4
Interconnection Airtime, Acquisition&Retension Network Other
Ksh. billions
FY 2008 FY 2009 FY 2010 FY 2011
2.7 4.2 4.5 5.5
14.5
17.7 19.6
24.0 5.8
7.6 8.0
8.3
3.0
3.4
4.4
8.1
Interconnection Airtime, Acquisition&Retension Network Other
18
42%
47%
44%
48%
Cost Intensity
45%
49% 46% 41%
46% 51%
Cost Intensity
• Acquisition Costs grew in line with the customer acquisition strategy particularly for M-PESA
and Data
• Other costs increased in License costs and Value Added Services costs in line with continued
coverage and revenue growth
• Increase in interconnection expenses with the decline in off-net tariffs and termination rates
• Savings in airtime cost
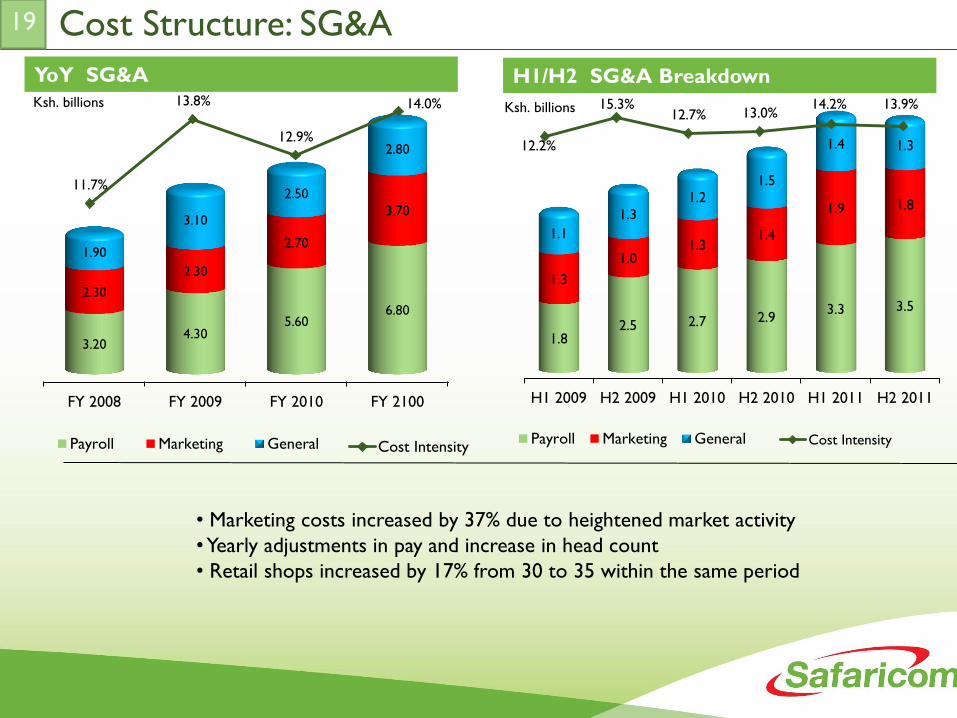
Cost Structure: SG&A
H1/H2 SG&A Breakdown
• Marketing costs increased by 37% due to heightened market activity
• Yearly adjustments in pay and increase in head count
• Retail shops increased by 17% from 30 to 35 within the same period
19
FY 2008 FY 2009 FY 2010 FY 2100
3.20 4.30
5.60 6.80
2.30
2.30
2.70
3.70
1.90
3.10
2.50
2.80
Payroll Marketing General
H1 2009 H2 2009 H1 2010 H2 2010 H1 2011 H2 2011
1.8 2.5 2.7 2.9
3.3 3.5
1.3
1.0 1.3
1.4
1.9 1.8
1.1
1.3
1.2 1.5
1.4 1.3
Payroll Marketing General
Ksh. billions
YoY SG&A
Ksh. billions
11.7%
13.8%
12.9%
14.0%
Cost Intensity
12.2%
15.3% 12.7% 13.0%
14.2% 13.9%
Cost Intensity
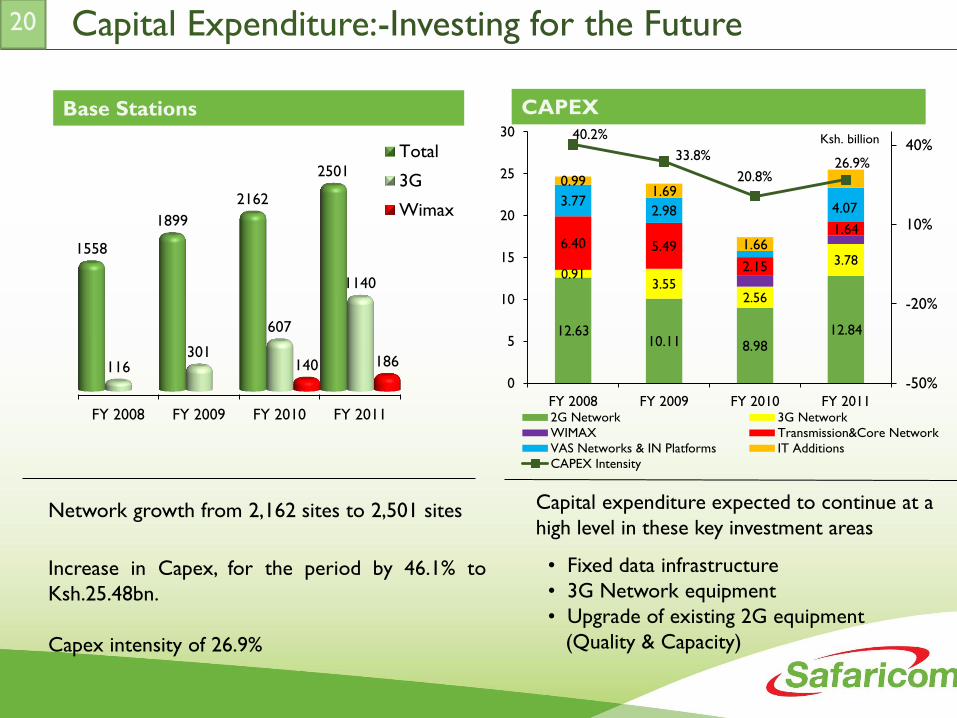
Capital Expenditure:-Investing for the Future
Network growth from 2,162 sites to 2,501 sites
Increase in Capex, for the period by 46.1% to
Ksh.25.48bn.
Capex intensity of 26.9%
Capital expenditure expected to continue at a
high level in these key investment areas
• Fixed data infrastructure
• 3G Network equipment
• Upgrade of existing 2G equipment
(Quality & Capacity)
Base Stations CAPEX
FY 2008 FY 2009 FY 2010 FY 2011
1558
1899
2162
2501
116 301
607
1140
140 186
Total
3G
Wimax
Ksh. billion
20
12.63 10.11 8.98
12.84
0.91 3.55
2.56
3.78
6.40 5.49
2.15
1.64
3.77 2.98 4.07
0.99 1.69
1.66
40.2%
33.8%
20.8% 26.9%
-50%
-20%
10%
40%
0
5
10
15
20
25
30
FY 2008 FY 2009 FY 2010 FY 20112G Network 3G Network
WIMAX Transmission&Core Network
VAS Networks & IN Platforms IT Additions
CAPEX Intensity

Strong Operational Performance
Gearing & Net/EBITDA
0.13
0.25
0.16
0.28
13%
19%
24%
19%
6%
11%
16%
21%
26%
0
0.1
0.2
0.3
FY 2008 FY 2009 FY 2010 FY 2011
Net debt/EBITDA GearingTimes
21
Highly under-leveraged
Significant capacity to gear further
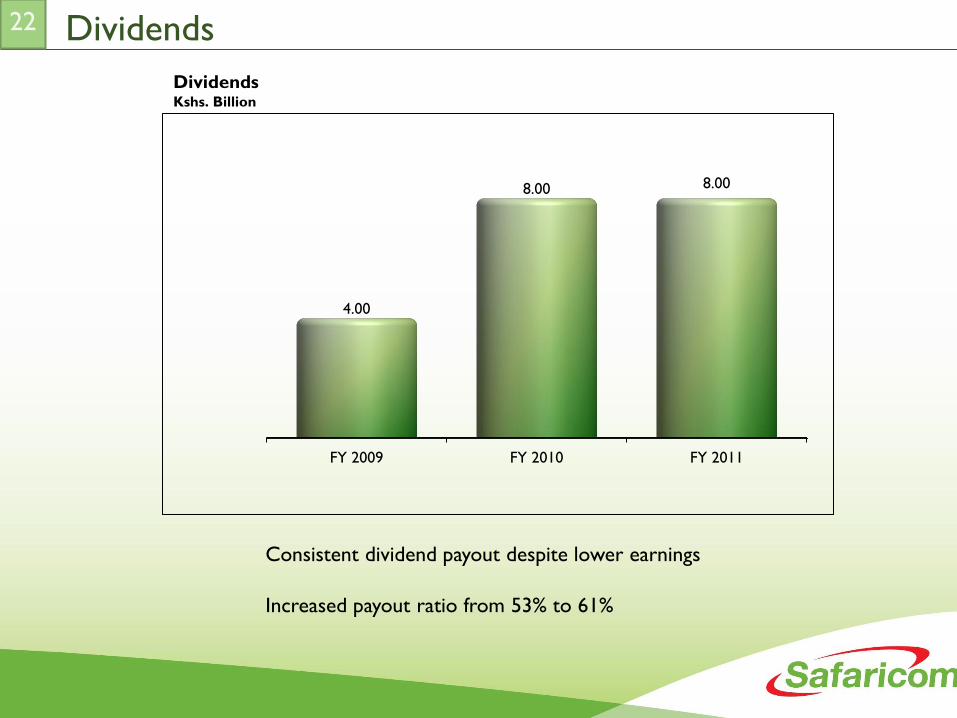
FY 2009 FY 2010 FY 2011
4.00
8.00 8.00
Dividends
Dividends Kshs. Billion
22
Consistent dividend payout despite lower earnings
Increased payout ratio from 53% to 61%

FUTURE OUTLOOK
Strategic Focus
Customer segmentation
Voice Revenue & ARPU
Realignment of Company Strategy - SAFARICOM 2.0
Company focus
Take ownership of the enterprise sector
Mobile Data and Mobile Money- continued market leadership
• M-PESA
• Mobile Data
• Fixed Data
• Value Added Services
• Network improvements
• Acquisition products- mobile handsets, data devices and accessories
We have the most extensive and advanced network and are well placed to
take full advantage of the expansion in Mobile Money and Data
24
Disclaimer
The following presentation is being made only to, and is only directed at, persons to whom such
presentations may lawfully be communicated (“relevant persons”). Any person who is not a
relevant person should not act or rely on this presentation or its contents.
This presentation does not constitute an offering of securities or otherwise constitute an
invitation or inducement to any person to underwrite subscribe for or otherwise acquire
securities in the Company.
The presentation also contains certain non-GAAP financial information. The Group’s management
believes these measures provide valuable additional information in understanding the performance
of the Company’s businesses because they provide measures used by the Company to assess
performance. Although these measures are important in the management of the business, they
should not be viewed as replacements for, but rather as complementary to, the comparable GAAP
measures.
Safaricom, M-PESA and Safaricom/M-PESA logos are trademarks of Safaricom Ltd. Other products
and company names mentioned herein maybe the trademarks of their respective owners.
25

THANK YOU