safaricom sustainability report 2013
TRANSCRIPT
SAFARICOM SUSTAINABILITYREPORT 2013
TRANSFORMINg LIvES
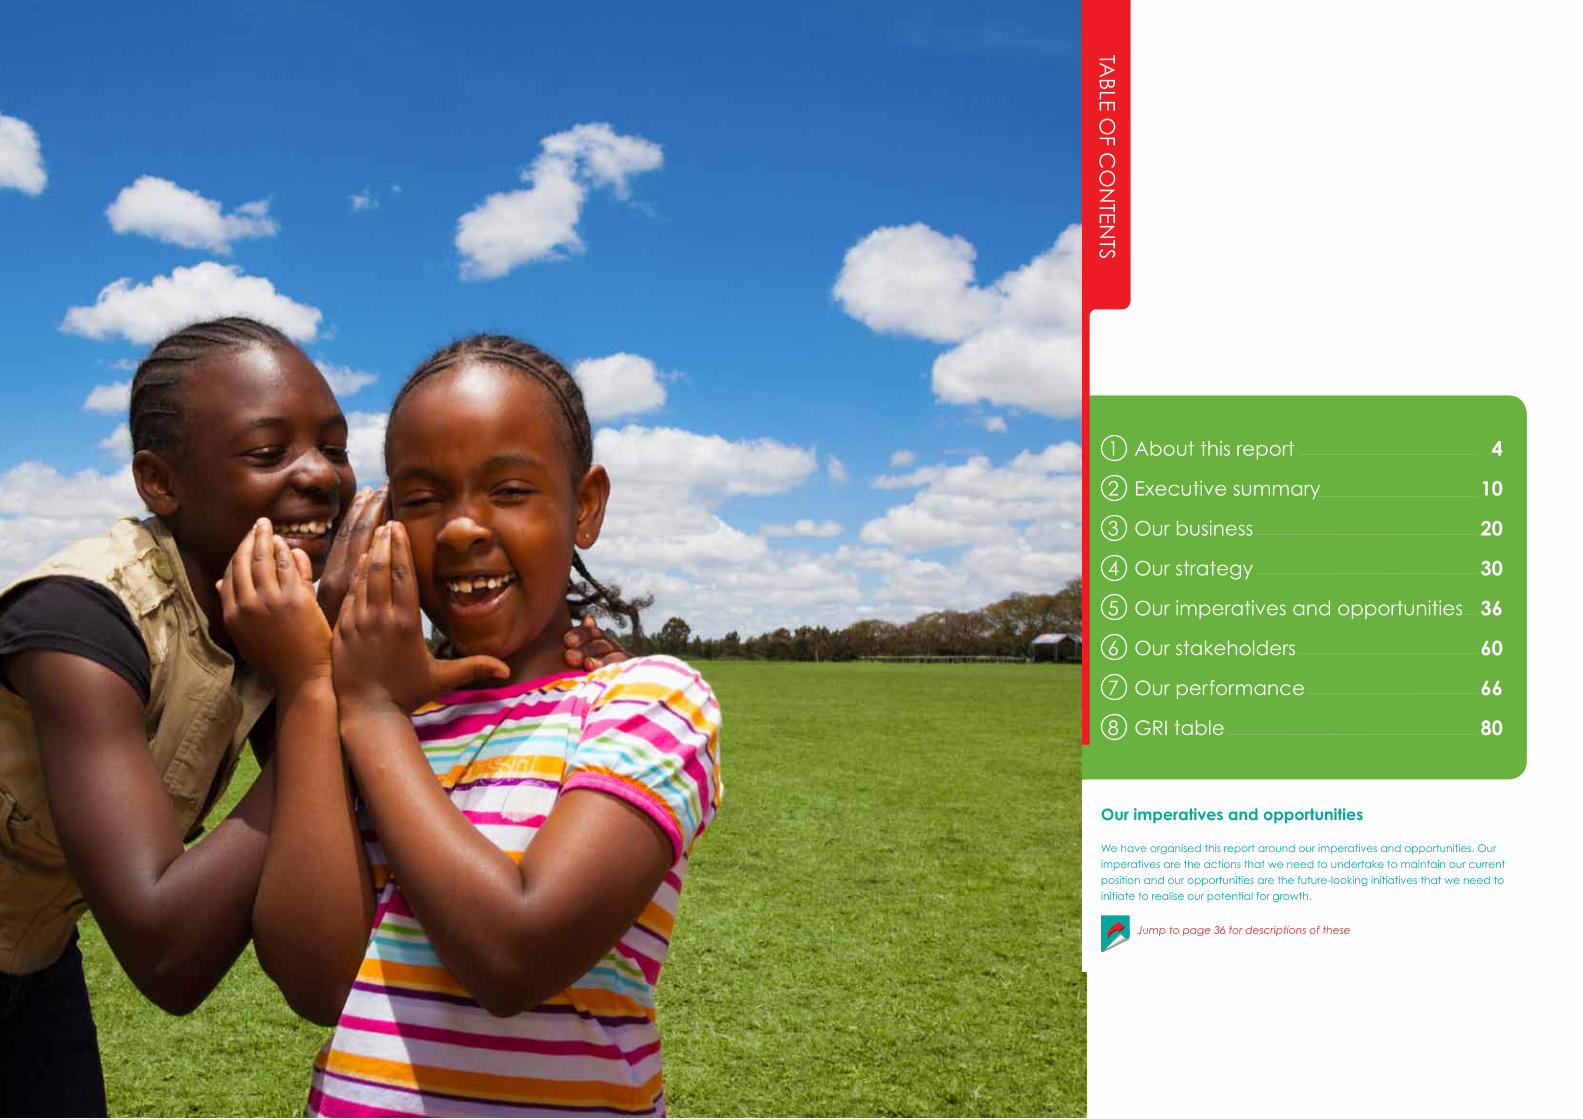
TABLE O
F CO
NTEN
TS
Our imperatives and opportunities
We have organised this report around our imperatives and opportunities. Our
imperatives are the actions that we need to undertake to maintain our current
position and our opportunities are the future-looking initiatives that we need to
initiate to realise our potential for growth.
Jump to page 36 for descriptions of these
4
10
20
30
36
60
66
80
About this report
Executive summary
Our business
Our strategy
Our imperatives and opportunities
Our stakeholders
Our performance
gRI table
1
2
3
4
5
6
7
8
TRA
NSFO
RM
INg
LIvES
ABOUT THIS REPORT
1
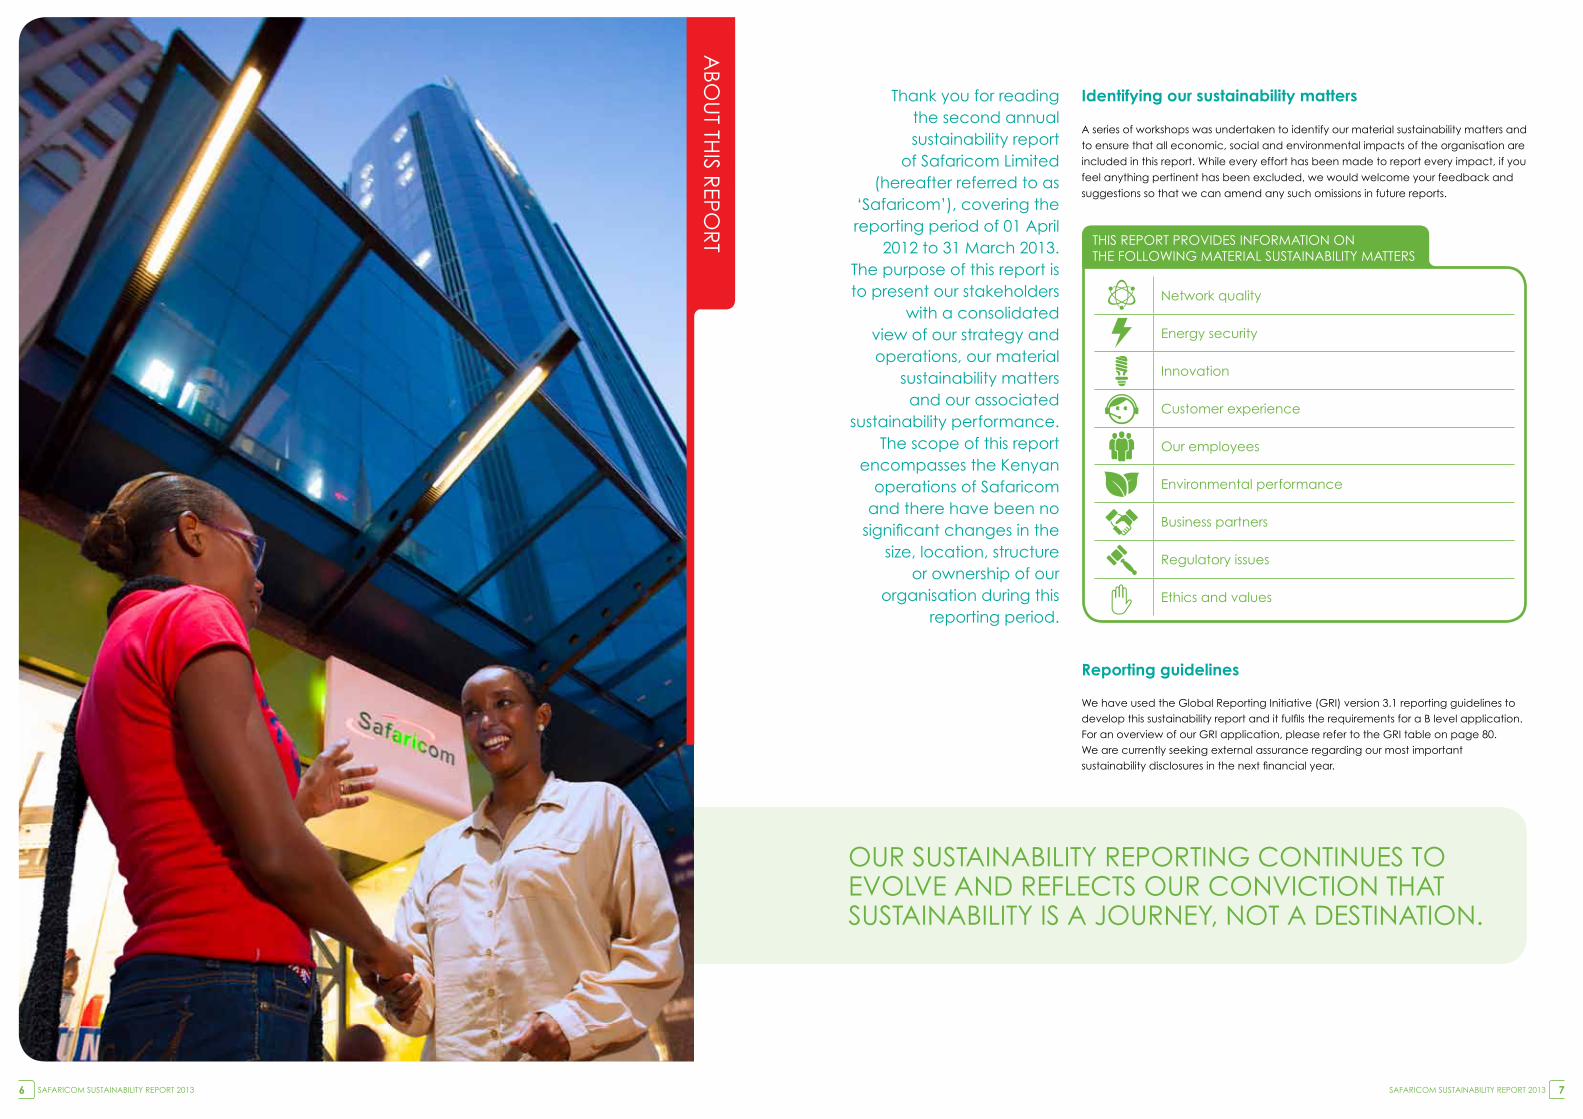
Identifying our sustainability matters
A series of workshops was undertaken to identify our material sustainability matters and
to ensure that all economic, social and environmental impacts of the organisation are
included in this report. While every effort has been made to report every impact, if you
feel anything pertinent has been excluded, we would welcome your feedback and
suggestions so that we can amend any such omissions in future reports.
Reporting guidelines
We have used the global Reporting Initiative (gRI) version 3.1 reporting guidelines to develop this sustainability report and it fulfils the requirements for a B level application. For an overview of our gRI application, please refer to the gRI table on page 80.We are currently seeking external assurance regarding our most important sustainability disclosures in the next financial year.
Thank you for reading the second annual sustainability report
of Safaricom Limited (hereafter referred to as
‘Safaricom’), covering the reporting period of 01 April
2012 to 31 March 2013. The purpose of this report is to present our stakeholders
with a consolidated view of our strategy and operations, our material
sustainability matters and our associated
sustainability performance. The scope of this report
encompasses the Kenyan operations of Safaricom
and there have been no significant changes in the
size, location, structure or ownership of our
organisation during this reporting period.
ABO
UT TH
IS REPO
RT
Network quality
Energy security
Innovation
Customer experience
Our employees
Environmental performance
Business partners
Regulatory issues
Ethics and values
THIS REPORT PROvIdES INFORMATION ONTHE FOLLOWINg MATERIAL SUSTAINABILITY MATTERS
OUR SUSTAINABILITY REPORTINg CONTINUES TO EvOLvE ANd REFLECTS OUR CONvICTION THAT SUSTAINABILITY IS A jOURNEY, NOT A dESTINATION.
SAFARICOM SUSTAINABILITY REPORT 20136 SAFARICOM SUSTAINABILITY REPORT 2013 7
ABO
UT TH
IS REPO
RT
Navigating this report
To help stakeholders achieve a more holistic understanding of how
sustainability impacts our organisation and how we manage its 360°,
interconnected consequences, we have included two new sections in
this report. We have organised our sustainability matters in relation to our
current imperatives (actions needed to maintain our current position) and
opportunities (actions needed to realise potential growth). These are identified
in Section 4 (page 30) and our management approach to each issue is
reported in Section 5 (page 36).
Each of our material sustainability matters is also described independently in
Section 4 (page 30) and our performance in relation to each of these matters
is reported in Section 7 (page 66).
We value your feedback
We value your views and feedback
on our sustainability reporting
and performance. Please email
OUR BUSINESS
OUR MANAGEMENT APPROACH
OUR PERFORMANCE
OUR STRATEGY
- Deliver the best network in Kenya
- Grow mobile data and fixed data
- Deepen financial inclusion
- Improve attractiveness to the youth market
- Retain and reward our loyal customer base
- Build an innovative organisation
OUR MATERIAL MATTERS
- Network quality
- Energy security
- Innovation
- Customer experience
- Our employees
- Environmental performance
- Business partners
- Regulatory issues
- Ethics and values
OUR IMPERATIVES
- Deliver the best network by maintaining and
enhancing network quality
- Develop transformational products and services
relevant to different customer segments
- Minimise business disruptions to our business
ecosystem
- Maintain a productive, supportive and safe
working environment
- Protect our reputation
- Comply with regulatory requirements
OUR OPPORTUNITIES
- Promote positive customer experiences at all
touch points
- Actively deepen financial inclusion
- Innovate to service a growing youth sector
- Promote sustainable practices within our
operations and business ecosystem
- Roll out alternative energy solutions, ensuring
energy security for our future growth
- Continue to lobby and drive policy to ensure a
constructive business environment
- Promote ethical business and good corporate
governance
Page 20
Page 33Page 30
Page 35Page 35
Page 36
Page 66
Throughout this report, we make reference to information contained
within the Safaricom Limited Annual Report, the Annual Report of
the Safaricom Foundation and information that is available on the
Safaricom website. Rather than repeating this background information
here, we have incorporated QR codes and icons to help interested
readers locate this supplementary information as easily as possible.
Safaricom Limited Annual Report
Safaricom Website
Safaricom Foundation Annual Report
SAFARICOM SUSTAINABILITY REPORT 20138 SAFARICOM SUSTAINABILITY REPORT 2013 9
TRA
NSFO
RM
INg
LIvES
ExECUTIvE SUMMARY
2
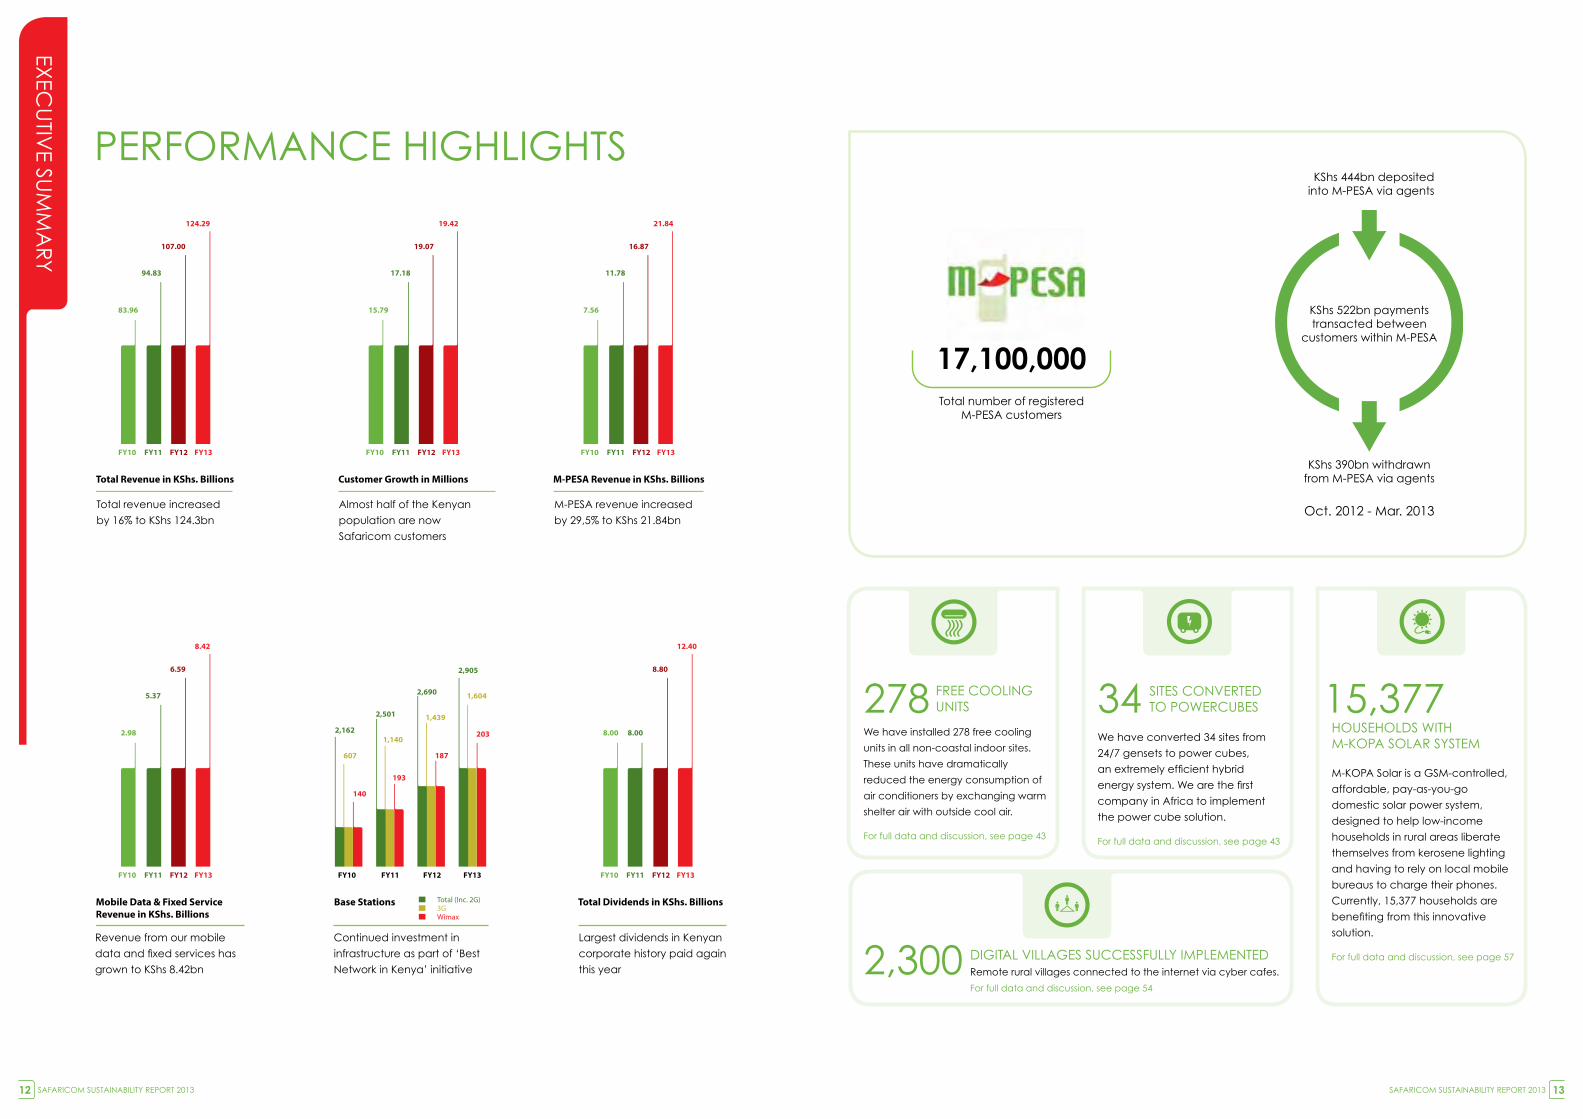
Total Revenue in KShs. Billions
83.96
94.83
107.00
124.29
FY10 FY11 FY12 FY13
Total Revenue Increased by 16% to KShs 124.3bn.
Mobile Data & Fixed ServiceRevenue in KShs. Billions
2.98 2,162
607
140
2,501
1,140
193
2,690
1,439
187
2,905
1,604
203
5.37
6.59
8.42
FY10 FY11 FY12 FY13 FY10 FY11 FY12 FY13
Revenue from our mobile data and service has grown to KShs 8.42bn
Total Dividends in KShs. Billions
8.00
8.80
12.40
FY10
8.00
FY11 FY12 FY13
Largest dividends in Kenyan corporate history paid again this year
Continued investment in infrastruc-ture as part of ‘Best Network in Kenya’ initiative
Base Stations
Customer Growth in Millions
15.79
17.18
19.07
19.42
FY10 FY11 FY12 FY13
Almost half of the Kenyan population are now customers
M-PESA Revenue in KShs. Billions
7.56
11.78
16.87
21.84
FY10 FY11 FY12 FY13
M-PESA revenue increased by 29.5% to KShs21.84bn
Total (Inc. 2G)3GWimax
ExEC
UTIv
E SUM
MA
RY
PERFORMANCE HIgHLIgHTS
We have installed 278 free cooling
units in all non-coastal indoor sites.
These units have dramatically
reduced the energy consumption of
air conditioners by exchanging warm
shelter air with outside cool air.
For full data and discussion, see page 43
278 FREE COOLINg UNITS
We have converted 34 sites from
24/7 gensets to power cubes,
an extremely efficient hybrid
energy system. We are the first
company in Africa to implement
the power cube solution.
For full data and discussion, see page 43
34 SITES CONvERTEd TO POWERCUBES
M-KOPA Solar is a gSM-controlled,
affordable, pay-as-you-go
domestic solar power system,
designed to help low-income
households in rural areas liberate
themselves from kerosene lighting
and having to rely on local mobile
bureaus to charge their phones.
Currently, 15,377 households are
benefiting from this innovative
solution.
For full data and discussion, see page 57
15,377 HOUSEHOLdS WITH M-KOPA SOLAR SYSTEM
Revenue from our mobile
data and fixed services has
grown to KShs 8.42bn
Total revenue increased
by 16% to KShs 124.3bn
Almost half of the Kenyan
population are now
Safaricom customers
M-PESA revenue increased
by 29,5% to KShs 21.84bn
Continued investment in
infrastructure as part of ‘Best
Network in Kenya’ initiative
Largest dividends in Kenyan
corporate history paid again
this year
KShs 522bn paymentstransacted between
customers within M-PESA
KShs 444bn deposited into M-PESA via agents
Oct. 2012 - Mar. 2013
Total number of registered M-PESA customers
17,100,000
KShs 390bn withdrawnfrom M-PESA via agents
2,300 dIgITAL vILLAgES SUCCESSFULLY IMPLEMENTEdRemote rural villages connected to the internet via cyber cafes.
For full data and discussion, see page 54
Total Revenue in KShs. Billions
83.96
94.83
107.00
124.29
FY10 FY11 FY12 FY13
Total Revenue Increased by 16% to KShs 124.3bn.
Mobile Data & Fixed ServiceRevenue in KShs. Billions
2.98 2,162
607
140
2,501
1,140
193
2,690
1,439
187
2,905
1,604
203
5.37
6.59
8.42
FY10 FY11 FY12 FY13 FY10 FY11 FY12 FY13
Revenue from our mobile data and service has grown to KShs 8.42bn
Total Dividends in KShs. Billions
8.00
8.80
12.40
FY10
8.00
FY11 FY12 FY13
Largest dividends in Kenyan corporate history paid again this year
Continued investment in infrastruc-ture as part of ‘Best Network in Kenya’ initiative
Base Stations
Customer Growth in Millions
15.79
17.18
19.07
19.42
FY10 FY11 FY12 FY13
Almost half of the Kenyan population are now customers
M-PESA Revenue in KShs. Billions
7.56
11.78
16.87
21.84
FY10 FY11 FY12 FY13
M-PESA revenue increased by 29.5% to KShs21.84bn
Total (Inc. 2G)3GWimax
SAFARICOM SUSTAINABILITY REPORT 201312 SAFARICOM SUSTAINABILITY REPORT 2013 13
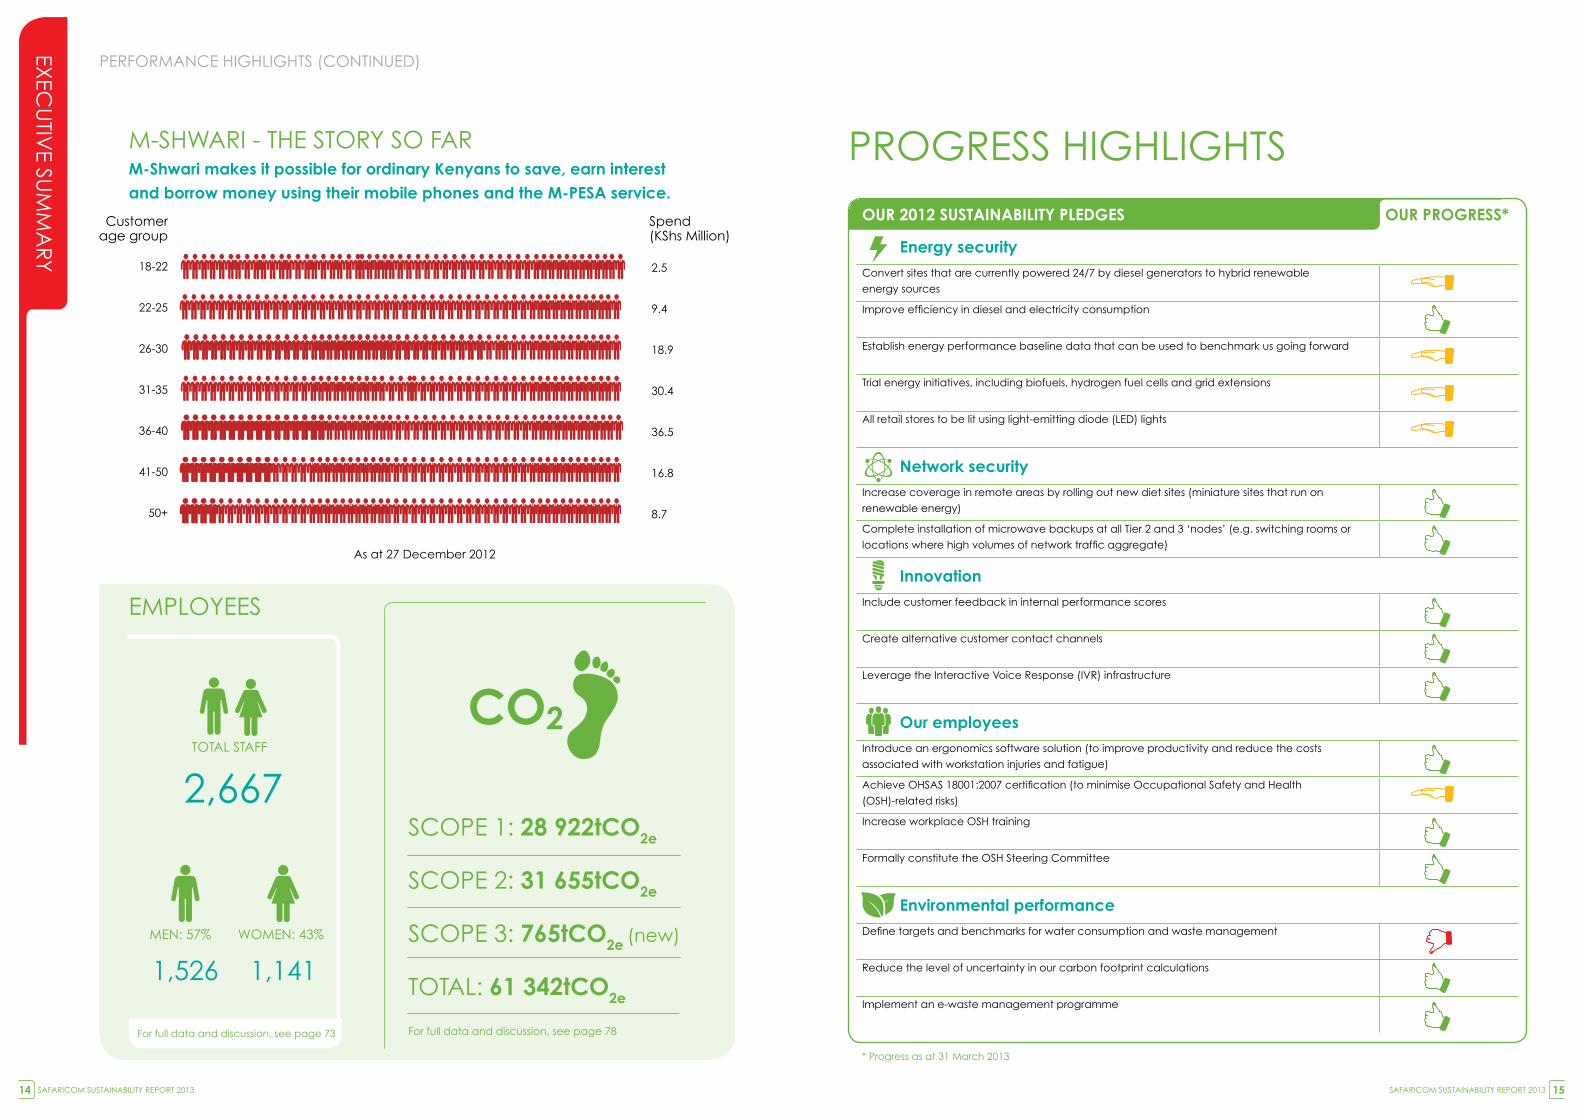
OuR 2012 sustaINabIlIty pledges OuR pROgRess*
energy securityConvert sites that are currently powered 24/7 by diesel generators to hybrid renewable
energy sources
Improve efficiency in diesel and electricity consumption
Establish energy performance baseline data that can be used to benchmark us going forward
Trial energy initiatives, including biofuels, hydrogen fuel cells and grid extensions
All retail stores to be lit using light-emitting diode (LEd) lights
Network securityIncrease coverage in remote areas by rolling out new diet sites (miniature sites that run on
renewable energy)
Complete installation of microwave backups at all Tier 2 and 3 ‘nodes’ (e.g. switching rooms or
locations where high volumes of network traffic aggregate)
InnovationInclude customer feedback in internal performance scores
Create alternative customer contact channels
Leverage the Interactive voice Response (IvR) infrastructure
Our employeesIntroduce an ergonomics software solution (to improve productivity and reduce the costs
associated with workstation injuries and fatigue)
Achieve OHSAS 18001:2007 certification (to minimise Occupational Safety and Health
(OSH)-related risks)
Increase workplace OSH training
Formally constitute the OSH Steering Committee
environmental performanceDefine targets and benchmarks for water consumption and waste management
Reduce the level of uncertainty in our carbon footprint calculations
Implement an e-waste management programme
ExEC
UTIv
E SUM
MA
RY
PROgRESS HIgHLIgHTS
PERFORMANCE HIgHLIgHTS (CONTINUEd)
Customer Age group
18-22
22-25
26-30
31-35
36-40
41-50
50+
M-Shwari The story so far...
As at 27 December 2012
Spend (Kshs. millions)
2.5
9.4
18.9
30.4
36.5
16.8
8.7
CO2
SCOPE 1: 28 922tCO2e
SCOPE 2: 31 655tCO2e
SCOPE 3: 765tCO2e (new)
TOTAL: 61 342tCO2e
For full data and discussion, see page 78For full data and discussion, see page 73
EMPLOYEES
M-SHWARI - THE STORY SO FARM-shwari makes it possible for ordinary Kenyans to save, earn interest and borrow money using their mobile phones and the M-pesa service.
Customerage group
Spend(KShs Million)
1,526
MEN: 57%
1,141
WOMEN: 43%
2,667TOTAL STAFF
ExEC
UTIv
E SUM
MA
RY
* Progress as at 31 March 2013
SAFARICOM SUSTAINABILITY REPORT 201314 SAFARICOM SUSTAINABILITY REPORT 2013 15
the Foundation and our CsI mandate
Through the Safaricom Foundation, we continue to partner with Kenyan communities countrywide. I am particularly pleased with the wide range of over 100 projects and partnerships initiated this year, in locations like Marsabit, Laikipia, Kilifi, Bura, Samburu, Rongo, Marigat, Pokot, Habaswein and Meru, to name a few.
I am also pleased that the Foundation has actively shared lessons from its experience through its quarterly dissemination forums with its project partners and key stakeholders, and the Corporate Social Investment Roundtable meeting, which brought together over 100 corporate leaders to discuss sustainable Social Investment models. We look forward to commemorating the 10 year anniversary of the Safaricom Foundation next year.
looking forward
As another exciting year of transition and growth draws to a close, I would like to join the entire Safaricom Board in acknowledging and celebrating the achievements of the company. Our success is built on the tireless efforts of our staff and management and it is most gratifying to see how readily sustainability has been embraced as a lens through which we can probe and evaluate our performance.
In closing, I would like to commend my colleagues on their unflagging enthusiasm and commitment to transforming the lives of Kenyans. It is your energy and vigour that inspires me to look towards the future with confidence and excitement.
One year on, we are still very new to
sustainability and have much to learn,
but I am particularly pleased to see
how enthusiastically the set of values
it represents have been embraced
and adopted across the company.
It is satisfying to see the economic,
social and environmental impact of
our activities becoming an increasingly
automatic consideration across our
operations.
From a strategic perspective,
sustainability continues to be a symbol of
our common commitment to our shared
future, a positive principle that unites us
as we recognise our responsibility to help
shape that future.
While we have made great strides
forward during the last year and are
proud of what we have achieved,
we acknowledge that there remains
a good deal still to be done and that
sustainability is a dynamic ongoing
journey, not a reporting destination.
It is with this attitude of humble optimism
that we present this report. We offer it
as the next exchange in our ongoing
conversation about the sustainability
challenges that are motivating us and
the progress we are making in response
to them.
a transitional year
In many respects, this has been a
transitional year for both the country and
us. The macro-economic environment
was subdued at the beginning of
the reporting period and so was our
performance. As the year progressed,
however, the economy started to
recover and so did we.
The Kenyan people are to be
commended on a peaceful general
election. The manner in which the
electoral and legal processes were
handled by all parties has strengthened
the confidence of both local and
international investors.
despite the long electioneering season
and difficult global economic conditions,
the country has achieved cautious,
but favourable outcomes. Inflationary
pressures have been tamed and
economic growth has kept a steady
pace.
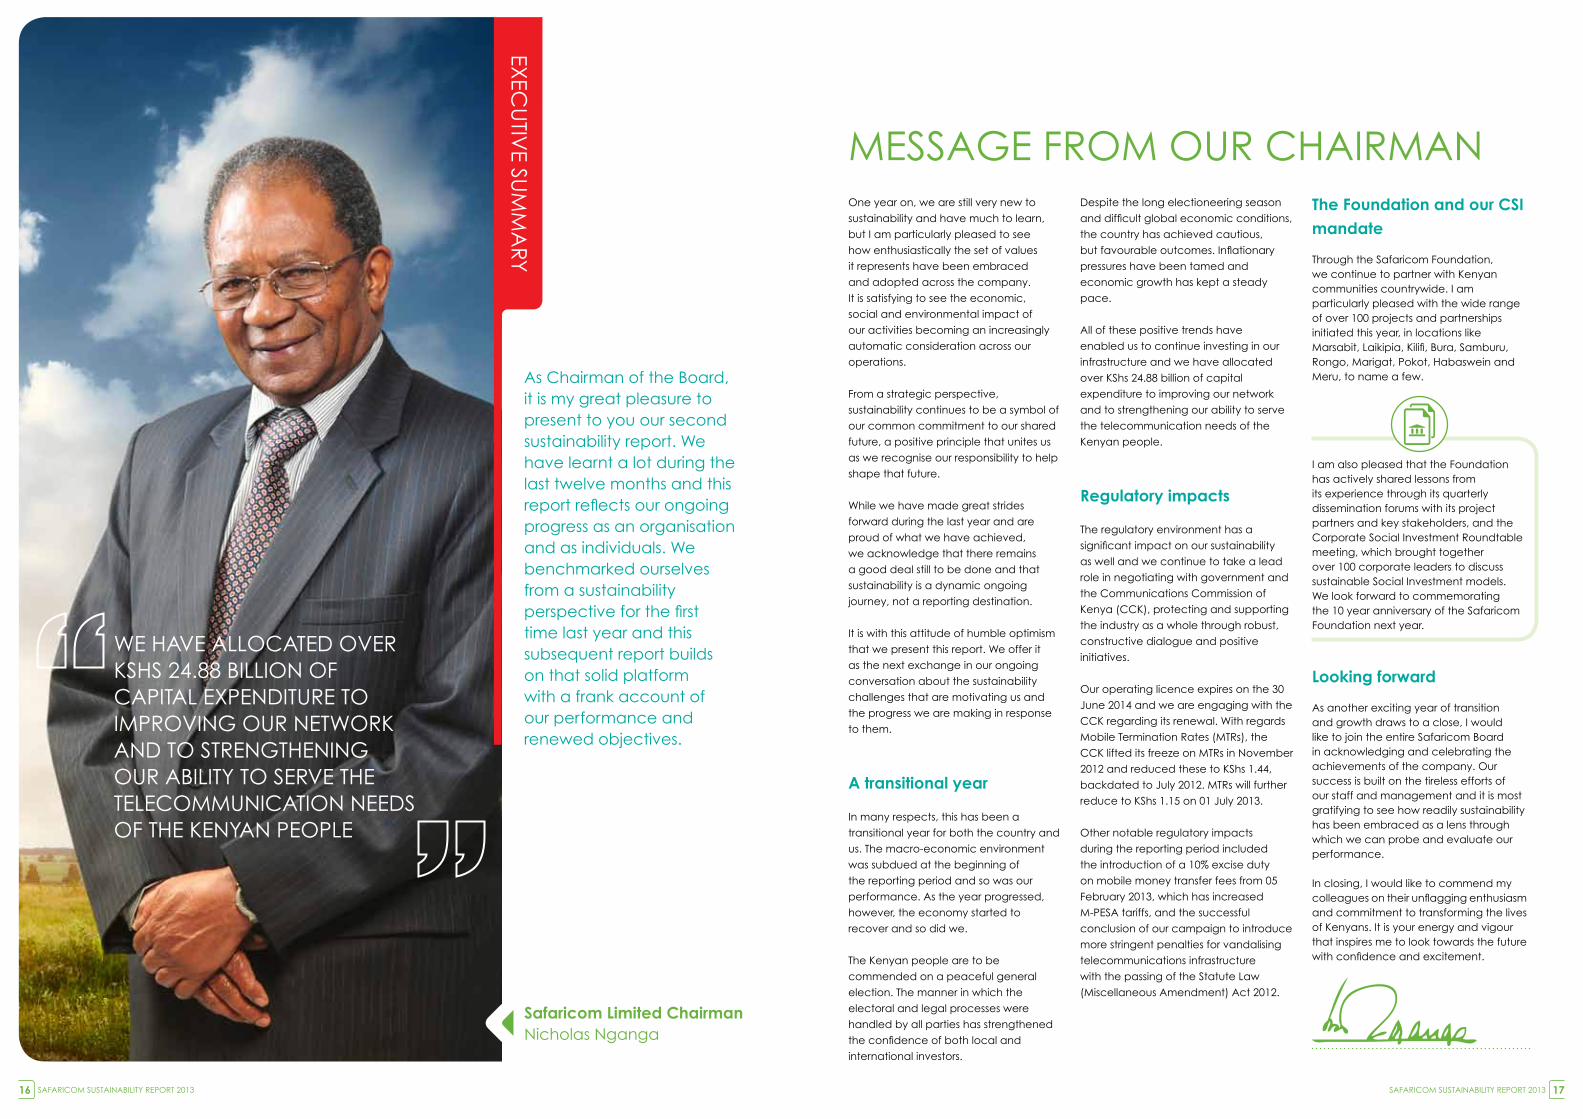
All of these positive trends have
enabled us to continue investing in our
infrastructure and we have allocated
over KShs 24.88 billion of capital
expenditure to improving our network
and to strengthening our ability to serve
the telecommunication needs of the
Kenyan people.
Regulatory impacts
The regulatory environment has a
significant impact on our sustainability
as well and we continue to take a lead
role in negotiating with government and
the Communications Commission of
Kenya (CCK), protecting and supporting
the industry as a whole through robust,
constructive dialogue and positive
initiatives.
Our operating licence expires on the 30
june 2014 and we are engaging with the
CCK regarding its renewal. With regards
Mobile Termination Rates (MTRs), the
CCK lifted its freeze on MTRs in November
2012 and reduced these to KShs 1.44,
backdated to july 2012. MTRs will further
reduce to KShs 1.15 on 01 july 2013.
Other notable regulatory impacts
during the reporting period included
the introduction of a 10% excise duty
on mobile money transfer fees from 05
February 2013, which has increased
M-PESA tariffs, and the successful
conclusion of our campaign to introduce
more stringent penalties for vandalising
telecommunications infrastructure
with the passing of the Statute Law
(Miscellaneous Amendment) Act 2012.
MESSAgE FROM OUR CHAIRMAN
WE HAvE ALLOCATEd OvER KSHS 24.88 BILLION OF CAPITAL ExPENdITURE TO IMPROvINg OUR NETWORK ANd TO STRENgTHENINg OUR ABILITY TO SERvE THE TELECOMMUNICATION NEEdS OF THE KENYAN PEOPLE
ExEC
UTIv
E SUM
MA
RY
As Chairman of the Board, it is my great pleasure to present to you our second sustainability report. We have learnt a lot during the last twelve months and this report reflects our ongoing progress as an organisation and as individuals. We benchmarked ourselves from a sustainability perspective for the first time last year and this subsequent report builds on that solid platform with a frank account of our performance and renewed objectives.
safaricom limited ChairmanNicholas Nganga
SAFARICOM SUSTAINABILITY REPORT 201316 SAFARICOM SUSTAINABILITY REPORT 2013 17
As we continue to grow and evolve, so does our sustainability reporting and this is reflected in the two new sections this year. In this report, we have reported our material sustainability issues and performance in relation to our current imperatives (actions that have led to our current position) and opportunities (actions needed to realise growth). We hope that this will help our ecosystem of stakeholders achieve a more holistic understanding of how sustainability impacts our business and how we manage its 360°, interconnected consequences.
We have, again, reported on sustainability using the rigorous global Reporting Initiative (gRI) guidelines and I am pleased to note that this report fulfils the requirements for a B level application, reflecting the substantial progress that has been made during the reporting period.
promoting sustainability
We remain an enthusiastic member of the United Nations global Compact (UNgC) Board and are committed to the Compact’s goal of encouraging businesses to align their operations and strategies with 10 ethical principles.We also recognise that we are part of a wider business ecosystem and that we need to partner with other businesses in promoting business ethics.
With this in mind we facilitated a CEO breakfast on Ethics and governance with the Kenya Association of Manufacturers (KAM) that was attended by 30 CEOs. The breakfast focused on the role of private business in fighting corruption and the CEOs confirmed their commitment to this cause.
We have also continued our constructive conversations with all of our dealers and suppliers, asking them to embrace sustainability as well and to undertake self-assessments. I am gratified to see that 120 of our largest suppliers roseto this challenge and conductedself-assessments, and a breakdown of their evaluations is included in Section 7 of this report.
ExEC
UTIv
E SUM
MA
RY
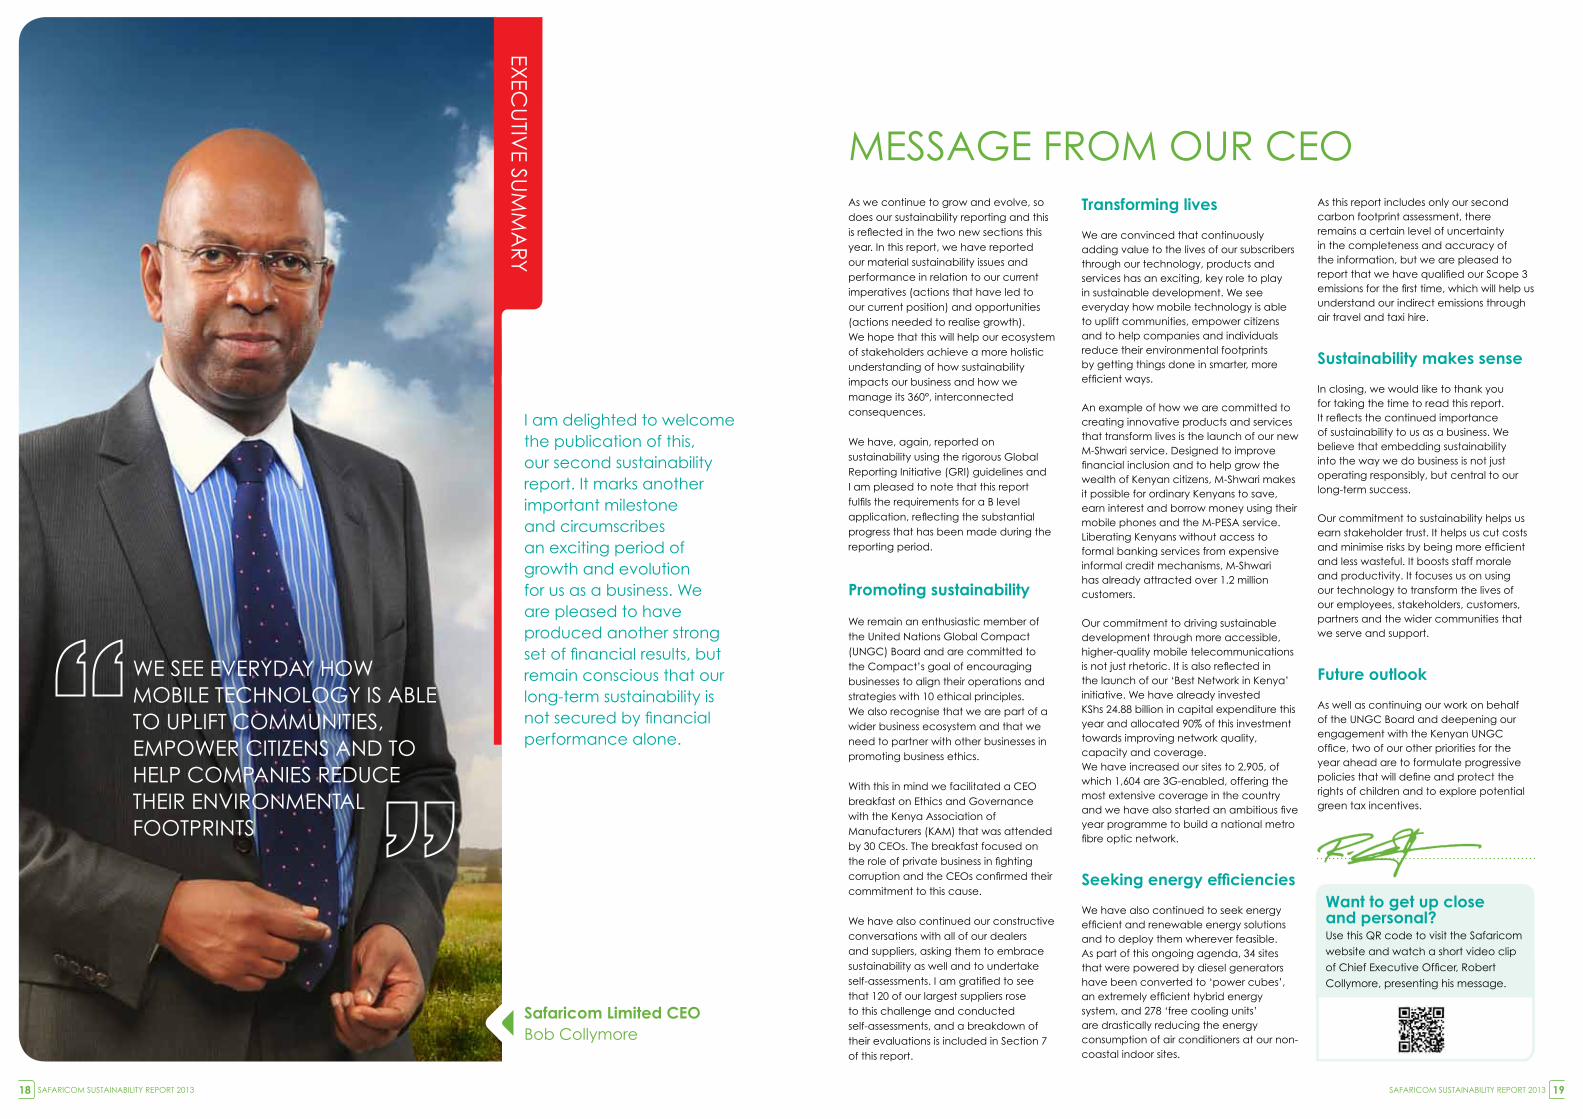
MESSAgE FROM OUR CEO
I am delighted to welcome the publication of this, our second sustainability report. It marks another important milestone and circumscribes an exciting period of growth and evolution for us as a business. We are pleased to have produced another strong set of financial results, but remain conscious that our long-term sustainability is not secured by financial performance alone.
transforming lives
We are convinced that continuously adding value to the lives of our subscribers through our technology, products and services has an exciting, key role to play in sustainable development. We see everyday how mobile technology is able to uplift communities, empower citizens and to help companies and individuals reduce their environmental footprints by getting things done in smarter, more efficient ways.
An example of how we are committed to creating innovative products and services that transform lives is the launch of our new M-Shwari service. designed to improve financial inclusion and to help grow the wealth of Kenyan citizens, M-Shwari makes it possible for ordinary Kenyans to save, earn interest and borrow money using their mobile phones and the M-PESA service. Liberating Kenyans without access to formal banking services from expensive informal credit mechanisms, M-Shwari has already attracted over 1.2 million customers.
Our commitment to driving sustainable development through more accessible, higher-quality mobile telecommunications is not just rhetoric. It is also reflected in the launch of our ‘Best Network in Kenya’ initiative. We have already invested KShs 24.88 billion in capital expenditure this year and allocated 90% of this investment towards improving network quality, capacity and coverage. We have increased our sites to 2,905, of which 1,604 are 3g-enabled, offering the most extensive coverage in the country and we have also started an ambitious five year programme to build a national metro fibre optic network.
Seeking energy efficiencies
We have also continued to seek energy efficient and renewable energy solutions and to deploy them wherever feasible.As part of this ongoing agenda, 34 sites that were powered by diesel generators have been converted to ‘power cubes’, an extremely efficient hybrid energy system, and 278 ‘free cooling units’ are drastically reducing the energy consumption of air conditioners at our non-coastal indoor sites.
As this report includes only our second carbon footprint assessment, there remains a certain level of uncertainty in the completeness and accuracy of the information, but we are pleased to report that we have qualified our Scope 3 emissions for the first time, which will help us understand our indirect emissions through air travel and taxi hire.
sustainability makes sense
In closing, we would like to thank you for taking the time to read this report. It reflects the continued importance of sustainability to us as a business. We believe that embedding sustainability into the way we do business is not just operating responsibly, but central to our long-term success.
Our commitment to sustainability helps us earn stakeholder trust. It helps us cut costs and minimise risks by being more efficient and less wasteful. It boosts staff morale and productivity. It focuses us on using our technology to transform the lives of our employees, stakeholders, customers, partners and the wider communities that we serve and support.
Future outlook
As well as continuing our work on behalf of the UNgC Board and deepening our engagement with the Kenyan UNgC office, two of our other priorities for the year ahead are to formulate progressive policies that will define and protect the rights of children and to explore potential green tax incentives.
Want to get up closeand personal?Use this QR code to visit the Safaricom
website and watch a short video clip
of Chief Executive Officer, Robert
Collymore, presenting his message.
WE SEE EvERYdAY HOW MOBILE TECHNOLOgY IS ABLE TO UPLIFT COMMUNITIES, EMPOWER CITIzENS ANd TO HELP COMPANIES REdUCE THEIR ENvIRONMENTAL FOOTPRINTS
safaricom limited CeOBob Collymore
SAFARICOM SUSTAINABILITY REPORT 201318 SAFARICOM SUSTAINABILITY REPORT 2013 19
TRA
NSFO
RM
INg
LIvES
OUR BUSINESS3
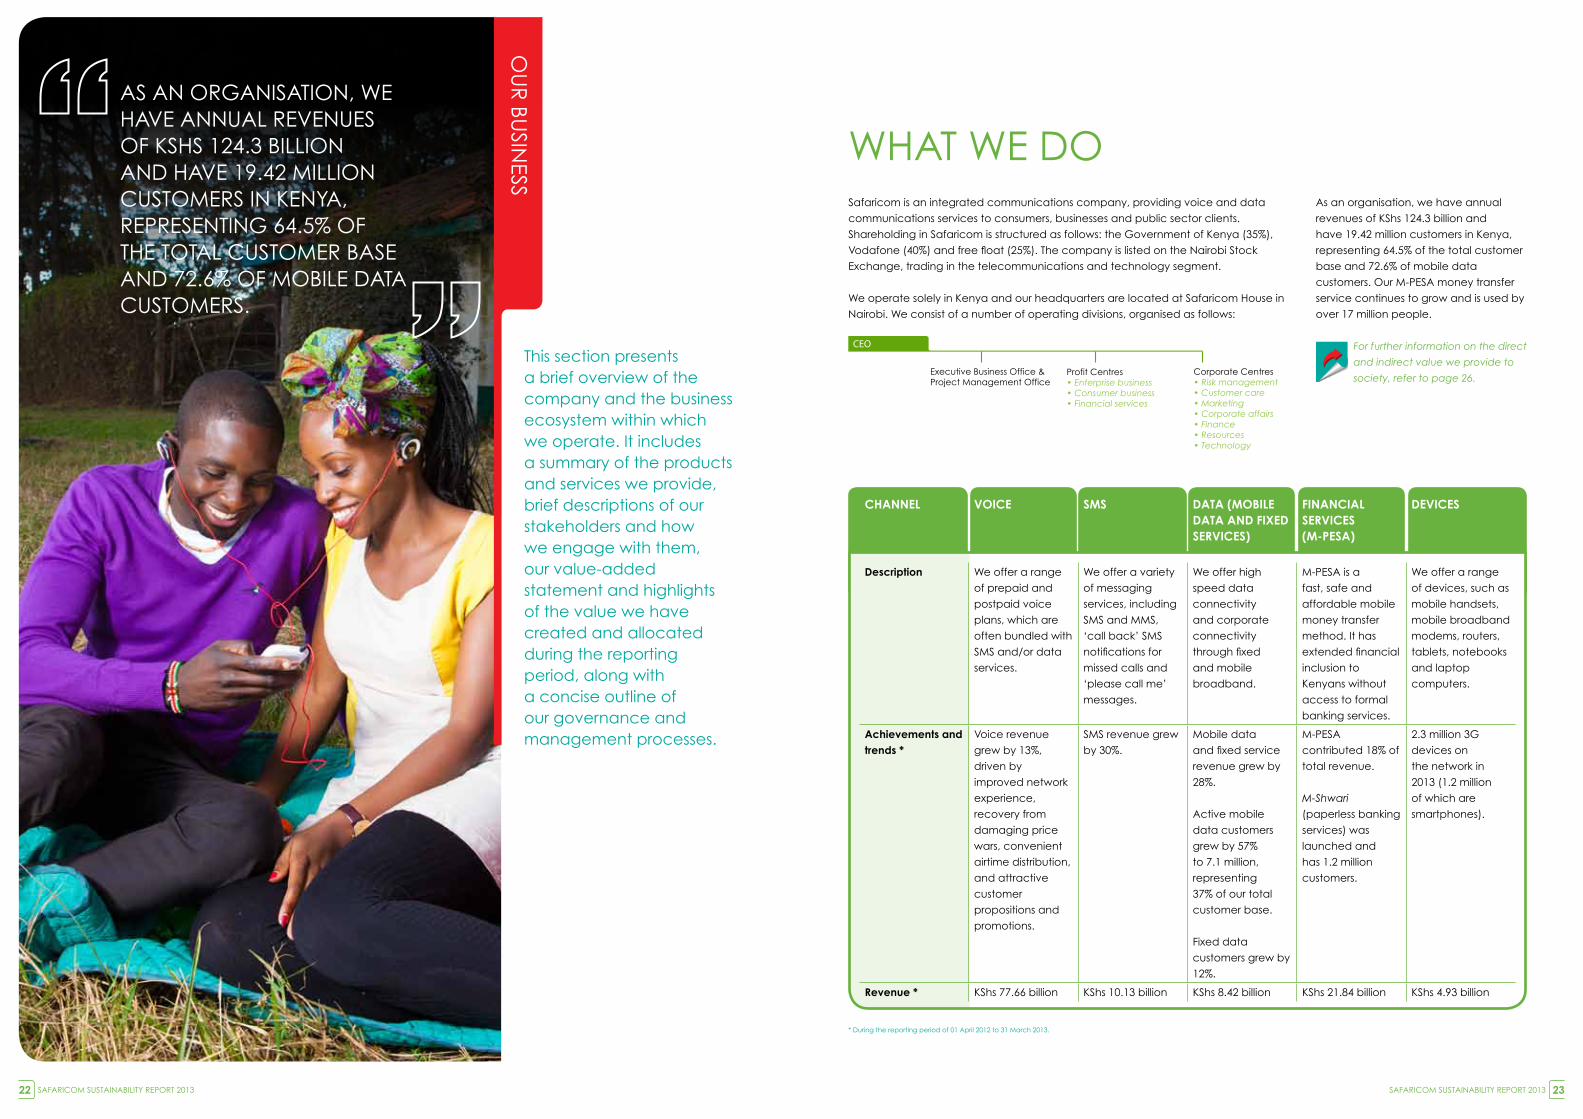
As an organisation, we have annual
revenues of KShs 124.3 billion and
have 19.42 million customers in Kenya,
representing 64.5% of the total customer
base and 72.6% of mobile data
customers. Our M-PESA money transfer
service continues to grow and is used by
over 17 million people.
For further information on the direct
and indirect value we provide to
society, refer to page 26.
Safaricom is an integrated communications company, providing voice and data
communications services to consumers, businesses and public sector clients.
Shareholding in Safaricom is structured as follows: the government of Kenya (35%),
Vodafone (40%) and free float (25%). The company is listed on the Nairobi Stock
Exchange, trading in the telecommunications and technology segment.
We operate solely in Kenya and our headquarters are located at Safaricom House in
Nairobi. We consist of a number of operating divisions, organised as follows:
ChaNNel VOICe sMs data (MObIle data aNd FIxed seRVICes)
FINaNCIal seRVICes (M-pesa)
deVICes
description We offer a range
of prepaid and
postpaid voice
plans, which are
often bundled with
SMS and/or data
services.
We offer a variety
of messaging
services, including
SMS and MMS,
‘call back’ SMS
notifications for
missed calls and
‘please call me’
messages.
We offer high
speed data
connectivity
and corporate
connectivity
through fixed
and mobile
broadband.
M-PESA is a
fast, safe and
affordable mobile
money transfer
method. It has
extended financial
inclusion to
Kenyans without
access to formal
banking services.
We offer a range
of devices, such as
mobile handsets,
mobile broadband
modems, routers,
tablets, notebooks
and laptop
computers.
achievements and trends *
voice revenue
grew by 13%,
driven by
improved network
experience,
recovery from
damaging price
wars, convenient
airtime distribution,
and attractive
customer
propositions and
promotions.
SMS revenue grew
by 30%.
Mobile data
and fixed service
revenue grew by
28%.
Active mobile
data customers
grew by 57%
to 7.1 million,
representing
37% of our total
customer base.
Fixed data
customers grew by
12%.
M-PESA
contributed 18% of
total revenue.
M-Shwari
(paperless banking
services) was
launched and
has 1.2 million
customers.
2.3 million 3g
devices on
the network in
2013 (1.2 million
of which are
smartphones).
Revenue * KShs 77.66 billion KShs 10.13 billion KShs 8.42 billion KShs 21.84 billion KShs 4.93 billion
This section presents a brief overview of the company and the business ecosystem within which we operate. It includes a summary of the products and services we provide, brief descriptions of our stakeholders and how we engage with them, our value-added statement and highlights of the value we have created and allocated during the reporting period, along with a concise outline of our governance and management processes.
OU
R BU
SINESS
* during the reporting period of 01 April 2012 to 31 March 2013.
AS AN ORgANISATION, WE HAvE ANNUAL REvENUES OF KSHS 124.3 BILLION ANd HAvE 19.42 MILLION CUSTOMERS IN KENYA, REPRESENTINg 64.5% OF THE TOTAL CUSTOMER BASE ANd 72.6% OF MOBILE dATA CUSTOMERS.
WHAT WE dO
Corporate Centres• Risk management• Customer care• Marketing• Corporate affairs• Finance• Resources• Technology
Executive Business Office &Project Management Office
Profit Centres• Enterprise business • Consumer business• Financial services
CEO
SAFARICOM SUSTAINABILITY REPORT 201322 SAFARICOM SUSTAINABILITY REPORT 2013 23
Cus
tom
ers
emp
loye
es
sha
reho
lde
rsRe
gul
ato
rsbu
sine
ss p
art
ners
OuR staKehOldeR ChaRteR
hOW they INFlueNCe us What MatteRs MOsttO theM
hOW We eNgage
We will communicate honestly, offer simple and relevant products, and deliver on our promises to the customer with speed and consistency.
Our customers are vital to the sustainability of Safaricom. They provide feedback on our products and services and drive us to develop innovative solutions.
- Customer experience- Relevant, affordable
products- Network quality- Better value offerings
- Customer care lines- Social media- Customer forums- Customer research and
surveys- Website
We will provide a great place to work and grow, where both individual accomplishments and team effort will be rewarded. We will provide opportunities for personal empowerment and career growth in an atmosphere of trust, honesty and openness.
Our employees are the face of Safaricom and ambassadors for the company. They continue to drive innovation and ensure that we achieve our company objectives. Our employees are also active participants in our Corporate Social Investment (CSI) agenda.
- Safe and exciting place to work
- Fair remuneration and benefits
- Career path opportunities
- Training and refresher courses on Safaricom products and services
- Staff portal- Newsletters- Company events- Team-building activities- Email- Website
We will enhance shareholder value by adherence to the highest standards of corporate governance and world class management practice. Our shareholders should expect timely and accurate information and the opportunity to engage with us through various forums.
Our shareholders provide us with capital, which supports our growth.
- Corporate performance- governance and ethics- Long-term sustainable
value creation- Return on investments
- Briefings- AgMs- Bulletins- Email- Reports
We will build constructive, respectful, open and transparent relationships with all regulators. Whilst beingcompliant with all regulation and applicable laws, we willadopt a firm approach onissues that may be detrimental to industry growth.
Our relationships with our regulators influence our ability to manage our risks and maintain our license to operate.
- Legislative compliance- Quality of service and
network performance- Licenses and taxes
- Industry wide forums- Reports and submissions
on issues- Public participation- Public meetings
We will engage in mutually beneficial and sustainable relationships with all business partners in an environment of equity, mutual respect and honesty. We are committed to growing Kenyan businesses and will offer preferential support to innovative local businesses.
Our business partners are a key part of how we engage with our customers and the overall customer experience. Our suppliers also impact on our ability to provide quality products and services in a responsible and ethical manner.
- Sustainability of Safaricom as a business
- Pricing and profit margins- Timely payment and
favourable terms
- Business meetings- Company events- Email- Briefings
soc
iety
Me
dia
Futu
re g
ene
ratio
ns
OuR staKehOldeR ChaRteR
hOW they INFlueNCe us What MatteRs MOsttO theM
hOW We eNgage
We will work closely with Kenyans to be a respected and empowering contributor to society. While we participate as an integral part in the upliftment of society, our relationship will be built on the principles of partnership, humility, openness and professionalism.
Society provides us with a conducive operating environment, and a market for our products and services.
- Access to transformative mobile solutions
- Responsible expansion of network infrastructure
- Access to health, education and financial services
- Media (traditional and social)
- AgMs- Website- Newsletters- Company events- Reports- Briefings
We will continuously and proactively engage with the media in a factual, speedy and honest way, in order to participate actively in informing public opinion. We will take a lead role in building industry knowledge among various media groups and hold them to account for responsible reporting.
The media provides us with a platform through which we can communicate with customers in Kenya and globally, and also influences our brand and image.
- Access to accurate and timely information
- Awareness of products and services
- Media (traditional and social)
- Briefings- Company events- Reports
The future is now and our conduct and business practices today must be designed to create and shape a sustainable tomorrow.
Future generations will influence the future environment within which Safaricom will operate.
- developing transformative and relevant solutions
- Ensuring responsible and sustainable corporate activities
- Website- Reports
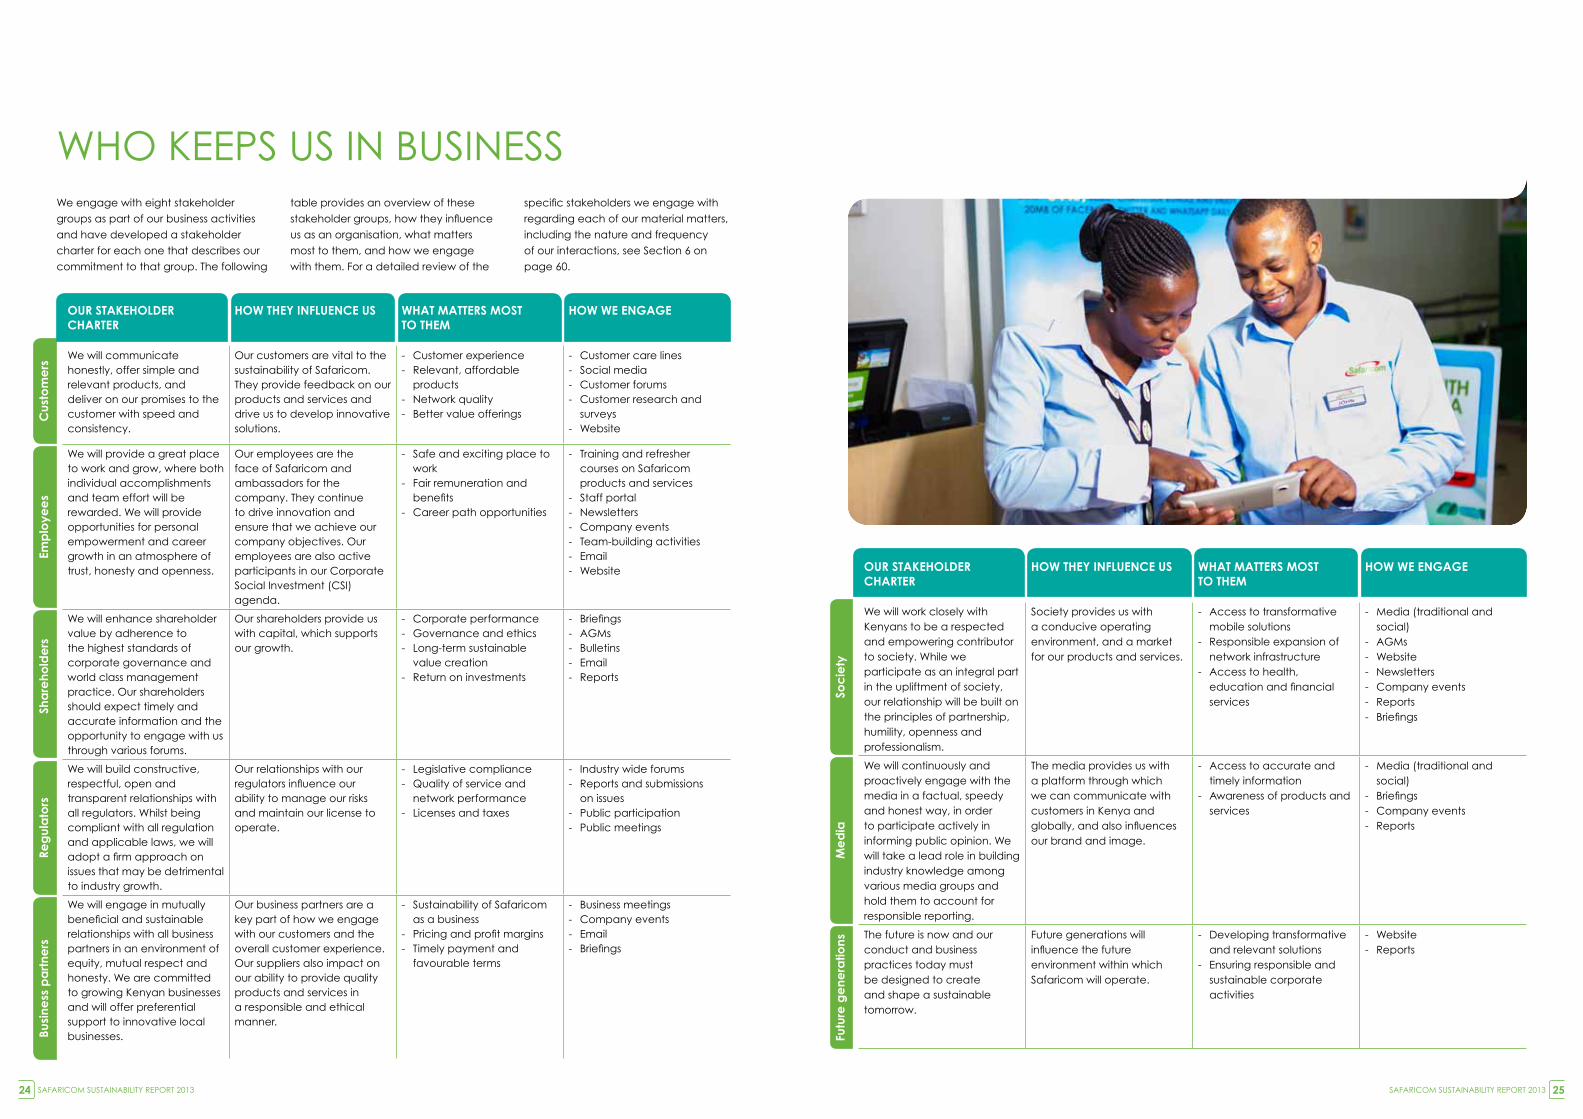
We engage with eight stakeholder
groups as part of our business activities
and have developed a stakeholder
charter for each one that describes our
commitment to that group. The following
table provides an overview of these
stakeholder groups, how they influence
us as an organisation, what matters
most to them, and how we engage
with them. For a detailed review of the
specific stakeholders we engage with
regarding each of our material matters,
including the nature and frequency
of our interactions, see Section 6 on
page 60.
WHO KEEPS US IN BUSINESS
SAFARICOM SUSTAINABILITY REPORT 2013 25SAFARICOM SUSTAINABILITY REPORT 201324
February 2013
November 2012October 2012
july 2012june 2012 October 2012
RETAINEDFOR GROWTH
26.21PY 21.77
LANDLORDS1.15
PY 1.05
SUPPLIERS40.67
PY 38.36
DEALERS AND AGENTS19.53
PY 16.54FINANCE EXPENSES2.84
PY 3.66
DIVIDENDS12.40
PY 8.80
SAFARICOM FOUNDATION0.21
PY 0.21
EMPLOYEES8.39
PY 7.51
VOICE77.66
PY 68.96
M-PESA21.84
PY 16.87
FIXED SERVICE2.11
PY 1.37
MESSAGING10.13
PY 7.77
MOBILE DATA6.31
PY 5.22
OTHER2.70
PY 2.23HANDSET
4.93PY 5.94
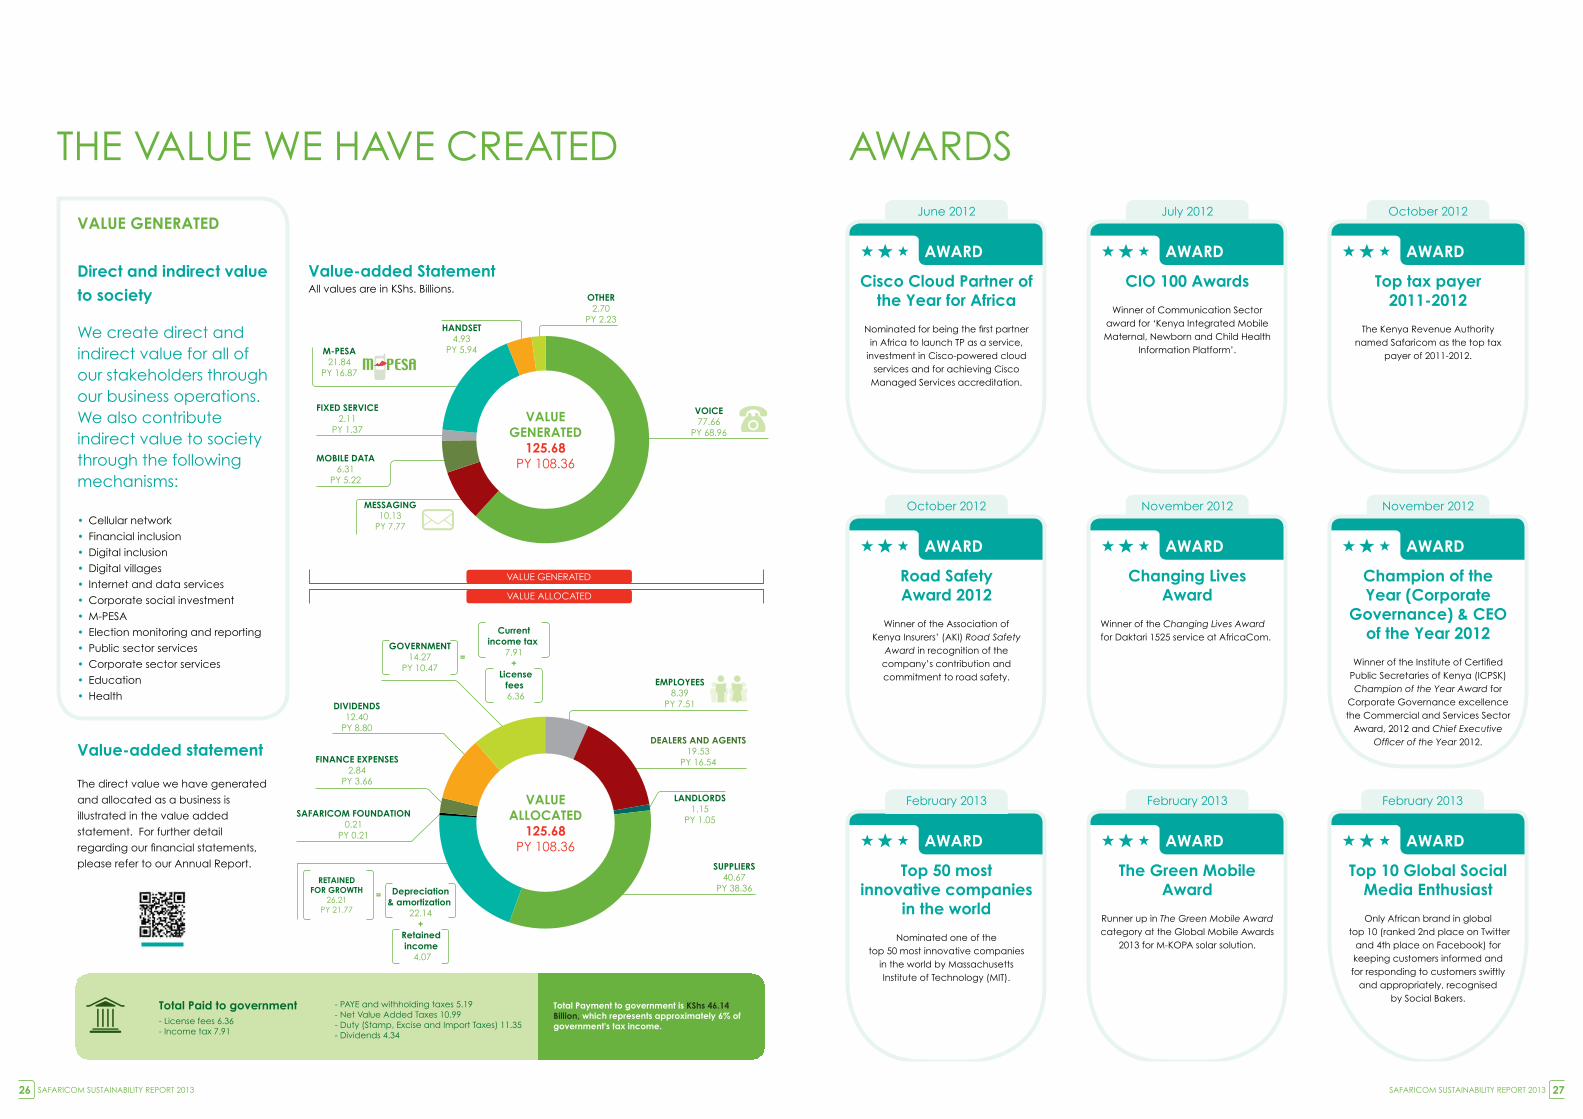
Total Paid to government- License fees 6.36- Income tax 7.91
VALUE GENERATED
VALUE ALLOCATED
- PAYE and withholding taxes 5.19- Net Value Added Taxes 10.99- Duty (Stamp, Excise and Import Taxes) 11.35- Dividends 4.34
Total Payment to government is KShs 46.14 Billion, which represents approximately 6% of government's tax income.
VALUEGENERATED
125.68PY 108.36
VALUEALLOCATED
125.68PY 108.36
=GOVERNMENT
14.27PY 10.47
Licensefees 6.36
+
Currentincome tax
7.91
=
Retained income
4.07
+
Depreciation& amortization
22.14
Value geNeRated
direct and indirect valueto society
We create direct and indirect value for all of our stakeholders through our business operations. We also contribute indirect value to society through the following mechanisms:
• Cellular network
• Financial inclusion
• digital inclusion
• digital villages
• Internet and data services
• Corporate social investment
• M-PESA
• Election monitoring and reporting
• Public sector services
• Corporate sector services
• Education
• Health
Value-added statement
The direct value we have generated
and allocated as a business is
illustrated in the value added
statement. For further detail
regarding our financial statements,
please refer to our Annual Report.
Value-added statementAll values are in KShs. Billions.
aWaRd
the green Mobile award
Runner up in The Green Mobile Award category at the global Mobile Awards
2013 for M-KOPA solar solution.
November 2012
aWaRd
Champion of the year (Corporate
governance) & CeO of the year 2012
Winner of the Institute of Certified Public Secretaries of Kenya (ICPSK) Champion of the Year Award for
Corporate governance excellence the Commercial and Services Sector
Award, 2012 and Chief Executive Officer of the Year 2012.
THE vALUE WE HAvE CREATEd AWARdS
aWaRd
top tax payer2011-2012
The Kenya Revenue Authoritynamed Safaricom as the top tax
payer of 2011-2012.
aWaRd
Road safetyaward 2012
Winner of the Association ofKenya Insurers’ (AKI) Road Safety
Award in recognition of the company’s contribution and commitment to road safety.
aWaRd
Changing livesaward
Winner of the Changing Lives Award for daktari 1525 service at AfricaCom.
February 2013
aWaRd
top 10 global social Media enthusiast
Only African brand in global top 10 (ranked 2nd place on Twitter
and 4th place on Facebook) for keeping customers informed andfor responding to customers swiftly
and appropriately, recognisedby Social Bakers.
aWaRd
CIO 100 awards
Winner of Communication Sector award for ‘Kenya Integrated Mobile Maternal, Newborn and Child Health
Information Platform’.
February 2013
aWaRd
top 50 most innovative companies
in the world
Nominated one of thetop 50 most innovative companies
in the world by MassachusettsInstitute of Technology (MIT).
aWaRd
Cisco Cloud partner of the year for africa
Nominated for being the first partner in Africa to launch TP as a service,
investment in Cisco-powered cloud services and for achieving Cisco
Managed Services accreditation.
RETAINEDFOR GROWTH
26.21PY 21.77
LANDLORDS1.15
PY 1.05
SUPPLIERS40.67
PY 38.36
DEALERS AND AGENTS19.53
PY 16.54FINANCE EXPENSES2.84
PY 3.66
DIVIDENDS12.40
PY 8.80
SAFARICOM FOUNDATION0.21
PY 0.21
EMPLOYEES8.39
PY 7.51
VOICE77.66
PY 68.96
M-PESA21.84
PY 16.87
FIXED SERVICE2.11
PY 1.37
MESSAGING10.13
PY 7.77
MOBILE DATA6.31
PY 5.22
OTHER2.70
PY 2.23HANDSET
4.93PY 5.94
Total Paid to government- License fees 6.36- Income tax 7.91
VALUE GENERATED
VALUE ALLOCATED
- PAYE and withholding taxes 5.19- Net Value Added Taxes 10.99- Duty (Stamp, Excise and Import Taxes) 11.35- Dividends 4.34
Total Payment to government is KShs 46.14 Billion, which represents approximately 6% of government's tax income.
VALUEGENERATED
125.68PY 108.36
VALUEALLOCATED
125.68PY 108.36
=GOVERNMENT
14.27PY 10.47
Licensefees 6.36
+
Currentincome tax
7.91
=
Retained income
4.07
+
Depreciation& amortization
22.14
SAFARICOM SUSTAINABILITY REPORT 201326 SAFARICOM SUSTAINABILITY REPORT 2013 27
Remuneration
Our remuneration policy aims to attract and retain leaders of the highest calibre. Compensation for the highest governance body, senior managers and executives is linked to performance indicators that include social and environmental performance, as well as strategic and financial deliverables. group ExCo members also volunteer their time and expertise to organisations and charities, serving communities in need through the Safaricom Foundation World of Difference programme. The annual pay increases awarded to executive directors are kept in line with
overall employee pay increases.
the board
The Board is heavily involved in
approving the strategic plans of the
organisation, which includes factors
affecting sustainability. during the
reporting period, the Board met twice to
review strategy, and the CEO updates
the Board on economic, social and
environmental performance every
quarter. The CEO is responsible for
social, economic and environmental
performance and is the sustainability
champion on the Board. A governance
Charter, which will outline the processes
for evaluating the performance of the
Board as a whole and as individual
members, is currently being developed
and will be finalised by September 2013.
The Safaricom Board consists of
11 members, nine non-executive
(of which three are independent)
and two executive directors. The
Board undertakes conflict of interest
declarations and any potential conflicts
of interest are discussed during meetings
of the Board; if applicable, these
conflicts are disclosed appropriately.
All employees at Safaricom also make
declarations, in terms of employee
relations and/or business relations.
The Nomination and Remuneration
Committee (REMCO) recommends
and nominates individuals for Board
interviews. Members of the committee
consider specific skills (technical,
telecommunications, financial and
general management) and gender.
Shareholders also nominate people to
the Board.
engagement mechanisms
Safaricom engages with its staff through
a number of mechanisms. These include
the Sema na CEO (‘speak with the
CEO’) chat room, the annual people
survey and Staff Council Meetings. The
Staff Council meets on a quarterly basis
to address issues and concerns raised
by employees. It is chaired by the CEO
and includes elected representatives
from each division. Some of the key
issues that have been raised during the
reporting period include:
• Wellness days: Company Wellness
days are predominantly held in Nairobi
(at HQ, SCC and jCC), as a result,
staff in the regions and retail centres
miss out. This exclusion was raised on
Sema na CEO and then reviewed and
the decision has since been taken
to include more locations outside of
Nairobi to cater for all staff.
• team-building sessions: The Enterprise
Business Unit (EBU) team includes a
number of contractors, who were not
involved in team-building initiatives.
This was raised on Sema na CEO and,
since then, the contractors have
been taken for a hybrid team-building
session and will be included in future
sessions.
• employee loans schemes:An escalation of the interest rates on
staff loans during the reporting period,
led to many employees paying
exorbitant amounts of interest on their
loans. To help address this, the HR team
renegotiated the rates with the various
providers, as well as bringing on board
new providers, to ensure that staff pay
equitable, affordable rates.
• staff tariffs: In response to an issue
raised on Sema na CEO, staff tariffs for
voice and data were reviewed.
We engage our shareholders through
our Annual general Meeting and
through our Investor Relations team.
enlightened corporate citizenship
Our CEO, Bob Collymore, was appointed
to the United Nations global Compact
(UNgC) Board in April 2012. The UNgC
encourages companies to benefit the
economies and societies in which they
operate by committing to 10 principles
in the areas of human rights, labour,
environment and anti-corruption.
This sustainability report is also a
reflection of our UNGC commitment to
report honestly and transparently on our
implementation of the 10 principles.
In addition to the UNgC, we also
subscribe to the global Reporting
Initiative (gRI), International Financial
Reporting Standards (IFRS) and the
Kenyan Capital Markets Authority
(KCMA) Corporate governance
Framework. We are also members of
the following industry associations:
Kenya Association of Manufacturers;
International Telecommunication Union;
gSM Association, and the Kenya Private
Sector Alliance.
safaricom people survey
Our annual independent employee survey was conducted by the Hay group. The survey attracted an impressive 88% response rate and there was a strong, positive improvement over the 2012 results. Business managers have been communicating the results to their staff and the feedback from these sessions will be used to determine how things can be improved even more.
OU
R BU
SINESS
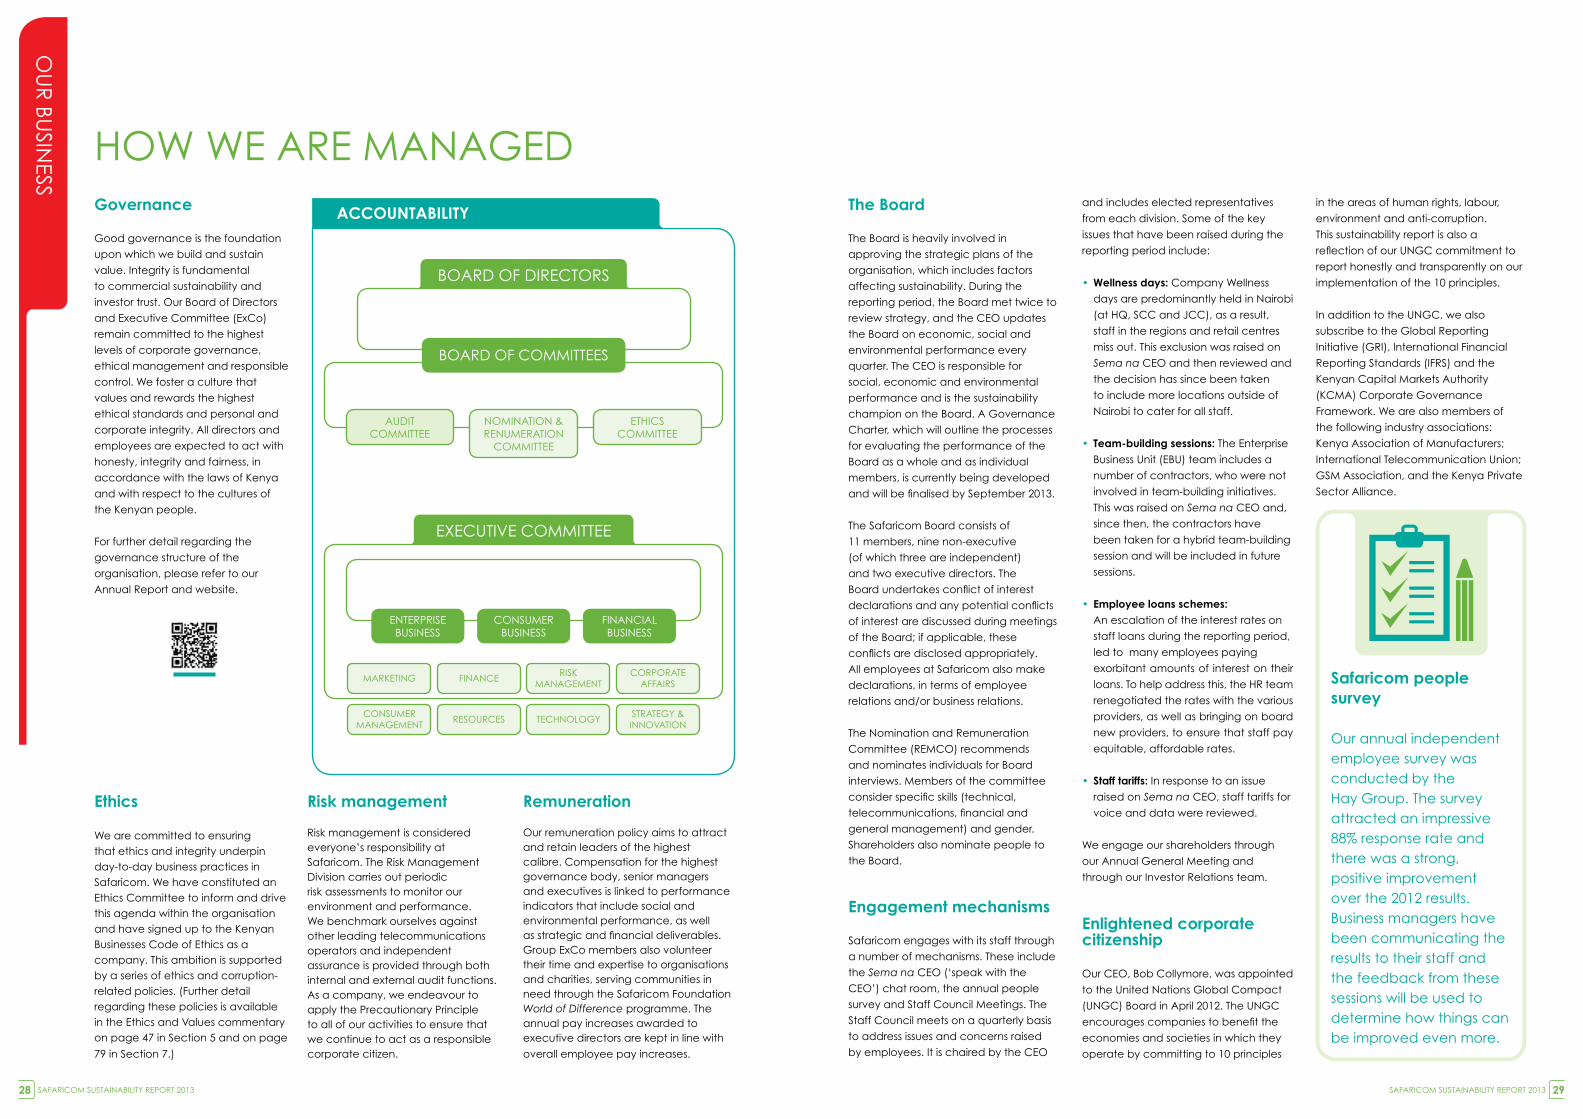
HOW WE ARE MANAgEdgovernance
good governance is the foundation
upon which we build and sustain
value. Integrity is fundamental
to commercial sustainability and
investor trust. Our Board of directors
and Executive Committee (ExCo)
remain committed to the highest
levels of corporate governance,
ethical management and responsible
control. We foster a culture that
values and rewards the highest
ethical standards and personal and
corporate integrity. All directors and
employees are expected to act with
honesty, integrity and fairness, in
accordance with the laws of Kenya
and with respect to the cultures of
the Kenyan people.
For further detail regarding the
governance structure of the
organisation, please refer to our
Annual Report and website.
ethics
We are committed to ensuring that ethics and integrity underpin day-to-day business practices in Safaricom. We have constituted an Ethics Committee to inform and drive this agenda within the organisation and have signed up to the Kenyan Businesses Code of Ethics as a company. This ambition is supported by a series of ethics and corruption-related policies. (Further detail regarding these policies is available in the Ethics and values commentary on page 47 in Section 5 and on page
79 in Section 7.)
Risk management
Risk management is considered everyone’s responsibility at Safaricom. The Risk Management division carries out periodic risk assessments to monitor our environment and performance. We benchmark ourselves against other leading telecommunications operators and independent assurance is provided through both internal and external audit functions. As a company, we endeavour to apply the Precautionary Principle to all of our activities to ensure that we continue to act as a responsible corporate citizen.
aCCOuNtabIlIty
BOARd OF dIRECTORS
ExECUTIvE COMMITTEE
BOARd OF COMMITTEES
ENTERPRISE BUSINESS
CONSUMER BUSINESS
FINANCIAL BUSINESS
AUdIT COMMITTEE
MARKETINg
CONSUMER MANAgEMENT
FINANCE
RESOURCES
RISK MANAgEMENT
CORPORATE AFFAIRS
TECHNOLOgYSTRATEgY & INNOvATION
ETHICSCOMMITTEE
NOMINATION & RENUMERATION
COMMITTEE
SAFARICOM SUSTAINABILITY REPORT 201328 SAFARICOM SUSTAINABILITY REPORT 2013 29
TRA
NSFO
RM
INg
LIvES
OUR STRATEgY4
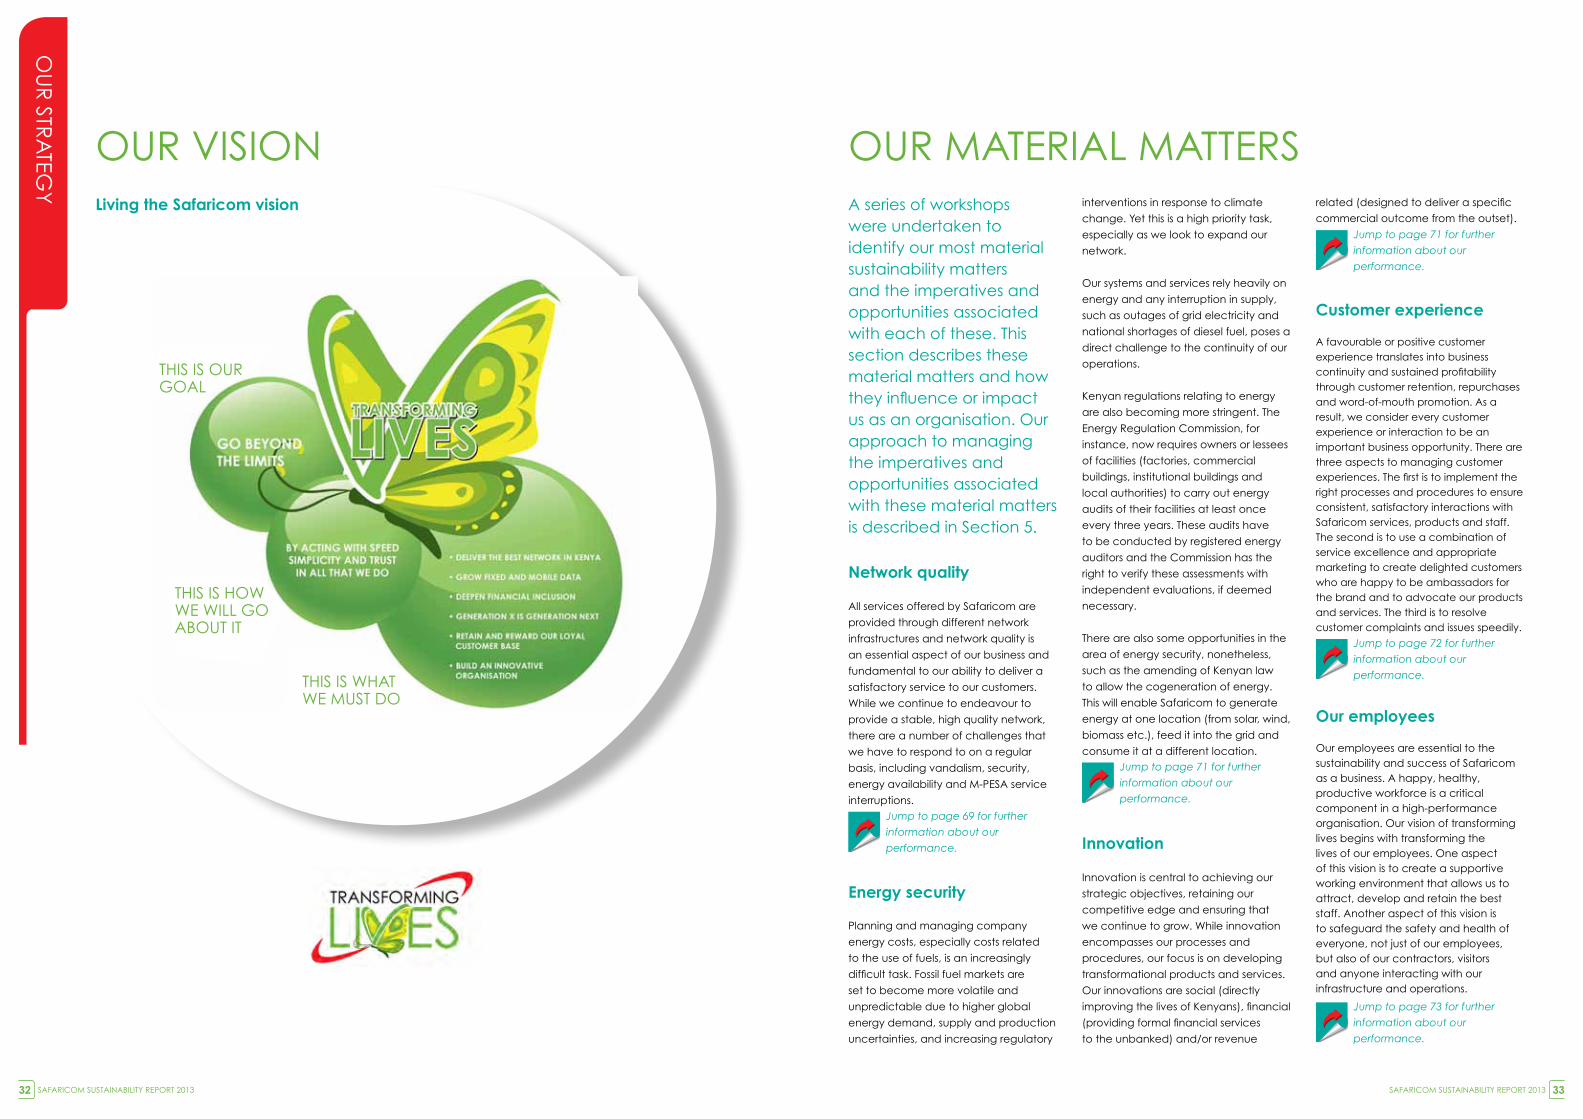
THIS IS OUR gOAL
THIS IS HOW WE WILL gO ABOUT IT
THIS IS WHAT WE MUST dO
OU
R STR
ATEg
Y
A series of workshops were undertaken to identify our most material sustainability matters and the imperatives and opportunities associated with each of these. This section describes these material matters and how they influence or impact us as an organisation. Our approach to managing the imperatives and opportunities associated with these material matters is described in Section 5.
Network quality
All services offered by Safaricom are
provided through different network
infrastructures and network quality is
an essential aspect of our business and
fundamental to our ability to deliver a
satisfactory service to our customers.
While we continue to endeavour to
provide a stable, high quality network,
there are a number of challenges that
we have to respond to on a regular
basis, including vandalism, security,
energy availability and M-PESA service
interruptions.
energy security
Planning and managing company
energy costs, especially costs related
to the use of fuels, is an increasingly
difficult task. Fossil fuel markets are
set to become more volatile and
unpredictable due to higher global
energy demand, supply and production
uncertainties, and increasing regulatory
interventions in response to climate
change. Yet this is a high priority task,
especially as we look to expand our
network.
Our systems and services rely heavily on
energy and any interruption in supply,
such as outages of grid electricity and
national shortages of diesel fuel, poses a
direct challenge to the continuity of our
operations.
Kenyan regulations relating to energy
are also becoming more stringent. The
Energy Regulation Commission, for
instance, now requires owners or lessees
of facilities (factories, commercial
buildings, institutional buildings and
local authorities) to carry out energy
audits of their facilities at least once
every three years. These audits have
to be conducted by registered energy
auditors and the Commission has the
right to verify these assessments with
independent evaluations, if deemed
necessary.
There are also some opportunities in the
area of energy security, nonetheless,
such as the amending of Kenyan law
to allow the cogeneration of energy.
This will enable Safaricom to generate
energy at one location (from solar, wind,
biomass etc.), feed it into the grid and
consume it at a different location.
Innovation
Innovation is central to achieving our
strategic objectives, retaining our
competitive edge and ensuring that
we continue to grow. While innovation
encompasses our processes and
procedures, our focus is on developing
transformational products and services.
Our innovations are social (directly
improving the lives of Kenyans), financial
(providing formal financial services
to the unbanked) and/or revenue
related (designed to deliver a specific
commercial outcome from the outset).
Customer experience
A favourable or positive customer experience translates into business continuity and sustained profitability through customer retention, repurchases and word-of-mouth promotion. As a result, we consider every customer experience or interaction to be an important business opportunity. There are three aspects to managing customer experiences. The first is to implement the right processes and procedures to ensure consistent, satisfactory interactions with Safaricom services, products and staff. The second is to use a combination of service excellence and appropriate marketing to create delighted customers who are happy to be ambassadors for the brand and to advocate our products and services. The third is to resolve customer complaints and issues speedily.
Our employees
Our employees are essential to the sustainability and success of Safaricom as a business. A happy, healthy, productive workforce is a critical component in a high-performance organisation. Our vision of transforming lives begins with transforming the lives of our employees. One aspect of this vision is to create a supportive working environment that allows us to attract, develop and retain the best staff. Another aspect of this vision is to safeguard the safety and health of everyone, not just of our employees, but also of our contractors, visitors and anyone interacting with our infrastructure and operations.
OUR MATERIAL MATTERSOUR vISIONliving the safaricom vision
Jump to page 71 for further
information about our
performance.
Jump to page 72 for further
information about our
performance.
Jump to page 73 for further
information about our
performance.
Jump to page 71 for further
information about our
performance.
Jump to page 69 for further
information about our
performance.
SAFARICOM SUSTAINABILITY REPORT 201332 SAFARICOM SUSTAINABILITY REPORT 2013 33
Based on our vision and material matters, we have identified a number of imperatives and opportunities. These balance our short-term position with our long-term strategy. We view our imperatives as those actions that we need to undertake to maintain our current position and our opportunities as future-looking initiatives that we need to initiate to realise our potential for growth. Our approach to managing each of these is described in Section 5.
environmental performance
One of the central challenges
of our age is how to uncouple
human progress from resource use
and environmental deterioration.
We appreciate the significance
of environmental risks and
uncertainties and how these affect
investment decisions and consumer
behaviour. We take a long-term
view and understand that positive
environmental performance makes
sound business sense.
Effective environmental
management offers many benefits.
It can help an organisation to
rethink its operations and to
reduce costs by uncovering
new efficiencies. It can also help
an organisation focus on being
innovative and discovering
different, smarter ways of doing
things, making the company leaner,
more agile and more resilient in an
increasingly resource-constrained
world. It also contributes indirectly
by helping an organisation to
avoid the penalties for breaching
environmental laws.
business partners
Our business partners include suppliers
and dealers and are an important part
of our value chain. We rely heavily on
our partners from both an operational
perspective and also in terms of
our reputation. It is essential that we
manage our relationships with our
business partners to ensure mutually
beneficial and sustainable associations.
Regulatory issues
The regulatory environment within which
Safaricom operates is increasingly
complex. The nature of the industry
requires the company to remain
compliant with a wide range of different
rules and laws, including licence
conditions, sector regulations, by-laws
and government legislation. As well
as being part of our responsibilities as
a good corporate citizen, failure to
comply damages our reputation and
exposes us to penalties, onerous fines
and other remedial sanctions. As a result,
we consider public policy lobbying
an important task and a vital way of
ensuring that the operating environment
for the provision of telecommunications
services in Kenya remains constructive.
ethics and values
Acting ethically is not only a key
responsibility of ours as a good
corporate citizen, it also makes business
sense. Ethical practices bolster the
reputation and trust enjoyed by an
organisation, strengthen employee
engagement and improve stakeholder
sentiment and interest. We view ethical
business practices as non-negotiable
and continue to promote these
principles throughout our value chain
and the wider business ecosystem in
Kenya.
OUR IMPERATIvES ANd OPPORTUNITIES
OUR MATERIAL MATTERS (CONTINUEd)
Jump to page 77 for further
information about our
performance.
Jump to page 79 for further
information about our
performance.
Jump to page 79 for further
information about our
performance.
Jump to page 79 for further
information about our
performance.
OU
R STR
ATEg
Y
WE TAKE A LONg-TERM vIEW ANd UNdERSTANd THAT POSITIvE ENvIRONMENTAL PERFORMANCE MAKES SOUNd BUSINESS SENSE.
IMpeRatIVes
deliver the best network by maintaining and enhancing network
quality
develop transformational products and services relevant to different
customer segments
Minimise business disruptions to our business ecosystem
Maintain a productive, supportive and safe working environment
protect our reputation
Comply with regulatory requirements
OppORtuNItIes
Promote positive customer experiences at all touch points
Actively deepen financial inclusion
Innovate to service a growing youth sector
Promote sustainable practices within our operations and business
ecosystem
Roll out alternative energy solutions, ensuring energy security for our
future growth
Continue to lobby and drive policy to ensure a constructive business
environment
Promote ethical business and good corporate governance
39
50
41
52
57
42
54
58
44
54
59
47
49
SAFARICOM SUSTAINABILITY REPORT 201334 SAFARICOM SUSTAINABILITY REPORT 2013 35
TRA
NSFO
RM
INg
LIvES
OUR IMPERATIvES ANd OPPORTUNITIES
5
delivering the best network by maintaining and enhancing network quality
Network quality is a core component of our business and we are undertaking the following actions to ensure that we continue to
provide a high quality service to all of our network users.
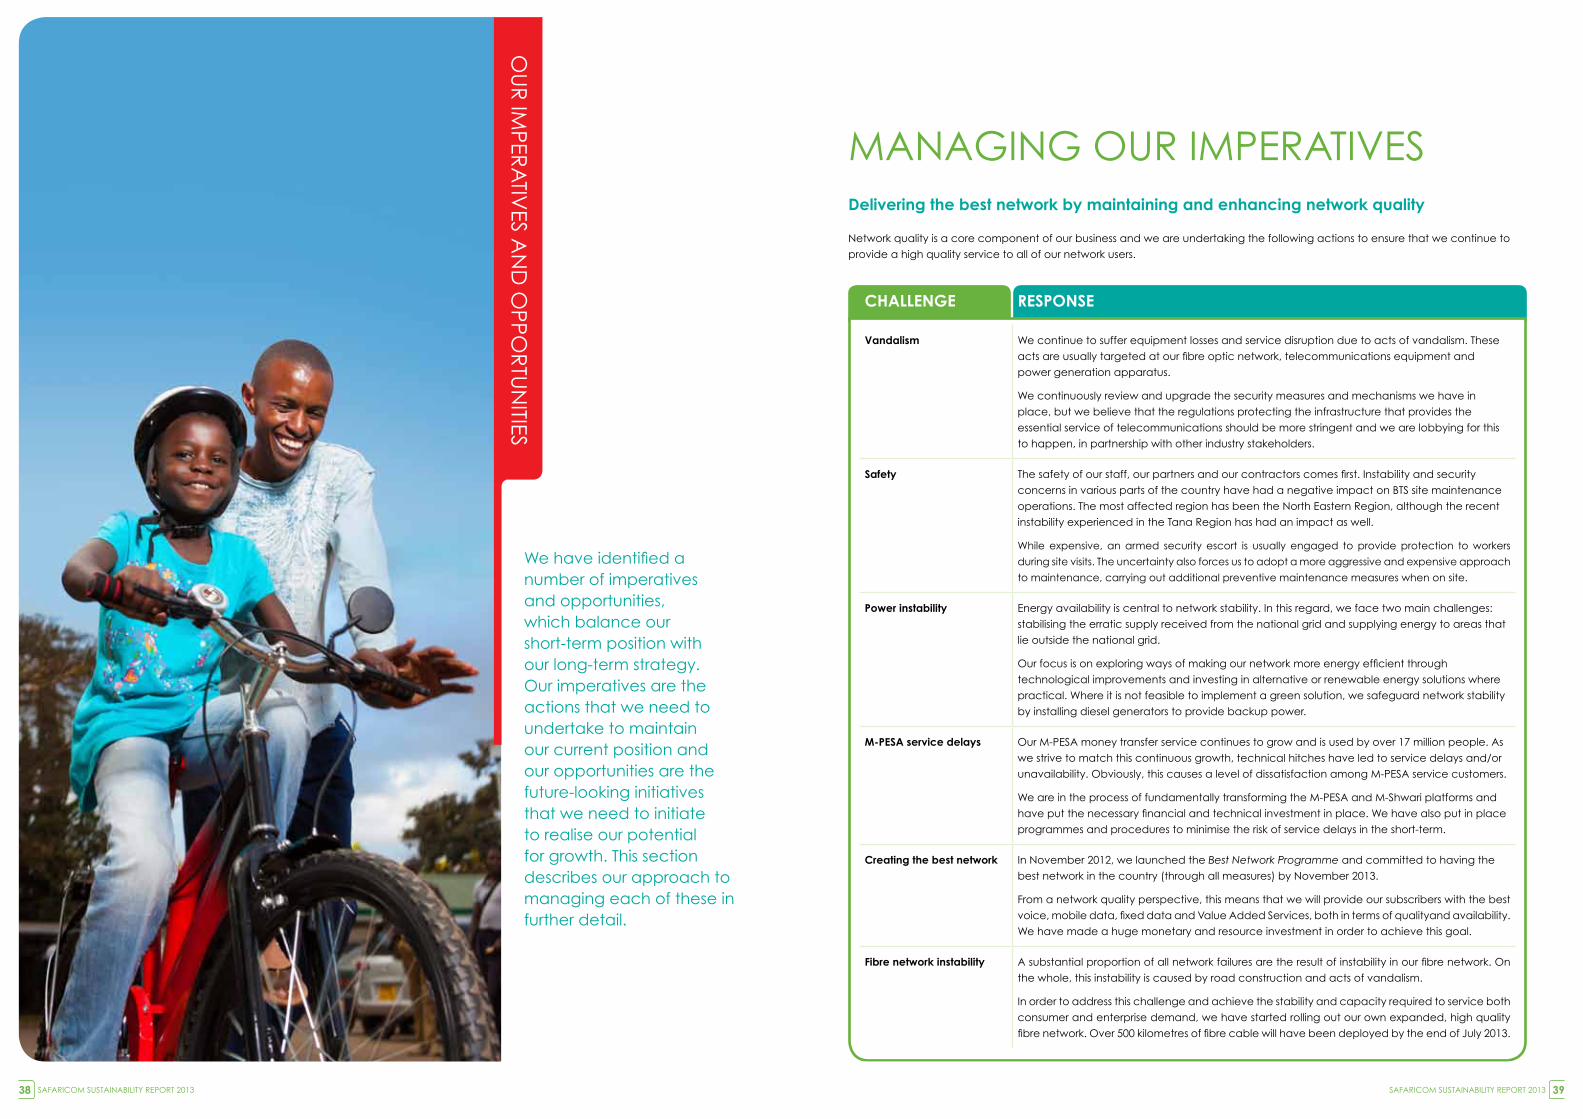
We have identified a number of imperatives and opportunities, which balance our short-term position with our long-term strategy. Our imperatives are the actions that we need to undertake to maintain our current position and our opportunities are the future-looking initiatives that we need to initiate to realise our potential for growth. This section describes our approach to managing each of these in further detail.
OU
R IM
PERA
TIvES A
Nd
OPPO
RTU
NITIES
MANAgINg OUR IMPERATIvES
ChalleNge RespONse
Vandalism We continue to suffer equipment losses and service disruption due to acts of vandalism. These
acts are usually targeted at our fibre optic network, telecommunications equipment and
power generation apparatus.
We continuously review and upgrade the security measures and mechanisms we have in
place, but we believe that the regulations protecting the infrastructure that provides the
essential service of telecommunications should be more stringent and we are lobbying for this
to happen, in partnership with other industry stakeholders.
safety The safety of our staff, our partners and our contractors comes first. Instability and security
concerns in various parts of the country have had a negative impact on BTS site maintenance
operations. The most affected region has been the North Eastern Region, although the recent
instability experienced in the Tana Region has had an impact as well.
While expensive, an armed security escort is usually engaged to provide protection to workers
during site visits. The uncertainty also forces us to adopt a more aggressive and expensive approach
to maintenance, carrying out additional preventive maintenance measures when on site.
power instability Energy availability is central to network stability. In this regard, we face two main challenges:
stabilising the erratic supply received from the national grid and supplying energy to areas that
lie outside the national grid.
Our focus is on exploring ways of making our network more energy efficient through
technological improvements and investing in alternative or renewable energy solutions where
practical. Where it is not feasible to implement a green solution, we safeguard network stability
by installing diesel generators to provide backup power.
M-pesa service delays Our M-PESA money transfer service continues to grow and is used by over 17 million people. As
we strive to match this continuous growth, technical hitches have led to service delays and/or
unavailability. Obviously, this causes a level of dissatisfaction among M-PESA service customers.
We are in the process of fundamentally transforming the M-PESA and M-Shwari platforms and
have put the necessary financial and technical investment in place. We have also put in place
programmes and procedures to minimise the risk of service delays in the short-term.
Creating the best network In November 2012, we launched the Best Network Programme and committed to having the
best network in the country (through all measures) by November 2013.
From a network quality perspective, this means that we will provide our subscribers with the best
voice, mobile data, fixed data and Value Added Services, both in terms of qualityand availability.
We have made a huge monetary and resource investment in order to achieve this goal.
Fibre network instability A substantial proportion of all network failures are the result of instability in our fibre network. On
the whole, this instability is caused by road construction and acts of vandalism.
In order to address this challenge and achieve the stability and capacity required to service both
consumer and enterprise demand, we have started rolling out our own expanded, high quality
fibre network. Over 500 kilometres of fibre cable will have been deployed by the end of July 2013.
SAFARICOM SUSTAINABILITY REPORT 201338 SAFARICOM SUSTAINABILITY REPORT 2013 39
ChalleNge RespONse
Network expansion We have to expand our network capacity constantly in order to keep up with the continuous
growth in demand for services and minimise network congestion.
An aggressive 2G and 3G site expansion programme was undertaken in this financial year and
over 240 BTS sites were rolled out. The programme included the roll out of sites in areas that
previously had little or no coverage, as well as in areas where coverage had degraded (mostly
as a result of the development of high rise buildings in urban settings). While BTS site acquisition
remains a challenge, co-location opportunities are explored wherever possible.
We have also invested heavily in our 3g infrastructure to enhance mobile data performance
and experience. Unlike 2g network coverage, 3g coverage ‘shrinks’ as 3g mobile user density
increases. This calls for intense and continuous planning and re-planning of the 3g network to
ensure an acceptable quality of service is provided.
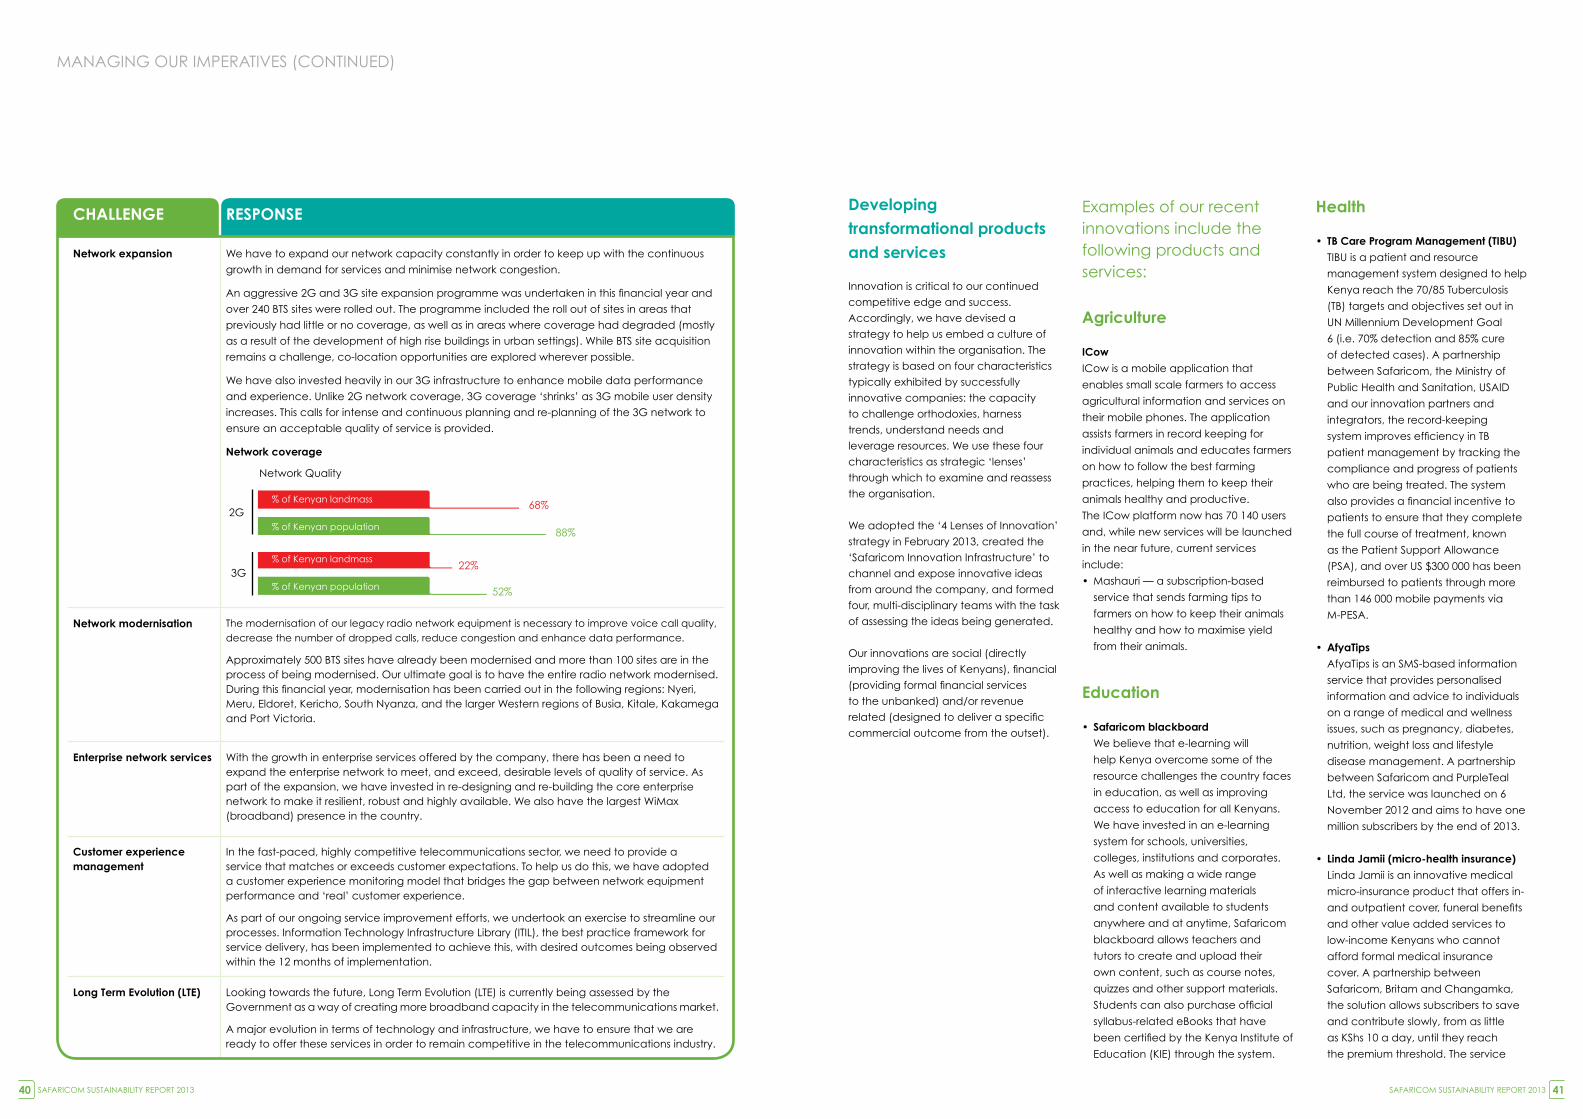
Network coverage
Network modernisation The modernisation of our legacy radio network equipment is necessary to improve voice call quality, decrease the number of dropped calls, reduce congestion and enhance data performance.
Approximately 500 BTS sites have already been modernised and more than 100 sites are in the process of being modernised. Our ultimate goal is to have the entire radio network modernised. During this financial year, modernisation has been carried out in the following regions: Nyeri, Meru, Eldoret, Kericho, South Nyanza, and the larger Western regions of Busia, Kitale, Kakamega and Port victoria.
enterprise network services With the growth in enterprise services offered by the company, there has been a need to expand the enterprise network to meet, and exceed, desirable levels of quality of service. As part of the expansion, we have invested in re-designing and re-building the core enterprise network to make it resilient, robust and highly available. We also have the largest WiMax (broadband) presence in the country.
Customer experience management
In the fast-paced, highly competitive telecommunications sector, we need to provide a service that matches or exceeds customer expectations. To help us do this, we have adopted a customer experience monitoring model that bridges the gap between network equipment performance and ‘real’ customer experience.
As part of our ongoing service improvement efforts, we undertook an exercise to streamline our processes. Information Technology Infrastructure Library (ITIL), the best practice framework for service delivery, has been implemented to achieve this, with desired outcomes being observed within the 12 months of implementation.
long term evolution (lte) Looking towards the future, Long Term Evolution (LTE) is currently being assessed by the government as a way of creating more broadband capacity in the telecommunications market.
A major evolution in terms of technology and infrastructure, we have to ensure that we are ready to offer these services in order to remain competitive in the telecommunications industry.
developing transformational products and services
Innovation is critical to our continued
competitive edge and success.
Accordingly, we have devised a
strategy to help us embed a culture of
innovation within the organisation. The
strategy is based on four characteristics
typically exhibited by successfully
innovative companies: the capacity
to challenge orthodoxies, harness
trends, understand needs and
leverage resources. We use these four
characteristics as strategic ‘lenses’
through which to examine and reassess
the organisation.
We adopted the ‘4 Lenses of Innovation’
strategy in February 2013, created the
‘Safaricom Innovation Infrastructure’ to
channel and expose innovative ideas
from around the company, and formed
four, multi-disciplinary teams with the task
of assessing the ideas being generated.
Our innovations are social (directly
improving the lives of Kenyans), financial
(providing formal financial services
to the unbanked) and/or revenue
related (designed to deliver a specific
commercial outcome from the outset).
Examples of our recent innovations include the following products and services:
agriculture
ICow
ICow is a mobile application that
enables small scale farmers to access
agricultural information and services on
their mobile phones. The application
assists farmers in record keeping for
individual animals and educates farmers
on how to follow the best farming
practices, helping them to keep their
animals healthy and productive.
The ICow platform now has 70 140 users
and, while new services will be launched
in the near future, current services
include:
• Mashauri — a subscription-based
service that sends farming tips to
farmers on how to keep their animals
healthy and how to maximise yield
from their animals.
education
• Safaricom blackboard
We believe that e-learning will
help Kenya overcome some of the
resource challenges the country faces
in education, as well as improving
access to education for all Kenyans.
We have invested in an e-learning
system for schools, universities,
colleges, institutions and corporates.
As well as making a wide range
of interactive learning materials
and content available to students
anywhere and at anytime, Safaricom
blackboard allows teachers and
tutors to create and upload their
own content, such as course notes,
quizzes and other support materials.
Students can also purchase official
syllabus-related eBooks that have
been certified by the Kenya Institute of
Education (KIE) through the system.
health
• TB Care Program Management (TIBU)
TIBU is a patient and resource
management system designed to help
Kenya reach the 70/85 Tuberculosis
(TB) targets and objectives set out in
UN Millennium development goal
6 (i.e. 70% detection and 85% cure
of detected cases). A partnership
between Safaricom, the Ministry of
Public Health and Sanitation, USAId
and our innovation partners and
integrators, the record-keeping
system improves efficiency in TB
patient management by tracking the
compliance and progress of patients
who are being treated. The system
also provides a financial incentive to
patients to ensure that they complete
the full course of treatment, known
as the Patient Support Allowance
(PSA), and over US $300 000 has been
reimbursed to patients through more
than 146 000 mobile payments via
M-PESA.
• AfyaTips
AfyaTips is an SMS-based information
service that provides personalised
information and advice to individuals
on a range of medical and wellness
issues, such as pregnancy, diabetes,
nutrition, weight loss and lifestyle
disease management. A partnership
between Safaricom and PurpleTeal
Ltd, the service was launched on 6
November 2012 and aims to have one
million subscribers by the end of 2013.
• linda Jamii (micro-health insurance)
Linda jamii is an innovative medical
micro-insurance product that offers in-
and outpatient cover, funeral benefits
and other value added services to
low-income Kenyans who cannot
afford formal medical insurance
cover. A partnership between
Safaricom, Britam and Changamka,
the solution allows subscribers to save
and contribute slowly, from as little
as KShs 10 a day, until they reach
the premium threshold. The service
MANAgINg OUR IMPERATIvES (CONTINUEd)
2G68%
88%
22%
52%
3G
% of Kenyan landmass
% of Kenyan population
% of Kenyan landmass
% of Kenyan population
Network Quality
2G68%
88%
22%
52%
3G
% of Kenyan landmass
% of Kenyan population
% of Kenyan landmass
% of Kenyan population
Network Quality
SAFARICOM SUSTAINABILITY REPORT 201340 SAFARICOM SUSTAINABILITY REPORT 2013 41
costs a family less than they pay for a packet of milk a day. Premiums and claim
payouts are made using the M-PESA platform. Although it has not yet been officially
launched, the service has already attracted over 7 000 subscribers through word-of-
mouth, with services available at over 600 hospitals and health facilities around the
country.
humanitarian response
• Refugees united is a family tracing service that helps refugees, internally displaced and stateless people to search for, and reconnect with, missing family or friends. To date, over 200,000 people have registered with the service and an updated version that allows people to register via USSd and SMS services, as well as via the web and mobile phone (WAP) will be launched in june 2013. The aim is to assist over 1 million registered displaced people globally by 2015.
business services
• Mobile videoThis is a video conference service that runs on smart mobile devices. It allows individuals and mobile workforces to collaborate and interact with colleagues, customers and vendors while on the move or away from the office. The objective is to bundle the collaboration service into our mobile data offerings and to provide an enterprise mobility solution that can be scaled to suit any size of business, from SMEs to corporates and government institutions.
• OneConnectOneConnect is a fixed voice product that unifies and simplifies enterprise communication needs into one solution. The solution consists of a fixed voice and numbering plan, single billing system and internet service, supported by a single point of contact support team and dedicated account manager. The objective is to provide a total business communication service that can be scaled to suit any size of business.
Minimising disruptions to our business ecosystem
Minimising the disruption caused by
power outages is one of the most
important challenges that we face.
As part of safeguarding our network
energy security, we ensure that all sites
where the cost of grid connection is
less than KShs 9 million are connected
immediately and that, where possible,
grid connection is undertaken before a
site switches live. All sites not connected
to the grid are powered using alternative
energy sources, such as power cubes
and renewable energy solutions.
power source(s) Number of sites
24/7 genset 79
diet site 14
Enhanced hybrid site 17
KPLC (grid) 2,466
KPLC/No genset 297
Mini-enhanced
hybrid site
6
Powercube 34
Solar/Wind 55
TKL/No genset 3
Network energy sources
MANAgINg OUR IMPERATIvES (CONTINUEd)
Specific initiatives to manage energy security and minimise the disruptions caused by power instability include the following:
INItIatIVe desCRIptION
power cube conversions
A first in Africa, we have converted 34 sites from 24/7 gensets to power cubes. A power cube is an
extremely efficient hybrid energy system in which all the power components are housed in one
enclosure. The components (generator, fuel tank, dc power system, batteries and controller) are all
factory integrated to reduce generator runtime, human interference, prolong battery life, reduce fuel
theft and enable remote monitoring.
Free cooling unit installations
We have installed 278 free cooling units in all indoor sites not in coastal areas. These units reduce the
energy consumption of air conditioners by exchanging warm inside air with cool air from outside when
the ambient temperatures are lower than the inside temperatures. As most of our sites are in areas of
moderate temperatures, it has been possible to achieve significant savings with these units, especially at
night.
power grid extensions
By working closely with the Kenya Power and Lighting Company (KPLC) and Rural Electrification
Authorities (REAs), we are able to take swift advantage of extensions to the national grid and use this
power to supply our sites. The programme is ongoing and approximately 95% of the sites targeted this
financial year have been connected.
low voltage auto phase selector (aps) installations
One hundred sites have had low voltage APS units installed. These units allow the switching of voltages
at sites at much lower voltages than normal (as low as 120v) and deep cycle batteries so that even
when the grid is completely non-existent, the site can run on stored energy for a period of time. All new
sites will feature APS units going forward.
Facilities energy redundancies
Within our facilities, we have created redundancies in the energy infrastructure to ensure that the loss of
one system does not paralyse our operations. Redundancy levels have reached level 4 (four different
backup systems) in critical facilities, such as the HQ1 data Centre.
The redundancy measures that have been implemented ensured zero downtime during the last 18
months, even though electricity shortages have been experienced at our data centres due to main
board failures and a generator catching alight after overheating.
We have also embarked on various projects in our buildings to reduce energy consumption and maintenance hours, including:
INItIatIVe desCRIptION
hybrid power supply system
As part of our ongoing programme to make our facilities more energy efficient, we have installed a hybrid
power supply in the Safaricom gym. The system uses solar power to heat the water used in the gym.
Office lighting All of the lighting in our major offices (Safaricom Care Centre, Jambo Call Centre and HQ1) has been
converted to energy efficient LED lighting, which is controlled by occupancy sensors.
Retail shop lighting We are also in the process of upgrading the lighting in our retail shops to energy efficient LED lighting,
controlled by occupancy sensors. To date, the lighting at seven of our 40 shops has been converted.
The conversion process is ongoing.
SAFARICOM SUSTAINABILITY REPORT 201342 SAFARICOM SUSTAINABILITY REPORT 2013 43
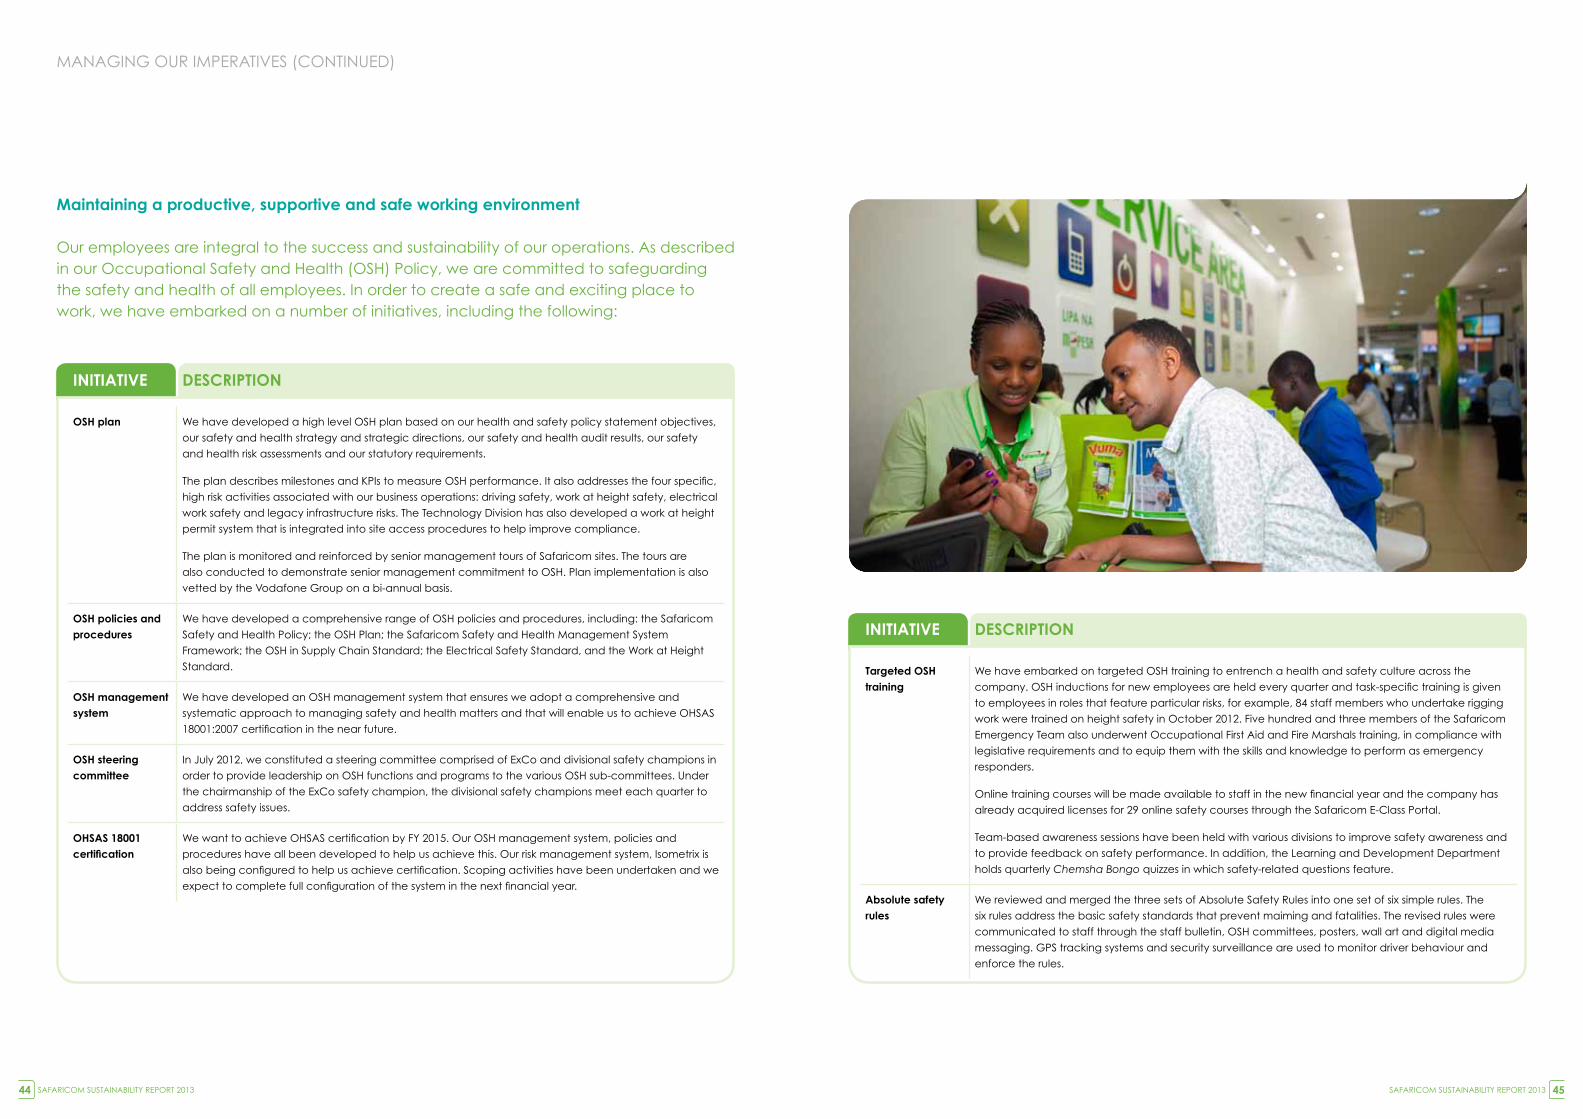
Maintaining a productive, supportive and safe working environment
Our employees are integral to the success and sustainability of our operations. As described in our Occupational Safety and Health (OSH) Policy, we are committed to safeguarding the safety and health of all employees. In order to create a safe and exciting place to work, we have embarked on a number of initiatives, including the following:
INItIatIVe desCRIptION
Osh plan We have developed a high level OSH plan based on our health and safety policy statement objectives,
our safety and health strategy and strategic directions, our safety and health audit results, our safety
and health risk assessments and our statutory requirements.
The plan describes milestones and KPIs to measure OSH performance. It also addresses the four specific,
high risk activities associated with our business operations: driving safety, work at height safety, electrical
work safety and legacy infrastructure risks. The Technology division has also developed a work at height
permit system that is integrated into site access procedures to help improve compliance.
The plan is monitored and reinforced by senior management tours of Safaricom sites. The tours are
also conducted to demonstrate senior management commitment to OSH. Plan implementation is also
vetted by the vodafone group on a bi-annual basis.
Osh policies and procedures
We have developed a comprehensive range of OSH policies and procedures, including: the Safaricom
Safety and Health Policy; the OSH Plan; the Safaricom Safety and Health Management System
Framework; the OSH in Supply Chain Standard; the Electrical Safety Standard, and the Work at Height
Standard.
Osh management system
We have developed an OSH management system that ensures we adopt a comprehensive and
systematic approach to managing safety and health matters and that will enable us to achieve OHSAS
18001:2007 certification in the near future.
Osh steering committee
In july 2012, we constituted a steering committee comprised of ExCo and divisional safety champions in
order to provide leadership on OSH functions and programs to the various OSH sub-committees. Under
the chairmanship of the ExCo safety champion, the divisional safety champions meet each quarter to
address safety issues.
Ohsas 18001 certification
We want to achieve OHSAS certification by FY 2015. Our OSH management system, policies and
procedures have all been developed to help us achieve this. Our risk management system, Isometrix is
also being configured to help us achieve certification. Scoping activities have been undertaken and we
expect to complete full configuration of the system in the next financial year.
INItIatIVe desCRIptION
targeted Osh training
We have embarked on targeted OSH training to entrench a health and safety culture across the
company. OSH inductions for new employees are held every quarter and task-specific training is given
to employees in roles that feature particular risks, for example, 84 staff members who undertake rigging
work were trained on height safety in October 2012. Five hundred and three members of the Safaricom
Emergency Team also underwent Occupational First Aid and Fire Marshals training, in compliance with
legislative requirements and to equip them with the skills and knowledge to perform as emergency
responders.
Online training courses will be made available to staff in the new financial year and the company has
already acquired licenses for 29 online safety courses through the Safaricom E-Class Portal.
Team-based awareness sessions have been held with various divisions to improve safety awareness and
to provide feedback on safety performance. In addition, the Learning and development department
holds quarterly Chemsha Bongo quizzes in which safety-related questions feature.
absolute safety rules
We reviewed and merged the three sets of Absolute Safety Rules into one set of six simple rules. The
six rules address the basic safety standards that prevent maiming and fatalities. The revised rules were
communicated to staff through the staff bulletin, OSH committees, posters, wall art and digital media
messaging. gPS tracking systems and security surveillance are used to monitor driver behaviour and
enforce the rules.
MANAgINg OUR IMPERATIvES (CONTINUEd)
SAFARICOM SUSTAINABILITY REPORT 201344 SAFARICOM SUSTAINABILITY REPORT 2013 45
• Performance managementAs part of our ongoing effort to embed a high performance culture, we reviewed and launched a new way of managing performance between employees and line managers. We have also introduced performance calibration meetings that will improve the performance of the organisation by fairly rewarding top performers and by helping low performers improve their contributions. The ultimate goal is more productive employees and every member of staff is required to partake in the performance management programme and to receive regular performance and career development reviews.
• Employee shareholder schemeWe have also introduced two employee shareholder schemes:- Employee share option (ESOP): The ESOP was issued to all permanent employees
on 26 February 2010. It had a three year vesting period and employees are currently exercising their shares for a period of one year.
- Out right grant: The outright grant is a performance- and potential-based scheme pegged on talent reviews. It is grade-based and issued to senior managers from grade 4 to grade 2. It is issued annually and the first tranche was awarded in july 2011.
protecting our reputation
In many respects, our reputation is one of our most important assets. It helps us to attract and retain customers, investment capital and talented employees. We recognise how easily a good reputation can be tarnished and take a number of steps to protect our reputation, including the following:
• Competition concerns and perceived dominanceNo official finding has been made in this regard, but, owing to our market share, Safaricom is perceived as being dominant. This perception has significant ramifications because if we were to be found dominant in certain markets in the telecommunications industry, we would be subject to additional regulatory scrutiny and obligations. Competition law in Kenya provides that an entity abusing its dominant position in the market can attract sanction and a heavy penalty of up to 10% of revenues. Accordingly, we focus on making sure that our operations and actions in the market are in compliance with the law and that we compete with other operators fairly.
• Ethical business practicesWe believe that ethical business practices are not only an integral part of protecting
our reputation, but are critical to our sustainability and success. As a result, we
promote an organisational culture that values the highest ethical standards of
personal and corporate integrity and expect all of our directors, employees and
suppliers to act with honesty, integrity and fairness.
INItIatIVe desCRIptION
ergonomics solutions
We have procured 1,000 ergonomically suitable seats for workstations in the jambo Call Centre, along with ergonomic foot- and wrist-rests. We are also introducing software to help staff develop good computing habits, which will help improve productivity and reduce the costs associated with workstation injuries and fatigue.
audits In compliance with statutory requirements, we audited 45 facilities from an OSH perspective and submitted our findings to the DOSHS. Workshops were held with ExCo and the responsible division heads on the findings and corrective action required. OSHA audits were also undertaken at 380 BTS sites and the company carried out fire safety audits at 60 facilities.
safety awareness week
A safety awareness week was held in April to commemorate World Safety and Health day on 28 April. Employees were engaged on safety-related issues throughout the week.
In addition, during the United Nations global Road Safety Week in May, staff participated in a series of awareness-raising activities that called for improved pedestrian safety, including walks on Mombasa Road and Waiyaki Way in Nairobi.
safety road show A company-wide road show was also undertaken in which employees were engaged on road safety issues. driving represents the greatest accident risk to staff (75% of all incidents) and employees were challenged to reduce the number of driving-related incidents.
Remuneration Our workforce is remunerated based on wages that are subject to Kenyan minimum wage rules. Our entry salary is 5 times higher than the minimum wage. There is no gender distinction on standard entry level wages.
We provide a number of benefits to all of our employees, including: medical insurance, work/injury benefits, as well as annual, sick, maternity, paternity and compassionate leave with funeral expenses.
Permanent employees are also provided with a pension, car allowance, group life insurance, social clubs, group personal accident insurance and stock ownership. None of our staff are covered by collective bargaining agreements; however, we do have a Staff Council which meets on a quarterly basis to address issues and concerns raised by employees.
employee wellness Our employee wellness strategy aims to encourage healthy living, ensure quick and easy access to medical facilities and to promote workplace wellness. We believe that this improves quality of life and leads to increased productivity, reduced medical costs and absenteeism, and enhanced recruitment and retention.
We offer a number of wellness initiatives, including: employee wellness programs, employee and family assistance programs, financial wellness programs and alcohol and drug abuse programs.
We also offer a number of amenities at our offices for employees, including lounge areas, a prayer room (jCC), gyms, a cyber café, cafeterias, a mothers room, games areas, in-house crèches (HQ1 and jCC) and an in-house clinic (HQ1).
safaricom wellness awareness campaign
Throughout our wellness awareness campaign, we aim to inspire and educate employees and enable them to take full responsibility for their own health and wellbeing. Employees can raise or share their health concerns, get information on current health issues and receive a comprehensive health check-up. We put together a team of doctors from various medical professions to offer free expert services to employees.
Our commitment to the wellness of our employees is not restricted to this particular campaign, however, and we run programmes throughout the year. These programmes encompass physical, mental, emotional and family health, and we also offer a counselling service to staff, if needed. In total, 2 036 staff participated in various wellness programmes during the reporting period.
e-Classes In total, we have had 4,253 visits by both permanent and temporary staff members to our E-Class online learning portal, with 992 employees having completed 3,837 modules. In the inaugural Safaricom E-Class graduation ceremony, 226 members of staff were conferred with E-Class certificates across various fields.
talent management
This year, we managed to on-board
all of the skills we required. We focus
our recruitment on growing internal
talent and identifying external talent
for unavailable/rare skills and have
achieved a 50:50 internal-to-external
hire ratio. We also have a 1:1.34 female-
to-male ratio across the business;
1.4% of our employees are physically-
challenged and 30% of our leaders
are female.
Some of the initiatives we have
undertaken this year to attract and
retain the best staff include:
• Talent management programmeThe objective of this programme is to
identify and nurture high-performing
and high-potential employees. This
year, 88 employees were identified
and are currently undergoing various
development initiatives.
• Job rotation programmeThrough our internal job rotation
programme, we have placed 70
employees in different roles to help
them gain skills and exposure in areas
of career interest.
• Internship programmeWe participated in six career fairs at
universities across the country. At the
fairs, Safaricom employees interacted
with students in an informal setting
and educated them about available
career options and requirements.
From the fairs, we drew the interest of
more than 3,000 graduate students
and successfully provided internship
opportunities to 200 of them.
doing business the right way: Safaricom 2.0 encapsulates our ethical standpoint and includes eight charters that describe our commitment to our stakeholders (see page 24). These charters are backed up by a number of other policy documents, including the Safaricom code of conduct (providing guidance to staff), our supplier and dealer codes of conduct, our corruption policy, gift policy, blacklisting policy, fraud policy, supplier sponsored trips policy and amnesty agreements.
MANAgINg OUR IMPERATIvES (CONTINUEd)
SAFARICOM SUSTAINABILITY REPORT 201346 SAFARICOM SUSTAINABILITY REPORT 2013 47
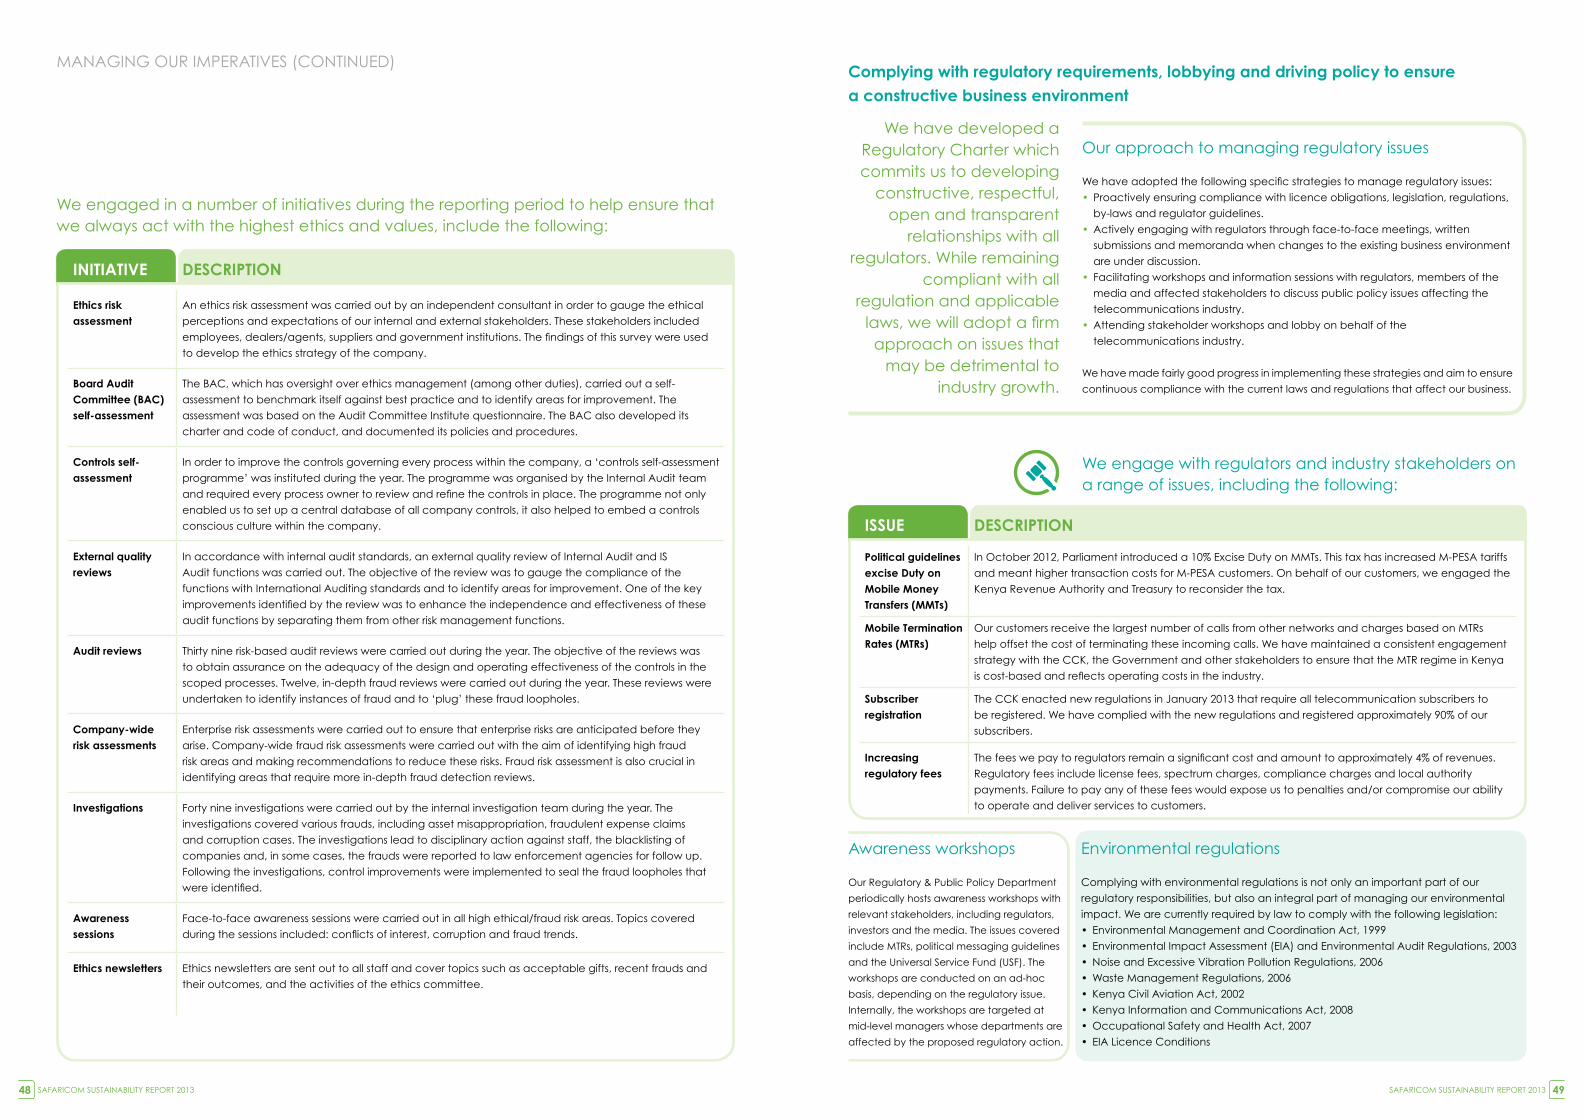
INItIatIVe desCRIptION
ethics risk assessment
An ethics risk assessment was carried out by an independent consultant in order to gauge the ethical
perceptions and expectations of our internal and external stakeholders. These stakeholders included
employees, dealers/agents, suppliers and government institutions. The findings of this survey were used
to develop the ethics strategy of the company.
board audit Committee (baC) self-assessment
The BAC, which has oversight over ethics management (among other duties), carried out a self-
assessment to benchmark itself against best practice and to identify areas for improvement. The
assessment was based on the Audit Committee Institute questionnaire. The BAC also developed its
charter and code of conduct, and documented its policies and procedures.
Controls self-assessment
In order to improve the controls governing every process within the company, a ‘controls self-assessment
programme’ was instituted during the year. The programme was organised by the Internal Audit team
and required every process owner to review and refine the controls in place. The programme not only
enabled us to set up a central database of all company controls, it also helped to embed a controls
conscious culture within the company.
external quality reviews
In accordance with internal audit standards, an external quality review of Internal Audit and IS
Audit functions was carried out. The objective of the review was to gauge the compliance of the
functions with International Auditing standards and to identify areas for improvement. One of the key
improvements identified by the review was to enhance the independence and effectiveness of these
audit functions by separating them from other risk management functions.
audit reviews Thirty nine risk-based audit reviews were carried out during the year. The objective of the reviews was
to obtain assurance on the adequacy of the design and operating effectiveness of the controls in the
scoped processes. Twelve, in-depth fraud reviews were carried out during the year. These reviews were
undertaken to identify instances of fraud and to ‘plug’ these fraud loopholes.
Company-wide risk assessments
Enterprise risk assessments were carried out to ensure that enterprise risks are anticipated before they
arise. Company-wide fraud risk assessments were carried out with the aim of identifying high fraud
risk areas and making recommendations to reduce these risks. Fraud risk assessment is also crucial in
identifying areas that require more in-depth fraud detection reviews.
Investigations Forty nine investigations were carried out by the internal investigation team during the year. The
investigations covered various frauds, including asset misappropriation, fraudulent expense claims
and corruption cases. The investigations lead to disciplinary action against staff, the blacklisting of
companies and, in some cases, the frauds were reported to law enforcement agencies for follow up.
Following the investigations, control improvements were implemented to seal the fraud loopholes that
were identified.
awareness sessions
Face-to-face awareness sessions were carried out in all high ethical/fraud risk areas. Topics covered
during the sessions included: conflicts of interest, corruption and fraud trends.
ethics newsletters Ethics newsletters are sent out to all staff and cover topics such as acceptable gifts, recent frauds and
their outcomes, and the activities of the ethics committee.
We engaged in a number of initiatives during the reporting period to help ensure that we always act with the highest ethics and values, include the following:
We have developed a Regulatory Charter which commits us to developing
constructive, respectful, open and transparent
relationships with all regulators. While remaining
compliant with all regulation and applicable
laws, we will adopt a firm approach on issues that
may be detrimental to industry growth.
Awareness workshops
Our Regulatory & Public Policy department
periodically hosts awareness workshops with
relevant stakeholders, including regulators,
investors and the media. The issues covered
include MTRs, political messaging guidelines
and the Universal Service Fund (USF). The
workshops are conducted on an ad-hoc
basis, depending on the regulatory issue.
Internally, the workshops are targeted at
mid-level managers whose departments are
affected by the proposed regulatory action.
Environmental regulations
Complying with environmental regulations is not only an important part of our
regulatory responsibilities, but also an integral part of managing our environmental
impact. We are currently required by law to comply with the following legislation:
• Environmental Management and Coordination Act, 1999
• Environmental Impact Assessment (EIA) and Environmental Audit Regulations, 2003
• Noise and Excessive Vibration Pollution Regulations, 2006
• Waste Management Regulations, 2006
• Kenya Civil Aviation Act, 2002
• Kenya Information and Communications Act, 2008
• Occupational Safety and Health Act, 2007
• EIA Licence Conditions
Complying with regulatory requirements, lobbying and driving policy to ensure a constructive business environment
Our approach to managing regulatory issues
We have adopted the following specific strategies to manage regulatory issues:
• Proactively ensuring compliance with licence obligations, legislation, regulations,
by-laws and regulator guidelines.
• Actively engaging with regulators through face-to-face meetings, written
submissions and memoranda when changes to the existing business environment
are under discussion.
• Facilitating workshops and information sessions with regulators, members of the
media and affected stakeholders to discuss public policy issues affecting the
telecommunications industry.
• Attending stakeholder workshops and lobby on behalf of the
telecommunications industry.
We have made fairly good progress in implementing these strategies and aim to ensure
continuous compliance with the current laws and regulations that affect our business.
We engage with regulators and industry stakeholders on a range of issues, including the following:
Issue desCRIptION
political guidelines excise duty on Mobile Money transfers (MMts)
In October 2012, Parliament introduced a 10% Excise duty on MMTs. This tax has increased M-PESA tariffs
and meant higher transaction costs for M-PESA customers. On behalf of our customers, we engaged the
Kenya Revenue Authority and Treasury to reconsider the tax.
Mobile termination Rates (MtRs)
Our customers receive the largest number of calls from other networks and charges based on MTRs
help offset the cost of terminating these incoming calls. We have maintained a consistent engagement
strategy with the CCK, the government and other stakeholders to ensure that the MTR regime in Kenya
is cost-based and reflects operating costs in the industry.
subscriber registration
The CCK enacted new regulations in January 2013 that require all telecommunication subscribers to
be registered. We have complied with the new regulations and registered approximately 90% of our
subscribers.
Increasing regulatory fees
The fees we pay to regulators remain a significant cost and amount to approximately 4% of revenues.
Regulatory fees include license fees, spectrum charges, compliance charges and local authority
payments. Failure to pay any of these fees would expose us to penalties and/or compromise our ability
to operate and deliver services to customers.
MANAgINg OUR IMPERATIvES (CONTINUEd)
SAFARICOM SUSTAINABILITY REPORT 201348 SAFARICOM SUSTAINABILITY REPORT 2013 49
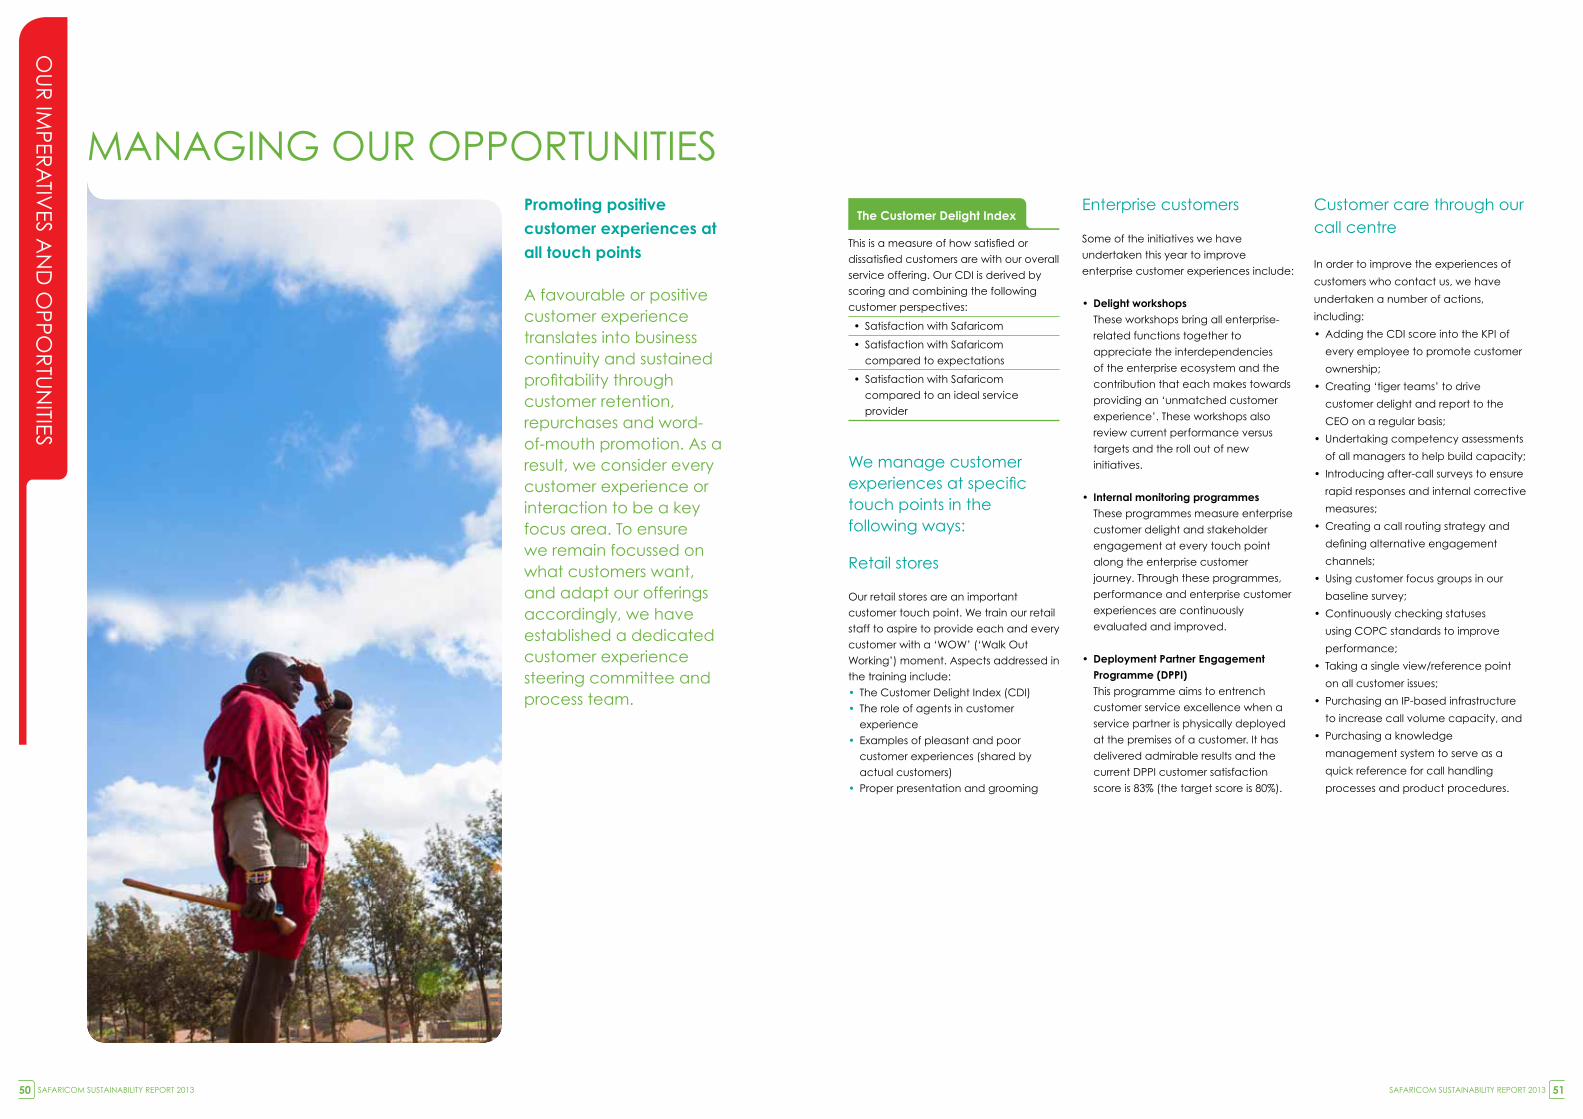
OU
R IM
PERA
TIvES A
Nd
OPPO
RTU
NITIES
We manage customer experiences at specific touch points in the following ways:
Retail stores
Our retail stores are an important
customer touch point. We train our retail
staff to aspire to provide each and every
customer with a ‘WOW’ (‘Walk Out
Working’) moment. Aspects addressed in
the training include:
• The Customer delight Index (CdI)
• The role of agents in customer
experience
• Examples of pleasant and poor
customer experiences (shared by
actual customers)
• Proper presentation and grooming
Enterprise customers
Some of the initiatives we have
undertaken this year to improve
enterprise customer experiences include:
• Delight workshops
These workshops bring all enterprise-
related functions together to
appreciate the interdependencies
of the enterprise ecosystem and the
contribution that each makes towards
providing an ‘unmatched customer
experience’. These workshops also
review current performance versus
targets and the roll out of new
initiatives.
• Internal monitoring programmes
These programmes measure enterprise
customer delight and stakeholder
engagement at every touch point
along the enterprise customer
journey. Through these programmes,
performance and enterprise customer
experiences are continuously
evaluated and improved.
• deployment partner engagement
programme (dppI)
This programme aims to entrench
customer service excellence when a
service partner is physically deployed
at the premises of a customer. It has
delivered admirable results and the
current dPPI customer satisfaction
score is 83% (the target score is 80%).
Customer care through our call centre
In order to improve the experiences of
customers who contact us, we have
undertaken a number of actions,
including:
• Adding the CDI score into the KPI of
every employee to promote customer
ownership;
• Creating ‘tiger teams’ to drive
customer delight and report to the
CEO on a regular basis;
• Undertaking competency assessments
of all managers to help build capacity;
• Introducing after-call surveys to ensure
rapid responses and internal corrective
measures;
• Creating a call routing strategy and
defining alternative engagement
channels;
• Using customer focus groups in our
baseline survey;
• Continuously checking statuses
using COPC standards to improve
performance;
• Taking a single view/reference point
on all customer issues;
• Purchasing an IP-based infrastructure
to increase call volume capacity, and
• Purchasing a knowledge
management system to serve as a
quick reference for call handling
processes and product procedures.
This is a measure of how satisfied or
dissatisfied customers are with our overall
service offering. Our CdI is derived by
scoring and combining the following
customer perspectives:
• Satisfaction with Safaricom
• Satisfaction with Safaricom
compared to expectations
• Satisfaction with Safaricom
compared to an ideal service
provider
the Customer delight Index promoting positive customer experiences at all touch points
A favourable or positive customer experience translates into business continuity and sustained profitability through customer retention, repurchases and word-of-mouth promotion. As a result, we consider every customer experience or interaction to be a key focus area. To ensure we remain focussed on what customers want, and adapt our offerings accordingly, we have established a dedicated customer experience steering committee and process team.
MANAgINg OUR OPPORTUNITIES
SAFARICOM SUSTAINABILITY REPORT 201350 SAFARICOM SUSTAINABILITY REPORT 2013 51
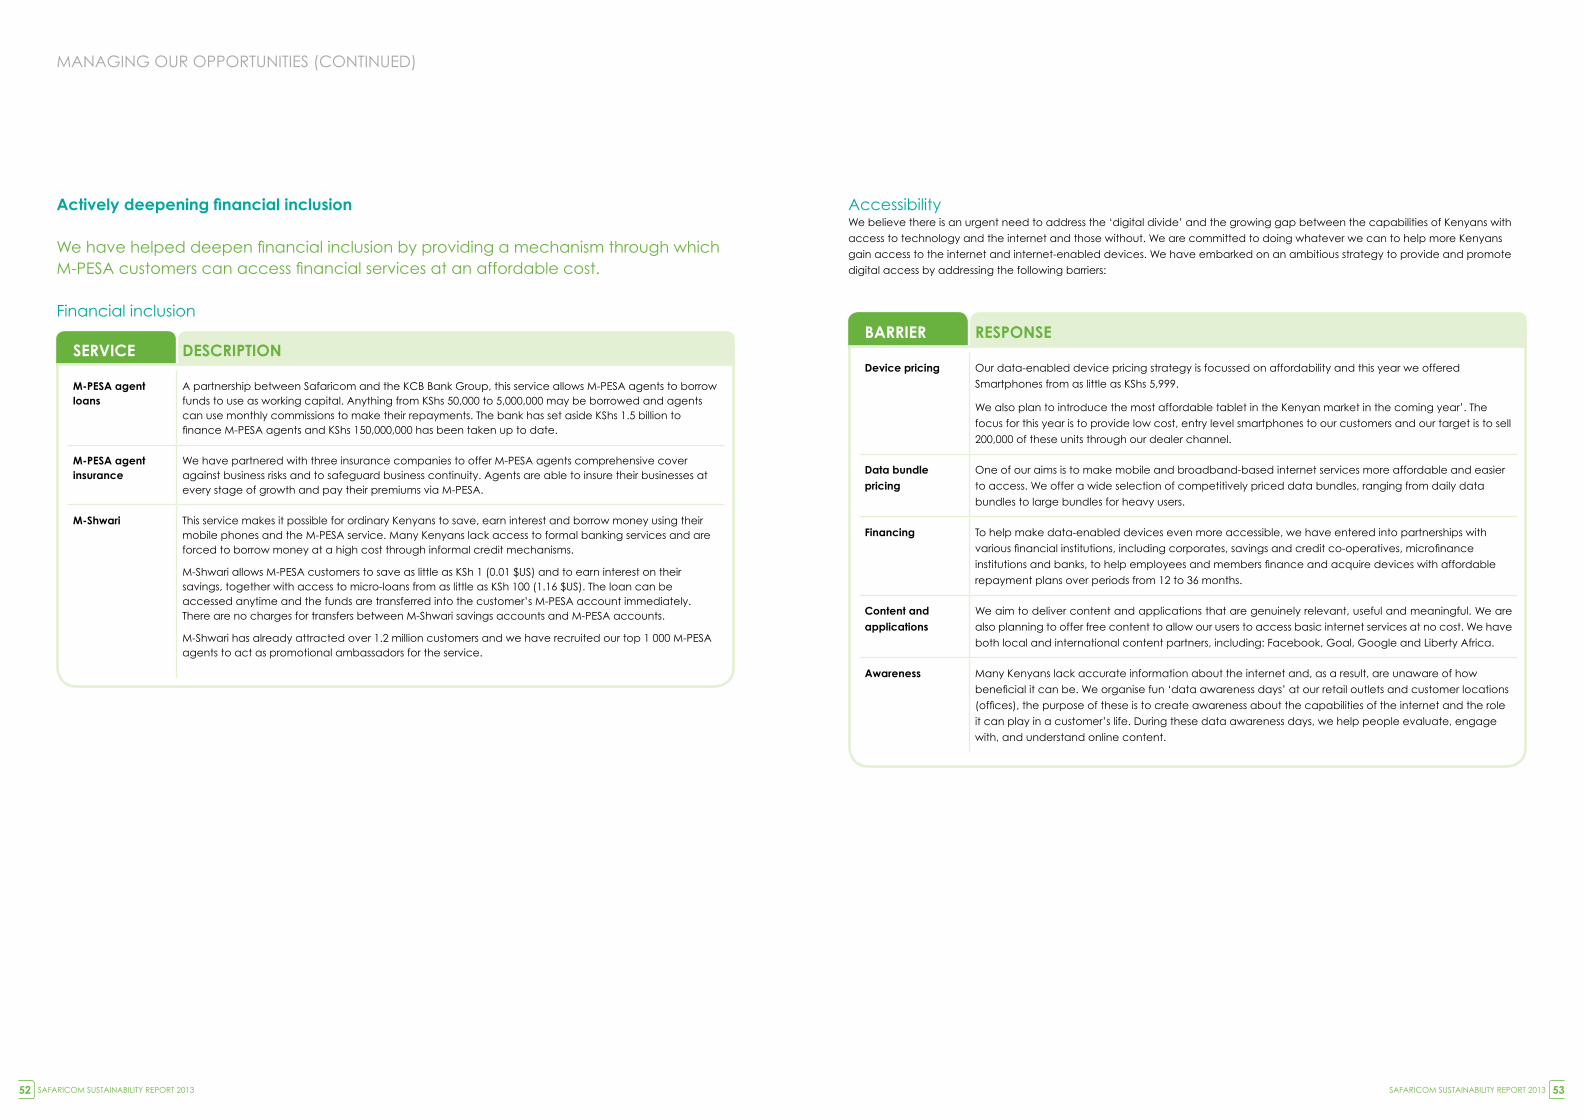
Actively deepening financial inclusion
We have helped deepen financial inclusion by providing a mechanism through which M-PESA customers can access financial services at an affordable cost.
Financial inclusion
AccessibilityWe believe there is an urgent need to address the ‘digital divide’ and the growing gap between the capabilities of Kenyans with
access to technology and the internet and those without. We are committed to doing whatever we can to help more Kenyans
gain access to the internet and internet-enabled devices. We have embarked on an ambitious strategy to provide and promote
digital access by addressing the following barriers:
seRVICe desCRIptION
M-pesa agent loans
A partnership between Safaricom and the KCB Bank group, this service allows M-PESA agents to borrow funds to use as working capital. Anything from KShs 50,000 to 5,000,000 may be borrowed and agents can use monthly commissions to make their repayments. The bank has set aside KShs 1.5 billion to finance M-PESA agents and KShs 150,000,000 has been taken up to date.
M-pesa agent insurance
We have partnered with three insurance companies to offer M-PESA agents comprehensive cover against business risks and to safeguard business continuity. Agents are able to insure their businesses at every stage of growth and pay their premiums via M-PESA.
M-shwari This service makes it possible for ordinary Kenyans to save, earn interest and borrow money using their mobile phones and the M-PESA service. Many Kenyans lack access to formal banking services and are forced to borrow money at a high cost through informal credit mechanisms.
M-Shwari allows M-PESA customers to save as little as KSh 1 (0.01 $US) and to earn interest on their savings, together with access to micro-loans from as little as KSh 100 (1.16 $US). The loan can be accessed anytime and the funds are transferred into the customer’s M-PESA account immediately. There are no charges for transfers between M-Shwari savings accounts and M-PESA accounts.
M-Shwari has already attracted over 1.2 million customers and we have recruited our top 1 000 M-PESA agents to act as promotional ambassadors for the service.
baRRIeR RespONse
device pricing Our data-enabled device pricing strategy is focussed on affordability and this year we offered
Smartphones from as little as KShs 5,999.
We also plan to introduce the most affordable tablet in the Kenyan market in the coming year’. The
focus for this year is to provide low cost, entry level smartphones to our customers and our target is to sell
200,000 of these units through our dealer channel.
data bundle pricing
One of our aims is to make mobile and broadband-based internet services more affordable and easier
to access. We offer a wide selection of competitively priced data bundles, ranging from daily data
bundles to large bundles for heavy users.
Financing To help make data-enabled devices even more accessible, we have entered into partnerships with
various financial institutions, including corporates, savings and credit co-operatives, microfinance
institutions and banks, to help employees and members finance and acquire devices with affordable
repayment plans over periods from 12 to 36 months.
Content and applications
We aim to deliver content and applications that are genuinely relevant, useful and meaningful. We are
also planning to offer free content to allow our users to access basic internet services at no cost. We have
both local and international content partners, including: Facebook, goal, google and Liberty Africa.
awareness Many Kenyans lack accurate information about the internet and, as a result, are unaware of how
beneficial it can be. We organise fun ‘data awareness days’ at our retail outlets and customer locations
(offices), the purpose of these is to create awareness about the capabilities of the internet and the role
it can play in a customer’s life. during these data awareness days, we help people evaluate, engage
with, and understand online content.
MANAgINg OUR OPPORTUNITIES (CONTINUEd)
SAFARICOM SUSTAINABILITY REPORT 201352 SAFARICOM SUSTAINABILITY REPORT 2013 53
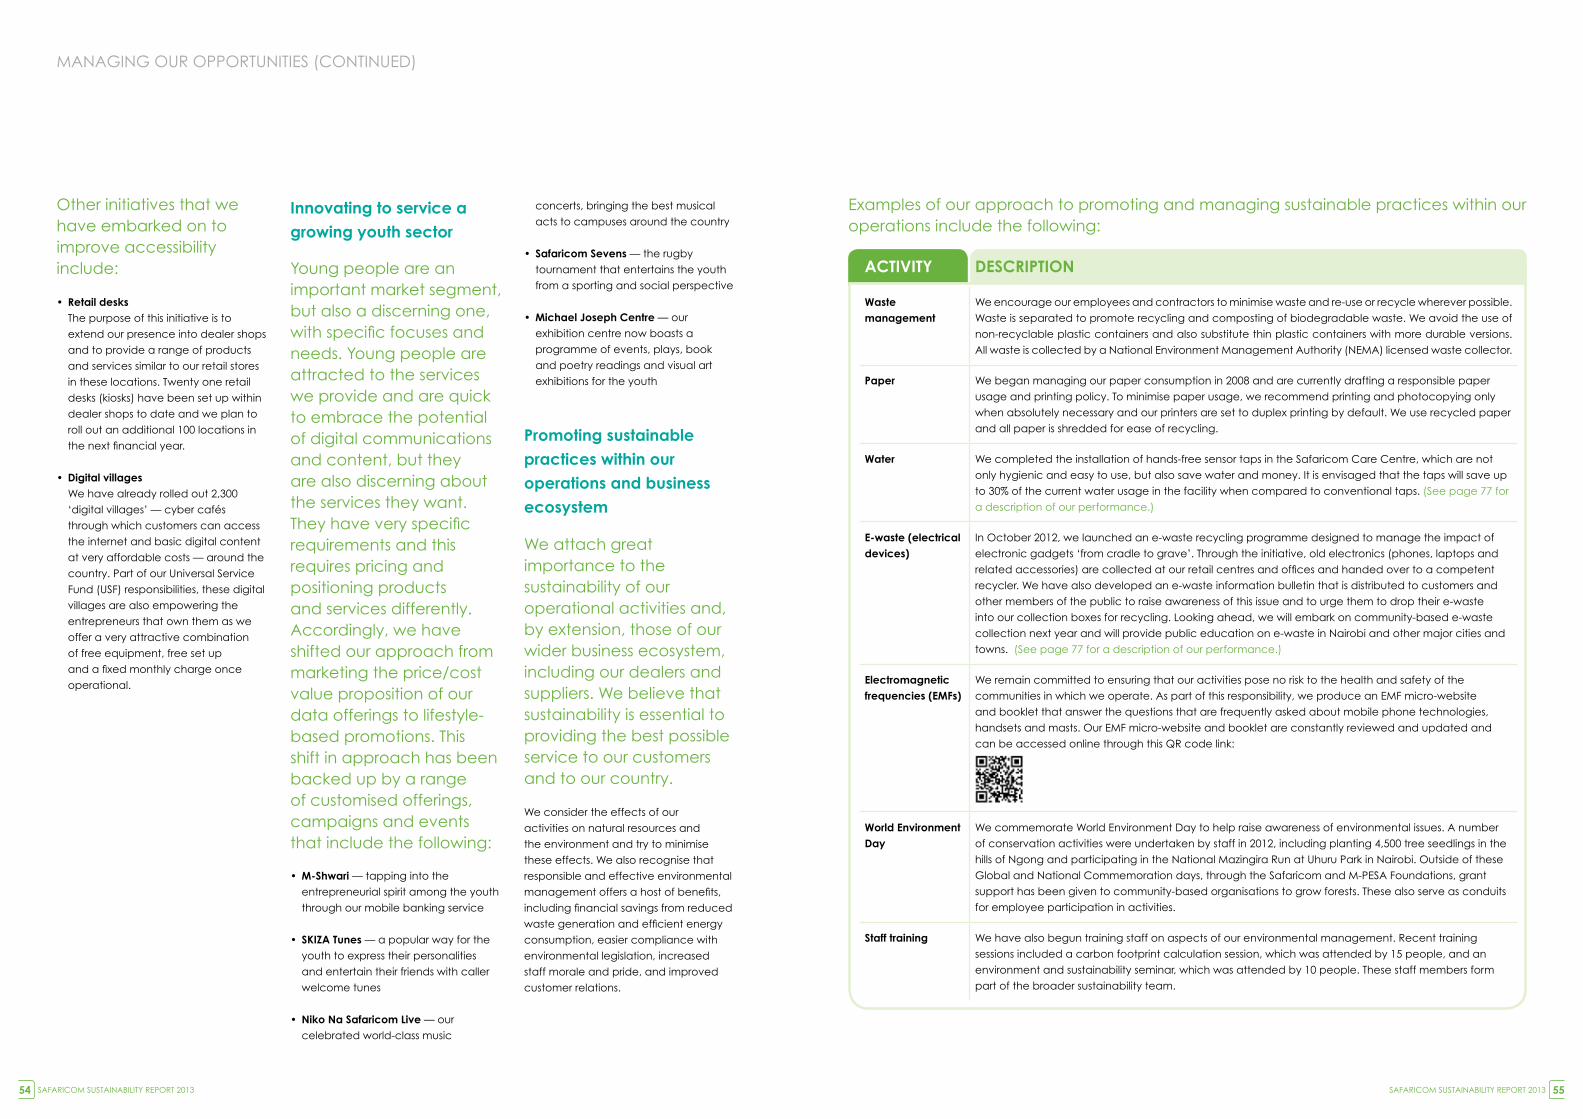
Other initiatives that we have embarked on to improve accessibility include:
• Retail desksThe purpose of this initiative is to
extend our presence into dealer shops
and to provide a range of products
and services similar to our retail stores
in these locations. Twenty one retail
desks (kiosks) have been set up within
dealer shops to date and we plan to
roll out an additional 100 locations in
the next financial year.
• Digital villagesWe have already rolled out 2,300
‘digital villages’ — cyber cafés
through which customers can access
the internet and basic digital content
at very affordable costs — around the
country. Part of our Universal Service
Fund (USF) responsibilities, these digital
villages are also empowering the
entrepreneurs that own them as we
offer a very attractive combination
of free equipment, free set up
and a fixed monthly charge once
operational.
Innovating to service a growing youth sector
Young people are an important market segment, but also a discerning one, with specific focuses and needs. Young people are attracted to the services we provide and are quick to embrace the potential of digital communications and content, but they are also discerning about the services they want. They have very specific requirements and this requires pricing and positioning products and services differently. Accordingly, we have shifted our approach from marketing the price/cost value proposition of our data offerings to lifestyle-based promotions. This shift in approach has been backed up by a range of customised offerings, campaigns and events that include the following:
• M-shwari — tapping into the
entrepreneurial spirit among the youth
through our mobile banking service
• sKIZa tunes — a popular way for the
youth to express their personalities
and entertain their friends with caller
welcome tunes
• Niko Na safaricom live — our
celebrated world-class music
concerts, bringing the best musical
acts to campuses around the country
• safaricom sevens — the rugby
tournament that entertains the youth
from a sporting and social perspective
• Michael Joseph Centre — our
exhibition centre now boasts a
programme of events, plays, book
and poetry readings and visual art
exhibitions for the youth
promoting sustainable practices within our operations and business ecosystem
We attach great importance to the sustainability of our operational activities and, by extension, those of our wider business ecosystem, including our dealers and suppliers. We believe that sustainability is essential to providing the best possible service to our customers and to our country.
We consider the effects of our
activities on natural resources and
the environment and try to minimise
these effects. We also recognise that
responsible and effective environmental
management offers a host of benefits,
including financial savings from reduced
waste generation and efficient energy
consumption, easier compliance with
environmental legislation, increased
staff morale and pride, and improved
customer relations.
Examples of our approach to promoting and managing sustainable practices within our operations include the following:
aCtIVIty desCRIptION
Waste management
We encourage our employees and contractors to minimise waste and re-use or recycle wherever possible.
Waste is separated to promote recycling and composting of biodegradable waste. We avoid the use of
non-recyclable plastic containers and also substitute thin plastic containers with more durable versions.
All waste is collected by a National Environment Management Authority (NEMA) licensed waste collector.
paper We began managing our paper consumption in 2008 and are currently drafting a responsible paper
usage and printing policy. To minimise paper usage, we recommend printing and photocopying only
when absolutely necessary and our printers are set to duplex printing by default. We use recycled paper
and all paper is shredded for ease of recycling.
Water We completed the installation of hands-free sensor taps in the Safaricom Care Centre, which are not
only hygienic and easy to use, but also save water and money. It is envisaged that the taps will save up
to 30% of the current water usage in the facility when compared to conventional taps. (See page 77 for
a description of our performance.)
e-waste (electrical devices)
In October 2012, we launched an e-waste recycling programme designed to manage the impact of
electronic gadgets ‘from cradle to grave’. Through the initiative, old electronics (phones, laptops and
related accessories) are collected at our retail centres and offices and handed over to a competent
recycler. We have also developed an e-waste information bulletin that is distributed to customers and
other members of the public to raise awareness of this issue and to urge them to drop their e-waste
into our collection boxes for recycling. Looking ahead, we will embark on community-based e-waste
collection next year and will provide public education on e-waste in Nairobi and other major cities and
towns. (See page 77 for a description of our performance.)
electromagnetic frequencies (eMFs)
We remain committed to ensuring that our activities pose no risk to the health and safety of the
communities in which we operate. As part of this responsibility, we produce an EMF micro-website
and booklet that answer the questions that are frequently asked about mobile phone technologies,
handsets and masts. Our EMF micro-website and booklet are constantly reviewed and updated and
can be accessed online through this QR code link:
World environment day
We commemorate World Environment day to help raise awareness of environmental issues. A number
of conservation activities were undertaken by staff in 2012, including planting 4,500 tree seedlings in the
hills of Ngong and participating in the National Mazingira Run at Uhuru Park in Nairobi. Outside of these
global and National Commemoration days, through the Safaricom and M-PESA Foundations, grant
support has been given to community-based organisations to grow forests. These also serve as conduits
for employee participation in activities.
staff training We have also begun training staff on aspects of our environmental management. Recent training
sessions included a carbon footprint calculation session, which was attended by 15 people, and an
environment and sustainability seminar, which was attended by 10 people. These staff members form
part of the broader sustainability team.
MANAgINg OUR OPPORTUNITIES (CONTINUEd)
SAFARICOM SUSTAINABILITY REPORT 201354 SAFARICOM SUSTAINABILITY REPORT 2013 55
Examples of our approach to promoting and managing sustainable practices within our wider business ecosystem include the following:
busINess paRtNeR
appROaCh
dealers dealers are important business partners as they account for almost 70% of airtime sales and represent our brand in the market. As a result, we maintain close working relationships with our dealers and expect them to share our business principles and ethical standards.
We use a combination of explicit business partner policies and dealer management procedures to manage every process from new dealer recruitment to ordering and delivery, performance monitoring and contract termination.
There are a number of sustainable business practices that dealers must have in place to become part of our network, including business plans, bank statements, managed premises, trained staff, as well as other technical and legal requirements.
We also assign each dealer a dedicated manager who will engage with them on performance, new market opportunities and financing through regular meetings, training sessions and annual contract renewals. We also recognise and reward strong performers through our ‘dealer of the Year’ awards.
suppliers Suppliers are key business partners who provide the goods and/or services that enable us to operate. In order to manage supplier performance, we implement the following:
• Supplier qualificationAll suppliers are pre-qualified and requalified regularly to ensure they are financial reliable and have all of the required accreditations and licences. We also ensure that they are fully compliant from a legal, insurance and regulatory perspective. Lastly, we also check that they have the required management policies in place, including OSH, customer service, staff integrity, environmental and CSR policies.
• Supplier performance evaluationsAll suppliers undergo quarterly or bi-annual performance evaluations and are measured against the following indicators: cost of service; on time delivery of service; flexibility to respond to unexpected Safaricom demands; quality of service; general responsiveness; customer support; value addition; documentation and invoicing, and communication skills. A performance score is calculated with a performance target of 80% and suppliers whose performance is below the performance threshold are placed on performance improvement plans.
• Supplier sustainability self-assessmentsSuppliers are required to complete a sustainability self-assessment that evaluates their performance in the following areas: fraud and ethics; human resources, health and safety, the environment, community and corporate giving, and regulatory compliance. We work with our suppliers to ensure that at all times we are supporting business that uphold the highest standards of integrity and ethical practices when it comes to employee rights. We aim to encourage fair employment practices that comply with current labour regulations and are supportive of a diverse and inclusive workforce, non discriminatory and afford freedom of association. The self-assessments will be followed by selected on-site verification exercises. For more information on the results of the supplier sustainability self-assessments, please refer to Section 7, page 79.
• Supplier safety management programmeSeveral initiatives have been taken around supplier safety management including: the development of an OSH in Supply Chain Management Standard to embed safety assurance processes in supply chain operations; two supplier safety conferences, and site safety inductions and awareness sessions prior to project commencement.
• Supplier training on OSHOSH training is being conducted with high risk suppliers who also have to identify OSH gaps in their operations and devise plans to close these gaps within specified timelines.
MANAgINg OUR OPPORTUNITIES (CONTINUEd)
Rolling out alternative energy solutions, ensuring energy security for our future growth
We are committed to employing alternative energy solutions wherever possible, to streamline our energy footprint and to reduce our reliance on fossil fuel energy. We are constantly investigating new energy technologies and processes and some of our recent initiatives include:
Renewable energy sites
Fourteen 100% solar-powered, diet
sites are already operational and
further solar power will be added to
power cube sites to reduce generator
run hours.
• Hybrid solar solution for facilities
We are also looking for renewable
energy solutions that we can use
in our facilities and have recently
installed a hybrid solar power solution
in the Safaricom gym to reduce
consumption of grid electricity.
• Staff training
As part of our ongoing focus on
alternative energy solutions, more
than 20 staff members have been
trained on solar and biofuels
technologies, as well as on energy-
efficient lighting and motors.
• M-KOPA Solar
M-KOPA Solar is a gSM-controlled
domestic solar power system.
designed to help low-income
households in rural areas liberate
themselves from kerosene lighting
and having to rely on local mobile
bureaus to charge their phones, the
system uses solar power to provide 3
light bulbs and a charger. Customers
pay an initial deposit of KShs 2,500
and daily instalments of KShs 40 for the
first 12 months (via M-PESA). Currently,
15,377 households are benefiting from
this innovative solution.
going forward, we will be tracking
our energy consumption per unit of
telecommunications traffic (Erlang). This
will allow us to benchmark ourselves
against other telecommunications
companies accurately. We will also be
undertaking remote energy monitoring
at our sites to improve efficiencies and
reduce downtime.
SAFARICOM SUSTAINABILITY REPORT 201356 SAFARICOM SUSTAINABILITY REPORT 2013 57
We engage with regulators and industry stakeholders on a range of issues, including the following:
aCtIVIty desCRIptION
universal service Fund (usF)
The USF was created to support the roll out of telecommunication services to underserved areas where
operators may not be investing. Through the CCK, government has set operator contribution levels at
0.5% of gross turnover.
We share the concerns of other operators regarding the USF (its governance structure, regulatory
framework and the lack of representation for contributors to the fund), but continue to fulfil our USF
obligations while lobbying the CCK and other industry stakeholders on these issues. We have rolled out
2,300 ‘digital villages’ (cyber cafés in remote rural villages) in various parts of Kenya.
political messaging guidelines
Cognisant of the post election violence in 2008, we decided that no bulk political messages containing
discriminatory, partisan or hate speech content would be transmitted through our network during the
general elections. We also engaged with the CCK, the National Cohesion and Integration Commission
and the Independent Electoral and Boundaries Commission to develop clear national guidelines for the
transmission of such messages. The new guidelines were launched in October 2012.
Counterfeit handsets
The CCK issued a directive to all mobile operators to switch off counterfeit handsets by 30 September
2012. Together with other mobile operators and handset manufacturers, we have engaged the CCK in
order to ensure a coordinated approach to the phase out of these handsets. We continue to comply
with this directive and have switched off approximately 700,000 counterfeit phones to date.
promoting ethical business and good corporate governance
We view ethical business practices and good corporate governance as non-negotiable and continue to promote these principles in the following ways:
aCtIVIty desCRIptION
Kenya association of Manufacturers (KaM) CeO breakfast on ethics and Corruption
We recognise that we are part of a wider business ecosystem and need to partner with other businesses
in promoting business ethics. With this in mind, we facilitated a CEO breakfast with the Kenya Association
of Manufacturers (KAM) that was attended by 30 CEOs. The breakfast focused on the role of private
business in fighting corruption and the CEOs confirmed the commitment of their organisations.
united Nations global Compact (uNgC)
The UNgC is a strategic policy initiative that encourages corporate responsibility and support for the
UN Millennium development goals (Mdgs). The UNgC encourages businesses to align their operations
and strategies to 10 ethical principles in the areas of human rights, labour, anti-corruption and the
environment. We are signatories to the Compact and our CEO, Bob Collymore, is a member of the
global Board of the UNgC.
sisi ni amani We partnered with the community-based peace organisation Sisi ni Amani during the build up to the
general elections. At the time, the aim of the organisation was to try and minimise election-related
violence through targeted, localised SMS messages. Members of the public could also use the platform
to report incidents of violence within their communities free of charge. We donated 50 million free SMS
messages to the initiative.
MANAgINg OUR OPPORTUNITIES (CONTINUEd)
lobbying and driving policy to ensure a constructive business environment
We operate within an increasingly complex regulatory environment. As a result, we consider public policy lobbying an important task and a vital way of ensuring that the operating environment for the provision of telecommunications services in Kenya remains constructive.
As well as proactively ensuring that we comply with all licence obligations, relevant legislation, regulations, by-laws and regulator
guidelines, we actively engage with regulators through face-to-face meetings, written submissions and memoranda when changes
to the existing business environment are under discussion. We attend stakeholder workshops to lobby on behalf of the industry
and facilitate our own workshops with regulators, members of the media and affected stakeholders to discuss public policy issues
affecting the telecommunications industry.
SAFARICOM SUSTAINABILITY REPORT 201358 SAFARICOM SUSTAINABILITY REPORT 2013 59
TRA
NSFO
RM
INg
LIvES
OUR STAKEHOLdERS6
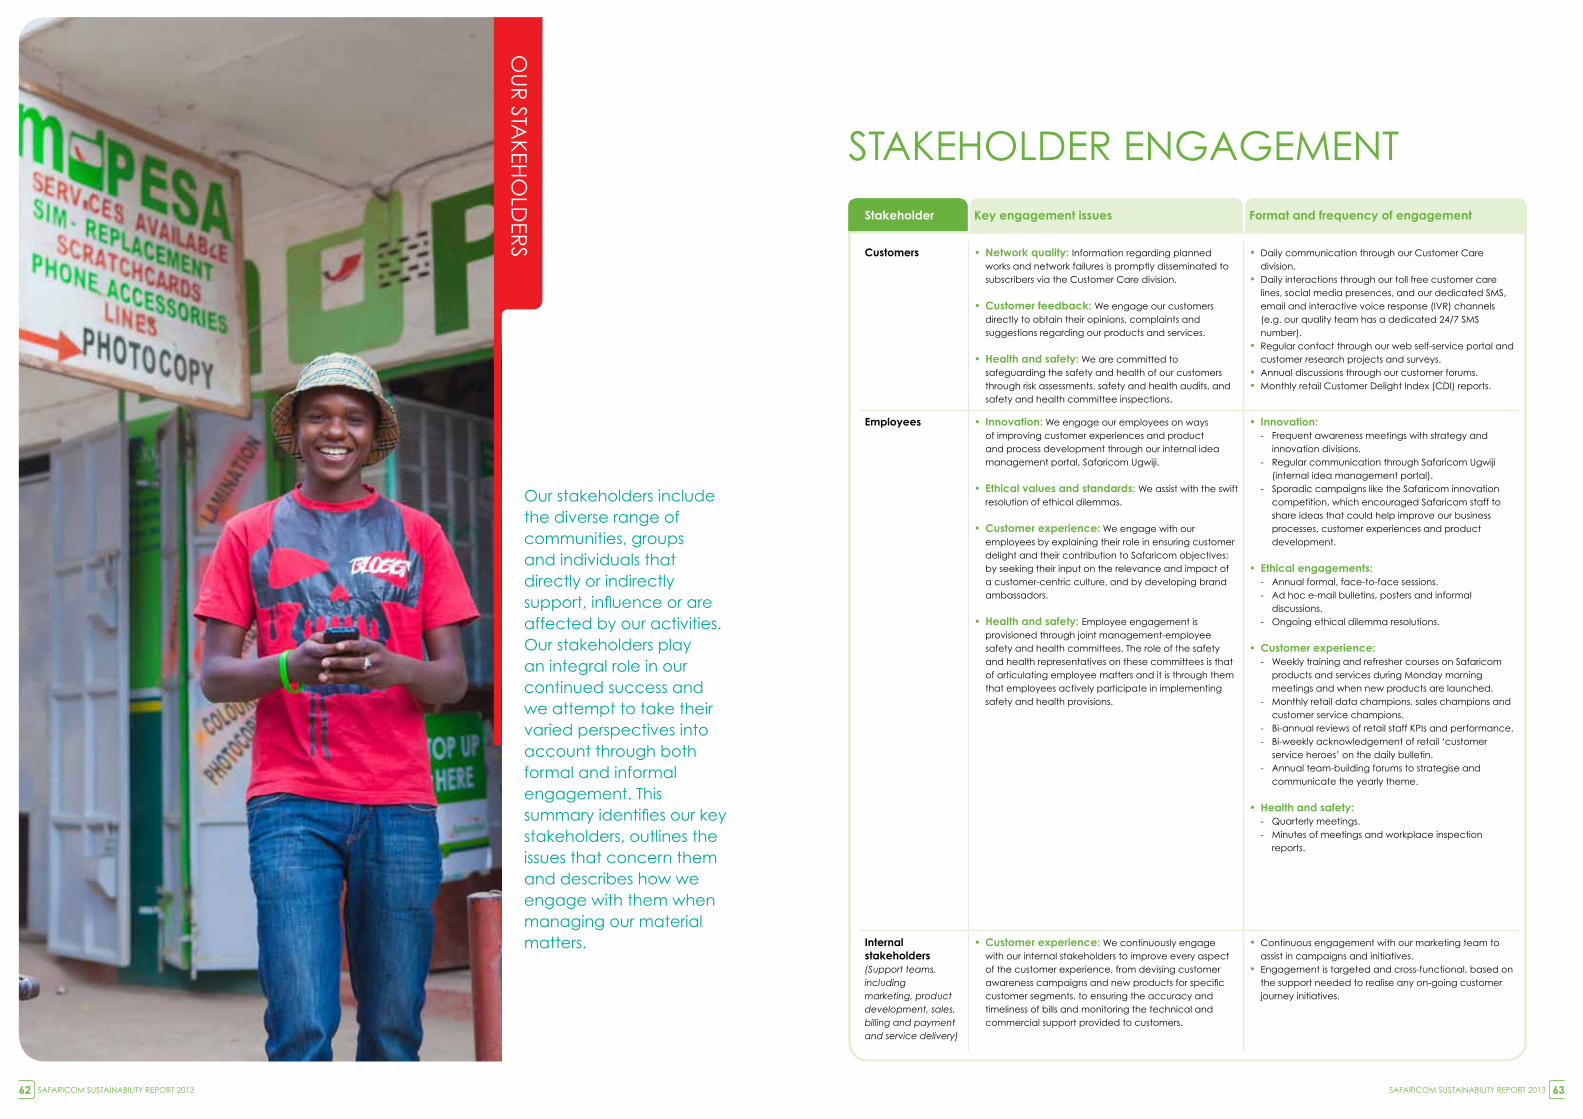
stakeholder Key engagement issues Format and frequency of engagement
Customers • Network quality: Information regarding planned works and network failures is promptly disseminated to subscribers via the Customer Care division.
• Customer feedback: We engage our customers directly to obtain their opinions, complaints and suggestions regarding our products and services.
• Health and safety: We are committed to safeguarding the safety and health of our customers through risk assessments, safety and health audits, and safety and health committee inspections.
• daily communication through our Customer Care division.
• daily interactions through our toll free customer care lines, social media presences, and our dedicated SMS, email and interactive voice response (IvR) channels (e.g. our quality team has a dedicated 24/7 SMS number).
• Regular contact through our web self-service portal and customer research projects and surveys.
• Annual discussions through our customer forums.• Monthly retail Customer delight Index (CdI) reports.
employees • Innovation: We engage our employees on ways of improving customer experiences and product and process development through our internal idea management portal, Safaricom Ugwiji.
• Ethical values and standards: We assist with the swift resolution of ethical dilemmas.
• Customer experience: We engage with our employees by explaining their role in ensuring customer delight and their contribution to Safaricom objectives; by seeking their input on the relevance and impact of a customer-centric culture, and by developing brand ambassadors.
• Health and safety: Employee engagement is provisioned through joint management-employee safety and health committees. The role of the safety and health representatives on these committees is that of articulating employee matters and it is through them that employees actively participate in implementing safety and health provisions.
• Innovation:- Frequent awareness meetings with strategy and
innovation divisions.- Regular communication through Safaricom Ugwiji
(internal idea management portal).- Sporadic campaigns like the Safaricom innovation
competition, which encouraged Safaricom staff to share ideas that could help improve our business processes, customer experiences and product development.
• Ethical engagements:- Annual formal, face-to-face sessions.- Ad hoc e-mail bulletins, posters and informal
discussions.- Ongoing ethical dilemma resolutions.
• Customer experience:- Weekly training and refresher courses on Safaricom
products and services during Monday morning meetings and when new products are launched.
- Monthly retail data champions, sales champions and customer service champions.
- Bi-annual reviews of retail staff KPIs and performance.- Bi-weekly acknowledgement of retail ‘customer
service heroes’ on the daily bulletin.- Annual team-building forums to strategise and
communicate the yearly theme.
• Health and safety:- Quarterly meetings.- Minutes of meetings and workplace inspection
reports.
Internal stakeholders(Support teams, including marketing, product development, sales, billing and payment and service delivery)
• Customer experience: We continuously engage with our internal stakeholders to improve every aspect of the customer experience, from devising customer awareness campaigns and new products for specific customer segments, to ensuring the accuracy and timeliness of bills and monitoring the technical and commercial support provided to customers.
• Continuous engagement with our marketing team to assist in campaigns and initiatives.
• Engagement is targeted and cross-functional, based on the support needed to realise any on-going customer journey initiatives.
Our stakeholders include the diverse range of communities, groups and individuals that directly or indirectly support, influence or are affected by our activities. Our stakeholders play an integral role in our continued success and we attempt to take their varied perspectives into account through both formal and informal engagement. This summary identifies our key stakeholders, outlines the issues that concern them and describes how we engage with them when managing our material matters.
OU
R STA
KEHO
LdER
S
STAKEHOLdER ENgAgEMENT
SAFARICOM SUSTAINABILITY REPORT 201362 SAFARICOM SUSTAINABILITY REPORT 2013 63
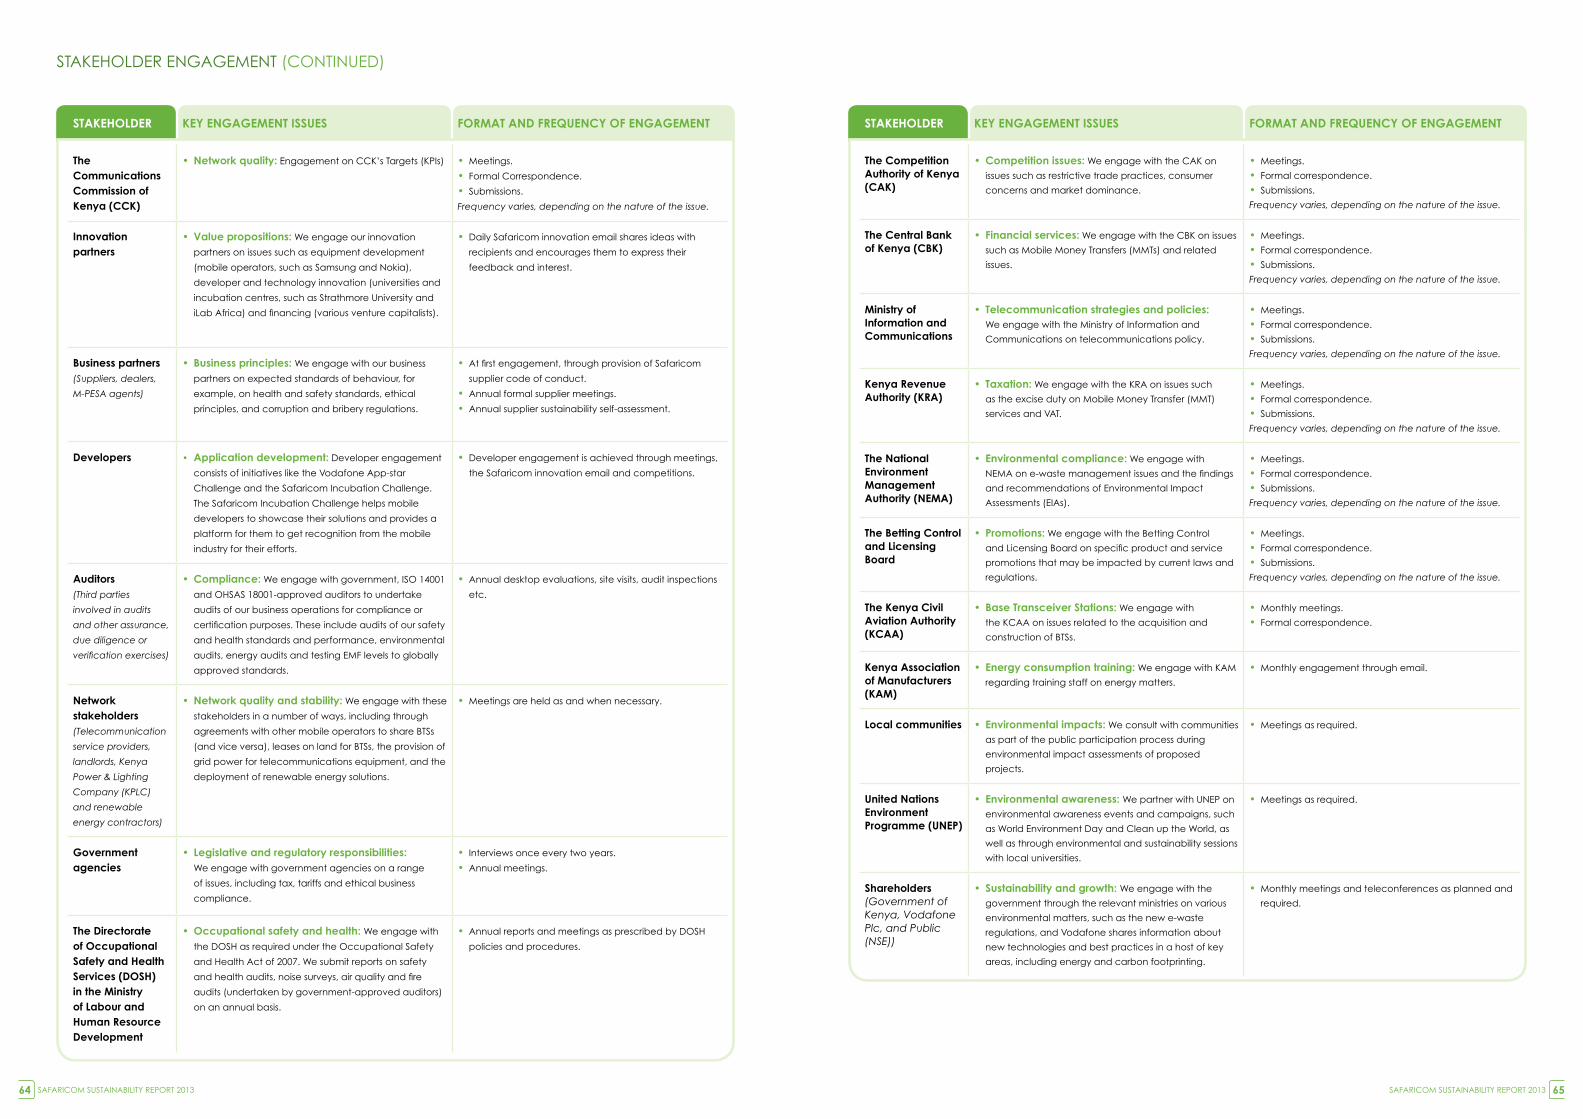
STAKEHOLdER ENgAgEMENT (CONTINUEd)
staKehOldeR Key eNgageMeNt Issues FORMat aNd FRequeNCy OF eNgageMeNt
the Competition authority of Kenya (CaK)
• Competition issues: We engage with the CAK on
issues such as restrictive trade practices, consumer
concerns and market dominance.
• Meetings.
• Formal correspondence.
• Submissions.
Frequency varies, depending on the nature of the issue.
the Central bank of Kenya (CbK)
• Financial services: We engage with the CBK on issues
such as Mobile Money Transfers (MMTs) and related
issues.
• Meetings.
• Formal correspondence.
• Submissions.
Frequency varies, depending on the nature of the issue.
Ministry of Information and Communications
• Telecommunication strategies and policies: We engage with the Ministry of Information and
Communications on telecommunications policy.
• Meetings.
• Formal correspondence.
• Submissions.
Frequency varies, depending on the nature of the issue.
Kenya Revenue authority (KRa)
• Taxation: We engage with the KRA on issues such
as the excise duty on Mobile Money Transfer (MMT)
services and vAT.
• Meetings.
• Formal correspondence.
• Submissions.
Frequency varies, depending on the nature of the issue.
the National environment Management authority (NeMa)
• Environmental compliance: We engage with
NEMA on e-waste management issues and the findings
and recommendations of Environmental Impact
Assessments (EIAs).
• Meetings.
• Formal correspondence.
• Submissions.
Frequency varies, depending on the nature of the issue.
the betting Control and licensing board
• Promotions: We engage with the Betting Control
and Licensing Board on specific product and service
promotions that may be impacted by current laws and
regulations.
• Meetings.
• Formal correspondence.
• Submissions.
Frequency varies, depending on the nature of the issue.
the Kenya Civil aviation authority (KCaa)
• Base Transceiver Stations: We engage with
the KCAA on issues related to the acquisition and
construction of BTSs.
• Monthly meetings.
• Formal correspondence.
Kenya association of Manufacturers (KaM)
• Energy consumption training: We engage with KAM
regarding training staff on energy matters.
• Monthly engagement through email.
local communities • Environmental impacts: We consult with communities
as part of the public participation process during
environmental impact assessments of proposed
projects.
• Meetings as required.
united Nations environment programme (uNep)
• Environmental awareness: We partner with UNEP on
environmental awareness events and campaigns, such
as World Environment day and Clean up the World, as
well as through environmental and sustainability sessions
with local universities.
• Meetings as required.
shareholders(Government of Kenya, Vodafone Plc, and Public (NSE))
• Sustainability and growth: We engage with the
government through the relevant ministries on various
environmental matters, such as the new e-waste
regulations, and vodafone shares information about
new technologies and best practices in a host of key
areas, including energy and carbon footprinting.
• Monthly meetings and teleconferences as planned and
required.
staKehOldeR Key eNgageMeNt Issues FORMat aNd FRequeNCy OF eNgageMeNt
the Communications Commission of Kenya (CCK)
• Network quality: Engagement on CCK’s Targets (KPIs) • Meetings.
• Formal Correspondence.
• Submissions.
Frequency varies, depending on the nature of the issue.
Innovation partners
• Value propositions: We engage our innovation
partners on issues such as equipment development
(mobile operators, such as Samsung and Nokia),
developer and technology innovation (universities and
incubation centres, such as Strathmore University and
iLab Africa) and financing (various venture capitalists).
• daily Safaricom innovation email shares ideas with
recipients and encourages them to express their
feedback and interest.
business partners(Suppliers, dealers,
M-PESA agents)
• Business principles: We engage with our business
partners on expected standards of behaviour, for
example, on health and safety standards, ethical
principles, and corruption and bribery regulations.
• At first engagement, through provision of Safaricom
supplier code of conduct.
• Annual formal supplier meetings.
• Annual supplier sustainability self-assessment.
developers • application development: developer engagement
consists of initiatives like the vodafone App-star
Challenge and the Safaricom Incubation Challenge.
The Safaricom Incubation Challenge helps mobile
developers to showcase their solutions and provides a
platform for them to get recognition from the mobile
industry for their efforts.
• developer engagement is achieved through meetings,
the Safaricom innovation email and competitions.
auditors(Third parties
involved in audits
and other assurance,
due diligence or
verification exercises)
• Compliance: We engage with government, ISO 14001
and OHSAS 18001-approved auditors to undertake
audits of our business operations for compliance or
certification purposes. These include audits of our safety
and health standards and performance, environmental
audits, energy audits and testing EMF levels to globally
approved standards.
• Annual desktop evaluations, site visits, audit inspections
etc.
Network stakeholders(Telecommunication
service providers,
landlords, Kenya
Power & Lighting
Company (KPLC)
and renewable
energy contractors)
• Network quality and stability: We engage with these
stakeholders in a number of ways, including through
agreements with other mobile operators to share BTSs
(and vice versa), leases on land for BTSs, the provision of
grid power for telecommunications equipment, and the
deployment of renewable energy solutions.
• Meetings are held as and when necessary.
government agencies
• Legislative and regulatory responsibilities:We engage with government agencies on a range
of issues, including tax, tariffs and ethical business
compliance.
• Interviews once every two years.
• Annual meetings.
the directorate of Occupational safety and health services (dOsh) in the Ministry of labour and human Resource development
• Occupational safety and health: We engage with
the DOSH as required under the Occupational Safety
and Health Act of 2007. We submit reports on safety
and health audits, noise surveys, air quality and fire
audits (undertaken by government-approved auditors)
on an annual basis.
• Annual reports and meetings as prescribed by dOSH
policies and procedures.
SAFARICOM SUSTAINABILITY REPORT 201364 SAFARICOM SUSTAINABILITY REPORT 2013 65
TRA
NSFO
RM
INg
LIvES
OUR PERFORMANCE7
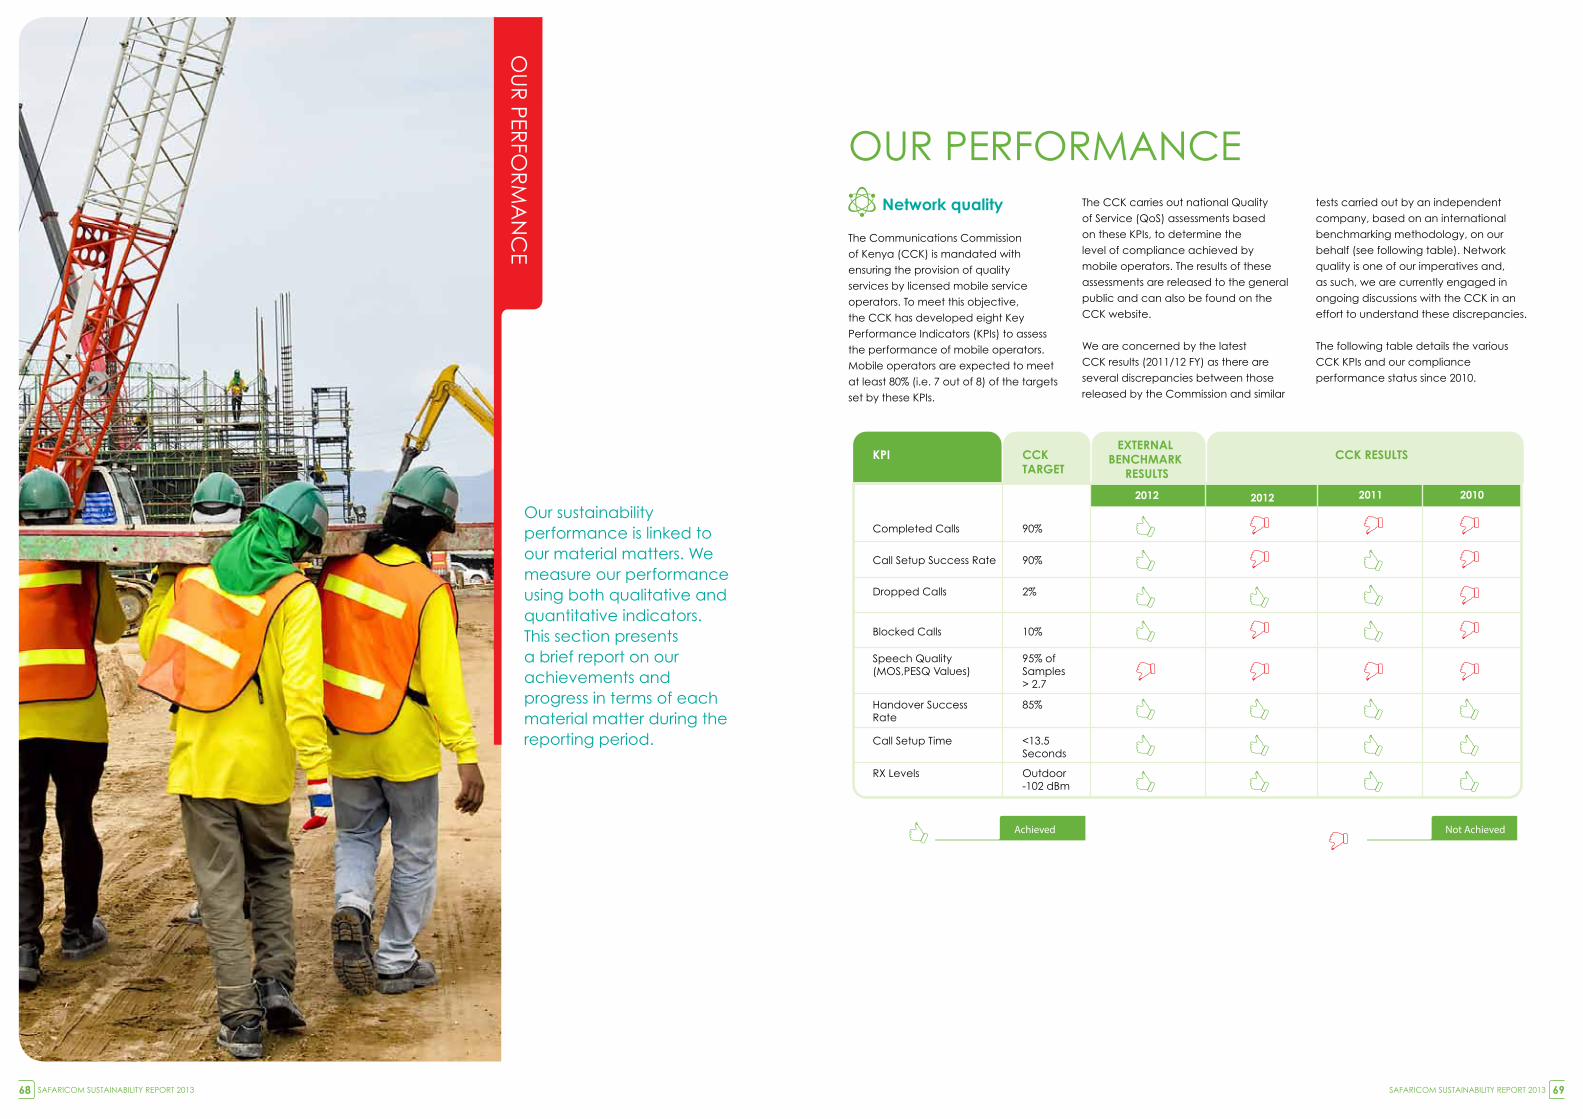
KPI
90%
90%
2%
Completed Calls
10%Blocked Calls
85%Handover SuccessRate
<13.5Seconds
Call Setup Time
Outdoor-102 dBm
RX Levels
95% ofSamples> 2.7
Speech Quality(MOS,PESQ Values)
Dropped Calls
Call Setup Success Rate
CCK RESULTSCCKTARGET
2012
EXTERNAL BENCHMARK
RESULTS
201020112012
Achieved Not Achieved
Our sustainability performance is linked to our material matters. We measure our performance using both qualitative and quantitative indicators. This section presents a brief report on our achievements and progress in terms of each material matter during the reporting period.
Network quality
The Communications Commission
of Kenya (CCK) is mandated with
ensuring the provision of quality
services by licensed mobile service
operators. To meet this objective,
the CCK has developed eight Key
Performance Indicators (KPIs) to assess
the performance of mobile operators.
Mobile operators are expected to meet
at least 80% (i.e. 7 out of 8) of the targets
set by these KPIs.
The CCK carries out national Quality
of Service (QoS) assessments based
on these KPIs, to determine the
level of compliance achieved by
mobile operators. The results of these
assessments are released to the general
public and can also be found on the
CCK website.
We are concerned by the latest
CCK results (2011/12 FY) as there are
several discrepancies between those
released by the Commission and similar
tests carried out by an independent
company, based on an international
benchmarking methodology, on our
behalf (see following table). Network
quality is one of our imperatives and,
as such, we are currently engaged in
ongoing discussions with the CCK in an
effort to understand these discrepancies.
The following table details the various
CCK KPIs and our compliance
performance status since 2010.
OU
R PER
FOR
MA
NC
E
OUR PERFORMANCE
SAFARICOM SUSTAINABILITY REPORT 201368 SAFARICOM SUSTAINABILITY REPORT 2013 69
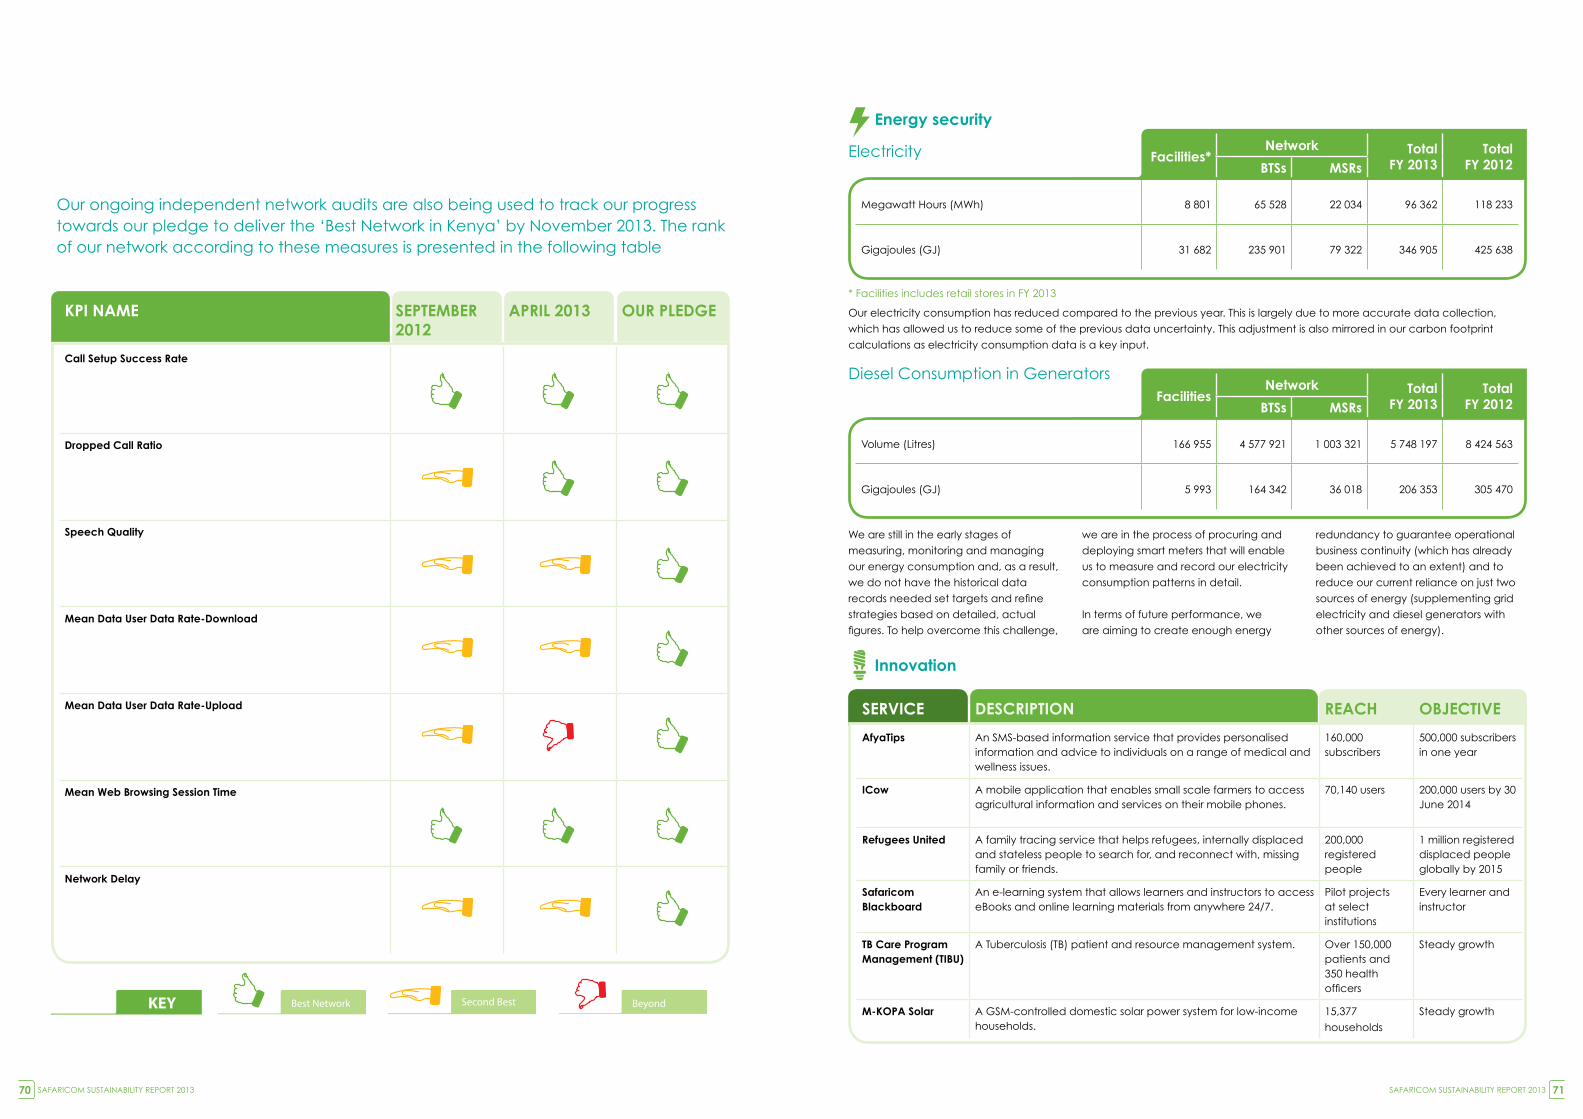
energy security
Electricity
we are in the process of procuring and
deploying smart meters that will enable
us to measure and record our electricity
consumption patterns in detail.
In terms of future performance, we
are aiming to create enough energy
redundancy to guarantee operational
business continuity (which has already
been achieved to an extent) and to
reduce our current reliance on just two
sources of energy (supplementing grid
electricity and diesel generators with
other sources of energy).
Our ongoing independent network audits are also being used to track our progress towards our pledge to deliver the ‘Best Network in Kenya’ by November 2013. The rank of our network according to these measures is presented in the following table
Facilities*Network total
Fy 2013total
Fy 2012btss MsRs
Megawatt Hours (MWh) 8 801
65 528
22 034
96 362
118 233
gigajoules (gj)
31 682
235 901
79 322
346 905
425 638
* Facilities includes retail stores in FY 2013
Our electricity consumption has reduced compared to the previous year. This is largely due to more accurate data collection,
which has allowed us to reduce some of the previous data uncertainty. This adjustment is also mirrored in our carbon footprint
calculations as electricity consumption data is a key input.
FacilitiesNetwork total
Fy 2013total
Fy 2012btss MsRs
volume (Litres)
166 955
4 577 921 1 003 321 5 748 197 8 424 563
gigajoules (gj)
5 993
164 342 36 018 206 353 305 470
diesel Consumption in generators
seRVICe desCRIptION ReaCh ObJeCtIVe
afyatips An SMS-based information service that provides personalised information and advice to individuals on a range of medical and wellness issues.
160,000 subscribers
500,000 subscribers in one year
ICow A mobile application that enables small scale farmers to access agricultural information and services on their mobile phones.
70,140 users 200,000 users by 30 june 2014
Refugees united A family tracing service that helps refugees, internally displaced and stateless people to search for, and reconnect with, missing family or friends.
200,000 registered people
1 million registered displaced people globally by 2015
safaricom blackboard
An e-learning system that allows learners and instructors to access eBooks and online learning materials from anywhere 24/7.
Pilot projects at select institutions
Every learner and instructor
tb Care program Management (tIbu)
A Tuberculosis (TB) patient and resource management system. Over 150,000 patients and 350 health officers
Steady growth
M-KOpa solar A gSM-controlled domestic solar power system for low-income households.
15,377
households
Steady growth
Innovation
We are still in the early stages of
measuring, monitoring and managing
our energy consumption and, as a result,
we do not have the historical data
records needed set targets and refine
strategies based on detailed, actual
figures. To help overcome this challenge,
KpI NaMe septeMbeR 2012
apRIl 2013 OuR pledge
Call setup success Rate
dropped Call Ratio
speech quality
Mean data user data Rate-download
Mean data user data Rate-upload
Mean Web browsing session time
Network delay
KEY
Best Network
Second Best
Beyond
KEY
Best Network
Second Best
Beyond
KEY
Best Network
Second Best
Beyond
KEY
Best Network
Second Best
Beyond
SAFARICOM SUSTAINABILITY REPORT 201370 SAFARICOM SUSTAINABILITY REPORT 2013 71
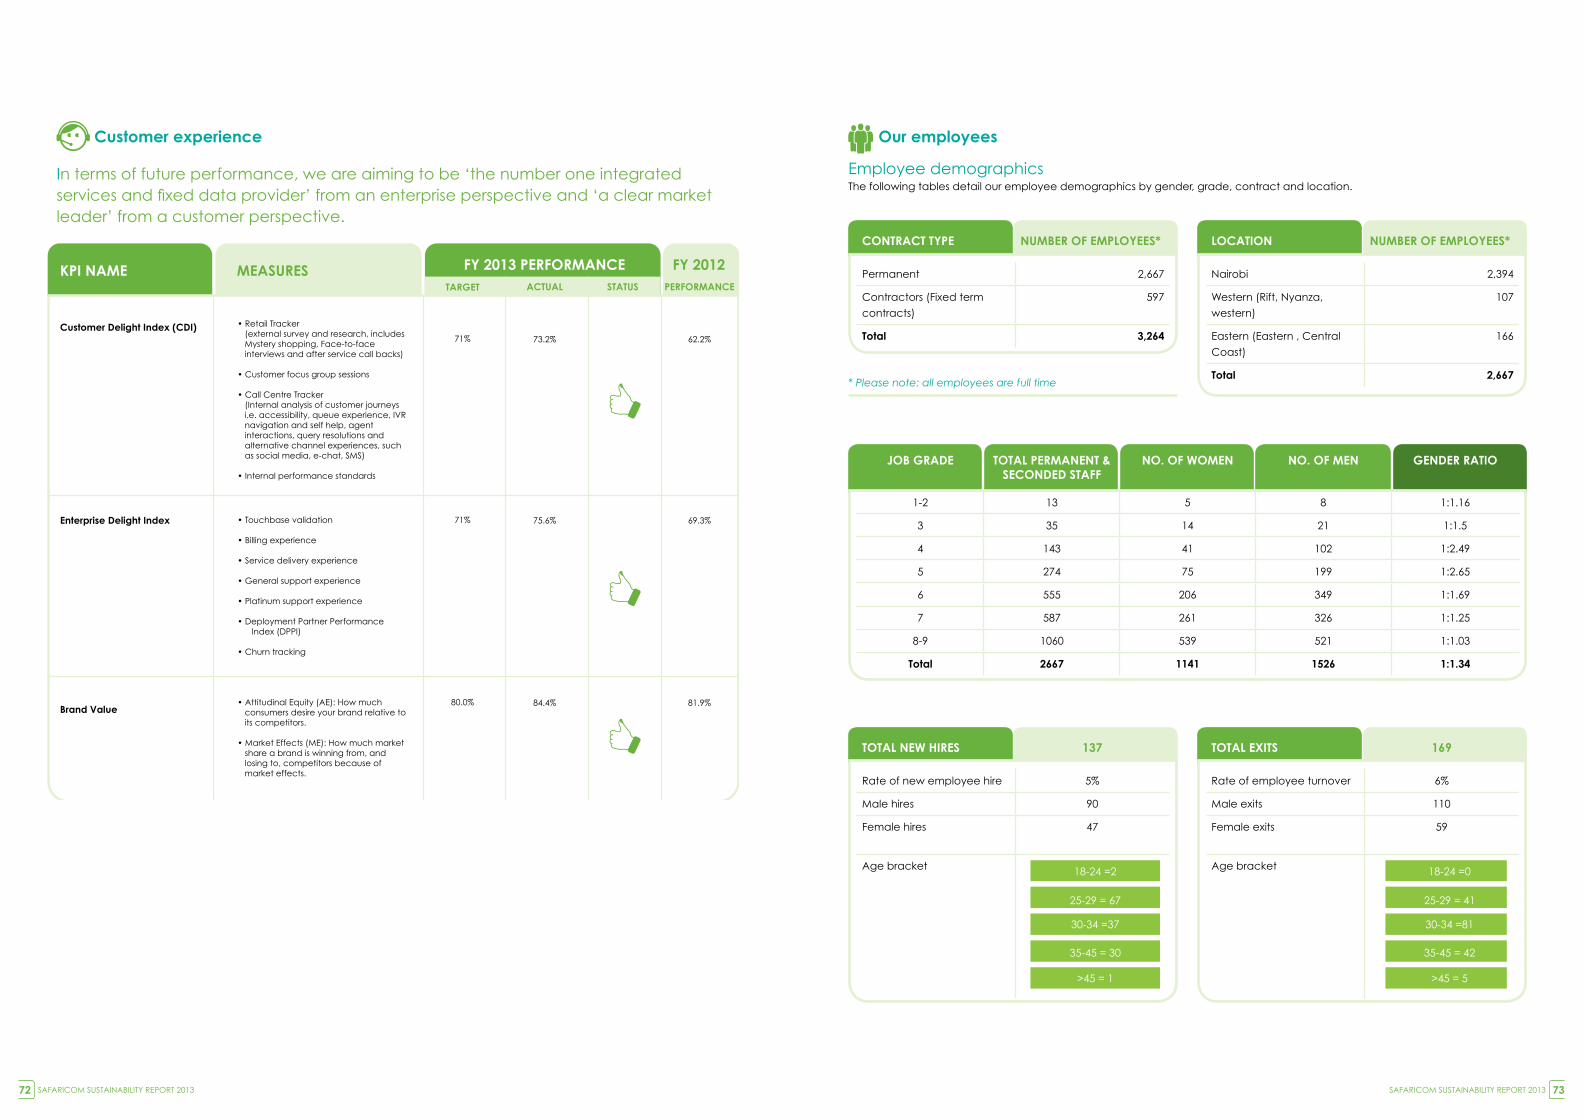
MEASURESKPI NAME TARGET ACTUAL STATUS PERFORMANCE
FY 2013 PERFORMANCE FY 2012
• Retail Tracker(external survey and research, includes Mystery shopping, Face-to-face interviews and after service call backs)
• Customer focus group sessions
• Call Centre Tracker(Internal analysis of customer journeys i.e. accessibility, queue experience, IVR navigation and self help, agent interactions, query resolutions and alternative channel experiences, suchas social media, e-chat, SMS)
• Internal performance standards
• Touchbase validation
• Billing experience
• Service delivery experience
• General support experience
• Platinum support experience
• Deployment Partner Performance Index (DPPI)
• Churn tracking
• Attitudinal Equity (AE): How much consumers desire your brand relative to its competitors.
• Market Effects (ME): How much market share a brand is winning from, and losing to, competitors because of market effects.
Customer Delight Index (CDI)
Enterprise Delight Index
Brand Value
71% 73.2% 62.2%
71% 75.6% 69.3%
81.9%80.0% 84.4%
Customer experience
In terms of future performance, we are aiming to be ‘the number one integrated services and fixed data provider’ from an enterprise perspective and ‘a clear market leader’ from a customer perspective.
Our employees
Employee demographicsThe following tables detail our employee demographics by gender, grade, contract and location.
* Please note: all employees are full time
CONtRaCt type NuMbeR OF eMplOyees*
Permanent 2,667
Contractors (Fixed term
contracts)
597
total 3,264
JOb gRade tOtal peRMaNeNt & seCONded staFF
NO. OF WOMeN NO. OF MeN geNdeR RatIO
1-2 13 5 8 1:1.16
3 35 14 21 1:1.5
4 143 41 102 1:2.49
5 274 75 199 1:2.65
6 555 206 349 1:1.69
7 587 261 326 1:1.25
8-9 1060 539 521 1:1.03
total 2667 1141 1526 1:1.34
lOCatION NuMbeR OF eMplOyees*
Nairobi 2,394
Western (Rift, Nyanza,
western)
107
Eastern (Eastern , Central
Coast)
166
total 2,667
tOtal NeW hIRes 137
Rate of new employee hire 5%
Male hires 90
Female hires 47
Age bracket
tOtal exIts 169
Rate of employee turnover 6%
Male exits 110
Female exits 59
Age bracket18-24 =2
25-29 = 67
30-34 =37
35-45 = 30
>45 = 1
18-24 =0
25-29 = 41
30-34 =81
35-45 = 42
>45 = 5
Total New Hires Total Exist
18-24 =2
25-29 = 67
30-34 =37
35-45 = 30
>45 = 1
18-24 =0
25-29 = 41
30-34 =81
35-45 = 42
>45 = 5
Total New Hires Total Exist
SAFARICOM SUSTAINABILITY REPORT 201372 SAFARICOM SUSTAINABILITY REPORT 2013 73
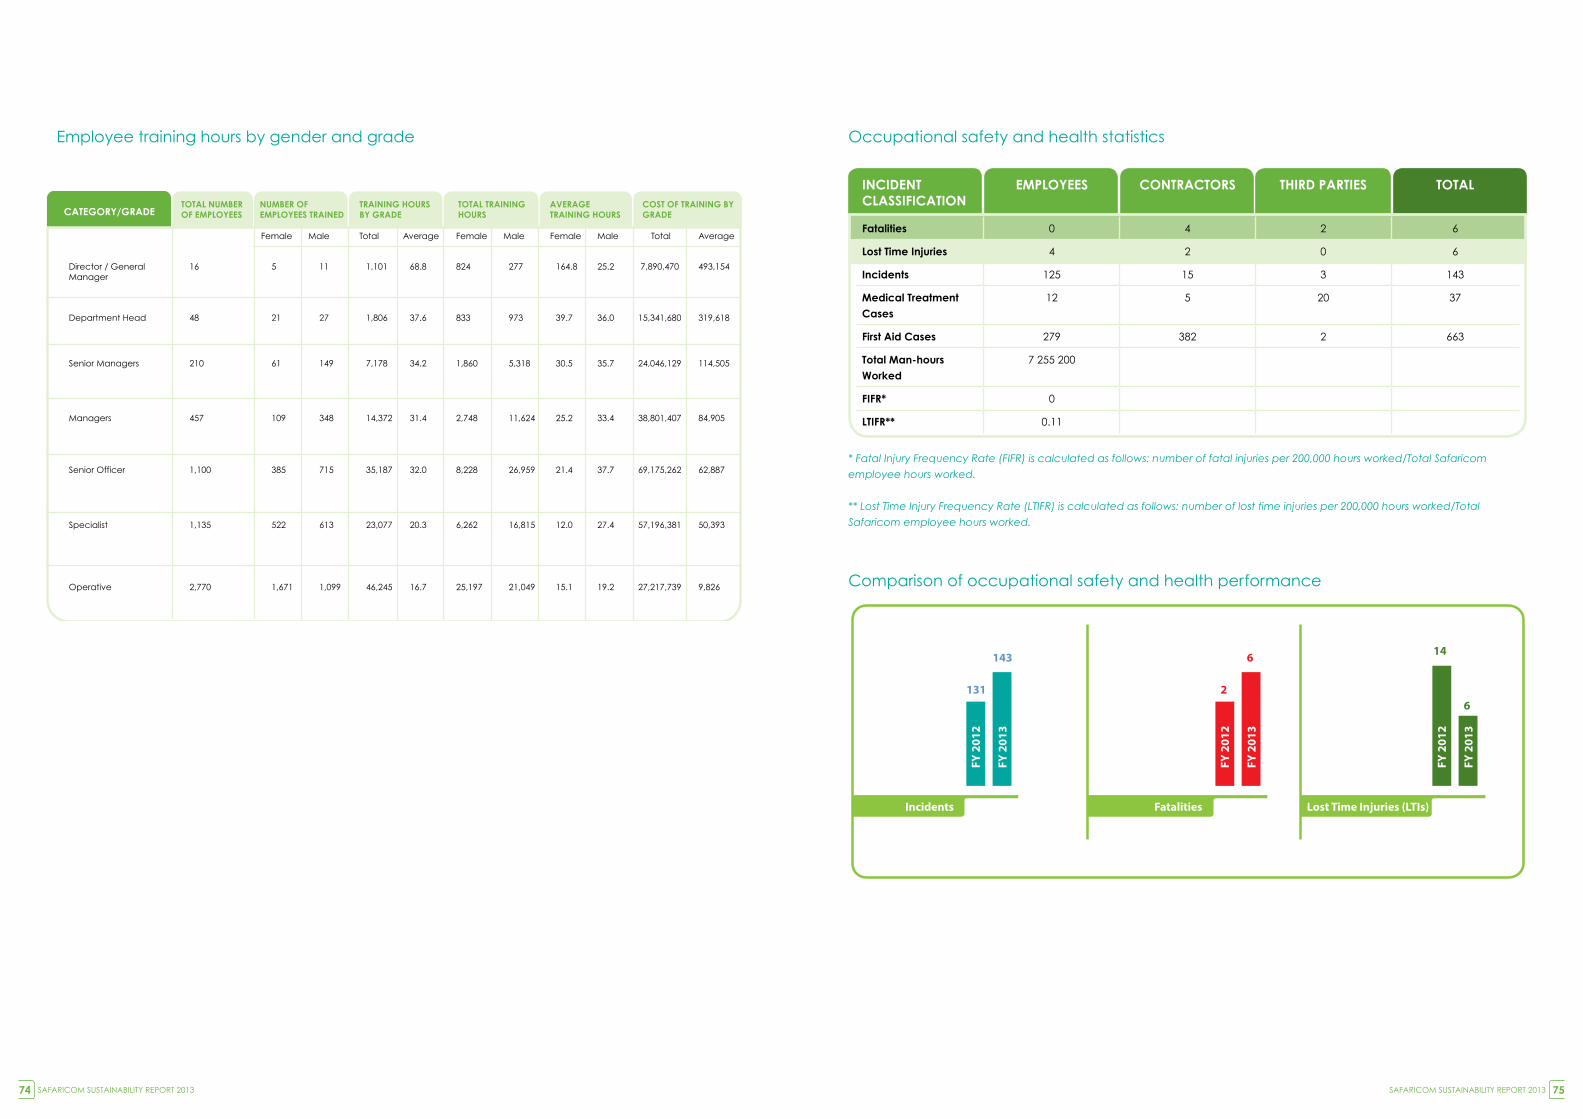
Occupational safety and health statistics
Comparison of occupational safety and health performance
* Fatal Injury Frequency Rate (FIFR) is calculated as follows: number of fatal injuries per 200,000 hours worked/Total Safaricom
employee hours worked.
** Lost Time Injury Frequency Rate (LTIFR) is calculated as follows: number of lost time injuries per 200,000 hours worked/Total
Safaricom employee hours worked.
Employee training hours by gender and grade
INCIdeNt ClassIFICatION
eMplOyees CONtRaCtORs thIRd paRtIes tOtal
Fatalities 0 4 2 6
lost time Injuries 4 2 0 6
Incidents 125 15 3 143
Medical treatment Cases
12 5 20 37
First aid Cases 279 382 2 663
total Man-hours Worked
7 255 200
FIFR* 0
ltIFR** 0.11
CATEGORY/GRADETOTAL NUMBEROF EMPLOYEES
Director / GeneralManager
16 5 11 1,101 68.8 824 277 164.8 25.2 7,890,470 493,154
NUMBER OFEMPLOYEES TRAINED
TRAINING HOURSBY GRADE
TOTAL TRAININGHOURS
AVERAGETRAINING HOURS
COST OF TRAINING BYGRADE
Department Head 48 21 27 1,806 37.6 833 973 39.7 36.0 15,341,680 319,618
Senior Managers 210 61 149 7,178 34.2 1,860 5,318 30.5 35.7 24,046,129 114,505
Managers 457 109 348 14,372 31.4 2,748 11,624 25.2 33.4 38,801,407 84,905
Senior Officer 1,100 385 715 35,187 32.0 8,228 26,959 21.4 37.7 69,175,262 62,887
Specialist 1,135 522 613 23,077 20.3 6,262 16,815 12.0 27.4 57,196,381 50,393
Operative 2,770 1,671 1,099 46,245 16.7 25,197 21,049 15.1 19.2 27,217,739 9,826
Female Male Female Male Female Male Total AverageTotal Average
Incidents
FY 2
012
131
143
FY 2
013
Fatalities
FY 2
012
2
6
FY 2
013
Lost Time Injuries (LTIs)
FY 2
012
14
6
FY 2
013
Comparison of occupational safety and health performance
SAFARICOM SUSTAINABILITY REPORT 201374 SAFARICOM SUSTAINABILITY REPORT 2013 75
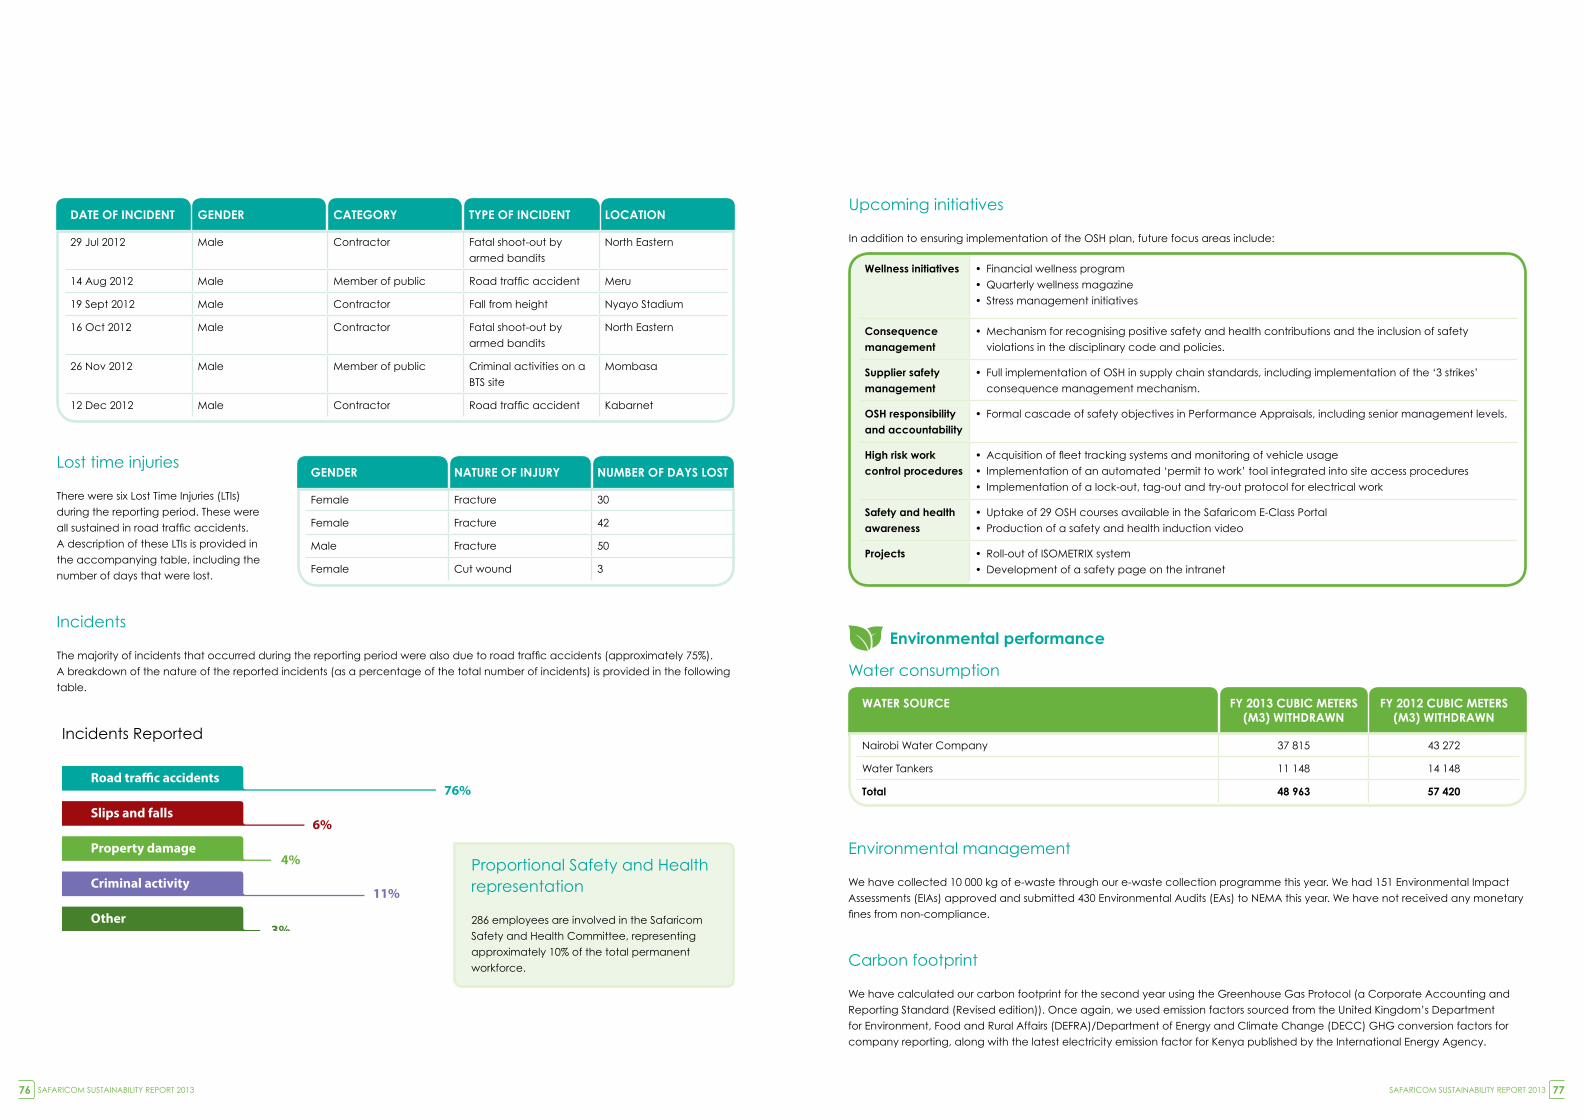
geNdeR NatuRe OF INJuRy NuMbeR OF days lOst
Female Fracture 30
Female Fracture 42
Male Fracture 50
Female Cut wound 3
date OF INCIdeNt geNdeR CategORy type OF INCIdeNt lOCatION
29 jul 2012 Male Contractor Fatal shoot-out by
armed bandits
North Eastern
14 Aug 2012 Male Member of public Road traffic accident Meru
19 Sept 2012 Male Contractor Fall from height Nyayo Stadium
16 Oct 2012 Male Contractor Fatal shoot-out by
armed bandits
North Eastern
26 Nov 2012 Male Member of public Criminal activities on a
BTS site
Mombasa
12 dec 2012 Male Contractor Road traffic accident Kabarnet
Lost time injuries
There were six Lost Time Injuries (LTIs)
during the reporting period. These were
all sustained in road traffic accidents.
A description of these LTIs is provided in
the accompanying table, including the
number of days that were lost.
Incidents
The majority of incidents that occurred during the reporting period were also due to road traffic accidents (approximately 75%).
A breakdown of the nature of the reported incidents (as a percentage of the total number of incidents) is provided in the following
table.
Proportional Safety and Health representation
286 employees are involved in the Safaricom
Safety and Health Committee, representing
approximately 10% of the total permanent
workforce.
Environmental management
We have collected 10 000 kg of e-waste through our e-waste collection programme this year. We had 151 Environmental Impact
Assessments (EIAs) approved and submitted 430 Environmental Audits (EAs) to NEMA this year. We have not received any monetary
fines from non-compliance.
Carbon footprint
We have calculated our carbon footprint for the second year using the greenhouse gas Protocol (a Corporate Accounting and
Reporting Standard (Revised edition)). Once again, we used emission factors sourced from the United Kingdom’s department
for Environment, Food and Rural Affairs (dEFRA)/department of Energy and Climate Change (dECC) gHg conversion factors for
company reporting, along with the latest electricity emission factor for Kenya published by the International Energy Agency.
Incidents Reported
Road tra�c accidents76%
6%
11%
4%
3%
Slips and falls
Property damage
Criminal activity
Other
Upcoming initiatives
In addition to ensuring implementation of the OSH plan, future focus areas include:
Wellness initiatives • Financial wellness program
• Quarterly wellness magazine
• Stress management initiatives
Consequence management
• Mechanism for recognising positive safety and health contributions and the inclusion of safety
violations in the disciplinary code and policies.
supplier safety management
• Full implementation of OSH in supply chain standards, including implementation of the ‘3 strikes’
consequence management mechanism.
Osh responsibility and accountability
• Formal cascade of safety objectives in Performance Appraisals, including senior management levels.
high risk work control procedures
• Acquisition of fleet tracking systems and monitoring of vehicle usage
• Implementation of an automated ‘permit to work’ tool integrated into site access procedures
• Implementation of a lock-out, tag-out and try-out protocol for electrical work
safety and health awareness
• Uptake of 29 OSH courses available in the Safaricom E-Class Portal
• Production of a safety and health induction video
projects • Roll-out of ISOMETRIX system
• Development of a safety page on the intranet
environmental performance
Water consumption
WateR sOuRCe Fy 2013 CubIC MeteRs (M3) WIthdRaWN
Fy 2012 CubIC MeteRs (M3) WIthdRaWN
Nairobi Water Company 37 815 43 272
Water Tankers 11 148 14 148
total 48 963 57 420
SAFARICOM SUSTAINABILITY REPORT 201376 SAFARICOM SUSTAINABILITY REPORT 2013 77
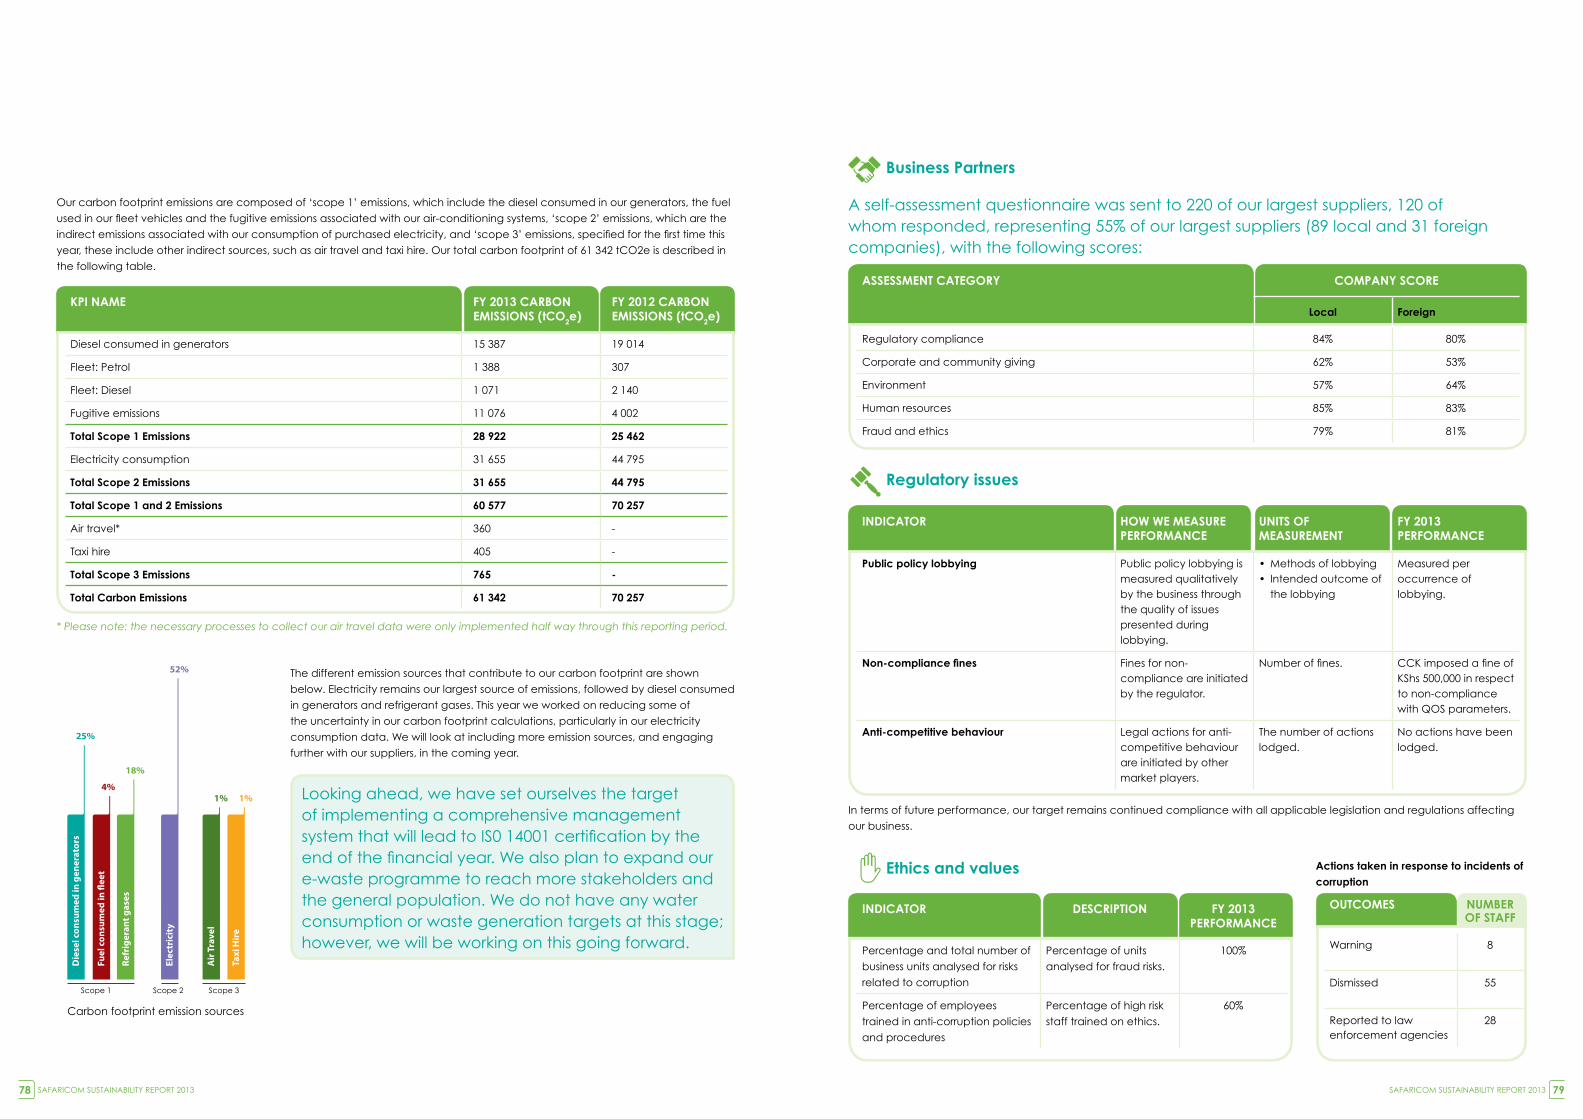
The different emission sources that contribute to our carbon footprint are shown
below. Electricity remains our largest source of emissions, followed by diesel consumed
in generators and refrigerant gases. This year we worked on reducing some of
the uncertainty in our carbon footprint calculations, particularly in our electricity
consumption data. We will look at including more emission sources, and engaging
further with our suppliers, in the coming year.
Looking ahead, we have set ourselves the target of implementing a comprehensive management system that will lead to IS0 14001 certification by the end of the financial year. We also plan to expand our e-waste programme to reach more stakeholders and the general population. We do not have any water consumption or waste generation targets at this stage; however, we will be working on this going forward.
Carbon footprint emission sources
Die
sel c
onsu
med
in g
ener
ator
s
Fuel
con
sum
ed in
�ee
t
Refr
iger
ant g
ases
Elec
tric
ity
Air
Tra
vel
Taxi
Hir
e
25%
4%
18%
52%
1% 1%
Scope 1 Scope 2 Scope 3
Our carbon footprint emissions are composed of ‘scope 1’ emissions, which include the diesel consumed in our generators, the fuel
used in our fleet vehicles and the fugitive emissions associated with our air-conditioning systems, ‘scope 2’ emissions, which are the
indirect emissions associated with our consumption of purchased electricity, and ‘scope 3’ emissions, specified for the first time this
year, these include other indirect sources, such as air travel and taxi hire. Our total carbon footprint of 61 342 tCO2e is described in
the following table.
* Please note: the necessary processes to collect our air travel data were only implemented half way through this reporting period.
KpI NaMe Fy 2013 CaRbON eMIssIONs (tCO2e)
Fy 2012 CaRbON eMIssIONs (tCO2e)
diesel consumed in generators 15 387 19 014
Fleet: Petrol 1 388 307
Fleet: diesel 1 071 2 140
Fugitive emissions 11 076 4 002
total scope 1 emissions 28 922 25 462
Electricity consumption 31 655 44 795
total scope 2 emissions 31 655 44 795
total scope 1 and 2 emissions 60 577 70 257
Air travel* 360 -
Taxi hire 405 -
total scope 3 emissions 765 -
total Carbon emissions 61 342 70 257
business partners
A self-assessment questionnaire was sent to 220 of our largest suppliers, 120 of whom responded, representing 55% of our largest suppliers (89 local and 31 foreign companies), with the following scores:
Regulatory issues
ethics and values actions taken in response to incidents of corruption
In terms of future performance, our target remains continued compliance with all applicable legislation and regulations affecting
our business.
assessMeNt CategORy COMpaNy sCORe
local Foreign
Regulatory compliance 84% 80%
Corporate and community giving 62% 53%
Environment 57% 64%
Human resources 85% 83%
Fraud and ethics 79% 81%
INdICatOR hOW We MeasuRe peRFORMaNCe
uNIts OF MeasuReMeNt
Fy 2013 peRFORMaNCe
public policy lobbying Public policy lobbying is measured qualitatively by the business through the quality of issues presented during lobbying.
• Methods of lobbying• Intended outcome of
the lobbying
Measured per occurrence of lobbying.
Non-compliance fines Fines for non-compliance are initiated by the regulator.
Number of fines. CCK imposed a fine of KShs 500,000 in respect to non-compliance with QOS parameters.
anti-competitive behaviour Legal actions for anti-competitive behaviour are initiated by other market players.
The number of actions lodged.
No actions have been lodged.
INdICatOR desCRIptION Fy 2013 peRFORMaNCe
Percentage and total number of
business units analysed for risks
related to corruption
Percentage of units
analysed for fraud risks.
100%
Percentage of employees
trained in anti-corruption policies
and procedures
Percentage of high risk
staff trained on ethics.
60%
OutCOMes NuMbeR OF staFF
Warning 8
dismissed 55
Reported to law enforcement agencies
28
SAFARICOM SUSTAINABILITY REPORT 201378 SAFARICOM SUSTAINABILITY REPORT 2013 79
TRA
NSFO
RM
INg
LIvES
gRI TABLE8
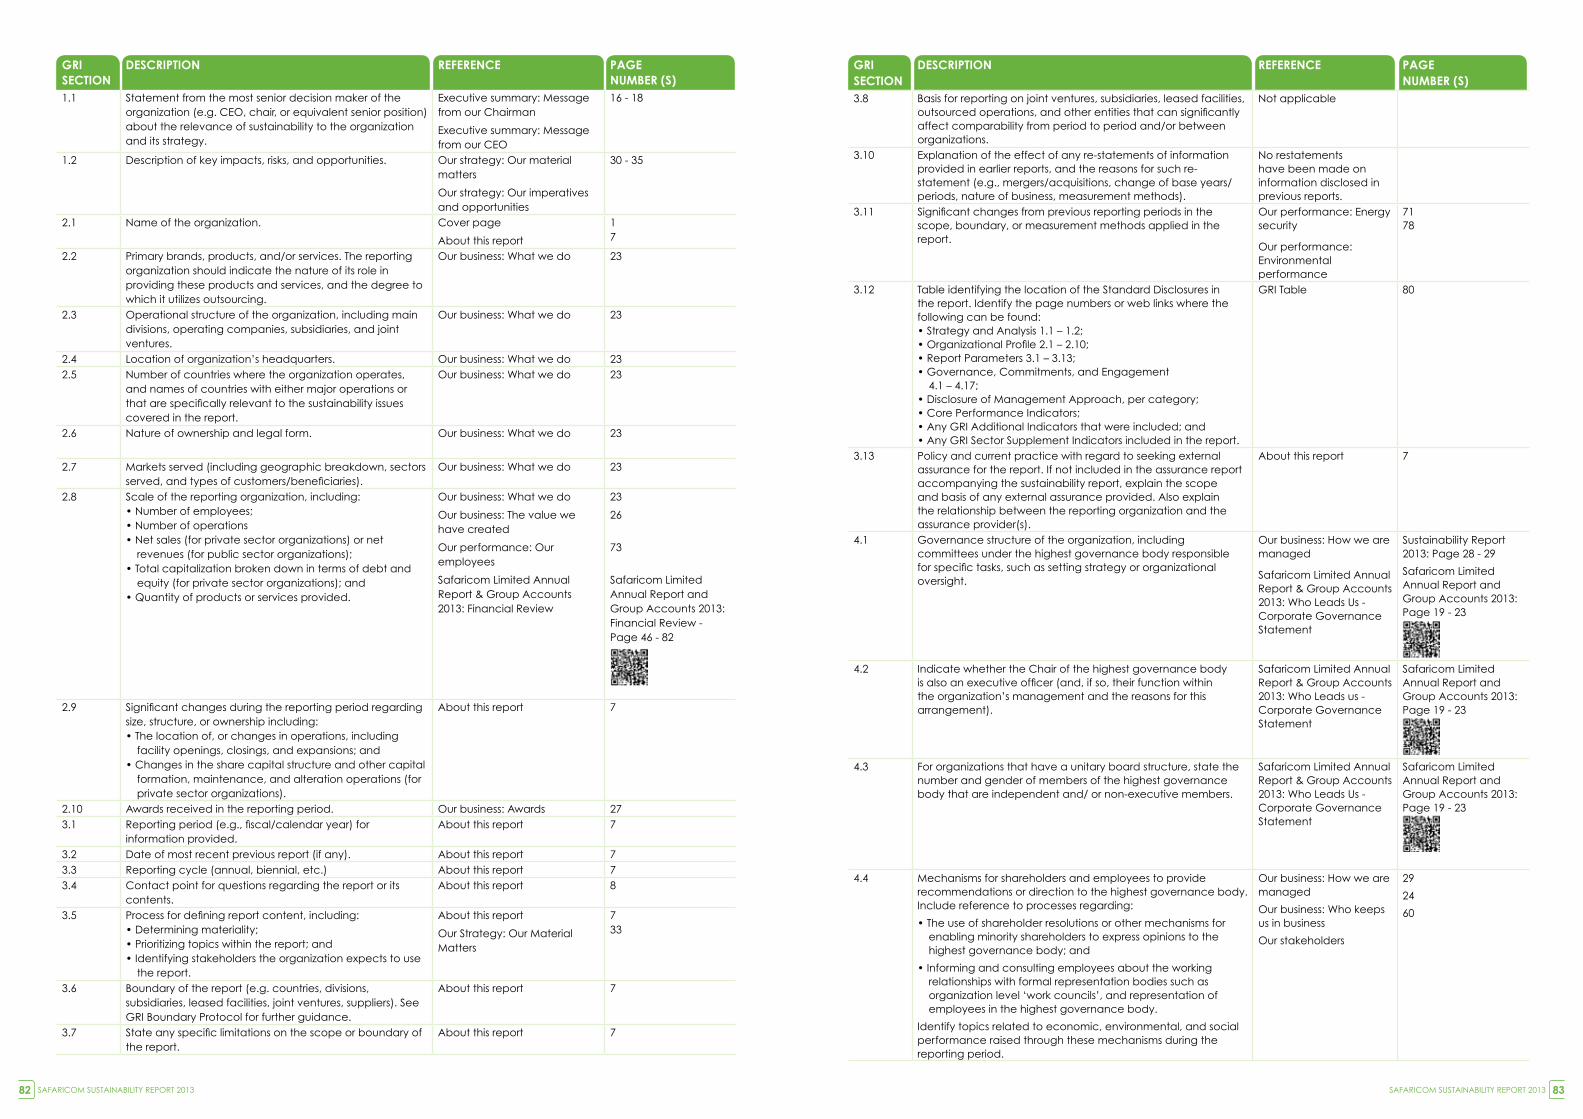
gRI seCtION
desCRIptION ReFeReNCe pageNuMbeR (s)
1.1 Statement from the most senior decision maker of the organization (e.g. CEO, chair, or equivalent senior position) about the relevance of sustainability to the organization and its strategy.
Executive summary: Message from our Chairman
Executive summary: Message from our CEO
16 - 18
1.2 description of key impacts, risks, and opportunities. Our strategy: Our material matters
Our strategy: Our imperatives and opportunities
30 - 35
2.1 Name of the organization. Cover page
About this report
17
2.2 Primary brands, products, and/or services. The reporting organization should indicate the nature of its role in providing these products and services, and the degree to which it utilizes outsourcing.
Our business: What we do 23
2.3 Operational structure of the organization, including main divisions, operating companies, subsidiaries, and joint ventures.
Our business: What we do 23
2.4 Location of organization’s headquarters. Our business: What we do 232.5 Number of countries where the organization operates,
and names of countries with either major operations or that are specifically relevant to the sustainability issues covered in the report.
Our business: What we do 23
2.6 Nature of ownership and legal form. Our business: What we do 23
2.7 Markets served (including geographic breakdown, sectors served, and types of customers/beneficiaries).
Our business: What we do 23
2.8 Scale of the reporting organization, including:• Number of employees;• Number of operations• Net sales (for private sector organizations) or net
revenues (for public sector organizations);• Total capitalization broken down in terms of debt and
equity (for private sector organizations); and• Quantity of products or services provided.
Our business: What we do
Our business: The value we have created
Our performance: Our employees
Safaricom Limited Annual Report & group Accounts 2013: Financial Review
23
26
73
Safaricom Limited Annual Report and group Accounts 2013: Financial Review - Page 46 - 82
2.9 Significant changes during the reporting period regarding size, structure, or ownership including:• The location of, or changes in operations, including
facility openings, closings, and expansions; and• Changes in the share capital structure and other capital
formation, maintenance, and alteration operations (for private sector organizations).
About this report 7
2.10 Awards received in the reporting period. Our business: Awards 273.1 Reporting period (e.g., fiscal/calendar year) for
information provided.About this report 7
3.2 date of most recent previous report (if any). About this report 73.3 Reporting cycle (annual, biennial, etc.) About this report 73.4 Contact point for questions regarding the report or its
contents.About this report 8
3.5 Process for defining report content, including:• Determining materiality;• Prioritizing topics within the report; and• Identifying stakeholders the organization expects to use
the report.
About this report
Our Strategy: Our Material Matters
733
3.6 Boundary of the report (e.g. countries, divisions, subsidiaries, leased facilities, joint ventures, suppliers). See gRI Boundary Protocol for further guidance.
About this report 7
3.7 State any specific limitations on the scope or boundary of the report.
About this report 7
gRI seCtION
desCRIptION ReFeReNCe pageNuMbeR (s)
3.8 Basis for reporting on joint ventures, subsidiaries, leased facilities, outsourced operations, and other entities that can significantly affect comparability from period to period and/or between organizations.
Not applicable
3.10 Explanation of the effect of any re-statements of information provided in earlier reports, and the reasons for such re-statement (e.g., mergers/acquisitions, change of base years/periods, nature of business, measurement methods).
No restatements have been made on information disclosed in previous reports.
3.11 Significant changes from previous reporting periods in the scope, boundary, or measurement methods applied in the report.
Our performance: Energy security
Our performance: Environmental performance
7178
3.12 Table identifying the location of the Standard disclosures in the report. Identify the page numbers or web links where the following can be found:• Strategy and Analysis 1.1 – 1.2;• Organizational Profile 2.1 – 2.10;• Report Parameters 3.1 – 3.13;• Governance, Commitments, and Engagement
4.1 – 4.17;• Disclosure of Management Approach, per category;• Core Performance Indicators;• Any GRI Additional Indicators that were included; and• Any GRI Sector Supplement Indicators included in the report.
gRI Table 80
3.13 Policy and current practice with regard to seeking external assurance for the report. If not included in the assurance report accompanying the sustainability report, explain the scope and basis of any external assurance provided. Also explain the relationship between the reporting organization and the assurance provider(s).
About this report 7
4.1 governance structure of the organization, including committees under the highest governance body responsible for specific tasks, such as setting strategy or organizational oversight.
Our business: How we are managed
Safaricom Limited Annual Report & group Accounts 2013: Who Leads Us - Corporate governance Statement
Sustainability Report 2013: Page 28 - 29
Safaricom Limited Annual Report and group Accounts 2013: Page 19 - 23
4.2 Indicate whether the Chair of the highest governance body is also an executive officer (and, if so, their function within the organization’s management and the reasons for this arrangement).
Safaricom Limited Annual Report & group Accounts 2013: Who Leads us - Corporate governance Statement
Safaricom Limited Annual Report and group Accounts 2013: Page 19 - 23
4.3 For organizations that have a unitary board structure, state the number and gender of members of the highest governance body that are independent and/ or non-executive members.
Safaricom Limited Annual Report & group Accounts 2013: Who Leads Us - Corporate governance Statement
Safaricom Limited Annual Report and group Accounts 2013: Page 19 - 23
4.4 Mechanisms for shareholders and employees to provide recommendations or direction to the highest governance body. Include reference to processes regarding:
• The use of shareholder resolutions or other mechanisms for enabling minority shareholders to express opinions to the highest governance body; and
• Informing and consulting employees about the working relationships with formal representation bodies such as organization level ‘work councils’, and representation of employees in the highest governance body.
Identify topics related to economic, environmental, and social performance raised through these mechanisms during the reporting period.
Our business: How we are managed
Our business: Who keeps us in business
Our stakeholders
29
24
60
SAFARICOM SUSTAINABILITY REPORT 201382 SAFARICOM SUSTAINABILITY REPORT 2013 83
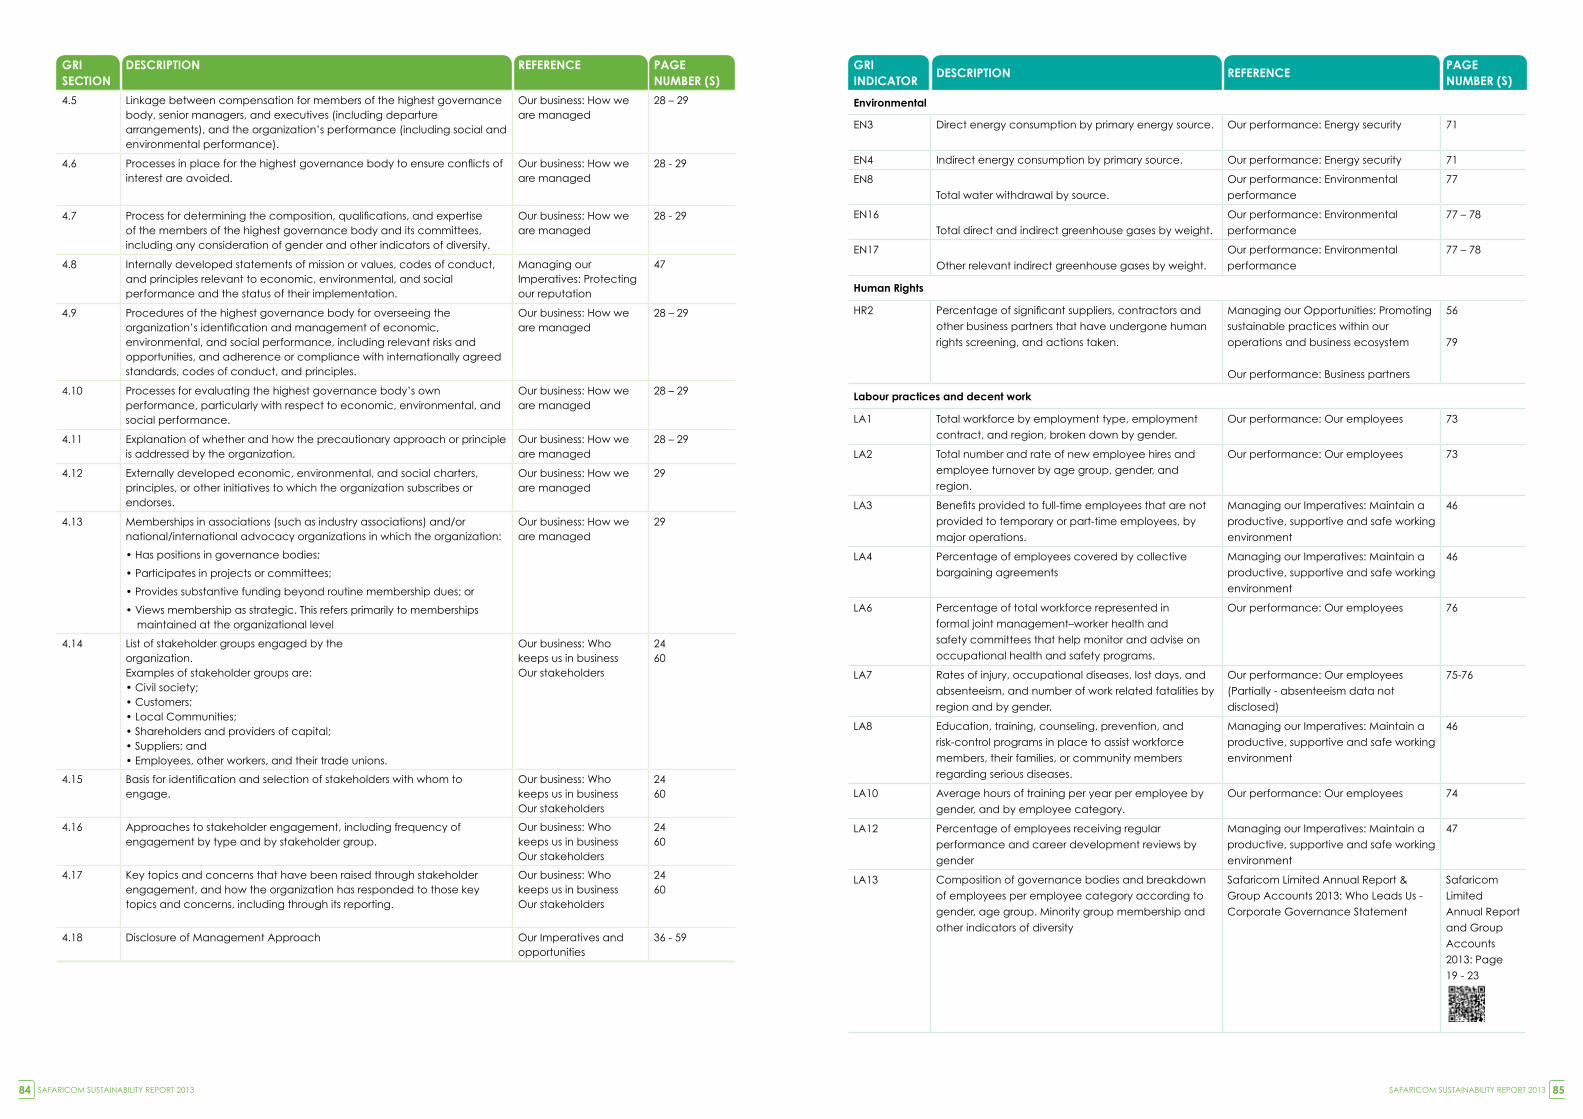
gRI seCtION
desCRIptION ReFeReNCe pageNuMbeR (s)
4.5 Linkage between compensation for members of the highest governance body, senior managers, and executives (including departure arrangements), and the organization’s performance (including social and environmental performance).
Our business: How we are managed
28 – 29
4.6 Processes in place for the highest governance body to ensure conflicts of interest are avoided.
Our business: How we are managed
28 - 29
4.7 Process for determining the composition, qualifications, and expertise of the members of the highest governance body and its committees, including any consideration of gender and other indicators of diversity.
Our business: How we are managed
28 - 29
4.8 Internally developed statements of mission or values, codes of conduct, and principles relevant to economic, environmental, and social performance and the status of their implementation.
Managing our Imperatives: Protecting our reputation
47
4.9 Procedures of the highest governance body for overseeing the organization’s identification and management of economic, environmental, and social performance, including relevant risks and opportunities, and adherence or compliance with internationally agreed standards, codes of conduct, and principles.
Our business: How we are managed
28 – 29
4.10 Processes for evaluating the highest governance body’s own performance, particularly with respect to economic, environmental, and social performance.
Our business: How we are managed
28 – 29
4.11 Explanation of whether and how the precautionary approach or principle is addressed by the organization.
Our business: How we are managed
28 – 29
4.12 Externally developed economic, environmental, and social charters, principles, or other initiatives to which the organization subscribes or endorses.
Our business: How we are managed
29
4.13 Memberships in associations (such as industry associations) and/or national/international advocacy organizations in which the organization:
• Has positions in governance bodies;
• Participates in projects or committees;
• Provides substantive funding beyond routine membership dues; or
• Views membership as strategic. This refers primarily to memberships maintained at the organizational level
Our business: How we are managed
29
4.14 List of stakeholder groups engaged by the organization. Examples of stakeholder groups are: • Civil society; • Customers; • Local Communities; • Shareholders and providers of capital; • Suppliers; and • Employees, other workers, and their trade unions.
Our business: Who keeps us in businessOur stakeholders
24 60
4.15 Basis for identification and selection of stakeholders with whom to engage.
Our business: Who keeps us in businessOur stakeholders
2460
4.16 Approaches to stakeholder engagement, including frequency of engagement by type and by stakeholder group.
Our business: Who keeps us in businessOur stakeholders
2460
4.17 Key topics and concerns that have been raised through stakeholder engagement, and how the organization has responded to those key topics and concerns, including through its reporting.
Our business: Who keeps us in businessOur stakeholders
2460
4.18 disclosure of Management Approach Our Imperatives and opportunities
36 - 59
gRI INdICatOR
desCRIptION ReFeReNCepage NuMbeR (s)
environmental
EN3 direct energy consumption by primary energy source. Our performance: Energy security 71
EN4 Indirect energy consumption by primary source. Our performance: Energy security 71
EN8
Total water withdrawal by source.
Our performance: Environmental
performance
77
EN16
Total direct and indirect greenhouse gases by weight.
Our performance: Environmental
performance
77 – 78
EN17
Other relevant indirect greenhouse gases by weight.
Our performance: Environmental
performance
77 – 78
human Rights
HR2 Percentage of significant suppliers, contractors and
other business partners that have undergone human
rights screening, and actions taken.
Managing our Opportunities: Promoting
sustainable practices within our
operations and business ecosystem
Our performance: Business partners
56
79
labour practices and decent work
LA1 Total workforce by employment type, employment
contract, and region, broken down by gender.
Our performance: Our employees 73
LA2 Total number and rate of new employee hires and
employee turnover by age group, gender, and
region.
Our performance: Our employees 73
LA3 Benefits provided to full-time employees that are not
provided to temporary or part-time employees, by
major operations.
Managing our Imperatives: Maintain a
productive, supportive and safe working
environment
46
LA4 Percentage of employees covered by collective
bargaining agreements
Managing our Imperatives: Maintain a
productive, supportive and safe working
environment
46
LA6 Percentage of total workforce represented in
formal joint management–worker health and
safety committees that help monitor and advise on
occupational health and safety programs.
Our performance: Our employees 76
LA7 Rates of injury, occupational diseases, lost days, and
absenteeism, and number of work related fatalities by
region and by gender.
Our performance: Our employees
(Partially - absenteeism data not
disclosed)
75-76
LA8 Education, training, counseling, prevention, and
risk-control programs in place to assist workforce
members, their families, or community members
regarding serious diseases.
Managing our Imperatives: Maintain a
productive, supportive and safe working
environment
46
LA10 Average hours of training per year per employee by
gender, and by employee category.
Our performance: Our employees 74
LA12 Percentage of employees receiving regular
performance and career development reviews by
gender
Managing our Imperatives: Maintain a
productive, supportive and safe working
environment
47
LA13 Composition of governance bodies and breakdown
of employees per employee category according to
gender, age group. Minority group membership and
other indicators of diversity
Safaricom Limited Annual Report &
group Accounts 2013: Who Leads Us -
Corporate governance Statement
Safaricom
Limited
Annual Report
and group
Accounts
2013: Page
19 - 23
SAFARICOM SUSTAINABILITY REPORT 201384 SAFARICOM SUSTAINABILITY REPORT 2013 85
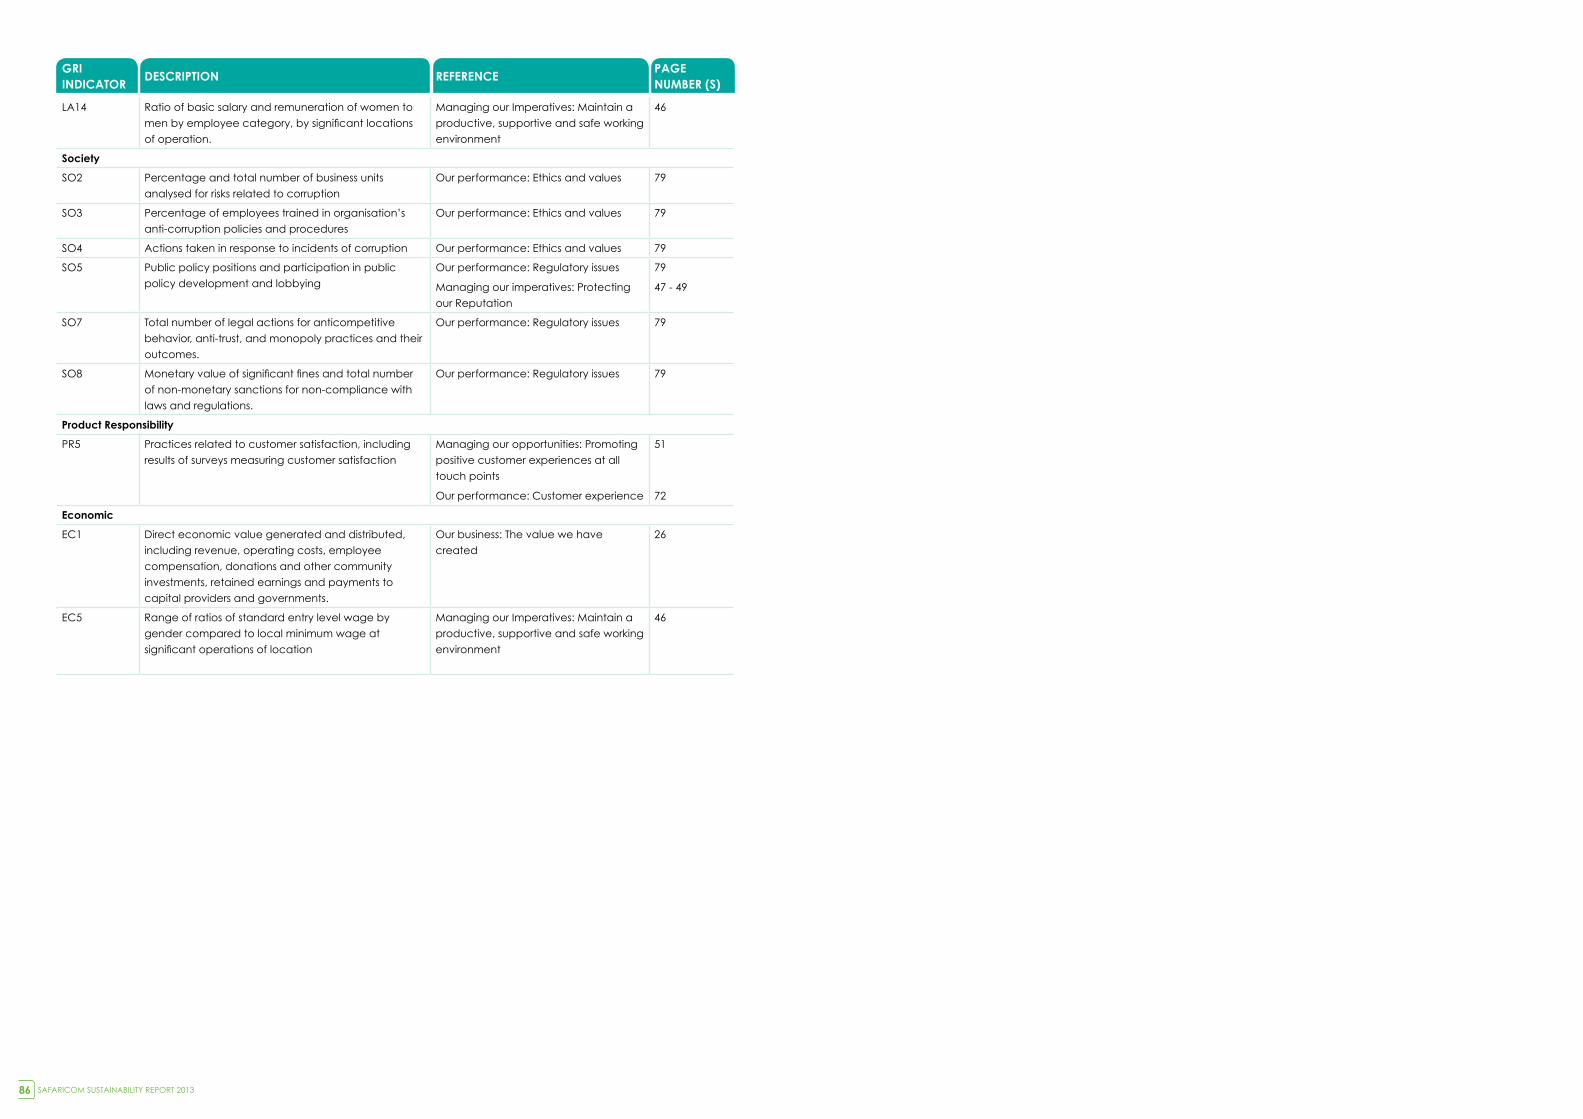
gRI INdICatOR
desCRIptION ReFeReNCepage NuMbeR (s)
LA14 Ratio of basic salary and remuneration of women to
men by employee category, by significant locations
of operation.
Managing our Imperatives: Maintain a
productive, supportive and safe working
environment
46
society
SO2 Percentage and total number of business units
analysed for risks related to corruption
Our performance: Ethics and values 79
SO3 Percentage of employees trained in organisation’s
anti-corruption policies and procedures
Our performance: Ethics and values 79
SO4 Actions taken in response to incidents of corruption Our performance: Ethics and values 79
SO5 Public policy positions and participation in public
policy development and lobbying
Our performance: Regulatory issues
Managing our imperatives: Protecting
our Reputation
79
47 - 49
SO7 Total number of legal actions for anticompetitive
behavior, anti-trust, and monopoly practices and their
outcomes.
Our performance: Regulatory issues 79
SO8 Monetary value of significant fines and total number
of non-monetary sanctions for non-compliance with
laws and regulations.
Our performance: Regulatory issues 79
product Responsibility
PR5 Practices related to customer satisfaction, including
results of surveys measuring customer satisfaction
Managing our opportunities: Promoting
positive customer experiences at all
touch points
Our performance: Customer experience
51
72
economic
EC1 direct economic value generated and distributed,
including revenue, operating costs, employee
compensation, donations and other community
investments, retained earnings and payments to
capital providers and governments.
Our business: The value we have
created
26
EC5 Range of ratios of standard entry level wage by
gender compared to local minimum wage at
significant operations of location
Managing our Imperatives: Maintain a
productive, supportive and safe working
environment
46
SAFARICOM SUSTAINABILITY REPORT 201386
www.safaricom.co.keScan this QR code to
view the digital report