safety and transport safetynov 13, 2018 · influence of wind is negligible. it has, however, been...
TRANSCRIPT

SAFETY AND TRANSPORT SAFETY
Wind effect on internal and external compartment fire exposure
Daniel Brandon Johan Anderson RISE Report 2018:72

© RISE Research Institutes of Sweden
Wind effect on internal and external compartment fire exposure
Daniel Brandon Johan Anderson

1
© RISE Research Institutes of Sweden
Abstract
Wind effect on compartment fires
Changes of buildings regulations regarding the allowable height of mass timber
structures in North America have been proposed. The proposed changes are to a
significant extent based on real scale fire experiments of compartments that have been
performed in laboratories in which the influence of wind is negligible. It has, however,
been questioned whether the proposed regulations are relevant for realistic scenarios
with external wind loads acting on the building during a compartment fire.
The study discussed in this report involves a review of previous literature, analysis of
available test results and single zone modeling to study potential effects of external
wind on the internal and external exposure of fires in compartments with exposed CLT.
Key words: CLT, wind, fire, mass timber, tall timber buildings
RISE Research Institutes of Sweden AB
RISE Report 2018:72
ISBN:978-91-88907-19-6
Stockholm 2018

2
© RISE Research Institutes of Sweden
Content Abstract ....................................................................................................... 1
Content ...................................................................................................... 2
Preface ....................................................................................................... 3
1 Introduction......................................................................................... 4
2 Background .......................................................................................... 4
3 Scope ................................................................................................... 5
4 Influence of wind on the external fire plume ........................................ 7
4.1 Literature review ................................................................................................. 7
4.2 Analysis of recent façade fire tests in outdoor environment ............................. 9
4.3 Influence of exposed wood on the external fire plume ..................................... 13
5 Influence of wind on the internal exposure ......................................... 16
5.1 Review of previous research ............................................................................. 16
5.2 Zone model with changed air velocity .............................................................. 16
5.2.1 Modelled compartments ........................................................................... 17
5.2.2 Fuel parameters ......................................................................................... 18
5.2.3 Gypsum board fall-off and CLT delamination .......................................... 18
5.2.4 Considered effects of external wind .......................................................... 18
5.2.5 Results and discussion ............................................................................. 20
6 Conclusions ........................................................................................ 24
References ............................................................................................... 25

3
© RISE Research Institutes of Sweden
Preface The study discussed in this report was performed in assignment of the American Wood
Council and the Canadian Wood Council. The research is performed at RISE in
Sweden.

4
© RISE Research Institutes of Sweden
1 Introduction The development of cross laminated timber (CLT) has resulted in an increase of multi-
storey timber buildings in multiple countries. Recently, changes of buildings
regulations regarding tall mass timber structures in North America have been
proposed. The proposed changes are to a significant extent based on real scale fire
experiments of compartments that have been performed in laboratories in which the
influence of wind is negligible. It has, however, been questioned whether the proposed
regulations are relevant for realistic scenarios with external wind loads acting on the
building during a compartment fire.
The effect of wind on fires in tall mass timber buildings with exposed timber surfaces
inside the compartment was studied, as is discussed in this report.
This report includes a review of relevant studies, analysis of available experimental data
and single zone modeling to indicate the effect of external wind on the external and
internal exposures of a compartment fire.
2 Background An experimental study of fires in compartments made of CLT was performed recently
(Zelinka et al. 2018). The study included five fire tests (denoted A1-A5) of
compartments with inner dimensions of 30 ft x 30 ft x 9 ft (9.1 x 9.1 x 2.7m). The fire
compartments were part of a larger structure, as can be seen in Figure 1. The fire load
comprised of typical apartment furniture with an average fuel load density of 550
MJ/m2. Three of the five compartments, A1 to A3, had two (window) openings of
17.8m2 or 182 ft2. The other two compartments, A4 and A5, had closed windows of the
same dimensions and had sprinklers installed. The compartments had different
quantities of exposed CLT, as indicated in Table 1. The opening factor given in the table
was calculated using:
too AHAO /
Where, Ao and Ho are the area and height of the opening and At is the total area of the
boundary surfaces.
175mm thick CLT consisting of five 35mm thick plies were used for all load-bearing
members. It should be noted that the CLT adhesive used in these tests complies with
the 2016 version of ANSI/APA PRG 320, but does not comply with the stricter fire-
performance requirements of the most recent (2018) version of the ANSI/APA
PRG320. The fires in the sprinklered compartments (A4 and A5) extinguished the fire
and avoided flashover, despite the intended delay of sprinkler activation in test A5. The
fires in compartments without sprinklers involved flashover, but the fire decayed and
finally the flaming combustion seized.

5
© RISE Research Institutes of Sweden
Figure 1: Compartment fire test after flashover (Hasburgh et al., 2018)
Table 1: Overview of compartment tests by Zelinka et al. (2018)
Test
Floor
area of
ignited
comp.
Ventilation
opening area of
ignited comp.
Opening
factor
(m1/2
)
Thickness
and type of gypsum board protection
(exposed layer last)
Sprinklers
Movable
fire load
density
(MJ/m2)
Extinguishment
A1
82.8m2
or
900 ft2
17.8 m2
or
192 ft2
0.105
All surfaces: 2 layers of 15.9mm Type
X Not installed
550
(MJ/m2)
Furniture
Self-extinction A2 30% of the ceiling exposed; Other
surfaces: 2 layers of 15.9mm Type X Not installed
A3 66% of two walls exposed; Other
surfaces: 2 layers of 15.9mm Type X Not installed
A4 17.8 m
2
or
192 ft2
window closed
0.105
window
closed
None Auto-
activation
Extinguishment
by sprinkler A5 None
Manually
activated after
20 minutes
Changes of regulations regarding the maximum surface area of CLT exposed and the
amount of gypsum board protection and requirements for adhesive performance have
been based on this study and other studies. It has, however, been questioned whether
these results are valid for scenarios in which wind acts on the compartment externally.
3 Scope This study aims to assess the influence of wind on fire conditions inside the
compartment and exterior flames from openings in compartment fires. Post-flashover
fires in compartments with openings on one side have been considered. The effect of
wind from one direction and wind from changing directions on the external fire plume
are of interest for this study (Figure 2). This study does not consider combustible

6
© RISE Research Institutes of Sweden
façade systems. The effect of wind on combustible façade systems is recommended for
further research.
The effect of an increased or reduced air flow into and out of a compartment after
flashover (Figure 2), as a potential result of wind, is studied using a single zone model.
A prediction of the damage caused by the fire is made using the single zone model.
Additionally, previous tests and CFD simulations are reviewed.
Figure 2: Wind exposure on compartment fires
Non-laminar wind flow
Laminar wind flow
Post flashover fire
Inflow
Outflow
Post flashover fire
Inflow
Outflow

7
© RISE Research Institutes of Sweden
4 Influence of wind on the external
fire plume This report includes a review of literature and analysis of outdoor fire tests to study the
influence of wind on the fire plume exposure on façades. Combustible façade systems
are not within the scope of this report.
4.1 Literature review
The number of studies found regarding wind-effect on compartment fires and
corresponding external fire plumes is limited to mostly CFD studies and small-scale
compartment tests in an environment with controlled air velocity. The studies all
considered ventilation-controlled fires in compartments with one ventilation opening
and wind exposed to the façade with the opening. The conclusions of these studies are
in line with each other:
The height of external flaming reduces as the wind increases (while the neutral
plane lowers and the flames spread wider either side of the opening).
For the same heat release rate an increased wind speed seems to reduce the gas
temperatures both internally and externally.
The addition of external wind load reduces the maximum temperature gas
temperatures of a compartment fire if the heat release rate stays the same.
The reduction of the flame height out of ventilation opening was visualized by Hu et al.
(2017) and Zhao (2017). Hu et al. (2017a) performed CFD analyses of compartments
with external wind load and performed compartment fire tests in environments with a
controlled air velocity and direction. Zhao performed CFD analyses of compartments
with external wind from angles parallel and perpendicular to the plane of the opening.
The studies both indicated that external wind reduces the height of the external fire
plume if the wind was perpendicular to the plane of the opening. According to Zhao
(2017) the outflow of unburned combustible gasses is increasingly hindered with
increasingly high velocities, leading to a reduced flame height (Figure 3). This is not the
case if the wind is parallel to the plane of the opening and he mentions that sideways
wind velocities increases the risk of sideways fire spread. It was, however, seen that the
footprint of elevated temperatures exposed on the façade reduced with increasing wind
speed (Figure 4) for a wind direction parallel to the façade with the opening.
Experimental studies of compartment tests exposed to velocity-controlled external
wind were published by Ren et al (2018). Ren et al. performed small-scale
compartment fire tests in airflows controlled using a wind tunnel. A matrix of
thermocouples was used to determine numerous temperatures at different heights
above the compartment opening and at different distances from the façade. It was
shown that the maximum temperatures decreased with an increasing wind velocity
from 0 m/s to 2.0 m/s (or 0 mph to 4.5 mph). Additionally, the height at which
elevated temperatures were measured, reduced with increasing wind velocities.
8
© RISE Research Institutes of Sweden
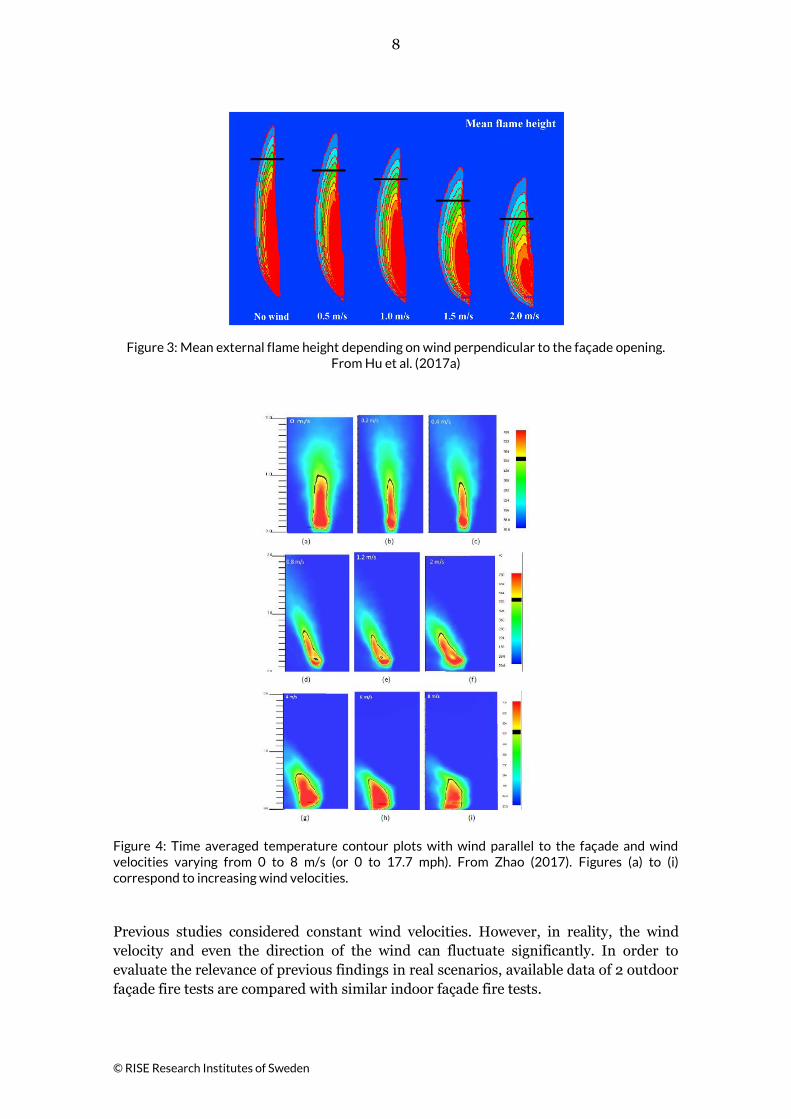
Figure 3: Mean external flame height depending on wind perpendicular to the façade opening. From Hu et al. (2017a)
Figure 4: Time averaged temperature contour plots with wind parallel to the façade and wind velocities varying from 0 to 8 m/s (or 0 to 17.7 mph). From Zhao (2017). Figures (a) to (i) correspond to increasing wind velocities.
Previous studies considered constant wind velocities. However, in reality, the wind
velocity and even the direction of the wind can fluctuate significantly. In order to
evaluate the relevance of previous findings in real scenarios, available data of 2 outdoor
façade fire tests are compared with similar indoor façade fire tests.

9
© RISE Research Institutes of Sweden
4.2 Analysis of recent façade fire tests in
outdoor environment
A standardized British façade fire test BS 8414 (2015) can be performed indoors and
outdoors. For the test results to be valid, the wind velocity should be less than 2 m/s (or
4.5 mph). However, during two demonstration tests (Anderson et al. 2017) the wind
velocity was significant. For this study, façade temperatures of the tests reported by
Anderson et al. (2017) were compared to temperatures of similar tests without wind.
Additionally, the behavior of the external fire plume is studied visually.
BS 8414 uses a compartment with a 400 kg crib of conditioned wood as fuel. During the
test, external flaming of the compartment leads to fire exposure on the facade. In order
to give an indication of the exposure on the façade for indoor fire tests, the maximum
temperatures measured using 8 thermocouples at the façade in a horizontal line 2.5m
or 8 ft 2 in above the compartment opening (see Figure 5) were determined for 13
published BS 8414 façade tests (Clark, 2005; Howard, 2015; McIntosh, 2015; Clark,
2015; Clark, 2016; Farrington, 2017; Lalu, 2017; BRE, 2017; Farrington, 2018a;
Farrington, 2018b; Lalu 2018; Abukar, 2018). All 13 tested facades were sufficient to
meet the approval criteria of BS 8414 and were performed inside fire testing
laboratories with negligible wind exposure. Figure 6 shows the range of the
temperatures measured in this horizontal line (shown in grey). It can be seen that the
temperatures in this line increase comparably for approximately the first 20 minutes of
the fire tests. In all 13 indoor fire tests, the highest temperatures were measured in the
thermocouple at the center line above the opening or a thermocouple directly next to it.
Results of outdoor BS 8414 tests have been published by Anderson et al. (2017). It
should be noted that the external wind load of one of the two tests was not within the
acceptable margins set by the British standard BS 8414. The wind velocity of Test 1
varied between 2 and 5 m/s (4.5 and 11 mph), coming from the N-E direction and the
wind velocity of Test 2 was between 0 and 2 m/s (0 – 4.5 mph), coming from N, N-W
direction (see Figure 7). In Test 2 the wind came from behind the façade, which may
have caused turbulence or at least varying wind directions in front of the façade, as
evidenced by frequent changes of fire plume direction. Also, in these outdoor fire tests
temperatures were measured in a horizontal line 2.5m or 8 ft 2 in above the ventilation
opening. The maximum temperatures measured at this line are included in Figure 6. In
contrast with the indoor fire tests, the location of the highest temperatures at a
horizontal line 2.5 meters above the façade changed regularly, indicating that the
direction of the fire plume changed recurrently. The temperatures fluctuated much
more significantly as in the 13 indoor BS 8414 fire tests (plotted in grey), indicating a
variable height of the fire plumes.

10
© RISE Research Institutes of Sweden
Figure 5: Setup of the BS 8414 test with location of thermocouples (TC) at a level 2.5m or above the opening (Dimensions in mm)
Figure 6: Maximum temperatures of each test measured at a horizontal line 2.5 m or 8ft 2 in above the opening.
0
100
200
300
400
500
600
700
800
900
1000
0 500 1000 1500
Tem
pe
ratu
re (
°C)
Time (s)
Range of maximumtemperatures at Level 1 of 13tests - Wind velocity = 0
Mean plus/minus standarddeviation of maximumtemperatures at Level 1 of 13tests - Wind velocity = 0Mean of maximumtemperatures at Level 1 of 13tests - Wind velocity = 0
Maximum temperature atLevel 1 Outdoor test - Windvelocity 0 - 4.5 mph
Maximum temperature atLevel 1 Outdoor test - Windvelocity 4.5 - 11 mph
Effecto
f win
d

11
© RISE Research Institutes of Sweden
Figure 7: Direction of the wind with respect to the façade (determined from raw data).
In Figure 6 it can be seen that the maximum temperatures measured at the horizontal
line 2.5m above the opening were significantly lower throughout the fire tests
performed outdoors. This difference is increasingly significant for the first 20 minutes
of the fire tests. At 20 minutes the maximum temperatures measured at the line for fire
tests with external winds were 400 to 700°C lower than the temperatures measured at
the same line during 13 similar indoor fire tests. This indicates that the wind reduced
the height of the fire plume. It should be noted that the tests show only two scenarios of
wind exposure. Due to the countless combinations of possible wind velocities, wind
directions and fluctuations of wind velocities and wind directions, it is not possible to
conclude that external wind load cannot increase the height of the fire plume from
experimental studies alone. However, the observed reduced height of the fire plumes
caused by wind is in line with conclusions of previous research with numerous CFD
analyses and compartment fire tests performed in controlled wind conditions.
The effect of wind on external fire plumes of compartments can be studied visually. Fire
plumes of indoor BS 8414 fire tests are generally approximately symmetrical and have a
peak height approximately above the center of the opening as can be seen in Figure 8.
Fire plumes of tests exposed to wind, can change direction frequently if the air flow is
not laminar (see Figure 9) and can lower the height of the fire plume. From video
evidence it was also seen that the fire plume occasionally in a horizontal direction away
from the façade, temporarily missing the façade. There were also brief moments in
which the external fire plume completely disappeared. These findings seem to be in line
with previous findings by Zhao (2017), Hu et al. (2017a) and Ren et al. (2018).

12
© RISE Research Institutes of Sweden
Figure 8: Typical fire plume during an indoor BS 8414 façade fire test.
Figure 9: Changing directions of the fire plume during an outdoor BS 8414 façade fire test (Test 2, Anderson et al. 2017)
Video evidence gives a strong indication of the possible variability of the fire plume size
as a result of wind. To give an indication of this variability in this report the shape of
the fire plume of Test 2 is determined graphically for a number of video frames. For a
period of 5 seconds, 20 minutes after ignition the size of the fire plume is determined
from video frames. The fire plume in each video frame was identified using software
(WebPlotDigitizer) that located all pixels within a range of colors that correspond to the
fire plume. The same range of colors was used to identify the shape of the fire plume for
each video frame. Figure 10 shows the shape of the fire plume with intervals of 1
second. Within the analyzed 5 seconds the fire plume reduced and increased twice,
resulting in a difference of fire plume height (measured from the top of the opening) of
400 to 500%.

13
© RISE Research Institutes of Sweden
Figure 10: Shape of the fire plume every second for five seconds, 20 minutes after ignition in Test 2
4.3 Influence of exposed wood on the
external fire plume
It was previously shown that exposing wood linings or CLT can increase the height of
the external fire plume. This was especially apparent in fire tests in which 100% of the
wall and ceiling surfaces were exposed and with relatively small window openings and
heavily ventilation-controlled fires (Hakkarainen, 2002; Frangi and Fontana 2005; Su
et al. 2018). However, the proposed regulations only allow exposing a relatively small
percentage of the total CLT surface. In this chapter the temperatures above the opening
and the height of the external plumes of relevant fire tests are compared.
Fires in compartments with smaller openings require lower heat release rates in order
to achieve a fully developed phase (i.e. the most severe phase of a flashover fire with the
highest possible combustion rate inside the compartment) than fires in compartments
with larger openings. During the fully developed phase, practically all oxygen that flows
into the compartment is consumed. Combustible gasses that do not react inside the
compartment due to lack of oxygen can react outside of the compartment. Therefore,
the height of the fire plume is dependent on the dimensions of the ventilation openings
of a compartment.
In order to assess the effect of relevant amounts of exposed surface areas of CLT on the
external exposure, pictures (video frames) of external fire plumes during the fully
developed phase are compared in Table 2. Three comparisons of compartments (A, B
and C) were included because they involved compartments with surface areas of
exposed CLT, which are in line with the proposed regulations. The comparisons A, B
and C correspond to significantly different opening factors. The smallest openings (of
comparison C) correspond approximately with the minimum allowable window
dimensions of 8% of the floor area for a habitable space. Therefore, comparison C
corresponds to the most extreme, but unlikely scenario. Differences in flame height are
not clearly visible from the photos in Table 2 for comparisons A and B. During a
meeting of the International Code Council, the majority of the audience was not able to
identify the compartment fire with exposed CLT, based on simultaneously played
0 sec
+1 sec
+ 2 sec
+ 3 sec
+ 4 sec
+ 5 sec

14
© RISE Research Institutes of Sweden
videos of the external flame of the compartment fire tests of comparison A. The
temperatures measured at the façade above the opening for, both, the fully protected
and partially exposed compartments, seemed similar as well. Although, the fire plumes
of comparison B were similar in height, the intensity of the fire seems higher at the side
of the exposed wall of the partially exposed compartment. The temperatures at the
façade at a height of 3.5 m were about 100 to 200 °C higher for approximately 15 to 20
minutes. In the extreme case of a small opening (comparison C) a difference can be
seen of fire plume height. The measured temperatures at the façade above the opening
were increased during most of the fully developed phase, due to the presence of
exposed wood.
The comparisons of this section indicate that the presence of the proposed amount of
exposed wood does not lead to an increased external fire plume if the opening of a
compartment is sufficiently large. For openings corresponding to the smallest allowable
windows in habitable space (ICC, 2013) the contribution of timber can lead to an
increased fire exposure on the façade.

15
© RISE Research Institutes of Sweden
Table 2: Overview of external exposure data during the fully developed phase of compartment fires with and without relevant exposed CLT surface areas.
Comparison A: Fully protected
versus 30% of ceiling exposed
Comparison B: Fully
protected versus longest
33% of walls exposed
Comparison C: Fully
protected versus longest
33% of walls exposed
Reference Zelinka et al. (2018) Su et al. (2018a) Su et al. (2018a)
Compartmen
t dimensions
(L x W x H)
9.1 m x 9.1 m x 2.7m
Or
30 ft x 30 ft x 9 ft
9.1 m x 4.6 m x 2.7m
Or
30 ft x 15 ft x 9 ft
9.1 m x 4.6 m x 2.7m
Or
30 ft x 15 ft x 9 ft
Opening
dimensions
(W x H)
3.7 m x 2.4 m (x 2 openings)
Or
12 ft x 8 ft (x 2 openings)
3.6 m x 2.0 m
Or
11 ft10 in x 6 ft 7 in
1.8 m x 2.0 m
Or
5 ft11 in x 6 ft 7 in
Opening
factor 0.105 0.065 0.032
Fully
protected
compartment
(fully
developed
phase)
Compartmen
t with
exposed CLT
(fully
developed
phase)
Time of photo
after ignition 21 (min) 28 (min) 28 (min)
Temperatures
at the facade
at 3.5m or 11
ft6in height
from the floor
Note
Delamination of CLT occurred during the tests. As it is
currently required to use non-delaminating CLT in North
America, the comparisons between temperatures after
delamination are irrelevant and are not included in the
comparison above.
0
200
400
600
800
1000
1200
0 20 40 60
T (°
C)
t (min)
30% of ceilingexposedFully protected
0
200
400
600
800
1000
1200
0 20 40 60
T (°
C)
t (min)
33% of all wallsexposedFully protected
0
200
400
600
800
1000
1200
0 20 40 60
T (°
C)
t (min)
33% of all wallsexposed
Fully protected

16
© RISE Research Institutes of Sweden
5 Influence of wind on the internal
exposure Only a few studies were found that focused on the influence that external wind load has
on the fire conditions inside the compartment. This chapter discusses a review of
previous research and an analysis using a single zone model to assess the influence of
changed ventilation conditions of compartment fires.
5.1 Review of previous research
Hu et al. (2017b) concluded from an experimental study that less heat release rate is
required to achieve a (well-mixed) fully developed phase with external wind
perpendicular to the plane of the opening. The maximum temperatures inside the
compartment are also lower. The results furthermore indicated that, for the same total
heat release rate, increasing wind velocity corresponds to a reduction of indoor
temperatures.
Klopovic and Turan (2001) performed a series of compartment fire tests in different
outdoor wind conditions. The setup of two tests was identical. However, in both tests
there was a significant difference in wind velocity and wind direction. Despite this
difference, the temperatures and the mass loss rate inside the compartment were nearly
identical.
5.2 Single zone model with changed air
velocity
Single zone models allow the calculation of fire temperatures based on an equilibrium
of mass and energy. The first single zone models have been developed multiple
decennia ago (Magnussen and Thelandersson, 1970). The single zone model as
presented in Appendix A has previously been used to predict the indoor exposure
corresponding to tests A1, A2 and A3 (Table 1). The predictions were made prior to the
tests (Brandon 2017a, and Brandon 2017b) and comparisons after the test indicated the
accuracy of the predictions (Brandon, 2017c). Figure 11 shows comparisons between
the predicted temperatures and heat release rates of compartment fire Test A2 and the
measured temperatures and heat release rate during Test A2. The accuracy of the
previous predictions is considered sufficient for the current study. The single zone
model is based on equilibrium of energy and it is assumed that the temperatures
throughout the compartment are homogeneous. Use of the model requires an
estimation of the heat release rate corresponding to the combustible content of the
compartment. This heat release rate is taken as proposed by Hopkin et al. (2017). As
there is an equilibrium of energy flows, the (homogeneous) fire temperatures can be
calculated using the single zone model. In order to include the combustion energy
corresponding to exposed CLT an iterative calculation was performed of the following
calculations: (1) the charring rate as a consequence of the temperature exposure; (2) it’s

17
© RISE Research Institutes of Sweden
corresponding combustion energy and; (3) a recalculation of the temperature exposure
using the single zone model. The principles of the single zone model are summarized in
Annex A and used empirical expressions for the heat release rate corresponding to
combustible content of the compartment are discussed in Annex B.
For the current study the same model is used as was done for predictions of the tests by
Zelinka et al. (2018), but air flow parameters are adjusted to study the influence of a
reduced or increased air flow on the indoor conditions of compartment fires.
Figure 11: Predicted and measured heat release rate and gas temperatures (Brandon, 2017b) of test A2 (Zelinka et al. 2018)
5.2.1 Modelled compartments
Two different compartments are considered. Compartment 1 has the same properties
and dimensions as Test A2 (Table 1), including the surface area of exposed CLT.
Compartment 2 is similar, except for the dimensions of the opening (see Figure 12).
The dimensions of the openings in Compartment 2 correspond to the minimum
allowable window size for habitable spaces according to Section 402 of the
International Property Maintenance Code (ICC, 2013). Small ventilation openings
result an increased fire duration and increased damage in comparison with large
ventilation openings. Therefore, choosing an opening equal to the minimum allowable
window size, should lead to very conservative results. The opening of Compartment 2
corresponds to an opening factor of 0.048, which is significantly lower than the
smallest opening factor of 0.078 found in habitable compartments of a few modern
CLT buildings in Europe (Brandon et al. 2018), whereby it was assumed that the
windows break during the development of the fire. This indicates the conservativeness
of assuming the openings of Compartment 2.
0
5000
10000
15000
20000
25000
0 20 40 60 80 100 120
He
at r
ele
ase
rat
e (
kW)
Time (min)
HRR Total heat release rate
0
200
400
600
800
1000
1200
0 20 40 60 80 100 120
Tem
pe
ratu
re (
°C)
Time (min) Measured temperatureMeasured temperatureMeasured temperatureMeasured temperatureMeasured temperaturepredicted gas temperature110% of predicted avg temperature rise

18
© RISE Research Institutes of Sweden
Figure 12: Openings in the façade of Compartment 1 and Compartment 2.
* the opening is approximately equal to the minimum window size in habitable spaces (ICC, 2013)
5.2.2 Fuel parameters
The same parameters that were used in previous predictions (Brandon 2017a and
Brandon 2017b) are used for the current predictions. The fuel load density is
550 MJ/m2, which is similar to that of the test series by Zelinka et al. (2018), Table 1.
The maximum assumed combustion energy of the fuel per surface area (maximum heat
release rate density) is assumed to be 190 kW/m2 which corresponds to the total heat
release rate measured in (non-combustible) compartment Test A1.
5.2.3 Gypsum board fall-off and CLT delamination
Fall-off of the base layer of gypsum boards and CLT delamination during the hot
stages of the fire should be avoided. A recent study by Su et al. (2018b), showed that
this can be done for compartments with a small (severe) opening factor, which
approximately corresponds to Compartment 2 of this analysis. This was achieved by
using a suitable adhesive and 2 layers of 16 mm gypsum boards and fastening methods
specified in the report (Su et al. 2018b). The effect of wind on the falling behavior of
gypsum boards is not considered in this study. The effect of possible charring CLT
behind the gypsum board is also not considered.
5.2.4 Considered effects of external wind
Only a few studies have previously looked at the internal conditions of a
compartment that is exposed to external wind during a fire. The studies are limited to
the effect of wind perpendicular and parallel to the façade and a comparison between
two random wind conditions of compartments with openings on one side.
Facade of compartment 1
Window open & same as tests A1 to A3
Facade of compartment 2
Window open & minimum allowable window size*
Opening dim.: 2.50 m x 1.52 m
8 ft 2 in x 5 ft
Opening dim.: 2.50 m x 1.52 m
8 ft 2 in x 5 ft
Opening dim.: 3.7 m x 2.4 m
12 ft x 8 ft
Opening dim.: 3.7 m x 2.4 m
12 ft x 8 ft
Compartment inner dimensions: 9.1 m x 9.1 m 30 ft x 30 ft
Fuel load density:550 MJ/m2

19
© RISE Research Institutes of Sweden
CFD simulations by Zhao (2017) indicate that wind can hinder or block the outflow of
combustible gasses in a compartment with a ventilation opening on one side and wind
perpendicular to the plane of the opening. The reduced maximum temperatures and
corresponding heat release rates of compartment fires with external wind according to
Hu et al. (2017b) also correspond to a reduced in and outflow of air. Zhao (2017)
concluded that this did not occur if the wind was in the direction parallel to the façade.
Klopovic and Turan (2000) have performed to similar outdoor compartment fire tests
with significantly different wind conditions. They have indicated that the exposure of
the external fire plume to the façade was significantly different in both tests. However,
the measured mass loss rates and temperatures were almost identical. These findings
indicate that wind does not necessarily have an effect on the conditions of a
compartment fire.
Hu et al. (2017b) performed fire experiments of small compartments exposed to wind
perpendicular to the façade and determined an empirical expression of the heat release
rate required to reach a well-mixed state (a state in which the compartment
temperatures are approximately similar). Although the well- mixed state is not a
synonym of the fully developed state (in which internal combustion cannot be
increased due to lack of oxygen), the well-mixed state is regularly used to describe fully
developed fires. In order to get a rough indication of the relationship between the
external wind velocity (in the direction perpendicular to the façade) and a change of
volume flow, the expression by Hu et al. is used.
�̇�𝑤𝑒𝑙𝑙−𝑚𝑖𝑥𝑒𝑑
1500𝐴√𝐻= −0.47𝑈𝑊/√𝑔𝐻 + 1.7
Where is the �̇�𝑤𝑒𝑙𝑙−𝑚𝑖𝑥𝑒𝑑∗ heat release rate required for a well-mixed state (kW)
𝑈𝑊is the external wind velocity
𝑔 is the gravitational acceleration (9.8 m/s2)
𝐴 is the area of the opening (m2)
𝐻 is the height of the opening (m)
According to the expression, a wind velocity of 5 m/s or 11 mph perpendicular to the
plane of the façade opening leads to a reduction of heat release rate required to reach a
well-mixed state of 28% for Compartment 1 and 36% for Compartment 2. In order to
get a rough indication of the relationship between external wind velocity (in the
direction perpendicular to the façade) and the inflow of air, it is assumed that the
reduction of heat release rate required to get a fully developed stage is also 28 and 36%.
It should be noted that previous findings found in the literature are all based on
compartments with openings on one side. It is considered possible that the wind
increases the air volume flow of a compartment fire if there is a draft, for example in
compartments with two opposing openings. Therefore, the effect of both a decrease and
an increase of air flow into the compartment is studied.
In the case that the air flow is increased as a result of wind, additional effects could
potentially play a role. From tunnel fire tests it is known that an increased air flow can
increase the growth rate of fires by a factor of up to 10 (Ingason and Lönnermark,

20
© RISE Research Institutes of Sweden
2010). In compartments it is less likely that the wind has an influence on the fire
growth phase than in tunnels, as windows and doors in the façade are commonly
closed. However, to study the effect of increased fire growth, scenarios with a fire
growth rate of 0.047 kW/s2 (which was assumed for previous predictions) and 0.47
kW/s2 were considered for predictions.
In a fuel-controlled fire, the change of air flow does not affect the heat release rate of
most synthetic (melting) fuels. It was however seen in tunnel tests that wind can
increase the heat release rate of charring fuels such as timber. Ingasson and
Lönnermark showed that the heat release rate of porous wood cribs increased up to
70% in wind tunnel tests. It should be noted that the increase of wind in wood cribs can
cause flames to spread horizontally, increasing the exposure on the wood and
eventually resulting in higher heat release rates. This phenomenon would have less
effect if the exposure would be coming from multiple heat sources, which is the case in
most compartment fires. In order to get an indication of the effect of an increased
maximum heat release rate on the fire damage, scenarios of an unchanged heat release
rate and an increased heat release by 70% are considered.
5.2.5 Results and discussion
The predicted char depth after the fire is compared as it can be used as a measure of
fire damage. The effects of an increased and reduced airflow into the compartment on
the predicted char depth at the end of the fire are plotted in Figure 13. For an increased
air flow, additional predictions assuming an increased fire growth rate and an increased
heat release rate density of the combustible content (moveable fuel load) were included.
The results indicate that the effect of accelerated fire growth and increased heat release
rate density on the total char depth after the fire is negligible. Therefore, these effects
are not discussed any further.
For Compartment 1 (with the large opening), the effect of reducing the air flow in the
compartment by 40% results in an increase of charring depth of approximately 5 mm.
Using an expression by Hu et al. (2017b) and the assumption that a percentile
reduction of the required heat release to achieve a well-mixed compartment fire as a
consequence of external wind, is the same as the percentile reduction of the heat
release rate needed to achieve a fully developed fire, it is roughly estimated that an
airflow reduction of 30% corresponds to a wind velocity of 5 m/s or 11 mph in the
direction perpendicular to the façade/opening. Winds of the same velocity coming from
other directions are expected to have less impact on the final char depth.
For Compartment 2, which has the minimum allowable window (opening) dimensions,
the increase of the char depth is more significant and is approximately 14 mm for a
reduction of 40%. It should be noted that the opening factor of the compartment is at
the lower (worst case) limit and that this opening factor is significantly smaller than
those found in a brief study of modern CLT buildings (Brandon et al. 2018). To get an
indication of the structural damage imposed by the fire in this unlikely scenario, the
char depth after the fire is compared with an estimated char depth after exposure of a 2
hour standard fire resistance furnace test. In North America tall buildings generally
require a 2 hour fire resistance rating. As the char depth gives an indication of the
structural capacity, the results indicate that the predicted structural damage is lower

21
© RISE Research Institutes of Sweden
than the structural damage imposed in regulatory (2 hour) standard fire resistance
tests for tall buildings.
Figure 13: Predicted char depths corresponding to an increase or reduction of air flow into the compartment.
* using an expression by Hu et al. 2017b (corresponding to a compartment with one opening and a wind
direction perpendicular to the opening) and the assumption that a percentile reduction of the required
heat release to achieve a well-mixed compartment fire as a consequence of external wind, is the same as
the percentile reduction of the heat release rate needed to achieve a fully developed fire.
The change of airflow has a different impact on the temperatures of the two
compartments. Due to the small opening, the fire in Compartment 2 is ventilation
controlled after flashover according to the model. In this case an increase of airflow
increases the available oxygen in the oxygen-poor environment, which increases the
potential combustion energy (heat release rate) inside the compartment. At the same
time the convective losses of the compartment increase. However, according to the
model the increase of the heat release rate appears to be more significant than the
increase of convective heat losses and the predicted temperatures increase for an
increasing air flow (Figure 14). Due to the increase of heat release rate, the fuel burns
0
10
20
30
40
50
60
70
80
90
-40 -20 0 20 40
Ch
ar d
ep
th (
mm
)
Change of airflow into the compartment (%)
Char depth in standard fire resistancetests for a 2 hour fire resistance ratingfor non-delaminating CLT
Compartment 1: Char depth at the endof the fire
Compartment 1: Char depth at the endof the fire (assuming accelarated firegrowth and increased HRR)
Compartment 2: Char depth at the endof the fire
Compartment 2: Char depth at the endof the fire (assuming accelarated firegrowth)
rou
ghly
co
rres
po
nd
ing
to e
xter
nal
win
d o
f
5 m
/s o
r 1
1 m
ph
per
pen
dic
ula
r to
fac
ade*
Red
uct
ion
of
air
volu
me
flo
w c
ause
d b
y w
ind
Incr
eas
e o
f ai
r vo
lum
e
flo
w c
ause
d b
y w
ind

22
© RISE Research Institutes of Sweden
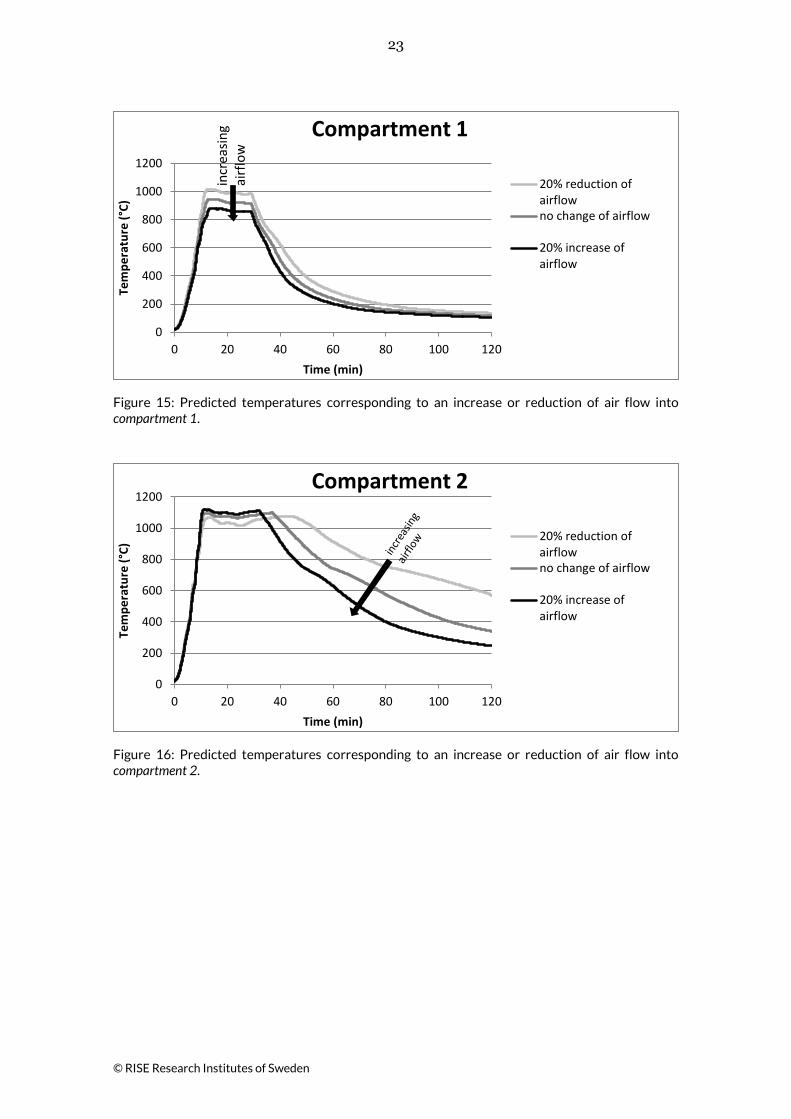
out more quickly and the fire becomes shorter (Figure 16). This explains the lower
predicted char depths for increased air flows.
According to the model the heat release rate of the movable content of Compartment 1
is not enough to consume all incoming oxygen. An increase of airflow into and out of
the compartment results in an increase of convective heat losses. Therefore, the
increase of airflow resulted in a reduction of temperatures in the compartment (see
Figure 14and Figure 15).
Figure 14: Predicted maximum temperatures corresponding to an increase or reduction of air flow into the compartment.
* using an expression by Hu et al. 2017b (corresponding to a compartment with one opening and a wind
direction perpendicular to the opening) and the assumption that a percentile reduction of the required
heat release to achieve a well-mixed compartment fire as a consequence of external wind, is the same as
the percentile reduction of the heat release rate needed to achieve a fully developed fire.
0
200
400
600
800
1000
1200
-40 -20 0 20 40
Max
imu
m t
em
pe
ratu
re (
°C)
Change of airflow into the compartment (%)
Compartment 1
Compartment 2
rou
ghly
co
rres
po
nd
ing
to e
xter
nal
win
d o
f
5 m
/s o
r 1
1 m
ph
per
pen
dic
ula
r to
fac
ade*
Red
uct
ion
of
air
volu
me
fl
ow
cau
sed
by
win
d
Incr
ease
of
air
volu
me
fl
ow
cau
sed
by
win
d
23
© RISE Research Institutes of Sweden
Figure 15: Predicted temperatures corresponding to an increase or reduction of air flow into compartment 1.
Figure 16: Predicted temperatures corresponding to an increase or reduction of air flow into compartment 2.
0
200
400
600
800
1000
1200
0 20 40 60 80 100 120
Tem
pe
ratu
re (
°C)
Time (min)
Compartment 1
20% reduction ofairflowno change of airflow
20% increase ofairflow
incr
easi
ng
ai
rflo
w
0
200
400
600
800
1000
1200
0 20 40 60 80 100 120
Tem
pe
ratu
re (
°C)
Time (min)
Compartment 2
20% reduction ofairflowno change of airflow
20% increase ofairflow

24
© RISE Research Institutes of Sweden
6 Conclusions This report summarizes a study that involved a review of relevant literature, analysis of
available façade test data and calculations using a single zone model. The study
considered a compartment with ventilation openings on one side (in the same external
wall) and different external wind conditions. These studies resulted in the following
findings regarding external exposure on the façade:
Previous studies indicate that the height of external fire plumes of
ventilation-controlled compartment fires reduce if external wind is exposed
on the opening.
Results of outdoor fire tests performed in different wind conditions indicate a
significantly reduced fire plume height in comparison with tests performed
without wind.
Results of outdoor fire tests performed in different wind conditions indicate
significant fluctuations of exposure and directions of external fire plumes that
are subjected to wind.
Regarding the effect of wind on the exposure inside the compartment, this study
resulted in the following findings:
Previous experiments involving under-ventilated fires in compartments with
one ventilation opening and wind exposure in the direction perpendicular to
the façade opening has shown a reduction of maximum temperatures inside a
compartment as well as a reduction of corresponding heat release rates with
increasing wind velocity.
Previous CFD simulations and experiments indicated a reduction of air flow
into and out of the fire compartment as a consequence of wind. It is, however,
considered possible that the wind increases the airflow in some
compartments if they have openings on more than one side.
A single zone model that includes the contribution of exposed wood in the
calculation of compartment temperatures indicated that the char depth after
a complete fire increases for a reduction of airflow into the compartment. The
model included the assumption that delamination of CLT and fall-off of the
base layer of gypsum board are prevented. The predicted char depths
corresponding to a compartment with large openings and a compartment
with minimum1 ventilation openings were, however, significantly lower than
char depths corresponding to standard fire resistance test exposure of 2
hours which is relevant for most tall building designs. The damage of
compartment fires is expected to be significantly higher if CLT delamination
is not prevented.
1minimum opening dimensions for habitable space according to current building regulations by
the ICC, assuming all windows break during the development of the fire.
25
© RISE Research Institutes of Sweden
References Abukar M (2018) BS 8414-2:2015 + A1:2017 Test on a ventilated façade system with
Kingspan Kooltherm insulation (100mm-thick) and Alpolic A2 panels (4mm-thick).
BRE Global Test Report. Report number P109938-1000 issue 2. Available online,
visited 13-11-2018: https://www.kingspan.com/gb/en-
gb/products/insulation/downloads/testing/bs-8414-2-p109938-1000
Anderson Johan, Boström Lars and McNamee, Robert, Fire Safety of Facades, SP
Rapport 2017:37 (2017)
Brandon D (2017a) ICC-TWB Fire demonstration test Performance expectations Test 2
Brandon D (2017b) ICC-TWB Fire demonstration test Performance expectations Test 3.
Report
Brandon D (2017c) Comparisons between predictions with results of compartment
tests ATF1 ATF2 and ATF3
Brandon D, Just A, Andersson P, Östman B (2018) Mitigation of fire spread in multi-
storey timber buildings – statistical analysis and guidelines for design. RISE Report
2018:43.
BRE (2015) BS 8414-1:2015 test referred to as DCLG test 5. BRE Global Client Report.
Report number B137611-1037 (DCLG test 5) Issue: 1.2. Available online, visited 13-11-
2018: https://www.gov.uk/government/publications/fire-test-report-dclg-bs-8414-
test-no5
BS 8414 (2015) Fire performance of external cladding systems. British Standards
Institution.
Chen Z. (2008). Design fires for motels and hotels. Master thesis. Department of Civil
and Environmental Engineering Carleton University. Ottawa-Carleton Institute of Civil
and Environmental Engineering, Ottawa, Ontario, Canada.
Clarke P (2005) BS8414 Part 1: 2002 Test on a Phenolic Insulated Rain screen System.
Kingspan Test report number 220876. Available online, visited 13-11-2018:
https://www.kingspan.com/gb/en-gb/products/insulation/downloads/testing/bs-
8414-1-220876
Clarke P (2015) BS8414-2: 2005 Test on a Kingspan K15 insulated system with a
ventilated Terracotta tile rain screen. BRE Global Test Report. Report number
297099. Available online, visited 13-11-2018: https://www.kingspan.com/gb/en-
gb/products/insulation/downloads/testing/bs-8414-2-297099
Clarke P (2016) BS 8414-2: 2005 Test on a Kingspan K15 insulated system with a
ventilated ArGeTon Terracotta tile rain screen. BRE Global Test Report. Report
number P100184-1000 issue 3. Available online, visited 13-11-2018:
https://www.kingspan.com/gb/en-gb/products/insulation/downloads/testing/bs-
8414-2-297099
Farrington D (2017) BS 8414-1:2015 + A1:2017 test on a ventilated façade system with
Kingspan Kooltherm K15 insulation and Alpolic/fr panels. BRE Global Test Report.

26
© RISE Research Institutes of Sweden
Report number P107017-1000 issue 1. Available online, visited 13-11-2018:
https://www.kingspan.com/gb/en-gb/products/insulation/downloads/testing/bs-
8414-1-p107017-1000
Farrington D (2018) BS 8414-1:2015 + A1:2017 test on a ventilated façade system with
Kingspan Kooltherm K15 insulation and Alpolic/fr panels. BRE Global Test Report.
Report number P109939-1000 issue 1. Available online, visited 13-11-2018:
https://www.kingspan.com/gb/en-gb/products/insulation/downloads/testing/bs-
8414-1-p109939-1000
Farrington D (2018) BS8414-2: 2005 Test on a Kingspan K15 insulated system with a
ventilated Terracotta tile rain screen. BRE Global Test Report. Report number
303930 Issue 3. Available online, visited 13-11-2018:
https://www.kingspan.com/gb/en-gb/products/insulation/downloads/testing/bs-
8414-2-303930
Frangi, A., & Fontana, M. (2005). Fire Performance of Timber Structures under
Natural Fire Conditions. Fire Safety Science Symposium 8: 279-290. IAFSS, Beijing,
China.
Guoxiang Zhao (2017) Numerical Study on Under-Ventilated Enclosure Fires and Fire
Spread on Building Facades. PhD Thesis, University of Gent, Belgium. ISBN 978-94-
6355-079-6.
Hakkarainen T. (2002) Post-flashover fire in light and heavy timber construction
compartments. Journal of Fire Sciences, 20 (2002): 133-175.
Hopkin D, Anastasov S, Brandon D (2017) Reviewing the veracity of a zone model
based approach for the assessment of enclosures formed of exposed CLT. In
Applications of Fire Engineering. CRC Press/Balkema, the Netherlands.
Howard S (2015) BS 8414-2:2005 + A1:2017 Test on a Carea Insulated façade system.
BRE Global Test Report. Report number 302995 issue 1. Available online, visited 13-11-
2018: https://www.kingspan.com/gb/en-
gb/products/insulation/downloads/testing/bs-8414-2-302995
Hu L, Hu K., Ren F. Sun X. (2017a) Façade flame height ejected from an opening of fire
compartment under external wind. Fire safety journal 92 (2017): pp 151-158.
Hu L., Ren F., Hu K., Tang F., Lu K. (2017b) An experimental study on temperature
evolution inside compartment with fire growth and flame ejection through an opening
under external wind. Proceedings of the Combustion Institute 36, pp: 2955-2962.
ICC (2013) 2012 International Property Maintenance Section 402 Light. Fifth Printing.
Janssens M. (2015) CLT compartment fire test results. Video presentation.
http://www.awc.org/Code-Officials/2015-IBC-Code-Changes (accessed on
2015/10/26)
Klopovic S, Turan ÖF (2001) A comprehensive study of externally venting flames – Part
II: Plume envelope and centre-line temperature comparisons, secondary fires, wind
effects and smoke management system. Fire Safety Journal 36 pp: 135-172.

27
© RISE Research Institutes of Sweden
Lalu O (2017) BS 8414-1:2015 + A1:2017 test on ventilated façade system with
Kingspan (K15) thermal insulation and ACM panels Booth Muirie BML400 rivet fixed.
BRE Global Test Report. Report number P109971-1000 issue 1.0. Available online,
visited 13-11-2018: https://www.kingspan.com/gb/en-
gb/products/insulation/downloads/testing/bs-8414-1-p109971-1000
Lalu O (2018) BS 8414-1:2015 + A1:2017 test on ventilated façade system with
phenolic thermal insulation and ACM (ALPOLIC/A2) Cassette panels BML 100 Hook
On. BRE Global Test Report. Report number P109973-1000 issue 1.0. Available online,
visited 13-11-2018: https://www.kingspan.com/gb/en-
gb/products/insulation/downloads/testing/bs-8414-1-p109973-1000
Li X., Zhang X., Hadjisophocleus G., McGregor C. (2014) Experimental study of
combustible and non-combustible construction in a natural fire. Fire Technology,
2014.
Magnusson S.E. and Thelandersson S. (1970) Temperature – Time Curves of Complete
Process of Fire Development. Acta Polytechnica Scandinavica, Civil Engineering and
Building Construction Series 65, Stockholm, Sweden.
McGregor, C.J. (2014) Contribution of cross-laminated timber panels to room fires.
Master thesis. Department of Civil and Environmental Engineering Carleton
University. Ottawa-Carleton Institute of Civil and Environmental Engineering, Ottawa,
Ontario, Canada.
McIntosh C (2015) BS 8414-2:2005 Test on a Gebrik Rainsreen Cladding System. BRE
Global Test Report. Report number P100838-1000 issue 2. Available online, visited 13-
11-2018: https://www.kingspan.com/gb/en-
gb/products/insulation/downloads/testing/bs-8414-2-p100838-1000
Ren F., Hu L., Sun X., Hu K. (2018) An experimental study on vertical temperature
profile of façade dire plume ejected from compartment with an opening subjected to
external wind normal to façade. International Journal of Thermal Sciences 130, pp:
94-99.
Rockett J.A. (1976) Fire Induced Gas Flow in an Enclosure. Comb. Sci. and Tech, 12: pp
165-175
Staffansson L. (2010) Selecting Design Fires. Lund University Report 7032, Sweden.
Su J., Lafrance P-S., Hoehler M., Bundy M. (2018) Cross Laminated Timber
Compartment Fire Tests for Research on Fire Safety Challenges of Tall Wood Buildings
– Phase 2.
Su J., Leroux P., Lafrance P-S., Berzins R., Gibbs E., Weinfurter M. (2018b) Fire testing
of rooms with exposed wood surfaces in encapsulated mass timber construction. NRC
CNRC Report A1-012710.1.
Su J.Z. and Lougheed G.D. (2014) Report to research consortium for wood and wood
hybrid mid-rise buildings – Fire safety summary – Fire research conducted for the
project on mid-rise wood construction. National Research Council Canada, Client
report: A1-004377.1, Ottawa, Ontario, Canada.

28
© RISE Research Institutes of Sweden
Wickström U. (2016) Temperature calculation in Fire Safety Engineering. Springer
International Publishing, Switzerland.

© RISE Research Institutes of Sweden
Through our international collaboration programmes with academia, industry, and the public
sector, we ensure the competitiveness of the Swedish business community on an international
level and contribute to a sustainable society. Our 2,200 employees support and promote all
manner of innovative processes, and our roughly 100 testbeds and demonstration facilities are
instrumental in developing the future-proofing of products, technologies, and services. RISE
Research Institutes of Sweden is fully owned by the Swedish state.
RISE Research Institutes of Sweden AB
Box 5608, SE-114 86 STOCKHOLM, Sweden
Telephone: +46 10 516 50 00
E-mail: [email protected], Internet: www.ri.se
Safety
RISE Report 2018:72
ISBN:

© RISE Research Institutes of Sweden
Annex A - Single zone model for
compartments with exposed wood A single zone model based on a previous model presented by Brandon (2016) which
was later revised by Hopkin et al (2017) is implemented in the study of the main report.
The model was developed to function as a design tool for structural assessment of
timber members exposed to natural compartment fires.
The model assumes a well-mixed state, in which the temperatures are similar
throughout the compartment. This is generally not valid for the pre-flashover phase
and fires in large compartments. However, the main report indicated that the pre-
flashover phase had negligible influence on the predicted total damage after the full
duration of a flashover fire, as it was shown that the predicted structural damage is
relatively insensitive to the assumed fire growth rate. For the purpose of the model it is
therefore considered reasonable to simply assume a fire growth rate and a well-mixed
pre-flashover phase. The use of the model is not recommended for compartments with
a floor area exceeding 500 m2 or 5400 ft2, which is in line with standardized calculation
methods that also assume a well-mixed state (EN 1991-1-2).
The model involves an iterative calculation of the fuel contribution of the timber.
Starting with a given heat release rate curve (heat release rate versus time, which is
discussed in Annex B) that corresponds to a flashover fire in compartments with non-
combustible lining materials, every iteration involves the following calculations in
chronological order:
calculation of the fire temperature curve (fire temperature versus time) inside
the compartment from the heat release rate curve, using a single zone model;
calculation of the temperatures in the exposed timber structure, using a finite
element or finite difference transient state heat transfer model;
calculation of the temperatures in the protected timber structure, using a finite
element or finite difference transient state heat transfer model;
calculation of the char rates of all timber walls ceiling and floor assuming that
timber chars at 300°C;
calculation of the combustion energy release rate (heat release rate) from the
charring rate;
calculation of the new heat release rate curve by the summation of the heat
release rate corresponding to a compartment with non-combustible linings and
the heat release rate of the timber. The new heat release rate curve is used for
the next iteration.
The iterations should be repeated until the difference between the heat release rate
curves of two subsequent iterations is negligible.
In addition to the assumptions generally made using single-zone models, the presented
method involves the following main additional assumptions:
© RISE Research Institutes of Sweden
the movable fuel (combustible room content) is sufficient to cause a flashover
fire on its own, if it were positioned in a similar compartment with non-
combustible linings;
the combustible gasses that come to exist during heating of timber, combust at
or near the moment they come to exist. If there is not enough oxygen inside the
compartment, this combustion will take place outside of the compartment and
increase the external fire plume. If there is oxygen left inside the compartment,
this combustion will take place inside the compartment.
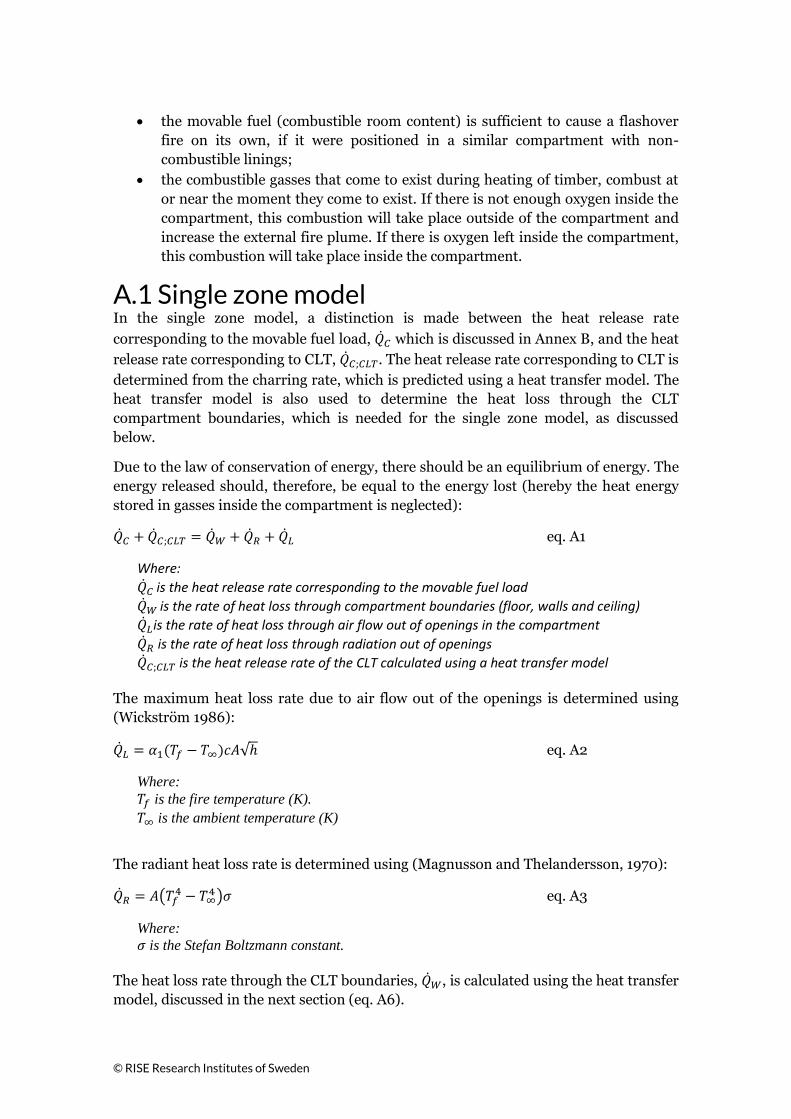
A.1 Single zone model In the single zone model, a distinction is made between the heat release rate
corresponding to the movable fuel load, �̇�𝐶 which is discussed in Annex B, and the heat
release rate corresponding to CLT, �̇�𝐶;𝐶𝐿𝑇. The heat release rate corresponding to CLT is
determined from the charring rate, which is predicted using a heat transfer model. The
heat transfer model is also used to determine the heat loss through the CLT
compartment boundaries, which is needed for the single zone model, as discussed
below.
Due to the law of conservation of energy, there should be an equilibrium of energy. The
energy released should, therefore, be equal to the energy lost (hereby the heat energy
stored in gasses inside the compartment is neglected):
�̇�𝐶 + �̇�𝐶;𝐶𝐿𝑇 = �̇�𝑊 + �̇�𝑅 + �̇�𝐿 eq. A1
Where:
�̇�𝐶 is the heat release rate corresponding to the movable fuel load
�̇�𝑊 is the rate of heat loss through compartment boundaries (floor, walls and ceiling)
�̇�𝐿is the rate of heat loss through air flow out of openings in the compartment
�̇�𝑅 is the rate of heat loss through radiation out of openings
�̇�𝐶;𝐶𝐿𝑇 is the heat release rate of the CLT calculated using a heat transfer model
The maximum heat loss rate due to air flow out of the openings is determined using
(Wickström 1986):
�̇�𝐿 = 𝛼1(𝑇𝑓 − 𝑇∞)𝑐𝐴√ℎ eq. A2
Where:
𝑇𝑓 is the fire temperature (K).
𝑇∞ is the ambient temperature (K)
The radiant heat loss rate is determined using (Magnusson and Thelandersson, 1970):
�̇�𝑅 = 𝐴(𝑇𝑓4 − 𝑇∞
4 )𝜎 eq. A3
Where:
𝜎 is the Stefan Boltzmann constant.
The heat loss rate through the CLT boundaries, �̇�𝑊, is calculated using the heat transfer
model, discussed in the next section (eq. A6).

© RISE Research Institutes of Sweden
The single zone model uses a simple algorithm to solve the fire temperatures. The fire
temperature is determined by substituting eq. A2 and A3) into eq. A1 and solving to
determine 𝑇𝑓 (Brandon, 2016):
𝑇𝑓 =�̇�𝐶+�̇�𝐶;𝐶𝐿𝑇−�̇�𝑊−�̇�𝑅
𝑐𝛼1𝐴√ℎ+ 𝑇∞ eq. A4
In the calculation, the fire temperature is determined for every time step. At each time
step, the values of �̇�𝑊 and �̇�𝑅 are determined and used as an input for the subsequent
time step.
For the study discussed in the main paper �̇�𝐶 is determined according to Annex B and
�̇�𝐶;𝐶𝐿𝑇 is determined iteratively as discussed in the next section.
A.2 Heat transfer in walls, floor and ceiling The calculation of the contribution of CLT (or other exposed timber linings) �̇�𝐶;𝐶𝐿𝑇is
determined using a 1-dimensional heat transfer model to predict the heat transfer from
the exposed side of the wall to the unexposed side. On both sides the following
boundary condition is assumed to account for convection and radiation:
)()( 44sfsfn TTTThq eq. A5
Where:
qn is the net heat flux through the surface, h is a convection coefficient, ε is the effective emissivity, Ts is the surface temperature.
The used convection coefficient and emissivity are 25 W/m2K and 0.8, respectively,
which are in accordance with EN 1991-1-2 (2002) and EN 1994-1-2 (2004).
Heat transfer/ temperature calculations should be performed for all wall and floor
assemblies with different built-ups, including those that have gypsum board protection.
The heat transfer calculations are performed for two reasons:
1. determine the total heat loss through the compartment walls, floor and ceiling;
2. determine the heat release rate of the CLT from the charring rate, which is
determined from the temperature development in the CLT.
The total heat loss through wall, floor and ceiling assemblies is calculated using:
�̇�𝑤 = ∑ �̇�𝑛;𝑖 ∗ 𝐴𝑖𝑚𝑖=1 eq. A6
Where:
�̇�𝑛;𝑖 is the net heat flux per surface area through assembly i
𝐴𝑖 is the surface area of assembly i
𝑚 is the number of assemblies
Using the char temperature of wood, which is approximately 300°C (Buchanan, 2002;
EN1995-1-2:2004), the charring rate during the whole fire can be estimated from the
calculated timber temperatures. Results of previous studies (Schmid et al., 2016) have
shown a constant heat release rate per millimeter of charring of 5.39 MJ/m2mm. This

© RISE Research Institutes of Sweden
relationship is hereby used to determine the heat release rate from the calculated
charring rate:
�̇�𝐶;𝐶𝐿𝑇 = ∑ 5.39 ∗�̇�𝑖
60∗ 𝐴𝑖 (𝑀𝑊)𝑚
𝑖=1 eq. A7
Where:
�̇�𝑖 is the charring rate (mm/min)
𝐴𝑖 is the surface area of assembly i (m2)
The effective thermal properties of timber (CLT) and the gypsum board used for the
predictions in the main text are shown in Table A.1 and A.2. The thermal properties for
temperatures in-between the temperature values of the table were linearly interpolated.
Table A.1: Effective thermal properties of CLT material implemented for predictions made for the main report
Table A.2: Effective thermal properties of CLT material implemented for predictions made for the main report
Tempe-rature (°C)
Conduc-tivity (W/mK)
Specific Heat (J/kgK)
Density (kg/m3)
Tempe-rature (°C)
Conduc-tivity (W/mK)
Specific Heat (W/mK)
Density (kg/m3)
20 0.07 1347 494.6 20 0.40 960 896
98 0.06 987 494.6 70 0.40 960 896
99 0.73 4006 494.6 100 0.27 960 896
120 0.75 6075 494.6 130 0.13 14900 829.7
121 0.20 2577 494.6 140 0.13 25200 808.2
200 0.67 2300 494.6 150 0.13 21700 785.8
250 0.82 3671 460 170 0.13 960 741.9
300 0.24 1936 375.9 600 0.13 960 741
350 0.12 4305 257.2 720 0.33 4360 740.1
400 0.14 3388 187.9 750 0.38 960 695.3
500 0.15 4472 163.2 1000 0.80 960 695.3
600 0.53 7799 138.5 1200 2.37 960 695.3
800 0.82 9192 128.6
1220 1.37 9192 1
A.3 Calculation procedure
The calculation of the fire temperature, Tf, using eq. A4 requires knowledge of the heat
release rate corresponding to the CLT, �̇�𝐶;𝐶𝐿𝑇 . However, �̇�𝐶;𝐶𝐿𝑇 is calculated using Tf as
was discussed in section A.2. This problem is solved iteratively, starting the first
iteration with�̇�𝐶;𝐶𝐿𝑇 = 0 . In the first iteration, the fire temperatures correspond to the
heat release rate of the movable fuel load only. The CLT temperatures and charring rates are determined based on those temperatures. The corresponding heat release rate
of CLT �̇�𝐶;𝐶𝐿𝑇is used to calculate the fire temperature in the subsequent iteration. This
allows the same process and the calculation of �̇�𝐶;𝐶𝐿𝑇 for the second and subsequently
third calculations and so forth. The iterative procedure is stopped when the change of
�̇�𝐶;𝐶𝐿𝑇in subsequent iterations is negligible.

© RISE Research Institutes of Sweden
Annex B – Generation of the heat
release rate curve corresponding to a
flashover fire in a non-combustible
compartment. The heat release rate (HRR) corresponding to solely the movable fire load (combustible
content of the compartment) is required as model input for the single-zone model
discussed in Annex B. This information should be based on the fuel type, quantity of
fuel and the ventilation condition in the compartment. Examples of methods to
generate a suitable heat release rate curve are given by Chen (2008) and Staffansson
(2010). The method used in the main report was solely based on previous flashover fire
tests in non-combustible compartments, with typical apartment furniture as fuel and is
discussed here
B.1 Review of Experimental Data The heat release rate corresponding to solely the variable fire load is needed as input
for the model presented herein. Therefore, it is important that the fire tests used for
correlation excluded involvement of combustible structures in the fire.
B.2 Maximum heat release rate and external
flaming Numerous correlations exist in the literature describing the maximum heat release rate
that can be attained within a small enclosure in ventilation-controlled conditions.
Herein, the common correlation noted in textbooks (Wickström, 2016) is adopted, i.e.:
�̇�𝐶;𝑚𝑎𝑥;𝑖𝑛𝑡 = α1 ∗ α2 ∗ 𝐴𝑜√𝐻𝑜 eq. B1
Where α2 is the energy released per unit mass of inflowing air (3.01 * 106 W s/kg, if
supply air has an oxygen content of 23%). The factor α1is a flow rate coefficient and is
often assumed to be 0.50 or 0.45 kg/(s m5/2). According to Rockett (1976) the value of
this coefficient ranges between 0.40 and 0.61 kg/(s m5/2). In this study the value of α1is
chosen empirically, using the series of post-flashover fire tests of compartments with
non-combustible linings shown in Table B.1. As will be shown in B.6, a value of
α1=0.40 corresponds well with experimental results.
During the post-flashover fire, combustion can take place outside the ventilation
opening, where outflowing combustibles will enter an oxygen-rich environment. The
extend of external flaming is commonly expressed using an excess fuel fraction, α3. The
excess fuel fraction can be defined as the ratio between the interior heat release rate
and the exterior heat release rate.
�̇�𝐶;𝑚𝑎𝑥;𝑡𝑜𝑡𝑎𝑙 = �̇�𝐶;𝑚𝑎𝑥;𝑖𝑛𝑡 ∗ (1 + α3) eq. B2

© RISE Research Institutes of Sweden
Where �̇�𝐶;𝑚𝑎𝑥;𝑡𝑜𝑡𝑎𝑙 is the maximum heat release rate of internal and external
combustion.
B.3 Fire growth rate The model presented in this paper aims to give a practical solution for the structural
assessment of compartments exposed to fires. In the main text of this report it was
shown that the predicted damage after the full duration of an uncontrolled flashover
fire is practically independent of the fire growth rate. As the pre-flashover fire is not the
focus of the model, a fast fire growth rate of 0.047 kW/s2, which corresponds well with
the experimental results of flashover compartment fire tests of Table B.1, is assumed.
B.4 Combustion efficiency In most fires, not all of the combustibles completely burn out. The combustion
efficiency is the ratio between the variable fire load and the total heat released during a
fire and can be determined as follows:
F
dttQt
C
04
)(
eq. B3
Where )(tQC is the heat release rate as a function of time, t;
F is the total variable fire load.
All tests included in Table B.1 were stopped after a significant period of fire decay.
However, none of the tests was performed until the heat release rate completely
diminished. Therefore, it is not possible to determine the exact combustion efficiency
from these results. However, it is determined that the combustion efficiency should be
approximately 0.8. Therefore, a combustion efficiency of 0.8 is chosen for this study.
B.5 The decay phase and the start of decay The start of a decay phase is often assumed to occur after a fraction of the fuel load, α5,
is consumed by the fire. The reduction of the heat release rate is commonly assumed to
follow a parabolic or linear function. However, assuming these types of functions
generally leads to sudden a stop of the fire, which is too abrupt in comparison with
compartment fires. Therefore, this study implements a hyperbolic function for the
decay phase, which has the following form:
eq. B4
Where )(; tQ decC is the heat release rate of the variable fire load during the decay phase as
a function of time
t is the time
x and y are determined using the following boundary conditions:
)(
1)(;
ytxtQ decC

© RISE Research Institutes of Sweden
FdttQdect
C 54
0
)( as the total area under the heat release rate curve should
correspond to the fuel load and the combustion efficiency.
totalCdecC QtQ max;;)( as the heat release declines during the decay phase, from the
heat release rate corresponding to the fully developed phase to zero.
FdttQ
dect
decC )1()( 54;
, as the area under the heat release rate curve of the
decay phase should correspond to fuel left at the start of the decay and the
combustion efficiency.
B.6 Empirical constants Values of α1 to α5 and the maximum heat release rate per floor area (heat release rate
density) of movable fuel (furnishings etc.) are needed for the model. Some, but not all
of these can be found in design standards. The values used in the main text of the
report are determined empirically from compartment tests as discussed here. Only tests
that involved a full or nearly full duration of a flashover fire in compartments with
typical apartment furniture were considered.
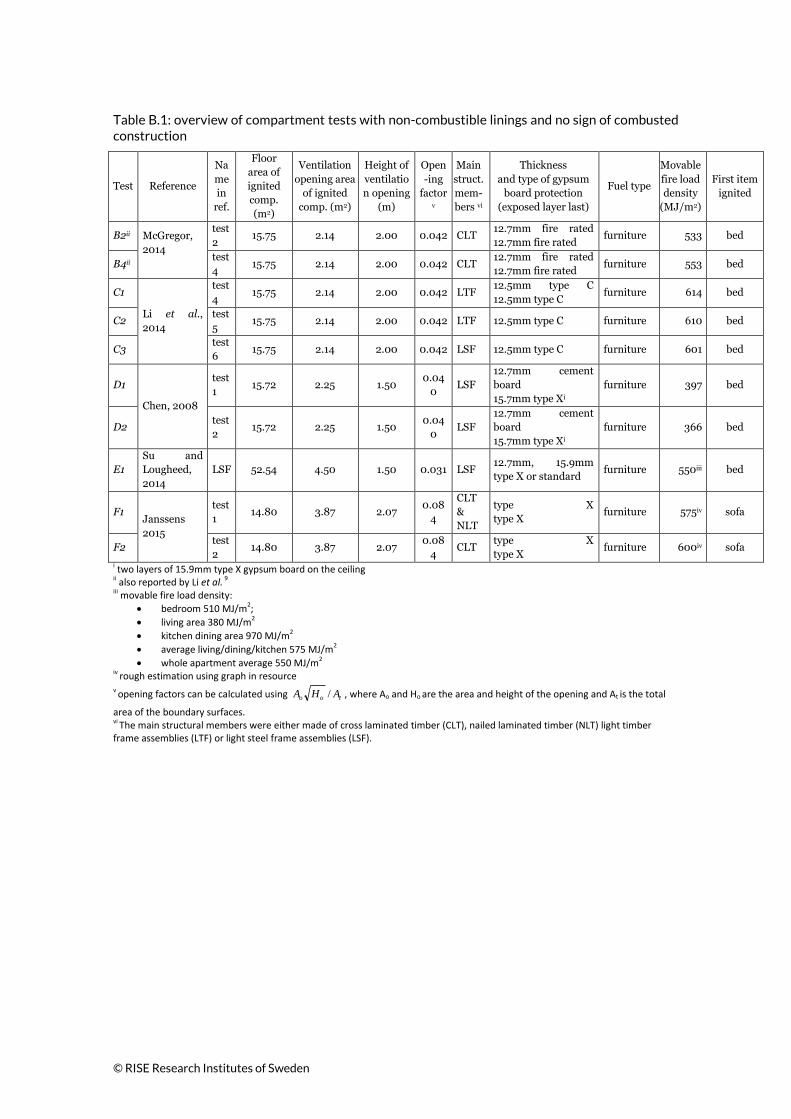
The experimental heat release rate curves for the purpose of benchmarking herein are
those indicated in Table B.1, which were reported by McGregor (2014) and Li et al.
(2014), Su and Lougheed (2014), Janssens (2015) and Chen (2008). Whilst some
charring of the CLT was noted in some of these experiments, the contribution of the
CLT to the fire loading was nominal in contrast to that of the variable fire loading.
Therefore, the heat release rate measured can be considered representative of the heat
release rate of the furniture within the fire enclosure. The design fire input parameters
are chosen empirically, so that the predicted heat release rate curves correspond to
those of the tests in Table B.1- The resulting parameters are summarised in Table B.2.
Figure 17, Figure 18, Figure 19 and Figure 20 contrast the experimental data and the
model input time-HRR relationship.
© RISE Research Institutes of Sweden
Table B.1: overview of compartment tests with non-combustible linings and no sign of combusted construction
Test Reference
Na
me
in
ref.
Floor
area of
ignited
comp.
(m2)
Ventilation
opening area
of ignited
comp. (m2)
Height of
ventilatio
n opening
(m)
Open
-ing
factorv
Main
struct.
mem-
bers vi
Thickness
and type of gypsum
board protection
(exposed layer last)
Fuel type
Movable
fire load
density
(MJ/m2)
First item
ignited
B2ii McGregor,
2014
test
2 15.75 2.14 2.00 0.042 CLT
12.7mm fire rated
12.7mm fire rated furniture 533 bed
B4ii test
4 15.75 2.14 2.00 0.042 CLT
12.7mm fire rated
12.7mm fire rated furniture 553 bed
C1
Li et al.,
2014
test
4 15.75 2.14 2.00 0.042 LTF
12.5mm type C
12.5mm type C furniture 614 bed
C2 test
5 15.75 2.14 2.00 0.042 LTF 12.5mm type C furniture 610 bed
C3 test
6 15.75 2.14 2.00 0.042 LSF 12.5mm type C furniture 601 bed
D1
Chen, 2008
test
1 15.72 2.25 1.50
0.04
0 LSF
12.7mm cement
board
15.7mm type Xi
furniture 397 bed
D2 test
2 15.72 2.25 1.50
0.04
0 LSF
12.7mm cement
board
15.7mm type Xi
furniture 366 bed
E1
Su and
Lougheed,
2014
LSF 52.54 4.50 1.50 0.031 LSF 12.7mm, 15.9mm
type X or standard furniture 550iii bed
F1 Janssens
2015
test
1 14.80 3.87 2.07
0.08
4
CLT
&
NLT
type X
type X furniture 575iv sofa
F2 test
2 14.80 3.87 2.07
0.08
4 CLT
type X
type X furniture 600iv sofa
i two layers of 15.9mm type X gypsum board on the ceiling ii also reported by Li et al. 9 iii movable fire load density:
bedroom 510 MJ/m2;
living area 380 MJ/m2
kitchen dining area 970 MJ/m2
average living/dining/kitchen 575 MJ/m2
whole apartment average 550 MJ/m2 iv rough estimation using graph in resource v opening factors can be calculated using too AHA / , where Ao and Ho are the area and height of the opening and At is the total
area of the boundary surfaces. vi The main structural members were either made of cross laminated timber (CLT), nailed laminated timber (NLT) light timber frame assemblies (LTF) or light steel frame assemblies (LSF).

© RISE Research Institutes of Sweden
Figure 17 – Experimental and model input heat release rates of test D1 and D2. Experimental results are reproduced from Chen (2018).
Figure 18 – Experimental and model input heat release rates of Test B2, B4, C1, C2, C3. Experimental results are reproduced from McGregor (2014) and Li et al. (2014).
Figure 19 – Experimental and model input heat release rates of test E1. Experimental results are reproduced from Su and Lougheed (2014).
Figure 20 – Experimental and model input heat release rate of test F1 and F2. Experimental results are reproduced from Janssens (2015).
0
2
4
6
0 15 30
He
at r
ele
ase
rat
e (
MW
)
Time (min)
Test D1, reproduced from Chen (2008)
Test D2, reproduced from Chen (2008)
Predicted HRR for test D1 and D2
0
2
4
6
8
0 30 60 90
He
at r
ele
ase
rat
e (
MW
)
Time (min)
Test B2, reproduced from McGregor (2013)Test A4, reproduced from McGregor (2013)Test C1, reproduced from Li et al. (2014)Test C2, reproduced from Li et al. (2014)Test C3, reproduced from Li et al. (2014)Predicted HRR for test B2 B4 C1 C2 C3
0
2
4
6
8
10
12
0 60 120 180
He
at r
ele
ase
rat
e (
MW
)
Time (min)
Test E1, reproduced from Su and Lougheed (2014)
Predicted HRR for test E1
0
2
4
6
8
0 30 60
He
at r
ele
ase
rat
e (
MW
)
Time (min)
Test F2, reproduced from Janssens (2015)
Test F1, reproduced from Janssens (2015)
Predicted HRR for test F1 and F2

© RISE Research Institutes of Sweden
Table B.2: Empirically determined design fire curve parameters for compartments with typical apartment furniture and non-combustible linings
Fire growth rate (kW/s2) 0.047
Flow rate coefficient, α1 (kg/(s m5/2)) 0.45
Excess fuel fraction, α3 (-) 0.1
Combustion efficiency, α4 (-) 0.8
Fraction of fuel load at start of decay, α5 (-) 0.5
Maximum heat release rate density of movable fuel (kW/m2)
Note: Only tests F1 and F2 were fuel controlled according to the equations given in this
Annex. The maximum heat release rate density was, therefore, only correlated to 2 tests. The
maximum heat release rate density used for predictions in the main text is different as it was
directly determined from test A1.
320