sagepoint telecom q3 10 m&a reviewsagepointadvisors.com/files/download/sagepoint telecom q3 10...
TRANSCRIPT

SagePoint Telecom ServicesM&A R i f Q3 2010M&A Review for Q3 2010
An Analysis of M&A Activity and ValuationAn Analysis of M&A Activity and Valuation Metrics in the Telecommunication & Data
Center Services Market Segments
For more information contact David Michaels at (858) 926‐5950 or [email protected]
Table of Contents
S ti PageSection
SagePoint’s Viewpoint – Key Takeaways
Internet, Communications & IT Infrastructure (“ICIT”) Universe
Page
3‐4
I e e , o u i a io I I a u u e ( I I ) U i e e• M&A Dollar Volume• M&A Transaction Volume• Median M&A Revenue Multiples
567p
Telecommunication & Data Center Services• M&A Dollar Volume
M&A T ti V l89• M&A Transaction Volume
• Transaction Volume by Deal Size • Median M&A Revenue Multiples• Most Active Buyers
910‐1112‐1314• Most Active Buyers
• M&A Transaction Spotlight• Appendix: Detailed M&A Data
1415‐2223‐31
2
Introduction to SagePoint 32‐39
Telecommunication & Data Center Services M&A – Q3 2010
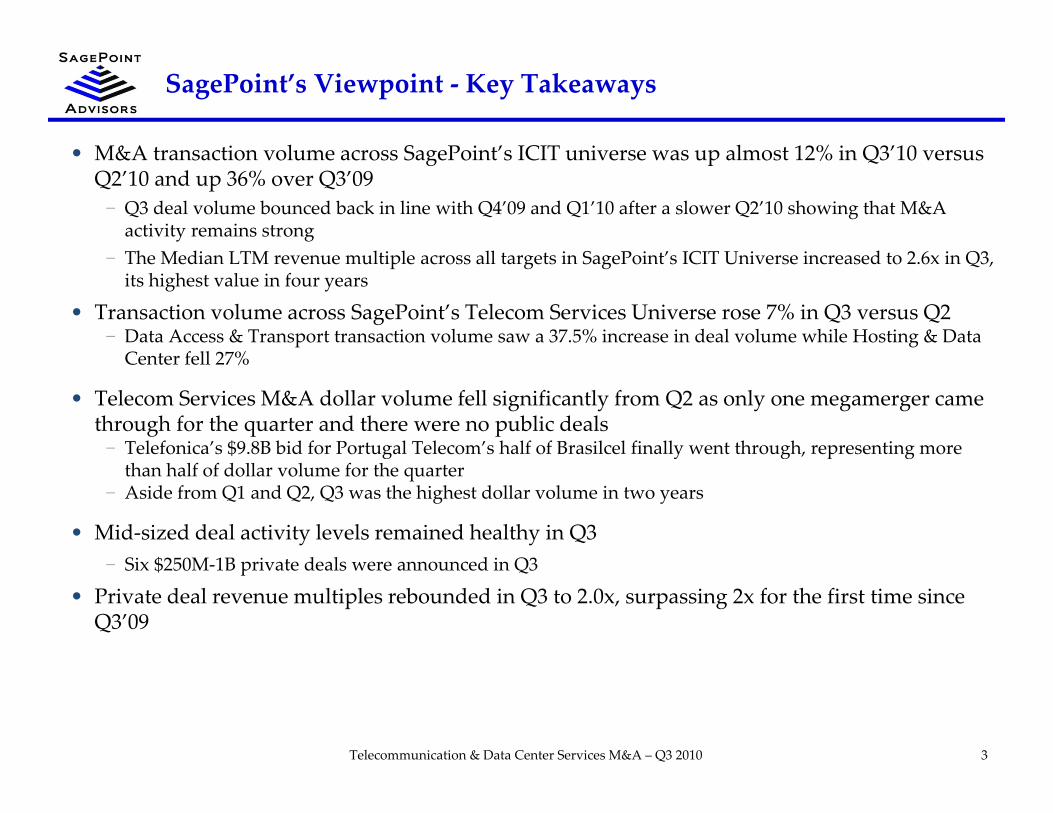
SagePoint’s Viewpoint ‐ Key Takeaways
• M&A transaction volume across SagePoint’s ICIT universe was up almost 12% in Q3’10 versus• M&A transaction volume across SagePoint’s ICIT universe was up almost 12% in Q3’10 versus Q2’10 and up 36% over Q3’09− Q3 deal volume bounced back in line with Q4’09 and Q1’10 after a slower Q2’10 showing that M&A activity remains strongTh M di LTM lti l ll t t i S P i t’ ICIT U i i d t 2 6 i Q3− The Median LTM revenue multiple across all targets in SagePoint’s ICIT Universe increased to 2.6x in Q3, its highest value in four years
• Transaction volume across SagePoint’s Telecom Services Universe rose 7% in Q3 versus Q2− Data Access & Transport transaction volume saw a 37.5% increase in deal volume while Hosting & Data Ce te fell 27%Center fell 27%
• Telecom Services M&A dollar volume fell significantly from Q2 as only one megamerger came through for the quarter and there were no public deals− Telefonica’s $9.8B bid for Portugal Telecom’s half of Brasilcel finally went through, representing more g y g p gthan half of dollar volume for the quarter
− Aside from Q1 and Q2, Q3 was the highest dollar volume in two years
• Mid‐sized deal activity levels remained healthy in Q3Si $250M 1B i t d l d i Q3− Six $250M‐1B private deals were announced in Q3
• Private deal revenue multiples rebounded in Q3 to 2.0x, surpassing 2x for the first time since Q3’09
3Telecommunication & Data Center Services M&A – Q3 2010

SagePoint’s Viewpoint ‐ Key Takeaways Continued
• The most active buyers over the last 24 months include just one tier 1 carrier France Telecom• The most active buyers over the last 24 months include just one tier 1 carrier, France Telecom, while Russian carriers are showing a lot of activity− Omnicity, a wireless ISP in the Midwest which is rolling up other wireless ISPs in the region, leads deal activity with 9 deals in the past two years, though just two small deals in ‘10
− OAO Svyazinvest MegaFon and Sistema are Russia based telecom providers active with smaller deals− OAO Svyazinvest, MegaFon and Sistema are Russia‐based telecom providers active with smaller deals− Daisy Group is a UK‐based, business focused telecom operator that has made several small acquisitions− PE players have been very active with 4 of the top 7 biggest deals going to financial buyers
• Notable Q3 M&A transactions include:− Telefonica’s $9.8B acquisition of Portugal Telecom’s half of Brasilcel finally ends the bidding saga− CVC Capital Partners’ $3.3B acquisition of Sunrise Communications− Windstream’s $778M acquisition of Q‐Comm− Court Square Capital Partners’ $500M acquisition of FibertechCourt Square Capital Partners $500M acquisition of Fibertech− GI Partners’ $475M acquisition of SoftLayer Technologies− PAETEC’s $460M acquisition of Cavalier Telephone− Welsh, Carson, Anderson & Stowe’s $400M acquisition of Peak 10
• SagePoint expects strong M&A activity to continue through 2011− Lumpiness of megamergers will continue to cause large swings in dollar volume, but SagePoint expects to see 80‐100+ deals a quarter in Telecom with revenue multiples in the low 2s
− Companies will continue to utilize M&A to add scale and drive growth, particularly in emerging growth areas, and carrier consolidation is bound to continue with more $1B+ transactions in Q4 and 2011
− It will be interesting to see if financial players continue to get more aggressive in the Telecom M&A landscape going forward
4Telecommunication & Data Center Services M&A – Q3 2010
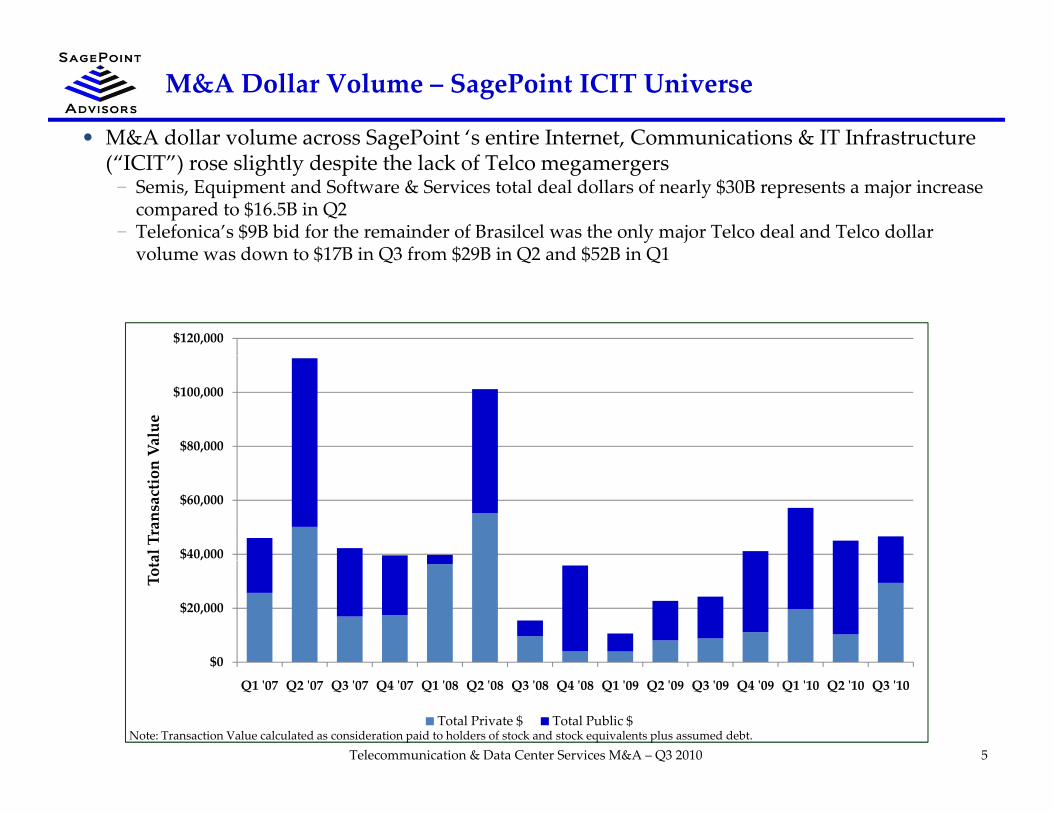
M&A Dollar Volume – SagePoint ICIT Universe
• M&A dollar volume across SagePoint ‘s entire Internet, Communications & IT Infrastructure (“ICIT”) rose slightly despite the lack of Telco megamergers − Semis, Equipment and Software & Services total deal dollars of nearly $30B represents a major increase compared to $16.5B in Q2
− Telefonica’s $9B bid for the remainder of Brasilcel was the only major Telco deal and Telco dollar volume was down to $17B in Q3 from $29B in Q2 and $52B in Q1volume was down to $17B in Q3 from $29B in Q2 and $52B in Q1
$120,000
$80,000
$100,000
Value
$40,000
$60,000
al Transaction
$0
$20,000
Tota
5Note: Transaction Value calculated as consideration paid to holders of stock and stock equivalents plus assumed debt.
Telecommunication & Data Center Services M&A – Q3 2010
$0
Q1 ʹ07 Q2 ʹ07 Q3 ʹ07 Q4 ʹ07 Q1 ʹ08 Q2 ʹ08 Q3 ʹ08 Q4 ʹ08 Q1 ʹ09 Q2 ʹ09 Q3 ʹ09 Q4 ʹ09 Q1 ʹ10 Q2 ʹ10 Q3 ʹ10
Total Private $ Total Public $

M&A Transaction Volume – SagePoint ICIT Universe
• M&A transaction volume across SagePoint’s ICIT universe was up almost 12% in Q3’10 versus g p QQ2’10 and up 36% over Q3’09− Q3 deal volume bounced back in line with Q4’09 and Q1’10 after a slower Q2’10 as M&A activity remains strong
− Software & Services had the highest growth while Equipment was the only segment with lower volumes
• SagePoint expects M&A transaction volume to remain relatively robust through 2010 and 2011
500
350
400
450
ns
150
200
250
300
Transaction
0
50
100
150
6Telecommunication & Data Center Services M&A – Q3 2010
0
Q1 ʹ07 Q2 ʹ07 Q3 ʹ07 Q4 ʹ07 Q1 ʹ08 Q2 ʹ08 Q3 ʹ08 Q4 ʹ08 Q1 ʹ09 Q2 ʹ09 Q3 ʹ09 Q4 ʹ09 Q1 ʹ10 Q2 ʹ10 Q3 ʹ10
Telecom Services Software & Services Equipment Semiconductors

M&A Median LTM Revenue Multiple – SagePoint ICIT Universe
• The Median LTM revenue multiple across all targets in SagePoint’s ICIT Universe increased to p g g2.6x in Q3, its highest value in four years− This increase in revenue multiples caps off a dramatic turnaround from late 2008 and early 2009 as distressed sales become less prevalent and buyers show a willingness to pay a premium for sought after targetsIt i t t l h th th Q3 k i t i bl b ti th h it i lik l th t− It is not yet clear whether the Q3 peak is sustainable or an aberration though it is more likely that revenue multiples will settle closer to their historical levels near 2x in the coming quarters
3.0x
2.4x
2.0x 2.0x 2.0x 1.9x2.1x
2.6x
2 0x
2.5x
ultiple
1.7x 1.8x
1.5x
1.3x1.1x
1.8x1.6x
.9
1.5x
2.0x
Revenue Mu
.
0.8x
0.5x
1.0x
Median
7
0.0x
Q1 ʹ07 Q2 ʹ07 Q3 ʹ07 Q4 ʹ07 Q1 ʹ08 Q2 ʹ08 Q3 ʹ08 Q4 ʹ08 Q1 ʹ09 Q2 ʹ09 Q3 ʹ09 Q4 ʹ09 Q1 ʹ10 Q2 ʹ10 Q3 ʹ10
Telecommunication & Data Center Services M&A – Q3 2010
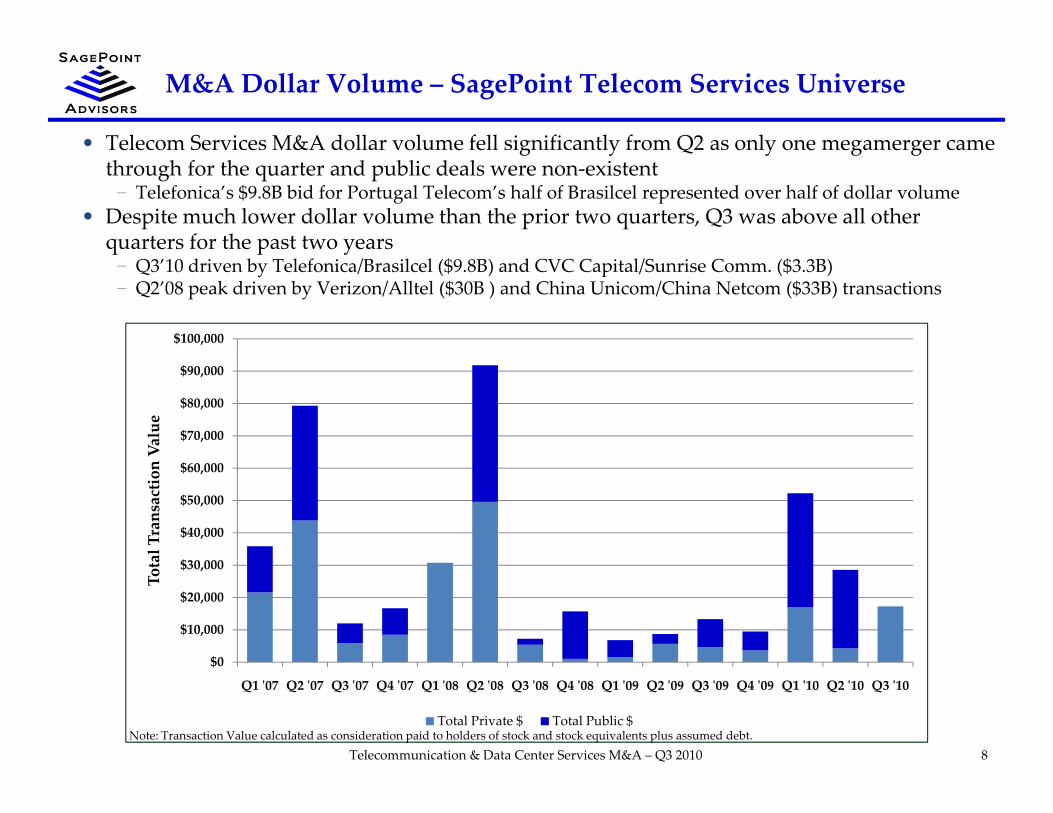
M&A Dollar Volume – SagePoint Telecom Services Universe
• Telecom Services M&A dollar volume fell significantly from Q2 as only one megamerger came e e o e i e A o a o u e e ig i i a y o Q a o y o e ega e ge a ethrough for the quarter and public deals were non‐existent− Telefonica’s $9.8B bid for Portugal Telecom’s half of Brasilcel represented over half of dollar volume
• Despite much lower dollar volume than the prior two quarters, Q3 was above all other quarters for the past two yearsq p y− Q3’10 driven by Telefonica/Brasilcel ($9.8B) and CVC Capital/Sunrise Comm. ($3.3B)− Q2’08 peak driven by Verizon/Alltel ($30B ) and China Unicom/China Netcom ($33B) transactions
$100,000
$70,000
$80,000
$90,000
Value
$30 000
$40,000
$50,000
$60,000
al Transaction
$0
$10,000
$20,000
$30,000
Tota
8Note: Transaction Value calculated as consideration paid to holders of stock and stock equivalents plus assumed debt.
Telecommunication & Data Center Services M&A – Q3 2010
$0
Q1 ʹ07 Q2 ʹ07 Q3 ʹ07 Q4 ʹ07 Q1 ʹ08 Q2 ʹ08 Q3 ʹ08 Q4 ʹ08 Q1 ʹ09 Q2 ʹ09 Q3 ʹ09 Q4 ʹ09 Q1 ʹ10 Q2 ʹ10 Q3 ʹ10
Total Private $ Total Public $

M&A Transaction Volume – Telecom Services by Segment
• Telecom Services M&A transaction volume rose 7.4% in Q3 versus Q2Q Q• International LEC/ICP and Wireless segments both saw four more deals in Q3 than Q2• Data Access & Transport deal volume rose 37.5% versus a Q2 that saw a sharp drop in deal
activity from Q1’10 and Q4’09 levels• Hosting & Data Center deal volume fell 27% but remains double Q3’09 as deal activity in the g Q y
segment has been very strong over the past twelve months
180
100
120
140
160
tions
40
60
80
100
Transact
0
20
Q1 ʹ07 Q2 ʹ07 Q3 ʹ07 Q4 ʹ07 Q1 ʹ08 Q2 ʹ08 Q3 ʹ08 Q4 ʹ08 Q1 ʹ09 Q2 ʹ09 Q3 ʹ09 Q4 ʹ09 Q1 ʹ10 Q2 ʹ10 Q3 ʹ10
Diversified ‐ International Diversified ‐ US LEC/ICP ‐ International
9Telecommunication & Data Center Services M&A – Q3 2010
Diversified International Diversified US LEC/ICP InternationalLEC/ICP ‐ US Data Access & Transport Hosting & Data CenterVoIP Cable & Satellite TV Satellite Voice & DataWireless ‐ International Wireless ‐ US Wireless ‐ Towers
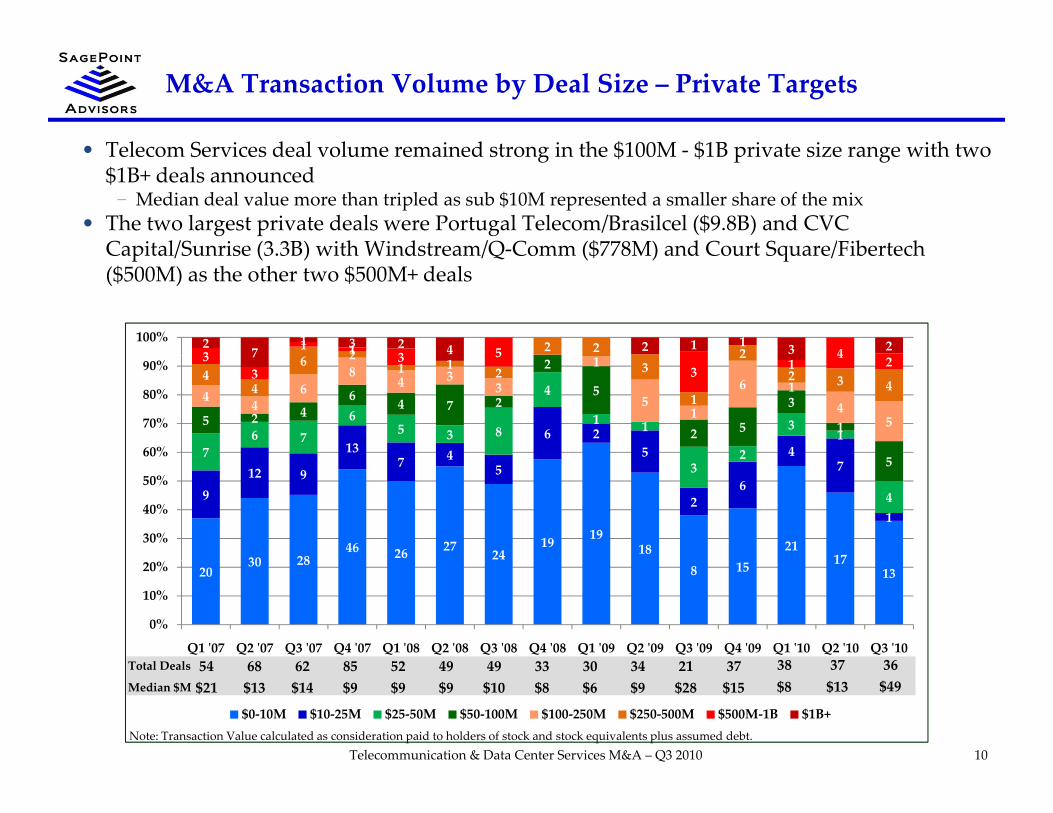
M&A Transaction Volume by Deal Size – Private Targets
• Telecom Services deal volume remained strong in the $100M $1B private size range with two• Telecom Services deal volume remained strong in the $100M ‐ $1B private size range with two $1B+ deals announced− Median deal value more than tripled as sub $10M represented a smaller share of the mix
• The two largest private deals were Portugal Telecom/Brasilcel ($9.8B) and CVCCapital/Sunrise (3 3B) with Windstream/Q‐Comm ($778M) and Court Square/FibertechCapital/Sunrise (3.3B) with Windstream/Q Comm ($778M) and Court Square/Fibertech($500M) as the other two $500M+ deals
2 2 2 231 1 3 5 4
27
1 3 2 4 2 1 1 3 2100%
137 4
6 25 47
6 76
5 3 8
4
1 1
2
31
5 2 46 4 7 2
2
5
2 5
3
1
5
44
68
4 33
1
51
6 14
5
44
6 21 1 2 3
1
22 3 4
33
3 53 1
4 27
60%
70%
80%
90%
30 2846 26 27 24
19 1918 21
17
912 9
7 45
26
7
1
32
4
5
30%
40%
50%
2030 28
8 15 1713
0%
10%
20%
Q1 ʹ07 Q2 ʹ07 Q3 ʹ07 Q4 ʹ07 Q1 ʹ08 Q2 ʹ08 Q3 ʹ08 Q4 ʹ08 Q1 ʹ09 Q2 ʹ09 Q3 ʹ09 Q4 ʹ09 Q1 ʹ10 Q2 ʹ10 Q3 ʹ1062 85 52 49 49 33 30 34 21 3868T t l D l 54 37 3637
10Note: Transaction Value calculated as consideration paid to holders of stock and stock equivalents plus assumed debt.
Telecommunication & Data Center Services M&A – Q3 2010
$0‐10M $10‐25M $25‐50M $50‐100M $100‐250M $250‐500M $500M‐1B $1B+
62 85 52 49 49 33 30 34 21 3868Total Deals
Median $M $14 $9 $9 $9 $10 $8 $6 $9 $28 $8$1354$21
37$15
36$49
37$13
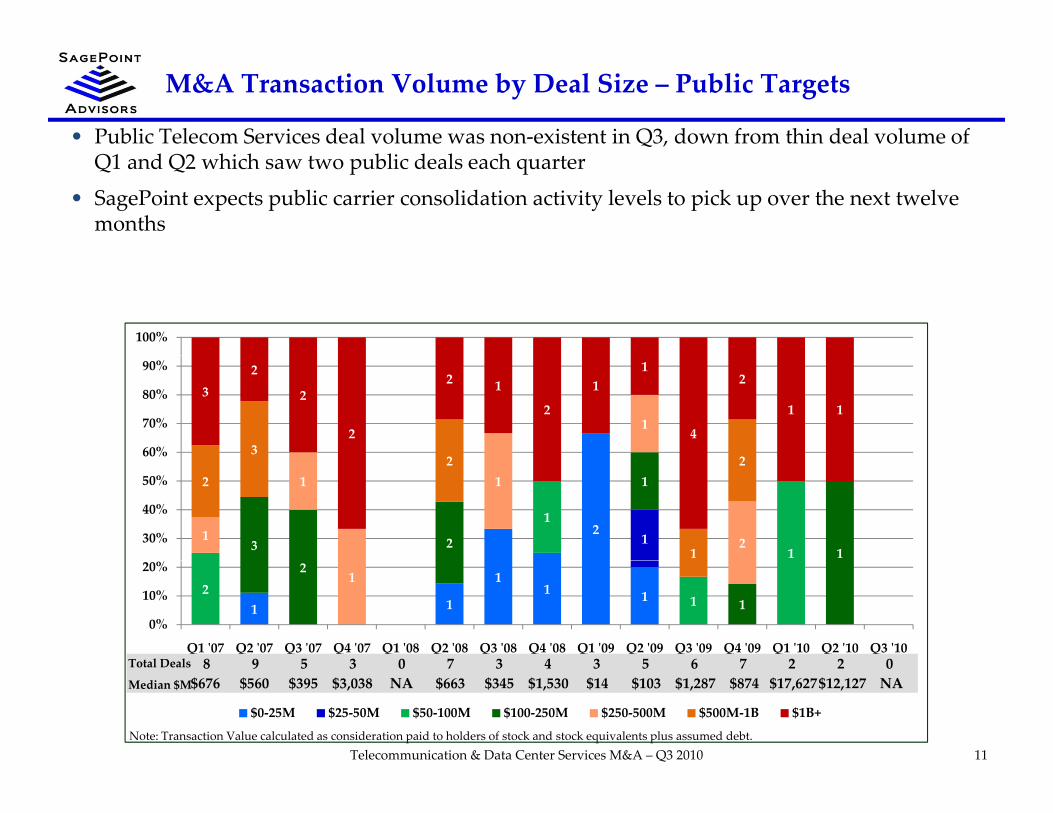
M&A Transaction Volume by Deal Size – Public Targets
• Public Telecom Services deal volume was non‐existent in Q3, down from thin deal volume of Q1 and Q2 which saw two public deals each quarter
• SagePoint expects public carrier consolidation activity levels to pick up over the next twelve months
100%
1
32 2
32
2
2
2 1
2
11
4
2
1 1
60%
70%
80%
90%
21
1
13 2
1
11
1 1
2
22
1
2
30%
40%
50%
1 1
11 12
1
2
1
1
0%
10%
20%
Q1 ʹ07 Q2 ʹ07 Q3 ʹ07 Q4 ʹ07 Q1 ʹ08 Q2 ʹ08 Q3 ʹ08 Q4 ʹ08 Q1 ʹ09 Q2 ʹ09 Q3 ʹ09 Q4 ʹ09 Q1 ʹ10 Q2 ʹ10 Q3 ʹ105 3 0 7 3 4 3 5 6 79Total Deals 8 2 02
11Telecommunication & Data Center Services M&A – Q3 2010Note: Transaction Value calculated as consideration paid to holders of stock and stock equivalents plus assumed debt.
$0‐25M $25‐50M $50‐100M $100‐250M $250‐500M $500M‐1B $1B+
Total Deals5 3 0 7 3 4 3 5 6 79Total Deals
Median $M $395 $3,038 NA $663 $345 $1,530 $14 $103 $1,287 $874$5608
$6762
$17,6270NA
2$12,127
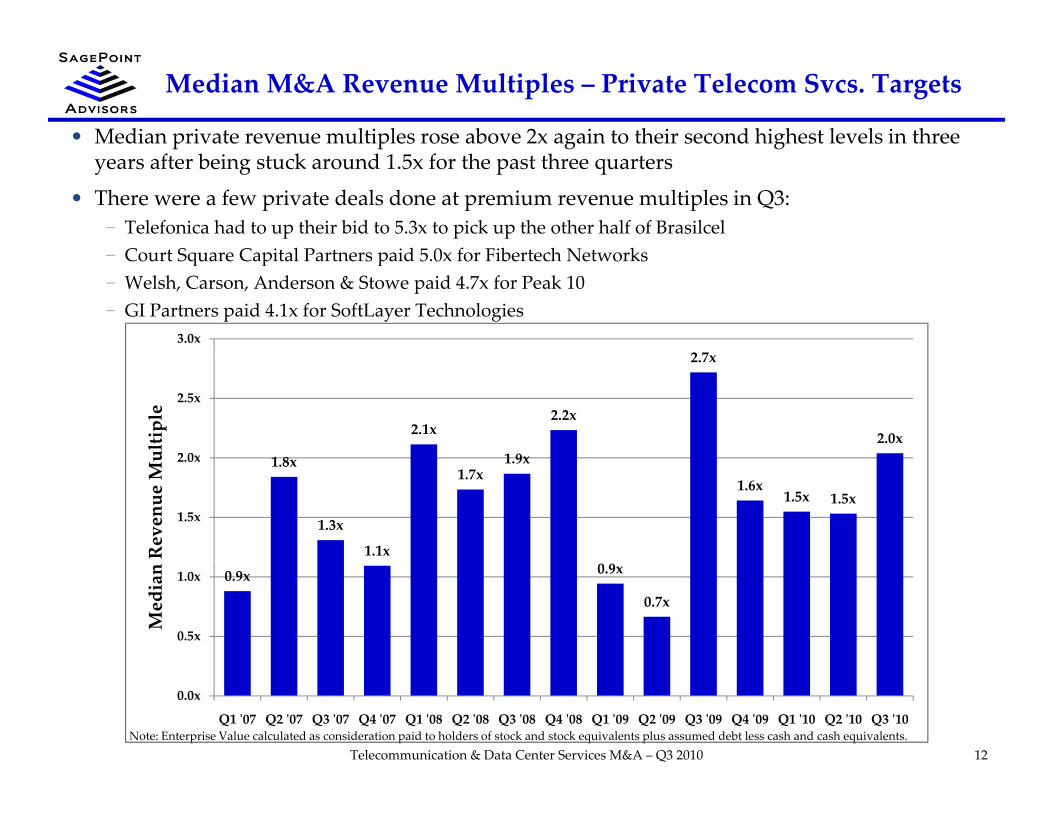
Median M&A Revenue Multiples – Private Telecom Svcs. Targets
• Median private revenue multiples rose above 2x again to their second highest levels in three years after being stuck around 1.5x for the past three quarters
• There were a few private deals done at premium revenue multiples in Q3:− Telefonica had to up their bid to 5.3x to pick up the other half of BrasilcelCourt Square Capital Partners paid 5 0x for Fibertech Networks− Court Square Capital Partners paid 5.0x for Fibertech Networks
− Welsh, Carson, Anderson & Stowe paid 4.7x for Peak 10− GI Partners paid 4.1x for SoftLayer Technologies
2 7x3.0x
1 8
2.1x
1 9x
2.2x
2.7x
2.0x2 0x
2.5x
ultiple
1.8x
1.3x
1.1x
1.7x1.9x
1.6x1.5x 1.5x
1.5x
2.0x
Revenue Mu
0.9x 0.9x
0.7x
0.5x
1.0x
Median
12Telecommunication & Data Center Services M&A – Q3 2010Note: Enterprise Value calculated as consideration paid to holders of stock and stock equivalents plus assumed debt less cash and cash equivalents.
0.0x
Q1 ʹ07 Q2 ʹ07 Q3 ʹ07 Q4 ʹ07 Q1 ʹ08 Q2 ʹ08 Q3 ʹ08 Q4 ʹ08 Q1 ʹ09 Q2 ʹ09 Q3 ʹ09 Q4 ʹ09 Q1 ʹ10 Q2 ʹ10 Q3 ʹ10
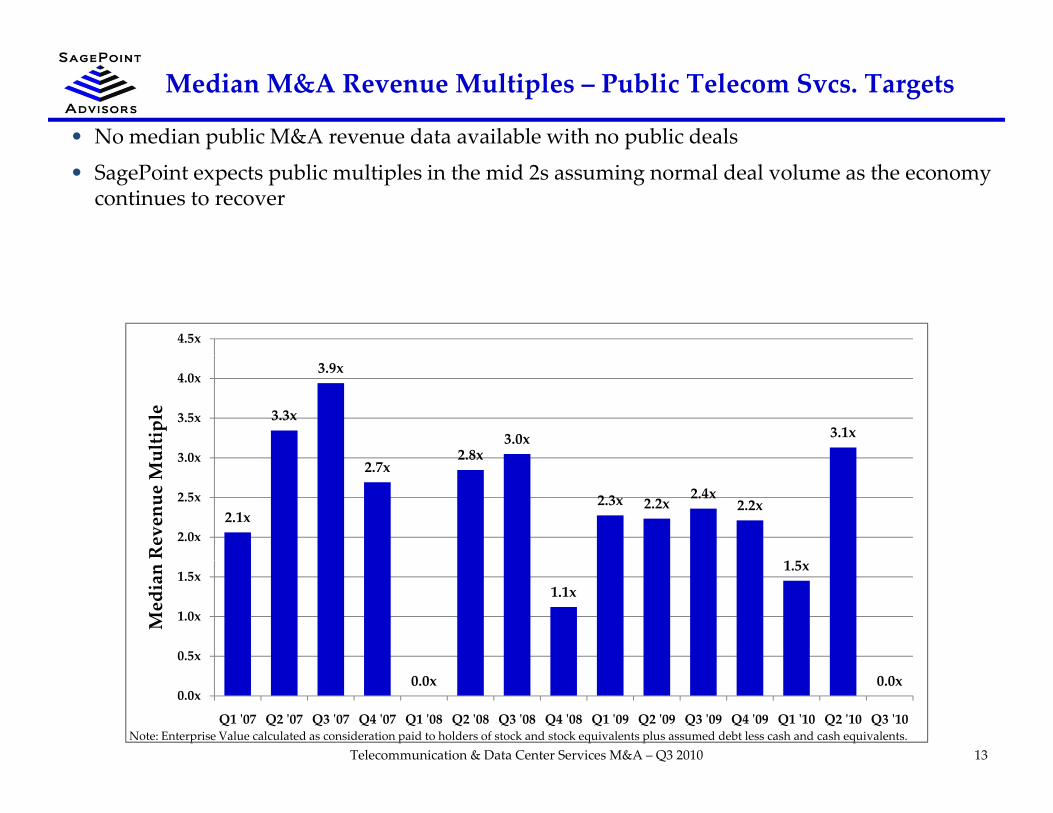
Median M&A Revenue Multiples – Public Telecom Svcs. Targets
• No median public M&A revenue data available with no public deals
• SagePoint expects public multiples in the mid 2s assuming normal deal volume as the economy continues to recover
4.5x
3.3x
3.9x
2.8x3.0x 3.1x
3 0x
3.5x
4.0x
ultiple
2.1x
2.7x2.8x
2.3x 2.2x2.4x
2.2x
1
2.0x
2.5x
3.0x
Revenue Mu
1.1x
1.5x
0.5x
1.0x
1.5x
Median
13Telecommunication & Data Center Services M&A – Q3 2010Note: Enterprise Value calculated as consideration paid to holders of stock and stock equivalents plus assumed debt less cash and cash equivalents.
0.0x 0.0x0.0x
Q1 ʹ07 Q2 ʹ07 Q3 ʹ07 Q4 ʹ07 Q1 ʹ08 Q2 ʹ08 Q3 ʹ08 Q4 ʹ08 Q1 ʹ09 Q2 ʹ09 Q3 ʹ09 Q4 ʹ09 Q1 ʹ10 Q2 ʹ10 Q3 ʹ10

Most Active Telecom Services Buyers – Last 2 Years
# of Deals# of Deals Company Telco Comm Telecom Services Transactions
9 9 7/21/10 ‐ RAA Services ‐ $0.1M 6/8/09 ‐ Rushville Wireless & Clinton Wireless ‐ NA2/3/10 ‐ Digital Network Solutions, Inc. ‐ NA 3/18/09 ‐ Cue Connex, LLC ‐ $0.1M12/23/09 ‐ USppp, Inc. ‐ NA 10/31/08 ‐ North Central Communications ‐ NA10/19/09 ‐ Solutions Unltd (Fixed Wireless) ‐ NA 10/31/08 ‐ Forepoint Networks LLC ‐ NA6/17/09 ‐ Culcom, LLC ‐ NA
8 9 4/1/10 ‐ LINKdotNET, Inc. ‐ $130M 11/5/09 ‐ T‐Mobile (UK) Limited ‐ NA2/18/10 ‐ Mauritius Telecom Limited ‐ NA 2/22/09 ‐ LINKdotNET ‐ NA11/25/09 ‐ KPN Belgium Business S.S. ‐ $97.9M 12/18/08 ‐ Telemedia Group S.A. ‐ NA11/25/09 ‐ Sunrise Communications AG ‐ $2 260M 10/19/08 ‐ Orange Uganda Limited ‐ NA11/25/09 Sunrise Communications AG $2,260M 10/19/08 Orange Uganda Limited NA
8 8 7/12/10 ‐ Severen‐Telekom ZAO ‐ NA 12/10/09 ‐ Yuzhno‐Uralskaya Telephone Co. ‐ NA5/27/10 ‐ Teleset Networks PLC ‐ $161M 9/17/09 ‐ CJSC Ulyanovsk‐GSM ‐ NA4/30/10 ‐ OAO Dagsvyazinform ‐ $20.6M 9/7/09 ‐ Sky Link Joint Stock Company ‐ NA12/15/09 ‐ Southern Ural Telephone Company ‐ NA 6/8/09 ‐ Gorodskaya Telephonnaya Svyaz ‐ $11.1M
7 7 9/28/10 ZAO Peterstar $215M 4/6/10 OOOVyborgtelecom NA7 7 9/28/10 ‐ ZAO Peterstar ‐ $215M 4/6/10 ‐ OOO Vyborgtelecom ‐ NA8/4/10 ‐ JSC Chermetresurs ‐ NA 5/27/09 ‐ Synterra CJSC ‐ NA4/26/10 ‐ Vimpel (Fibre Backbone Ntwks) ‐ NA 3/31/09 ‐ 51% of Aquaphone & Ostelecom ‐ $27.6M4/19/10 ‐ Northwest Telecom & Informatics ‐ NA
6 6 6/22/10 ‐ murphx Innovative Solutions Ltd ‐ $7.1M 8/14/09 ‐ Redstone Telecom Ltd. ‐ $28.1M2/17/10 ‐ BNS Telecom Group plc ‐ $20.7M 7/1/09 ‐ FREEDOM4 Group plc ‐ NA2/8/10 ‐ Managed Communications ‐ $9.9M 1/23/09 ‐ 4Com Ltd. ‐ $7.5M
5 6 5/20/10 ‐ Penza‐Telekom Zao ‐ $20.0M 11/25/09 ‐ OAO Eurotel ‐ $110M4/26/10 ‐ Sky Link Joint Stock Company ‐ NA 6/18/09 ‐ COMSTAR‐United TeleSystems ‐ $2,580M1/29/10 ‐ Sky Link Joint Stock Company ‐ NA
14Note: Transaction Value calculated as consideration paid to holders of stock and stock equivalents plus assumed debt.
Telecommunication & Data Center Services M&A – Q3 2010
Q3 M&A Transaction Spotlight – Telecom Services
Deal Rationale/Commentary
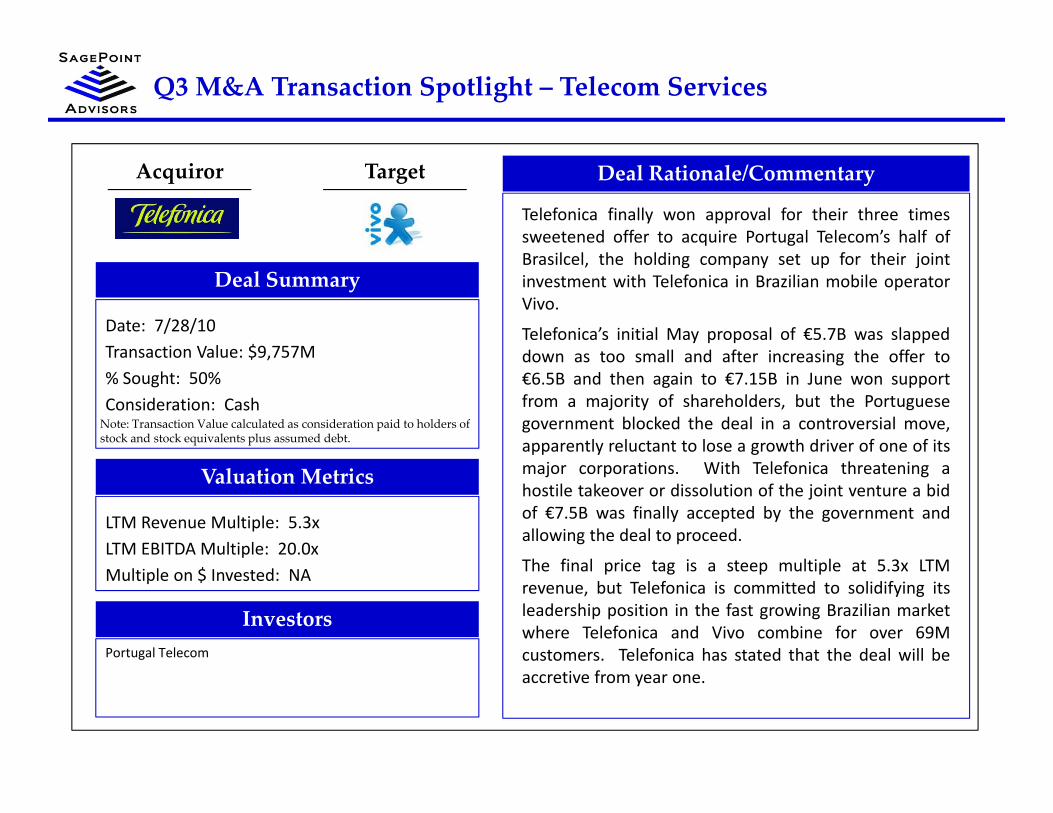
Telefonica finally won approval for their three timessweetened offer to acquire Portugal Telecom’s half of
il l h h ldi f h i j i
Acquiror Target
Brasilcel, the holding company set up for their jointinvestment with Telefonica in Brazilian mobile operatorVivo.
Telefonica’s initial May proposal of €5.7B was slappeddown as too small and after increasing the offer to
Deal Summary
Date: 7/28/10Transaction Value: $9 757M down as too small and after increasing the offer to
€6.5B and then again to €7.15B in June won supportfrom a majority of shareholders, but the Portuguesegovernment blocked the deal in a controversial move,apparently reluctant to lose a growth driver of one of its
Transaction Value: $9,757M% Sought: 50%Consideration: CashNote: Transaction Value calculated as consideration paid to holders of stock and stock equivalents plus assumed debt.
major corporations. With Telefonica threatening ahostile takeover or dissolution of the joint venture a bidof €7.5B was finally accepted by the government andallowing the deal to proceed.
Th fi l i t i t lti l t 5 3 LTM
Valuation Metrics
LTM Revenue Multiple: 5.3xLTM EBITDA Multiple: 20.0x
The final price tag is a steep multiple at 5.3x LTMrevenue, but Telefonica is committed to solidifying itsleadership position in the fast growing Brazilian marketwhere Telefonica and Vivo combine for over 69Mcustomers. Telefonica has stated that the deal will be
Multiple on $ Invested: NA
InvestorsPortugal Telecom
accretive from year one.
Q3 M&A Transaction Spotlight – Telecom Services
Deal Rationale/Commentary
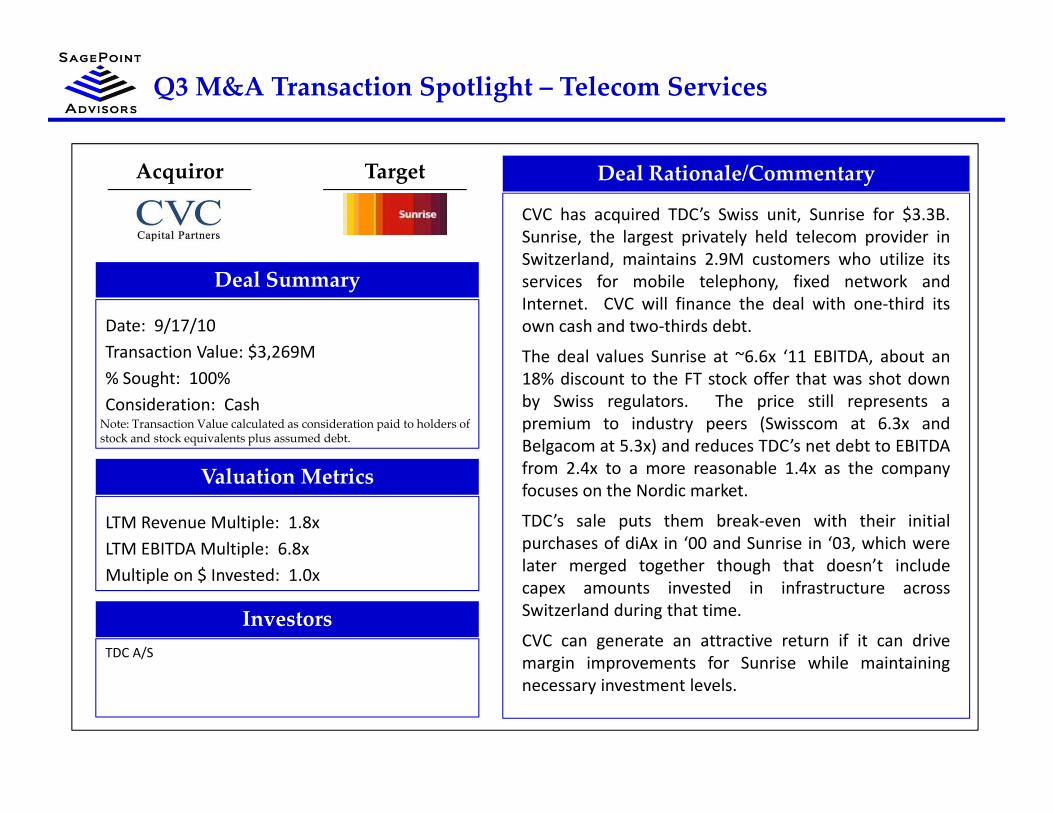
CVC has acquired TDC’s Swiss unit, Sunrise for $3.3B.Sunrise, the largest privately held telecom provider inS i l d i i 2 9 h ili i
Acquiror Target
Switzerland, maintains 2.9M customers who utilize itsservices for mobile telephony, fixed network andInternet. CVC will finance the deal with one‐third itsown cash and two‐thirds debt.
The deal values Sunrise at ~6 6x ‘11 EBITDA about an
Deal Summary
Date: 9/17/10Transaction Value: $3 269M The deal values Sunrise at 6.6x 11 EBITDA, about an
18% discount to the FT stock offer that was shot downby Swiss regulators. The price still represents apremium to industry peers (Swisscom at 6.3x andBelgacom at 5.3x) and reduces TDC’s net debt to EBITDA
Transaction Value: $3,269M% Sought: 100%Consideration: CashNote: Transaction Value calculated as consideration paid to holders of stock and stock equivalents plus assumed debt.
from 2.4x to a more reasonable 1.4x as the companyfocuses on the Nordic market.
TDC’s sale puts them break‐even with their initialpurchases of diAx in ‘00 and Sunrise in ‘03, which werel t d t th th h th t d ’t i l d
Valuation Metrics
LTM Revenue Multiple: 1.8xLTM EBITDA Multiple: 6.8x
later merged together though that doesn’t includecapex amounts invested in infrastructure acrossSwitzerland during that time.
CVC can generate an attractive return if it can drivemargin improvements for Sunrise while maintaining
Multiple on $ Invested: 1.0x
InvestorsTDC A/S
margin improvements for Sunrise while maintainingnecessary investment levels.
Q3 M&A Transaction Spotlight – Telecom Services
Deal Rationale/Commentary
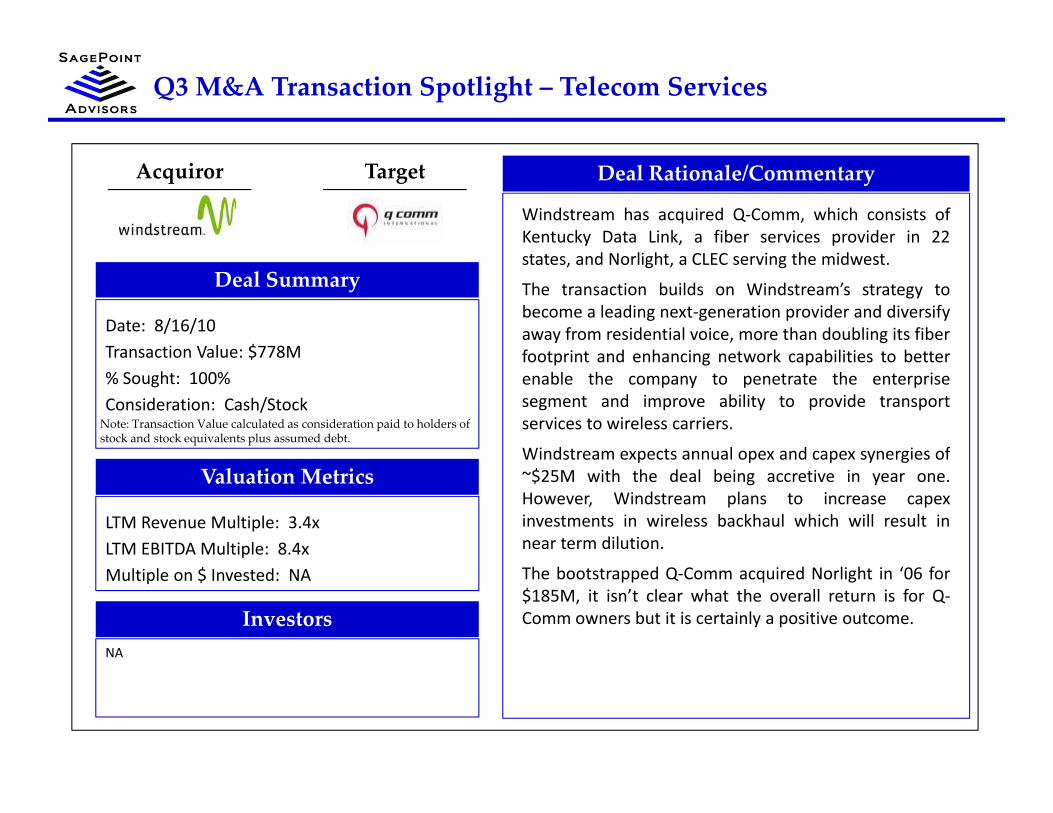
Windstream has acquired Q‐Comm, which consists ofKentucky Data Link, a fiber services provider in 22
d li h C C i h id
Acquiror Target
states, and Norlight, a CLEC serving the midwest.
The transaction builds on Windstream’s strategy tobecome a leading next‐generation provider and diversifyaway from residential voice, more than doubling its fiberfootprint and enhancing network capabilities to better
Deal Summary
Date: 8/16/10Transaction Value: $778M footprint and enhancing network capabilities to better
enable the company to penetrate the enterprisesegment and improve ability to provide transportservices to wireless carriers.
Windstream expects annual opex and capex synergies of
Transaction Value: $778M% Sought: 100%Consideration: Cash/StockNote: Transaction Value calculated as consideration paid to holders of stock and stock equivalents plus assumed debt.
Windstream expects annual opex and capex synergies of~$25M with the deal being accretive in year one.However, Windstream plans to increase capexinvestments in wireless backhaul which will result innear term dilution.
Valuation Metrics
LTM Revenue Multiple: 3.4xLTM EBITDA Multiple: 8.4x
The bootstrapped Q‐Comm acquired Norlight in ‘06 for$185M, it isn’t clear what the overall return is for Q‐Comm owners but it is certainly a positive outcome.
Multiple on $ Invested: NA
InvestorsNA
Q3 M&A Transaction Spotlight – Telecom Services
Deal Rationale/Commentary
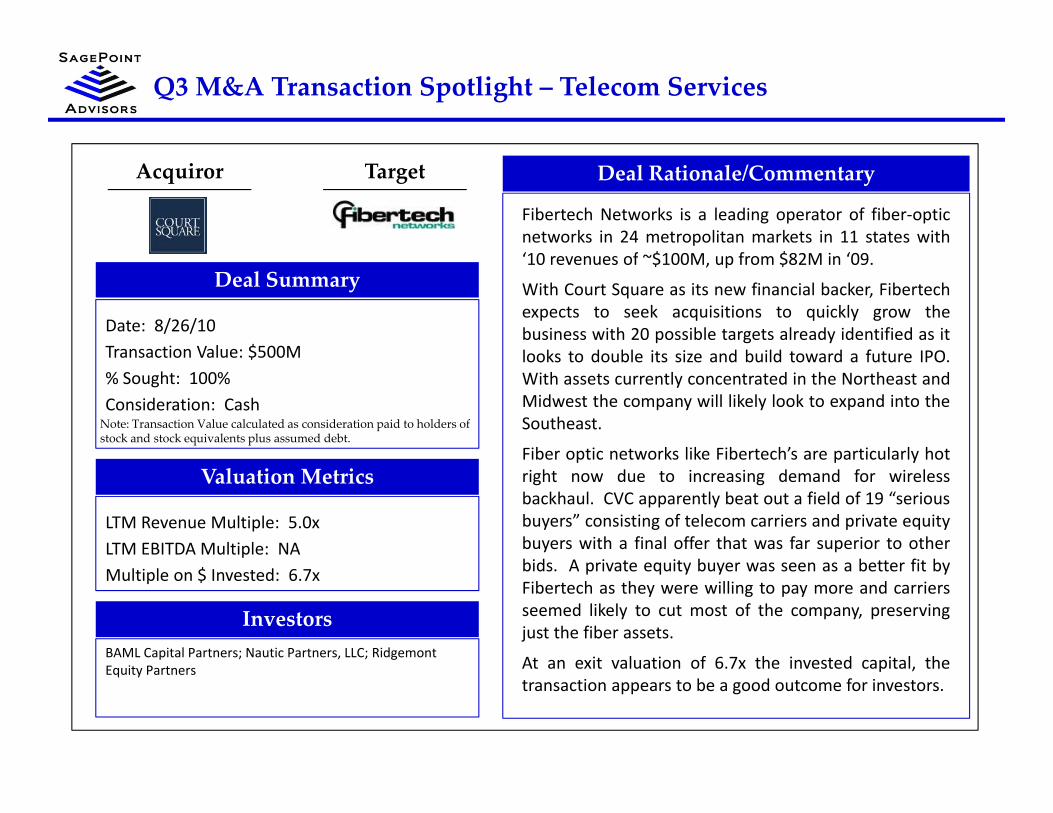
Fibertech Networks is a leading operator of fiber‐opticnetworks in 24 metropolitan markets in 11 states with‘ 0 f $ 00 f $82 i ‘09
Acquiror Target
‘10 revenues of ~$100M, up from $82M in ‘09.
With Court Square as its new financial backer, Fibertechexpects to seek acquisitions to quickly grow thebusiness with 20 possible targets already identified as itlooks to double its size and build toward a future IPO
Deal Summary
Date: 8/26/10Transaction Value: $500M looks to double its size and build toward a future IPO.
With assets currently concentrated in the Northeast andMidwest the company will likely look to expand into theSoutheast.
Fiber optic networks like Fibertech’s are particularly hot
Transaction Value: $500M% Sought: 100%Consideration: CashNote: Transaction Value calculated as consideration paid to holders of stock and stock equivalents plus assumed debt.
Fiber optic networks like Fibertech s are particularly hotright now due to increasing demand for wirelessbackhaul. CVC apparently beat out a field of 19 “seriousbuyers” consisting of telecom carriers and private equitybuyers with a final offer that was far superior to otherbid A i t it b b tt fit b
Valuation Metrics
LTM Revenue Multiple: 5.0xLTM EBITDA Multiple: NA
bids. A private equity buyer was seen as a better fit byFibertech as they were willing to pay more and carriersseemed likely to cut most of the company, preservingjust the fiber assets.
At an exit valuation of 6 7x the invested capital the
Multiple on $ Invested: 6.7x
InvestorsBAML Capital Partners; Nautic Partners, LLC; Ridgemont
At an exit valuation of 6.7x the invested capital, thetransaction appears to be a good outcome for investors.
Equity Partners

Q3 M&A Transaction Spotlight – Telecom Services
Deal Rationale/Commentary
SoftLayer provides global, on‐demand data center andhosting services from facilities throughout the U.S. The
h h 6 000 d h
Acquiror Target
company has more than 6,000 customers and more than30,000 servers under management. SoftLayer has beengrowing quickly with ‘09 revenue of $80M and expectsgrowth of more than 50% for ‘10.
GI Partners plans to combine SoftLayer with portfolio
Deal Summary
Date: 8/3/10Transaction Value: $475M GI Partners plans to combine SoftLayer with portfolio
company The Planet with the combined companygenerating $270M in ‘10 revenue and a possible IPO asearly as next year being considered. The 10.6x EBITDAmultiple paid by GI appears reasonable given SoftLayer’s
Transaction Value: $475M% Sought: 100%Consideration: CashNote: Transaction Value calculated as consideration paid to holders of stock and stock equivalents plus assumed debt.
growth rate and the potential synergies with The Planet.
SoftLayer is one of three major PE acquisitions for ‘10 inthe hosting space with Oak Hill leading and GIparticipating in the $420M buyout of ViaWest andW l h C A d & St i $400M f
Valuation Metrics
LTM Revenue Multiple: 4.1xLTM EBITDA Multiple: 10.6x
Welsh, Carson, Anderson & Stowe paying $400M forPeak 10 in September. With the demand for cloudservices fueling growth, there appears to be renewed PEinterest in the hosting space.
At an exit valuation of 4 75x the invested capital the
Multiple on $ Invested: 4.75x
InvestorsUndisclosed
At an exit valuation of 4.75x the invested capital, thetransaction appears to be a solid outcome for investors.
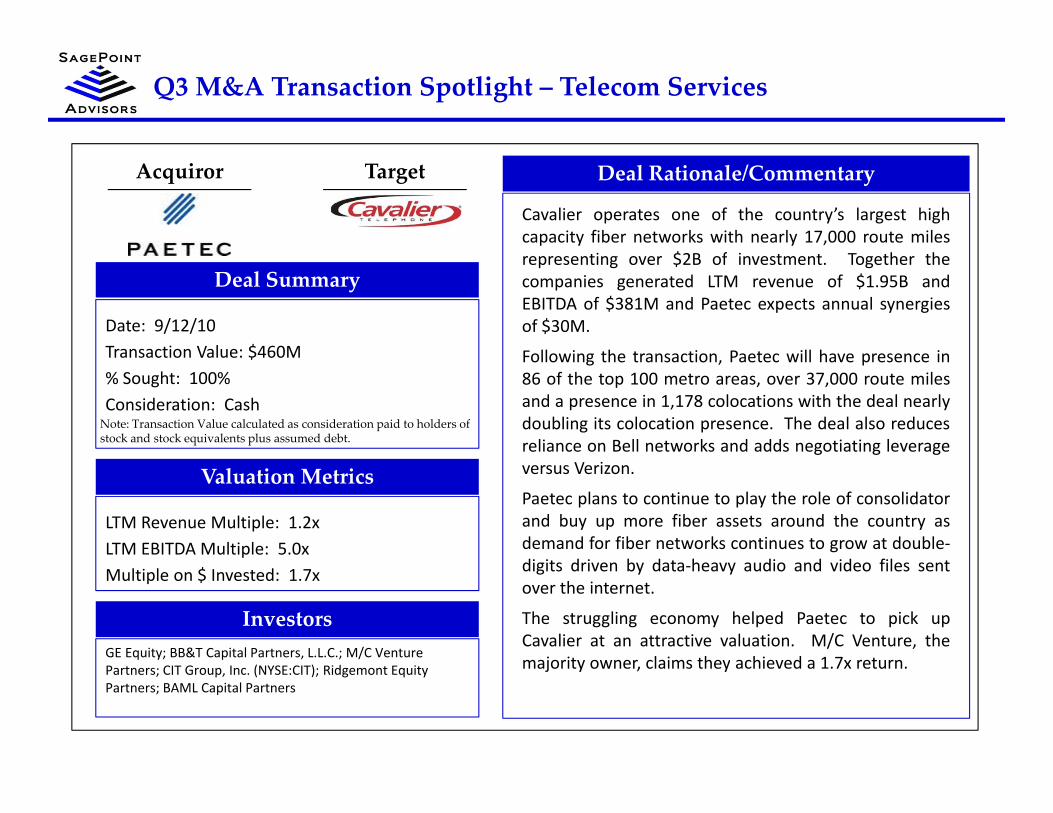
Q3 M&A Transaction Spotlight – Telecom Services
Deal Rationale/Commentary
Cavalier operates one of the country’s largest highcapacity fiber networks with nearly 17,000 route miles
i $2 f i h h
Acquiror Target
representing over $2B of investment. Together thecompanies generated LTM revenue of $1.95B andEBITDA of $381M and Paetec expects annual synergiesof $30M.
Following the transaction Paetec will have presence in
Deal Summary
Date: 9/12/10Transaction Value: $460M Following the transaction, Paetec will have presence in
86 of the top 100 metro areas, over 37,000 route milesand a presence in 1,178 colocations with the deal nearlydoubling its colocation presence. The deal also reducesreliance on Bell networks and adds negotiating leverage
Transaction Value: $460M% Sought: 100%Consideration: CashNote: Transaction Value calculated as consideration paid to holders of stock and stock equivalents plus assumed debt.
versus Verizon.
Paetec plans to continue to play the role of consolidatorand buy up more fiber assets around the country asdemand for fiber networks continues to grow at double‐di it d i b d t h di d id fil t
Valuation Metrics
LTM Revenue Multiple: 1.2xLTM EBITDA Multiple: 5.0x
digits driven by data‐heavy audio and video files sentover the internet.
The struggling economy helped Paetec to pick upCavalier at an attractive valuation. M/C Venture, themajority owner claims they achieved a 1 7x return
Multiple on $ Invested: 1.7x
InvestorsGE Equity; BB&T Capital Partners, L.L.C.; M/C Venture
majority owner, claims they achieved a 1.7x return.Partners; CIT Group, Inc. (NYSE:CIT); Ridgemont Equity Partners; BAML Capital Partners
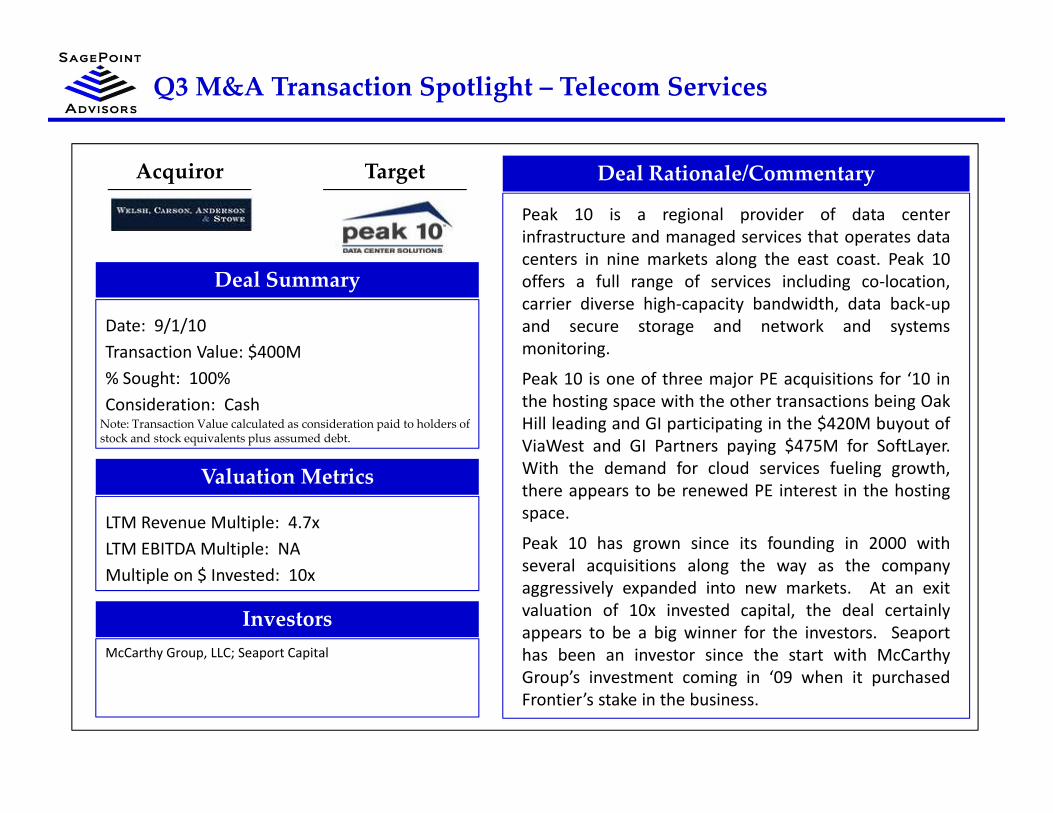
Q3 M&A Transaction Spotlight – Telecom Services
Deal Rationale/Commentary
Peak 10 is a regional provider of data centerinfrastructure and managed services that operates data
i i k l h k 0
Acquiror Target
centers in nine markets along the east coast. Peak 10offers a full range of services including co‐location,carrier diverse high‐capacity bandwidth, data back‐upand secure storage and network and systemsmonitoring.
Deal Summary
Date: 9/1/10Transaction Value: $400M g
Peak 10 is one of three major PE acquisitions for ‘10 inthe hosting space with the other transactions being OakHill leading and GI participating in the $420M buyout ofViaWest and GI Partners paying $475M for SoftLayer.
Transaction Value: $400M% Sought: 100%Consideration: CashNote: Transaction Value calculated as consideration paid to holders of stock and stock equivalents plus assumed debt.
With the demand for cloud services fueling growth,there appears to be renewed PE interest in the hostingspace.
Peak 10 has grown since its founding in 2000 withl i iti l th th
Valuation Metrics
LTM Revenue Multiple: 4.7xLTM EBITDA Multiple: NA
several acquisitions along the way as the companyaggressively expanded into new markets. At an exitvaluation of 10x invested capital, the deal certainlyappears to be a big winner for the investors. Seaporthas been an investor since the start with McCarthy
Multiple on $ Invested: 10x
InvestorsMcCarthy Group, LLC; Seaport Capital y
Group’s investment coming in ‘09 when it purchasedFrontier’s stake in the business.

Q3 M&A Transaction Spotlight – Telecom Services
Deal Rationale/Commentary
Host Europe provides enterprise hosting, manageddedicated servers, shared virtual server hosting, server
l i d i i i d f
Acquiror Target
co‐location, domain name registration, and a range of e‐services to 730,000 customers in the small to mediumsized enterprise community in the UK and Germany.
The company has specific strength in the fast growingcloud computing and virtualized server markets which
Deal Summary
Date: 9/15/10Transaction Value: $344M cloud computing and virtualized server markets which
likely is one of the reasons Montagu was attracted toHost Europe.
Montagu plans to integrate Host Europe’s Webfusionand Host Europe GmbH businesses, both of which
Transaction Value: $344M% Sought: 100%Consideration: CashNote: Transaction Value calculated as consideration paid to holders of stock and stock equivalents plus assumed debt.
and Host Europe GmbH businesses, both of whichdemonstrate strong growth prospects, to create aplatform to better address market opportunities.
The deal represents a 1.45x increase on the price paidfor Oakley’s acquisition of the company in March ’08, a
Valuation Metrics
LTM Revenue Multiple: NALTM EBITDA Multiple: NA
moderate return but not too bad considering theturmoil over the past two years.
Multiple on $ Invested: 1.45x
InvestorsOakley Capital Investments Limited (AIM:OCL)

Appendix – Q3 Telecom Services M&A Transactions
Transaction Value / Transaction Value /Ann Date Acquiror Target Value Revenue
International LEC/ICP7/2/10 Aster Sp. z o.o. Mediatel 4B sp. z o. o 4.6 NA9/27/10 ECI Partners LLP XLN Telecom Ltd. 61.5 0.7x9/28/10 Open joint stock company
MegaFonZAO Peterstar 215.0 2.3x
7/12/10 North-West Telecom (RTS:SPTL)
Severen-Telekom ZAO NA NA
Ann Date Acquiror Target Value RevenueData Access/Transport
8/4/10 Sitestar Corp. (OTCBB:SYTE) jellico.com, Inc. 0.0 NA7/1/10 Highw ay 1 (Aust) Pty Ltd. NerdNet Internet and EON
Technology0.1 NA
7/28/10 Investor Group ComTel Corp (Post Paid and Prepaid Retail Mobile Bus)
7.0 NA
7/19/10 Investor Group Multinet Pakistan (Private) 26.2 NA( )7/26/10 j2 Global Communications, Inc.
(NasdaqGS:JCOM)Alban Telecom Ltd. NA NA
7/31/10 Chess Telecom Limited Intelligent Netw orks Limited NA NA8/4/10 ZAO Peterstar JSC Chermetresurs NA NA8/13/10 Investor Group Teleport St. Petersburg Ltd. NA NA9/8/10 Dial Telecom, a.s. GTS Slovakia, inc. NA NA9/15/10 MobilTel AD Spectrum Net JSC NA NA9/15/10 The Phone Co-op Limited Saga Group Ltd Telephone NA NA
Limited7/30/10 Vimpel-Communications
(NYSE:VIP)Foratek Kommunikeishn Zao 46.2 NA
7/26/10 CITIC Netw orks Co., Ltd. Great Wall Broadband Netw ork Service Co., Ltd.
47.8 NA
7/16/10 Tele2 AB (OM:TEL2 B) BBned N.V. 64.7 0.6x9/9/10 Neutral Tandem, Inc.
(NasdaqGS:TNDM)Tinet SpA 94.8 1.7x
7/21/10 LDC Ltd E t G l 151 9 0 59/15/10 The Phone Co op Limited Saga Group Ltd., Telephone Business
NA NA
9/22/10 PJSC Southern Telecom (MICEX:UTEL)
South Telecom LLC NA NA
9/22/10 Komet Telecoms Company CJSC Synterra-Far East, Volga and Caucases
NA NA
9/23/10 Acropolis Telecom SA (ENXTPA:ALACR)
IPeX Telecom S.A. NA NA
9/23/10 Investor Group ETS Communications Limited NA NA
7/21/10 LDC Ltd. Easynet Group plc 151.9 0.5x8/26/10 Court Square Capital Partners Fibertech Netw orks, LLC 500.0 5.0x
7/6/10 HitecVision AS (OTCNO:HITV) Tampnet As NA NA
7/6/10 GLOBALINX Enterprises, LLC TRI-M Communications, Inc. NA NA7/9/10 Mariehamns Telefon Ab;
Alands Telefonandelslag ABAlands Datakommunikation AB
NA NA
7/26/10 NetByNet Holding Inetera NA NA
US LEC/ICP7/19/10 NTELOS Inc. Mountaineer
Telecommunications LLC170.0 2.2x
9/12/10 PAETEC Holding Corp. (NasdaqGS:PAET)
Cavalier Telephone, LLC 460.0 1.2x
8/16/10 Windstream Corporation (NasdaqGS:WIN)
Q-Comm Corporation 778.4 3.4x
7/26/10 NetByNet Holding Inetera NA NA7/30/10 Blizoo Link BG NA NA8/2/10 Lexicon United Inc.
(OTCBB:LXUN)Pathw orks Corporation NA NA
8/25/10 PT First Media New s; PT First Media Production
PT Jaring Data Interaktif NA NA
9/1/10 Jaguar Communications, Inc. Southern Minnesota Internet Group Inc.
NA NA
9/2/10 Datagroup Close Joint Stock MainStream LLC NA NA9/2/10 Datagroup, Close Joint Stock Company
MainStream LLC NA NA
9/8/10 Datagroup, Close Joint Stock Company
Limited Liability Company Home-Net
NA NA
9/9/10 Altitude Infrastructure SAS LUXINET TELECOM Société à Responsabilité Limité
NA NA
9/21/10 Sion S.A. UOL Sinectis SA NA NA
23
Note: Transaction Value calculated as consideration paid to holders of stock and stock equivalents plus assumed debt. Transaction Value and Revenue per public filings and press releases if available, otherwise per analyst estimates. Partial year data is annualized if LTM data is not available. Deals with Public targets shaded.
Telecommunication & Data Center Services M&A – Q3 2010

Appendix – Q3 Telecom Services M&A Transactions
Transaction Value /Ann Date Acquiror Target Value Revenue
Transaction Value /Ann Date Acquiror Target Value RevenueAnn Date Acquiror Target Value Revenue
Hosting & Data Center7/29/10 24h Technologies AB
(OM:24H)IPMovers AB 0.2 NA
7/28/10 St. Bernard Softw are, Inc. (OTCBB:SBSW)
Red Condor, Inc. 0.7 NA
8/19/10 Digital Realty Trust Inc. (NYSE:DLR)
Tw o Datacenter Properties 50.3 NA
9/14/10 Corporate Office Properties Pow er Loft @ Innovation 115.0 NA
Ann Date Acquiror Target Value RevenueCable & Satellite TV
7/6/10 Magyar Telekom (BUSE:MTELEKOM)
Modultechnika Kereskedelmi es Szolgaltato Kft.
6.7 NA
8/9/10 Investor Group Midcontinent Media, Inc. NA NA9/15/10 MobilTel AD Megalan Netw ork Ltd. NA NA
Satellite Voice & Data7/31/10 ING Satcom Ltd. Gujarat Narmada Valley
(V SAT/ISP G t B )1.3 NA
9/14/10 Corporate Office Properties Trust (NYSE:OFC)
Pow er Loft @ Innovation Data Center
115.0 NA
9/1/10 Welsh, Carson, Anderson & Stow e
Peak 10, Inc. 400.0 4.7x
9/15/10 Montagu Private Equity Limited Host Europe WVS Limited 344.4 NA
8/3/10 GI Partners SoftLayer Technologies, Inc. 475.0 4.1x
7/6/10 Redstation Limited Altaire Limited NA NA
(V-SAT/ISP Gatew ay Bus)9/17/10 L-3 Communications Holdings
Inc. (NYSE:LLL)3Di Technologies, LLC NA NA
International Wireless7/28/10 Mediamesh Holdings Pty
LimitedComTel Corporation Limited, Prepaid Retail Mobile Bus.
1.5 NA
7/12/10 Compañía Paraguaya de Comunicaciones Sociedad Anónima S A
Hola Paraguay SA 3.0 NA
7/7/10 Charterhouse Group; Thompson Street; Cequel
Colo4 LLC NA NA
7/27/10 Hosting Metro, Inc. Drupal Value Hosting NA NA8/3/10 CybrHost Corporation Green Dedicated Host, Inc. NA NA8/9/10 Bluemile, Inc. Fivebean Media, LLC NA NA8/17/10 Hosting Metro, Inc. Win Web Hosting NA NA8/29/10 Dynamic Netw ork Services
IncorporatedNerdie Netw orks LLC NA NA
Anónima S.A.8/17/10 Arendals Fossekompani ASA
(OB:AFK)World Wide Mobile Communications AS
21.8 NA
8/11/10 Bharti Airtel Ltd. (BSE:532454) Telecom Seychelles Limited 62.0 NA
9/17/10 CVC Capital Partners Ltd. Sunrise Communications AG 3,269.0 1.8x
7/28/10 Telefonica, S.A. (CATS:TEF) Brasilcel, N.V. 9,757.4 5.3x7/9/10 Royal KPN NV (ENXTAM:KPN) Yes Telecom Netherlands NA NAp
9/6/10 UAB Baltic Data Center UAB HOSTEX NA NA9/9/10 OurWeb.net Arbershosting.com NA NA9/13/10 IS PINS Group BV NA NA9/14/10 Lightow er Fiber Netw orks Lexent Metro Connect, LLC NA NA9/19/10 MetroBeam Wireless
Telecommunications Co LLCStream NA NA
9/21/10 Competitive Companies Inc. (OTCBB:CCOP)
Surfs Global, Inc. NA NA
y ( )B.V.
7/23/10 Media Exchange Group, Inc. (OTCPK:CWLC)
Tarsin (Europe) Limited NA NA
9/15/10 Keyyo (ENXTPA:ALKEY) Mobeel Group SAS NA NA9/15/10 T-Mobile Netherlands B.V. Simpel BV NA NA
US Wireless7/2/10 KeyOn Communications
Holdings Inc. (OTCBB:KEYO)Technology Specialists Group, Inc., TS Wireless
0.2 NA(OTCBB:CCOP)
9/28/10 Informatica Softw are (Schw eiz) AG
MyGate AG Sw itzerland, Data Centre in Chur
NA NA
7/30/10 Telecity Group plc (LSE:TCY) Internet Facilitators Limited 33.1 NA
VoIP Specialty7/22/10 Musicians Exchange
(OTCBB:MUEX)SpeechCard LLC NA NA
7/26/10 Integrated BroadBand Services, LLC
SinglePipe Communications, Inc.
NA NA
g ( ) p, ,8/2/10 KeyOn Communications
Holdings Inc. (OTCBB:KEYO)Southw est Wireless Net, Wireless Broadband In Southw est Minnesota
0.3 NA
8/10/10 Sprint Nextel Corp. (NYSE:S) 10 megahertz of w ireless spectrum
105.0 NA
8/18/10 Airband Communications, Inc. Sparkplug, Inc. NA NA9/2/10 Cellular One, LLC TX-11 Acquisition, LLC NA NA
Wireless Towers
24
Note: Transaction Value calculated as consideration paid to holders of stock and stock equivalents plus assumed debt. Transaction Value and Revenue per public filings and press releases if available, otherwise per analyst estimates. Partial year data is annualized if LTM data is not available. Deals with Public targets shaded.
Telecommunication & Data Center Services M&A – Q3 2010
,9/20/10 Logicalis Group Limited Touchbase Singapore Pte
Ltd.NA NA 7/21/10 Omnicity, Corp.
(OTCBB:OMCY)RAA Services 0.1 NA
8/9/10 ATC Sitios del Peru S.R.L. Telefónica del Perú, 468 Wireless Communication Tow er Sites
NA NA

Appendix – Q3 Telecom Services M&A Data
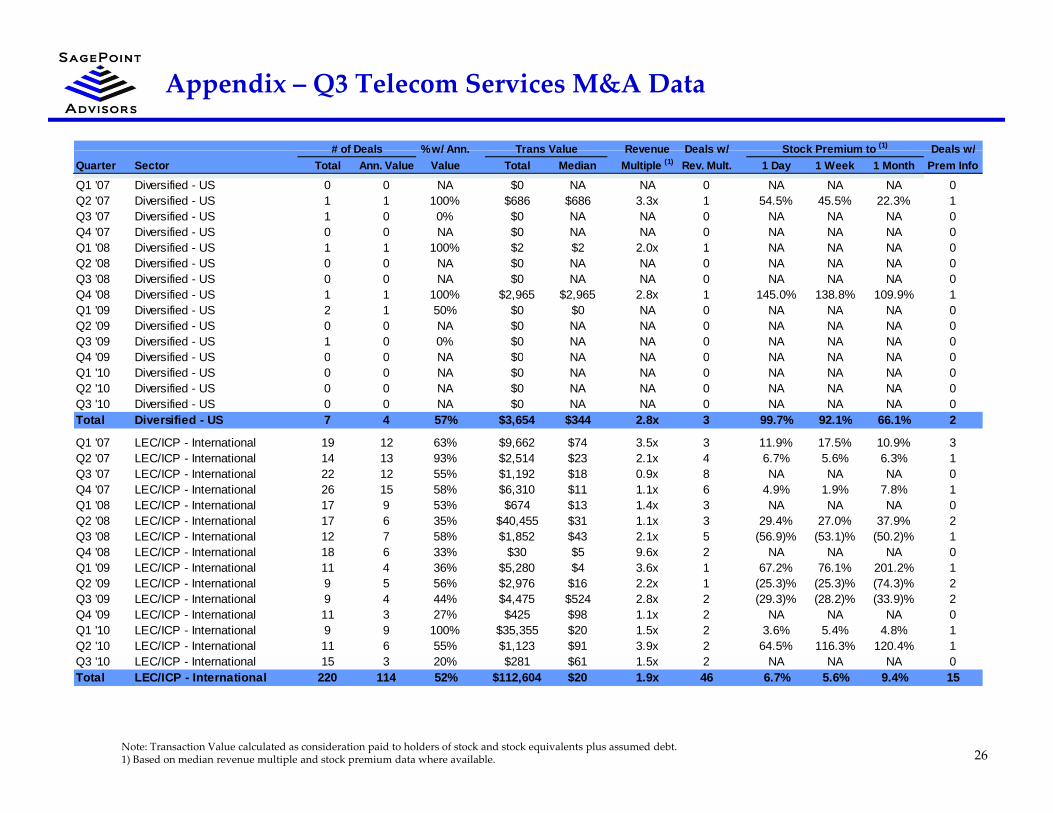
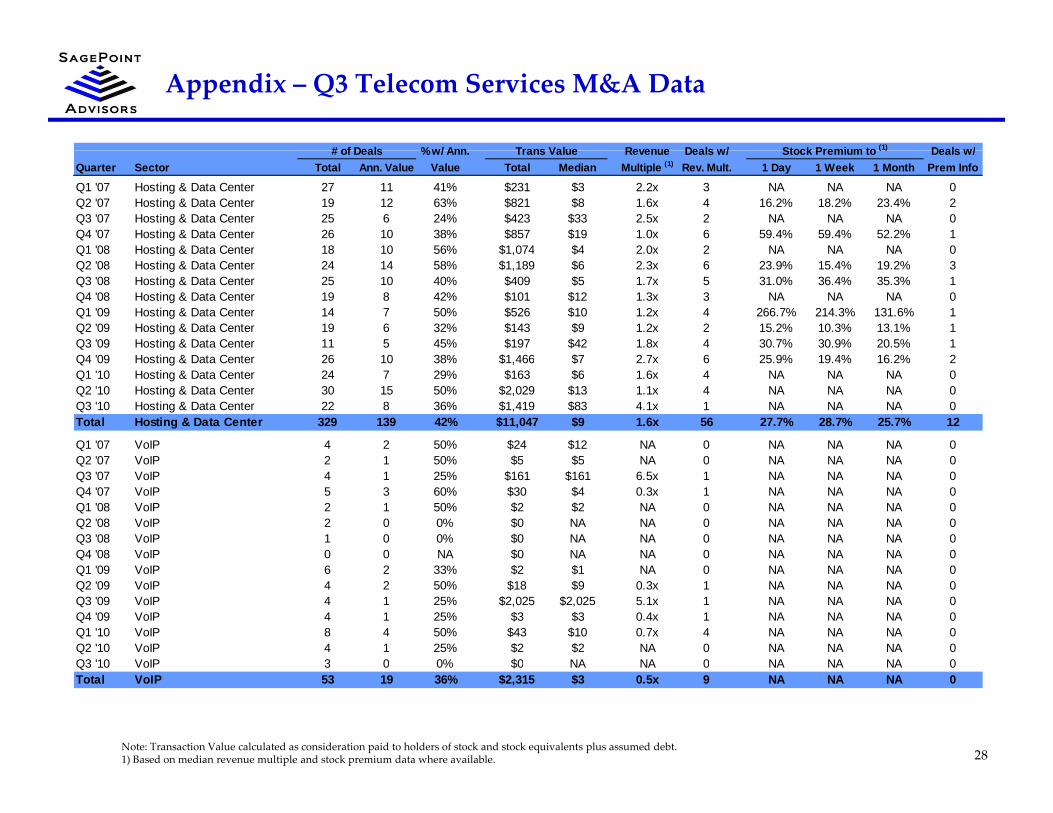
# of Deals %w/ Ann Trans Value Revenue Deals w/ Stock Premium to (1) Deals w/# of Deals % w/ Ann. Trans Value Revenue Deals w/ Stock Premium to (1) Deals w/Quarter Sector Total Ann. Value Value Total Median Multiple (1) Rev. Mult. 1 Day 1 Week 1 Month Prem Info
Q1 '07 Telecom Services 127 62 49% $35,863 $28 1.1x 19 15.2% 18.7% 28.6% 8Q2 '07 Telecom Services 122 77 63% $79,325 $16 2.2x 24 31.8% 45.3% 30.7% 9Q3 '07 Telecom Services 135 67 50% $12,001 $16 2.1x 25 18.7% 21.1% 22.6% 5Q4 '07 Telecom Services 156 88 56% $16,686 $9 1.1x 26 4.9% 1.9% 7.8% 3Q1 '08 Telecom Services 101 52 51% $30 745 $9 2 1x 15 NA NA NA 0Q1 08 Telecom Services 101 52 51% $30,745 $9 2.1x 15 NA NA NA 0Q2 '08 Telecom Services 110 56 51% $91,828 $10 2.1x 20 19.2% 17.3% 29.6% 7Q3 '08 Telecom Services 93 52 56% $7,264 $14 2.1x 17 (16.4)% (19.4)% (16.4)% 3Q4 '08 Telecom Services 86 37 43% $15,705 $9 1.8x 11 101.8% 91.7% 71.8% 4Q1 '09 Telecom Services 75 33 44% $6,837 $8 1.1x 12 67.2% 76.1% 131.6% 3Q2 '09 Telecom Services 81 39 48% $8,730 $11 0.7x 13 15.2% 10.3% 10.0% 5Q3 '09 Telecom Services 68 27 40% $13,343 $62 2.7x 15 26.1% 28.3% 17.3% 6Q4 '09 T l S i 112 44 39% $9 4 1 $2 1 20 28 3% 28 2% 31 0%Q4 '09 Telecom Services 112 44 39% $9,471 $27 1.7x 20 28.3% 28.2% 31.0% 7Q1 '10 Telecom Services 93 40 43% $52,258 $9 1.5x 15 3.6% 5.4% 4.8% 1Q2 '10 Telecom Services 81 39 48% $28,531 $17 1.7x 14 40.9% 64.5% 69.0% 2Q3 '10 Telecom Services 87 36 41% $17,275 $49 2.0x 12 NA NA NA 0Total Telecom Services 1527 749 49% $425,862 $14 1.8x 258 20.8% 22.2% 23.7% 63
Q1 '07 Diversified - International 2 0 0% $0 NA NA 0 NA NA NA 0Q2 '07 Di ifi d I t ti l 11 11 100% $12 928 $185 1 1 6 53 5% 65 5% 57 7% 3Q2 '07 Diversified - International 11 11 100% $12,928 $185 1.1x 6 53.5% 65.5% 57.7% 3Q3 '07 Diversified - International 2 1 50% $186 $186 NA 0 29.5% 34.3% 13.9% 1Q4 '07 Diversified - International 7 6 86% $3,674 $89 3.1x 2 (6.1)% (4.6)% (1.7)% 1Q1 '08 Diversified - International 7 2 29% $1,139 $570 3.0x 1 NA NA NA 0Q2 '08 Diversified - International 3 2 67% $343 $171 2.1x 2 NA NA NA 0Q3 '08 Diversified - International 2 2 100% $902 $451 4.4x 1 NA NA NA 0Q4 '08 Diversified - International 3 1 33% $12 $12 0.2x 1 142.2% 151.9% 186.3% 1Q1 '09 Diversified - International 10 5 50% $556 $77 2.3x 3 7.3% 1.1% 4.6% 1Q2 '09 Diversified - International 3 1 33% $1 $1 NA 0 NA NA NA 0Q3 '09 Diversified - International 0 0 NA $0 NA NA 0 NA NA NA 0Q4 '09 Diversified - International 5 4 80% $358 $49 1.7x 3 10.2% 10.2% 3.5% 1Q1 '10 Diversified - International 4 1 25% $2,500 $2,500 NA 0 NA NA NA 0Q2 '10 Diversified - International 2 2 100% $488 $244 2.3x 1 NA NA NA 0Q3 '10 Diversified International 0 0 NA $0 NA NA 0 NA NA NA 0
25Note: Transaction Value calculated as consideration paid to holders of stock and stock equivalents plus assumed debt.1) Based on median revenue multiple and stock premium data where available.
Q3 10 Diversified - International 0 0 NA $0 NA NA 0 NA NA NA 0Total Diversified - International 61 38 62% $23,087 $82 2.1x 20 35.7% 41.3% 22.3% 8
Appendix – Q3 Telecom Services M&A Data
# of Deals %w/ Ann Trans Value Revenue Deals w/ Stock Premium to (1) Deals w/# of Deals % w/ Ann. Trans Value Revenue Deals w/ Stock Premium to Deals w/Quarter Sector Total Ann. Value Value Total Median Multiple (1) Rev. Mult. 1 Day 1 Week 1 Month Prem Info
Q1 '07 Diversified - US 0 0 NA $0 NA NA 0 NA NA NA 0Q2 '07 Diversified - US 1 1 100% $686 $686 3.3x 1 54.5% 45.5% 22.3% 1Q3 '07 Diversified - US 1 0 0% $0 NA NA 0 NA NA NA 0Q4 '07 Diversified - US 0 0 NA $0 NA NA 0 NA NA NA 0Q1 '08 Diversified - US 1 1 100% $2 $2 2.0x 1 NA NA NA 0Q2 '08 Diversified - US 0 0 NA $0 NA NA 0 NA NA NA 0Q3 '08 Diversified - US 0 0 NA $0 NA NA 0 NA NA NA 0Q4 '08 Diversified - US 1 1 100% $2,965 $2,965 2.8x 1 145.0% 138.8% 109.9% 1Q1 '09 Diversified - US 2 1 50% $0 $0 NA 0 NA NA NA 0Q2 '09 Diversified - US 0 0 NA $0 NA NA 0 NA NA NA 0Q3 '09 Diversified - US 1 0 0% $0 NA NA 0 NA NA NA 0Q4 '09 Diversified US 0 0 NA $0 NA NA 0 NA NA NA 0Q4 '09 Diversified - US 0 0 NA $0 NA NA 0 NA NA NA 0Q1 '10 Diversified - US 0 0 NA $0 NA NA 0 NA NA NA 0Q2 '10 Diversified - US 0 0 NA $0 NA NA 0 NA NA NA 0Q3 '10 Diversified - US 0 0 NA $0 NA NA 0 NA NA NA 0Total Diversified - US 7 4 57% $3,654 $344 2.8x 3 99.7% 92.1% 66.1% 2
Q1 '07 LEC/ICP - International 19 12 63% $9,662 $74 3.5x 3 11.9% 17.5% 10.9% 3Q2 '07 LEC/ICP International 14 13 93% $2 514 $23 2 1x 4 6 7% 5 6% 6 3% 1Q2 07 LEC/ICP - International 14 13 93% $2,514 $23 2.1x 4 6.7% 5.6% 6.3% 1Q3 '07 LEC/ICP - International 22 12 55% $1,192 $18 0.9x 8 NA NA NA 0Q4 '07 LEC/ICP - International 26 15 58% $6,310 $11 1.1x 6 4.9% 1.9% 7.8% 1Q1 '08 LEC/ICP - International 17 9 53% $674 $13 1.4x 3 NA NA NA 0Q2 '08 LEC/ICP - International 17 6 35% $40,455 $31 1.1x 3 29.4% 27.0% 37.9% 2Q3 '08 LEC/ICP - International 12 7 58% $1,852 $43 2.1x 5 (56.9)% (53.1)% (50.2)% 1Q4 '08 LEC/ICP - International 18 6 33% $30 $5 9.6x 2 NA NA NA 0Q1 '09 LEC/ICP - International 11 4 36% $5,280 $4 3.6x 1 67.2% 76.1% 201.2% 1Q2 '09 LEC/ICP - International 9 5 56% $2,976 $16 2.2x 1 (25.3)% (25.3)% (74.3)% 2Q3 '09 LEC/ICP - International 9 4 44% $4,475 $524 2.8x 2 (29.3)% (28.2)% (33.9)% 2Q4 '09 LEC/ICP - International 11 3 27% $425 $98 1.1x 2 NA NA NA 0Q1 '10 LEC/ICP - International 9 9 100% $35,355 $20 1.5x 2 3.6% 5.4% 4.8% 1Q2 '10 LEC/ICP - International 11 6 55% $1,123 $91 3.9x 2 64.5% 116.3% 120.4% 1Q3 '10 LEC/ICP - International 15 3 20% $281 $61 1 5x 2 NA NA NA 0
26Note: Transaction Value calculated as consideration paid to holders of stock and stock equivalents plus assumed debt.1) Based on median revenue multiple and stock premium data where available.
Q3 10 LEC/ICP International 15 3 20% $281 $61 1.5x 2 NA NA NA 0Total LEC/ICP - International 220 114 52% $112,604 $20 1.9x 46 6.7% 5.6% 9.4% 15
Appendix – Q3 Telecom Services M&A Data
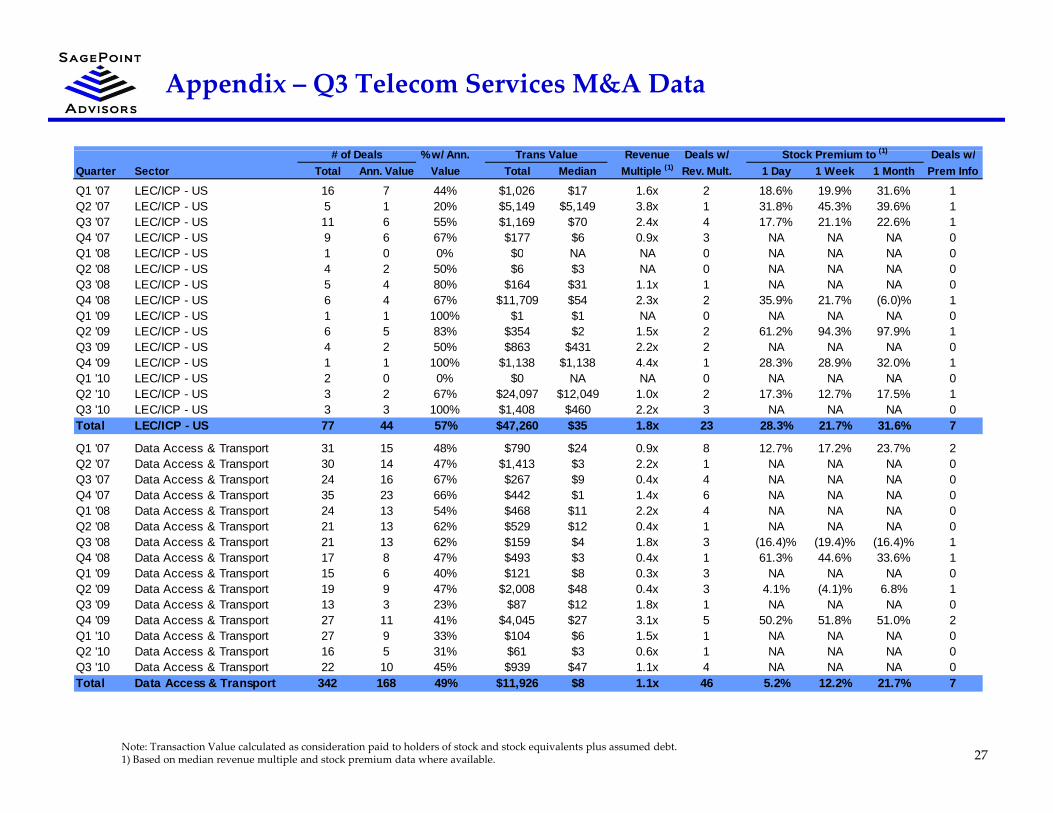
# f % / / S (1) /# of Deals % w/ Ann. Trans Value Revenue Deals w/ Stock Premium to (1) Deals w/Quarter Sector Total Ann. Value Value Total Median Multiple (1) Rev. Mult. 1 Day 1 Week 1 Month Prem Info
Q1 '07 LEC/ICP - US 16 7 44% $1,026 $17 1.6x 2 18.6% 19.9% 31.6% 1Q2 '07 LEC/ICP - US 5 1 20% $5,149 $5,149 3.8x 1 31.8% 45.3% 39.6% 1Q3 '07 LEC/ICP - US 11 6 55% $1,169 $70 2.4x 4 17.7% 21.1% 22.6% 1Q4 '07 LEC/ICP - US 9 6 67% $177 $6 0.9x 3 NA NA NA 0Q1 '08 LEC/ICP US 1 0 0% $0 NA NA 0 NA NA NA 0Q1 08 LEC/ICP - US 1 0 0% $0 NA NA 0 NA NA NA 0Q2 '08 LEC/ICP - US 4 2 50% $6 $3 NA 0 NA NA NA 0Q3 '08 LEC/ICP - US 5 4 80% $164 $31 1.1x 1 NA NA NA 0Q4 '08 LEC/ICP - US 6 4 67% $11,709 $54 2.3x 2 35.9% 21.7% (6.0)% 1Q1 '09 LEC/ICP - US 1 1 100% $1 $1 NA 0 NA NA NA 0Q2 '09 LEC/ICP - US 6 5 83% $354 $2 1.5x 2 61.2% 94.3% 97.9% 1Q3 '09 LEC/ICP - US 4 2 50% $863 $431 2.2x 2 NA NA NA 0Q4 '09 LEC/ICP - US 1 1 100% $1,138 $1,138 4.4x 1 28.3% 28.9% 32.0% 1Q1 '10 LEC/ICP - US 2 0 0% $0 NA NA 0 NA NA NA 0Q2 '10 LEC/ICP - US 3 2 67% $24,097 $12,049 1.0x 2 17.3% 12.7% 17.5% 1Q3 '10 LEC/ICP - US 3 3 100% $1,408 $460 2.2x 3 NA NA NA 0Total LEC/ICP - US 77 44 57% $47,260 $35 1.8x 23 28.3% 21.7% 31.6% 7
Q1 '07 Data Access & Transport 31 15 48% $790 $24 0.9x 8 12.7% 17.2% 23.7% 2Q2 '07 Data Access & Transport 30 14 47% $1,413 $3 2.2x 1 NA NA NA 0Q3 '07 Data Access & Transport 24 16 67% $267 $9 0.4x 4 NA NA NA 0Q4 '07 Data Access & Transport 35 23 66% $442 $1 1.4x 6 NA NA NA 0Q1 '08 Data Access & Transport 24 13 54% $468 $11 2.2x 4 NA NA NA 0Q2 '08 Data Access & Transport 21 13 62% $529 $12 0.4x 1 NA NA NA 0Q3 '08 Data Access & Transport 21 13 62% $159 $4 1.8x 3 (16.4)% (19.4)% (16.4)% 1Q4 '08 Data Access & Transport 17 8 47% $493 $3 0.4x 1 61.3% 44.6% 33.6% 1Q4 08 Data Access & Transport 17 8 47% $493 $3 0.4x 1 61.3% 44.6% 33.6% 1Q1 '09 Data Access & Transport 15 6 40% $121 $8 0.3x 3 NA NA NA 0Q2 '09 Data Access & Transport 19 9 47% $2,008 $48 0.4x 3 4.1% (4.1)% 6.8% 1Q3 '09 Data Access & Transport 13 3 23% $87 $12 1.8x 1 NA NA NA 0Q4 '09 Data Access & Transport 27 11 41% $4,045 $27 3.1x 5 50.2% 51.8% 51.0% 2Q1 '10 Data Access & Transport 27 9 33% $104 $6 1.5x 1 NA NA NA 0Q2 '10 Data Access & Transport 16 5 31% $61 $3 0.6x 1 NA NA NA 0Q3 '10 D t A & T t 22 10 45% $939 $47 1 1 4 NA NA NA 0
27Note: Transaction Value calculated as consideration paid to holders of stock and stock equivalents plus assumed debt.1) Based on median revenue multiple and stock premium data where available.
Q3 '10 Data Access & Transport 22 10 45% $939 $47 1.1x 4 NA NA NA 0Total Data Access & Transport 342 168 49% $11,926 $8 1.1x 46 5.2% 12.2% 21.7% 7
Appendix – Q3 Telecom Services M&A Data
# of Deals %w/ Ann Trans Value Revenue Deals w/ Stock Premium to (1) Deals w/# of Deals % w/ Ann. Trans Value Revenue Deals w/ Stock Premium to ( ) Deals w/Quarter Sector Total Ann. Value Value Total Median Multiple (1) Rev. Mult. 1 Day 1 Week 1 Month Prem Info
Q1 '07 Hosting & Data Center 27 11 41% $231 $3 2.2x 3 NA NA NA 0Q2 '07 Hosting & Data Center 19 12 63% $821 $8 1.6x 4 16.2% 18.2% 23.4% 2Q3 '07 Hosting & Data Center 25 6 24% $423 $33 2.5x 2 NA NA NA 0Q4 '07 Hosting & Data Center 26 10 38% $857 $19 1.0x 6 59.4% 59.4% 52.2% 1Q1 '08 Hosting & Data Center 18 10 56% $1,074 $4 2.0x 2 NA NA NA 0Q1 08 Hosting & Data Center 18 10 56% $1,074 $4 2.0x 2 NA NA NA 0Q2 '08 Hosting & Data Center 24 14 58% $1,189 $6 2.3x 6 23.9% 15.4% 19.2% 3Q3 '08 Hosting & Data Center 25 10 40% $409 $5 1.7x 5 31.0% 36.4% 35.3% 1Q4 '08 Hosting & Data Center 19 8 42% $101 $12 1.3x 3 NA NA NA 0Q1 '09 Hosting & Data Center 14 7 50% $526 $10 1.2x 4 266.7% 214.3% 131.6% 1Q2 '09 Hosting & Data Center 19 6 32% $143 $9 1.2x 2 15.2% 10.3% 13.1% 1Q3 '09 Hosting & Data Center 11 5 45% $197 $42 1.8x 4 30.7% 30.9% 20.5% 1Q4 '09 H ti & D t C t 26 10 38% $1 466 $7 2 7 6 25 9% 19 4% 16 2% 2Q4 '09 Hosting & Data Center 26 10 38% $1,466 $7 2.7x 6 25.9% 19.4% 16.2% 2Q1 '10 Hosting & Data Center 24 7 29% $163 $6 1.6x 4 NA NA NA 0Q2 '10 Hosting & Data Center 30 15 50% $2,029 $13 1.1x 4 NA NA NA 0Q3 '10 Hosting & Data Center 22 8 36% $1,419 $83 4.1x 1 NA NA NA 0Total Hosting & Data Center 329 139 42% $11,047 $9 1.6x 56 27.7% 28.7% 25.7% 12
Q1 '07 VoIP 4 2 50% $24 $12 NA 0 NA NA NA 0Q2 '07 VoIP 2 1 50% $5 $5 NA 0 NA NA NA 0Q2 '07 VoIP 2 1 50% $5 $5 NA 0 NA NA NA 0Q3 '07 VoIP 4 1 25% $161 $161 6.5x 1 NA NA NA 0Q4 '07 VoIP 5 3 60% $30 $4 0.3x 1 NA NA NA 0Q1 '08 VoIP 2 1 50% $2 $2 NA 0 NA NA NA 0Q2 '08 VoIP 2 0 0% $0 NA NA 0 NA NA NA 0Q3 '08 VoIP 1 0 0% $0 NA NA 0 NA NA NA 0Q4 '08 VoIP 0 0 NA $0 NA NA 0 NA NA NA 0Q1 '09 VoIP 6 2 33% $2 $1 NA 0 NA NA NA 0Q2 '09 VoIP 4 2 50% $18 $9 0.3x 1 NA NA NA 0Q3 '09 VoIP 4 1 25% $2,025 $2,025 5.1x 1 NA NA NA 0Q4 '09 VoIP 4 1 25% $3 $3 0.4x 1 NA NA NA 0Q1 '10 VoIP 8 4 50% $43 $10 0.7x 4 NA NA NA 0Q2 '10 VoIP 4 1 25% $2 $2 NA 0 NA NA NA 0Q3 '10 VoIP 3 0 0% $0 NA NA 0 NA NA NA 0
28Note: Transaction Value calculated as consideration paid to holders of stock and stock equivalents plus assumed debt.1) Based on median revenue multiple and stock premium data where available.
Q3 10 VoIP 3 0 0% $0 NA NA 0 NA NA NA 0Total VoIP 53 19 36% $2,315 $3 0.5x 9 NA NA NA 0
Appendix – Q3 Telecom Services M&A Data
# of Deals %w/ Ann Trans Value Revenue Deals w/ Stock Premium to (1) Deals w/# of Deals % w/ Ann. Trans Value Revenue Deals w/ Stock Premium to ( ) Deals w/Quarter Sector Total Ann. Value Value Total Median Multiple (1) Rev. Mult. 1 Day 1 Week 1 Month Prem Info
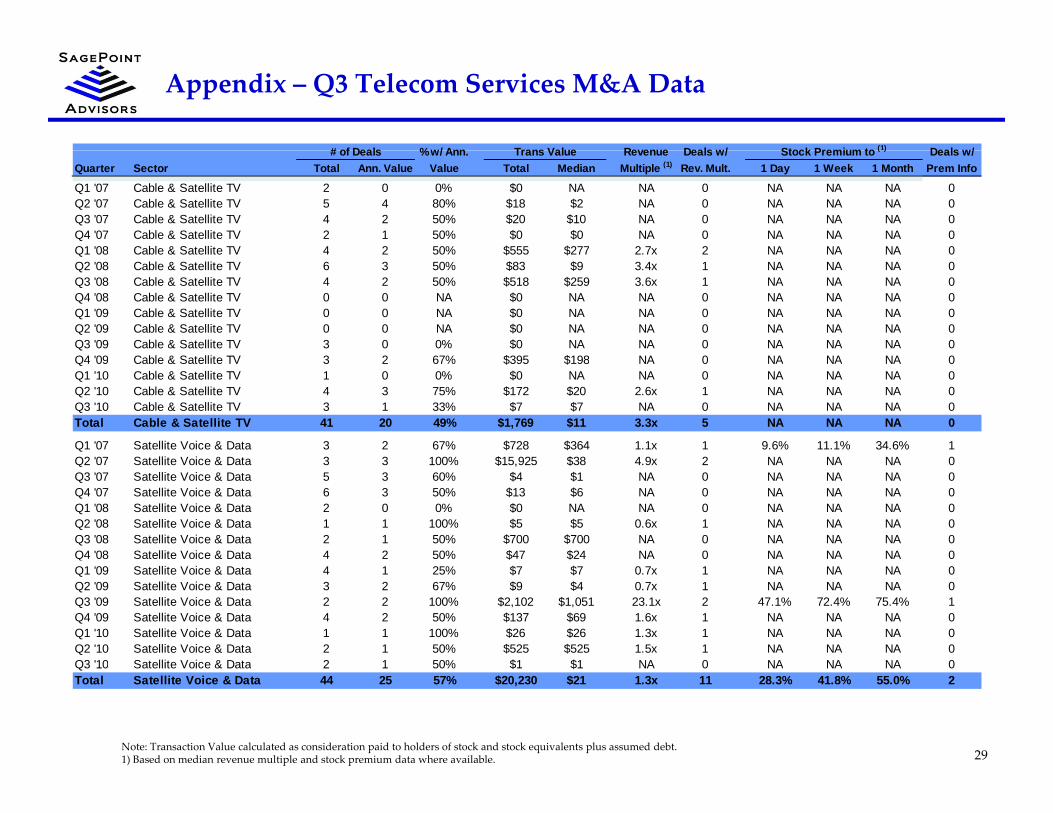
Q1 '07 Cable & Satellite TV 2 0 0% $0 NA NA 0 NA NA NA 0Q2 '07 Cable & Satellite TV 5 4 80% $18 $2 NA 0 NA NA NA 0Q3 '07 Cable & Satellite TV 4 2 50% $20 $10 NA 0 NA NA NA 0Q4 '07 Cable & Satellite TV 2 1 50% $0 $0 NA 0 NA NA NA 0Q1 '08 Cable & Satellite TV 4 2 50% $555 $277 2 7x 2 NA NA NA 0Q1 08 Cable & Satellite TV 4 2 50% $555 $277 2.7x 2 NA NA NA 0Q2 '08 Cable & Satellite TV 6 3 50% $83 $9 3.4x 1 NA NA NA 0Q3 '08 Cable & Satellite TV 4 2 50% $518 $259 3.6x 1 NA NA NA 0Q4 '08 Cable & Satellite TV 0 0 NA $0 NA NA 0 NA NA NA 0Q1 '09 Cable & Satellite TV 0 0 NA $0 NA NA 0 NA NA NA 0Q2 '09 Cable & Satellite TV 0 0 NA $0 NA NA 0 NA NA NA 0Q3 '09 Cable & Satellite TV 3 0 0% $0 NA NA 0 NA NA NA 0Q4 '09 C bl & S lli TV 3 2 67% $395 $198 NA 0 NA NA NA 0Q4 '09 Cable & Satellite TV 3 2 67% $395 $198 NA 0 NA NA NA 0Q1 '10 Cable & Satellite TV 1 0 0% $0 NA NA 0 NA NA NA 0Q2 '10 Cable & Satellite TV 4 3 75% $172 $20 2.6x 1 NA NA NA 0Q3 '10 Cable & Satellite TV 3 1 33% $7 $7 NA 0 NA NA NA 0Total Cable & Satellite TV 41 20 49% $1,769 $11 3.3x 5 NA NA NA 0
Q1 '07 Satellite Voice & Data 3 2 67% $728 $364 1.1x 1 9.6% 11.1% 34.6% 1Q2 '07 S t llit V i & D t 3 3 100% $15 925 $38 4 9 2 NA NA NA 0Q2 '07 Satellite Voice & Data 3 3 100% $15,925 $38 4.9x 2 NA NA NA 0Q3 '07 Satellite Voice & Data 5 3 60% $4 $1 NA 0 NA NA NA 0Q4 '07 Satellite Voice & Data 6 3 50% $13 $6 NA 0 NA NA NA 0Q1 '08 Satellite Voice & Data 2 0 0% $0 NA NA 0 NA NA NA 0Q2 '08 Satellite Voice & Data 1 1 100% $5 $5 0.6x 1 NA NA NA 0Q3 '08 Satellite Voice & Data 2 1 50% $700 $700 NA 0 NA NA NA 0Q4 '08 Satellite Voice & Data 4 2 50% $47 $24 NA 0 NA NA NA 0Q1 '09 Satellite Voice & Data 4 1 25% $7 $7 0.7x 1 NA NA NA 0Q2 '09 Satellite Voice & Data 3 2 67% $9 $4 0.7x 1 NA NA NA 0Q3 '09 Satellite Voice & Data 2 2 100% $2,102 $1,051 23.1x 2 47.1% 72.4% 75.4% 1Q4 '09 Satellite Voice & Data 4 2 50% $137 $69 1.6x 1 NA NA NA 0Q1 '10 Satellite Voice & Data 1 1 100% $26 $26 1.3x 1 NA NA NA 0Q2 '10 Satellite Voice & Data 2 1 50% $525 $525 1.5x 1 NA NA NA 0Q3 '10 Satellite Voice & Data 2 1 50% $1 $1 NA 0 NA NA NA 0
29Note: Transaction Value calculated as consideration paid to holders of stock and stock equivalents plus assumed debt.1) Based on median revenue multiple and stock premium data where available.
Q3 10 Satellite Voice & Data 2 1 50% $1 $1 NA 0 NA NA NA 0Total Satellite Voice & Data 44 25 57% $20,230 $21 1.3x 11 28.3% 41.8% 55.0% 2

Appendix – Q3 Telecom Services M&A Data
# of Deals %w/ Ann Trans Value Revenue Deals w/ Stock Premium to (1) Deals w/# of Deals % w/ Ann. Trans Value Revenue Deals w/ Stock Premium to ( ) Deals w/Quarter Sector Total Ann. Value Value Total Median Multiple (1) Rev. Mult. 1 Day 1 Week 1 Month Prem Info
Q1 '07 Wireless - International 14 10 71% $23,095 $282 3.2x 2 47.7% 47.7% 59.0% 1Q2 '07 Wireless - International 21 13 62% $6,854 $16 2.2x 3 NA NA NA 0Q3 '07 Wireless - International 17 8 47% $1,067 $83 3.4x 4 5.3% 11.1% 66.7% 1Q4 '07 Wireless - International 26 13 50% $2,473 $50 NA 0 NA NA NA 0Q1 '08 Wireless - International 17 8 47% $26 050 $0 NA 0 NA NA NA 0Q1 08 Wireless International 17 8 47% $26,050 $0 NA 0 NA NA NA 0Q2 '08 Wireless - International 16 11 69% $19,618 $73 3.5x 4 13.2% 22.9% 30.2% 2Q3 '08 Wireless - International 10 7 70% $1,160 $28 9.0x 1 NA NA NA 0Q4 '08 Wireless - International 9 3 33% $55 $19 NA 0 NA NA NA 0Q1 '09 Wireless - International 6 4 67% $313 $31 NA 0 NA NA NA 0Q2 '09 Wireless - International 10 4 40% $429 $69 2.0x 2 NA NA NA 0Q3 '09 Wireless - International 17 7 41% $2,851 $18 2.0x 1 1.7% 1.0% 2.3% 1Q4 '09 Wi l I i l 19 6 32% $473 $46 NA 0 NA NA NA 0Q4 '09 Wireless - International 19 6 32% $473 $46 NA 0 NA NA NA 0Q1 '10 Wireless - International 9 4 44% $11,826 $563 2.4x 2 NA NA NA 0Q2 '10 Wireless - International 6 2 33% $33 $16 1.0x 1 NA NA NA 0Q3 '10 Wireless - International 10 6 60% $13,115 $42 5.3x 1 NA NA NA 0Total Wireless - International 207 106 51% $109,411 $33 3.0x 21 7.3% 17.3% 30.8% 5
Q1 '07 Wireless - US 8 3 38% $307 $5 NA 0 NA NA NA 0Q2 '07 Wi l US 7 3 43% $28 067 $313 2 9 2 9 7% 8 5% 15 5% 1Q2 '07 Wireless - US 7 3 43% $28,067 $313 2.9x 2 9.7% 8.5% 15.5% 1Q3 '07 Wireless - US 14 9 64% $5,713 $10 3.7x 2 30.1% 24.7% 13.8% 2Q4 '07 Wireless - US 9 5 56% $2,543 $7 1.8x 2 NA NA NA 0Q1 '08 Wireless - US 6 4 67% $90 $10 1.5x 2 NA NA NA 0Q2 '08 Wireless - US 15 4 27% $29,599 $24 1.7x 2 NA NA NA 0Q3 '08 Wireless - US 6 3 50% $60 $2 NA 0 NA NA NA 0Q4 '08 Wireless - US 8 3 38% $285 $8 0.4x 1 NA NA NA 0Q1 '09 Wireless - US 5 2 40% $30 $15 NA 0 NA NA NA 0Q2 '09 Wireless - US 7 4 57% $2,791 $220 0.4x 1 NA NA NA 0Q3 '09 Wireless - US 3 2 67% $706 $353 0.5x 1 59.2% 60.1% 41.1% 1Q4 '09 Wireless - US 8 2 25% $911 $455 1.5x 1 34.2% 34.8% 32.2% 1Q1 '10 Wireless - US 3 1 33% $2 $2 NA 0 NA NA NA 0Q2 '10 Wireless - US 3 2 67% $2 $1 3.0x 1 NA NA NA 0Q3 '10 Wireless US 5 3 60% $106 $0 NA 0 NA NA NA 0
30Note: Transaction Value calculated as consideration paid to holders of stock and stock equivalents plus assumed debt.1) Based on median revenue multiple and stock premium data where available.
Q3 10 Wireless - US 5 3 60% $106 $0 NA 0 NA NA NA 0Total Wireless - US 107 50 47% $71,210 $8 2.0x 15 34.2% 34.8% 24.9% 5
Appendix – Q3 Telecom Services M&A Data
# of Deals % w/ Ann. Trans Value Revenue Deals w/ Stock Premium to (1) Deals w/Quarter Sector Total Ann. Value Value Total Median Multiple (1) Rev. Mult. 1 Day 1 Week 1 Month Prem Info
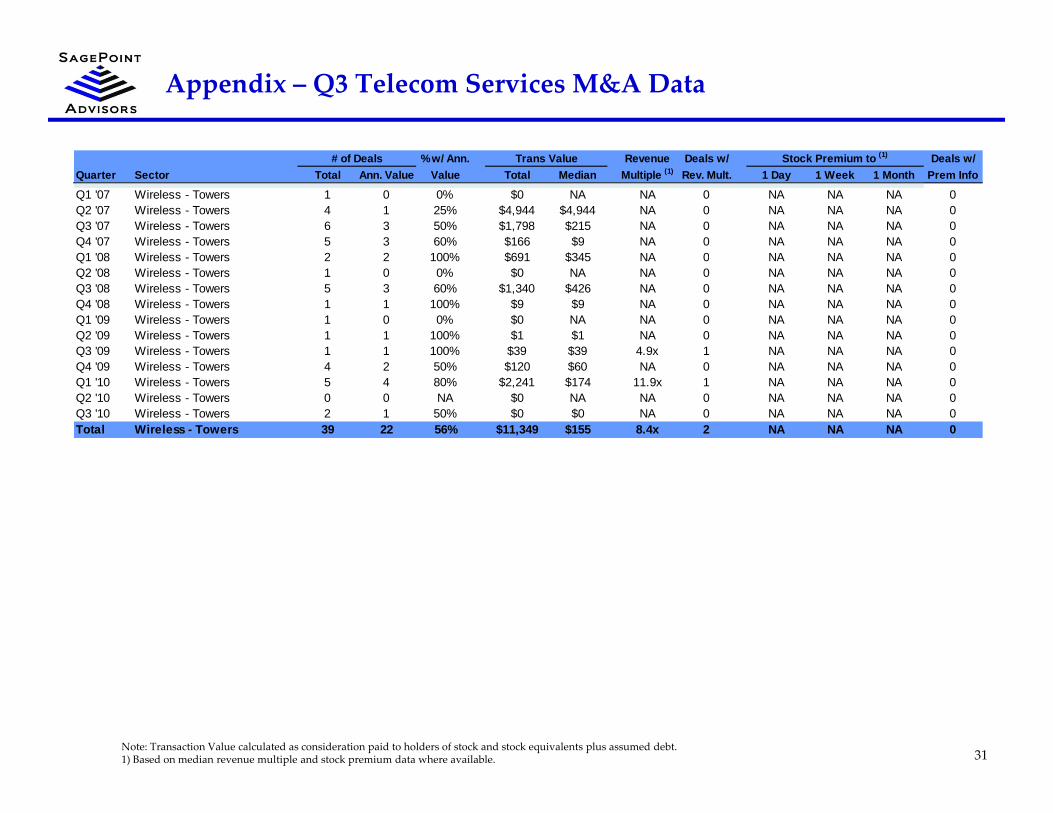
Q1 '07 Wireless - Towers 1 0 0% $0 NA NA 0 NA NA NA 0Q2 '07 Wireless - Towers 4 1 25% $4,944 $4,944 NA 0 NA NA NA 0Q3 '07 Wireless - Towers 6 3 50% $1,798 $215 NA 0 NA NA NA 0Q4 '07 Wireless - Towers 5 3 60% $166 $9 NA 0 NA NA NA 0Q1 '08 Wi l T 2 2 100% $691 $345 NA 0 NA NA NA 0Q1 '08 Wireless - Towers 2 2 100% $691 $345 NA 0 NA NA NA 0Q2 '08 Wireless - Towers 1 0 0% $0 NA NA 0 NA NA NA 0Q3 '08 Wireless - Towers 5 3 60% $1,340 $426 NA 0 NA NA NA 0Q4 '08 Wireless - Towers 1 1 100% $9 $9 NA 0 NA NA NA 0Q1 '09 Wireless - Towers 1 0 0% $0 NA NA 0 NA NA NA 0Q2 '09 Wireless - Towers 1 1 100% $1 $1 NA 0 NA NA NA 0Q3 '09 Wireless - Towers 1 1 100% $39 $39 4.9x 1 NA NA NA 0Q $ $Q4 '09 Wireless - Towers 4 2 50% $120 $60 NA 0 NA NA NA 0Q1 '10 Wireless - Towers 5 4 80% $2,241 $174 11.9x 1 NA NA NA 0Q2 '10 Wireless - Towers 0 0 NA $0 NA NA 0 NA NA NA 0Q3 '10 Wireless - Towers 2 1 50% $0 $0 NA 0 NA NA NA 0Total Wireless - Towers 39 22 56% $11,349 $155 8.4x 2 NA NA NA 0
31Note: Transaction Value calculated as consideration paid to holders of stock and stock equivalents plus assumed debt.1) Based on median revenue multiple and stock premium data where available.

Introduction to SagePoint Advisors
Telecommunication & Data Center Services M&A – Q3 2010

Introduction to SagePoint Advisors
SagePoint Advisors is a boutique investment banking firm providing merger, acquisition and strategic advisory services to technology and telecom companies and their venture backers.
MissionTo deliver the senior‐level attention, trusted relationships and market insight on $10‐100 million M&A transactions that other investment banks reserve only for much larger transactionsinvestment banks reserve only for much larger transactions.
Services Sell Side Advisory; Divestitures; Buy Side Advisory; Strategic Investments
IndustryFocus
Software, hardware and services in the Wireless, VoIP, IP Video, Networking, Internet, Telecom Equipment, IT Infrastructure and Enabling Technology sectorsg gy
Offices San Diego, CA
33Telecommunication & Data Center Services M&A – Q3 2010
SagePoint Advisors Team
D id P Mi h l F d &M i DiDavid P. Michaels ‐ Founder & Managing DirectorPrior to founding SagePoint Advisors in 2008, David Michaels was a Co‐Founder, Partner and Managing Director atMontgomery & Co., a leading investment bank focused on serving emerging‐growth technology companies and their venturebackers. Mr. Michaels co‐founded Montgomery’s investment banking business in 1996 as the lead banker and played aninstrumental role in building the business to over $50 million in revenues and 80 employees. Mr. Michaels launchedMontgomery’s San Diego office in 2003 and established Montgomery as the dominant brand in the region. Mr. Michaels alsog y g g y gran the firm’s Communications and Digital Media Technology practice areas for several years prior to his departure. Duringhis 14 year tenure at Montgomery, Mr. Michaels advised CEOs and Boards on more than 75 corporate strategy, M&A and fundraising engagements.
Mr. Michaels has intimate knowledge of the strategic landscape, market dynamics and technology underpinnings of severalhigh technology market segments including wireless infrastructure, software and services, voice, video and datainfrastructure software and services storage infrastructure and software networking equipment Internet software andinfrastructure, software and services, storage infrastructure and software, networking equipment, Internet software andservices and semiconductors. Prior to co‐founding Montgomery’s investment banking business, Mr. Michaels managedstrategic consulting assignments for the firm including market entry analysis, acquisition search studies and strategic portfolioassessments.
Prior to joining the Montgomery in 1994, Mr. Michaels held various investment banking positions including a position withinBankers Trust Corporate Finance Department, where he helped execute merger and acquisition assignments such as salemandates and valuation analyses. Prior to that, Mr. Michaels worked as a structural engineer at General Dynamics, where heassisted on the Advanced Tactical Fighter program. Mr. Michaels received an M.B.A. with an emphasis in marketing andentrepreneurship from the Anderson School of Management at UCLA and holds a B.S. in Mechanical Engineering from theUniversity of Michigan.
Teak Murphy ‐ Senior AssociatePrior to joining SagePoint, Teak worked as a Senior Associate with Enterprise Partners Venture Capital, the largest SouthernCalifornia based VC firm, where he evaluated investment opportunities and worked closely with senior management andboard members to successfully grow portfolio companies. Prior to Enterprise Partners, Teak worked as an Associate intechnology investment banking at Montgomery & Co. where he spent three years working closely with SagePointʹs founderDavid Michaels on buy‐side and sell‐side M&A transactions. Prior to Montgomery, Teak worked at Cowen & Co. advisingtechnology companies on M&A and IPO transactions.
34
gy p
Teakʹs experience working on fund raising, mergers and acquisitions, and initial public offerings as both an advisor andinvestor provides unique insight into the needs of venture‐backed companies. Teak graduated from the University of SouthernCalifornia with honors, receiving a B.S. in Business Administration and Finance .
Telecommunication & Data Center Services M&A – Q3 2010
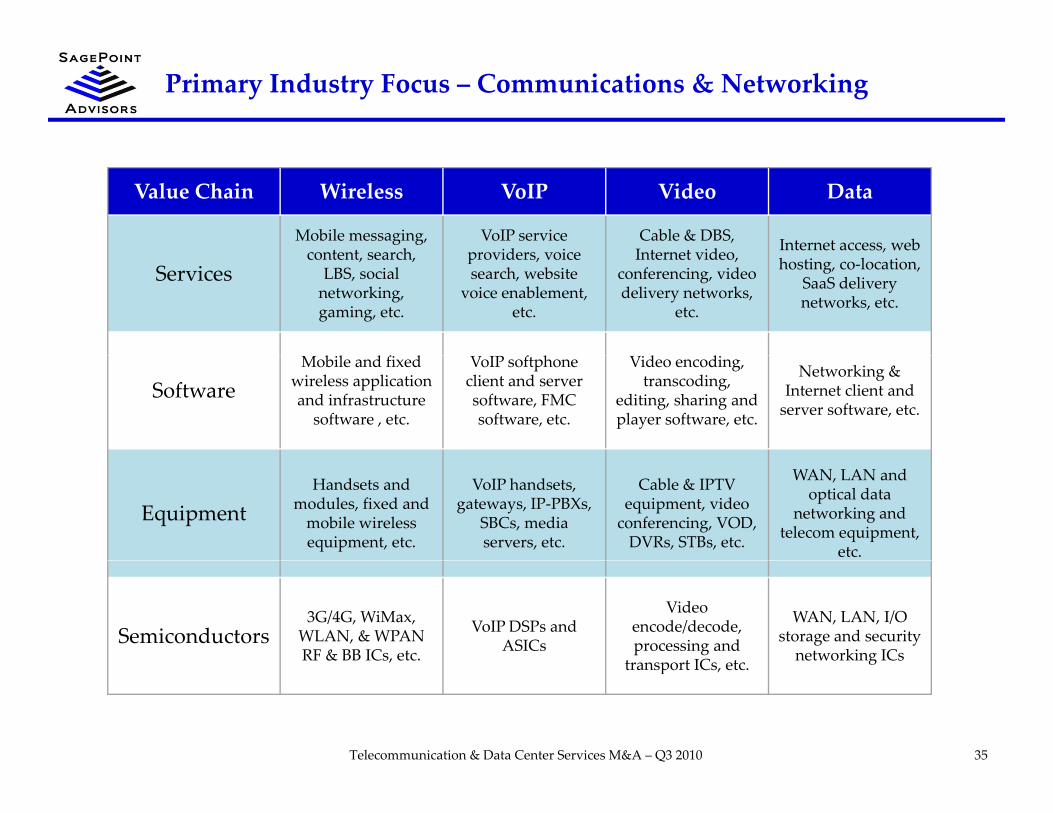
Primary Industry Focus – Communications & Networking
Value Chain Wireless VoIP Video Data
Mobile messaging, content search
VoIP serviceproviders voice
Cable & DBS, Internet video Internet access, web
Servicescontent, search, LBS, social networking, gaming, etc.
providers, voice search, website
voice enablement, etc.
Internet video, conferencing, video delivery networks,
etc.
hosting, co‐location, SaaS delivery networks, etc.
b l d f d I f h d d
SoftwareMobile and fixed
wireless application and infrastructuresoftware , etc.
VoIP softphoneclient and server software, FMC software, etc.
Video encoding, transcoding,
editing, sharing and player software, etc.
Networking &Internet client and server software, etc.
EquipmentHandsets and
modules, fixed and mobile wireless equipment, etc.
VoIP handsets,gateways, IP‐PBXs,
SBCs, media servers, etc.
Cable & IPTV equipment, video conferencing, VOD, DVRs, STBs, etc.
WAN, LAN and optical data
networking and telecom equipment,
etc.
Semiconductors3G/4G, WiMax,
WLAN, & WPAN RF & BB ICs, etc.
VoIP DSPs and ASICs
Video encode/decode,processing and
transport ICs etc
WAN, LAN, I/O storage and security networking ICs
35
transport ICs, etc. g
Telecommunication & Data Center Services M&A – Q3 2010

Transaction Experience of SagePoint Team
has sold certain assets to
Undisclosed Handset OEM
BuysideAdvisory
has been acquired by
Undisclosed Buyer
has been acquired by
$34 875 000
has been acquired by has been acquired by has sold its assets to
$10 000 000
has beeni d b
October 2008 2008November 2008
y
Senior Convertible
September 2007
$34,875,000
has been acquired by
August 2009 April 2008 October 2007
$10,000,000
I itial Publi Offe i Initial Public Offeringhas been acquired by has sold its SRAM
assets toacquired by
August 2006
Debentures
$5,000,000
Financial Advisor and Placement Agent
July 2006
q y
January 2007
Initial Public Offering$82,500,000
June 2007
Co‐manage
Initial Public Offering$167,440,000
September 2006
Co‐manager
August 2006
assets to
January 2006
has beenacquired by
has agreed to the sale of their NAS
Software Intellectual Property to
$50 000 000
Private Investment in Public Equity
$14,400,000
Co‐Agent Strategic Investor
has sold a minority stake to has been acquired by
has been acquired by
$122 500 000
has been acquired by
October 2005
has beeni d b
$50,000,000
May 2005January 2006 2005 August 2004 April 2004
$122,500,000
March 2004
has been acquired by l has merged withhas been acquired by
36
acquired by
August 2003
has been acquired by
February 2003
has been acquired by
April 2002
Private Placement
July 2001
Placement Agent
$9,900,000Private Placement
May 2000
Placement Agent
$11,000,000
has merged with
March 2000
$157,000,000
has been acquired by
December 2003
Telecommunication & Data Center Services M&A – Q3 2010

Transaction Experience by Market Segment
SagePoint’s Founder has led more than 75 M&A and fund raising engagements with deal experience across the entire communications and networking value chain.
Value Chain Wireless VoIP Video DataValue Chain Wireless VoIP Video Data
Services• Sale of Xumii toMyriad Group
• Capital Raise for
• Sale of AccessLine to Telanetix
• Strategic Advisory for Voice 2 0 Service
• Strategic Advisory for DirecTV Reseller
• Sale of Compute Intensive to Verio
• Sale of GeoNet to Level 3
InfoSonics Voice 2.0 Service Provider • Capital Raise for
Speakeasy
Software• Sale of Neven Vision to Google
• Sale of SKY
• Sale of CrystalVoice to Global IP Solutions
• Buyside Advisory for
• IPO for Divx• Strategic Advisory for Mobile Video SW
• Sale of LVL7 to Broadcom
Sale of SKYMobileMedia; VOIP Softphone
Vendor
Mobile Video SW Vendor • Sale of Netreon to CA
Equipment• Sale of Strix to Idream• Sale of Aiprime to
• Strategic Advisory for Unified Messaging Vendor
• Sale of Gyration to Philips
• Sale of Network Physics to OpNet
• Capital Raise for kSierra Wireless • Strategic Advisory for
IP‐PBX Vendor• Sale of TIR to Philips Raptor Networks
• Sale of Procom to Sun
Semis
• Sale of CommAsic to Freescale
• Peregrine Strategic • Strategic Advisory for Noise Cancellation IC
• Sale of Vativ to Entropic
• Strategic Advisory for • Strategic Advisory for Storage Networking IC
37
Investment• Sale of Synad to ST
Vendorg y
Video Processing IC Vendor
Vendor
Telecommunication & Data Center Services M&A – Q3 2010
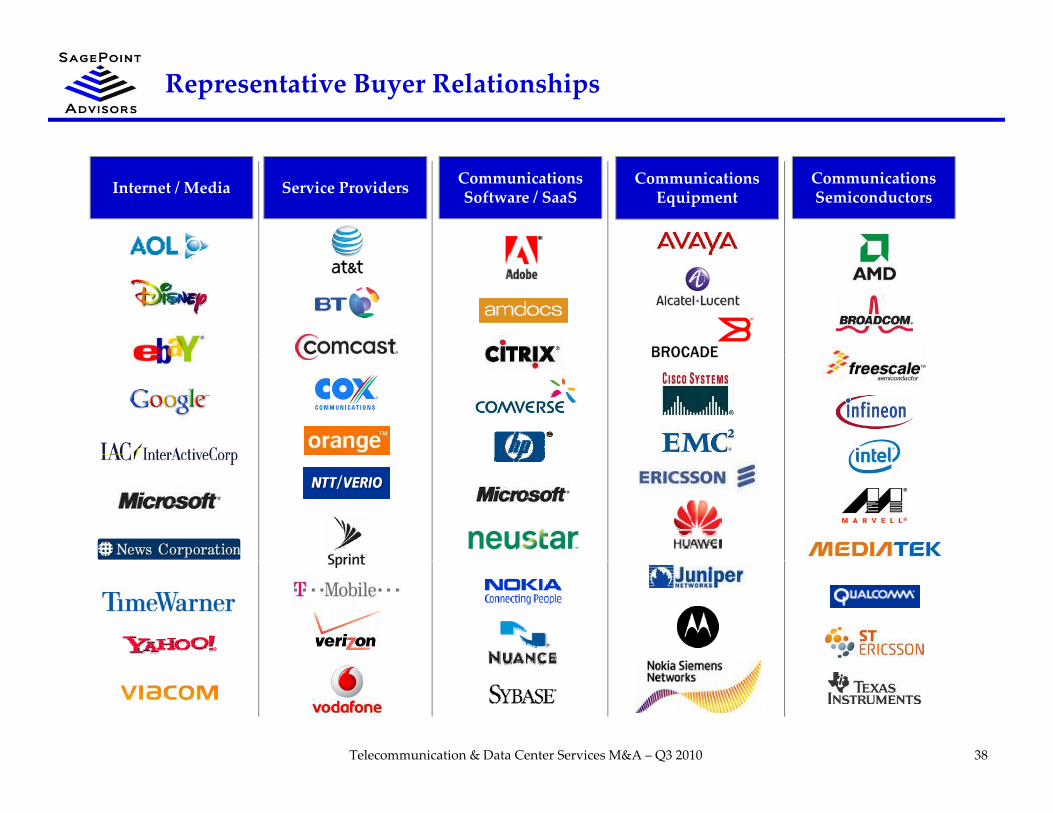
Representative Buyer Relationships
Internet / Media Service Providers Communications Equipment
CommunicationsSemiconductors
CommunicationsSoftware / SaaS
38Telecommunication & Data Center Services M&A – Q3 2010
Why Work With SagePoint?
• SagePoint delivers the senior‐level attention trusted relationships and market insight on• SagePoint delivers the senior‐level attention, trusted relationships and market insight on $10‐100M transactions that larger investment banks reserve only for much larger transactions
• SagePoint’s domain knowledge is world‐class across the entire communications and g gnetworking value chain
• SagePoint has developed trusted relationships with the most active strategic buyers across the communications value chain
• SagePoint has the M&A expertise that comes only from decades of experience focusing on strategic transactions
• SagePoint’s unwavering integrity and commitment to intellectual honesty ensures that we tell our clients what they need to hear to make sound business decisions
• At SagePoint, we offer sage advice that points our clients in the right direction to ensure an optimal outcome
39Telecommunication & Data Center Services M&A – Q3 2010