salamońska, justyna; baglioni, lorenzo grifone; recchi ... · justyna salamońska, lorenzo grifone...
TRANSCRIPT

www.ssoar.info
Navigating the European space: physical andvirtual forms of cross-border mobility among EUcitizensSalamońska, Justyna; Baglioni, Lorenzo Grifone; Recchi, Ettore
Veröffentlichungsversion / Published VersionArbeitspapier / working paper
Empfohlene Zitierung / Suggested Citation:Salamońska, Justyna ; Baglioni, Lorenzo Grifone ; Recchi, Ettore : Navigating the European space: physical and virtualforms of cross-border mobility among EU citizens. 2013 (EUCROSS Working Paper 5). URN: http://nbn-resolving.de/urn:nbn:de:0168-ssoar-395617
Nutzungsbedingungen:Dieser Text wird unter einer Deposit-Lizenz (KeineWeiterverbreitung - keine Bearbeitung) zur Verfügung gestellt.Gewährt wird ein nicht exklusives, nicht übertragbares,persönliches und beschränktes Recht auf Nutzung diesesDokuments. Dieses Dokument ist ausschließlich fürden persönlichen, nicht-kommerziellen Gebrauch bestimmt.Auf sämtlichen Kopien dieses Dokuments müssen alleUrheberrechtshinweise und sonstigen Hinweise auf gesetzlichenSchutz beibehalten werden. Sie dürfen dieses Dokumentnicht in irgendeiner Weise abändern, noch dürfen Siedieses Dokument für öffentliche oder kommerzielle Zweckevervielfältigen, öffentlich ausstellen, aufführen, vertreiben oderanderweitig nutzen.Mit der Verwendung dieses Dokuments erkennen Sie dieNutzungsbedingungen an.
Terms of use:This document is made available under Deposit Licence (NoRedistribution - no modifications). We grant a non-exclusive, non-transferable, individual and limited right to using this document.This document is solely intended for your personal, non-commercial use. All of the copies of this documents must retainall copyright information and other information regarding legalprotection. You are not allowed to alter this document in anyway, to copy it for public or commercial purposes, to exhibit thedocument in public, to perform, distribute or otherwise use thedocument in public.By using this particular document, you accept the above-statedconditions of use.

The Europeanisation of Everyday Life:
Cross-Border Practices and Transnational Identifications
among EU and Third-Country Citizens
Navigating the European Space:
Physical and Virtual Forms
of Cross-Border Mobility among EU Citizens
Justyna Salamońska, Lorenzo Grifone Baglioni and Ettore Recchi
EUCROSS Working Paper # 5
July 2013

2
This series of working papers originates from the research project The Europeanisation of Everyday Life: Cross-
Border Practices and Transnational Identities among EU and Third-Country Citizens (acronym: EUCROSS).
The EUCROSS research project is funded as part of the European Commission’s 7th Framework Programme
(‘Socio-economic Sciences and Humanities’, activity 8.5: ‘The Citizen in the European Union’; call identifier:
FP7-SSH-2010-2; Funding scheme: collaborative project – small and medium-scale focused research projects;
grant agreement: 266767). The project started on April 1, 2011 and is scheduled to end on March 31, 2014.
The research consortium is formed by:
- Università ‘G. d’Annunzio’ di Chieti-Pescara, Italy (coordinator: Ettore Recchi);
- GESIS–Leibniz Institut fűr Sozialwissenschaften, Mannheim, Germany (coordinator: Michael Braun);
- Aarhus Universitet, Denmark (coordinator: Adrian Favell);
- IBEI–Institut Barcelona d’Estudis Internacionals, Spain (coordinator: Juan Díez Medrano);
- University of York, United Kingdom (coordinator: Laurie Hanquinet);
- Universitatea din Bucuresti, Romania (coordinator: Dumitru Sandu).
The EUCROSS project and this working paper series are coordinated by Ettore Recchi at the Università ‘G.
d’Annunzio’ di Chieti-Pescara.
For additional information: www.eucross.eu.
This is Deliverable D9.8 of Workpackage 9 (Dissemination and exploitation strategies)
Release date: July 15, 2013

3
Contents
Introduction ............................................................................................................................................ 5
Mapping mobility forms.......................................................................................................................... 6
Physical/high permanence mobility (migration-like) .......................................................................... 6
Physical/low permanence (tourism-like) ............................................................................................ 9
Virtual/personal mobility (facebook-like) ........................................................................................ 11
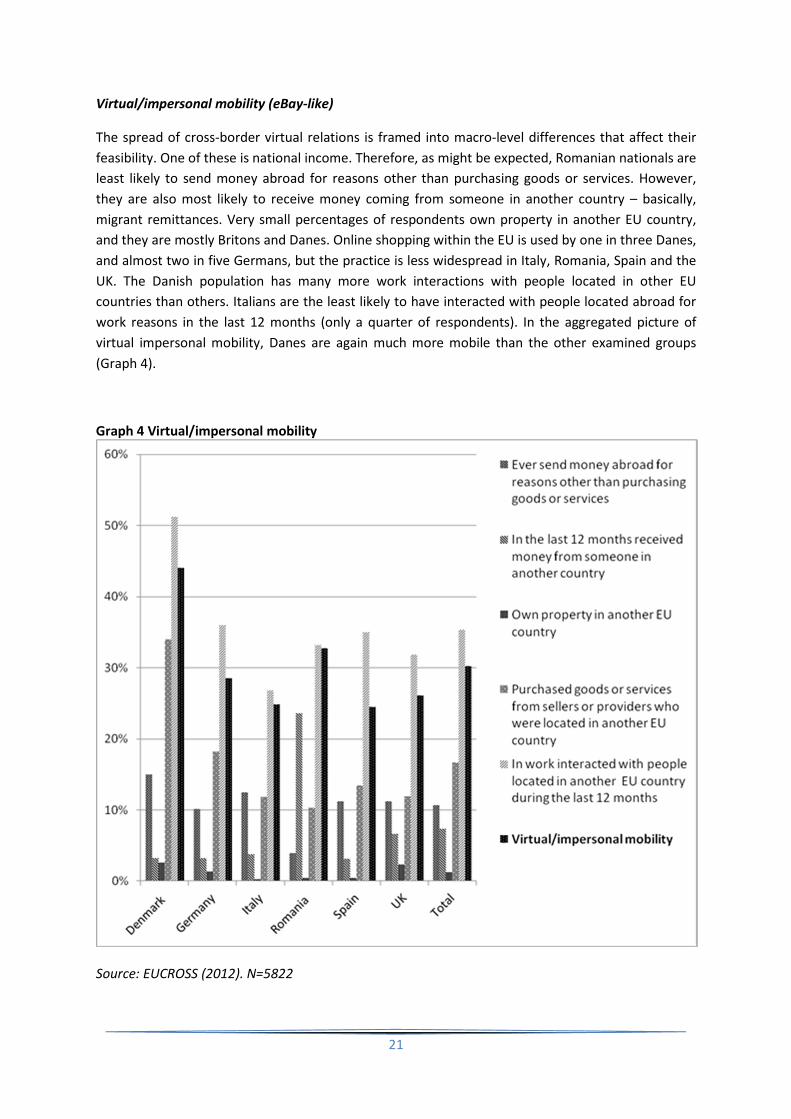
Virtual/impersonal mobility (eBay-like) ............................................................................................ 13
Data and methods ................................................................................................................................. 14
EUCROSS data analysis .......................................................................................................................... 17
Descriptive analyses: forms of mobility across countries ................................................................. 17
Physical/high permanence (migration-like) mobility. ................................................................... 17
Physical/low permanence (tourism-like) mobility ........................................................................ 19
Virtual/personal (facebook-like) mobility ..................................................................................... 20
Virtual/impersonal (eBay-like) mobility ........................................................................................ 21
Multiple regressions analyses ........................................................................................................... 22
Conclusions: mobilities and European citizenship ................................................................................ 25
References ............................................................................................................................................ 27
Appendix – Tables ................................................................................................................................. 30

4
Executive Summary
Drawing on earlier works in the EUCROSS series, this working paper proposes a comprehensive
picture of physical and virtual mobility practices. Physical mobilities are characterised with regards
to the time factor, thus distinguishing between high and low permanence practices (or ‘migration-
like’ and ‘tourism-like’ mobilities). Virtual mobilities may have personal or impersonal character
(taking a ‘facebook-like’ or an ‘eBay-like’ form). A short discussion of each mobility type is
additionally described with existing sources (mainly from Eurostat). This range of cross-border
practices is then mapped within the European countries in which the EUCROSS survey was carried
out (Germany, the UK, Denmark, Italy, Spain and Romania). Quite against conventional wisdom
which suggests that EU citizens make modest use of their free movement rights and are rather
immobile, we found that one in six Europeans of the EUCROSS sample has spent at least three
months in another EU country in their lifetime. Furthermore, 51 per cent have visited another EU
member state, even if for a short vacation, in the last two years. Europeans cross borders in a non-
physical sense as well (almost three quarters of our sample), when they connect online or on the
phone with significant others who migrated or with friends they met during their physical trips.
Finally, Europeans increasingly engage in cross-border transactions (almost one third of EUCROSS
sample), shopping online but also transferring money abroad. All these practices are socially
structured, their likelihood depending significantly on education, socioeconomic status, gender and
age in differing degrees, as multivariate analyses detail. National contexts matter as well. Danes are
most mobile when it comes to low permanence physical mobility and impersonal virtual moves. In
turn, Britons and Romanians – possibly with different purposes – have definitely higher odds of
having migrated, even in the wider sense of migration as ‘long-permanence mobility’ that we used.
This reverberates on being more strongly networked with other persons abroad than any other
nationality examined.

5
Navigating the European Space:
Physical and Virtual Forms of Cross-Border Mobility among EU Citizens
Justyna Salamońska, Lorenzo Grifone Baglioni and Ettore Recchi
Introduction
Multiple cross-border mobilities occupy our every-day lives – from online searching for shopping
deals across the world, to talking to friends abroad on Skype, to travelling for holidays or relocating
in other countries for longer spells. While many researchers examine the plurality of mobilities
under the transnationalism agenda, the EUCROSS project proposed ‘cross-border practices’ as the
umbrella concept to bring more clarity to ongoing discussions of mobilities. As Favell et al. (2011: 19)
outlined in the EUCROSS state of the art report, with cross-border practices ‘we intend to focus on
behaviours that are performed by any possible individual agent in any aspect of everyday life’. The
cross-border practices concept allows for a broad understanding of activities and behaviours that
span across national borders and it stresses the individual-level picture ‘from below’, giving a more
focused perspective to an otherwise rather general debate on space of flows (e.g. Castells 2000).
Furthermore, as suggested by previous working papers in the EUCROSS project series, by focusing on
diverse forms of mobilities, this research project seeks to overcome the implicitly assumed and over
rigid distinction between movers and stayers (Favell et al. 2011) drawing a map of mobilities in
which nationals in European countries are increasingly involved. This working paper examines how
such mobilities are enacted in the physical and virtual dimensions on the basis of the six-country
survey data generated by the EUCROSS project in 2012.
This paper adopts a comprehensive picture of mobilities. To begin with, the analysis of mobilities
requires a clear distinction between its different manifestations. The mobilities paradigm in social
sciences is still a relatively recent theoretical approach, and while distinctions between corporeal
and virtual mobilities are made, there is still need to draw sharp and exhaustive classifications.
Recchi (2012) offers one way to classify individual cross-border practices distinguishing between
physical mobilities of different permanence and virtual mobilities of personal/impersonal character.
This proposal is taken up in the analysis of European mobilities presented in this paper, which
differentiates physical ‘migration-like’ and ‘tourism-like’ mobilities on the one hand, from virtual
‘facebook-like’ and ‘eBay-like’ mobilities on the other. This range of cross-border practices is then
mapped within the six European countries in which the EUCROSS survey was carried out.
This classification of mobilities is expected to lead to a better understanding of the determinants of
different forms of mobility. The ‘mobility turn’ (Urry 2000) suggested that movement has become a
central concept to the understanding contemporary societies. However, even if we are living in a
world dominated by mobilities, access to them has never been equal. For instance, although in
Europe a theoretically free movement space exists, it is interesting to question which mobilities are
more accessible and for whom. The EUCROSS survey, carried out in six European countries, gives an
excellent opportunity to sketch out how different forms of mobility are determined by the ascribed
and achieved characteristics of persons engaging in them and by the contexts from which these
persons come from.

6
This paper proceeds as follows. It first illustrates a classification of mobility forms along the lines of
the EUCROSS project rationale. Then, a short discussion of each mobility type is additionally
described with existing sources (mainly from Eurostat). Finally, the EUCROSS dataset is used to
outline micro- and macro determinants of mobilities in Europe, thus seeking to answer the key
question about social and cultural differences in access to diverse forms of cross-border mobility.
Mapping mobility forms
In the search for a more structured analysis of different forms of mobility, Recchi (2012) outlined a
classification of cross-border individual activities by separating physical and virtual practices. Physical
mobilities can be characterised with regards to the time factor, thus distinguishing between high and
low permanence practices. The former are best described by migrations and the latter may be
exemplified with short term stays of tourist character. On the other hand, virtual mobility may be
described as involving personal connections or different types of transactions across national
borders. Personal mobility which does not involve physical movement takes place when people
communicate with others based abroad through different kinds of media, including phone, email
and increasingly important social media like Facebook (or its competitors). Individuals also move
internationally when they engage in transactions of different character that cross national borders,
like shopping online and sending or receiving money from abroad.
Distinguishing between different types of mobility also gives an opportunity to examine their social
patterning. For instance, in migration studies there is evidence of a growing incidence of middle-
class mobility (e.g. Conradson and Latham 2005). Low permanence mobility for professional reasons
is common for some occupations at the highest skill levels (e.g. Beaverstock 2005; Wickham and
Vecchi 2009), but higher social position may also come with more resources facilitating other forms
of international movement (like transferring savings or making investments abroad). Age remains an
important factor for virtual mobilities, with younger cohorts more accustomed to life embedded in
the new technologies (Duggan and Brenner 2013). Furthermore, bringing country contexts in to the
analysis is crucial to understanding how international movement is enacted. Newcomers to the EU
free movement regime have very different international mobility patterns when compared to EU15
citizens, who have enjoyed opportunities of unrestricted intra-European exchanges for decades.
Physical/high permanence mobility (migration-like)
International migration is traditionally the most researched form of physical mobility across borders.
For a long time, migration has been understood as a move from a place of origin to a destination of
(more or less) permanent character. Migration statistics reflect this trend, as they usually define
migrants as persons who are resident in a country other than their country of origin for at least a
year. Yet a plethora of international moves do not necessarily last a year or more, and migration
horizons for many become much broader and go beyond the origin and destination dichotomy. This
in particular is the case of intra-European mobility strategies, which are likely to have become more
flexible in the free movement regime space. Recently published studies challenge the conventional
view on migrations as taking place between origin and destination and as high permanence moves.
What they have in common is the focus on diverse motivations for migrations. Especially within the
‘old’ EU, the ‘guest-worker’ conceptualisation of migration does not fit the reality of people moving

7
for better quality of life, for studies, for family, or simply because they fall in love with somebody
residing in another country (Benson 2010; King 2002; King and Ruiz-Gelices 2003; Recchi and Favell
2009 for a comparative picture of intra-European migrants in the EU15). Furthermore, in the
aftermath of the EU enlargements of 2004 and 2007, population flows from East to West in Europe
grew substantially. While the movements of Central and Eastern Europeans are still largely regarded
as labour migration due to the economic rationale behind the moves (European Commission 2010),
a growing literature points to non-economic factors involved, including life-style issues, social
networks, quality of life, and life course related rationales (Cook et al. 2011; Eade 2007; Grabowska
2003; Koryś 2003; Wickham et al. 2009; Recchi and Triandafyllidou 2010; Krings et al. 2013).
Generally, intra-European migrations both of Western and Central-Eastern Europeans are illustrated
by numerous and rich qualitative accounts that describe in detail trajectories that develop across
countries, labour markets and individual life course, adding colour to our understanding of individual
migration projects in Europe.
Existing data provide a more detailed quantitative picture with regards to the scale and motivations
of such movements. In 2012, 20.7 million non-EU migrants and 13.6 million intra-European movers
resided in the EU27, that is 4.1% and 2.7% of the total population respectively (Eurostat 2012, Table
1). Non-EU migrants constituted 60.3% and intra-EU movers 39.7% of the migrant population in
EU27. Excluding Cyprus (12.6%) and Luxembourg (37.9%), small countries with a peculiar position in
the European context, the highest percentage of movers in relation to the total population is in
Ireland (8.5%), Belgium (7.0%), and Spain (5.1%). At the opposite end we find Romania, Bulgaria,
Poland, Latvia, Lithuania, and Slovenia, each one with no more than few thousands of intra-EU
movers. In addition to movers, who avail of European citizenship rights, we can also count 7.2
million Europeans from outside the EU, coming from Turkey, Albania and Ukraine (Eurostat 2010),
that is, countries that in the future could become the EU members. Therefore, over 20 million
Europeans, from within and outside of the EU, travel, study or work on the EU27 territory in a
country that is not their country of birth. They make up two-thirds of all non-national residents in
the EU.
Turning to EU movers only, we can locate origins and destinations of high permanence physical
mobility flows in the EU27. Most movers come from Romania (23.0%), Poland (16.6%), Italy (8.8%),
United Kingdom (7.3%), Germany (5.7%), and France (4.6%). The most popular destinations are
Germany (24.5%), Spain (22.7%), the United Kingdom (19.%), and Italy (14.3%). The largest outflows
originate from new member states of the EU. Inflows are predominantly directed towards larger EU
founding countries and Spain. Migration flows have not been immune to the current economic crisis.
The impact of the recession may be investigated by comparing intra-European mobility between
2008 and 2012. We can note a sharp increase in outflows from Romania (+13.2%) and, on the
contrary, a very strong decrease in outflows from Germany (-36.6%). Inflows declined most notably
in Germany (-8.7%), Spain (-5.2%), and Belgium (-3.5%).

8
Table 1 Resident population in EU by group of citizenship, 2012
Total Nationals Migrants Mig (%) Movers Mov (%)
EU-27 503,663,600 468,706,308 20,699,798 4.1 13,613,640 2.7
Austria 8,434,455 7,475,176 564,984 6.7 382,733 4.5
Belgium 11,094,850 9,866,885 446,331 4.0 778,573 7.0
Bulgaria 7,330,215 7,287,717 31,094 0.4 11,329 0.2
Cyprus 862,011 683,994 64,098 7.4 108,329 12.6
Czech Republic 10,505,445 10,082,454 271,710 2.6 151,256 1.4
Denmark 5,580,516 5,221,658 223,827 4.0 134,887 2.4
Estonia 1,318,005 1,110,933 192,161 14.6 14,397 1.1
Finland 5,401,267 5,218,134 113,438 2.1 68,259 1.3
France 65,327,724 61,469,429 2,505,162 3.8 1,353,133 2.1
Germany 81,843,743 74,433,989 4,664,977 5.7 2,744,777 3.4
Greece 11,290,067 10,314,693 824,220 7.3 151,154 1.3
Hungary 9,957,731 9,750,157 79,705 0.8 127,869 1.3
Ireland 4,582,769 4,031,974 99,105 2.2 388,793 8.5
Italy 60,820,696 55,960,451 3,375,426 5.5 1,450,147 2.4
Latvia 2,041,763 1,708,870 326,153 16.0 6,740 0.3
Lithuania 3,007,758 2,984,909 17,619 0.6 2,966 0.1
Luxembourg 524,853 294,983 31,189 5.9 198,681 37.9
Malta 417,520 396,999 - - 10,603 2.5
Netherlands 16,730,348 15,944,291 336,894 2.0 360,847 2.2
Poland 38,538,447 38,472,199 39,025 0.1 18,425 0.0
Portugal 10,541,840 10,102,729 331,140 3.1 107,971 1.0
Romania 21,355,849 21,319,018 29,522 0.1 7,014 0.0
Slovakia 5,404,322 4,980,227 16,720 0.3 54,007 1.0
Slovenia 2,055,496 1,969,941 79,477 3.9 6,078 0.3
Spain 46,196,276 40,634,209 3,207,566 6.9 2,354,501 5.1
Sweden 9,482,855 8,827,755 370,052 3.9 276,043 2.9
United Kingdom 62,989,551 58,162,534 2,458,203 3.9 2,344,128 3.7
Source: Eurostat (online data code: migr_pop1ctz)
Our interest in mobility experience leads us to pay attention not only to current migrants, but also to
people who have some migration-like background. Such data are hard to find. However, a
Eurobarometer survey (EB73.3, March-April 2010) shows that 12.7% of European citizens have
worked abroad (including volunteering and traineeships) for at least three consecutive months, 7.6%
have attended school or studied abroad for at least half an academic year, and 10.4% have lived
abroad for reasons other than study or work for at least three consecutive months (Table 17 in
Appendix). These data highlight the variety of motivations among movers. In substance, almost one
in five Europeans has experienced life abroad at least for a few months, immersed in another social
and cultural space, getting to know people speaking different languages, and having different
customs. One in five Europeans has breathed the air of an EU member state other than his or her
own.
Altogether 17.8% of respondents spent at least three consecutive months in another EU country.
Among these, 10.4% performed only migration-like mobility (without any experience of tourism-like
mobility) and 7.4% made both migration-like and tourism-like mobility. Movers who have
experienced only migration-like mobility (without any tourism-like experience abroad) are mostly
men (57.3%), aged 25-39 (30.8%) or 55 and more (33.1%), graduates (42.7%), middle (34.0%) or
working class (38.6%). Migration-like and tourism-like movers are mostly men (56.5%), aged 25-39

9
(36.3%) or 40-54 (27.5%), graduates (53.7%) and are upper (37.6%) or middle class (38.1%) (see
Appendix, Tables from 9 to 12). The first profile resembles that of classic (including high-skilled)
migrants, while the second is rather that of a mobile bourgeois. Overall, it seems that physical
mobility practices are more common as the levels of human capital increase – maybe as a means of
social distinction and reproduction (Bourdieu 1986).
Data shows that the experience of working abroad is more frequent among residents of Luxembourg
(26.9%), Ireland (26.8%), Sweden (23.0%), and Denmark (21.9%). The habit of studying abroad is
more frequent among people living in Luxembourg (46.0%), Cyprus (20.8%), Sweden (15.9%), and
Ireland (15.0%). Residence in another country for reasons other than study or work is more common
among residents of Luxembourg (34.4%), Sweden (19.5%), Ireland (17.6%), Denmark (17.2%), and
Spain (16.5%). As we can see, there seem to be patterns of mobility for some countries. The case of
Luxembourg should not surprise, as its geographical and financial centrality in Europe leads to a high
level of transnationalism (also eased by its tiny size, which makes borders within arm’s reach).
Cyprus and Ireland also show high mobility levels, with historical, national, religious, and linguistic
factors underlying the cross-border propensities of their residents.
Why do people decide to start a physical mobility experience in EU? The Pioneur survey (Santacreu
et al. 2009) shows that three main motivations drive mobility in the EU15: love/family (29.1%), work
(25.2%), and quality of life (24.0%). These choices are gendered. Men move predominantly for work
(33.1%) and quality of life (24.3%). Women move in the first place for love/family reasons (37.4%)
and then for quality of life (23.6%). Men moving mostly for work on one side and women as tied
movers seem to reproduce the classical social roles divisions based on gender. The ‘male-
breadwinner’ and ‘female-homemaker’ profiles still loom large in a category of people – that is,
intra-EU15 migrants – which are distinguished by their transnational orientation, supposedly an
avant-garde of individuals projecting themselves out of a national, established and conventional
framework.
Physical/low permanence (tourism-like)
Migration is only one of the physical forms of mobility, and the ‘mobility turn’ described by Urry
(2000) points to a much broader world of mobilities. Originally inspired by the implications of ‘the
tourist gaze’ (Urry 1990), Urry turned the sociologist’s interest to varieties of mobilities: corporeal
travel, mobilities of objects, imaginative mobilities, and virtual travel (Urry 2000). While undermining
the importance of nation-state containers, Urry’s contribution highlights the growing salience of
cross-border practices in their variety. However, it is necessary to provide a more fine grained and
nuanced recognition of differing kinds of mobility in order to avoid hyperbole, and this aim lies
behind the concerns of the EUCROSS project.
The importance of short term mobility may be measured in economic terms, with tourism being
among the biggest industries of the world, its growth being undeterred even by the global recession
(WTO 2012). In 2011, the number of international tourist arrivals reached 982 million globally. The
World Tourism Organization defines tourists as people ‘traveling to and staying in places outside
their usual environment for not more than one consecutive year for leisure, business and other
purposes’. More specifically, the ‘tourist’ is the visitor that makes at least one overnight stop and
stays for at least 24 hours. In turn, the ‘excursionist’ stays for less than 24 hours (for instance as a

10
day-tripper or people on a cruise). The UN defines ‘outbound tourism’ as a form of tourism ‘involving
residents traveling in another country’.
Tourist trips are possibly the most common form of short-term physical movements, but short trips
for work trigger mobility as well (for an interesting example of the importance of physical travel in
otherwise highly virtual software sector, see Wickham and Vecchi 2009). The expansion of travel has
been examined in the context of social change in the last century (Kaelble 2004; Recchi and Kuhn
2013) and as a socially stratified phenomenon (Frändberg 2009). Travel themes were also picked up
by the migration literature. Researchers study how new migrant destinations may become gates to
further travels (Dobruszkes 2009; Conradson and Latham 2005; Kennedy 2010), and how ‘new’
European migrants (but also ‘old’ EU residents) travel to access medical services in Central and
Eastern Europe (Krings et al. forthcoming), just to name a few aspects of travel. The growing scale of
physical tourist-like mobility within the EU is largely facilitated by the fast growth of transport, and
especially, low-cost air carriers.
Table 2 Number of trips made by EU27 residents by group of citizenship, 2011
Total Inbound In (%)
EU-27 1,152,484,194 833,575,050 72.3
Austria 20,058,679 10,184,981 50.8
Belgium 12,010,635 Na
Bulgaria 5,890,560 5,114,090 86.8
Cyprus 1,923,174 Na
Czech Republic 35,759,284 29,847,408 83.5
Denmark 32,034,168 23,940,608 74.7
Estonia Na
Finland 42,836,000 35,561,000 83.0
France 224,939,600 199,646,460 88.8
Germany 270,487,078 185,795,317 68.7
Greece Na
Hungary 20,077,921 15,663,802 78.0
Ireland Na
Italy 69,059,102 55,527,938 80.4
Latvia 4,723,399 3,471,953 73.5
Lithuania 4,005,829 2,479,358 61.9
Luxembourg 1,644,780 Na
Malta 480,681 216,996 45.1
Netherlands Na
Poland 35,110,000 30,068,300 85.6
Portugal 12,035,507 10,783,176 89.6
Romania 12,894,441 11,985,610 93.0
Slovakia 8,608,962 5,324,128 61.8
Slovenia 4,766,000 1,356,000 28.5
Spain 137,383,858 125,436,403 91.3
Sweden 49,878,000 36,941,000 74.1
United Kingdom 142,688,775 92,194,053 64.6
Source: Eurostat (online data code: tour_dem_ttq)
Interestingly, a large part of European tourism takes place within the EU. Indeed, 72.3% of the
arrivals in EU27 countries come from another EU country (Eurostat 2011). Particularly, comparing
the different types of tourism and counting the number of trips, we find that inbound tourism is

11
most prevalent in short holiday trips (without overnight stay) (91.0%), more than in all holiday trips
(76.0%) (excursions from one to three overnight stays), and long holiday trips (59.0%) (holidays with
at least four overnight stays). Intra-EU trips are prevalent among citizens of Romania (93.0%), Spain
(91.3%), Portugal (89.6%), France (88.8%), Bulgaria (86.8%), and Poland (85.6%). At the opposite
end, there are the citizens of Malta (45.1%) and Austria (50.8%), who however still choose intra-EU
destinations relatively often. Slovenia (28.5%) is a notable exception as the only European country
where tourism directed towards outside the EU is highly prevalent – but this is largely explained by
trips to Croatia, which now counts as EU (Table 2). Overall, nearly three in four European tourists
spend their holidays in the EU: that is, abroad, but not in entirely abroad.
With regards to the frequency of low permanence physical mobility, the Eurobarometer survey
(EB73.3, March-April 2010) shows that 21.9% of European citizens regularly spend their
holidays/weekends abroad, out of which 14.5% reported only tourism-like mobility (without any
experience of migration-like mobility) and 7.4% experienced both tourism-like and migration-like
mobility spells. Just over one in five Europeans have made tourist trips within the EU, thus
experiencing a short period (less than three months, in this case) of stay in another European
country. Movers who have experienced only tourism-like mobility (without any migration-like
experience abroad) are both males (49.5%) and females (50.5%), more likely aged 40-54 (28.5%) or
55 and older (30.8%), holding undergraduate degree (43.5%) and middle class (46.0%) (see
Appendix, Tables from 9 to 12).
Virtual/personal mobility (facebook-like)
While people have been physically mobile for centuries, one of the new features of mobilities is
virtual travel, which is instantaneous and simultaneous, but does not include physical movement
(Urry 2000; Cooper et al. 2002). While lowering costs of transport facilitated the growth of physical
mobility, development of information and communication technologies had an enormous impact on
the ways people communicate with each other. Studies of transnational social networks were
initially the domain of migration studies which explored how mobile people kept in touch with
significant others back home. These ‘travelling-in-dwelling’ practices of communication by email or
phone were becoming cheaper and more easily accessible, especially when compared with previous
generations (e.g. Clarke 2005). What is more, social networking sites have developed fast over the
last years as new platforms of communications in addition to phone and email, and are used in order
to keep in touch with family and friends but also to reconnect with old friends (Smith 2011). For
instance, Polish migrants in Ireland who accessed the social networking platform ‘nasza-klasa’ (based
on school connections) turned it into the 11th
most accessed website in the country (Komito and
Bates 2009). However, if migrants’ practices are an extreme illustration of information and
communication technologies’ use linked to physical mobility, the recent success of several other
social network platforms challenge the ways we think about mobility. Thus, instead of drawing a
dichotomy of migrants and stayers, or mobile versus immobile, we suggest thinking about a
continuum of mobilities. Mau’s work (2010) on social transnationalism based on a survey carried out
in Germany points precisely to that: almost half of the residents in Germany have social contacts
that cross national borders, although the geography of these international social networks is not
random, but embedded in specific geographical, cultural and historical contexts.
Eurostat data (2012) shows that connecting to the internet has become a daily practice for the large
majority of European citizens (59.0%) or, at least, is a weekly habit (11.0%). Internet has become an

12
almost inexhaustible supply of contacts for leisure or for work. Today, 65.0% of Europeans use the
internet to send and receive e-mails, 26.0% to telephone or video call via computer, 38.0% share
their profiles and their ideas on general social media (like Facebook or Twitter) and 11.0% on
professional social media (like Linkedin or Xing) (Table 3).
Table 3 Individual use of social and professional media by main citizenship group, 2012
E-mailing
(%)
Phoning or
video calling
via
computer
(%)
Social media
(%)
Professional
media (%)
EU-27 65 26 38 7
Austria 73 23 35 11
Belgium 74 26 40 6
Bulgaria 42 40 30 4
Cyprus 46 35 33 3
Czech Republic 69 40 27 5
Denmark 86 40 55 16
Estonia 70 46 37 13
Finland 81 21 45 17
France 72 23 36 6
Germany 76 22 42 8
Greece 41 21 28 4
Hungary 67 31 52 10
Ireland 66 29 40 8
Italy 48 18 26 5
Latvia 63 45 55 8
Lithuania 54 48 36 2
Luxembourg 87 36 46 15
Malta 60 25 45 11
Netherlands 89 39 46 19
Poland 51 24 36 4
Portugal 53 19 32 6
Romania 38 22 25 3
Slovakia 70 47 48 2
Slovenia 57 20 32 3
Spain 62 22 35 7
Sweden 86 38 54 10
United Kingdom 78 35 50 11
Source: Eurostat (online data code: isoc_bde15_cua)
E-mailing is more frequent in the Netherlands, Luxembourg, Denmark, Sweden, and Finland. Phoning
or calling via computer is more widespread in Lithuania, Slovakia, Estonia, and Latvia. General social
media use is more frequent in Latvia, Denmark, Sweden, and Hungary, while professional social
media use is more widespread in the Netherlands, Finland, Denmark, Luxembourg, and Estonia.
Compared to traditional media, internet makes it possible to connect to people and places that
otherwise would be difficult to reach. Eurobarometer shows that 27.3% of European citizens have
close relatives who live in a foreign country, and 39.7% have close friends who live abroad. Another
29.1% of Europeans have family roots and friends in their countries of origin, and 8.2% have lived

13
with a partner of a different citizenship than their own (EB73.3, March-April 2010). For all of these
people, new media becomes ever the more necessary for keeping in touch frequently and
affordably.
Virtual/impersonal mobility (eBay-like)
Finally, people engage in non-physical mobility when they participate in transactions that cross
national borders, sending money or purchasing goods or services in a country other than their
country of origin or residence. Before the economic crisis, one important trend of virtual impersonal
mobility (especially for middle- and upper-class citizens of the richest Central-Northern European
countries) was that of buying a second property abroad. At the end of the first decade of the 21st
century, 3.3% of European citizens claim to have purchased real property in a foreign country
(EB73.3, March-April 2010). Wickham (2007) analyses precisely the development of second home
ownership as one of the aspects of contemporary mobilities. From the end of 1990s until 2003-04,
ownership of property abroad among the UK households grew by almost 50% to reach over quarter
of a million (Aspden 2005). Smaller scale transactions of online shopping are becoming more
widespread, and this form of consumption is perceived as a more convenient and time saving
option, although consumers may raise concerns about disclosing personal and credit card details
online (Horrigan 2008).
Table 4 Individual internet purchase by main citizenship group, 2008-2012
2008 (%) 2012 (%)
EU-27 24 35
Austria 28 39
Belgium 14 33
Bulgaria 2 6
Cyprus 7 17
Czech Republic 13 18
Denmark 47 60
Estonia 7 17
Finland 33 47
France 28 42
Germany 42 55
Greece 6 16
Hungary 8 15
Ireland 30 35
Italy 7 11
Latvia 10 18
Lithuania 4 14
Luxembourg 36 57
Malta 16 37
Netherlands 43 55
Poland 12 21
Portugal 6 13
Romania 3 3
Slovakia 13 30
Slovenia 12 22
Spain 13 22
Sweden 38 58
United Kingdom 49 64
Source: Eurostat (online data code: isoc_ec_ibuy)

14
If we think about impersonal virtual mobility as an ‘eBay-like’ experience we can see that the share
of Europeans who made a purchase on the internet increased by 50% in four years. If in 2008 24% of
EU residents had used the world wide web for shopping, in 2012 they reached 35% (Eurostat 2012).
Despite the crisis, or just coinciding with it, the decrease of consumption in the real market has been
compensated by an expansion in consumption in the virtual market (Table 4).
The picture of mobilities sketched on the basis of existing datasets gives some indications as to who
moves and how, but it also leaves many open questions. The EUCROSS survey enquiry was intended
to fill some of the gaps in our knowledge about mobilities. The following section presents the
dataset and explains how the survey may add to our understanding of cross-border activities.
Data and methods
This paper is based on the quantitative data coming from the EUCROSS survey1. The survey provides
an up-to-date and detailed picture of physical and virtual mobility practices as reported by nationals
of six European countries (Denmark, Germany, Italy, Romania, Spain and the United Kingdom). In
total, 6000 respondents were interviewed in 2012 – that is, 1000 per country. As outlined in
Pötzschke (2012), the EUCROSS survey focused on three dimensions of cross-border practices:
physical mobility, virtual mobility and cosmopolitan consumption and competences. This paper looks
in detail at physical and virtual mobility practices taking place within Europe. As anticipated, the
analysis makes a distinction between high and low permanence physical mobility on the one hand
and personal and impersonal forms of virtual mobility on the other. Spatial and virtual dimensions of
mobility are measured by the items listed in Table 5.
With regards to physical mobility of high permanence, our analysis expands Eurobarometer 73 (see
also Table 6) by looking at the experiences of mobility that took place in childhood/adolescence
versus experiences as an adult. This seems an important distinction, as it may point to how
migration as a child affects the propensity to migrate independently as an adult. On the macro level,
this distinction allows for drawing comparisons between the ‘old’ and ‘new’ EU member states, as
for Romanians freedom of movement within the EU is a very recent right. Similarly, when examining
low permanence physical mobility, EUCROSS makes a distinction between moves that took place
before and after becoming an adult and takes into consideration a variety of reasons for short
mobility, not limited to vacation, but also taking into account personal, professional, educational or
volunteering reasons. Regarding virtual mobility of a personal character, Eurobarometer focuses on
the presence of affective links with family or friends based abroad and friends coming from abroad
in the country of residence, or alternatively, having a partner of different citizenship than the
respondent’s. EUCROSS broadens the scope of enquiry by looking at the modes of communication in
more detail and including the work sphere as well. Finally, in examining non-physical impersonal
mobility, EUCROSS poses more detailed questions about increasingly common transactions in online
1 EUCROSS fieldwork took place between June 2012 and January 2013 and it was carried out by
Sozialwissenschaftliches Umfragezentrum GmbH (SUZ) based in Duisburg (Germany). SUZ conducted survey in
all countries examined (Denmark, Germany, Italy, Romania, Spain and the United Kingdom) in order to assure
consistency of fieldwork across different national contexts. Computer-assisted telephone interviews (CATI)
were carried out by trained interviewers, all of whom were native speakers. Sample selection was based on
random digit dialling (RDD).

15
shopping and money transfers across borders. Generally, EUCROSS draws a more comprehensive
and theoretically sound map of different forms of mobility, which we will now turn to.
Table 5 Forms of mobility and their indicators
Mobility dimension Items
Physical/high permanence mobility
within EU (migration-like)
Lived in another EU country for three or more months before
turning 18
Lived in another EU country for three or more months since turning
18
Ever participated in an international exchange program funded or
co-funded by the EU
Physical/low permanence mobility
within EU (tourism-like)
Visited one or more EU countries before turning 18
Visited one or more EU countries in the last 24 months
Mobility virtual/personal
(facebook-like)2
Talked to family members, in-laws and friends abroad by
phone/computer in the last 12 months*
Communicated by mail or e-mail with family, friends*
Communicated via social networks with family, friends*
Received email messages from abroad*
Mobility: virtual/impersonal (eBay-
like)
Ever sent money abroad for reasons other than purchasing goods or
services*
In the last 12 months, received money from someone in another
country*
Own property in another EU country
Purchased goods or services from sellers or providers who were
located in another EU country
At work, interacted with people located in another EU country
during the last 12 months*
*For these items breakdown for the EU not possible
2 EUCROSS did not distinguish between European and non-European virtual mobilities (with the exception of
property ownership, shopping and work relations), considering that in all other instances virtual mobility may
depend on the origins of the people one is communicating with or their physical location. In the case of highly
mobile individuals, the situation becomes even more problematic, as virtual communication media allow
reaching a person when he or she travels.

16
Table 6 Mobility indicators – comparison between Eurobarometer and EUCROSS
High permanence physical mobility indicators
Eurobarometer
- Have you worked abroad (including volunteering and traineeships) for at least three consecutive months?
[yes, no];
- Have you attended school or studied abroad for at least half an academic year? [yes, no];
- Have you lived abroad for reasons other than study or work for at least three consecutive months? [yes, no].
Eucross
- 1.5.1 In which year did you settle in CoR? [note date];
- 2.3 Why did you decide to settle in CoR? [work, education, quality of life, family/love];
- 2.4 Have you ever lived in another country for three or more consecutive months before you turned 18? [yes,
no];
- 2.4.1 In which country or countries? [note country - multiple response];
- 2.4.2a When did you live in this country? [note period - multiple response];
- 2.4.2b In which of these countries have you lived the longest and when did you live there? [note country and
period];
- 2.6 Have you lived in another country for three or more consecutive months since you turned 18? [yes, no];
- 2.6.1 In which country or countries? [note country - multiple response];
- 2.6.2a When did you live in this country? [note period - multiple response];
- 2.6.2b In which of these countries have you lived the longest and when did you live there? [note country and
period];
- 2.6.3 Why did you move there? [work, education, quality of life, family/love].
Low permanence physical mobility indicators
Eurobarometer
- Do you regularly spend your holidays/weekends abroad? [yes, no].
Eucross
- 2.5 Please think about all your journeys abroad before you turned 18 (e.g. with your parents, other relatives,
school or alone). How many countries did you visit before you turned 18? [none, 1, 2, 3-5, 6-10, more than 10];
- 2.11 Please think of trips abroad which included at least one overnight stay. How many of these trips have
you had in the past 24 months? [none, 1, 2, 3-5, 6-10, more than 10];
- 2.11.1 Which country or countries did you visit? [note country - multiple response];
- 2.11.2 Which were the main reasons for those trips? [vacations (including short and week-end trips etc.); to
visit friends and/or relatives; other private reasons; professional reasons (e.g. business trips, conferences);
education (e.g. language classes, internships); volunteering (e.g. doing unpaid work for an NGO)].
Personal virtual mobility indicators
Eurobarometer
- Have you close relatives (brothers, sisters, children, parents) who live in a foreign country? [yes, no];
- Have you close friends who live in a foreign country? [yes, no];
- Have you close friends in their country who have moved here from abroad? [yes, no].
Eucross
- 2.13 Please think about all family members, in-laws and friends you have who live in [CoR]. I would like to
know how many are originally from other countries [A lot, a few, none];
- 2.14 Please think about all family members, in-laws and friends you have who live in [CoR]. I would like to
know… How many are originally from your country of birth? [A lot, a few, none], And how many are from
[CoR]? [A lot, a few, none], And how many are originally from other countries? [A lot, a few, none];
- 2.15 Please think about those family members, in-laws and friends who live in other countries… How many
are originally from your country of birth and also live there? [A lot, a few, none]; How many are from your
country of birth but live neither there nor in [CoR]? [A lot, a few, none]; In which country or countries are they
living? [note country - multiple response];
- 2.16 Please think about the last 12 months: How frequently did you talk to family members, in-laws and
friends abroad by phone or using your computer? [every day, at least once a week, at least once a month, less
often, never];
- 2.17 And how frequently did you communicate with them by mail or e-mail? [every day, at least once a week,
at least once a month, less often, never];
- 2.18 And how frequently via social networks? (e.g. Facebook, Hi5, Google+, etc.) [every day, at least once a
week, at least once a month, less often, never];

17
- 2.23 Please think about all private and business related messages you received by e-mail and, if you use
them, via social networking sites during the last 12 months. Approximately which percentage of them came
from abroad (excluding spam and junk messages)? [note estimated percentage].
Impersonal virtual mobility indicators
Eurobarometer
- Have you own real property/properties in a foreign country? [yes, no];
- Do you regularly follow news, cultural life or sports from a foreign country? [yes, no];
- Do you regularly eat food at home that is typical of a foreign country? [yes, no];
- Are you fluent in at least one foreign language? [yes, no].
Eucross
- 2.25 Do you ever send money abroad for reasons other than purchasing goods or services? [yes, no];
- 2.25.1 How often? [at least once a month, at least once a year, less than once a year];
- 2.25.2 Who do you send money to? [to my partner, close relatives, other relatives, other persons, an own
bank account];
- 2.26 In the last 12 months, have you received money from someone who is living in another country? If yes,
could you tell me who from? [from my partner, close relatives, other relatives, other persons, no];
- 2.27 Do you or your partner own property in your country of residence or in another country? [yes in CoR,
yes in another country, no];
- 2.27.1 And in which country is this property? [note country - multiple response];
- 2.28 Thinking about the last 12 months, have you purchased any goods or services from sellers or providers
who were located abroad (that is, for example, via websites, mail, phone, etc.)? [yes, no];
- 2.28.1 In which countries were these sellers or providers located? [note country - multiple response];
- 4.6 In your work, how often did you interact with people (e.g. business partners, clients, colleagues) who are
located in another country during the last 12 months? [every day, at least once a week, at least once a month,
less often, never].
EUCROSS data analysis
Descriptive analyses: forms of mobility across countries3
The indicators of different mobility forms were first examined in order to map how nationals of the
six countries engage in activities that cross national borders. While sketching the picture of
European mobilities, we first present descriptive statistics of four forms of mobility across the
countries and discuss their differences.
Physical/high permanence (migration-like) mobility within EU
Most respondents in the six countries surveyed did not have the experience of living in another EU
country for three months or more before they turned 18. Just over one per cent of Romanians lived
in another EU country as a minor, over two per cent of Italians and over three per cent of Danes,
Germans, Spaniards and Brits. More respondents reported having lived in another EU country as
adults: the percentages vary between around eight per cent in Germany and Italy and more than 15
per cent in Romania, reflecting the development of short term migrations from Romania in the
recent two decades. The high share of migration experiences among Romanians reflects the Eurostat
findings presented earlier, according to which Romania is the country with the highest migration
outflows in the EU. EUCROSS also shows that popularity of international exchange programmes
funded or co-funded by the EU is the highest in the new member state: in Romania, eight per cent of
3 Descriptive analyses are based on unweighted data.

18
respondents declare that they took part in it4. The programs were also relatively popular among
Spanish nationals (almost seven per cent). Respondents from the UK were the least likely to
participate (see Graph 1).
Graph 1 Physical/high permanence mobility
Source: EUCROSS (2012). N=5977
Even more interesting is a general picture of long term physical mobility in the six countries
examined. Thus a new dichotomic variable is created which takes into account all of the long term
physical mobility forms examined above. This variable takes the value of 1 for individuals who score
1 on at least one of the physical/high permanence variables analysed above. Migration is most often
declared in Romania. Italians and Germans are the least likely to have migrated of all six groups.
Overall, over 16 per cent of EUCROSS respondents declared an experience of long term-mobility,
which compares with almost 18 per cent of EB respondents. The slight difference may be due to a
combination of three factors: the selection of countries of EUCROSS, the fact that EB asked about
any experience abroad, while our variable refers to EU countries only, or to sampling and time
divergences. Overall, however, the findings look remarkably similar.
4 This share is even more impressive considering that Romanian students could participate in Erasmus
exchanges from 1997 only, while all other nationalities were eligible from ten years earlier.

19
Physical/low permanence (tourism-like) mobility within EU
With regards to short term mobility, almost 80 per cent of Danes visited at least one EU country
before they turned 18. This is the case for almost 70 per cent of Germans and 60 per cent of Britons.
Possibly, in these countries, travels to the EU stand out as a form of a quasi-generalised pre-
adulthood, if not emancipatory, event. The experience of short term mobility is much rarer in Italy or
Spain, where the majority of respondents did not visit another EU country as children or
adolescents. Only 12 per cent of Romanians travelled to the EU at all before turning 18 – a
proportion which of course depends on both political and economic constraints that differentiate
Romania from the other surveyed countries. Similarly, in the last two years, Danes were again most
mobile within the EU with (74 per cent). Over half of respondents in Germany and the UK travelled
within the EU in the last 24 months. Although nationals of Italy, Spain and Romania were least likely
to travel abroad in the last two years, more respondents from these countries travelled in the last
two years than as children/adolescents (Graph 2).
Graph 2 Physical/low permanence mobility
Source: EUCROSS (2012). N=5994
Unsurprisingly, the picture of low permanence physical mobility is very different from the high
permanence one. This type of mobility involves a relatively lower share of Romanians. Oppositely,
short trips within the EU are extremely common for Danes, Germans and Britons.

20
Virtual/personal mobility (facebook-like)
In Romania, seven out of ten respondents talked to relatives or friends abroad by phone/computer
in the last 12 months. This mode of communication was also popular in the UK and Spain, with more
than half of respondents declaring this method of contact with friends or relatives abroad. Email and
mail communication was most often chosen by the respondents based in the UK. Social network
sites, such as Facebook or Google+, were most popular in Romania, and least popular in Germany.
Finally, emails from abroad were most often received by persons in the UK, Germany and Denmark
(over half of the sample). According to EUCROSS, between 44 and 45 per cent of Romanians and
Spaniards receive email messages from abroad, compared to less than 40 per cent of Italians.
When considering general engagement in different forms of virtual mobility, Italians seem least
connected to people abroad via virtual links. Romanians are particularly well connected across
borders through virtual personal contacts, perhaps due to growing ties with friends and family-
migrants abroad, followed by Britons and Spaniards (Graph 3).
Graph 3 Virtual/personal mobility
Source: EUCROSS (2012). N=5592
0%
10%
20%
30%
40%
50%
60%
70%
80%
90%Talked to family members, in-
laws and friends abroad by
phone/computer in the last 12
months
Communicated by mail or e-
mail with family, friends
Communicated via social
networks with family, friends
Received email messages from
abroad
Virtual/personal mobility
21
Virtual/impersonal mobility (eBay-like)
The spread of cross-border virtual relations is framed into macro-level differences that affect their
feasibility. One of these is national income. Therefore, as might be expected, Romanian nationals are
least likely to send money abroad for reasons other than purchasing goods or services. However,
they are also most likely to receive money coming from someone in another country – basically,
migrant remittances. Very small percentages of respondents own property in another EU country,
and they are mostly Britons and Danes. Online shopping within the EU is used by one in three Danes,
and almost two in five Germans, but the practice is less widespread in Italy, Romania, Spain and the
UK. The Danish population has many more work interactions with people located in other EU
countries than others. Italians are the least likely to have interacted with people located abroad for
work reasons in the last 12 months (only a quarter of respondents). In the aggregated picture of
virtual impersonal mobility, Danes are again much more mobile than the other examined groups
(Graph 4).
Graph 4 Virtual/impersonal mobility
Source: EUCROSS (2012). N=5822

22
Multiple regression analyses
Our understanding of forms of mobility distinguishes between physical and virtual movement. In
particular, quite against the sociological tradition, migration is treated as one of the high
permanence mobility forms. Going beyond the interest in migrants’ settlement and integration in
host countries, we also track migrations of shorter duration (with a limit of at least three months).
Descriptive analyses, however, pointed to how traditional sociological themes of interest (like
socioeconomic and cultural-cognitive characteristics, at both macro and micro level) are likely to
matter for mobilities. The classification of mobilities allows us to examine similarities and differences
between taking up migration spells, vacations, connecting to significant others abroad, and shopping
online. In the following analysis, we propose to use traditional sociological lenses in order to
understand how mobilities are shaped. To do so, we conduct a systematic investigation of how
personal resources, cognitive skills, and national contexts affect different physical and virtual
mobility forms.
We expect physical mobilities to be highly dependent on the cognitive and material resources
individuals possess. Among physical mobilities, we can presume that some are taken up as a form of
investment (migration-like mobilities) and others as a form of consumption (tourism-like mobilities).
In the case of migration-like mobility, we expect individuals to engage in it as a form of investment
to better their economic status. In particular, people with fewer resources may see international
migration as a means to improve their socioeconomic standing. Tourism-like mobility, in turn, as a
mostly consumption-oriented practice, requires material resources and thus should be chosen more
often by persons of middle-upper class background.
While socioeconomic background is expected to facilitate or hamper access to physical mobilities
(depending on the low and high permanence form), we hypothesise that access to virtual mobilities
is more ‘democratic’, including both onerous (i.e., buying property) and cheap (i.e., talking through
Skype) practices. As outlined earlier, virtual mobilities are in fact more likely related to cognitive
skills and generational cultures, with younger cohorts more competent in making use of information
and communication technologies (Duggan and Brenner 2013).
On the country level, modernisation and globalisation are expected to have an impact on short term
international movements and social networks that cross national borders (Mau and Mewes 2012). In
this analysis, particularly interesting is the difference in mobility patterns between EU15 countries
and Romania, a newcomer to the free movement regime space.
This section looks in detail at the four dichotomic variables epitomising each of the mobility forms
described in the previous section: physical/high permanence mobility, physical/low permanence
mobility, virtual/personal mobility, virtual/impersonal mobility. Four binomial logistic regression
models examine determinants of different forms of mobility, focusing on how individual factors and
country characteristics affect varieties of mobility. Favell et al. (2011) summarise some of the
literature describing how individual factors affect mobilities. The following analysis pinpoints a set of
individual characteristics in our dataset. Independent variables include age, gender, educational
level, ISEI socioeconomic status score of the respondent’s job, and ISEI socioeconomic status score
of the respondent’s parent job (the highest among parents). Following Mau and Mewes (2012),
country variables are investigated as well in order to control for differences on a macro level.

23
Table 7 Logit regression models with four mobility form dummies as dependent variables
High permanence physical
mobility
Low permanence physical
mobility
Personal virtual
mobility
Impersonal virtual
mobility
Explanatory variables Categories Exp(B) Wald Exp(B) Wald Exp(B) Wald Exp(B) Wald
Age group (ref 65+) 18-24 0.66 2.45 6.95 *** 53.41 5.24 *** 45.77 4.20 *** 53.02
25-34 0.84 0.87 4.01 *** 64.17 5.39 *** 85.33 6.51 *** 153.44
35-44 0.83 1.57 3.56 *** 74.00 3.04 *** 65.27 5.49 *** 174.80
45-54 0.79 2.43 2.91 *** 61.57 2.68 *** 61.33 4.99 *** 172.75
55-64 0.65 ** 7.36 1.90 *** 22.39 1.61 *** 14.72 2.63 *** 61.29
Gender (ref male) Female 0.86 2.45 0.75 ** 10.46 0.88 2.28 0.63 *** 36.60
Education (ref less than
higher secondary)
Higher secondary education
(university entrance requirement) 1.44 * 6.06 1.53 *** 12.20 1.22 3.02 1.30 * 6.15
Tertiary education 1.86 *** 18.45 1.71 *** 16.83 2.13 *** 37.77 1.42 ** 10.58
ISEI 1.23 0.50 6.50 *** 50.28 3.69 *** 26.39 3.22 *** 27.01
Parental ISEI 3.14 *** 23.82 7.52 *** 68.57 1.43 2.60 1.89 *** 11.13
Country (ref Germany) Denmark 1.51 * 5.92 2.14 *** 16.71 1.00 0.00 2.91 *** 64.25
UK 1.18 1.01 0.73 * 3.94 1.69 *** 12.83 0.99 0.00
Italy 1.22 1.35 0.26 *** 80.32 0.74 * 4.91 0.67 ** 9.83
Romania 2.10 *** 17.95 0.10 *** 201.37 1.22 1.55 0.94 0.18
Spain 1.35 2.54 0.23 *** 85.02 0.92 0.28 0.78 3.27
Constant 0.07 *** 140.73 0.38 *** 24.34 0.40 *** 25.09 0.14 *** 126.41
Nagelkerke R Square 0.061 0.343 0.166 0.207
* p< 0.05; ** p< 0.01; *** p< 0.001
Source: EUCROSS (2012). N=3348

24
At first glance, younger persons and males are more mobile in general, but this effect does not hold
for migration-like mobility, for which the effect of gender is not significant and older respondents
translate their higher age into a higher ‘risk’ of having long-term mobility experiences in their
background. Furthermore, education is an important predictor of all cross-border activities types,
with least educated persons being significantly the least mobile in any respect. Since we control for
socioeconomic status, this may well mean that mobilities – in any of its declinations – require
cognitive skills that are nurtured in the educational system. Equally, mobilities may be based on and
reinforce cultural capital. In future analyses we may seek to disentangle these underlying rationales,
distinguishing for instance language and geographic competences from ‘distinction-like’ motives as
triggers of mobilities.
Economic resources matter for mobilities as well, with the SES of the respondent’s job having a large
effect on all forms of mobility except migration. While the effect on migration is in line with our
expectations, our claim that virtual mobility is class-free does not stand the test. Similarly, family
socioeconomic status has a large positive effect on all forms of mobility except facebook-like
mobility. This particular type of mobility is thus more ‘democratic’, as expected, representing a
cheap opportunity for cross-border activities regardless of parental origins – but still being more
accessible for those who have higher education and belong to younger cohorts. Interestingly, in the
case of tourism, the impact of parental SES is even bigger than one’s occupational position.
When country level variables are examined, Romanian and Danish residents are more likely to have
migrated than Germans. Probably with different trajectories and individual projects (to be examined
in greater detail in further analyses), Danes are open to experiencing life abroad almost as much as
Romanians, ceteris paribus. Their long-permanence mobility perhaps intertwines with more short-
term travelling practices, which they also champion. All other national groups have sensibly lower
propensities to short-term mobility. British nationals have the highest likelihood to engage in
international social networks and Italians, the lowest. Finally, Danes have a much higher inclination
to engage in virtual impersonal mobility than all other respondents, while Italians’ experience with
such practices is significantly the lowest.
The associations between pairs of dependent variables were also examined (analysis not shown).
However, in all cases, the lambda coefficient was not statistically significantly different from zero.
Small associations were found between some of the pairs at the country level5. This seems to go
against Urry’s (2007: 157 ff.) and Woolgar’s (2002: 17 ff.) claims that spatial and virtual mobilities
amplify one another. But of course, a more fine-grained examination of the interconnections among
specific forms of mobilities (e.g., study abroad and facebook ties) is needed to further qualify this
finding.
5 In Romania, low permanence physical mobility improves prediction of high permanence physical mobility
(lambda =.109) and impersonal virtual mobility (lambda=.087). In Denmark, impersonal virtual mobility
improves prediction of high permanence physical mobility (lambda =.066). In Italy, low permanence physical
mobility improves prediction of personal virtual mobility (lambda=.194). Similarly, in Spain, low permanence
physical mobility improves prediction of personal virtual mobility (lambda=.177).

25
Conclusions: mobilities and European citizenship
At the heart of European citizenship lies the right to mobility. Most noticeably, unrestricted
geographical mobility across national borders, for both long- and short-permanence travels, which is
a unicum of the EU in the worldwide regulation of individual movements (Recchi 2013). But perhaps
less spectacularly, every citizen of EU member states also enjoys the liberty of communicating with
people from any other country, navigating the web, buying goods, properties and services all over
the EU, and shopping across the Union’s frontiers. These ‘options’ are part and parcel of citizenship
rights, enlarging the package of individual ‘life-chances’ remarkably (Dahrendorf 1988). However, we
know little on how options turn into real practices. A sociological take on citizenship cannot stop at
formal rights. Citizenship rights translate into a ‘set of practices […] which define a person as a
competent member of society’ (Turner 1993: 2). This reading of citizenship brings to the forefront
not only individuals’ rights of action, but also their actual ‘capability of doing things’ (Giddens 1984:
9; emphasis added). Considering mobilities as critical rights implied in EU citizenship, in this first
exploration of the EUCROSS data we have overviewed Europeans’ exercise of their capabilities to
move in both physical and virtual space.
Quite against conventional wisdom that EU citizens make modest use of their free movement rights
and are rather immobile, we found that one in six Europeans of the EUCROSS sample have spent at
least three months in another EU country in their lifetime. Moreover, 51 per cent have visited
another EU member state, even if for a short vacation, in the last two years. Europeans cross
borders in non-physical sense as well, when they connect online or on the phone with significant
others who migrated or with friends they met during their physical trips (almost three quarter of our
sample). Finally, Europeans increasingly engage in cross border transactions (almost one third of our
sample), shopping online but also transferring money abroad.
Overall, this paper delves into the richness of European mobilities, furnishing a first outline of four
basic modalities of international movements. While Eurobarometer data suggest national and
individual differences to these mobilities, EUCROSS allows for further investigation of the impact of
micro and macro factors on mobility practices. Interestingly, even in a free movement context,
cross-border mobility remains selective, being conditioned by individual and country-level
characteristics. Human capital is a mighty predictor of all forms of persons’ mobilities, but
socioeconomic status also makes a huge difference. Age is a significant factor as well, with younger
cohorts more easily embracing different forms of movement (except migration-like practices, which
net of education effects are in fact more common among senior respondents). The young are
notoriously more skilled in the new technologies that shape the virtual world; their geographical
mobility is in fact comparatively higher when it comes to low permanence travels – in a ‘bite and go’
interpretation of mobility.
Having said this, individual characteristics do not tell us the whole story about European mobilities.
Broader national contexts from which people come are important for understanding differences,
especially for comparing EU15 citizens with newcomers to the free movement regime. In general,
Danes are most mobile when it comes to low permanence physical mobility and impersonal virtual
moves. In turn, not surprisingly, Romanians have twice the odds of Germans of having migrated –
even in the wider sense of migration as ‘long-permanence mobility’ that we used. This reverberates
on being more strongly networked with other persons abroad than any other nationality examined.

26
While the four forms of mobilities are overall independent one from the other, articulating a
diversity of cross-border experiences, in some particular instances they lend themselves to
cumulation and self-reinforcement. Taking stock of the wealth and detail of EUCROSS data on
diverse mobility experiences, future analysis is envisaged to shed light on the interactions between
specific forms of mobility and possible ‘mobility patterns’ that characterize different clusters of
Europeans.

27
References
Aspden, D. (2005) ‘Methodological Improvements to UK Foreign Property Statistics’, Economic
Trends 619 (June): 54-60,
http://www.ons.gov.uk/ons/search/index.html?newquery=Methodological+improvements+to+UK+f
oreign+property+investment+statistics (accessed 20/05/2013).
Beaverstock, J. (2005) ‘Transnational Elites in the City: British Highly-skilled Inter-company
Transferees in New York City’s Financial District’. Journal of Ethnic and Migration Studies 31(2): 245-
268.
Benson, M.C. (2010) ‘The Context and Trajectory of Lifestyle Migration’. European Societies 12(1):
45-64.
Bourdieu, P. (1986) The Forms of Capital, in Richardson, J. (ed.) Handbook of Theory and Research for
the Sociology of Education. New York: Greenwood.
Castells, M. (2000) The Rise of the Network Society. 2nd ed. Oxford: Blackwell.
Clarke, N. (2005) ‘Detailing Transnational Lives of the Middle: British Working Holiday Makers in
Australia’. Journal of Ethnic and Migration Studies 31(2): 307-322.
Conradson, D. and Latham, A. (2005) ‘Friendship, Networks and Transnationality in a World City:
Antipodean Transmigrants in London’. Journal of Ethnic and Migration Studies 31(2): 287-305.
Cook, J., Dwyer, P. and Waite, L. (2011) ‘The Experiences of Accession 8 Migrants in England:
Motivations, Work and Agency’. International Migration 49(2): 54-79.
Cooper, G., Green, N., Murtagh, G.M., and Harper, R. (2002) Mobile Society? Technology, Distance
and Presence, in Woolgar, S. (ed) Virtual Society? Technology, Cyberbole, Reality. Oxford: Oxford
University Press.
Dahrendorf, R. (1988) The Modern Social Conflict. An Essay on the Politics of Liberty. New York:
Weiden & Nicolson.
Duggan, M. and Brenner, J. (2013) ‘The Demographics of Social Media Users — 2012’ Pew Research
Center’s Internet & American Life Project Report, http://pewinternet.org/Reports/2013/Social-
media-users.aspx (accessed 5/05/2013).
Eade, J. (2007) ‘Class and Ethnicity: Polish Migrant Workers in London. Full Research Report’. ESRC
End of Award Report, RES-000-22-1294. Swindon: ESRC.
EU Commission (2008) Employment in Europe. Luxembourg: Office for Official Publications of the
European Communities.
Favell, A., Recchi, E., Kuhn, T., Solgaard, J., and Klein, J. (2011) State of the Art Report. EUCROSS
Working Paper 1,
http://www.eucross.eu/cms/index.php?option=com_content&view=category&layout=blog&id=10&I
temid=110 (accessed 3/03/2013).
Frändberg, L. (2009) ‘How Normal is Travelling Abroad? Differences in Transnational Mobility
between Groups of young Swedes’. Environment and Planning A 41(3): 649-667.
Giddens, A. (1984) The Constitution of Society. Outline of a Theory of Structuration. Cambridge:
Polity Press.
Grabowska, I. (2003) ‘Irish Labour Migration of Polish Nationals: Economic, Social and Political
Aspects in the Light of the EU Enlargement’. Prace Migracyjne No. 51.
Horrigan, J., (2008) ‘Online Shopping’ Pew Internet & American Life Project Report,
http://www.pewinternet.org/Reports/2008/Online-Shopping.aspx (accessed 08/02/2013).

28
Kaelble, H. (2004) The European Way: European Societies in the 19th and 20th Centuries. Oxford:
Berghahn.
Kennedy, P. (2010) ‘Mobility, Flexible Lifestyles and Cosmopolitanism: EU Postgraduates in
Manchester’. Journal of Ethnic and Migration Studies 36(3): 465-482.
King, R. (2002) ‘Towards a New Map of European Migration’. International Journal of Population
Geography 8(2): 89-106.
King, R., and Ruiz-Gelices, E. (2003) ‘International Student Migration and the European ‘Year
Abroad’: Effects on European Identity and Subsequent Migration Behaviour’. International Journal of
Population Geography 9(3): 229-252.
Komito, L. and Bates, J. (2009) ‘Virtually Local: Social Media and Community amongst Polish
Nationals in Dublin’. Aslib Proceedings: New Information Perspectives 61(3):232-244.
Koryś, I. (2003) ‘Migration Trends in Selected EU Applicant Countries: Poland’. CEFMR Working Paper
No. 5/2003.
Krings, T., Bobek, A., Moriarty, E., Salamońska, J., and Wickham, J. (2013) ‘Polish Migration to
Ireland: “Free Movers” in the New European Mobility Space’. Journal of Ethnic and Migration Studies
39(1): 87-103.
Krings, T., Moriarty, E., Wickham, J., Bobek, A., Salamońska, J. (Forthcoming 2013) Polish Migration
to Ireland post 2004: New Mobilities in the new Europe. Manchester: Manchester University Press.
Mau, S. (2010) Social Transnationalism. Lifeworlds Beyond the Nation-State. London: Routledge.
Mau, S. and Mewes, J. (2012) ‘Horizontal Europeanisation in Contextual Perspective’. European
Societies 14(1): 7-34.
Recchi, E. (2012) Transnational Practices and European Identity: From Theoretical to Policy Issues.
EUCROSS Working Paper 3,
http://www.eucross.eu/cms/index.php?option=com_content&view=category&layout=blog&id=10&I
temid=110 (accessed 12/05/2013).
-- (2013) Senza frontiere. La libertà di circolazione delle persone in Europa. Bologna: Il Mulino.
Recchi, E. and Favell, A. (eds) (2009) Pioneers of European Integration. Cheltenham: Edward Elgar.
Recchi, E. and Kuhn, T. (2013), Europeans’ Space-Sets and the Political Legitimacy of the EU, in N.
Kauppi (ed), A Political Sociology of Transnational Europe. Colchester: ECPR Press.
Recchi, E. and Triandafyllidou, A. (2010) ‘Crossing Over, Heading West and South: Mobility,
Citizenship and Employment in the Enlarged Europe’, in G. Menz and A. Caviedes (eds), Labour
Migration in Europe. London: Palgrave Macmillan.
Santacreu, O., Baldoni, E. and Albert, M.C. (2009) ‘Deciding to Move: Migration Projects in an
Integrating Europe’, in E. Recchi and A. Favell (eds) Pioneers of European Integration. Cheltenham:
Edward Elgar.
Smith, A. (2011) ‘Why Americans Use Social Media’ Pew Research Center Report, http:
//www.pewinternet.org/Reports/2011/Why-Americans-Use-Social-Media.aspx (accessed 24 March,
2013).
Turner, B.S. (1993) Contemporary Problems in the Theory of Citizenship, in B.S. Turner (ed), Citizenship
and Social Theory. London: Sage.
Urry, J. (1990) The Tourist Gaze: Leisure and Travel in Contemporary Society. London: Sage.
-- (2000) Sociology Beyond Societies: Mobilities for the Twenty-first Century. London: Routledge.
-- (2007) Mobilities. Cambridge: Polity Press.

29
Wickham, J. (2007) ‘Irish Mobilities’ in S. O’Sullivan (ed.) Contemporary Ireland: A Sociological Map,
Dublin: UCD Press.
Wickham, J., Moriarty, E., Bobek, A. and Salamońska, J. (2009) ‘Working in the Gold Rush: Polish
Migrants’ Careers and the Irish Hospitality Sector’, in S.C. Bolton and M. Houlihan (eds) Work
Matters: Critical Reflections on Contemporary Work. Basingstoke: Palgrave Macmillan.
Wickham, J. and Vecchi, A. (2009) ‘The Importance of Business Travel for Industrial Clusters – Making
Sense of Nomadic Workers’. Geografiska Annaler: Series B, Human Geography 91(3): 245–255.
Woolgar, S. (2002) Five Rules of Virtuality, in Woolgar, S. (ed) Virtual Society? Technology, Cyberbole,
Reality. Oxford: Oxford University Press.
World Tourism Organization (WTO) (2012) Annual Report 2011. Madrid: UNWTO.

30
Appendix – Tables
Table 8 Movers flows in EU by group of citizenship, 2012
from CoO (%) in CoR (%)
Austria 0.6
Belgium 1.0 4.5
Bulgaria 3.8 0.1
Cyprus 0
Czech Republic 0.9 1.5
Denmark 0.8 1.3
Estonia 0.5
Finland 1.1 0.7
France 4.6
Germany 5.7 24.5
Greece 3.1
Hungary 1.4 0.6
Ireland 4.0 3.7
Italy 8.8 14.3
Latvia 1.2
Lithuania 2.6
Luxembourg 0.2
Malta 0
Netherlands 3.5 3.0
Poland 16.6 0.2
Portugal 4.1
Romania 23.0 0.1
Slovakia 2.3 0.5
Slovenia 0.3 0.1
Spain 2.0 22.7
Sweden 0.8 2.6
United Kingdom 7.3 19.8
Total 100.0 100.0
Source: Eurostat (online data code: migr_pop1ctz)
Table 9 Social profile of Europeans on the move (gender)
Male Female Total
Both migration-like and
tourism-like movers 56.5 43.5 100.0
Migration-like movers
only 57.3 42.7 100.0
Tourism-like movers
only 49.5 50.5 100.0
Stayers 45.8 54.2 100.0
Source: Eurobarometer 73.3

31
Table 10 Social profile of Europeans on the move (age)
15-24 25-39 40-54 55 or more Total
Both migration-like and
tourism-like movers 10.5 36.3
27.5 25.7 100.0
Migration-like movers
only 9.6 30.8
26.6 33.1 100.0
Tourism-like movers
only 16.1 24.6
28.5 30.8 100.0
Stayers
15.7 23.0
24.8 36.6 100.0
Source: Eurobarometer 73.3
Table 11 Social profile of Europeans on the move (education)
High
(finished
education
aged 20 or
later)
Medium
(finished
education
aged 16-19)
Low
(finished
education
aged 15 or
less) Total
Both migration-like and
tourism-like movers 53.7 34.0 12.3 100.0
Migration-like movers
only 42.7 36.8 20.6 100.0
Tourism-like movers
only 40.9 43.5 15.5 100.0
Stayers
28.6 42.8 28.6 100.0
Source: Eurobarometer EB73.3
Table 12 Social profile of Europeans on the move (social class)
Upper
class
Middle
class
Working
class Total
Both migration-like and
tourism-like movers 37.6 38.1 24.3 100.0
Migration-like movers
only
27.4
38.6
34.0
100.0
Tourism-like movers
only 30.3 46.0 23.7 100.0
Stayers
16.9 44.3 38.9 100.0
Source: Eurobarometer 73.3

32
Table 13 Movers in CoR 2012 (%)
AT BE BG CY CZ DK EE FI FR DE EL HU IE IT LV LT LU MT NL PL PT RO SK SI ES SE UK
Total
Belgium 0.6 4.6 0.1 0.7 0.6 0.2 0.7 0.0 8.9 0.3 1.1 0.9 3.6 0.0 0.4 0.1 0.1 27.5 12.5 8.0 9.6 1.3 0.2 11.4 1.0 5.5 100.0
Bulgaria 2.3 1.5 1.1 3.7 0.6 0.5 0.5 3.7 10.9 16.2 1.5 0.8 6.1 0.7 0.6 0.1 0.1 0.1 9.4 0.5 4.7 1.9 0.4 1.9 0.8 29.5 100.0
Czech Republic 2.2 0.4 5.0 0.1 0.2 0.1 0.2 1.8 10.6 0.6 0.6 0.4 2.0 0.2 0.3 0.0 0.0 0.2 12.8 0.1 3.3 54.6 0.2 0.5 0.4 3.3 100.0
Denmark 1.0 0.7 3.1 0.0 0.7 0.9 1.8 4.2 17.1 0.9 1.7 1.1 3.9 3.0 6.0 0.0 0.0 0.5 19.0 1.0 7.3 0.8 0.2 3.1 10.2 11.6 100.0
Finland 0.6 0.5 1.6 0.1 0.6 1.0 51.6 2.6 5.8 0.9 2.3 0.7 2.6 1.8 1.4 0.0 0.0 1.5 0.4 0.6 2.3 0.4 0.1 2.2 12.9 5.6 100.0
Germany 0.8 1.0 4.1 0.0 1.9 0.9 0.3 0.7 5.1 12.0 3.2 0.4 21.1 0.9 1.4 0.6 0.0 5.8 20.5 4.9 7.0 1.4 0.9 0.5 0.8 3.9 100.0
Hungary 6.9 1.3 2.3 0.3 0.7 0.4 0.2 0.7 3.8 36.8 0.9 0.7 3.4 0.2 0.2 0.0 0.1 2.0 4.7 0.4 12.4 13.6 0.4 1.3 1.8 4.4 100.0
Ireland 0.2 0.3 0.5 0.0 1.5 0.2 0.1 0.2 0.2 2.9 0.1 2.2 2.0 5.6 9.9 0.0 0.0 33.1 0.7 4.7 2.9 0.1 1.8 0.4 30.4 100.0
Italy 0.5 0.4 3.8 0.0 0.4 0.0 0.1 0.1 2.4 3.0 0.1 0.6 0.2 0.0 0.3 0.0 0.1 0.6 7.7 0.4 74.5 0.7 0.2 1.5 0.3 2.1 100.0
Netherlands 1.3 9.3 0.6 0.1 1.0 0.9 0.3 0.8 6.1 24.4 0.0 2.6 1.6 0.8 0.1 1.2 0.1 0.1 21.8 0.6 3.1 1.2 0.2 6.8 1.3 13.9 100.0
Poland 3.7 1.4 5.9 0.1 4.9 1.9 0.1 0.3 6.7 28.8 3.7 2.5 1.6 8.1 0.8 4.8 0.1 0.1 2.2 0.5 3.8 2.9 0.3 2.9 3.3 8.6 100.0
Romania 2.2 1.7 3.0 0.1 0.2 0.3 0.0 0.1 8.3 11.3 23.9 4.1 0.3 31.7 0.0 0.0 0.1 0.0 1.9 1.4 0.3 0.6 0.1 1.6 1.4 5.5 100.0
Slovakia 4.3 0.8 3.4 0.1 27.1 0.5 0.1 0.2 2.9 8.0 0.6 17.2 0.4 3.9 0.3 0.2 0.0 0.0 0.6 12.8 0.3 10.6 0.4 1.1 0.5 3.4 100.0
Slovenia 6.9 1.0 24.8 0.0 2.7 0.4 0.3 0.5 3.1 13.6 0.3 2.8 0.7 16.2 0.3 0.5 0.0 0.0 1.6 3.2 0.4 4.2 7.2 1.2 1.1 6.7 100.0
Spain 0.5 1.5 7.7 0.0 0.4 0.5 0.1 0.5 5.3 8.1 0.2 0.4 0.8 8.4 0.2 1.0 0.0 0.0 2.2 0.4 5.9 38.0 0.4 0.1 1.0 16.3 100.0
Sweden 1.2 0.5 1.6 0.1 0.5 15.6 1.5 26.1 2.6 10.7 0.2 2.0 0.8 2.5 1.5 3.0 0.0 0.0 2.6 16.4 0.7 0.4 0.5 0.2 2.1 7.0 100.0
United Kingdom 7.3 6.1 18.0 6.2 3.3 6.9 35.2 5.4 4.8 3.2 3.7 100.0
Source: Eurostat (online data code: migr_pop1ctz)

33
Table 14 Movers from CoO 2012 (%)
AT BE BG CY CZ DK EE FI FR DE EL HU IE IT LV LT LU MT NL PL PT RO SK SI ES SE UK
Austria 1.8
Belgium 4.4 5.5 12.3 3.4 3.5 1.7 2.8 0 6.9 0.5 3.6 1.0 1.8 0.1 0.7 2.8 15.2 35.2 3.4 8.8 1.9 2.5 2.9 25.8 5.3 3.4
Bulgaria 0.4 0.2 4.0 0.4 0.1 0.1 0 0.1 0.2 0.6 0.1 0 0.1 0.1 0 0 0.3 0 0.1 0 0 0.1 0.1 0.1 0.1 0.4
Czech Republic 5.5 0.5 2.0 3.3 0.4 0.2 0.2 0.6 2.7 0.3 0.6 0.2 0.3 0.2 0.2 0.1 0.7 0.1 1.1 0.1 0.2 35.4 1.0 0.4 0.8 0.7
Denmark 2.1 0.9 1.1 1.4 0.9 2.3 2.1 1.2 3.8 0.4 1.6 0.4 0.6 3.2 3.0 0.2 2.1 0.2 1.5 0.3 0.4 0.5 0.8 2 16 2.1
Finland 0.7 0.3 0.3 1.5 0.4 0.8 67.4 0.4 0.7 0.2 1.1 0.1 0.2 1.0 0.4 0.1 0.6 0.3 0 0.1 0.1 0.1 0.3 0.7 10.4 0.5
Germany 31.6 25.5 26.6 35.8 49.9 26.3 12.2 15.6 26.8 94.9 57.4 2.7 58.5 17.3 13.2 87.2 19.9 40.4 30.3 29.1 7.4 14.9 72.8 6.1 24.5 13.3
Hungary 6.8 0.8 0.4 6.7 0.4 0.3 0.2 0.4 0.5 3.8 0.2 0.1 0.2 0.1 0 0.2 1.1 0.3 0.2 0.1 0.3 3.5 0.8 0.4 1.3 0.4
Ireland 1.2 1.0 0.5 2.8 5.9 0.9 0.5 0.8 0.2 1.9 0.2 5.9 0.8 17.2 14.3 0.2 6.7 7.4 0.6 0.8 4.7 0.6 3.3 2.0 15.6
Italy 11.6 6.3 14.7 6.8 6.8 0.3 2.2 1.7 7.3 7.4 0.2 5.8 0.8 0.2 1.9 2 32.4 2.3 6.7 1.4 46.5 4.1 11 10.6 4.5 4.1
Luxembourg 1.1
Malta 0.1
Netherlands 6.6 27.7 0.4 8.3 3.2 3.3 1.7 2.2 3.9 12.6 0 5.7 1.1 0.3 0.2 1.4 2.4 6.8 3.9 0.4 0.4 1.6 2.2 10.3 4.6 5.7
Poland 1.1 0.3 0.3 0.9 1.0 0.4 0 0 0.3 0.9 0.2 0.3 0.1 0.2 0.1 0.3 0.1 0.3 0.1 0 0 0.2 0.1 0.3 0.7 0.2
Portugal 1.9
Romania 0.3 0.1 0.1 0.1 0 0 0 0 0.1 0.1 0.5 0.2 0 0.2 0 0 0 0 0 0 0 0 0 0.1 0.1 0.1
Slovakia 3.8 0.4 0.5 1.2 15.7 0.3 0.1 0.1 0.3 0.7 0.1 6.7 0.1 0.2 0.1 0 0.1 0.7 0.1 0.4 0 0.2 0.8 0.3 0.3 0.3
Slovenia 0.7 0.1 0.4 0.1 0.2 0 0 0 0 0.1 0 0.1 0 0.1 0 0 0 0.1 0 0 0 0 0.2 0 0.1 0.1
Spain 18.0 34.8 46.3 7.5 10.3 14.9 3.6 11.4 25.8 32.1 1.5 7.1 4.5 21.7 3.5 8.9 4.3 9.8 14.2 0.5 32.5 37.5 3.7 4.5 29.1 50.8
Sweden 5.2 1.2 1.1 7.3 1.4 48.5 7.6 62.5 1.4 4.8 0.2 3.7 0.5 0.7 3.3 3 0.3 3.3 1.9 2.6 0.4 0 0.5 2.1 2.8 2.5
UK 31.2 21.1 88.5 14 53.4 52.6 42.0 26.1 4.1 28 36.9
Total 100 100 100 100 100 100 100 100 100 100 100 100 100 100 100 100 100 100 100 100 100 100 100 100 100 100 100
Source: Eurostat (online data code: migr_pop1ctz)

34
Table 15 Movers in CoR (difference years 2012-2008) (%)
AT BE BG CY CZ DK EE FI FR DE EL HU IE IT LV LT LU MT NL PL PT RO SK SI ES SE UK
CoR
difference
Belgium 0.2 3.5 0.1 0.4 0.5 0.1 0.2 -21.6 8.3 -2.2 0.6 0.3 -24.4 -0.1 0.2 0 0.1 7.1 7.4 3.1 9.3 0.8 0.1 4.3 0.3 1.3 -3.5
Bulgaria 1.4 1.1 -2.7 -1.9 0.3 0.4 0.2 1.5 2.3 -28.4 -0.9 0.7 2.8 0.3 0.3 0.1 0 -0.3 -5.9 0.4 -0.4 -0.4 0.1 1.3 0.2 27.6 0
Czech Republic -0.8 0 0.5 0 -0.1 0 0 1.6 10.5 -0.1 0.1 0 -0.1 0.1 0 0 0 0 -5.6 0 0.4 -6 0 0.1 -0.1 -0.5 0
Denmark 1.0 -0.2 2.1 0 0 -0.1 -0.9 -1.3 -4.8 -0.1 0.5 0.9 3.4 1.1 1.7 0 0 -0.2 2.2 -0.1 4.4 0.2 0 -0.5 -4.5 -5 0.2
Finland -0.2 0 0.6 0 0 -0.3 9.2 -0.3 -1.2 0 0.4 0 -0.2 0.5 0.3 0 0 -0.6 -2.7 0 0.4 0 0 0 -4.8 -1.1 0.1
Germany -6.8 0 2.1 0 0.5 0.1 0.1 0.1 0.5 -0.6 0.8 0 -1.6 0.5 0.6 0.2 0 0.2 4.1 0 3.4 0.4 0 -4.1 0.1 -0.3 -8.7
Hungary 4.3 0.9 1.2 0.2 0.4 0.3 0.2 0.3 2.3 22.5 0.5 0.5 2.2 0.2 0.1 0 0.1 0.8 2.1 0.3 -53.0 8.7 0.3 1.1 1.1 2.3 -0.7
Italy -0.2 -0.2 0.2 0 -0.2 -0.2 0 -0.1 -0.9 -1.3 -0.7 0 -0.1 -0.2 0 0 0 -0.3 -2.0 -0.1 7.6 -0.1 -0.1 -0.4 -0.1 -0.7 2
Netherlands -0.3 8.2 -2.2 0 0.9 -0.2 0.1 0.7 -0.4 -2.5 -3 1.3 1.6 -7.4 -0.1 0.6 0 0 10.5 -5.0 1.0 0.3 0 -0.3 -0.1 -3.5 -0.1
Poland 2.5 0.7 1.2 0 2.1 0 0 -0.3 4.0 -24.3 -1.8 0.5 1.4 5.8 0.6 2.8 0.1 0.1 0.4 0.4 2.8 1.8 0.2 2.3 -9.2 5.9 -0.1
Romania 0.2 0.3 -0.1 0.1 0 0 0 0 -0.3 -0.3 -2.3 -0.3 0 2.1 0 0 0.1 0 -0.3 0.4 0 0.2 0 0.1 0.2 0.2 0
Slovakia -1.6 -0.1 -0.6 0 3.1 -0.3 0 -0.1 2.4 -3.6 -0.1 6.3 -0.1 0 0.2 0 0 0 -0.7 -3.3 0 -1.5 -0.1 0 -0.1 -0.4 0.2
Slovenia -0.3 0.1 5.8 0 -0.2 0 0.2 0 -1.1 -1.6 0.1 -0.3 0.3 3.0 0.1 -0.2 0 -0.1 -0.7 -0.9 0.1 -1.3 -3.9 0.2 -0.2 0.5 0
Spain 0 -0.1 0.4 0 0 -0.1 0 0 -0.1 -0.5 0 0.1 0.1 0.9 0.1 0 0 0 -0.1 -3.3 -0.1 3.2 0 0.1 -0.1 -0.5 -5.2
Sweden 0 0.1 0.8 0 0.1 -0.4 0.3 -7.2 0.2 0.4 -1.6 0.7 0.1 0.4 0.8 1.5 0 0 -0.2 4.4 0.1 -1.4 0.2 0 0.4 0.5 -0.6
Source: Eurostat (online data code: migr_pop1ctz)

35
Table 16 Movers from CoO (difference years 2012-2008) (%)
AT BE BG CY CZ DK EE FI FR DE EL HU IE IT LV LT LU MT NL PL PT RO SK SI ES SE UK
Belgium 3.3 3.1 2.4 0.4 3.1 -0.1 0.2 -29.1 6.1 -3.7 0.9 -7.9 -15.6 -3.1 -0.9 -0.5 3.6 -0.7 -0.9 0.9 1.8 0.3 1.4 6.8 0.1 0.0
Bulgaria 0.4 0.2 -1.9 0.1 0.1 0.1 0.0 0.1 0.1 0.2 0.0 0.0 0.1 0.0 0.0 0.0 0.2 0.0 0.0 0.0 0.0 0.0 0.1 0.1 0.1 0.4
Czech Republic 4.0 -0.1 0.2 0.9 0.1 0.0 0.0 0.6 2.7 0.1 0.1 -0.9 0.1 -0.3 -0.4 -0.1 -0.3 0.0 -1.8 0.1 0.0 -13.9 0.4 0.2 0.2 0.1
Denmark 2.1 -0.1 0.8 0.2 0.1 -0.2 0.2 0.2 0.2 0.2 0.7 0.1 0.6 -3.9 -2.7 0.0 0.4 0.0 -0.4 0.1 0.2 0.1 0.4 0.7 1.6 0.3
Finland 0.5 0.0 0.1 0.2 0.0 0.0 6.1 0.1 0.0 0.1 0.3 -0.8 0.1 -1.8 -0.5 0.0 0.0 0.0 -0.2 0.0 0.0 0.0 0.2 0.2 0.4 0.1
Germany -52.7 -7.5 8.5 -4.8 -1.8 1.8 -1.2 3.4 1.0 8.2 1.6 -25.2 -0.3 -32.7 -21.4 5.8 -0.3 -0.7 -27.5 -3.4 1.6 -4.0 11.0 -44.9 2.2 -0.9
Hungary 5.7 0.3 0.0 2.0 0.0 0.1 0.1 0.1 0.2 0.9 0.1 -0.5 0.1 -0.1 -0.1 0.1 0.8 0.0 -0.2 0.1 -3.9 -0.1 0.4 0.3 0.5 0.1
Italy 8.7 -1.4 2.7 -0.4 -1.0 -2.3 0.0 0.2 0.4 -0.6 -1.7 0.7 -6.3 -7.1 -3.0 -0.4 -4.5 -0.1 -5.9 0.1 6.6 -1.3 2.4 2.9 0.4 0.5
Netherlands 5.0 24.2 -1.9 3.2 2.9 0.1 0.6 2.0 0.5 0.2 -1.9 3.0 1.0 -1.7 -2.4 -1.0 0.1 0.8 0.2 -3.0 0.1 0.0 1.1 2.9 0.7 0.3
Poland 1.0 0.1 -0.1 0.3 0.1 -0.1 -0.1 -0.1 0.2 -1.5 -0.1 -0.1 0.0 0.1 -0.1 -0.4 0.0 0.3 0.0 0.0 0.0 0.0 0.1 0.2 -2.6 0.1
Romania 0.2 0.0 0.0 0.1 0.0 0.0 0.0 0.0 0.0 0.0 0.1 0.0 0.0 0.0 0.0 0.0 0.0 0.0 0.0 0.0 0.0 0.0 0.0 0.1 0.0 0.1
Slovakia 3.2 0.1 0.1 0.4 7.2 0.1 0.0 0.0 0.3 0.1 0.1 4.2 -0.2 0.1 -0.1 -0.1 0.1 0.3 0.0 -0.2 0.0 0.0 0.4 0.2 0.1 0.2
Slovenia 0.6 0.1 0.1 0.1 0.0 0.0 0.0 0.0 0.0 0.0 0.0 0.0 0.0 0.0 0.0 0.0 0.0 0.0 0.0 0.0 0.0 0.0 -0.1 0.0 0.0 0.1
Spain 13.7 -10.4 -9.3 -0.1 -1.1 0.1 0.0 1.9 0.6 -4.0 0.4 1.0 -35.4 5.3 -8.3 -25.8 -0.2 1.3 -0.2 -10.5 -1.3 -9.3 -1.7 1.6 2.5 3.1
Sweden 3.9 -0.1 0.4 0.7 0.2 1.9 -1.0 -6.2 0.1 -0.1 -1.0 0.8 -3.7 0.2 -4.5 -2.9 0.1 0.5 -0.1 -1.4 0.0 -0.3 -0.1 0.5 1.0 0.4
CoO difference 0.6 0.5 1.1 0 -2 0.5 0.4 0.7 4.4 -36.6 2.2 -5.4 3.7 4.1 1.1 2.4 0 0 1.3 4.1 4.1 13.2 -3.2 -2.2 1.1 -0.2 4.6
Source: Eurostat (online data code: migr_pop1ctz)

36
Table 17 Transnational practices by main citizenship group, 2010 (%)
Worked
abroad (%)
Studied
abroad (%)
Lived
abroad
(%)
Holyday
abroad
(%)
EU-27 12.7 7.6 10.4 21.9
Austria 17.2 8.1 11.5 43.4
Belgium 10.7 9.4 11.8 47.7
Bulgaria 9.9 1.4 3.4 0.7
Cyprus 17.5 20.8 15.3 8.9
Czech Republic 6.2 2.7 2.9 15.4
Denmark 21.9 12.0 17.2 39.1
Estonia 12.5 7.3 10.7 8.6
Finland 14.4 9.9 12.9 12.6
France 13.5 6.7 12.1 21.6
Germany 13.0 7.9 11.1 38.0
Greece 11.7 9.2 9.3 4.3
Hungary 8.8 2.8 4.3 2.5
Ireland 26.8 15.0 17.6 29.3
Italy 7.2 3.5 5.1 9.8
Latvia 10.9 2.6 8.7 3.9
Lithuania 14.4 3.2 7.3 7.6
Luxembourg 26.9 46.0 34.4 78.4
Malta 11.2 5.4 10.0 20.1
Netherlands 17.7 12.3 14.6 51.5
Poland 10.0 1.7 4.2 4.6
Portugal 13.3 4.7 6.8 6.1
Romania 8.3 1.0 4.6 5.0
Slovakia 14.9 3.3 5.3 22.2
Slovenia 11.4 8.7 10.2 45.3
Spain 14.8 13.9 16.5 13.2
Sweden 23.0 15.9 19.5 25.6
United Kingdom 15.4 12.6 14.8 33.2
Source: Eurobarometer EB73.3

37
Table 18 Transnational practices by main citizenship group, 2010 (%)
Relatives
abroad
Friends
abroad
Friends
from
abroad
Partner
from
abroad
EU-27 27.3 39.7 29.1 8.2
Austria 25.4 39.3 39.6 10.5
Belgium 25.8 41.8 33.3 13.1
Bulgaria 28.9 50.7 10.4 1.1
Cyprus 54.5 57.2 39.4 10.0
Czech Rep 15.1 32.9 18.5 2.6
Denmark 25.5 45.3 41.6 6.9
Estonia 37.2 53.4 17.7 11.7
Finland 30.7 43.1 27.5 4.9
France 21.5 37.6 34.1 13.4
Germany 27.9 37.5 37.1 10.8
Greece 28.7 34.3 24.8 4.2
Hungary 17.3 25.2 16.7 3.3
Ireland 59.3 67.8 42.5 11.5
Italy 11.5 22.6 16.5 4.2
Latvia 42.8 61.5 16.5 10.8
Lithuania 46.6 59.0 15.1 4.0
Luxembourg 60.2 72.4 69.1 32.7
Malta 66.2 53.3 31.7 6.8
Netherlands 26.8 51.1 36.7 8.4
Poland 32.9 49.3 10.9 1.9
Portugal 45.2 49.3 29.6 5.0
Romania 36.7 43.4 14.1 3.6
Slovakia 31.5 51.8 22.4 2.6
Slovenia 38.1 50.3 41.6 5.5
Spain 26.7 37.4 40.5 12.8
Sweden 28.6 55.7 57.1 17.3
United Kingdom 36.8 45.0 33.1 8.2
Source: Eurobarometer EB73.3