salary&benefitscovers layout 1 10/4/12 1:41 pm page 5 ... · nonprofit organizations new york...
TRANSCRIPT

2012Nonprofit OrganizationsNew York StateSalary & Benefits Report Collaborating Partner
Salary&BenefitsCovers_Layout 1 10/4/12 1:41 PM Page 5
SAMPLE

2012 Nonprofit Organizations New York State Salary and Benefits Report
Collaborating Partner
Based on a Salary and Benefits Survey of Nonprofit Organizations in the U.S.A.,
Authored and Administered by
© 2012 Bluewater Nonprofit Solutions SAMPLE

All rights reserved. No part of this publication may be reproduced, distributed, or transmitted in any form or by any means, or stored in a database or retrieval system, except as permitted under the U.S. Copyright Act of 1976, without the prior written permission of both the copyright owner and the publisher of this report. The scanning, uploading and distribution of this report via the Internet or via any other means without the written permission of both the copyright owner and the publisher is illegal and punishable by law. Please purchase only authorized electronic editions, and do not participate in or encourage electronic piracy of copyrighted materials. Your support of the author’s rights is appreciated. Limit of Liability/Disclaimer of Warranty: While the publisher and the author have used their best efforts in preparing this report, they make no representation or warranties with respect to the accuracy or completeness of the contents of this report and specifically disclaim any implied warranties of merchantability or fitness for a particular purpose. No warranty may be created or extended by sales representatives or written sales materials. You should consult with a professional where appropriate. Neither the publisher nor the author shall be liable for any loss of profit or any other commercial damages, including but not limited to special, incidental, consequential, or other damages. The information contained in this report is not intended to serve as a replacement for professional compensation and benefits advice. Any use of the information in this report is at the reader’s discretion. The author and the publisher specifically disclaim any and all liability arising directly or indirectly from the use or application of any information contained in this report. A human resources professional should be consulted regarding your specific situation.
Published by NPT Publishing Group and The NonProfit Times 201 Little Road Morris Plains, NJ 07950 Tel: (973) 401-0202 Fax: (973) 401-0404 ISBN: 978-0-9884320-4-8
2012 Nonprofit Organizations New York State Salary and Benefits Report © 2012 Bluewater Nonprofit Solutions | Page 3
SAMPLE

About The NonProfit Times Publishing Group
NPT Publishing Group, Inc. is structured for success in an increasingly more engaged, more connected media environment. Since 1987, NPT Publishing has been the leading information provider for the nonprofit sector delivering the most comprehensive, nonpartisan news and analysis to global audiences across many platforms. NPT’s publishing platforms include: The NonProfit Times, Exempt Magazine, NPT-TV, nonprofit jobs, special reports, educational webinars, and informational E-Newsletters. For additional information please visit www.thenonprofittimes.com
About Bluewater Nonprofit Solutions
Bluewater Nonprofit Solutions is a leading provider of salary and benefits surveys, management and information technology consulting, and credit card processing to nonprofit organizations. Their leading edge survey tools offer unlimited customization and flexible reporting options that allow quick, affordable tailoring of a survey to meet the needs of any associations, industry groups, professional societies, or chambers of commerce. Bluewater was founded by former nonprofit executives, and was created out of their deep knowledge and experiences providing day-to-day leadership within charitable organizations for more than 25 years. To learn more, visit www.bwnps.com Contact Information: Bluewater Nonprofit Solutions 11285 Elkins Road, Suite D4 Roswell, GA 30076 Office Phone: 770-777-4828 Email: [email protected]
2012 Nonprofit Organizations New York State Salary and Benefits Report © 2012 Bluewater Nonprofit Solutions | Page 4
SAMPLE

Table of Contents Page
I. Introduction 10 1. Developing the Survey 10 2. Data Effective Date 10 3. Data Sources 10 4. Data Confidentiality 10 5. Survey Data Collection 11 6. Survey Participation 11 7. Survey Completion 11 8. Understanding what Survey Responses are Displayed 12
II. Overview of Survey Participants 13 1. Characteristics of Participating Organizations 13 2. Survey Participants 14
III. Guide to Locating and Using the Report Data 19 1. Finding and Using the Compensation Data 19 2. Finding and Using the Benefits Data 22 3. Report Presentation Views 28 4. Explanation of Data Fields Used 30 5. Compensation Data Field Definitions 31 6. Employee Benefits Data Field Definitions 32 7. Navigating the Report Using Bookmarks 34
IV. Compensation 35 1. Operating Unit Compensation Costs & Practices 36 2. Employee Turnover & Salary Increases 38 3. Administrative/General Office Job Family 40
a. Administrative Director Position 42 b. Administrative Assistant, Intermediate Level Position 44 c. Administrative Assistant, Junior Level Position 46 d. Administrative Assistant, Senior Level Position 48 e. Data Entry Operator Position 50 f. Data Entry Supervisor Position 52 g. Executive Assistant Position 54
Page h. File Clerk Position 56 i. Mail Clerk Position 58 j. Meetings and Events Manager/Planner Position 60 k. Office Manager Position 62 l. Receptionist Position 64
4. Advocacy / Government Affairs Job Family 66 a. Government Relations Director/Manager Position 68 b. Grassroots Advocacy/Campaign Manager Position 70 c. Policy Analyst Position 72
5. Athletics / Recreation Job Family 74 a. Recreation/Activity Leader Position 76
6. Call Center Job Family 78 a. Inbound Call Center Associate Position 80 b. Inbound Call Center Manager Position 82 c. Inbound Call Center Supervisor Position 84
7. Communications / Marketing Job Family 86 a. Communications/Marketing/Pub. Relations Assist. Pos 88 b. Communications/Public Relations Director Position 90 c. Communications/Public Relations Manager Position 92 d. Marketing Coordinator Position 94 e. Marketing Director Position 96
8. Conservation / Environmental Programs Job Family 98 a. Energy Auditor Position 100 b. Environmental/Sustainability Educator Position___________ 102
9. Culture / Performing Arts Job Family 104 a. Artistic Director Position__ 106 b. Box Office/Sales Manager Position 108 c. Curator Position 110 d. Exhibits Manager Position 112 e. Production Manager/Coordinator Position 114 f. Technical Staff Position 116
10. Education Job Family__ 118 a. Adult Education Teacher Position 120 b. Department Chair Position 122
2012 Nonprofit Organizations New York State Salary and Benefits Report © 2012 Bluewater Nonprofit Solutions | Page 5
SAMPLE

Page c. Instructor Position 124 d. Librarian Position 126 e. School Principal/Headmaster Position 128 f. Teacher, K – 12 Position 130 g. Teacher, Pre-School/Kindergarten Position 132 h. Teaching Assistant, K-12 134 i. Teaching Assistant, Pre-School/Kindergarten Position 136
11. Executive Job Family 138 a. Chancellor/President Position 140 b. Chief Administrative Officer Position 142 c. Chief Development Officer Position 144 d. Chief Executive Officer/President /Executive Dir. Position 146 e. Chief Financial Officer Position 148 f. Chief Human Resources Officer Position 150 g. Chief Information Officer Position 152 h. Chief Marketing Officer Position 154 i. Chief Medical Officer Position 156 j. Chief Operating Officer/Associate Executive Dir. Position 158 k. Chief Program Officer Position 160 l. Executive Vice President Position 162
12. Facilities / Maintenance Job Family 164 a. Building Manager Position 166 b. Driver Position 168 c. Facilities Manager Position 170 d. Groundskeeper Position 172 e. Janitor or Custodian Position 174 f. Maintenance Supervisor Position 176 g. Maintenance Technician/Specialist Position 178 h. Security Guard/Officer Position 180
13. Finance Job Family 182 a. Accounting Clerk Position 184 b. Accounting Manager Position 186 c. Accounts Payable Manager/Supervisor Position 188 d. Accounts Receivable Manager/Supervisor Position 190 e. Assistant Controller/Assistant Dir. of Accounting Position 192
Page f. Bookkeeper Position 194 g. Budget Analyst Position 196 h. Director of Accounting/Controller Position 198 i. Director of Finance Position 200 j. Finance Administrator Position 202 k. Finance Analyst Position 204 l. Internal Auditor Position 206 m. Senior Accountant Position 208 n. Staff Accountant Position 210
14. Food Services Job Family 212 a. Cook Position 214 b. Food Service Assistant/Worker Position 216 c. Food Service Manager or Supervisor Position 218
15. Grant Making Job Family 220 a. Foundation Program Assistant Position 222 b. Foundation Program Associate Position 224 c. Foundation Program Officer Position 226
16. Graphics / Printing Job Family 228 a. Graphic Artist Position 230
17. Housing Job Family 232 a. Construction Manager Position 234 b. Director of Property Management Position 236 c. Director of Resident Services Position 238 d. Resident Services Coordinator Position 240 e. Shelter Supervisor Position 242
18. Human Resources Job Family 244 a. Employee Benefits Administrator Position 246 b. Employee Training Manager/Specialist Position 248 c. Human Resources Assistant Position 250 d. Human Resources Director/Manager Position 252 e. Human Resources Generalist Position 254 f. Payroll Clerk Position 256 g. Payroll Manager Position 258 h. Recruiter Position 260 i. Recruiting Manager Position 262
2012 Nonprofit Organizations New York State Salary and Benefits Report © 2012 Bluewater Nonprofit Solutions | Page 6
SAMPLE

Page
19. Income Development / Fundraising Job Family 264 a. Annual Giving Director/Officer Position 266 b. Corporate and Foundation Relations Director Position 268 c. Development Associate (Generalist) Position 270 d. Development Director Position 272 e. Donor Information and Gift Processing Manager Position 274 f. Grant Proposal Writer Position 276 g. Grants Manager Position 278 h. Major Gifts Director/Officer Position 280 i. Membership Assistant Position 282 j. Membership Director/Manager Position 284 k. Shop Manager Position 286 l. Special Events Manager/Specialist Position 288
20. Information Technology Job Family 290 a. Database Administrator Position 292 b. Database Analyst Position 294 c. Desktop Support Manager Position 296 d. Desktop Support Specialist Position 298 e. Information Technology Manager Position 300 f. Network Manager Position 302 g. Web Developer Position 304 h. Webmaster Position 306
21. Legal Job Family 308 a. Attorney/Lawyer Position 310 b. Legal Assistant Position 312 c. Paralegal Position 314 d. Senior Attorney/Lawyer Position 316
22. Medical Services Job Family 318 a. Clinic Director Position 320 b. Community Health Worker Position 322 c. Director of Nursing Position 324 d. Medical Case Manager Position 326 e. Medical Receptionist Position 328 f. Medical Records Clerk Position 330 g. Nurse Practitioner Position 332
Page h. Nutritionist/Dietician Position 334 i. Occupational Therapist Position 336 j. Patient Accounts Representative Position 338 k. Personal Attendant/Home Health Care Worker Position 340 l. Physical Therapist Position 342 m. Physician’s Assistant Position 344 n. Registered Nurse Position 346 o. Speech Pathologist Position 348
23. Program Administration Job Family 350 a. Partnership & Collaboration Manager Position 352 b. Program Analyst Position 354 c. Program Assistant Position 356 d. Program Coordinator Position 358 e. Program Director/Manager Position 360 f. Project Manager (Non-Technical) Position 362 g. Regional Area Program Coordinator Position 364 h. Regional Area Program Director or Manager Position 366
24. Program Delivery Job Family 368 a. Case Manager, Entry-Level Position 370 b. Case Manager, Mid-Level Position 372 c. Case Manager, Senior-Level Position 374 d. Child Care Assistant/Babysitter Position 376 e. Counselor, Entry-Level Position 378 f. Counselor, Mid-Level Position 380 g. Counselor, Senior-Level Position 382 h. Direct Care Counselor Position 384 i. Driver Position 386 j. Eligibility Specialist Position 388 k. Job Coach Position 390 l. Job Placement Coordinator Position 392 m. Licensed Psychologist Position 394 n. Psychiatric Social Worker Position 396 o. Psychiatrist Position 398 p. Social Worker, Entry-Level Position 400 q. Social Worker, Mid-Level Position 402
2012 Nonprofit Organizations New York State Salary and Benefits Report © 2012 Bluewater Nonprofit Solutions | Page 7
SAMPLE

Page r. Social Worker, Senior-Level Position 404 s. Vocational or Placement Counselor Position 406
25. Purchasing Job Family 408 a. Purchasing Coordinator/Specialist Position 410 b. Purchasing Manager Position 412
26. Regional General Management Job Family 414 a. Area Director/Manager Position 416
27. Volunteerism Job Family 418 a. Community Organizer Position 420 b. Volunteer Coordinator Position 422 c. Volunteer Director Position 424
28. Warehousing Job Family 426 a. Warehouse Manager Position 428
V. Employee Benefits 430 1. General Benefit Offerings 431 2. Flexible Spending Accounts 434 3. Employee Leave Types 436
a. Paid Vacation 436 b. Paid Sick Leave 438 c. Paid Personal Days 440 d. Paid Company Holidays 442 e. Paid Floating Holidays 444 f. Paid Bereavement Time 446 g. Extended Sick Leave Pool (ESLP) 448 h. Paid Time Off (PTO) 450 i. Family Medical Leave Act (FMLA) with Pay 452
4. Overtime Practices 454 5. Medical 456
a. Plan Offerings 456 b. Plan Costs 459
6. Prescription Drug Plans 462 7. Dental 465
a. Plan Offerings 465 b. Plan Costs 468
Page
8. Vision 471 a. Plan Offerings 471 b. Plan Costs 474
9. Life Insurance & Disability 476 a. Plan Offerings 476 b. Plan Eligibility 479
10. Retirement 482 a. Plan Offerings 482 b. Plan Eligibility 484 c. Plan Contributions 487
11. Executive Benefit Offerings 489 a. Chief Executive Officer /President/Executive Director 489 b. Chancellor/President 491 c. Chief Operating Officer/Associate Executive Director 493 d. Executive Vice President 495 e. Chief Administrative Officer 497 f. Chief Advocacy Officer 499 g. Chief Development Officer 501 h. Chief Financial Officer 503 i. Chief Human Resources Officer 505 j. Chief Information Officer 507 k. Chief Marketing Officer 509 l. Chief Medical Officer 511 m. Chief Program Officer 513 n. Chief Scientific Officer 515 o. Chief of Staff 517
12. Executive Employment Agreements 519 a. Chief Executive Officer /President/Executive Director 519 b. Chancellor/President 521 c. Chief Operating Officer/Associate Executive Director 523 d. Executive Vice President 525 e. Chief Administrative Officer 527 f. Chief Advocacy Officer 529 g. Chief Development Officer 531 h. Chief Financial Officer 533
2012 Nonprofit Organizations New York State Salary and Benefits Report © 2012 Bluewater Nonprofit Solutions | Page 8
SAMPLE

Page
i. Chief Human Resources Officer 535 j. Chief Information Officer 537 k. Chief Marketing Officer 539 l. Chief Medical Officer 541 m. Chief Program Officer 543 n. Chief Scientific Officer 545 o. Chief of Staff 547
VI. Wage Conversion Tables 549 VII. Glossary of Terms 554
2012 Nonprofit Organizations New York State Salary and Benefits Report © 2012 Bluewater Nonprofit Solutions | Page 9
SAMPLE

Introduction
Developing the Survey The 2012 Nonprofit Organizations Salary and Benefits Survey was designed to address the unique compensation and benefit practices of nonprofits in the U.S.A. Prior to developing the survey, extensive research was completed to ensure the survey reports would satisfy the needs of the nonprofit sector. The survey used a state-of-the-art online questionnaire to collect total cash compensation data on 311 nonprofit specific positions from entry-level to executive directors. Where possible, detailed benefits information was collected to cover plan costs, participation rates and eligibility for medical, dental, vision, life, disability, and retirement plans. More than 34 general benefit offerings from employee leave to telecommuting are covered as well. An executive benefits section provides additional information on these benefits and on employment agreements.
Data Effective Date
Survey participants were asked to provide responses to all survey questions with data that was valid for their organization as of April 1, 2012.
Data Sources Participation in the survey was open to all U.S. based nonprofit organizations with at least 1 full time employee working 30 or more hours per week. All Data within the 2012 Nonprofit Organizations Salary and Benefits Reports were obtained directly from nonprofit organizations. As a condition to participating in the survey, each participant was asked to verify that they were an employee that had been authorized by their organization to provide the information requested in the survey. Additionally, they acknowledged that they would provide accurate survey information for their organization. No third party data was used in this report.
Data Confidentiality All questionnaire data have been handled in the strictest confidence by Bluewater Nonprofit Solutions. The data within this report is presented in aggregate to protect the confidentiality of participating organizations. In the case where data specific to a particular organization could possibly be identified, the results have not been published or the presentation of the data has been changed to protect the identity of the organization.
2012 Nonprofit Organizations New York State Salary and Benefits Report © 2012 Bluewater Nonprofit Solutions | Page 10
SAMPLE

Survey Data Collection Data was collected through an online questionnaire on the Bluewater Nonprofit Solutions’ website. Nonprofits were invited to complete the survey from April 1 through July 20, 2012. Prior to completing the questionnaire, participants were asked to register and verify that they were authorized by their organizations to complete the survey.
Survey Participation Participation in the survey was promoted through a variety of channels. The NonProfit Times invited its subscribers to participate in the survey through a series of vehicles including email communications, social media, advertisements on its website, and print and electronic advertisements in its magazines, newsletters and publications. Bluewater Nonprofit Solutions promoted participation in the survey to its customers and other nonprofit organizations through emails, social media, and by advertising on its website. Additionally, the New York Council of Nonprofits (NYCON) and the Grants Professional Association (GPA) invited their members to participate in the survey.
Survey Completion
Organizational Data Survey participants were asked to provide information about their nonprofit organization to make it possible for the survey results to be displayed by operating budget size, number of full-time employees, geographic region, and field of work (based on the classifications in the National Taxonomy of Exempt Organizations). These data are used extensively throughout the report.
Position Matching and Entering Compensation Data Prior to completing the compensation section of the questionnaire, participants were asked to match the organization’s positions to benchmark jobs found in one of 28 job families. Job families are used to group relevant jobs together by functional area of responsibility (e.g., all jobs related to income development). The survey questionnaire made use of benchmark jobs during the position matching process to accommodate the many differences between the size, field, and programs offered by various nonprofit organizations. Because of these differences, similar job titles used across multiple organizations are likely to have differing levels of responsibility and scope associated with them. The use of benchmark jobs helps level the playing field by asking survey participants to match their organization’s positions to a predefined list of positions using job descriptions, not job titles. Once the appropriate benchmark jobs were selected, participants were asked to enter compensation data for each position. They were instructed to enter data for full-time employees only and to match each employee to only one benchmark job description. If more than one employee was being reported for a position, participants were asked to provide average annual compensation data for the group. The majority of the fields on the position entry page were mandatory to ensure data completeness. Participants were given the option to enter the position title used by their organization.
2012 Nonprofit Organizations New York State Salary and Benefits Report © 2012 Bluewater Nonprofit Solutions | Page 11
SAMPLE

Organizations that completed the survey by the deadline were provided a complimentary Executive Summary report of the survey results and were given a discount on the purchase price of the full survey report.
Understanding what Survey Responses are Displayed The online survey questionnaire was designed with functionality and tools that helped survey participants provide accurate data. A series of business rules were used during the data entry process. These business rules help improve the quality of the survey data by providing data validation in real time. Once participation in the survey was closed, a series of additional data quality checks are made. Survey participants were contacted directly to verify suspect responses, and changes were made to these survey participants’ data as necessary. Salary data was not collected for part-time positions. However, the data can be used as a starting point for determining part-time pay by calculating a percentage of the base salary amount reported in the data. As part of the quality control process, data display rules are used to determine what information is presented throughout the report. The following data display guidelines are utilized throughout the report. Position Data Titles Removed For Insufficient Data Individual job title reports are not displayed where fewer than 5 organizations have provided a response. In cases where fewer than 5 responses are available, the data is still used for the aggregated data reporting in the Job Family and Operating Unit Compensation Costs & Practices reports. Survey Responses Not Displayed Survey responses are displayed as a hyphen (-) in cases where data is not available or where an insufficient number of organizations provided a response to the survey question. In the case where a zero is displayed, this data should be considered valid and the response accurate.
Displaying Statistical Data (AVG, MIN, 25th PCTL, Median, 75th PCTL, MAX) The key statistical measures of Average (AVG), Minimum (MIN), 25th Percentile (25th PCTL), Median (50th PCTL), 75th Percentile (75th PCTL), and Maximum (MAX) are used to display data throughout the report. In cases where fewer than 4 organizations have provided valid data, only the AVG field will display data. All other statistical fields will display a hyphen (-) when data is not available. Throughout the report, survey responses will be displayed as numbers unless otherwise indicated by the use of a percentage (%) or dollar ($) sign.
2012 Nonprofit Organizations New York State Salary and Benefits Report © 2012 Bluewater Nonprofit Solutions | Page 12
SAMPLE

Overview of Survey Participants
Characteristics of Participating Organizations This section provides information about the 429 nonprofit organizations in the State of New York that completed the 2012 Nonprofit Organizations Salary and Benefits Survey. These organizations provided detailed information on benefit practices and compensation data on 169 different nonprofit positions. The tables in this section provide an overview of the participants based upon where they are located, their operating budget size, field of services and the number of full time staff they employ.
Field of Work Number of Organizations Arts, Culture, and Humanities 102
Education 26
Environment and Animals 14
Health 48
Human Services 173
International, Foreign Affairs 6
Public, Societal Benefit 42
Religion Related 3
Mutual/Membership Benefit 7
Unknown, Unclassified 8
Geographic Region Number of Organizations Central 50
Central Southern Tier 39
Greater Capital 71
Hudson Valley 45
North Country 10
New York City 145
Western 38
Finger Lakes 31
Full-Time Employees Number of Organizations 1-10 227
11-25 80
26-50 31
51-100 39
101-200 26
201 or more 26
Operating Budget Number of Organizations $0 - $249,999 55
$250,000 - $499,999 72
$500,000 - $999,999 82
$1,000,000 - $2,499,999 92
$2,500,000 - $4,999,999 34
$5,000,000 - $9,999,999 39
$10,000,000 - $24,999,999 34
$25,000,000 or More 21 SAMPLE

Survey Participants A Better Chance, Inc. Action for a Better Community, Inc. Adaptive Sports Foundation Advocates for Exceptional Children, Inc. Agricultural Stewardship Association Al Sigl Community of Agencies Alcoholism & Drug Abuse Council of Orange County Alwan Foundation (DBA Alwan for the Arts) Alzheimer's Association America SCORES American Indian Community House, Inc. American Red Cross Arbor Housing and Development ARISE Art Omi Inc. Artists Space Arts & Business Council Arts in Orange Arts Services Initiative of Western New York, Inc. Association to Benefit Children Aurora of Central New York, Inc. AVODAH: The Jewish Service Corps Battery Dance Company Bedford Historical Society Behavioral Health Services North Belmont Housing Resources for WNY Big Apple Performing Arts Big Brothers Big Sisters of Greater Rochester Brookwood Broome County Arts Council Broome County Urban League
Buffalo & Erie Co Historical Society Buffalo Niagara RIVERKEEPER Capabilities Partnership Inc Capital District Community Gardens Capital Region Sponsor-A-Scholar, Inc. CAPTAIN Youth and Family Services Capuchin Franciscans, Province of St. Mary Cardinal O'Hara High School Care Management Coalition of Western New York, Inc. Carnegie Art Center Carver Community Center Catholic Charities Brooklyn & Queens Catholic Charities of Broome County Catholic Family Center Catskill Area Hospice & Palliative Care, Inc. CCCS of Rochester Center for Aging in Place Center for Community Alternatives Center for Creative Education Center for Disability Rights, Inc. Center for Family Life and Recovery, Inc. Center for Working Families Central Adirondack Partnership Central New York Health Systems Agency, Inc. Central Terminal Restoration Corp. Chadwick Residence, Inc. Chances and Changes, Inc. Charles Settlement House Inc Chautauqua Alcoholism & Substance Abuse Council Chemung County Historical Society Chemung County Humane Society and SPCA
Chenango County Council of the Arts Child Care Council of Dutchess & Putnam, Inc. Child Care Council of Nassau, Inc. Child Care Council of Orange Co., Inc. Child Care Council, Inc. Child Care Solutions Child Development Council of Central New York, Inc. Children's Media Project Chinese Methodist Center Corp CitiWide Harm Reduction City Year New York Coarc Columbia County Community Healthcare Consortium, Inc. Columbia County Habitat for Humanity Columbia Land Conservancy, Inc. Community Action of Greene County Community Awareness Network for a Drug-free Life and Environment Community Capital Resources Community Care Network of Nichols Community Caregivers Community Concern of WNY, Inc. Community Cradle Community Planning Council of Yonkers Community Services for the Developmentally Disabled Community Voices Heard Compeer of the Mohawk Valley, Inc. Compeer Rochester Inc Coney Island USA CONNECT, Inc. Consumer Directed Choices
2012 Nonprofit Organizations New York State Salary and Benefits Report © 2012 Bluewater Nonprofit Solutions | Page 14
SAMPLE

Consumer Directed Personal Assistance Association of NYS Cooperstown Art Association Cornell Cooperative Extension Dutchess County Cornell University Cortland County Community Action Program, Inc. Council on the Arts and Humanities for Staten Island Court Appointed Special Advocates for Children Crandall Public Library Crime Victims Assistance Center, Inc. CURE Childhood Cancer Association Dance Films Association Danielle House Dextra Baldwin McGonagle Foundation Dixon Place Doing Art Together, Inc. Domestic Violence and Rape Crisis Services of Saratoga County Doug Varone and Dancers Downtown Albany Business Improvement District Dumbo Arts Center Dutchess County Arts Council Dutchess County Community Action Agency, Inc. EAC Early Care and Learning Council East End Arts EBA ECBA Volunteer Lawyers Project Economists for Peace and Security ECOS: The Environmental Clearinghouse, Inc Education for Employment
Education Through Music Educational & Institutional Cooperative Service Ellenville Public Library & Museum Elmcor Youth And Adult Activities, Inc Emelin Theatre En Foco, Inc. Enable Epilepsy Association of WNY, Inc. Epilepsy Foundation of NENY, Inc. Equal Justice USA Erie County Council for the Prevention of Alcohol and Substance Abuse Everywoman Opportunity Center, Inc. Families and Work Institute Families Together in NYS Family Justice Center of Erie County Family Reach Foundation Family Service Communities Family Services, Inc. Farm Sanctuary Finger Lakes ReUse, Inc. Five Towns Senior Center Inc. Flamenco Vivo Carlota Santana FOCUS Churches of Albany, Inc. Foodnet Meals on Wheels Footsteps Foundation of the NYS Psychological Association Friends In Deed Friends of Recovery of Delaware and Otsego Counties, Inc. Friends of Reinstein Nature Preserve Friends of Seniors of Dutchess County Corp. Friends of the Children New York Friends of Van Cortlandt Park Fulton Friendship House, Inc.
Garth Fagan Dance, Inc. Gateway Community Industries, Inc. General Human Outreach in the Community, Inc. Genesee-Orleans Regional Arts Council Geva Theatre Center Girl Scouts of NYPENN pathways, Inc. GIRL SCOUTS OF WESTERN NEW YORK INC Glens Falls Independent Living Center Good for Good, Inc. Grace Smith House, Inc. Grantmakers Forum of New York Grassroots Gardens of Buffalo Greater New York Councils, Boy Scout of America Greene County Council on the Arts, Inc. Habitat for Humanity of NYS Hamilton Hill Arts Center Handicapped Children's Association Hanford Mills Museum Harlem RBI Harlem Stage Health Care Advocates Healthy Community Alliance, Inc. Hearts and Hands-Faith in Action Inc. Heights and Hills Hemophilia Association of NY Inc HERE Arts Center Herkimer County HealthNet, Inc. Hofstra University Museum Homeless Action Committee, Inc Honest Weight Community Initiative, Inc. Hope 7 Community Center Hospicare and Palliative Care Services of Tompkins County, Inc. Hospice & Palliative Care Assn. of NYS Housing Opportunities Made Equal Inc. HR Dynamics, Inc. as an Agent for FEGS
2012 Nonprofit Organizations New York State Salary and Benefits Report © 2012 Bluewater Nonprofit Solutions | Page 15
SAMPLE

Hubbard Hall Projects, Inc. Human Development Services of Westchester Hunger Solutions New York, Inc. Huntington's Disease Society of America Huther Doyle Memorial Institute Innovative Charitable Initiatives, Inc, InterExchange, Inc. InterFaith Works of CNY International Film Seminars, Inc. Jewish Community Center of Binghamton Jewish Family Services of Ulster County John W. Lavelle Preparatory Charter School Joseph's House and Shelter Just Buffalo Literary Center King Manor Museum Kopernik Observatory & Science Center Lake Placid-North Elba Historical Society Lakeview LARAC LDA Life & Learning Services Legal Aid Society of Northeastern NY Liberty Community Development Corporation Liberty Resources, Inc. LifeSong Inc. Lighthouse International Literacy New York Greater Capital Region, Inc. Literacy Orange` Loeb House, Inc. Lollypop Farm Long Island Arts Alliance Long Island Minority AIDS Coalition Lotus Fine Arts Productions, Inc. dba Lotus Music & Dance Lower East Side Printshop
Madison County Council on Alcoholism & Substance Abuse, Inc. d/b/a/ Bridges Magic Box Productions Malignant Hyperthermia Assoc of the US MARC Maternity and Early Childhood Foundation MCIF Center McMahon/Ryan Child Advocacy Center Meals on Wheels for Western New York, Inc. Meals on Wheels of Chemung County, Inc. Meals on Wheels of Syracuse Mediation Center of Dutchess County, Inc. Medical Motor Service MHA of Columbia - Greene Counties, Inc. Mid-Erie Counseling and Treatment Services Mohawk Opportunities, Inc Mohawk Valley Community Action Agency, Inc Momenta Art MOMMAS, Inc. Mountain View Prevention Services, Inc. Museum of Chinese in America Museumwise Music is Art NADAP, Inc. Nantucket Film Festival National Alliance for Musical Theatre National Assoc. of Social Workers, NYS National Center for Law and Economic Justice National Down Syndrome Society National Kidney Foundation National Marfan Foundation, Inc. NELLCO New York Center for Liver Transplantation
New York Communities Organizing Fund, Inc. New York Council of Nonprofits, Inc. New York Folklore Society New York Foundation for the Arts New York Women in Film & Television Niagara County Historical Society NNY Cerebral Palsy Association NNY Rural Health Care Alliance, Inc. North Area Meals on Wheels North Country Prenatal/Perinatal Council Northeast Community Council, Inc Northern Manhattan Perinatal Partnership, Inc. NYS Psychological Association NYSARC Inc., Broome-Tioga County Chapter dba ACHIEVE NYSILC Old Fort Niagara Oneonta Family YMCA ONTARIO COUNTY MENTAL HEALTH Opera Saratoga Opportunities for Chenango Options for Community Living, Inc Oswego County Opportunities, Inc. Otsego County Chapter NYSARC, Inc. PARENTS OF SPECIAL CHILDRENT Parsons Child and Family Center Paul Taylor Dance Foundation, Inc. People Inc Performance Space 122, Inc. Perinatal Network of Monroe County Peter Maurin House Inc. Phelps Arts Center Planned Parenthood of Nassau County, Inc. Planned Parenthood of South Central New York
2012 Nonprofit Organizations New York State Salary and Benefits Report © 2012 Bluewater Nonprofit Solutions | Page 16
SAMPLE
Planned Parenthood of the Rochester/Syracuse Region Potential Unlimited Productions, Inc. PowerPlay NYC, Inc. Prevent Child Abuse New York, Inc. Prevention Network Printed Matter, Inc Pro Bono Partnership Rainbow Chimes, Inc. Rainbow Heights Club REACH CNY, Inc. READ Foundation Read To Succeed Buffalo Regional Economic Community Action Program Regional EMS Council of NYC Inc Regional Food Bank of Northeastern New York Research Foundation of CUNY Resource Center for Accessible Living, Inc. Retired Public Employees Assoc, Inc. Roberson Museum and Science Center Rochester City Ballet Rochester Hearing & Speech Center Rochester International Council Rockaway Artists Alliance, Inc. Rockland Independent Living Center, Inc. Rosie's Theater Kids, Inc. Roundabout Theatre Company RUPCO Saint Dominic's Home Saratoga Arts Saratoga P.L.A.N. SCAN New York Schenectady Museum Association Schuyler Center for Analysis and Advocacy Scleroderma Foundation Tri-State, Inc. Chapter
Sculpture Space, Inc. Seaway Valley Prevention Council Services for the UnderServed Seven Pillars House of Wisdom Shadowland Artists, Inc. Shaker Heritage Society shelters of Saratoga, inc Small Wonders Child Care Center, Inc South Central Regional Library Council South End Improvement Corporation Southern Hills Preservation Corporation Southern Tier AIDS Program, Inc. Southern Tier Zoological Society, Inc. Special Citizens Futures Unlimited Inc. Sports & Arts in Schools Foundation Springbrook NY Springville Center for the Arts St. Lawrence County Arts Council St. Lawrence County Health Initiative, Inc. St. Marks Pl Institute for Mental Health St. Paul's Center Standby Program STAT Inc. Staten Island NFP Association Story Pirates Sullivan County Child Care Council, Inc. Sullivan County Head Start, Inc. Sundog Theatre Support-Link Inc. Susan B Anthony House Sylvia Rivera Law Project Symphony Space Teachers & Writers Collaborative The Addictions Care Center of Albany, Inc. THE ALBANY DAMIEN CENTER, INC. The Alcohol and Substance Abuse Prevention Council The Arts Center of the Capital Region
The Brookwood School The Broome County Humane Society & Relief Assoc. Inc. The Child Center of NY The Children's Law Center New York The Civilians The Community Foundation for SCNY The Concord Baptist Church of Christ The Elizabeth Foundation for the Arts The Firemen's Association of the State of New York The History Center in Tompkins County The Jewish Community Center of Staten Island The Korean American Family Service Center The Legal Aid Society of Rochester The Leukemia & Lymphoma Society The Little Orchestra Society/Orpheon Inc. The National Multiple Sclerosis Society, NYC/Southern NY Chapter The New Group The NYS Forum. Inc. The Olana Partnership The Parent-Child Home Program The Salvation Army The Schoolhouse Theater The SEPP Group The United Way of Delaware/Otsego Counties The Workshop Inc, dba Northeast Career Planning Theatre of Youth Company, Inc. Tibet Aid TIER Inc Tioga County Council on the Arts Tioga County Historical Society Tioga County Rural Ministry, Inc.
2012 Nonprofit Organizations New York State Salary and Benefits Report © 2012 Bluewater Nonprofit Solutions | Page 17
SAMPLE

Tioga Opportunities, Inc. Tompkins Community Action, Inc. Transitional Services Association, Inc. Tri-Lakes Center for Independent Living, Inc. Trinity United Methodist Church Trocaire College Troy Savings Bank Music Hall United Jewish Federation of Northeastern NY United Way of Broome County United Way of Buffalo & Erie County Unity House of Troy, Inc Universal School Unlimited Possibilities Utica Public Library
Vassar-Warner Home Visions For Change Visiting Nurse Service of Rochester & Monroe County, Inc. Voices of Ascension VSIONS/Services for the Blind and Visually Impaired Waterkeeper Alliance West Brighton Community LDC Westchester County Historical Society Westchester Disabled On the Move Inc Western Catskills Community Revitalization Council, Inc Wildwood Programs Willie Mae Rock Camp for Girls Winnakee Land Trust
Women's Employment & Resource Center, Inc. Women's Project & Productions, Inc. World Peace Society Writers & Books Young Audiences New York Youth and Family Counseling Agency Youth Service Opportunities Project Youth Shelter Program of Westchester, Inc YUCCA Orange County YWCA Mohawk Valley YWCA NYC YWCA of Niagara YWCA of Ulster County YWCA Westfield YWCAs Northeast Region
2012 Nonprofit Organizations New York State Salary and Benefits Report © 2012 Bluewater Nonprofit Solutions | Page 18
SAMPLE

Guide to Locating and Using the Report Data
Finding and Using the Compensation Data
This section will help you understand what information is available within the compensation reports and where to find it. Each report section presents unique information that can be used to quickly assess market competitiveness and benchmark compensation practices. The compensation data is organized and displayed through four different reports. When used in combination, the report sections provide a comprehensive view of compensation practices throughout all levels of an organization.
Quick Guide to the Compensation Report Sections Type of Information Needed Where to Find the Information
Salary and bonus information for a single position • Individual Job Title Reports
Compensation data for a department or group of related positions • Job Family Reports
Compensation data for all positions within the organization • Operating Unit Compensation Costs & Practices
Report Employee data and compensation practices for the whole
organization • Employee Turnover & Salary Increases Report
The information available within each report section is presented by multiple views to allow for easy comparisons against relevant peer organizations by geographic location, operating budget, or field of work. Each compensation segment below contains a brief description of the information available within the report section. Look for the Suggested Uses for the Data component for recommendations and guidance on how the data might be used for comparison purposes.
Individual Job Title Reports Individual Job Title reports provide base salary, bonus information, and total cash compensation data for a specific position title including:
• Benchmark Job Description Used for the Position • Total Number of Organizations Reporting Data for the Position • Average Number of Full-Time Employees within the Position • Average Number of Years Employed with the Organization • Base Salary Compensation Statistics • Percentage of Organizations Offering Bonus Pay • Percentage of Employees Receiving Bonus Pay • Maximum Bonus Offered • Average Bonus Pay Received • Total Cash Compensation Statistics
2012 Nonprofit Organizations New York State Salary and Benefits Report © 2012 Bluewater Nonprofit Solutions | Page 19
SAMPLE
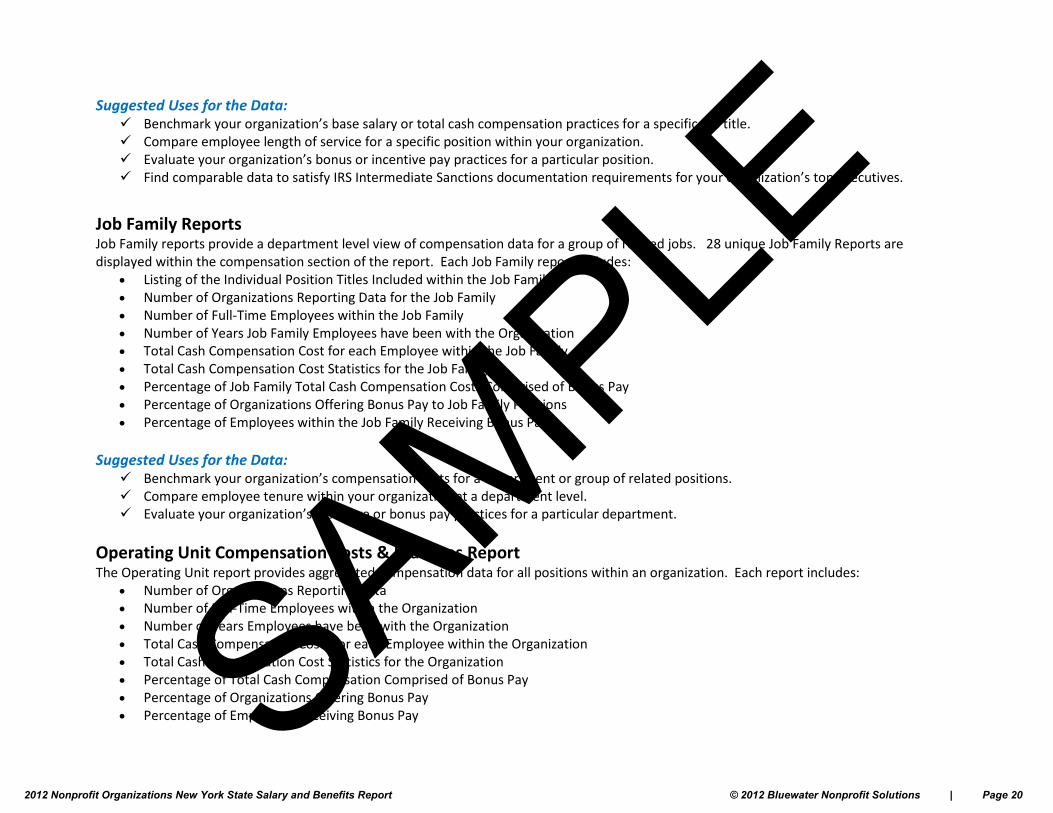
Suggested Uses for the Data: Benchmark your organization’s base salary or total cash compensation practices for a specific job title. Compare employee length of service for a specific position within your organization. Evaluate your organization’s bonus or incentive pay practices for a particular position. Find comparable data to satisfy IRS Intermediate Sanctions documentation requirements for your organization’s top executives.
Job Family Reports Job Family reports provide a department level view of compensation data for a group of related jobs. 28 unique Job Family Reports are displayed within the compensation section of the report. Each Job Family report includes:
• Listing of the Individual Position Titles Included within the Job Family • Number of Organizations Reporting Data for the Job Family • Number of Full-Time Employees within the Job Family • Number of Years Job Family Employees have been with the Organization • Total Cash Compensation Cost for each Employee within the Job Family • Total Cash Compensation Cost Statistics for the Job Family • Percentage of Job Family Total Cash Compensation Costs Comprised of Bonus Pay • Percentage of Organizations Offering Bonus Pay to Job Family Positions • Percentage of Employees within the Job Family Receiving Bonus Pay
Suggested Uses for the Data: Benchmark your organization’s compensation costs for a department or group of related positions. Compare employee tenure within your organization at a department level. Evaluate your organization’s incentive or bonus pay practices for a particular department.
Operating Unit Compensation Costs & Practices Report The Operating Unit report provides aggregated compensation data for all positions within an organization. Each report includes:
• Number of Organizations Reporting Data • Number of Full-Time Employees within the Organization • Number of Years Employees have been with the Organization • Total Cash Compensation Costs for each Employee within the Organization • Total Cash Compensation Cost Statistics for the Organization • Percentage of Total Cash Compensation Comprised of Bonus Pay • Percentage of Organizations Offering Bonus Pay • Percentage of Employees Receiving Bonus Pay
2012 Nonprofit Organizations New York State Salary and Benefits Report © 2012 Bluewater Nonprofit Solutions | Page 20
SAMPLE

Suggested Uses for the Data: Benchmark your organization’s total compensation costs. Compare the organization’s overall employee tenure and retention practices. Evaluate your organization’s incentive or bonus pay practices.
Employee Turnover & Salary Increases Report This report section provides aggregated employee turnover & salary increase data at the organization level. Each report includes:
• Number of Organizations Reporting Data • Number of Full-Time Employees within the Organization • Percentage of Full-Time Exempt Level Staff • Number of Part-Time Employees within the Organization • Number of Years Employees have been with the Organization • Full-Time Employee Turnover Statistics • Annual Salary Increases for Prior Year • Projected Salary Increases for Current Year
Suggested Uses for the Data: Benchmark your organization’s full-time employee turnover. Analyze the organization’s mix of exempt versus non-exempt employees. Compare the organization’s projected and prior year annual salary increase practices. Evaluate the competitiveness of the organization’s staffing model.
2012 Nonprofit Organizations New York State Salary and Benefits Report © 2012 Bluewater Nonprofit Solutions | Page 21
SAMPLE
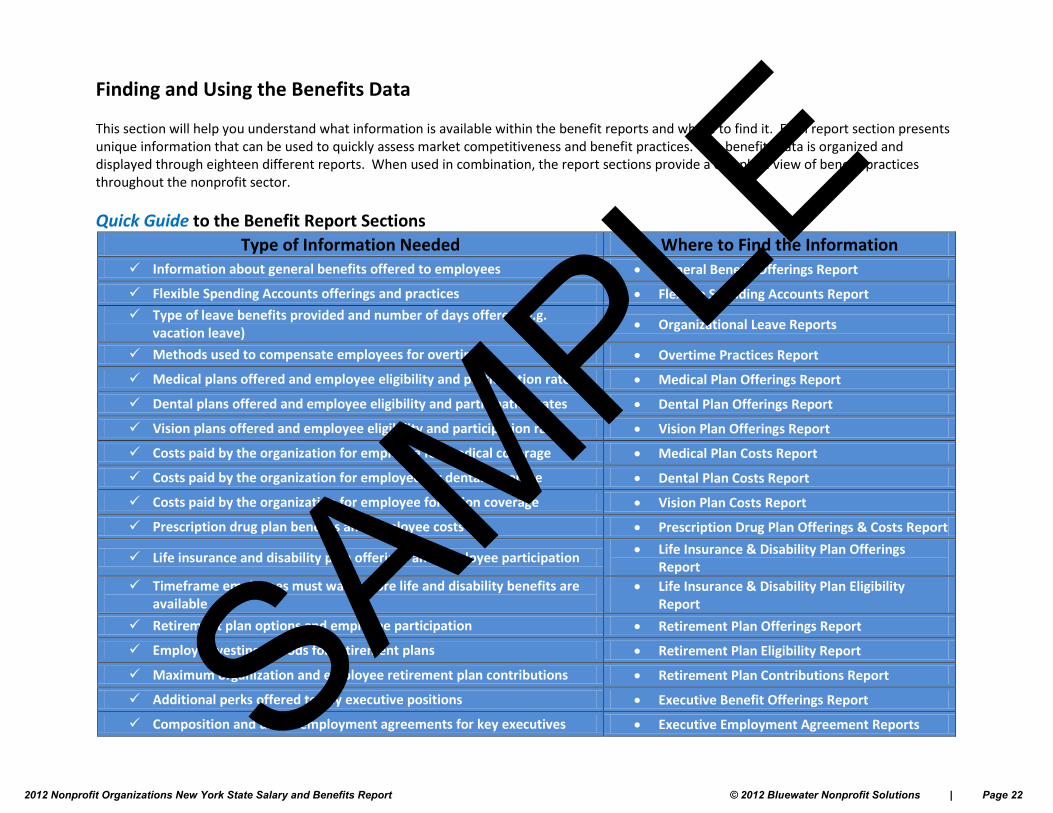
Finding and Using the Benefits Data This section will help you understand what information is available within the benefit reports and where to find it. Each report section presents unique information that can be used to quickly assess market competitiveness and benefit practices. The benefits data is organized and displayed through eighteen different reports. When used in combination, the report sections provide a complete view of benefit practices throughout the nonprofit sector.
Quick Guide to the Benefit Report Sections Type of Information Needed Where to Find the Information
Information about general benefits offered to employees • General Benefit Offerings Report
Flexible Spending Accounts offerings and practices • Flexible Spending Accounts Report
Type of leave benefits provided and number of days offered (e.g. vacation leave)
• Organizational Leave Reports
Methods used to compensate employees for overtime • Overtime Practices Report
Medical plans offered and employee eligibility and participation rates • Medical Plan Offerings Report
Dental plans offered and employee eligibility and participation rates • Dental Plan Offerings Report
Vision plans offered and employee eligibility and participation rates • Vision Plan Offerings Report
Costs paid by the organization for employee for medical coverage • Medical Plan Costs Report
Costs paid by the organization for employee for dental coverage • Dental Plan Costs Report
Costs paid by the organization for employee for vision coverage • Vision Plan Costs Report
Prescription drug plan benefits and employee costs • Prescription Drug Plan Offerings & Costs Report
Life insurance and disability plan offerings and employee participation • Life Insurance & Disability Plan Offerings
Report Timeframe employees must wait before life and disability benefits are
available • Life Insurance & Disability Plan Eligibility
Report
Retirement plan options and employee participation • Retirement Plan Offerings Report
Employee vesting periods for retirement plans • Retirement Plan Eligibility Report
Maximum organization and employee retirement plan contributions • Retirement Plan Contributions Report
Additional perks offered to key executive positions • Executive Benefit Offerings Report
Composition and use of employment agreements for key executives • Executive Employment Agreement Reports
2012 Nonprofit Organizations New York State Salary and Benefits Report © 2012 Bluewater Nonprofit Solutions | Page 22
SAMPLE

The information available within each report section is presented by multiple views to allow for easy comparisons against relevant peer organizations by geographic location, operating budget, number of employees, or field of work. Each benefit segment below contains a brief description of the information available within the report section. Look for the Suggested Uses for the Data component for recommendations and guidance on how the data might be used for comparison purposes.
General Benefit Offerings Report This report section provides information about 34 different general benefits that are offered by organizations to their employees. Each report includes:
• Number of Organizations Reporting Data • Percentage of Organizations Offering Each Benefit Type
Suggested Uses for the Data: Benchmark your organization’s general benefit practices. Identify additional benefits that can be offered to increase market competitiveness. Evaluate the competitiveness of the organization’s benefit package.
Flexible Spending Accounts Report The Flexible Spending Account report provides information on healthcare and dependent care account usage and practices. Each report includes:
• Number of Organizations Reporting Data • Percentage of Organizations Offering Flexible Spending Account Programs • Maximum Employee Contribution Statistics
Suggested Uses for the Data: Analyze the use of flexible spending account benefit programs within the marketplace. Evaluate the competitiveness of your organization’s flexible spending account program.
Organizational Leave Reports Includes the following 9 Report Sections: Paid Vacation Leave, Paid Sick Leave, Paid Corporate Holidays, Paid Floating Holidays, Paid Personal Days, Paid Bereavement, Extended Sick Leave Pool, Paid Time Off (PTO), Family and Medical Leave (FMLA) with Pay These reports provide data on the number of leave days provided to employees based upon the length of service with the organization. Each report includes:
• Number of Organizations Reporting Data • Percentage of Organizations Offering Each Benefit Type • Number of Leave Days Offered to Employees by Length of Employment with the Organization • Percentage of Organizations Offering Benefits to Part-Time Employees
2012 Nonprofit Organizations New York State Salary and Benefits Report © 2012 Bluewater Nonprofit Solutions | Page 23
SAMPLE

Suggested Uses for the Data: Benchmark your organization’s employee leave practices. Identify emerging market trends in the use of employee leave programs. Evaluate the competitiveness of the organization’s employee leave practices for part-time staff.
Overtime Practices Report This report section provides information on how organizations compensate employees that work overtime. The report provides data on employees classified by the Fair Labor Standards Act as exempt and non-exempt. Each report includes:
• Number of Organizations Reporting Data • Percentage of Organizations Utilizing Each Compensation Method
Suggested Uses for the Data: Benchmark your organization’s overtime practices for exempt and non-exempt staff.
Medical, Dental and Vision Plan Offering Reports These reports provide information on the scope and usage of medical, dental and vision plans made available by organizations to their employees. Each report includes:
• Number of Organizations Reporting Data • Percentage of Organizations Offering Plan Benefits • Percentage of Organizations Offering Each Plan Type • Percentage of Employees Enrolled in Each Plan Type • Eligibility Time Frame Requirements for Employee Plan Participation • Percentage of Organizations Offering Plan Coverage to Part-Time Employees • Percentage of Organizations Offering Reimbursement for Medical Plan Opt-Out
Suggested Uses for the Data: Benchmark your organization’s medical, dental, or vision plan offerings. Identify emerging market trends in the use of medical, dental and vision plans. Assess the competitiveness of the organization’s employee eligibility time frame for plan participation. Evaluate your organization’s practice of providing medical, dental or vision plan benefits to part-time staff.
Medical, Dental and Vision Plan Cost Reports These reports show the monthly cost and percentage of the cost paid by the organization for all medical, dental and vision plan offerings. Each report includes:
• Number of Organizations Reporting Data • Total Monthly Cost for Plan Coverage • Percentage of Monthly Cost Paid By the Organization
2012 Nonprofit Organizations New York State Salary and Benefits Report © 2012 Bluewater Nonprofit Solutions | Page 24
SAMPLE

Suggested Uses for the Data: Benchmark your organization’s medical, dental, or vision plan costs. Identify opportunities to reduce medical, dental, and vision plan costs. Evaluate the competitiveness of the organization’s premium cost share coverage for each medical, dental, or vision plan offered.
Prescription Drug Plan Offerings & Costs Report This report provides data on prescription drug plan offerings and the costs associated with filling a prescription through retail and mail order pharmacies. Each report includes:
• Number of Organizations Reporting Data • Percentage of Organizations Offering Prescription Drug Plan Benefits • Cost to Fill a 30-Day Supply of Medication at a Retail Pharmacy • Cost to Fill a 90-Day Supply of Medication Through a Mail Order Pharmacy
Suggested Uses for the Data: Compare your organization’s prescription drug plan costs. Identify opportunities to reduce prescription drug plan costs.
Life Insurance & Disability Plan Offerings Report This report provides information on the types of life insurance and disability plans offered to employees and participation rates by plan type. Each report includes:
• Number of Organizations Reporting Data • Percentage of Organizations Offering Each Plan Type • Percentage of Employees Enrolled in Each Plan Type • Percentage of Organizations Offering Plan Coverage to Part-Time Employees
Suggested Uses for the Data: Benchmark your organization’s life insurance and disability plan offerings. Evaluate the participation rates of your employees within each plan type.
Life Insurance & Disability Plan Eligibility Report This report provides information on life insurance and disability plans eligibility time frames for each plan type offered to employees. Each report includes:
• Number of Organizations Reporting Data • Eligibility Time Frame Requirements for Employee Plan Participation
Suggested Uses for the Data: Assess the competitiveness of the organization’s employee eligibility time frame for plan participation.
2012 Nonprofit Organizations New York State Salary and Benefits Report © 2012 Bluewater Nonprofit Solutions | Page 25
SAMPLE

Retirement Plan Offerings Report This report provides information on the types of retirement plans offered to employees and participation rates by plan type. Each report includes:
• Number of Organizations Reporting Data • Percentage of Organizations Offering Each Plan Type • Percentage of Employees Enrolled in Each Plan Type • Percentage of Organizations Offering Plan Coverage to Part-Time Employees
Suggested Uses for the Data: Compare your organization’s retirement plan offerings. Evaluate employee participation rates within each plan type.
Retirement Plan Eligibility Report This report provides information on retirement benefits eligibility time frames for each retirement plan option offered to employees. Each report includes:
• Number of Organizations Reporting Data • Eligibility Time Frame Requirements for Employee Plan Participation
Suggested Uses for the Data: Assess the competitiveness of the organization’s employee eligibility time frame for plan participation.
Retirement Plan Contributions Report This report shows the maximum percentage an organization will contribute to each plan type as a percentage of an employee’s salary. Each report includes:
• Number of Organizations Reporting Data • Maximum Organization Contribution by Plan Type
Suggested Uses for the Data: Benchmark your organization’s retirement plan benefits. Identify opportunities to reduce retirement plan costs.
2012 Nonprofit Organizations New York State Salary and Benefits Report © 2012 Bluewater Nonprofit Solutions | Page 26
SAMPLE

Executive Benefit Offerings Report Reports are provided for the following 12 Executive Positions: Chief Executive Officer/ President/Executive Director, Chancellor/President, Chief Operating Officer/Associate Executive Director, Executive Vice President, Chief Administrative Officer, Chief Development Officer, Chief Financial Officer, Chief Human Resources Officer, Chief Information Officer, Chief Marketing Officer, Chief Medical Officer, Chief Program Officer These reports provide market data on the percentage of organizations that offer 11 additional benefits to executive level positions. Each report includes:
• Number of Organizations Reporting Data • Percentage of Organizations Offering Additional Benefits for Executives • Percentage of Organizations Offering Each Benefit Type
Suggested Uses for the Data: Evaluate the competitiveness of the organization’s executive compensation package. Find comparable data to satisfy IRS Intermediate Sanctions documentation requirements for your organization’s top executives. Identify additional benefits that can be offered to increase market competitiveness.
Executive Employment Agreement Reports Reports are provided for the following 12 Executive Positions: Chief Executive Officer/ President/Executive Director, Chancellor/President, Chief Operating Officer/Associate Executive Director, Executive Vice President, Chief Administrative Officer, Chief Development Officer, Chief Financial Officer, Chief Human Resources Officer, Chief Information Officer, Chief Marketing Officer, Chief Medical Officer, Chief Program Officer These reports provide information on the use of five popular contract terms found within employment agreements. The reports also cover the length of the agreement and the percentage of organizations that use employment agreements for each position. Each report includes:
• Number of Organizations Reporting Data • Percentage of Organizations Utilizing Employment Agreements for Executives • Number of Years the Employment Agreement Covers • Percentage of Organizations that Utilize Each Contract Term
Suggested Uses for the Data: Benchmark your organization’s employment agreement practices. Identify what components and contract terms are used most frequently. Evaluate the competitiveness of the organization’s executive compensation package.
2012 Nonprofit Organizations New York State Salary and Benefits Report © 2012 Bluewater Nonprofit Solutions | Page 27
SAMPLE

Report Presentation Views
The information within the report is presented by multiple reporting views to allow the user to quickly identify the most relevant data set for comparison. The following four distinct reporting views are used throughout the report to display the data: 1) Operating Budget, 2) Geographic Region, 3) Field of Work, and 4) Number of Employees. Each section within the report utilizes three of the available reporting views to present the data. The reporting views utilized are dependent upon the content and the relevance to the data being displayed. Each of the four reporting views contains predefined “bands” or subcategories that organize the display of the data. One additional aspect of each reporting view is the All Organizations row. The All Organizations row provides a summary of the data being displayed within each band of the reporting view. See the charts below for definitions of the bands displayed within the reporting views.
Geographic Region Counties within the Region
Central Cayuga, Cortland, Herkimer, Madison, Oneida, Ononadaga, Oswego, Otsego, Tompkins
Central Southern Tier Broome, Chemung, Chenago, Delaware, Schuyler, Stueben, Sullivan, Tioga
Greater Capital Region Albany, Fulton, Montgomery, Rennselaer, Saratoga, Schenectady, Schoharie, Warren, Washington
Hudson Valley Columbia, Dutchess, Green, Orange, Putnam, Ulster
North Country Clinton, Essex, Franklin, Hamilton, Jefferson, Lewis, St. Lawrence
New York City Bronx, Kings, Nassau, Queens, Richmond, Rockland, Suffolk, Westchester
Western New York Alleghany, Cattaraugus, Chauteugua, Erie, Genesse, Niagara, Orleans, Wyoming
Finger Lakes Region Livingston, Monroe, Ontario, Seneca, Wayne, Yates
2012 Nonprofit Organizations New York State Salary and Benefits Report © 2012 Bluewater Nonprofit Solutions | Page 28
SAMPLE

Operating Budget
(Organization Fiscal-Year Operating Expenses)
$0 - $249,999
$250,000 - $499,999
$500,000 - $999,999
$1,000,000 - $2,499,999
$2,500,000 - $4,999,999
$5,000,000 - $9,999,999
$10,000,000 - $24,999,999
$25,000,000 or More
Number of Employees (Full Time Staff)
1-10
11-25
26-50
51-100
101-200
201 or more
Field of Work Sub-Categories
Arts, Culture, and Humanities Arts, Culture, and Humanities
Education Educational Institutions
Environment and Animal Environmental Quality Protection, Beautification
Animal Related
Health Health - General & Rehabilitative Mental Health, Crisis Intervention
Disease, Disorders, Medical Disciplines Medical Research
Human Services
Crime, Legal Related Employment, Job Related
Agriculture, Food, Nutrition Housing, Shelter
Public Safety, Disaster Preparedness and Relief Recreation, Sports, Leisure, Athletics
Youth Development Human Services
International, Foreign Affairs International, Foreign Affairs, and National
Security
Public, Societal Benefit
Civil Rights, Social Actions, Advocacy Community Improvement, Capacity Building Philanthropy, Voluntarism, and Grantmaking Science and Technology Research Institutes
Social Science Research Institute Public, Society Benefit
Religion Related Religion, Spiritual Development
Mutual/Membership Benefit Mutual/Membership Benefit Organizations, Other
Unknown, Unclassified Unknown
2012 Nonprofit Organizations New York State Salary and Benefits Report © 2012 Bluewater Nonprofit Solutions | Page 29
SAMPLE

Compensation Section
2012 Nonprofit Organizations New York State Salary and Benefits Report © 2012 Bluewater Nonprofit Solutions | Page 35
SAMPLE
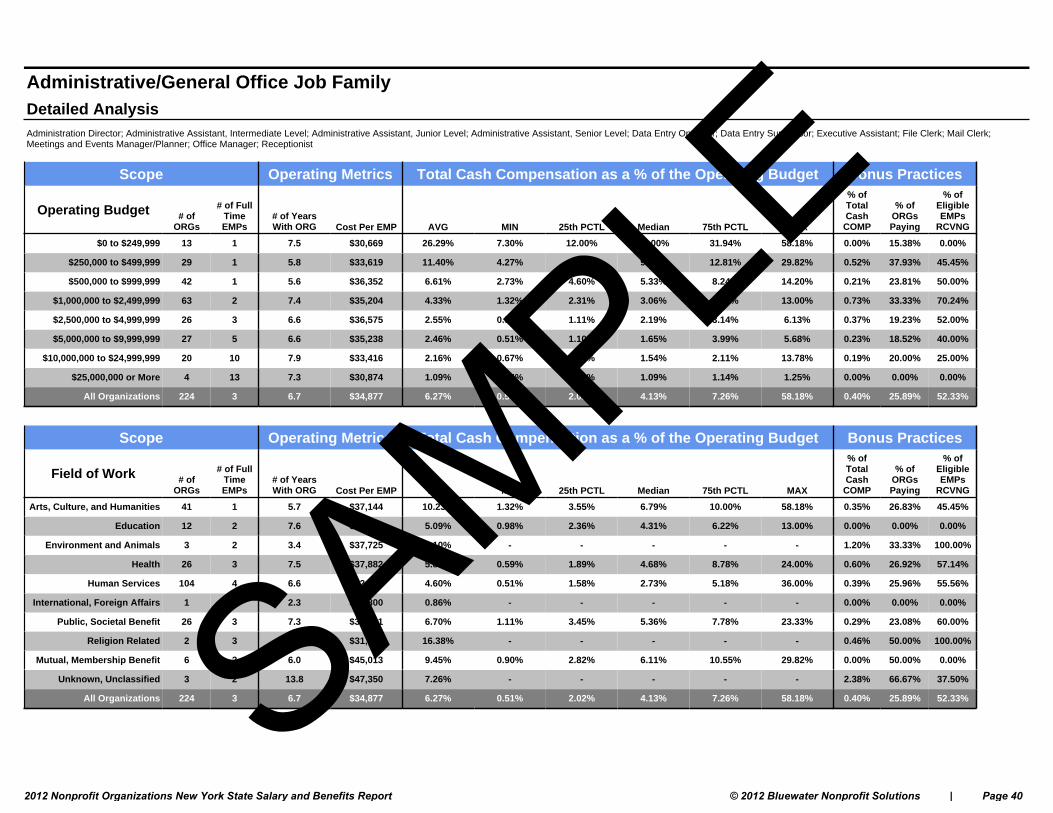
Administrative/General Office Job FamilyDetailed AnalysisAdministration Director; Administrative Assistant, Intermediate Level; Administrative Assistant, Junior Level; Administrative Assistant, Senior Level; Data Entry Operator; Data Entry Supervisor; Executive Assistant; File Clerk; Mail Clerk; Meetings and Events Manager/Planner; Office Manager; Receptionist
$2,500,000 to $4,999,999 26 3 6.6 $36,575 2.55% 0.59% 1.11% 2.19% 3.14% 6.13% 0.37% 19.23% 52.00%
All Organizations 224 3 6.7 $34,877 6.27% 0.51% 2.02% 4.13% 7.26% 58.18% 0.40% 25.89% 52.33%
$5,000,000 to $9,999,999 27 5 6.6 $35,238 2.46% 0.51% 1.10% 1.65% 3.99% 5.68% 0.23% 18.52% 40.00%
$25,000,000 or More 4 13 7.3 $30,874 1.09% 0.94% 1.04% 1.09% 1.14% 1.25% 0.00% 0.00% 0.00%
$10,000,000 to $24,999,999 20 10 7.9 $33,416 2.16% 0.67% 0.90% 1.54% 2.11% 13.78% 0.19% 20.00% 25.00%
$0 to $249,999 13 1 7.5 $30,669 26.29% 7.30% 12.00% 24.00% 31.94% 58.18% 0.00% 15.38% 0.00%
$1,000,000 to $2,499,999 63 2 7.4 $35,204 4.33% 1.32% 2.31% 3.06% 5.80% 13.00% 0.73% 33.33% 70.24%
$500,000 to $999,999 42 1 5.6 $36,352 6.61% 2.73% 4.60% 5.33% 8.24% 14.20% 0.21% 23.81% 50.00%
$250,000 to $499,999 29 1 5.8 $33,619 11.40% 4.27% 7.20% 9.31% 12.81% 29.82% 0.52% 37.93% 45.45%
Scope Operating Metrics Total Cash Compensation as a % of the Operating Budget Bonus Practices
Operating Budget # of ORGs
# of Full Time EMPs
# of Years With ORG Cost Per EMP AVG MIN 25th PCTL Median 75th PCTL MAX
% of Total Cash COMP
% of ORGs Paying
% of Eligible EMPs
RCVNG
Public, Societal Benefit 26 3 7.3 $35,791 6.70% 1.11% 3.45% 5.36% 7.78% 23.33% 0.29% 23.08% 60.00%
International, Foreign Affairs 1 3 2.3 $28,800 0.86% - - - - - 0.00% 0.00% 0.00%
All Organizations 224 3 6.7 $34,877 6.27% 0.51% 2.02% 4.13% 7.26% 58.18% 0.40% 25.89% 52.33%
Unknown, Unclassified 3 2 13.8 $47,350 7.26% - - - - - 2.38% 66.67% 37.50%
Mutual, Membership Benefit 6 2 6.0 $45,013 9.45% 0.90% 2.82% 6.11% 10.55% 29.82% 0.00% 50.00% 0.00%
Religion Related 2 3 9.0 $31,612 16.38% - - - - - 0.46% 50.00% 100.00%
Arts, Culture, and Humanities 41 1 5.7 $37,144 10.23% 1.32% 3.55% 6.79% 10.00% 58.18% 0.35% 26.83% 45.45%
Human Services 104 4 6.6 $32,111 4.60% 0.51% 1.58% 2.73% 5.18% 36.00% 0.39% 25.96% 55.56%
Education 12 2 7.6 $34,769 5.09% 0.98% 2.36% 4.31% 6.22% 13.00% 0.00% 0.00% 0.00%
Health 26 3 7.5 $37,882 5.85% 0.59% 1.89% 4.68% 8.78% 24.00% 0.60% 26.92% 57.14%
Environment and Animals 3 2 3.4 $37,725 2.10% - - - - - 1.20% 33.33% 100.00%
Scope Operating Metrics Total Cash Compensation as a % of the Operating Budget Bonus Practices
Field of Work # of ORGs
# of Full Time EMPs
# of Years With ORG Cost Per EMP AVG MIN 25th PCTL Median 75th PCTL MAX
% of Total Cash COMP
% of ORGs Paying
% of Eligible EMPs
RCVNG
2012 Nonprofit Organizations New York State Salary and Benefits Report © 2012 Bluewater Nonprofit Solutions | Page 40
SAMPLE

Administrative/General Office Job FamilyDetailed Analysis
North Country 7 3 5.7 $34,342 17.10% 4.11% 5.76% 8.78% 18.54% 58.18% 0.53% 57.14% 25.00%
All Organizations 224 3 6.7 $34,877 6.27% 0.51% 2.02% 4.13% 7.26% 58.18% 0.40% 25.89% 52.33%
New York City 64 4 5.3 $40,558 5.49% 0.59% 2.14% 3.89% 6.18% 27.00% 0.23% 23.44% 38.33%
Finger Lakes 17 3 8.4 $33,422 6.22% 0.70% 1.36% 1.90% 5.09% 54.17% 0.08% 17.65% 33.33%
Western 23 3 7.2 $31,286 7.02% 0.94% 3.50% 5.68% 7.70% 29.82% 0.23% 17.39% 50.00%
Central 26 3 7.8 $28,837 5.01% 0.67% 2.24% 2.86% 6.48% 15.56% 0.55% 23.08% 50.00%
Hudson Valley 27 2 7.6 $34,848 6.74% 0.84% 2.26% 3.54% 6.90% 36.00% 0.74% 37.04% 80.00%
Greater Capital 39 2 5.8 $35,909 5.65% 0.51% 1.94% 5.10% 7.29% 27.37% 0.35% 23.08% 51.11%
Central Southern Tier 21 3 8.4 $28,453 6.33% 0.89% 1.67% 4.54% 7.11% 31.67% 0.80% 33.33% 71.43%
Scope Operating Metrics Total Cash Compensation as a % of the Operating Budget Bonus Practices
Geographic Region # of ORGs
# of Full Time EMPs
# of Years With ORG Cost Per EMP AVG MIN 25th PCTL Median 75th PCTL MAX
% of Total Cash COMP
% of ORGs Paying
% of Eligible EMPs
RCVNG
2012 Nonprofit Organizations New York State Salary and Benefits Report © 2012 Bluewater Nonprofit Solutions | Page 41
SAMPLE

Administrative Assistant, Intermediate Level -- Position Code: 2001Detailed AnalysisPerforms routine clerical and administrative functions such as drafting correspondence, scheduling appointments and travel, organizing and maintaining paper and electronic files, updating databases, or providing information to callers. Prepares and formats reports, presentations, program materials, and other documents as necessary using the full suite of office productivity software.
$2,500,000 to $4,999,999 10 2 6.9 $31,516 $14,500 $27,445 $31,550 $34,525 $53,200 30.00% 44.44% 2.50% 1.89% $31,679 $14,500 $27,445 $31,717 $34,525 $54,500
All Organizations 81 3 6.2 $29,574 $14,500 $26,000 $28,631 $33,000 $53,200 19.75% 43.96% 5.00% 1.74% $29,674 $14,500 $26,000 $29,000 $33,000 $54,500
$5,000,000 to $9,999,999 12 3 5.8 $29,596 $21,700 $26,688 $30,645 $32,625 $35,575 25.00% 33.33% 1.86% 0.62% $29,638 $21,700 $27,063 $30,645 $32,625 $35,575
$25,000,000 or More 9 11 5.9 $35,296 $23,300 $27,537 $34,000 $42,851 $52,000 11.11% 70.00% 4.00% 2.56% $35,400 $23,300 $27,537 $34,000 $42,851 $52,932
$10,000,000 to $24,999,999 16 4 10.3 $29,664 $23,969 $25,850 $28,129 $32,425 $45,000 12.50% 0.00% 0.00% 0.00% $29,664 $23,969 $25,850 $28,129 $32,425 $45,000
$0 to $249,999 4 1 5.1 $20,725 $18,000 $18,075 $18,950 $21,600 $27,000 0.00% 0.00% 0.00% 0.00% $20,725 $18,000 $18,075 $18,950 $21,600 $27,000
$1,000,000 to $2,499,999 16 1 5.3 $28,893 $15,700 $26,000 $30,000 $32,125 $37,500 18.75% 66.67% 3.20% 3.20% $29,081 $15,700 $26,000 $30,000 $32,125 $37,500
$500,000 to $999,999 9 1 3.4 $29,260 $25,000 $28,000 $28,000 $29,000 $36,100 22.22% 0.00% 0.00% 0.00% $29,260 $25,000 $28,000 $28,000 $29,000 $36,100
$250,000 to $499,999 5 1 2.6 $24,880 $18,387 $20,800 $27,500 $28,000 $29,714 40.00% 100.00% 5.00% 4.09% $25,280 $18,887 $20,800 $28,000 $29,000 $29,714
Scope Base Salary Bonus Total Cash Compensation
Operating Budget # of ORGs
# of Full
Time EMPs
# of Years With ORG AVG MIN
25th PCTL Median
75th PCTL MAX
% of ORGs Paying
% of Eligible EMPs
RCVNGMAX % Payout
AVG % Paid AVG MIN
25th PCTL Median
75th PCTL MAX
Public, Societal Benefit 10 2 6.3 $32,797 $20,800 $26,479 $31,500 $36,625 $53,200 30.00% 77.78% 3.00% 2.87% $33,060 $20,800 $26,479 $31,667 $36,875 $54,500
International, Foreign Affairs 0 - - - - - - - - - - - - - - - - - -
All Organizations 81 3 6.2 $29,574 $14,500 $26,000 $28,631 $33,000 $53,200 19.75% 43.96% 5.00% 1.74% $29,674 $14,500 $26,000 $29,000 $33,000 $54,500
Unknown, Unclassified 1 2 6.0 $31,200 - - - - - 100.00% 0.00% 0.00% 0.00% $31,200 - - - - -
Mutual, Membership Benefit 0 - - - - - - - - - - - - - - - - - -
Religion Related 1 1 2.0 $28,000 - - - - - 0.00% 0.00% 0.00% 0.00% $28,000 - - - - -
Arts, Culture, and Humanities 7 1 4.3 $24,986 $18,000 $18,950 $28,000 $28,000 $35,000 14.29% 0.00% 0.00% 0.00% $24,986 $18,000 $18,950 $28,000 $28,000 $35,000
Human Services 48 4 6.3 $28,996 $14,500 $25,663 $28,379 $32,500 $45,000 16.67% 37.50% 1.86% 1.40% $29,058 $14,500 $25,663 $28,379 $32,500 $45,000
Education 4 2 11.6 $28,311 $15,700 $26,425 $31,550 $33,436 $34,442 0.00% 0.00% 0.00% 0.00% $28,311 $15,700 $26,425 $31,550 $33,436 $34,442
Health 10 4 5.4 $32,843 $26,737 $28,000 $31,045 $34,500 $52,000 30.00% 56.67% 5.00% 2.67% $33,086 $26,737 $28,250 $31,045 $34,500 $52,932
Environment and Animals 0 - - - - - - - - - - - - - - - - - -
Scope Base Salary Bonus Total Cash Compensation
Field of Work # of ORGs
# of Full
Time EMPs
# of Years With ORG AVG MIN
25th PCTL Median
75th PCTL MAX
% of ORGs Paying
% of Eligible EMPs
RCVNGMAX % Payout
AVG % Paid AVG MIN
25th PCTL Median
75th PCTL MAX
2012 Nonprofit Organizations New York State Salary and Benefits Report © 2012 Bluewater Nonprofit Solutions | Page 44
SAMPLE

Administrative Assistant, Intermediate Level -- Position Code: 2001Detailed Analysis
North Country 3 5 5.7 $25,600 - - - - - 33.33% 0.00% 0.00% 0.00% $25,600 - - - - -
All Organizations 81 3 6.2 $29,574 $14,500 $26,000 $28,631 $33,000 $53,200 19.75% 43.96% 5.00% 1.74% $29,674 $14,500 $26,000 $29,000 $33,000 $54,500
New York City 22 4 5.1 $33,888 $18,000 $28,000 $33,290 $35,969 $53,200 22.73% 54.00% 4.00% 1.59% $34,035 $18,000 $28,000 $33,290 $35,969 $54,500
Finger Lakes 6 2 5.2 $26,100 $21,700 $23,450 $25,950 $28,375 $31,200 33.33% 0.00% 0.00% 0.00% $26,100 $21,700 $23,450 $25,950 $28,375 $31,200
Western 8 2 8.7 $27,574 $14,500 $24,220 $30,645 $32,500 $34,442 0.00% 0.00% 0.00% 0.00% $27,574 $14,500 $24,220 $30,645 $32,500 $34,442
Central 15 3 7.4 $28,363 $20,800 $25,400 $28,000 $31,390 $34,000 26.67% 50.00% 5.00% 3.03% $28,597 $20,800 $25,400 $29,000 $32,050 $34,000
Hudson Valley 6 3 9.9 $30,528 $27,900 $28,546 $30,706 $32,375 $33,100 0.00% 0.00% 0.00% 0.00% $30,528 $27,900 $28,546 $30,706 $32,375 $33,100
Greater Capital 13 4 3.1 $30,192 $25,000 $27,500 $29,714 $33,000 $37,500 7.69% 33.33% 3.23% 3.23% $30,218 $25,000 $27,500 $29,714 $33,000 $37,500
Central Southern Tier 8 3 8.0 $24,361 $15,700 $20,722 $25,164 $26,803 $35,235 37.50% 66.67% 1.86% 1.52% $24,486 $15,700 $20,847 $25,164 $26,928 $35,235
Scope Base Salary Bonus Total Cash Compensation
Geographic Region # of ORGs
# of Full
Time EMPs
# of Years With ORG AVG MIN
25th PCTL Median
75th PCTL MAX
% of ORGs Paying
% of Eligible EMPs
RCVNGMAX % Payout
AVG % Paid AVG MIN
25th PCTL Median
75th PCTL MAX
2012 Nonprofit Organizations New York State Salary and Benefits Report © 2012 Bluewater Nonprofit Solutions | Page 45
SAMPLE

Employee Benefits Section
2012 Nonprofit Organizations New York State Salary and Benefits Report © 2012 Bluewater Nonprofit Solutions | Page 434
SAMPLE

Medical Plan OfferingsDetailed Analysis
51-100 31 96.77% 60.00% 57.82% 26.67% 52.63% 16.67% 33.20% 46.67% 32.71% 3.33% 30.70%
26-50 25 96.00% 66.67% 48.15% 16.67% 67.50% 16.67% 30.42% 41.67% 60.20% 0.00% 0.00%
201 or more 19 100.00% 52.63% 66.00% 31.58% 51.80% 31.58% 40.18% 26.32% 24.15% 0.00% 0.00%
101-200 20 100.00% 45.00% 55.53% 35.00% 58.37% 35.00% 58.14% 15.00% 36.84% 0.00% 0.00%
All Organizations 357 87.39% 50.96% 60.58% 29.17% 57.96% 13.14% 47.32% 24.04% 47.67% 2.24% 46.53%
11-25 71 98.59% 48.57% 57.74% 25.71% 48.61% 12.86% 52.80% 34.29% 46.28% 2.86% 22.50%
1-10 191 78.01% 48.32% 65.24% 32.21% 62.26% 6.71% 52.92% 12.75% 61.74% 2.68% 62.50%
Scope Medical Plan Offerings & Employee Participation Rates
# of Employees# of
ORGs
% of ORGs
Offering% of ORGs
Offering% of EMPs in
Plan% of ORGs
Offering% of EMPs in
Plan% of ORGs
Offering% of EMPs in
Plan% of ORGs
Offering% of EMPs in
Plan% of ORGs
Offering% of EMPs in
Plan
PPO Plan HMO Plan POS Plan HDHP Plan Indemnity Plan
51-100 31 96.77% 16.67% 40.00% 20.00% 13.33%
All Organizations 357 87.39% 22.76% 29.17% 15.38% 26.60%
201 or more 19 100.00% 0.00% 31.58% 31.58% 36.84%
101-200 20 100.00% 15.00% 30.00% 20.00% 35.00%
26-50 25 96.00% 29.17% 37.50% 4.17% 20.83%
1-10 191 78.01% 26.85% 26.17% 12.08% 28.86%
11-25 71 98.59% 22.86% 27.14% 18.57% 24.29%
Scope Eligibility Time Frame for Employee Participation in Medical Plans
# of Employees # of ORGs
% of ORGs
Offering% of ORGs Offering on EMP Start Date
% of ORGs Offering on 1st of the Month Following EMP Start
Date
% of ORGs Offering at 30 Days
Following EMP Start Date
% of ORGs Offering at 90 Days
Following EMP Start Date
59.26% 26.67%
38.23% 25.32%
42.11% 42.11%
40.00% 30.00%
45.45% 33.33%
29.29% 22.15%
44.62% 22.86%
Part Time Employee Coverage
Medical Plan Opt Out
% of ORGs Offering Benefit to Part Time EMPs
% of ORGs Offering Opt Out Benefit Option To EMPs
2012 Nonprofit Organizations New York State Salary and Benefits Report © 2012 Bluewater Nonprofit Solutions | Page 460
SAMPLE

Medical Plan OfferingsDetailed Analysis
55.17% 17.24%
0.00% 0.00%
38.23% 25.32%
57.14% 42.86%
50.00% 16.67%
0.00% 0.00%
22.22% 16.42%
40.48% 27.41%
35.71% 22.22%
43.59% 35.00%
28.57% 50.00%
Part Time Employee Coverage
Medical Plan Opt Out
% of ORGs Offering Benefit to Part Time EMPs
% of ORGs Offering Opt Out Benefit Option To EMPs
Public, Societal Benefit 34 85.29% 37.93% 37.93% 3.45% 20.69%
International, Foreign Affairs 3 33.33% 0.00% 0.00% 0.00% 100.00%
All Organizations 357 87.39% 22.76% 29.17% 15.38% 26.60%
Unknown, Unclassified 8 87.50% 0.00% 71.43% 28.57% 0.00%
Mutual, Membership Benefit 7 85.71% 16.67% 33.33% 16.67% 33.33%
Religion Related 2 50.00% 0.00% 0.00% 0.00% 100.00%
Arts, Culture, and Humanities 83 80.72% 23.88% 20.90% 11.94% 37.31%
Human Services 147 91.84% 19.26% 28.89% 17.78% 27.41%
Education 19 94.74% 38.89% 5.56% 27.78% 5.56%
Health 42 95.24% 20.00% 35.00% 17.50% 25.00%
Environment and Animals 12 66.67% 25.00% 62.50% 0.00% 0.00%
Scope Eligibility Time Frame for Employee Participation in Medical Plans
Field of Work # of ORGs
% of ORGs
Offering% of ORGs Offering on EMP Start Date
% of ORGs Offering on 1st of the Month Following EMP Start
Date
% of ORGs Offering at 30 Days
Following EMP Start Date
% of ORGs Offering at 90 Days
Following EMP Start Date
Public, Societal Benefit 34 85.29% 62.07% 68.12% 17.24% 44.56% 10.34% 71.00% 17.24% 62.33% 3.45% 25.00%
International, Foreign Affairs 3 33.33% 0.00% 0.00% 100.00% 60.00% 0.00% 0.00% 0.00% 0.00% 0.00% 0.00%
Human Services 147 91.84% 50.37% 57.47% 27.41% 59.00% 15.56% 44.51% 29.63% 41.90% 2.96% 43.93%
Unknown, Unclassified 8 87.50% 42.86% 78.16% 14.29% 0.07% 28.57% 5.10% 57.14% 54.88% 0.00% 0.00%
Mutual, Membership Benefit 7 85.71% 50.00% 40.83% 66.67% 66.00% 16.67% 0.01% 16.67% 0.01% 0.00% 0.00%
Religion Related 2 50.00% 0.00% 0.00% 100.00% 90.00% 0.00% 0.00% 0.00% 0.00% 0.00% 0.00%
All Organizations 357 87.39% 50.96% 60.58% 29.17% 57.96% 13.14% 47.32% 24.04% 47.67% 2.24% 46.53%
Arts, Culture, and Humanities 83 80.72% 47.76% 66.35% 32.84% 69.39% 7.46% 60.40% 14.93% 59.92% 1.49% 50.00%
Health 42 95.24% 55.00% 65.41% 35.00% 47.60% 15.00% 43.86% 22.50% 47.30% 0.00% 0.00%
Environment and Animals 12 66.67% 37.50% 80.00% 12.50% 50.00% 12.50% 100.00% 25.00% 77.50% 12.50% 75.00%
Education 19 94.74% 55.56% 33.84% 27.78% 42.25% 11.11% 58.50% 22.22% 47.00% 0.00% 0.00%
Scope Medical Plan Offerings & Employee Participation Rates
Field of Work# of
ORGs
% of ORGs
Offering% of ORGs
Offering% of EMPs in
Plan% of ORGs
Offering% of EMPs in
Plan% of ORGs
Offering% of EMPs in
Plan% of ORGs
Offering% of EMPs in
Plan% of ORGs
Offering% of EMPs in
Plan
PPO Plan HMO Plan POS Plan HDHP Plan Indemnity Plan
2012 Nonprofit Organizations New York State Salary and Benefits Report © 2012 Bluewater Nonprofit Solutions | Page 461
SAMPLE

Medical Plan OfferingsDetailed Analysis
33.33% 50.00%
38.23% 25.32%
35.48% 14.85%
44.44% 22.22%
17.39% 46.15%
39.47% 32.50%
51.85% 34.48%
42.86% 27.12%
34.78% 16.67%
Part Time Employee Coverage
Medical Plan Opt Out
% of ORGs Offering Benefit to Part Time EMPs
% of ORGs Offering Opt Out Benefit Option To EMPs
North Country 7 85.71% 16.67% 50.00% 16.67% 16.67%
All Organizations 357 87.39% 22.76% 29.17% 15.38% 26.60%
New York City 115 87.83% 21.78% 16.83% 12.87% 40.59%
Finger Lakes 29 93.10% 33.33% 40.74% 0.00% 25.93%
Western 31 83.87% 15.38% 30.77% 23.08% 19.23%
Central 42 95.24% 30.00% 35.00% 12.50% 17.50%
Hudson Valley 37 78.38% 27.59% 17.24% 27.59% 20.69%
Greater Capital 65 90.77% 20.34% 33.90% 18.64% 22.03%
Central Southern Tier 31 77.42% 12.50% 54.17% 16.67% 12.50%
Scope Eligibility Time Frame for Employee Participation in Medical Plans
Geographic Region # of ORGs
% of ORGs
Offering% of ORGs Offering on EMP Start Date
% of ORGs Offering on 1st of the Month Following EMP Start
Date
% of ORGs Offering at 30 Days
Following EMP Start Date
% of ORGs Offering at 90 Days
Following EMP Start Date
North Country 7 85.71% 50.00% 42.34% 0.00% 0.00% 0.00% 0.00% 66.67% 59.25% 0.00% 0.00%
Hudson Valley 37 78.38% 44.83% 39.59% 34.48% 75.90% 3.45% 59.00% 24.14% 63.03% 3.45% 30.70%
New York City 115 87.83% 50.50% 74.04% 39.60% 57.11% 24.75% 46.35% 9.90% 29.60% 0.00% 0.00%
Finger Lakes 29 93.10% 55.56% 51.25% 33.33% 56.79% 0.00% 0.00% 44.44% 48.21% 3.70% 50.00%
Western 31 83.87% 23.08% 43.25% 38.46% 43.98% 19.23% 39.80% 38.46% 37.78% 0.00% 0.00%
All Organizations 357 87.39% 50.96% 60.58% 29.17% 57.96% 13.14% 47.32% 24.04% 47.67% 2.24% 46.53%
Greater Capital 65 90.77% 45.76% 66.24% 35.59% 57.38% 6.78% 41.05% 22.03% 51.51% 3.39% 35.00%
Central 42 95.24% 70.00% 53.16% 2.50% 74.80% 12.50% 53.20% 35.00% 48.28% 0.00% 0.00%
Central Southern Tier 31 77.42% 66.67% 56.81% 0.00% 0.00% 4.17% 93.10% 20.83% 59.80% 12.50% 58.33%
Scope Medical Plan Offerings & Employee Participation Rates
Geographic Region# of
ORGs
% of ORGs
Offering% of ORGs
Offering% of EMPs in
Plan% of ORGs
Offering% of EMPs in
Plan% of ORGs
Offering% of EMPs in
Plan% of ORGs
Offering% of EMPs in
Plan% of ORGs
Offering% of EMPs in
Plan
PPO Plan HMO Plan POS Plan HDHP Plan Indemnity Plan
2012 Nonprofit Organizations New York State Salary and Benefits Report © 2012 Bluewater Nonprofit Solutions | Page 462
SAMPLE