salesforce for marketers advertising index · pdf fileglobal linkedin trends ... the...
TRANSCRIPT
Salesforce for Marketers
Advertising Index Q2 2016 Report
2 | Q2 2016 Salesforce Advertising Index
ContentsExecutive Summary .....................................................................................3
Global Facebook Trends .............................................................................4
Global Instagram Trends ............................................................................6
Global Twitter Trends .................................................................................8
Global LinkedIn Trends ..............................................................................9
Credits and Appendix .................................................................................10
What is Advertising Studio? .......................................................................11

• Global Facebook CPM grew 65% year over year.
• In the e-commerce industry, Germany has the highest Facebook CTR at 1.62%, followed by the
United States at 1.54%.
• Global Instagram CPM was $6.30, growing 42% quarter over quarter.
• Twitter CPM fell 18% year over year.
• Global LinkedIn CPM for Q1 2016 was $29.43.
Executive Summary
marketingcloud.com | 3
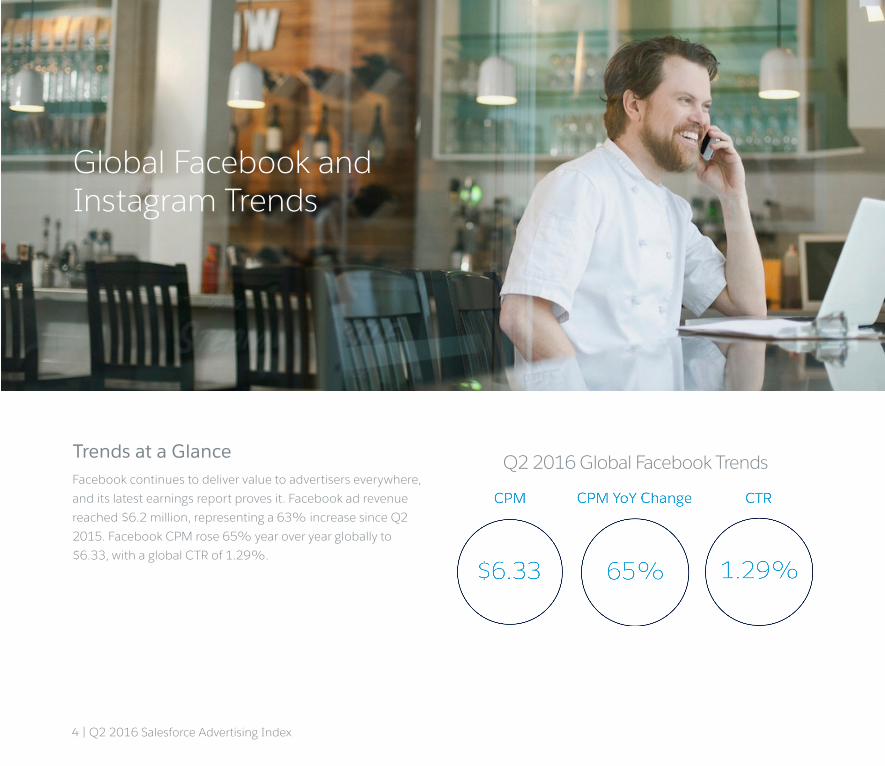
Global Facebook and Instagram Trends
Facebook continues to deliver value to advertisers everywhere,
and its latest earnings report proves it. Facebook ad revenue
reached $6.2 million, representing a 63% increase since Q2
2015. Facebook CPM rose 65% year over year globally to
$6.33, with a global CTR of 1.29%.
4 | Q2 2016 Salesforce Advertising Index
Trends at a Glance Q2 2016 Global Facebook Trends
marketingcloud.com | 5
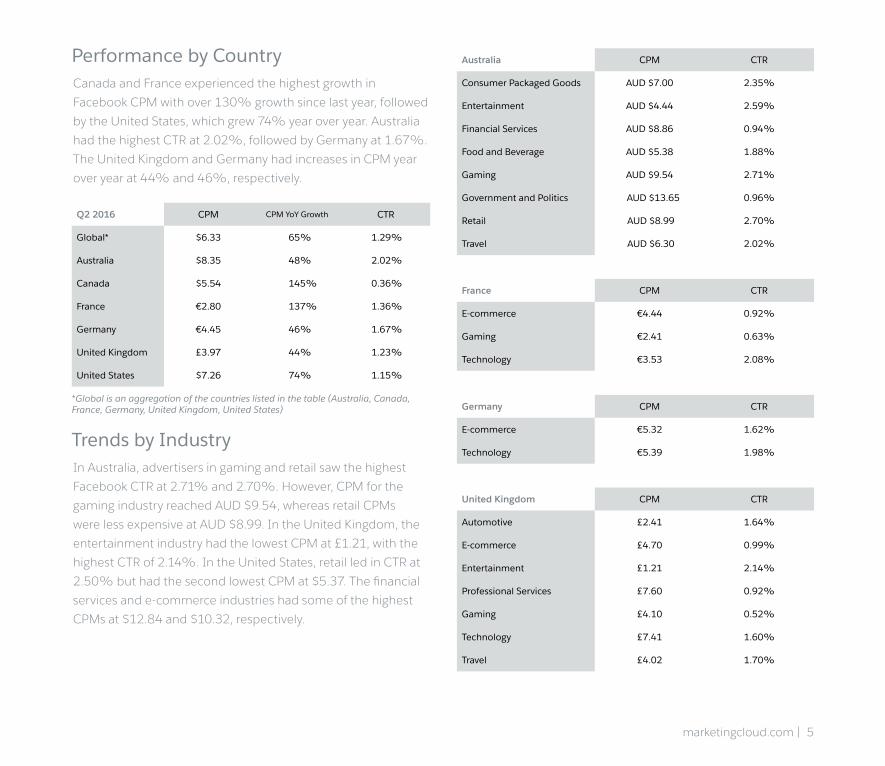
Q2 2016 CPM CPM YoY Growth CTR
Global* $6.33 65% 1.29%
Australia $8.35 48% 2.02%
Canada $5.54 145% 0.36%
France €2.80 137% 1.36%
Germany €4.45 46% 1.67%
United Kingdom £3.97 44% 1.23%
United States $7.26 74% 1.15%
Germany CPM CTR
E-commerce €5.32 1.62%
Technology €5.39 1.98%Trends by IndustryIn Australia, advertisers in gaming and retail saw the highest
Facebook CTR at 2.71% and 2.70%. However, CPM for the
gaming industry reached AUD $9.54, whereas retail CPMs
were less expensive at AUD $8.99. In the United Kingdom, the
entertainment industry had the lowest CPM at £1.21, with the
highest CTR of 2.14%. In the United States, retail led in CTR at
2.50% but had the second lowest CPM at $5.37. The financial
services and e-commerce industries had some of the highest
CPMs at $12.84 and $10.32, respectively.
Performance by CountryCanada and France experienced the highest growth in
Facebook CPM with over 130% growth since last year, followed
by the United States, which grew 74% year over year. Australia
had the highest CTR at 2.02%, followed by Germany at 1.67%.
The United Kingdom and Germany had increases in CPM year
over year at 44% and 46%, respectively.
Australia CPM CTR
Consumer Packaged Goods AUD $7.00 2.35%
Entertainment AUD $4.44 2.59%
Financial Services AUD $8.86 0.94%
Food and Beverage AUD $5.38 1.88%
Gaming AUD $9.54 2.71%
Government and Politics AUD $13.65 0.96%
Retail AUD $8.99 2.70%
Travel AUD $6.30 2.02%
France CPM CTR
E-commerce €4.44 0.92%
Gaming €2.41 0.63%
Technology €3.53 2.08%
United Kingdom CPM CTR
Automotive £2.41 1.64%
E-commerce £4.70 0.99%
Entertainment £1.21 2.14%
Professional Services £7.60 0.92%
Gaming £4.10 0.52%
Technology £7.41 1.60%
Travel £4.02 1.70%
*Global is an aggregation of the countries listed in the table (Australia, Canada, France, Germany, United Kingdom, United States)
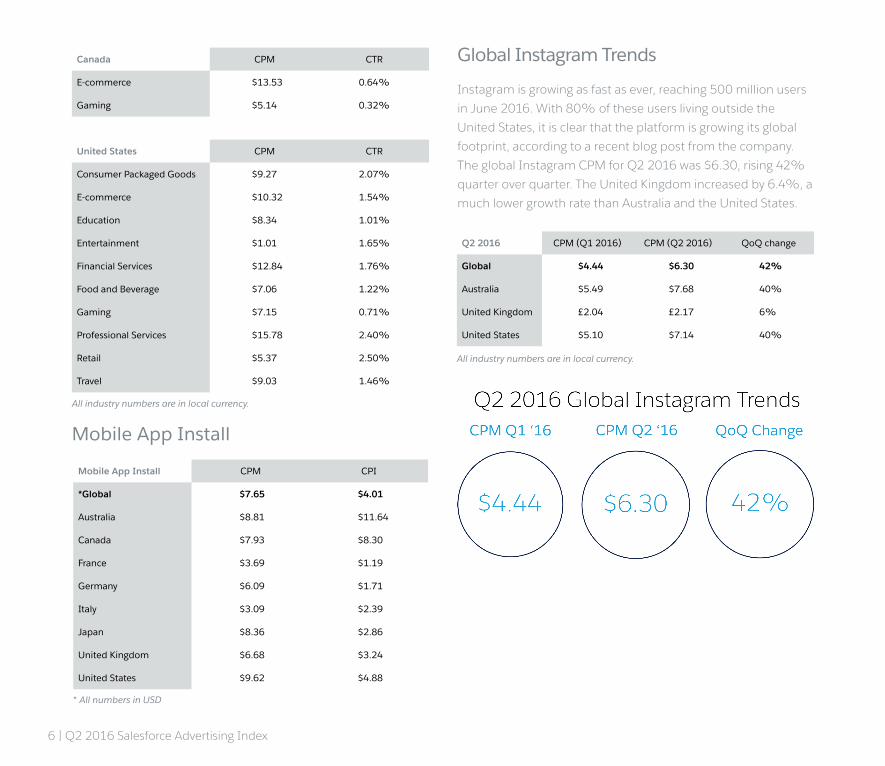
Mobile App Install CPM CPI
*Global $7.65 $4.01
Australia $8.81 $11.64
Canada $7.93 $8.30
France $3.69 $1.19
Germany $6.09 $1.71
Italy $3.09 $2.39
Japan $8.36 $2.86
United Kingdom $6.68 $3.24
United States $9.62 $4.88
Instagram is growing as fast as ever, reaching 500 million users
in June 2016. With 80% of these users living outside the
United States, it is clear that the platform is growing its global
footprint, according to a recent blog post from the company.
The global Instagram CPM for Q2 2016 was $6.30, rising 42%
quarter over quarter. The United Kingdom increased by 6.4%, a
much lower growth rate than Australia and the United States.
Global Instagram Trends
Q2 2016 CPM (Q1 2016) CPM (Q2 2016) QoQ change
Global $4.44 $6.30 42%
Australia $5.49 $7.68 40%
United Kingdom £2.04 £2.17 6%
United States $5.10 $7.14 40%
6 | Q2 2016 Salesforce Advertising Index
Mobile App Install
United States CPM CTR
Consumer Packaged Goods $9.27 2.07%
E-commerce $10.32 1.54%
Education $8.34 1.01%
Entertainment $1.01 1.65%
Financial Services $12.84 1.76%
Food and Beverage $7.06 1.22%
Gaming $7.15 0.71%
Professional Services $15.78 2.40%
Retail $5.37 2.50%
Travel $9.03 1.46%
Canada CPM CTR
E-commerce $13.53 0.64%
Gaming $5.14 0.32%
* All numbers in USD
All industry numbers are in local currency.
All industry numbers are in local currency.

marketingcloud.com | 7
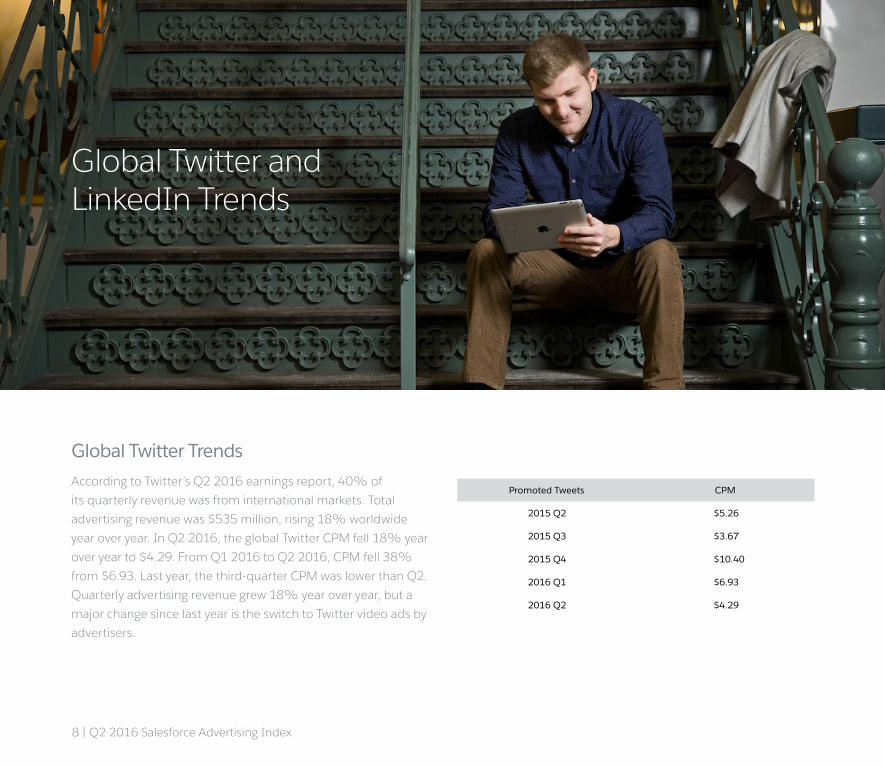
Global Twitter and LinkedIn Trends
8 | Q2 2016 Salesforce Advertising Index
Promoted Tweets CPM
2015 Q2 $5.26
2015 Q3 $3.67
2015 Q4 $10.40
2016 Q1 $6.93
2016 Q2 $4.29
Global Twitter TrendsAccording to Twitter’s Q2 2016 earnings report, 40% of
its quarterly revenue was from international markets. Total
advertising revenue was $535 million, rising 18% worldwide
year over year. In Q2 2016, the global Twitter CPM fell 18% year
over year to $4.29. From Q1 2016 to Q2 2016, CPM fell 38%
from $6.93. Last year, the third-quarter CPM was lower than Q2.
Quarterly advertising revenue grew 18% year over year, but a
major change since last year is the switch to Twitter video ads by
advertisers.
marketingcloud.com | 9
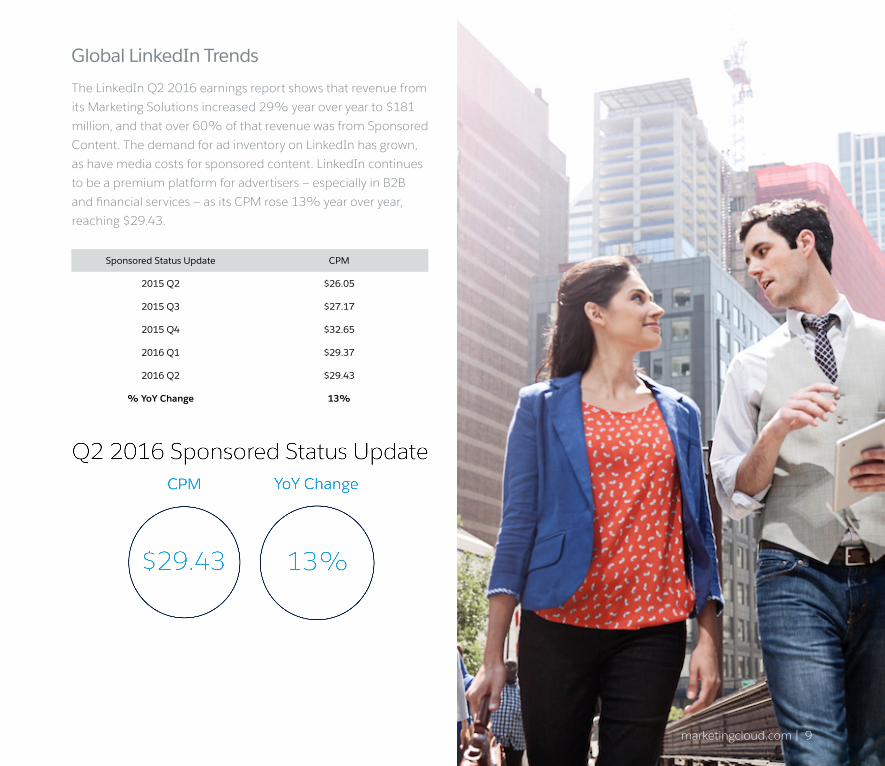
Sponsored Status Update CPM
2015 Q2 $26.05
2015 Q3 $27.17
2015 Q4 $32.65
2016 Q1 $29.37
2016 Q2 $29.43
% YoY Change 13%
Global LinkedIn Trends
The LinkedIn Q2 2016 earnings report shows that revenue from
its Marketing Solutions increased 29% year over year to $181
million, and that over 60% of that revenue was from Sponsored
Content. The demand for ad inventory on LinkedIn has grown,
as have media costs for sponsored content. LinkedIn continues
to be a premium platform for advertisers — especially in B2B
and financial services — as its CPM rose 13% year over year,
reaching $29.43.
10 | Q2 2016 Salesforce Advertising Index
Credits and AppendixThe advertising data in this report covers hundreds of millions of ad
impressions and engagements by Marketing Cloud customers using
our Advertising Studio platform from April 2016 through June 2016,
as well as comparative data from past periods. This includes
advertising on Facebook Audience Network, Instagram, Twitter, and
LinkedIn across the globe. This aggregate data in no way represents
any official position of Facebook, Twitter, or LinkedIn for advertising
trends, or for any individual advertiser.
Aggregate advertiser data is anonymized, categorized, and checked
for consistency and accuracy before being included in any index
presented in this report. This information is presented under safe
harbor and should not be considered as any official statement by
Salesforce. Please seek appropriate advice and counsel prior to
making any advertising or business decision.
Global and regional indexes were employed for a majority of this
report to control for factors like seasonality, vertical variances, and
other factors. For some analyses, including when more than three
fiscal quarters of data are shown, a larger index of advertisers was
used. We encourage readers not to do much comparison with older
reports as we continue to evolve our methodologies with the goal of
market trend data that is more accurate.
The Salesforce Advertising Index report was authored by members
of the Advertising Studio product marketing team at Salesforce, with
support across wider teams. We acknowledge the work of Zachary
Reiss-Davis, Hilary Givens, and Kyle Graden in leading this effort, with
data support from Julien Grouteau and executive sponsorship from
Chris Jacob and Liam Doyle.
This report, or parts thereof, should in no way be published or
redistributed without express written permission from an authorized
Salesforce representative. Please email [email protected]
with any feedback or questions about this report.
For more Salesforce Advertising Studio content, check out the blog:
marketingcloud.com/blog.
Facebook® is a registered trademark of Facebook Inc.
Instagram® is a registered trademark of Facebook Inc.
Twitter® is a registered trademark of Twitter Inc.
LinkedIn® is a registered trademark of LinkedIn Corp.
Reach Your Customers Where They Are
Advertising Studio is an end-to-end advertising platform that
enables you to reach your customers where they are across all
digital advertising. Activate your customer data in Salesforce
to securely and powerfully reach your customers, find new
prospects with lookalikes, and re-engage inactive users in the
customer journey. Create advanced campaigns and creative
variations with sophisticated targeting and optimize them at
scale across Facebook, Instagram, Twitter, LinkedIn, and mobile.
Enhance your email marketing goals with advertising and
coordinate campaigns across social, mobile, sales, and customer
service efforts.
Five Key Ways to Make Advertising a 1-to-1 Channel
1. Acquire new customers: Build lookalikes of best customers to find new ones with end-to-end lead automation.
2. Re-engage inactive customers: Re-engage subscribers in a new channel, reducing risk to your email program.
3. Extend the reach of email: Coordinate email and advertising to increase your reach using Journey Builder.
4. Exclude customers from ad campaigns: Increase ROI by excluding existing or low-value buyers.
5. Power ads using social listening: Advertise based on what customers and prospects say on Twitter.
marketingcloud.com | 11
Securely Connect Customer Data to Advertising
Coordinate advertising with the rest of your marketing, sales,
and customer service terms. All customer data is stored in
Salesforce, and any data that leaves the platform is encrypted
and hashed before it is sent to any external advertising partner.
Your customer data is protected at every stage, and no external
partner can see it.
As a part of the Customer Success Platform, Advertising Studio is part of Salesforce for
Marketers. The Customer Success Platform includes sales, service, marketing, community,
analytics, and apps. Salesforce for Marketers and Advertising Studio are members of the
Facebook Marketing partner program, Instagram Ads API partner program, and LinkedIn
Sponsored Updates Ads Api Partner program. Salesforce is the world’s largest provider of
customer relationship management (CRM) software. For more information about Salesforce
(NYSE:CRM), visit salesforce.com.
What is Advertising Studio?