sample construction - seb · web viewstarting with all active firms in each of the three baltic...
TRANSCRIPT

SHADOW ECONOMY
INDEXfor the Baltic countries
2009 – 2014
by Tālis J. Putniņš & Arnis Sauka
1
About the authors
Dr. Arnis Sauka is an Assistant Professor at the Stockholm School of Economics in Riga since 2005. Prior to joining the doctoral program at the University of Siegen (Germany), Arnis was a visiting PhD candidate at Jönköping International Business School (Sweden) and University College London (U.K.). Since 2014 Arnis is Director of the Centre for Sustainable Business at SSE Riga, from 2011- 2013 he was Vice Rector at Ventspils University College (Latvia). His main research interests are related to tax evasion, internationalisation of SMEs, entrepreneurship policies, business strategies, competitiveness and social contribution of entrepreneurs.E-mail: [email protected]
Dr. Tālis Putniņš is an Assistant Professor at the Stockholm School of Economics in Riga, Research Associate at the Baltic International Centre for Economic Policy Studies (Latvia), and Associate Professor at UTS Business School (Sydney, Australia). His research interests include financial economics, market microstructure, market manipulation, tax evasion, and partial detection modelling. Tālis has a Ph.D. from the University of Sydney and has been a Visiting Scholar at Columbia University and New York University.E-mail: [email protected]
2

Acknowledgments
We are grateful to the Centre for Sustainable Business at SSE Riga powered by SEB for the generous financial support that made data collection in 2015 possible, SKDS for data collection as well as all entrepreneurs who agreed to participate in the interviews.
© Authors, Stockholm School of Economics in Riga, May 2015
3
Executive summary
The SSE Riga Shadow Economy Index is estimated annually based on surveys of entrepreneurs in the Baltic countries. The Index combines estimates of misreported business income, unregistered or hidden employees, as well as unreported “envelope” wages to estimate the shadow economies as a proportion of GDP.
During 2014, Estonia and Lithuania have continued their long-term trend of gradually reducing the size of their shadow economies. Our estimates suggest that the Estonian and Lithuanian shadow economies contracted by approximately 2.5-2.8 percentage points and now account for 12.5%-13.2% of GDP. The contraction has been across all components of the shadow economies. In contrast, the Latvian shadow economy has remained largely unchanged in aggregate compared to the previous year and is estimated at around 23.5% of GDP. The different dynamics of the shadow economies means that there is now a large difference in their size – the Latvian shadow economy is almost double the size of those in neighbouring countries. According to our data, unregistered companies make up around 5%-8% of all enterprises. They are most widespread in the construction sector.
Although in aggregate the size of the shadow economy in Latvia has not changed much in 2014, its composition has changed. Envelope wages have declined, but their contraction is offset by a corresponding increase in underreporting of business income, which now makes up around 46% of the total Latvian shadow economy. By far the worst sector is construction, where shadow activity in Latvia is estimated to be as high as 48.9% (it is also the sector with the highest level of shadow activity in Estonia and Lithuania, but with more modest levels of 21% and 19%). The recovery in the construction sector has offset the declining levels of shadow activity in other sectors. Perhaps in part driven by the influence of the construction sector, Riga is estimated to have the highest level of shadow activity in Latvia in 2014.
When it comes to attitudes, companies continue to be relatively satisfied with the State Revenue Service and relatively dissatisfied with the government’s tax policy and support for entrepreneurs. The level of dissatisfaction with the government in Latvia has been gradually declining since 2010, whereas it has been increasing in Estonia.
For policymakers, our results highlight the need for continued reforms and actions that combat the shadow economy in particular in Latvia. We believe the widening shadow economy gap between Latvia and neighbouring countries (after the gap was nearly closed in 2012) partly reflects the reduction in Latvian policymaker efforts to combat shadow activity. Now is the time for Latvian policymakers to implement a second large-scale and serious policy package targeting the shadow economy as was done during 2010-2013. The reforms could focus on misreporting of business income, as well as the construction sector, as these are the most problematic parts of the shadow economy. Our findings on the determinants of shadow activity suggest a number of approaches to combatting the shadow economy.
4
Table of contents
Foreword 6
1. Introduction 7
2. Methods used in constructing the Index 8
3. Shadow Economy Index for the Baltic countries 2009- 2014 12
4. Determinants of shadow activity 20
5. Entrepreneurs’ attitudes regarding shadow activities 37
6. Discussion and conclusions 40
References 43
Appendix 1: Questionnaire form used in 2015 44
Appendix 2: Observed and non-observed components of GDP 48
Appendix 3: Regression results 49
5
Foreword
The Shadow Economy Index for the Baltic Countries 2009-2014 report is the fifth report written within the ongoing research project on the Baltic shadow economies. The project is undertaken within the Centre for Sustainable Business at SSE Riga. In addition to the ‘pure’ findings on the size of the shadow economy, the research agenda also addresses the methodological aspects of estimating the size of the shadow economy, i.e. how to measure something that cannot be directly observed.
The previous reports have generated considerable attention and hence contributed to an informed public debate on the shadow economy and its causes. It is our hope that the current report will contribute further to this important debate. Furthermore, as known from economic theory, the size of the shadow economy affects not only government tax revenue but also the allocation of an economy’s resources and thereby its competitiveness. Hence, the report should also be seen as a contribution to the ongoing discussion on how to enhance the competitiveness of the Baltic countries.
The Shadow Economy project would not have been possible without the generous support of SEB through its gratefully acknowledged donations to the Centre for Sustainable Business at SSE Riga.
Anders PaalzowRector, SSE Riga
6

1. Introduction
The aim of the SSE Riga Shadow Economy Index for the Baltic countries is to measure the size of the shadow economies in Estonia, Latvia and Lithuania, as well as to explore the main factors that influence participation in the shadow economy. We use the term “shadow economy” to refer to all legal production of goods and services that is deliberately concealed from public authorities.1 The Index is published annually since 2010 to provide policy makers with information for making justified policy decisions, as well as to foster a deeper understanding of entrepreneurship processes in the Baltic countries. This report analyses the dynamics of the shadow economy in Estonia, Latvia and Lithuania during the period 2009-2014. It also provides evidence on the main factors that influence entrepreneurs’ involvement in the shadow economy and provides some policy recommendations.
The SSE Riga Shadow Economy Index is based on annual surveys of entrepreneurs in the three countries. This approach is based on the notion that those most likely to know how much production/income goes unreported are the entrepreneurs that themselves engage in the misreporting and shadow production. The Index combines estimates of misreported business income, unregistered or hidden employees, as well as unreported “envelope” wages to obtain estimates of the size of the shadow economies as a proportion of GDP. The method used in this report for estimating the size of the shadow economy requires fewer assumptions than most existing methods, in particular compared to methods based on macro indicators. Furthermore, the SSE Riga Shadow Economy Index can be used through time or across sectors and countries and thus is a useful tool for evaluating the effectiveness of policy designed to minimise the shadow economy.
Survey-based approaches face the risk of underestimating the total size of the shadow economy due to non-response and untruthful response given the sensitive nature of the topic. The SSE Riga Shadow Economy Index minimises this risk by employing a number of survey and data collection techniques shown in previous studies to be effective in eliciting more truthful responses.2 These include confidentiality with respect to the identities of respondents, framing the survey as a study of satisfaction with government policy, gradually introducing the most sensitive questions after less sensitive questions, phrasing misreporting questions indirectly and, in the analysis, controlling for factors that correlate with potential untruthful response such as tolerance towards misreporting.
The next section describes how the Index is constructed, starting with the survey and then the calculations. The third section of this report presents estimates of the Index and analyses the
1 This definition corresponds to what the Organisation for Economic Co-operation and Development (OECD) in their comprehensive 2002 handbook “Measuring the Non-observed Economy” as well as the System of National Accounts (SNA 1993) refer to as “underground production”. It is also consistent with definitions employed by other researchers (e.g., the World Bank study of 162 countries by Schneider, Buehn and Montenegro (2010)). We elaborate further on the components of the unobserved economy in Section 2.2 For example, Gerxhani (2007), Kazemier and van Eck (1992), and Hanousek and Palda (2004).
7
various forms of shadow activity. Sections 4 and 5 analyse the determinants of entrepreneurs’ involvement in the shadow sector and their attitudes towards shadow activities. Finally, Section 6 discusses the conclusions that we can draw from the results and identifies some policy implications.
2. Methods used in constructing the Index
2.1. The survey of entrepreneurs
The SSE Riga Shadow Economy Index is based on an annual survey of company owners/managers in Estonia, Latvia and Lithuania, following the method of Putniņš and Sauka (2014). The surveys are conducted between February and March of each year and contain questions about shadow activity during the previous two years. For example, the survey conducted in February-March 2015 collects information about shadow activity during 2013 and 2014. The overlap of one year in consecutive survey rounds (e.g., collecting information about 2013 shadow activity in both the 2014 and 2015 survey rounds) is used to validate the consistency of responses.
We use random stratified sampling to construct samples that are representative of the population of firms in each country. Starting with all active firms in each of the three Baltic countries (obtained from the Orbis database maintained by Bureau Van Dijk), for each country we form size quintiles (using book value of assets) and take equal sized random samples from each size quintile. In total a minimum of 500 phone interviews are conducted in each of the three Baltic countries in each survey round. The 2015 survey collected responses from 500 company owners/managers in Estonia, 505 in Latvia and 501 in Lithuania. The survey is conducted in cooperation with SKDS, and funded by SEB through the Centre for Sustainable Business at SSE Riga.
The questionnaire form (see Appendix 1) contains four main sections: (i) external influences and satisfaction; (ii) shadow activity; (iii) company and owner characteristics; and (iv) entrepreneurs’ attitudes. To increase the response rate and truthfulness of responses the questionnaire begins with non-sensitive questions about satisfaction with the government and tax policy, before moving to more sensitive questions about shadow activity and deliberate misreporting. This ‘gradual’ approach is recommended by methodological studies of survey design in the context of tax evasion and the shadow economy (e.g., Gerxhani, 2007; and Kazemier and van Eck, 1992). Further, the survey is framed as a study of satisfaction with government policy, rather than a study of tax evasion and misreporting (similar to Hanousek and Palda, 2004). We also guarantee respondents 100% confidentiality with respect to their identities.
In the first survey block, ‘external influences’, respondents are asked to express their satisfaction with the State Revenue Service, tax policy, business legislation and government support for entrepreneurs in the respective country. The questions use a five point Likert scale, from “1”
8
(“very unsatisfied”) to “5” (“very satisfied”). The first section of the questionnaire also includes two questions related to entrepreneurs’ social norms: entrepreneurs’ tolerance towards tax evasion and towards bribery. Previous studies argue that entrepreneurs are likely to engage in more tax evasion when such behaviour is tolerated (Baumol, 1990). The measures of tolerance serve a second important role as control variables for possible understating of the extent of shadow activity due to the sensitivity of the topic.
The second section of the questionnaire, ‘informal business’, is constructed based on the concepts of productive, unproductive and destructive entrepreneurship by Baumol (1990), assessment of ‘deviance’ or ‘departure from norms’ within organisations (e.g., Warren, 2003) and empirical studies of tax evasion in various settings (e.g., Fairlie, 2002; Aidis and Van Praag, 2007). We assess the amount of shadow activity by asking entrepreneurs to estimate the degree of underreporting of business income (net profits), underreporting of the number of employees, underreporting of salaries paid to employees and the percentage of revenues that firms pay in bribes.
We employ the ‘indirect’ approach for questions about informal business, asking entrepreneurs about ‘firms in their industry’ rather than ‘their firm’.3 This approach is discussed by Gerxhani (2007) as a method of obtaining more truthful answers, and is used by Hanousek and Palda (2004), for example. The study conducted by Sauka (2008) shows that even if asked indirectly entrepreneurs’ answers can be attributed to the particular respondent or company that the respondent represents.4 Furthermore, experience from Sauka (2008) suggests that phone interviews are an appropriate tool to elicit information about tax evasion.5 The second section of the questionnaire also elicits entrepreneurs’ perceptions of the probability of being caught for various forms of shadow activity and the severity of penalties if caught deliberately misreporting.
We use the overlapping years (e.g., answers in both the 2013 survey and 2012 survey about the level of shadow activity in 2011) to filter out inconsistent responses. This is only possible in instances where a respondent participates in repeated survey rounds. In particular, our filter drops responses when the same respondent in two different survey rounds answers the same
3 Even when asked indirectly, some entrepreneurs choose not to answer sensitive questions about shadow activity. One way to avoid providing truthful answers to such questions is by simply answering “0” to all of the shadow activity questions, suggesting that no shadow activity of any kind has taken place during the past two years. We view it as much more likely that these responses reflect avoidance of sensitive questions than truthful opinions and therefore treat these cases as non-responses, in order to minimise the downward bias in estimates of shadow activity.4 Sauka (2008) used the following approach: in the follow up survey (one year after the initial survey), respondents are ‘reminded’ that in the initial survey they stated that, for example, the degree of involvement in underreporting business income by ‘their firm’ (not by ‘firms in their industry’ as formulated in the initial survey) was, for example, 23%. Each respondent is then asked whether the degree of underreporting in their companies is the same this year and if not, to what extent it has changed. The conclusion from using this method is that respondents tend to state the amount of underreporting in ‘their firm’ when asked about ‘firms in their industry’. 5 Sauka (2008) uses both face-to-face and phone interviews and concludes that willingness to talk about sensitive issues like tax evasion in Latvia does not differ significantly between the two methods.
9
shadow activity questions about the same reference year with a difference of +/- 20%. This filtering helps increase the reliability of survey responses used in calculating the Index.
The third section of the questionnaire asks entrepreneurs about the performance of their companies (percentage change in net sales profit, sales turnover and employment during the previous year), company age, industry and region. The fourth section of the questionnaire elicits entrepreneurs’ opinions about why entrepreneurs evade taxes.
In the 2015 survey we included a question that measures the amount of unregistered business in all three Baltic countries. We asked owners/managers of registered businesses the following question (see question 16 in Appendix 1): “In some industries, in addition to registered companies such as yours, unregistered enterprises also operate but do not report any of their activity to authorities. In your opinion, what percentage of your industry's total production of goods/services is carried out by unregistered enterprises in 2014? In 2013?”. Even though we asked this question to owners/ managers of registered businesses, we believe that being experts in their industry they are likely to know approximately how many unregistered businesses operate in their industry. Registered companies compete with unregistered ones and therefore should be aware of such companies.
We do not include the production of unregistered businesses in the shadow economy index as their activity does not fit within our definition of the shadow economy. Yet, by including question 16, we are able to provide a more in depth picture of the unobserved economies in the Baltic States. As illustrated in Appendix 2, key parts of unobserved economy are:
(1) Unreported income of registered producers. This is what we refer to as the ‘shadow economy’ and measure with our annual index since 2010.
(2) Unreported income of unregistered producers. This is where we extend this year’s report.(3) Income from production of illegal goods/services. We still do not measure this
component of unobserved economy since it requires different methods.
2.2.Calculation of the Index
The Index measures the size of the shadow economy as a percentage of GDP.6 There are three common methods of measuring GDP: the output, expenditure and income approaches. Our Index is based on the income approach, which calculates GDP as the sum of gross remuneration of employees (gross personal income) and gross operating income of firms (gross corporate income). Computation of the Index proceeds in three steps: (i) estimate the degree of underreporting of employee remuneration and underreporting of firms’ operating income using the survey responses; (ii) estimate each firm’s shadow production as a weighted average of its underreported employee remuneration and underreported operating income, with the weights
6 Two caveats are worth noting: (i) because we do not measure shadow activity in the state (public) sector, our estimates refer to private sector shadow activity as a percentage of private sector domestic output; and (ii) we do not attempt to measure the “black economy”, i.e., the illegal goods and services.
10
reflecting the proportions of employee remuneration and firms’ operating income in the composition of GDP; and (iii) calculate a production-weighted average of shadow production across firms.
In the first step, underreporting of firm i’s operating income, , is estimated directly from the corresponding survey question (question 7). Underreporting of employee remuneration, however, consists of two components: (i) underreporting of salaries, or ‘envelope wages’ (question 11); and (ii) unreported employees (question 9). Combining the two components, firm i’s total unreported proportion of employee remuneration is:7
In the second step, for each firm we construct a weighted average of underreported personal and underreported corporate income, producing an estimate of the unreported (shadow) proportion of the firm’s production (income):
where is the ratio of employees’ remuneration (Eurostat item D.1) to the sum of employees’ remuneration and gross operating income of firms (Eurostat items B.2g and B.3g). We calculate
for each country, c, in each year using data from Eurostat. Taking a weighted average of the underreporting measures rather than a simple average is important to allow the Shadow Economy Index to be interpreted as a proportion of GDP.8
In the third step we take a weighted average of underreported production, , across firms in country c to arrive at the Shadow Economy Index for that country:
The weights, , are the relative contribution of each firm to the country’s GDP, which we approximate by the relative amount of wages paid by the firm. Similar to the second step, the
7 In deriving the formula we make the simplifying assumption that wages of unreported employees are on average equal to those of reported employees.8 For example, suppose in an economy wages sum to 80 and corporate income 20, giving true GDP of 100. Suppose that wages are underreported by 50% and corporate income by 10% giving an official reported GDP of 40+18=58. In this example the shadow economy is 42% of true GDP, i.e. (100-58)/100. A weighted average of the two underreporting proportions accurately estimates the size of the shadow economy: (0.8)(50%)+(1-0.8)(10%)=42%. However, neither of the two underreporting proportions themselves correctly represent the size of the shadow economy (50% and 10%), nor does an equal weighted average: (0.5)(50%)+(1-0.5)(10%)=30%.
i
N
ii
omyShadowEconc ortionShadowPropwINDEX
c
1
ncomeOperatingIiUR
)1)(1(1 Employeesi
Salariesi
munerationEmployeeRei URURUR
ncomeOperatingIic
munerationEmployeeReici URURortionShadowProp )1(
c
c
iortionShadowProp
iw
11

weighting in this final average is important to allow the Shadow Economy Index to reflect a proportion of GDP.9
As a final step, we follow the methodology of the World Economic Forum in their Global
Competitiveness Report and apply a weighted moving average of calculated from the most recent two survey rounds. There are several reasons for doing this, including: (i) it increases the amount of available information and hence precision of the Index by providing a larger sample size; and (ii) it makes the results less sensitive to the specific point in time when the survey is administered. The weighting scheme comprises two overlapping elements: (i) more weight is given to the more recent survey round as that contains more recent information (past information is “discounted”); and (ii) more weight is placed on larger sample sizes as they contain more information.10 Following the approach of the World Economic Forum, for years in which there are no previous surveys (the 2009 and 2010 results, which are based on the first survey round conducted in 2011) the Index is simply based on the one survey round. Consequently, the first two annual Index estimates (2009 and 2010) are more prone to sampling error than subsequent annual estimates, which benefit from larger samples via the moving average. To allow comparisons across countries we apply consistent methodology in calculating the Shadow Economy Index for each of the Baltic countries.
3. Shadow Economy Index for the Baltic countries 2009-2014
This section reports the Shadow Economy Index in the Baltic countries during the past six years. We also separately examine each of the types of shadow activity that make up the Index, as well as bribery/corruption and the prevalence of unregistered enterprises. Table 1 and Figure 1 report the size of the shadow economies as a percentage of GDP in the years 2009-2014. In 2014, the estimated size of the shadow economy has decreased in all three Baltic countries and reached 13.2% of GDP in Estonia, 12.5% of GDP in Lithuania and 23.5% of GDP in Latvia. The decrease in 2014, however, is statistically significant only in Lithuania and Estonia (decreases of 2.5 and 2.8 percentage points, respectively), i.e., the size of the Latvian shadow economy has remained approximately unchanged from 2013 to 2014. Consequently, the gap between Latvia and neighbouring Baltic countries in the size of their shadow economies has further increased.
9 For an example, consider the previous footnote’s example replacing the two sources of income with two firms: a large one that produces income of 80 and a smaller one that produces income of 20.10 For details on this procedure see the Global Competitiveness Report 2011-2012 (Box 3, p. 64), which is available at: http://www3.weforum.org/docs/WEF_GCR_Report_2011-12.pdf
omyShadowEconcINDEX
12
Table 1. SSE Riga Shadow Economy Index for the Baltic countries 2009-2014This table reports point estimates and 95% confidence intervals for the size of the shadow economies as a proportion of GDP. The last row reports the change in the relative size of the shadow economy from 2013 to 2014.
Estonia Latvia Lithuania2009 20.2%
(18.7%, 21.7%)36.6%
(34.3%, 38.9%)17.7%
(15.8%, 19.7%)
2010 19.4%(18.0%, 20.8%)
38.1%(35.9%, 40.3%)
18.8%(16.9%, 20.6%)
2011 18.9%(16.8%, 20.9%)
30.2%(27.6%, 32.7%)
17.1%(15.2%, 19.0%)
2012 19.2%(16.6%, 21.9%)
21.1%(18.5%, 23.6%)
18.2%(16.4%, 20.1%)
2013 15.7%(13.5%, 17.9%)
23.8%(20.7%, 26.9%)
15.3%(13.6%, 17.1%)
2014 13.2%(11.3%, 15.1%)
23.5%(20.5%, 26.6%)
12.5%(11.0%, 13.9%)
2014-2013 -2.5%(-4.6%, -0.5%)
-0.3%(-3.4%, 2.8%)
-2.8%(-4.4%, -1.2%)
Figure 1. SSE Riga Shadow Economy Index for the Baltic countries 2009-2014.
Figure 2 illustrates the relative size of the components of the shadow economy in each of the three countries. Similarly to results from 2013, the largest component of the shadow economies in Latvia and Lithuania in 2014 is unreported business income. According to our data, the proportion of the shadow economy made up by unreported business income has increased in Latvia, which is an important signal for policy makers (increase from 42.0% in 2013 to 45.5% in 2014). In Estonia, however, envelope wages continue to be the main component of the shadow
13
economy (49.5% in 2014). Envelope wages are the second largest component of the shadow economy in Latvia and Lithuania (36.1% and 40.5% accordingly).
Figure 2. Components of the shadow economies in each of the Baltic countries, 2014.
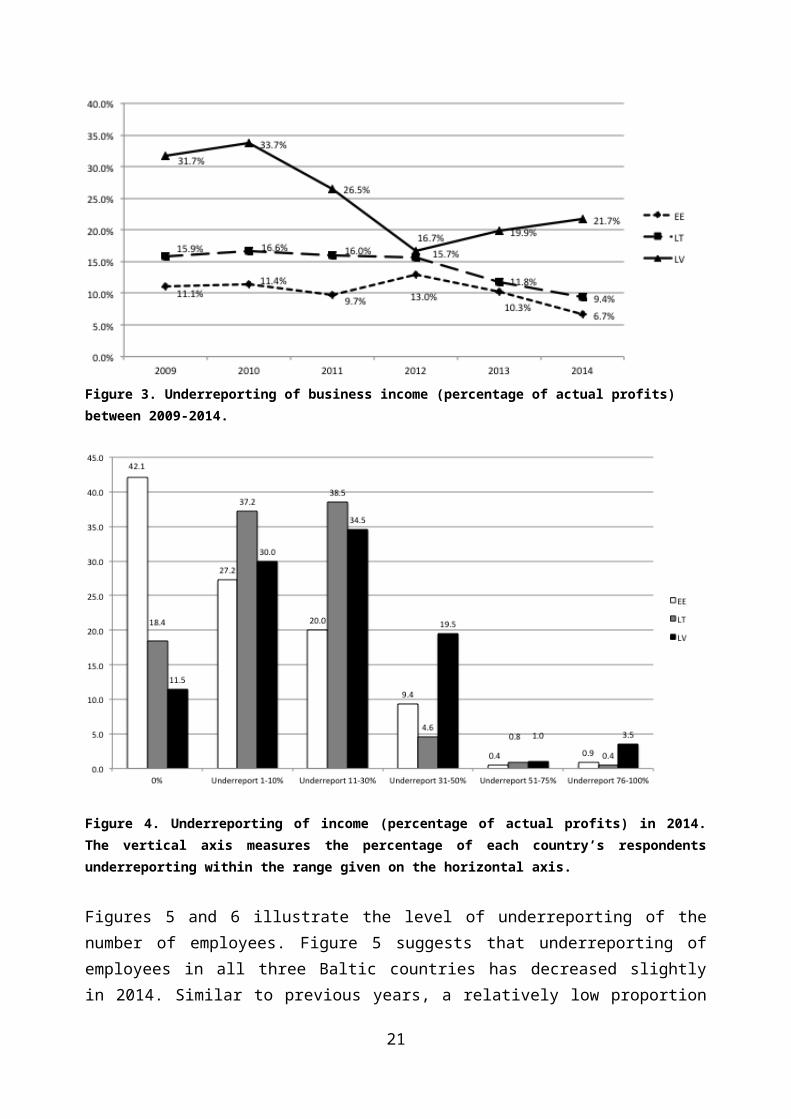
Figures 3 and 4 illustrate the degree of underreporting of business income (profits). Figure 3 shows the dynamics of underreporting profits from 2009 to 2014, whereas Figure 4 shows the distribution of firms that underreport profits within a given range. According to Figure 3, Latvia is the only Baltic country where underreporting of business income has increased compared to 2013, which is also reflected in the components of the shadow economy in Figure 2. In Estonia underreporting of profits in 2014 is estimated as 6.7%, whereas in Lithuania it is 9.4%, and in contrast, in Latvia it is 21.7%. Similar to 2013, approximately 40% of respondents from Estonia state that underreporting ‘in the industry’ in 2014 is 0%, i.e. that companies report 100% of their actual profits (see Figure 4). In Latvia and Lithuania, however, 100% of actual profits are reported by 11.5% and 18.4% respondents, respectively.
14
Figure 3. Underreporting of business income (percentage of actual profits) between 2009-2014.
Figure 4. Underreporting of income (percentage of actual profits) in 2014. The vertical axis measures the percentage of each country’s respondents underreporting within the range given on the horizontal axis.
Figures 5 and 6 illustrate the level of underreporting of the number of employees. Figure 5 suggests that underreporting of employees in all three Baltic countries has decreased slightly in 2014. Similar to previous years, a relatively low proportion of respondents claim that underreporting of employees in 2014 represents more than 50% of employees (Figure 6).
15

Figure 5. Underreporting of the number of employees (percentage of the actual number of employees) between 2009-2014.
Figure 6. Underreporting of the number of employees in 2014. The vertical axis measures the percentage of each country’s respondents underreporting within the range given on the horizontal axis.
Figure 7 indicates that, on average, envelope wages as a proportion of total wages have also decreased in all Baltic countries in 2014. The biggest decrease compared to 2013 is in Latvia (from 25.2% to 20.3%), whereas in Lithuania and Estonia the proportion of envelope wages in 2014 are estimated as 12.2% and 13.6% of total wages, respectively. Figure 8 shows that in 2014 most frequently companies from Latvia and Lithuania underreport 11-30% of actual salaries; 1-10% in Estonia.
16
Figure 7. Underreporting of salaries (percentage of actual salaries) between 2009-2014.
Figure 8. Underreporting of salaries in 2014. The vertical axis measures the percentage of each country’s respondents underreporting within the range given on the horizontal axis.
Similar to 2013, Figure 9 indicates that during 2014 Lithuanian and Latvian companies paid proportionally more in bribes (revenues spent on “getting things done”) than Estonian companies. The level of bribery in Latvia and Lithuania during 2014 is rather similar – around 10%, whereas in Estonia it has decreased to 3.4%.
17

Figure 9. Bribery (percentage of revenue spent on payments ‘to get things done’) between 2009-2014.
Figure 10. Bribery in 2014 as a percentage of revenue. The vertical axis measures the percentage of each country’s respondents making unofficial payments ‘to get things done’ within the range given on the horizontal axis.
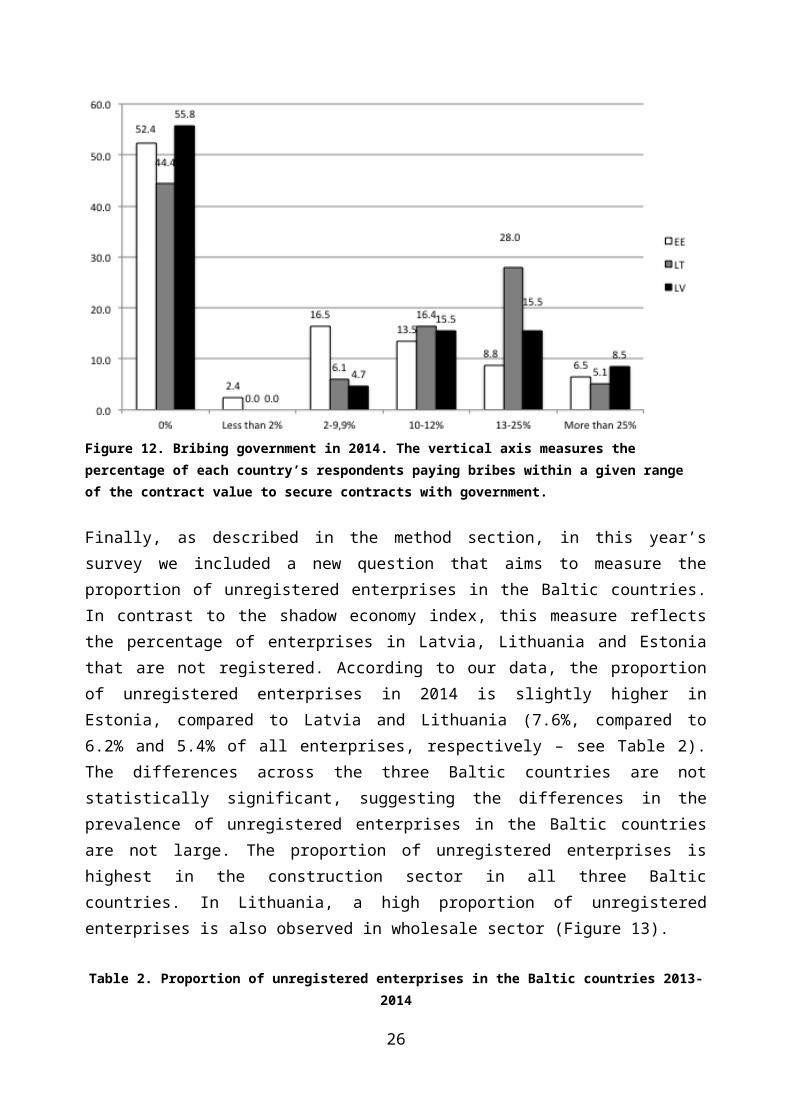
Figures 11 and 12 illustrate the percentage of the contract value that firms typically offer as a bribe to secure a contract with the government. Similar to the general level of bribery reported in Figure 9, the level of government bribery has decreased in Estonia. A decrease compared to 2013 is also observed in Latvia. The estimated level of the government bribery, however, has substantially increased in Lithuania reaching 10.9% of the contract value in 2014, compared to 6.2% in 2013. Consistent with these findings, Figure 12 illustrates that the most frequent size of government bribes (proportion of the contract value) in Lithuania is higher than in the other two Baltic countries.
18
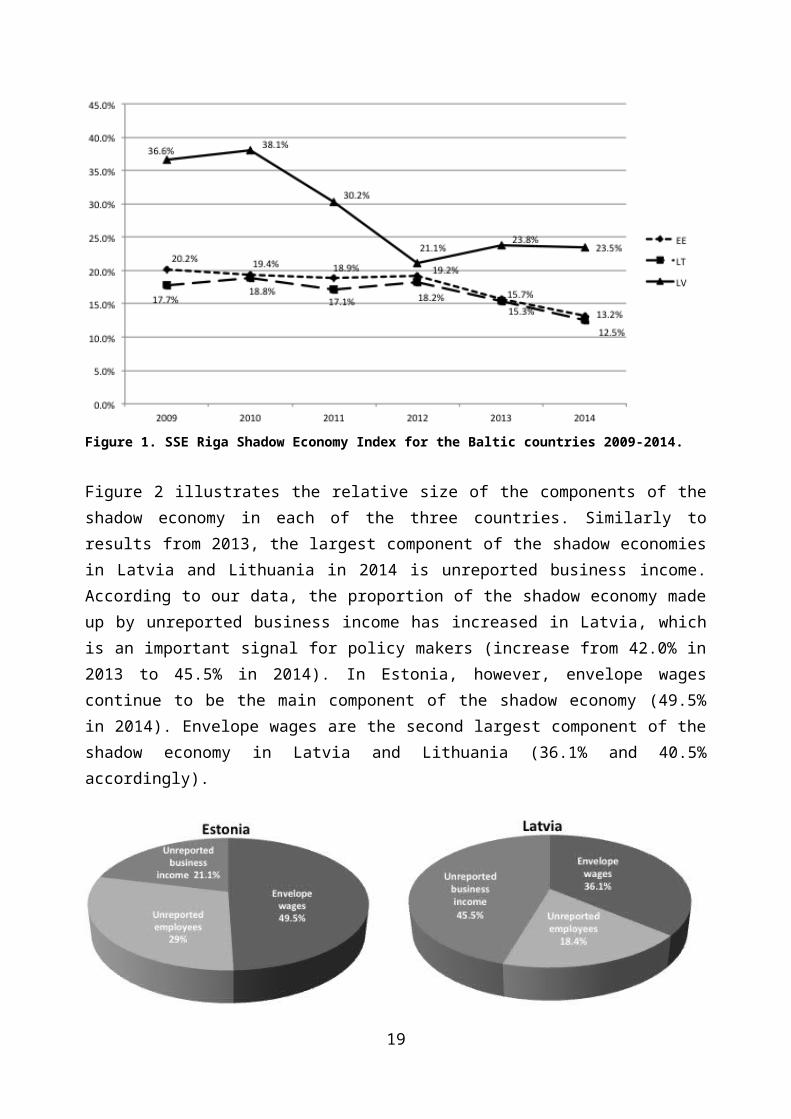
Figure 11. Percentage of the contract value paid to government to secure the contract, 2010-2014.
Figure 12. Bribing government in 2014. The vertical axis measures the percentage of each country’s respondents paying bribes within a given range of the contract value to secure contracts with government.
Finally, as described in the method section, in this year’s survey we included a new question that aims to measure the proportion of unregistered enterprises in the Baltic countries. In contrast to the shadow economy index, this measure reflects the percentage of enterprises in Latvia, Lithuania and Estonia that are not registered. According to our data, the proportion of unregistered enterprises in 2014 is slightly higher in Estonia, compared to Latvia and Lithuania (7.6%, compared to 6.2% and 5.4% of all enterprises, respectively – see Table 2). The differences across the three Baltic countries are not statistically significant, suggesting the differences in the prevalence of unregistered enterprises in the Baltic countries are not large. The proportion of unregistered enterprises is highest in the construction sector in all three Baltic countries. In Lithuania, a high proportion of unregistered enterprises is also observed in wholesale sector (Figure 13).
19
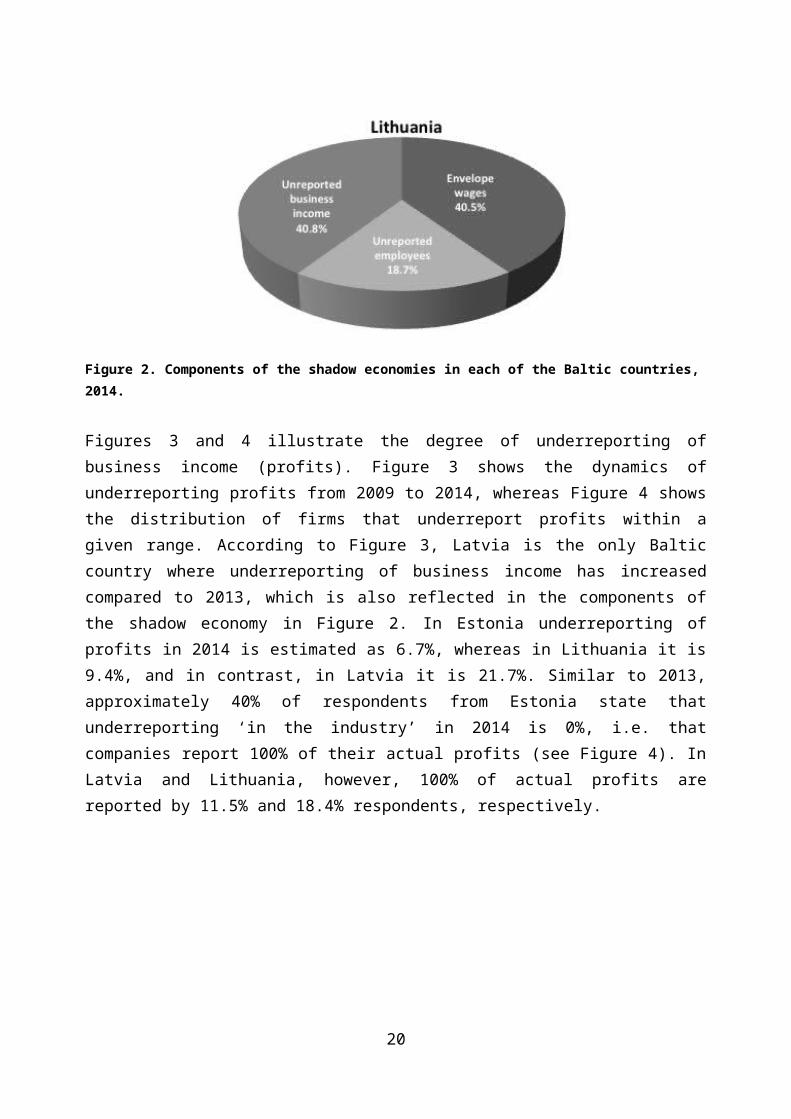
Table 2. Proportion of unregistered enterprises in the Baltic countries 2013-2014This table reports point estimates and 95% confidence intervals of unregistered enterprises as a percentage of all enterprises in Estonia, Latvia and Lithuania.
Estonia Latvia Lithuania2013 7.6%
(5.4%, 9.9%)6.2%
(5.3%, 7.1%)5.4%
(4.2%, 6.6%)
2014 6.3%(4.5%, 8.2%)
5.6%(4.5%, 6.7%)
5.2%(4.5%, 6.0%)
Figure 13. Proportion of unregistered enterprises in the Baltic countries in 2014 by industry.
4. Determinants of shadow activity
In this section we examine the factors that influence firms’ decisions to participate in the shadow economy. We start by reporting the size of the shadow economy by company characteristics including operating region, sector and firm size. Next, we report descriptive statistics of how the size of the shadow economies varies with attitudes and perceptions towards tax evasion. Finally, we use regression analysis to identify the drivers of firms’ involvement in the shadow economy, while controlling for a range of factors.
20
4.1. Company characteristics
Figures 14-16 report the size of the shadow economy by region, in Estonia, Latvia and Lithuania. Figure 14 shows that similar to 2013, the highest levels of shadow activity in Latvia during 2014 are in the Kurzeme and Riga regions (28.7% and 32.0%, respectively). In Lituania, the level of shadow activity is rather similar across the regions, whereas patterns of the shadow economy across regions in Estonia are similar to those in 2013. The small number of observations in some of the regions in Estonia, however, create a relatively large margin of error and therefore the Estonian estimates by region should be interpreted with caution.
Figure 14. Size of the shadow economy (% of GDP) by region in Latvia, 2009-2014.
21
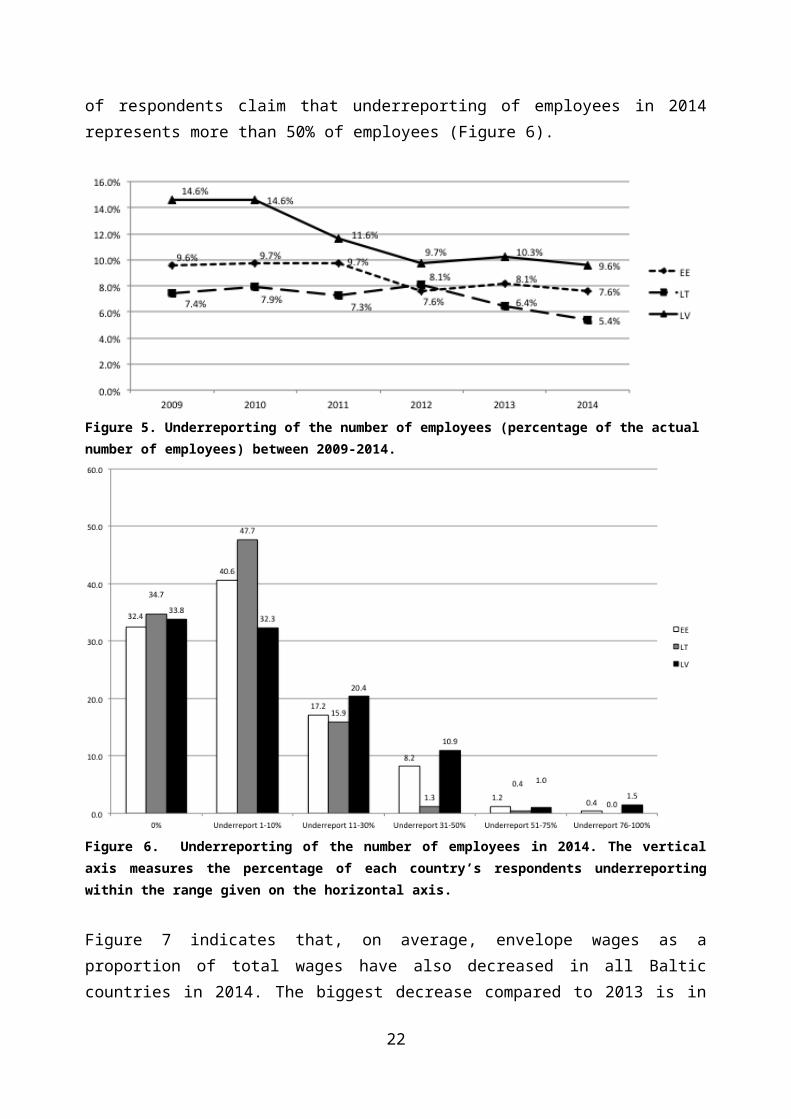
Figure 15. Size of the shadow economy (% of GDP) by region in Lithuania, 2009-2014.
Figure 16. Size of the shadow economy (% of GDP) by region in Estonia, 2009-2014. 11
11 Our sample does not contain valid observations for 2009-2012 on Estonian firms in Hiiu maakond, Viljandi maakond, Võru maakond, Jõgeva maakond, Lääne-Viru maakond, Rapla maakond and Saare maakond regions.
22
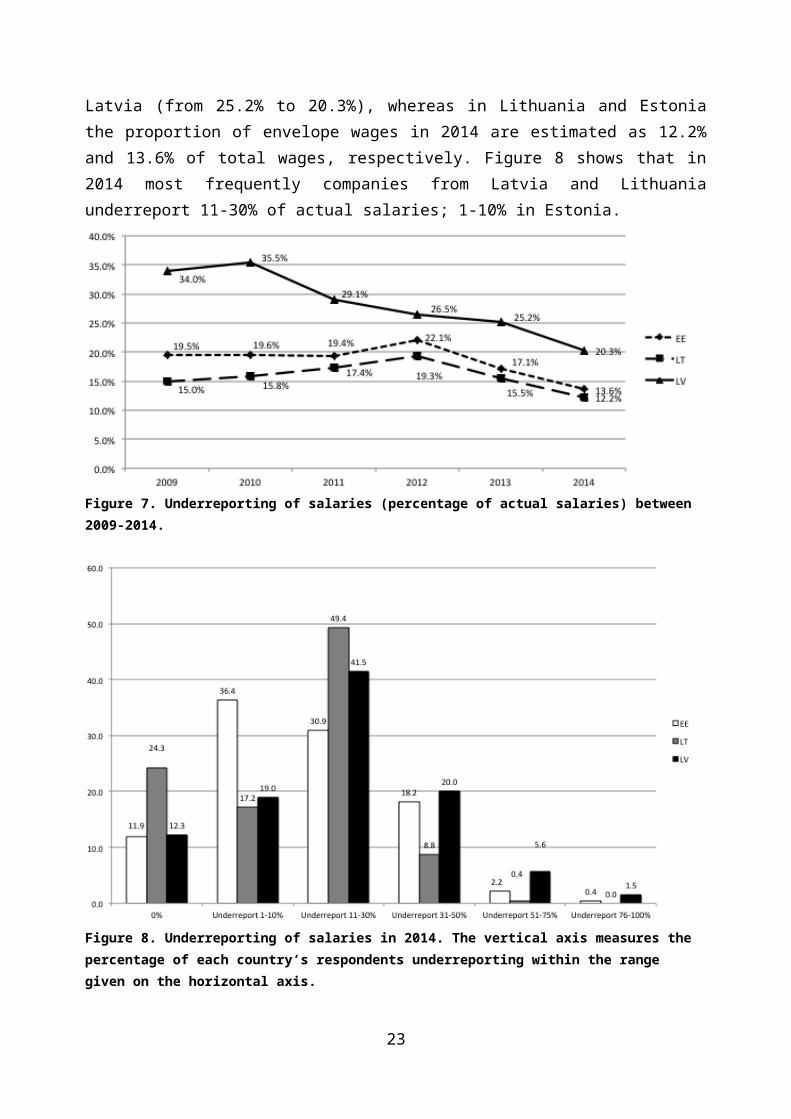
Figure 17 summarises how the size of the shadow economy varies by sector in 2014. The dynamics of the shadow economy in each sector during 2010-2014 are presented in Figures 18-20. Figure 17 suggests that in 2014 in Latvia, by far the highest level of shadow activity is in the construction sector (48.9%), followed by retail. Also, Figure 18 reports an increase in the size of the shadow economy in Latvia in both construction and retail sectors compared to previous years. In Lithuania and Estonia, the construction sector also has the highest level of shadow activity (19.0% and 21.0%, respectively, see Figure 17). As shown in Figures 19 and 20, in both Lithuania and Estonia the shadow economy in 2014 has decreased in all sectors compared to 2013, with exception of wholesale in Estonia (Figure 20).
Figure 17. Size of the shadow economy (% of GDP) by sector, 2014.
23
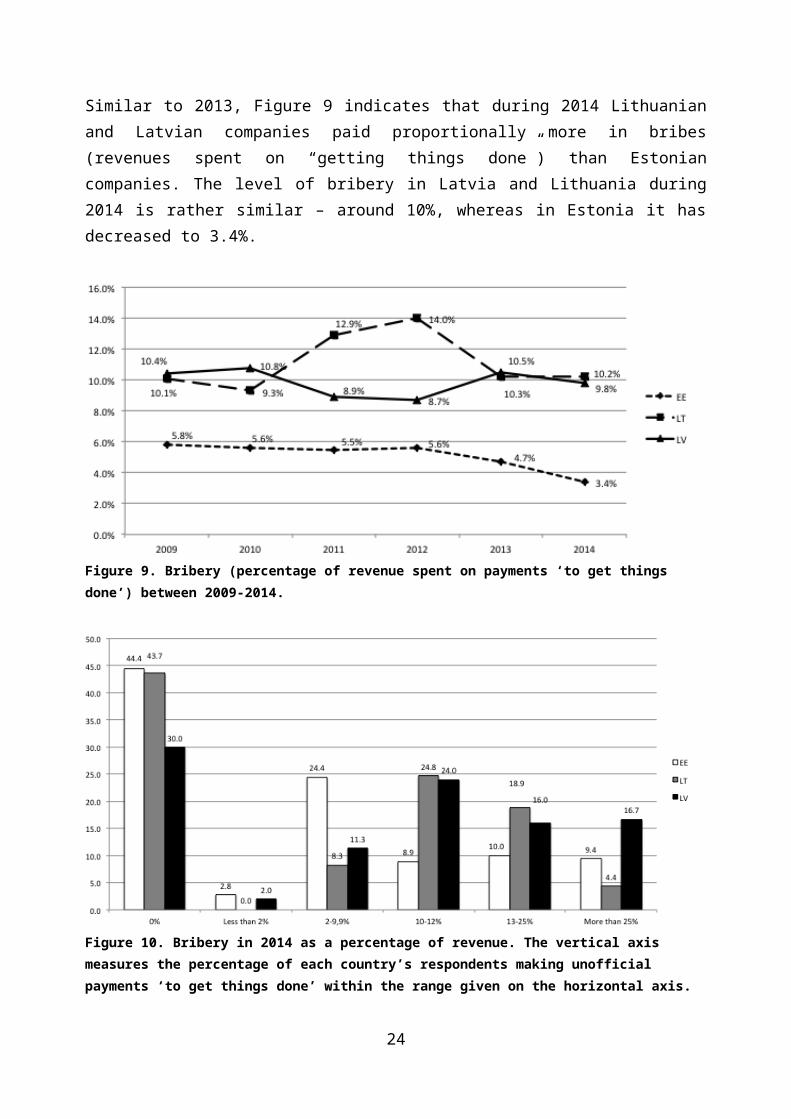
Figure 18. Size of the shadow economy (% of GDP) by sector in Latvia, 2010-2014.
Figure 19. Size of the shadow economy (% of GDP) by sector in Lithuania, 2010-2014.
24
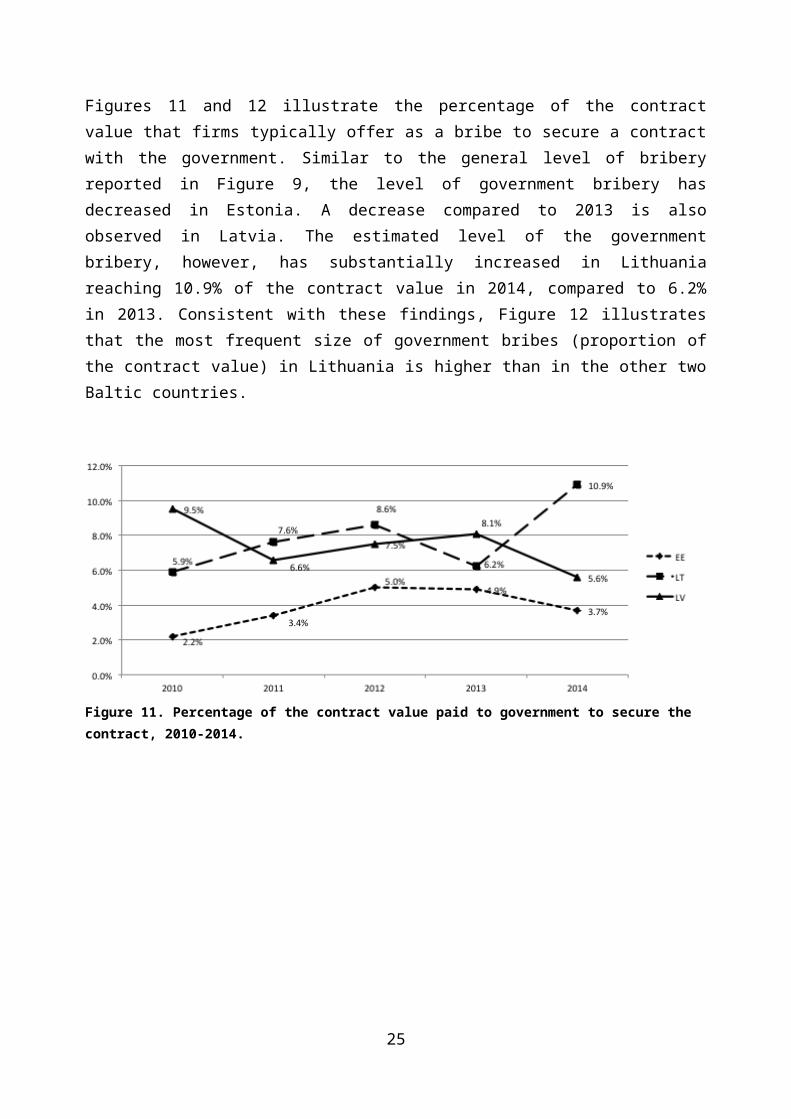
Figure 20. Size of the shadow economy (% of GDP) by sector in Estonia, 2010-2014.
Figure 21. Size of the shadow economy (% of GDP) by firm size (number of employees), 2014.12
Figure 21 clearly shows that shadow activity is not a phenomenon that can only be observed in relatively small companies – in all three Baltic countries a relatively high level of shadow activity occurs in companies that employ 51-200 employees and 200+ employees. In 2014 (similar to 2013), the level of shadow activity is relatively similar across size categories, with a modest tendency for higher levels in smaller companies.
12 Our sample does not contain any valid observations on Estonian firms with 51-200 employees.
25
4.2. How attitudes and perceptions affect shadow activity
According to the tax evasion literature, the decision to evade taxes and participate in the shadow economy is affected by the detection rates, the size and type of penalties, firms’ attitudes towards risk-taking and so on. These factors are likely to differ across countries, regions, sectors of the economy, size and age of firm. To measure such influences, we include questions about entrepreneurs’ perceptions of the likelihood of being caught for underreporting business profits, number of employees, salaries, as well as involvement in bribery. We also ask entrepreneurs to evaluate potential consequences for the firm if it were caught for deliberate misreporting. Figures 22-26 summarise the results on perceived probabilities of being caught and expected consequences.
Figure 22. Probability of being caught for underreporting business profits, 2014. Vertical axis measures percentage of each country’s respondents in each category.
26
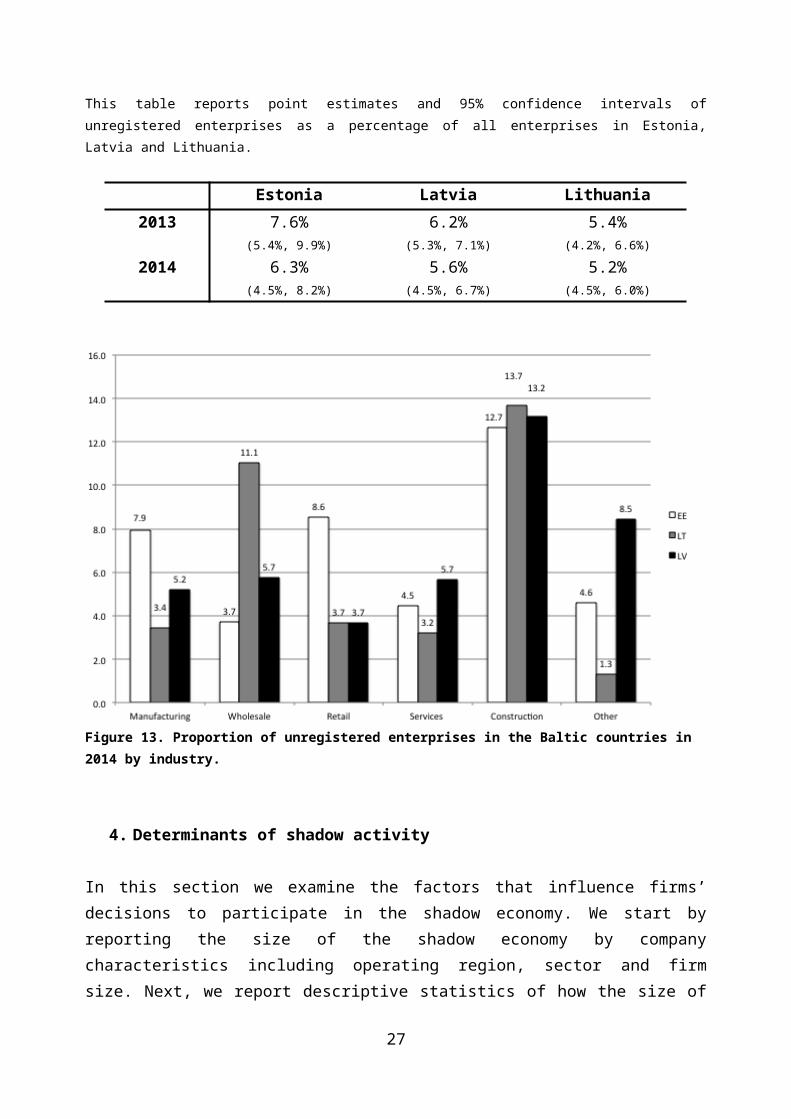
Figure 23. Probability of being caught for underreporting number of employees, 2014. Vertical axis measures percentage of each country’s respondents in each category.
Figure 24. Probability of being caught for underreporting salaries, 2014. Vertical axis measures percentage of each country’s respondents in each category.
27

Figure 25. Probability of being caught for making payments to ‘get things done’, 2014. Vertical axis measures percentage of each country’s respondents in each category.
28
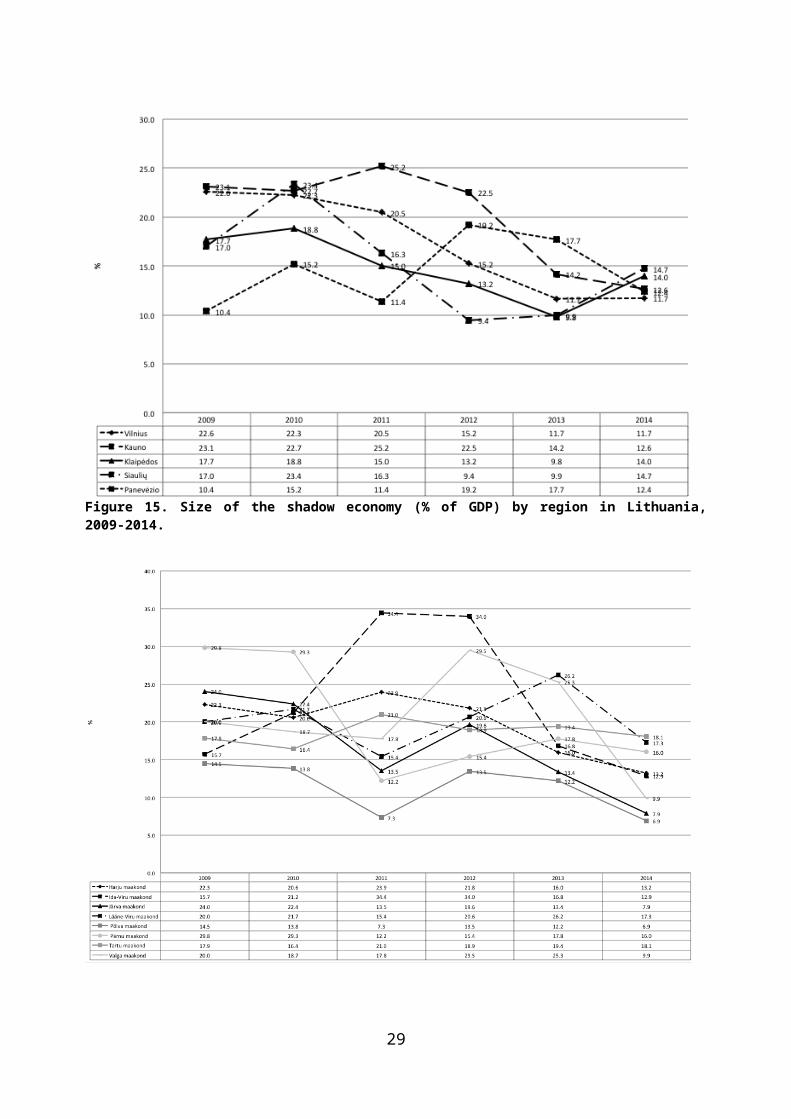
Figure 26. Most likely consequences if caught deliberately underreporting, 2014. Vertical axis measures percentage of each country’s respondents in each category.
The results suggest that entrepreneurs in all three Baltic countries perceive the risk of being caught when underreporting income, salaries and employees is relatively high, especially in Lithuania. As many as 65.8% of respondents in Lithuania report that the probability of being caught for underreporting profits is 76-100% (Figure 22). The majority of respondents in Lithuania also perceive a very high probability of being caught for underreporting salaries and employees. The probability of being caught bribing is relatively lower in all three Baltic countries, yet, again, comparably higher in Lithuania (Figure 25). Figure 26 shows that the expected penalties for deliberate misreporting are similar across all three countries; close to half of the respondents expect the penalty would be a serious fine that would impact on competitiveness. The overall perceived likelihood of consequences from being caught has not changed significantly through the years 2011-2014.
Empirical studies find that the actual amount of tax evasion is considerably lower than predicted by rational choice models and the difference is often attributed to the second, broader, set of tax evasion determinants – attitudes and social norms. These factors include perceived justice of the tax system, i.e., attitudes about whether the tax burden and administration of the tax system are fair, attitudes about how appropriately taxes are spent and how much firms trust the government. Finally, tax evasion is also influenced by social norms such as ethical values and moral convictions, as well as fear of feelings of guilt and social stigmatisation if caught. We measure firms’ attitudes using four questions about their satisfaction with the State Revenue Service, the government’s tax policy, business legislation and the government’s support for entrepreneurs (see questions 1-4 in Appendix 1).
Figure 27. Satisfaction with State Revenue Service, 2014. Vertical axis measures percentage of each country’s respondents in each category.
29
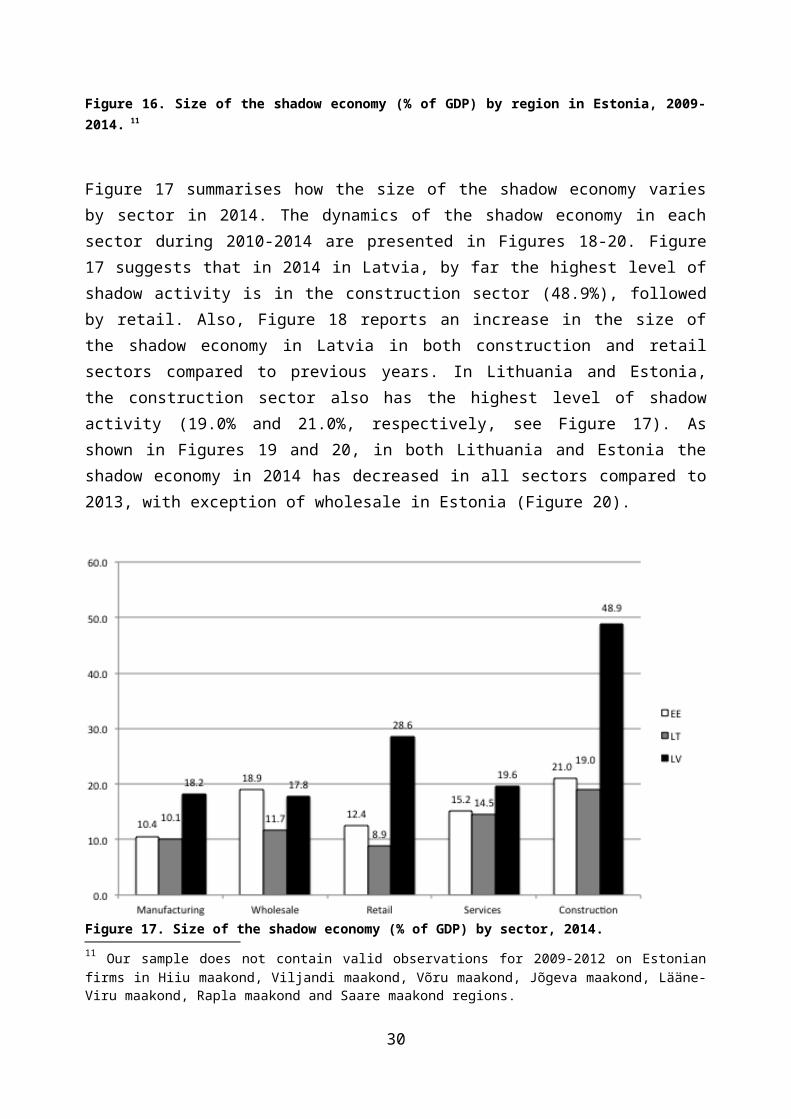
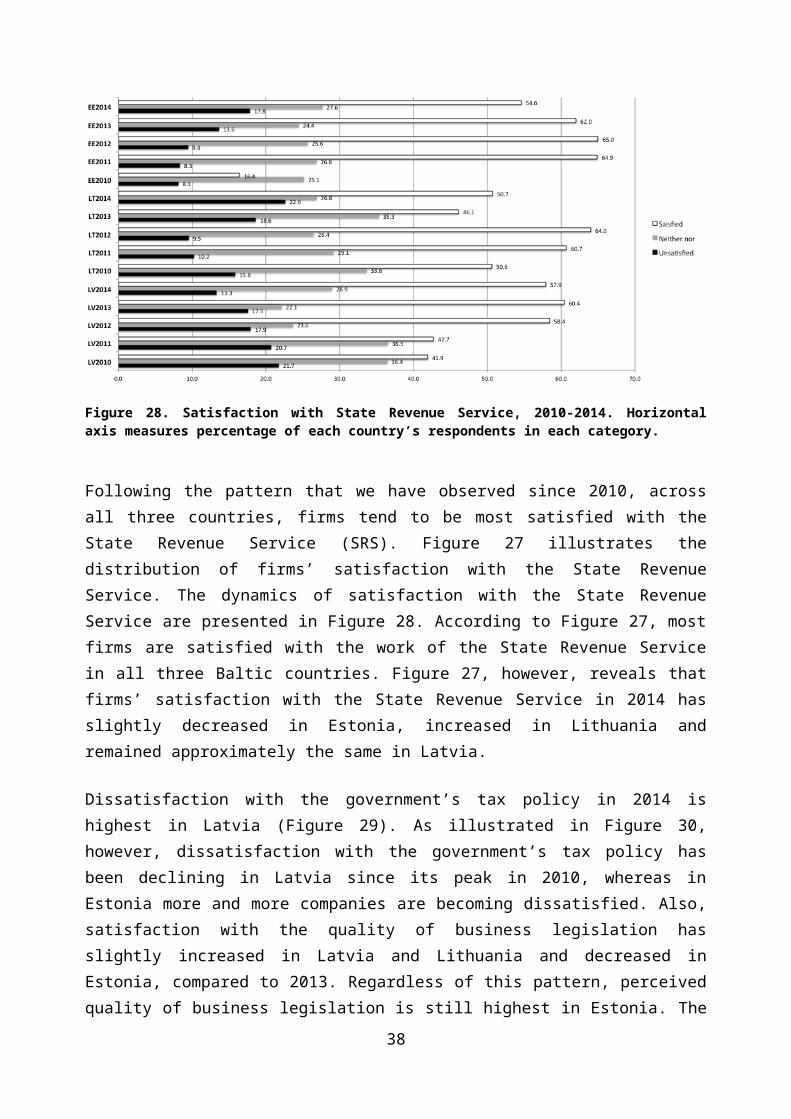
Figure 28. Satisfaction with State Revenue Service, 2010-2014. Horizontal axis measures percentage of each country’s respondents in each category.
Following the pattern that we have observed since 2010, across all three countries, firms tend to be most satisfied with the State Revenue Service (SRS). Figure 27 illustrates the distribution of firms’ satisfaction with the State Revenue Service. The dynamics of satisfaction with the State Revenue Service are presented in Figure 28. According to Figure 27, most firms are satisfied with the work of the State Revenue Service in all three Baltic countries. Figure 27, however, reveals that firms’ satisfaction with the State Revenue Service in 2014 has slightly decreased in Estonia, increased in Lithuania and remained approximately the same in Latvia.
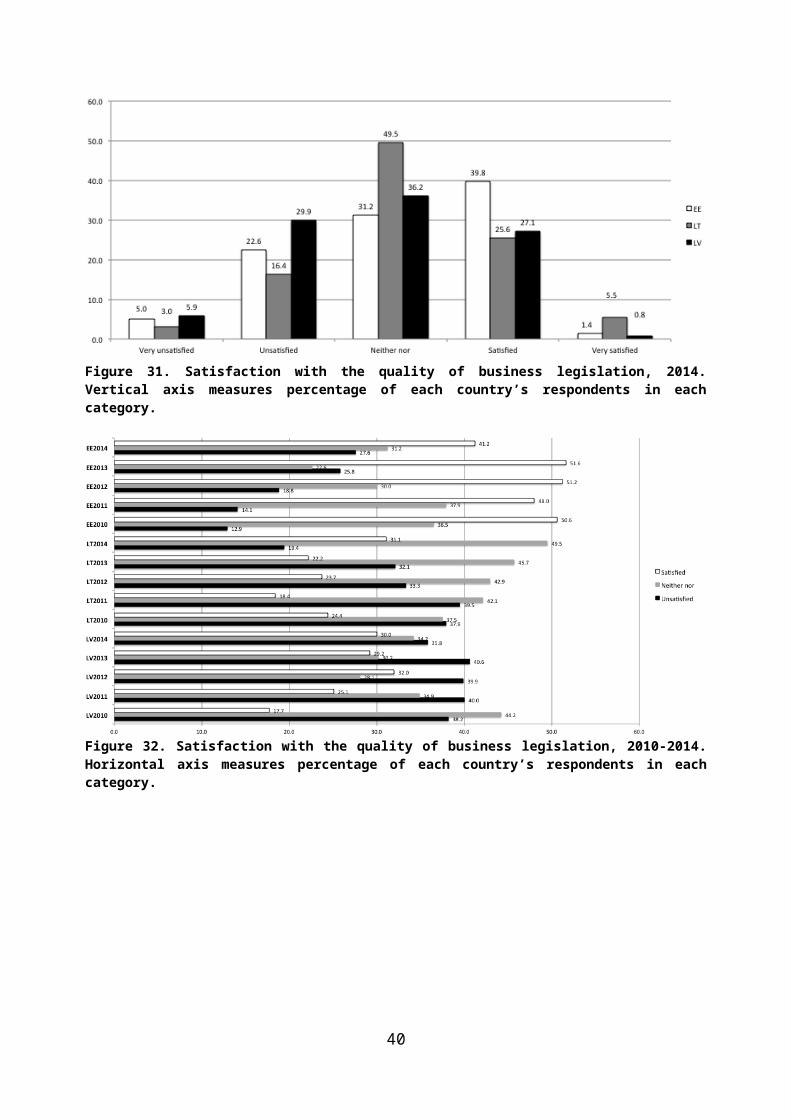
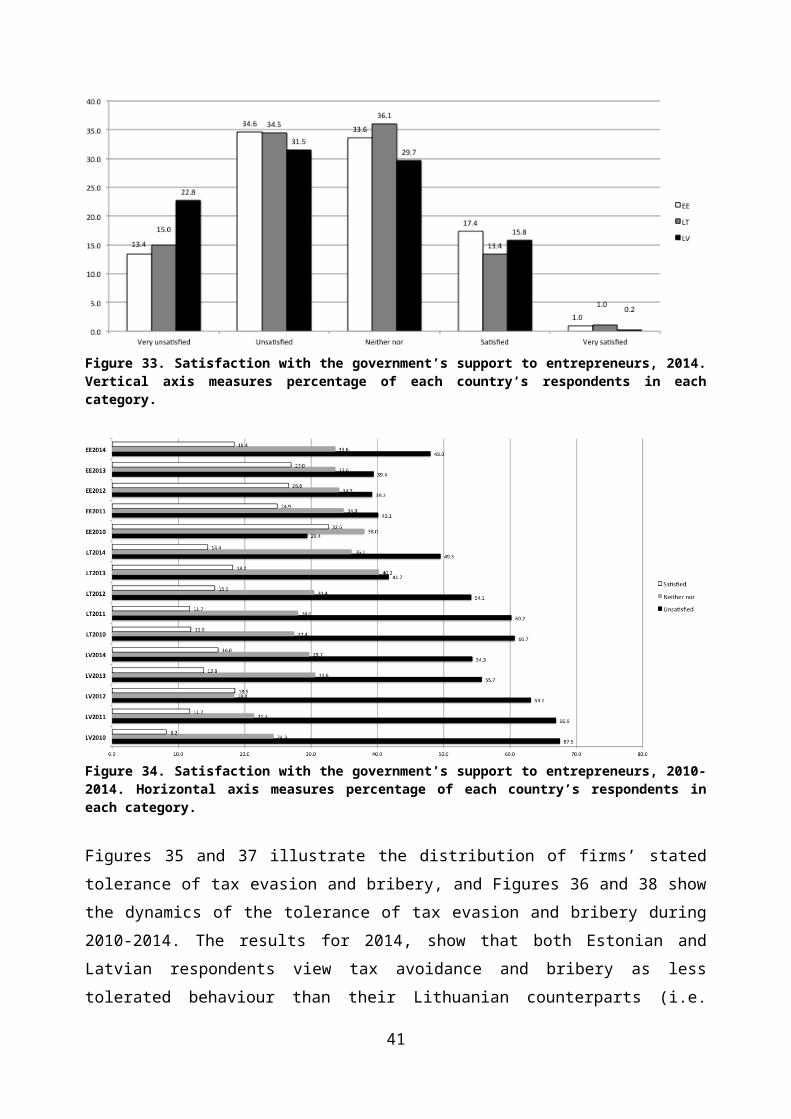
Dissatisfaction with the government’s tax policy in 2014 is highest in Latvia (Figure 29). As illustrated in Figure 30, however, dissatisfaction with the government’s tax policy has been declining in Latvia since its peak in 2010, whereas in Estonia more and more companies are becoming dissatisfied. Also, satisfaction with the quality of business legislation has slightly increased in Latvia and Lithuania and decreased in Estonia, compared to 2013. Regardless of this pattern, perceived quality of business legislation is still highest in Estonia. The dynamics of entrepreneurs’ satisfaction with the quality of government support in Latvia show similar tendencies, yet in Lithuania and Estonia more respondents seem to be dissatisfied in 2014 compared to 2013 (Figure 34).
30

Figure 29. Satisfaction with the government’s tax policy, 2014. Vertical axis measures percentage of each country’s respondents in each category.
Figure 30. Satisfaction with the government’s tax policy, 2010-2014. Horizontal axis measures percentage of each country’s respondents in each category.
31
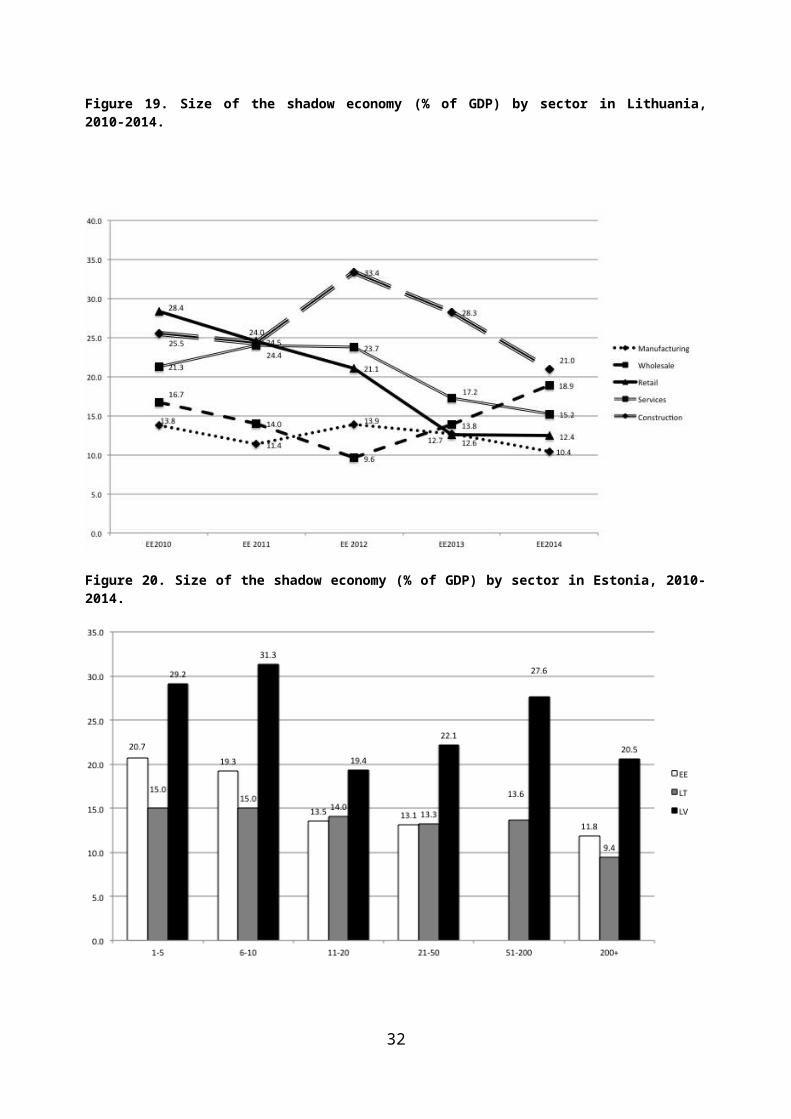
Figure 31. Satisfaction with the quality of business legislation, 2014. Vertical axis measures percentage of each country’s respondents in each category.
Figure 32. Satisfaction with the quality of business legislation, 2010-2014. Horizontal axis measures percentage of each country’s respondents in each category.
32
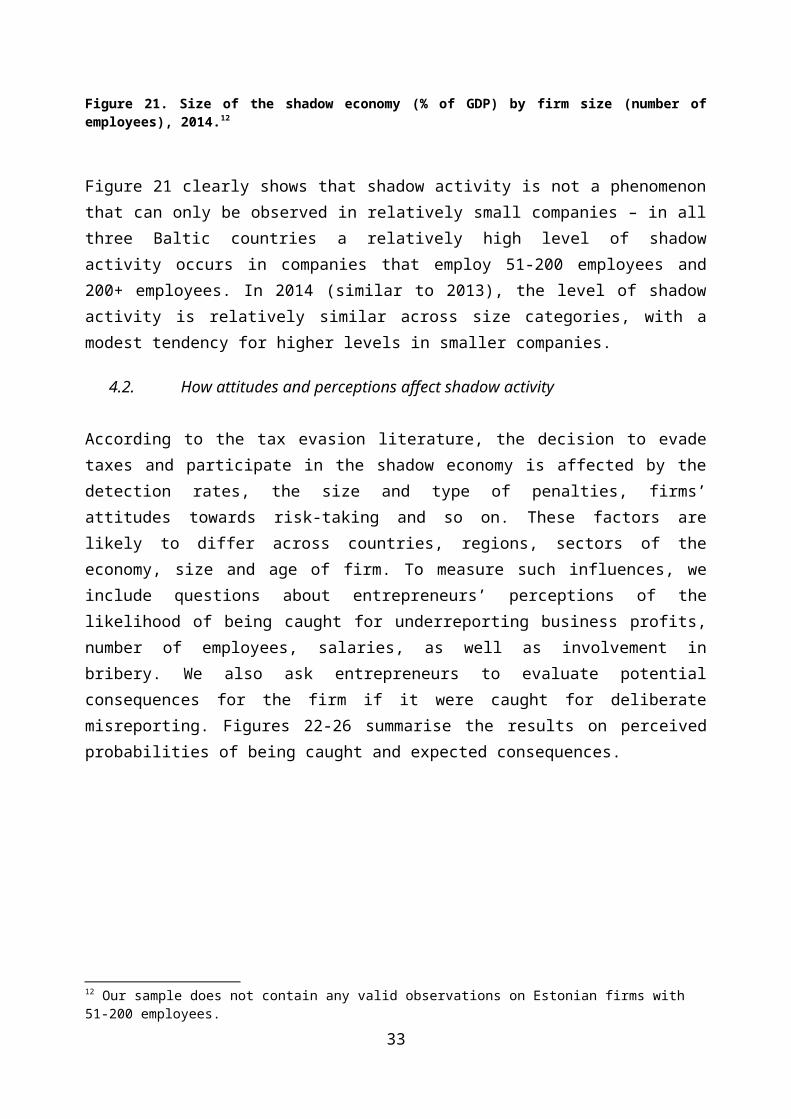
Figure 33. Satisfaction with the government’s support to entrepreneurs, 2014. Vertical axis measures percentage of each country’s respondents in each category.
Figure 34. Satisfaction with the government’s support to entrepreneurs, 2010-2014. Horizontal axis measures percentage of each country’s respondents in each category.
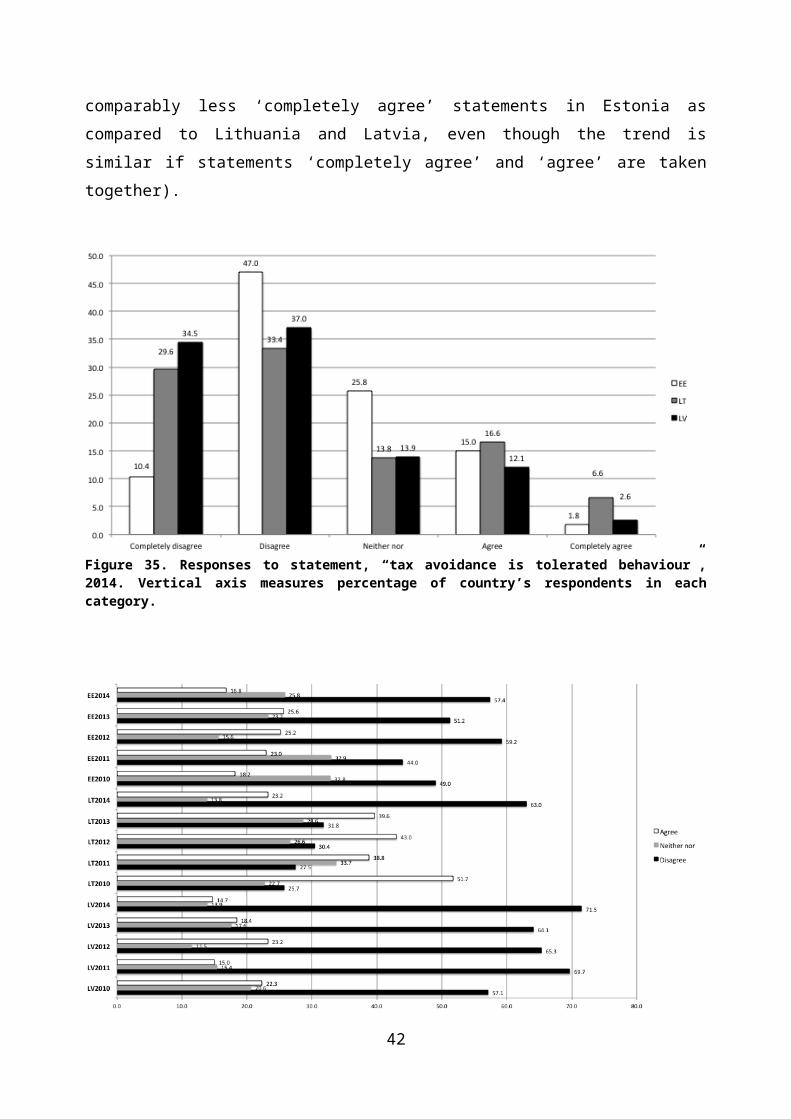
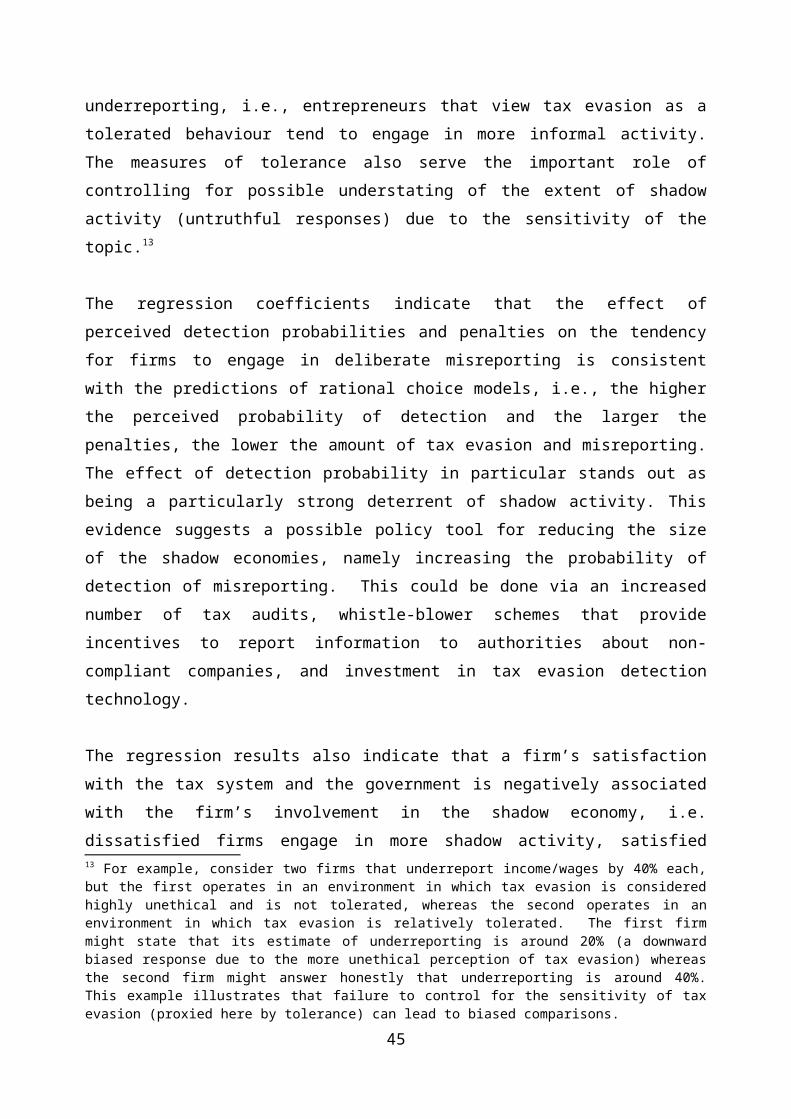
Figures 35 and 37 illustrate the distribution of firms’ stated tolerance of tax evasion and bribery, and Figures 36 and 38 show the dynamics of the tolerance of tax evasion and bribery during 2010-2014. The results for 2014, show that both Estonian and Latvian respondents view tax avoidance and bribery as less tolerated behaviour than their Lithuanian counterparts (i.e. comparably less ‘completely agree’ statements in Estonia as compared to Lithuania and Latvia, even though the trend is similar if statements ‘completely agree’ and ‘agree’ are taken together).
33
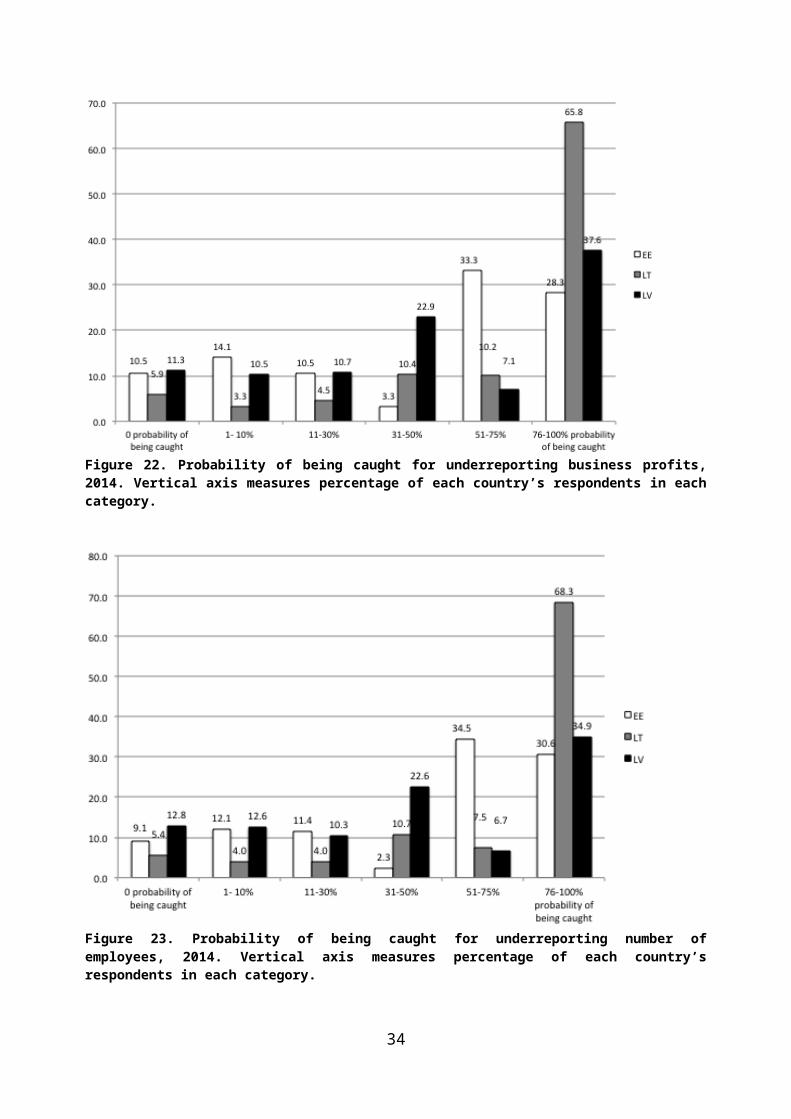
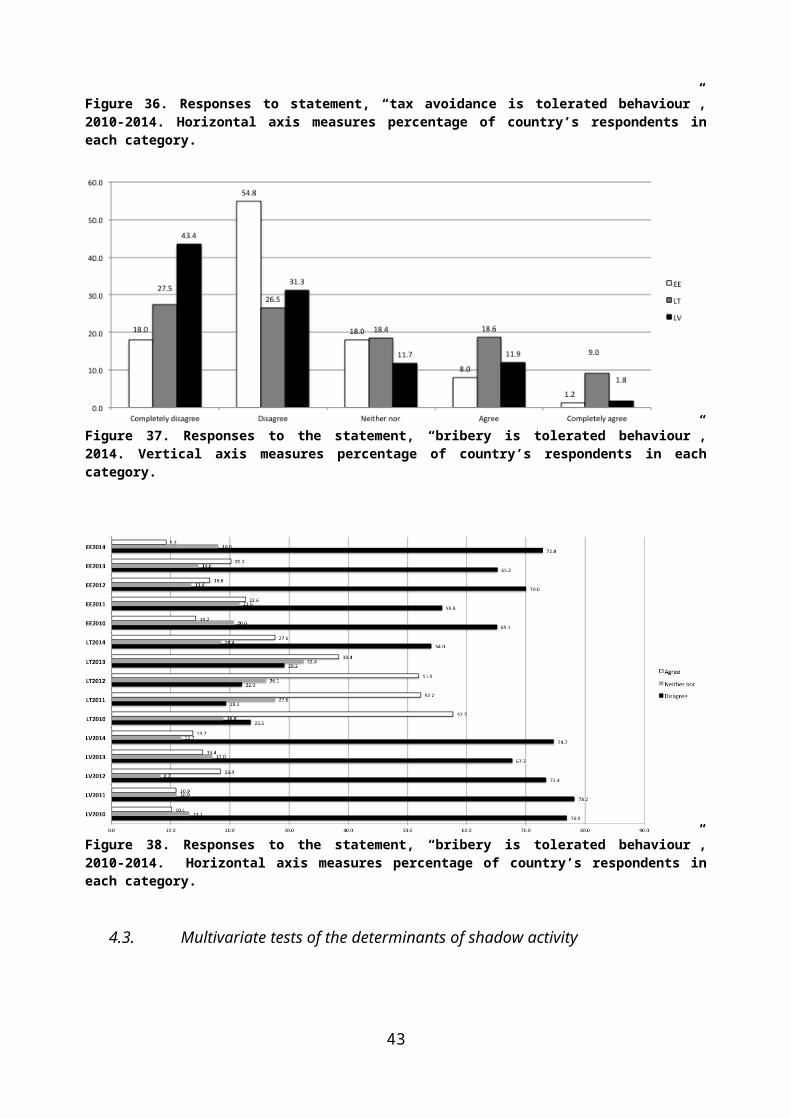
Figure 35. Responses to statement, “tax avoidance is tolerated behaviour”, 2014. Vertical axis measures percentage of country’s respondents in each category.
Figure 36. Responses to statement, “tax avoidance is tolerated behaviour”, 2010-2014. Horizontal axis measures percentage of country’s respondents in each category.
34
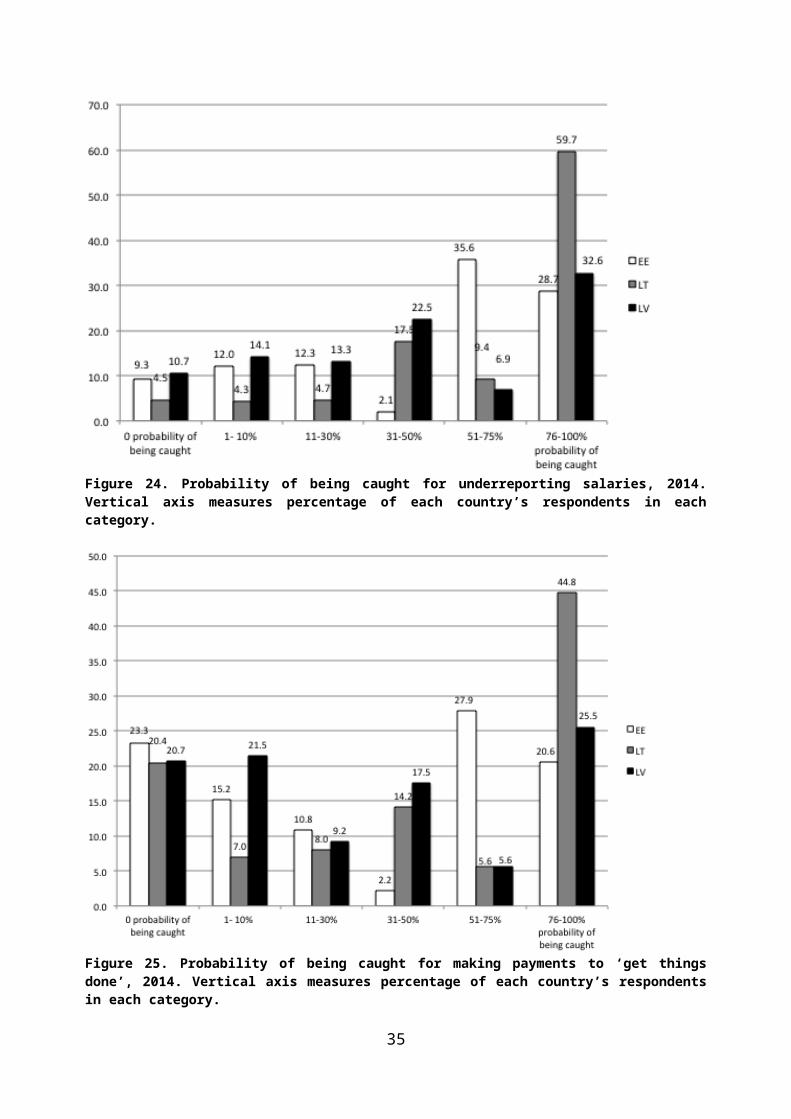
Figure 37. Responses to the statement, “bribery is tolerated behaviour”, 2014. Vertical axis measures percentage of country’s respondents in each category.
Figure 38. Responses to the statement, “bribery is tolerated behaviour”, 2010-2014. Horizontal axis measures percentage of country’s respondents in each category.
4.3. Multivariate tests of the determinants of shadow activity
We use regression analysis to identify the statistically significant determinants of firms’ involvement in the shadow economy. For the regressions, we use pooled data from the past five survey rounds, which gives a panel that spans the years 2010-2014 and has a cross-section of approximately 1,500 firms per year. The dependent variable in all regressions is the level of the firm’s involvement in the shadow economy. The independent variables are various firm-level characteristics, attitudes, sector dummy variables, region and year fixed effects.
35

The regression results are reported in Appendix 3. Model 1 includes most of the measured determinants of shadow activity and dummy variables for Estonian and Lithuanian firms (Latvian firms are the base case). It excludes variables that measure the firm’s perceived probability of being caught for involvement in the shadow economy (DetectionProbability) and the firm’s perceived penalties for being caught (PenaltyForDetection) in order to make use of data from 2010 (the variables DetectionProbability and PenaltyForDetection are only collected from 2011 onwards). Model 2 includes the full set of determinants of shadow activity and thus restricts the sample to 2011-2013. Model 3 replaces the country dummy variables with region dummy variables (with Kurzeme, Latvia, as the omitted category). Model 4 adds year fixed effects. Model 5 replaces Satisfaction with a dummy variable for whether the interview is conducted in Russian language.
The country dummy variables suggest that during the sample period, the size of the shadow economy is smaller in Estonia and Lithuania relative to Latvia after controlling for a range of explanatory factors, and the differences are statistically significant. Tolerance towards tax evasion is positively associated with the firm’s stated level of income/wage underreporting, i.e., entrepreneurs that view tax evasion as a tolerated behaviour tend to engage in more informal activity. The measures of tolerance also serve the important role of controlling for possible understating of the extent of shadow activity (untruthful responses) due to the sensitivity of the topic.13
The regression coefficients indicate that the effect of perceived detection probabilities and penalties on the tendency for firms to engage in deliberate misreporting is consistent with the predictions of rational choice models, i.e., the higher the perceived probability of detection and the larger the penalties, the lower the amount of tax evasion and misreporting. The effect of detection probability in particular stands out as being a particularly strong deterrent of shadow activity. This evidence suggests a possible policy tool for reducing the size of the shadow economies, namely increasing the probability of detection of misreporting. This could be done via an increased number of tax audits, whistle-blower schemes that provide incentives to report information to authorities about non-compliant companies, and investment in tax evasion detection technology.
The regression results also indicate that a firm’s satisfaction with the tax system and the government is negatively associated with the firm’s involvement in the shadow economy, i.e. dissatisfied firms engage in more shadow activity, satisfied firms engage in less. This result is 13 For example, consider two firms that underreport income/wages by 40% each, but the first operates in an environment in which tax evasion is considered highly unethical and is not tolerated, whereas the second operates in an environment in which tax evasion is relatively tolerated. The first firm might state that its estimate of underreporting is around 20% (a downward biased response due to the more unethical perception of tax evasion) whereas the second firm might answer honestly that underreporting is around 40%. This example illustrates that failure to control for the sensitivity of tax evasion (proxied here by tolerance) can lead to biased comparisons.
36

consistent with the descriptive statistics and with previous research on tax evasion, and offers an explanation of why the size of the shadow economy is larger in Latvia than in Estonia and Lithuania; namely that Latvian firms engage in more shadow activity because they are more dissatisfied with the tax system and the government. Analysing each of the four measures of satisfaction separately we find that shadow activity is most strongly related to dissatisfaction with business legislation and the State Revenue Service, followed by the government’s tax policy and support for entrepreneurs.
A natural question to ask is why Latvian companies are more dissatisfied. One explanation is that the business environment (actions of the government and SRS) is less favourable to companies in Latvia. It may also be that the ethnic composition of the country plays a role, as minority groups may feel less engaged in society and involved in the country-level decision making. To test this hypothesis, specifically with respect to the Russian-speaking population in each of the countries, in Model 5 we replace the Satisfaction variable with a dummy variable for whether the interview is conducted in Russian language. Consistent with the hypothesis, Model 5 indicates that the companies of Russian-speaking respondents tend to be involved in a slightly higher (3.6 percentage points) level of shadow activity, controlling for other factors. This effect is moderately statistically significant. Given that Latvia has a proportionally larger Russian-speaking population than Estonia and Lithuania, this result suggests that the mix of ethnicities may contribute to the difference in the size of the shadow economies in the Baltic countries.
Another strong (and statistically significant) determinant of involvement in the shadow economy is firm size, with smaller firms engaging in more shadow activity than larger firms, although the descriptive statistics suggest the relation may be non-monotonic. The statistically significant coefficient on firm age suggests that younger firms engage in more shadow activity than older firms. A possible explanation for these two relations is that small, young firms use tax evasion as a means of being competitive against larger and more established competitors. The sector dummy variables suggest that firms in the construction sector and services tend to engage in more shadow activity than firms in other sectors such as retail. The association between shadow activity and the average wage paid by a firm or a firm’s change in profits (or employees or turnover) is not significant across all specifications.
5. Entrepreneurs’ attitudes regarding shadow activities
In addition to estimating the size of shadow economy and its influential factors, we also elicit entrepreneurs’ opinions regarding various aspects of the shadow economy in the Baltic countries. We believe that some of these data might be useful to policy makers, at least as complementary information.
37
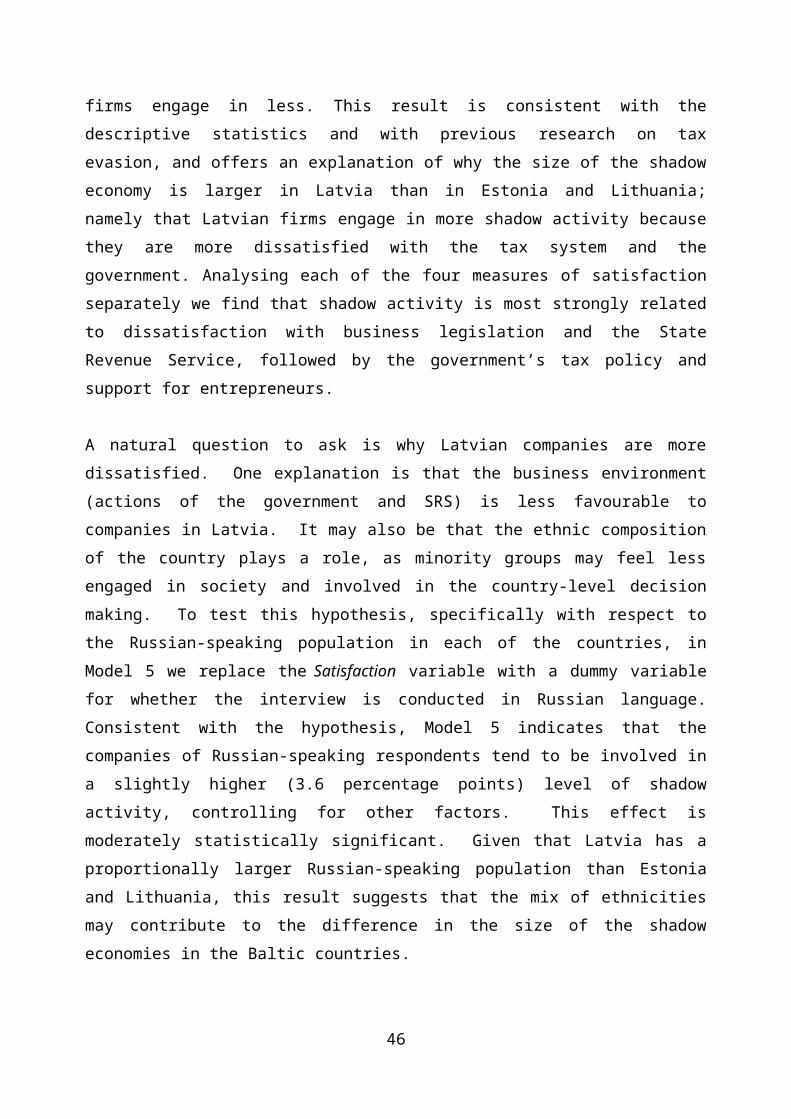
We ask entrepreneurs a number of questions about the motivation for participating in tax evasion. Entrepreneurs are presented with various statements, which they are asked to assess on a 1-7 scale, where ‘1’ represents ‘completely agree’ and ‘7’ represents ‘completely disagree’. The results are summarised in Figure 39. The key finding in 2014 is that Latvian entrepreneurs disagree more with statement that they trust the Government and believe that tax money is spent adequately. Entrepreneurs in Latvia, in contrast to entrepreneurs in Lithuania, but especially in Estonia, also disagree more that to ensure competitiveness of companies it is more appropriate to invest in new products and strategies, rather than evade taxes.
38
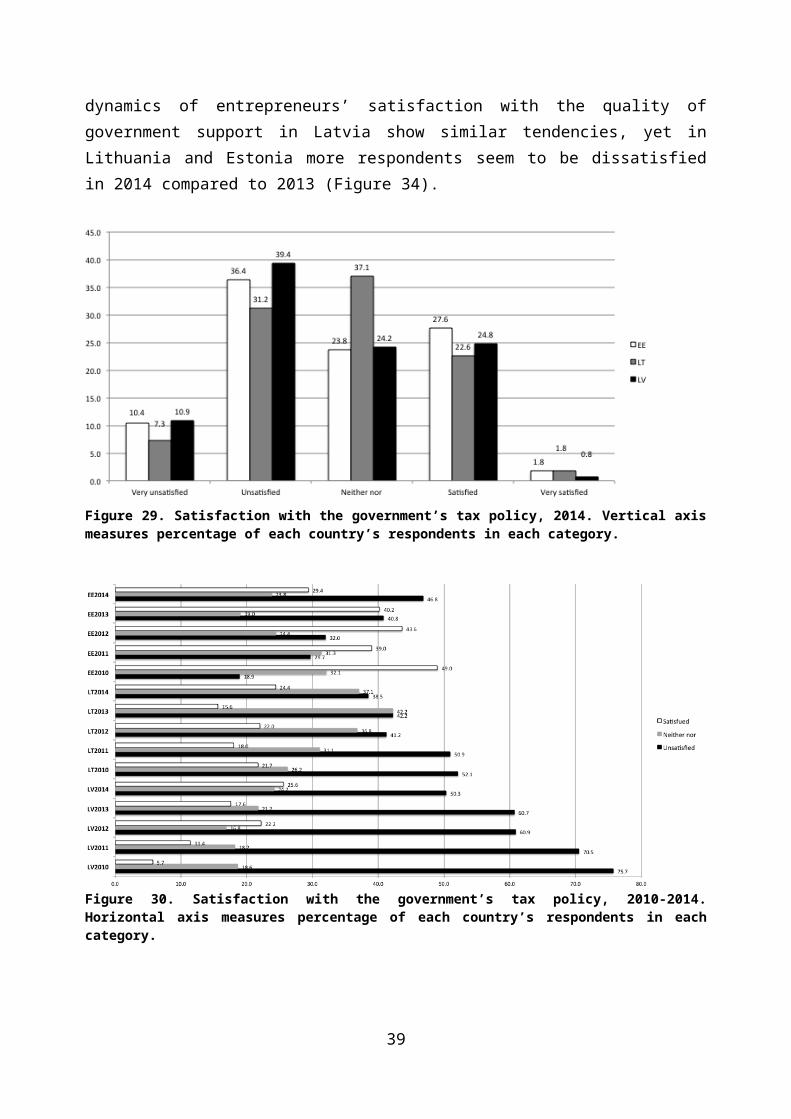
Figure 39. Entrepreneurs’ attitudes regarding tax evasion, 2014.
39
6. Discussion and conclusions
The SSE Riga Shadow Economy Index is estimated annually based on surveys of entrepreneurs in the Baltic countries using a number of surveying and data collection techniques shown in previous studies to be effective in eliciting relatively truthful responses. The Index combines estimates of misreported business income, unregistered or hidden employees, as well as unreported “envelope” wages to obtain estimates of the shadow economies as a proportion of GDP. This report is the fifth in the series and focusses on the shadow economy estimates for the year 2014, as well as trends during the years 2009-2014.
Our first key finding is about trends in the Baltic shadow economies. During 2014, Estonia and Lithuania have continued their long-term trend of gradually reducing the size of their shadow economies. Our estimates suggest that the Estonian and Lithuanian shadow economies contracted by approximately 2.5-2.8 percentage points and now account for 12.5%-13.2% of GDP. The contraction has been across all components of the shadow economies. In contrast, the Latvian shadow economy has remained largely unchanged in aggregate compared to the previous year and is estimated at around 23.5% of GDP. The different dynamics of the shadow economies means that there is now a large difference in their size – the Latvian shadow economy is almost double the size of those in neighbouring countries.
Although in aggregate the size of the shadow economy in Latvia has not changed much in 2014, its composition has changed. Envelope wages have declined, but their contraction is offset by a corresponding increase in corporate tax evasion – companies in Latvia misreport a larger proportion of their business income in 2014 compared to the previous two years. Unreported business income has overtaken envelope wages and now makes up around 46% of the total Latvian shadow economy. By far the worst sector is construction, where shadow activity in Latvia is estimated to be as high as 48.9% (it is also the sector with the highest level of shadow activity in Estonia and Lithuania, but with more modest levels of 21% and 19%). As the Latvian economy continues to recover from the crisis, real estate prices have risen from their post-crisis lows and the construction sector is regaining activity after having almost ground to a halt. The recovery in the construction sector with its high level of shadow activity has offset the declining levels of shadow activity in other sectors. Perhaps in part driven by the influence of the construction sector, Riga is estimated to have the highest level of shadow activity in Latvia in 2014.
When it comes to attitudes, companies continue to be relatively satisfied with the State Revenue Service and relatively dissatisfied with the government’s tax policy and support for entrepreneurs. Latvian companies tend to be slight less satisfied than Estonian and Lithuanian companies overall, but this tendency is changing: the level of dissatisfaction with the government in Latvia has been gradually declining since 2010, whereas it has been increasing in Estonia.
40
Also new in this year’s report are our estimates of the prevalence of unregistered companies. According to our data, unregistered companies make up around 5%-8% of all enterprises. They are most widespread in the construction sector.
This year’s study confirms some of our previous findings regarding what makes Baltic entrepreneurs more likely to operate in the shadow sector and adds some new ones. Firms that are dissatisfied with the tax system or the government tend to engage in more shadow activity; satisfied firms engage in less. This result is consistent with previous research on tax evasion, and has implications for policy measures to reduce the size of the shadow economy. We also find that smaller, younger firms engage in proportionally more shadow activity than larger, older firms, consistent with the anecdotal evidence that tax evasion is used by firms to gain a competitive edge, and that having an edge is important in competing in an established market. Finally, the level of tax evasion and deliberate misreporting among Baltic companies is responsive to the perceived probabilities of being caught and to the expected penalties for being caught. In particular, companies that perceive the probability of being caught as being higher tend to engage in less shadow activity.
Our results have several noteworthy implications. For policymakers, our results highlight the need for continued reforms and actions that combat the shadow economy in particular in Latvia. We believe the widening shadow economy gap between Latvia and neighbouring countries (after the gap was nearly closed in 2012) partly reflects the slow-down in Latvian policymaker efforts in combatting shadow activity. The data from 2011 and 2012 support the notion that large scale and serious efforts to combat the shadow economy can make a difference and reduce the size of the shadow economy. In exchange for financial assistance during the crisis, the Latvian government undertook over 60 different policy actions to combat the informal economy between 2010-2013, with most of the reforms front-loaded, i.e., taking effect in 2010 and 2011. Our estimates of the size of the Latvian shadow economy in previous years are consistent with the notion that the deliberate policy efforts aimed at reducing shadow sector activity were indeed successful; Latvia experienced a large decline in the size of its shadow economy from a peak of 38% of GDP in 2010 to a low of 21% in 2012. However, following the completion of this substantial package of policy actions, Latvian policymaker efforts targeting the shadow economy have substantially subsided. The reduced regulatory/policy effort is likely to have contributed to the ending of the consecutive contractions in the size of the Latvian shadow economy and serves as a strong signal that reducing the shadow economy requires continued effort from policymakers and enforcement agencies such as the State Revenue Service. Now is the time for Latvian policymakers to implement a second large-scale and serious policy package targeting the shadow economy as was done during 2010-2013. The reforms could focus on misreporting of business income, as well as the construction sector, as these are the most problematic parts of the shadow economy.
Our results on the determinants of shadow activity in the Baltic countries suggest a number of approaches for policymakers to reduce the size of the Baltic shadow economies. First, reducing
41
dissatisfaction with the tax system is likely to decrease the size of the shadow economies. Addressing this issue could involve actions such as making tax policy more stable (less frequent changes in procedures and tax rates), making taxes more “fair” from the perspective of businesses and employees, and increasing the transparency with which taxes are spent. Second, increasing the probability of detection is expected to reduce shadow activity. This could be achieved via an increased number of tax audits, whistle-blower schemes that provide incentives to report information to authorities about non-compliant companies, and investment in tax evasion detection technology. Third, we find that the mix of ethnicities also has an impact on the level of shadow economy, possibly as a result of minorities feeling less engaged in society and country-level decision making. Therefore, addressing social cohesion and integration of minorities may also lead to a reduction in the shadow economy.
42
References
Aidis, R.; Van Praag, M. (2007): Illegal entrepreneurship experience: Does it make a difference for business performance and motivation? Analyzing the effects of illegal entrepreneurship experience in Lithuania, in Journal of Business Venturing, 22:2, pp. 283-310.
Baumol, W. (1990): Entrepreneurship: Productive, unproductive and destructive, in Journal of Political Economy, 98, pp. 893-921.
Fairlie, R. (2002): Drug dealing and legitimate self- employment, in Journal of Labour Economics, 20:3, pp. 538-567.
Gerxhani, K. (2007): “Did you pay your taxes?” How (not) to conduct tax evasion surveys in transition countries, in Social Indicators Research, 80, pp. 555-581.
Hanousek, J.; Palda, F. (2004): Quality of government services and the civic duty to pay taxes in the Czech and Slovak Republics, and other transition countries, in Kyklos, 57:2, pp. 237-252.
Kazemier, B.; van Eck, R. (1992): Survey investigations of the hidden economy, in Journal of Economic Psychology, 13, pp. 569-587.
Putniņš, T. and A. Sauka (2014, forthcoming): Measuring the shadow economy using company managers, in Journal of Comparative Economics.
Sauka, A. (2008): Productive, unproductive and destructive entrepreneurship: A theoretical and empirical exploration. Frankfurt am Main: Peter Lang GmbH.
Schneider, F.; Buehn, A. and Montenegro, C. (2010): New estimates for the shadow economies
all over the world, in International Economic Journal, 24:4, pp. 443-461
Warren, E. (2003): Constructive and destructive deviance in organizations, in Academy of Management Review, 28:4, pp. 622–631.
43

Appendix 1. Questionnaire used in 2015.
External influences
1. Please evaluate your satisfaction with the performance of the State Revenue Service with regards to tax administration in 2014.
1 2 3 4 5Very
unsatisfiedUnsatisfied Neither satisfied
nor unsatisfiedSatisfied Very satisfied
2. Please evaluate your satisfaction with the government’s tax policy in Latvia in 2014.1 2 3 4 5
Very unsatisfied
Unsatisfied Neither satisfied nor unsatisfied
Satisfied Very satisfied
3. Please evaluate your satisfaction with the quality of business legislation in Latvia in 2014.
1 2 3 4 5Very
unsatisfiedUnsatisfied Neither satisfied
nor unsatisfiedSatisfied Very satisfied
4. Please evaluate your satisfaction with the government’s support to entrepreneurs in Latvia in 2014.
1 2 3 4 5Very
unsatisfiedUnsatisfied Neither satisfied
nor unsatisfiedSatisfied Very satisfied
5. Tax avoidance is tolerated behaviour in Latvia.1 2 3 4 5
Completely disagree
Disagree Neither agree nor disagree
Agree Completely agree
6. Bribing is tolerated behaviour in Latvia.1 2 3 4 5
Completely disagree
Disagree Neither agree nor disagree
Agree Completely agree
Government policy and amount of informal business
7. Please estimate the approximate degree of underreporting business income by firms in your industry in 2014:
Firms underreported business income by approximately ____ % in 2014.
8. Please estimate the approximate degree of underreporting business income by firms in your industry in the previous year (2013):
Firms underreported business income by approximately ____ % in 2013.
44
9. Please estimate the approximate degree of underreporting number of employees by firms in your industry in 2014: Firms underreported approximately ____ % of the actual number of employees in 2014.
10. Please estimate the approximate degree of underreporting number of employees by firms in your industry in the previous year (2013)
Firms underreported approximately ____ % of the actual number of employees in 2013.
11. Please estimate the approximate degree of underreporting salaries paid to employees by companies in your industry in 2014 (for instance, if in reality an employee receives EUR 400, but the reported salary is EUR 100, then underreporting is 75%; if EUR 400 and EUR 200, then underreporting is 50%):
Firms underreported actual salaries by approximately ____ % in 2014.
12. Please estimate the approximate degree of underreporting salaries paid to employees by companies in your industry in 2013.
Firms underreported actual salaries by approximately ____ % in 2013.
13. On average, approximately what percent of revenue (turnover) did firms in your industry pay in unofficial payments to ’get things done’ in 2014?
In 2014 firms paid approximately ____ % of their revenue in order to get things done.
14. On average, approximately what percent of revenue (turnover) did firms in your industry pay in unofficial payments to ’get things done’ in 2013?
In 2013 firms paid approximately ____ % of their revenue in order to get things done.
15. When other firms in your industry do business with the government, approximately how much of the contract value would firms typically offer in unofficial payments to ’secure’ the contract? (year 2014)
_____%
16. In some industries, in addition to registered companies such as yours, unregistered enterprises also operate but do not report any of their activity to authorities. In your opinion, what percentage of your industry's total production of goods/services is carried out by unregistered enterprises in 2014?_____ in 2013? _____
17. For a typical company in your industry, what would you say is the approximate probability (0-100%) of being caught if the company were to:
(i) underreport its business income? ______%(ii) underreport its number of employees? _____%(iii) underreport the amount it pays to employees in salaries? _____%(iv) make unofficial payments to ‘get things done’? _____%
45
18. If a company in your industry were caught for deliberate misreporting, what would typically be the consequence to that company?
Nothing serious A small fine
A serious fine that would affect the
competitiveness of the company
A serious fine that would put the
company at risk of insolvency
The company would be forced to cease operations
1 2 3 4 5
Company
19. What is the approximate percentage change in your net sales profit, sales turnover and total employment in 2014 compared to 2013?
Net sales profit Sales turnover Total employment
Change (increase or decrease in %) as compared to 2013.For example: +20%, -15%, 0 (no change)
20. In which year did your company start operation?
Year________
21. What is the main activity (i.e. sector) that your company is engaged in?
Manufacturing Wholesale Retail Services (please specify_______________________________ ) Construction Other, please specify…………………..
22. What was the operating profit of your company in 2014? EUR __________
23. How many employees are currently employed in your company (full time equivalent, including you)?
_________ employees
24. Approximately what was the average reported salary in your company in 2014?
____ EUR / month
25. In which region does your company conduct most of its business?
Rīga Kurzeme Vidzeme Zemgale Latgale
46

Attitudes
26. Do you agree that (1 completely agree; 7 completely disagree):
Firms in your industry tend to evade taxes more if they are having relatively bad times (for instance, decrease in profits or turnover in comparison to previous years)
1 2 3 4 5 6 7
Entrepreneurs in your industry evade taxes because this is the only way to survive. 1 2 3 4 5 6 7
Whenever possible, entrepreneurs will try to decrease their business costs, which also includes evading taxes, regardless of how their company performs.
1 2 3 4 5 6 7
Whenever possible, entrepreneurs will try to decrease their business costs, which also includes evading taxes, regardless of the nature of the Government’s entrepreneurship policy in Latvia (state support, tax legislation, etc.)
1 2 3 4 5 6 7
Entrepreneurs in Latvia trust the Government, and believe that their tax money is spent appropriately. 1 2 3 4 5 6 7
Tax evasion is primarily entrepreneurs’ response to what they believe are incorrect actions by the State with regard to promoting entrepreneurship.
1 2 3 4 5 6 7
To ensure successful performance of a company (including survival) it is much more important to have appropriate product and business strategies than to evade taxes.
1 2 3 4 5 6 7
Performance of your company very much depends on the economic situation in the country: your company performs considerably better during economic growth, but during economic recession performance gets considerably worse.
1 2 3 4 5 6 7
Performance of companies in your industry is very much influenced by their choice to pay or evade taxes: by evading taxes firms in your industry considerably increase their profits.
1 2 3 4 5 6 7
Thank you!
47
48

Appendix 2. Observed and non-observed components of GDP.
Notes on some of the components 1-7 follow. Income refers to both business income and employee income. Illegal production (3) includes production of goods/services that are illegal regardless of who produces them (e.g., narcotics, prostitution) and production of goods that themselves are legal but the production is illegal because it is carried out by an unauthorised producer (e.g., unlicensed surgeons, unlicensed production of alcohol). Goods/services that are produced legally (2) can still involve breaches of the law at the registration or reporting stage (e.g., intentional underreporting of profit to evade taxes). Most of the income generated from producing legal goods is reported by registered firms and therefore fully captured in official GDP (6). However, some proportion of income is intentionally hidden from authorities either by not registering the enterprise (5) or by misreporting wages or company earnings (7). Following other studies, we refer to the latter (7) as the ‘shadow economy’, and use the term ‘non-observed’ economy in a broader sense referring to illegal goods/services, activities of unregistered enterprises and the shadow economy.
NON-OBSERVED ECONOMY
OBSERVED ECONOMY
4. Income of REGISTERED
producers
5. Income of UNREGISTERED
producers
3. Income from production of ILLEGAL goods/services
(N2)
6. Income that is REPORTED and fully OBSERVED income
2. Income from production of LEGAL goods/services
1. Income from all economic production (theoretical GDP)
7. Income that is NOT REPORTED
SHADOW ECONOMY UNREGISTERED ENTERPRISE
49
Appendix 3. Regression results.
Table 3. Determinants of firms’ involvement in shadow activity.This table reports coefficients from regressions of firms’ unreported proportion of production (dependent variable; see Section 2 for details of calculation) on various determinants of shadow activity, using the pooled sample of Estonian, Latvian, and Lithuanian firms, between 2010-2014. D_EE, and D_ LT are dummy variables for Estonian and Lithuanian firms, respectively (Latvian firms are the omitted category). Tolerance_TaxEvasion is the firm’s response to Question 5, with higher scores indicating more tolerance. Satisfaction is the first principal component of the firm’s responses to Questions 1-4, with higher scores indicating higher satisfaction with the country’s tax system and government. DetectionProbability and PenaltyForDetection measure the firm’s perception of the probability of being caught for shadow activity and the severity of penalties conditional on being caught (calculated as the first principal component of responses to Questions 17(i)-17(iv), and the response to Question 18, respectively). ln(FirmAge) and ln(Employees) are the natural logarithms of the firm’s age in years and its number of employees. AverageWage is the average monthly salary in EUR paid by the firm. ChangeInProfit is the firm’s percentage change in net sales profit relative to the previous year. D_Wholesale to D_OtherSector are sector dummy variables with manufacturing as the omitted category. D_RU is a dummy variable that takes the value one if the respondent elected to answer the questionnaire in Russian language. ***, ** and * indicate statistical significance at the 1%, 5% and 10% levels. T-statistics are reported in parentheses.
Model 1 Model 2 Model 3 Model 4 Model 5Intercept 36.955***
(15.53)41.197***
(12.83)39.625***
(10.50)36.378***
(9.53)34.585***
(9.10)D_EE -6.395***
(-6.31)-6.467***
(-5.04)D_LT -9.430***
(-8.89)-5.688***
(-4.00)Tolerance_TaxEvasion 1.570***
(4.90)1.208***
(3.18)1.202***
(3.14)1.129***
(2.94)1.388***
(3.71)Satisfaction -1.591***
(-4.32)-1.815***
(-4.03)-1.772***
(-3.81)-1.818***
(-3.96)DetectionProbability -2.196***
(-4.29)-2.155***
(-4.18)-2.057***
(-4.01)-2.230***
(-4.40)PenaltyForDetection -1.130**
(-2.49)-1.114**(-2.48)
-0.995**(-2.23)
-0.777*(-1.74)
ln(FirmAge) -3.891***(-4.96)
-4.582***(-5.07)
-4.430***(-4.80)
-4.016***(-4.37)
-3.852***(-4.20)
ln(Employees) -0.818***(-2.71)
-1.096***(-3.23)
-1.109***(-3.22)
-1.454***(-4.20)
-1.384***(-4.12)
AverageWage -0.001*(-1.96)
-0.001**(-2.29)
-0.002**(-2.54)
-0.001**(-2.35)
-0.002***(-2.72)
ChangeInProfit 0.011***(2.99)
0.017**(2.10)
0.017**(2.06)
0.014*(1.66)
0.016**(1.98)
D_Wholesale 0.385(0.32)
0.338(0.25)
0.078(0.06)
-0.636(-0.46)
-0.553(-0.41)
D_Retail 1.025(0.83)
1.507(1.05)
1.447(1.00)
1.147(0.80)
1.582(1.12)
D_Services 1.717(1.64)
2.097*(1.75)
1.844(1.51)
1.807(1.50)
1.938(1.63)
D_Construction 4.596***(3.49)
5.416***(3.64)
5.624***(3.75)
5.552***(3.73)
5.774***(3.90)
D_OtherSector -0.764(-0.47)
1.321(0.65)
1.323(0.64)
0.830(0.40)
0.870(0.43)
D_RU 3.595*(1.68)
Region fixed effects No No Yes Yes Yes
Year fixed effects No No No Yes Yes
Data 2010-2014 2011-2014 2011-2014 2011-2014 2011-2014
R-squared 10.5% 13.0% 13.9% 15.3% 14.8%
50