sample design and procedures for hepatitis b...
TRANSCRIPT

Sample design and procedures for Hepatitis B immunization surveys:
A companion to the WHO cluster survey reference manual
WHO/IVB/11.12 ORIGINAL: ENGLISH
Immunization, Vaccines and Biologicals

Sample design and procedures for Hepatitis B immunization surveys:
A companion to the WHO cluster survey reference manual
WHO/IVB/11.12 ORIGINAL: ENGLISH
Immunization, Vaccines and Biologicals

ii
The Department of Immunization, Vaccines and Biologicals thanks the donors whose unspecified financial support
has made the production of this document possible.
Steven G. Heeringa; Survey Methodology Program; Institute for Social Research;
University of Michigan, Ann Arbor
Sonja I. Ziniel;Department of Pediatrics; Harvard Medical School, Boston
Division of Adolescent Medicine; Program for Patient Safety and Quality; Children’s Hospital Boston, Boston
This document was produced by the Expanded Programme on Immunization (EPI)
of the Department of Immunization, Vaccines and Biologicals
Ordering code: WHO/IVB/11.12 Printed: April 2012
This publication is available on the Internet at: www.who.int/vaccines-documents/
Copies of this document as well as additional materials on immunization, vaccines and biologicals may be requested from:
World Health Organization Department of Immunization, Vaccines and Biologicals
CH-1211 Geneva 27, Switzerland • Fax: + 41 22 791 4227 • Email: [email protected] •
© World Health Organization 2012
All rights reserved. Publications of the World Health Organization can be obtained from WHO Press, World Health Organization, 20 Avenue Appia, 1211 Geneva 27, Switzerland (tel: +41 22 791 3264; fax: +41 22 791 4857; email: [email protected]). Requests for permission to reproduce or translate WHO publications – whether for sale or for noncommercial distribution – should be addressed to WHO Press, at the above address (fax: +41 22 791 4806; email: [email protected]).
The designations employed and the presentation of the material in this publication do not imply the expression of any opinion whatsoever on the part of the World Health Organization concerning the legal status of any country, territory, city or area or of its authorities, or concerning the delimitation of its frontiers or boundaries. Dotted lines on maps represent approximate border lines for which there may not yet be full agreement.
The mention of specific companies or of certain manufacturers’ products does not imply that they are endorsed or recommended by the World Health Organization in preference to others of a similar nature that are not mentioned. Errors and omissions excepted, the names of proprietary products are distinguished by initial capital letters.
All reasonable precautions have been taken by the World Health Organization to verify the information contained in this publication. However, the published material is being distributed without warranty of any kind, either expressed or implied. The responsibility for the interpretation and use of the material lies with the reader. In no event shall the World Health Organization be liable for damages arising from its use.
The named authors alone are responsible for the views expressed in this publication.
Printed by the WHO Document Production Services, Geneva, Switzerland
iii
Contents
I. Introduction ...............................................................................................................1
1.A Background .........................................................................................................21.B Distinguishing surveys of rare characteristics and surveys of rare ...................
populations ...........................................................................................................31.C Organization of the report .................................................................................4
2. Target populations and survey populations ..........................................................5
2.A Target populations for vaccination coverage and impact assessment of Hepatitis B vaccination programs through serological surveys ...................5
2.B Survey populations ..............................................................................................62.C Survey populations and time ..............................................................................8
3. Sampling frames ........................................................................................................9
3.A Evaluating sampling frame alternatives ...........................................................93.B Household sampling frames based on multi-stage area probability
sampling .............................................................................................................113.C Sampling frames based on population registers ..............................................113.D Sampling frames based on schools enrollments ...............................................113.E Sampling frames based on other population lists ............................................12
4. Choosing a sampling design ..................................................................................13
4.A Conventional area-probability cluster sampling of households ....................144.B Multi-stage clustered sample of children enrolled in schools .........................204.C Clustered sampling based on medical providers, clinics, other non- .................
household units .................................................................................................224.D Some special sampling approaches for immunization program ........................
assessments .........................................................................................................234.E Quota sampling and other non-probability sampling methods.....................26
5. Determining the required sample size ..................................................................28
5.A Specifying the primary analysis objectives.......................................................295.B Determine the required precision for each objective ......................................305.C Determine the required sample size under simple random sampling ..............
(SRS) assumptions .............................................................................................325.D Effects of a complex sample design on sample size .........................................345.E Summary of steps in calculating sample size for complex sample
surveys ................................................................................................................40

iv
6. Total survey error and its impact on immunization surveys ...........................41
6.A Total survey error ..............................................................................................416.B Target population coverage bias .......................................................................436.C Nonresponse bias ...............................................................................................466.D Measurement bias .............................................................................................486.E Processing bias ...................................................................................................51
7. Analyzing data collected through complex sample surveys ............................54
7.A Sampling error computation methods and programs .....................................547.B Sampling error computation models ................................................................567.C Summary: preparation of data files of complex sample surveys .....................57
8. References .................................................................................................................58

1WHO/IVB/11.12
This document is designed to supplement the sample design, sample selection and sample size determination guidance report provided by the World Health Organization (WHO), “Immunization Cluster Survey Reference Manual” (WHO, 2005). All information is presented with a focus on sero-prevalence surveys that are used to assess Hepatitis B vaccination program impact as well as surveys that are used to assess Hepatitis B vaccination program performance. In particular, we will emphasize how to measure low prevalence population characteristics, such as Hepatitis B surface antigen (HBsAg) in countries with low Hepatitis B endemicity (<2% HBsAg).
Hepatitis B vaccine programs have been widely implemented over the past decades and were able to decrease the percentage of chronic Hepatitis B infections and liver cancer among children (Chang et al. 1997, Mast et al. 2004, see table 1.1). In fact, two regional offices of the WHO have declared prevalence targets of chronic Hepatitis B virus infections. The Western Pacific Regional Office (WPRO) declared in 2007 to reduce chronic hepatitis B infection in children aged at least five years to <2% by 2012 as an interim milestone towards the final goal of <1% (WPRO 2005). The Eastern Mediterranean Regional Office (EMRO) aims at a reduction of chronic Hepatitis B virus infections to less than 1% among children less than 5 years of age by 2015. The WPRO has even established a certification procedure to document national achievement of Hepatitis B control (WPRO 2007). One of the requirements for certification is that at least one representative serosurvey measuring the HBsAg rate in the selected population (e.g. birth cohorts after the introduction of a national Hepatitis B vaccination program) is conducted. This document is written as an aid to researchers and health professionals who are preparing to conduct such a Hepatitis B vaccination program impact assessment or HBsAg sero-prevalence survey.
The emphasis of this report lies on using probability sampling methods for population surveys; however, we wish to acknowledge at the outset that a population survey is not the only tool and in some cases not the best tool for measuring the effectiveness of a vaccination program. Depending on the specific objectives of the study, assessments based on administrative systems or procedures involving monitoring by medical clinics and public health agencies may be more cost effective and less labor intensive than one-time population surveys. Examples are studies by Mele et al. (2008) and Madani (2007) who used population-based surveillance systems to measure the incidence of acute Hepatitis B infections. It should also be noted that specific considerations have to be made when a conventional population survey is used to assess extremely low prevalence conditions (<1-2%) because it is likely that nonsampling errors may bias the final prevalence estimate. This report will introduce readers to the concepts of nonsampling errors and guide them in adjusting their sample design to minimize biases introduced in the final prevalence estimate.
I. Introduction

Sample design and procedures for Hepatitis B immunization surveys: A companion to the WHO cluster survey reference manual2
It should generally be noted that although the focus of this report is on Hepatitis B immunization coverage and sero-prevalence surveys, the methods described can also be applied to other immunization surveys or epidemiological studies of rare population characteristics.
1.A Background
Why do surveys of rare population characteristics or events require special sample designs or survey procedures? First, conventional sample designs and traditional survey methods that work very well in a general, multi-purpose study may not be efficient for a survey of rare events and conditions. Second, the relative importance of sampling bias and nonsampling errors to the total survey error of the data is much greater when the outcomes of interest are not common in the target population of the survey. Finally, traditional survey procedures may not be cost effective for surveys of rare events and conditions.
Historically, the WHO’s Expanded Programme on Immunization (EPI) cluster survey method (Henderson and Sundaresan, 1982) was developed to be low cost and practicable and to deliver useful but not highly precise estimates of vaccination rates in target populations. The original EPI cluster survey method certainly proved practical and popular. In a 1994 paper, Brogan et al. cite a total of 4502 documented uses of the survey method reported to the WHO. The EPI cluster survey method or simple modifications of the basic method have been important tools in rapid assessments of progress in the worldwide efforts in vaccinating children and adults against infectious diseases. As progress in immunization coverage for target populations has been achieved, epidemiologists and health planners are conducting assessments of immunization programs that are much more statistically demanding than the quick coverage surveys conducted under the EPI cluster survey method.
Part of the challenge in the design of contemporary surveys to evaluate Hepatitis B vaccination programs can be attributed to the very effectiveness of these programs in achieving vaccination coverage in infants and reducing the levels of chronic infection in children and the population at large. Table 1.1 is an excerpt from Mast et al. (2004) that illustrates this point.
Table 1.1: Effectiveness of HepB vaccination in reducing the prevalence of chronic HBV infection (HBsAg positive) (Mast et al., 2004)
Study Site Follow-up Years
HepB3 coverage
achieved %
% chronic infection,
before HepB vaccination
% chronic infection,
after HepB vaccination
Alaska1 1-10 96 16 0.0
Gambia2 9 100 10 0.6
Italy3 6-14 95 6.8 0.7
Taiwan4 6 92 10.5 1.7
1 Harpaz et al. (2000), 2 Viviani et al. (1999), 3 DaVilla et al. (1998), 4 Hsu et al. (1999)
3WHO/IVB/11.12
Prior to the introduction of the HepB vaccination program, 16% of the Alaskan population studied by Harpaz et al. (2000) had a chronic HBV infection. Based on follow-ups conducted one to ten years following the program introduction, chronic infections had virtually disappeared from the study population. Chronic infection rates in the Taiwanese population studied by Hsu et al. (1999) went from 10.5% in the pre-program years to 1.7% by six years following the start of a mass vaccination effort.
Chronic infections in as few as 1-2% of the population constitute a rare event. Likewise, a child that is not vaccinated in a population where vaccination coverage exceeds 97% is “rare”. The terms, “rare event” or “rare condition”, do not have formal statistical definitions. In this document, these terms will be used to refer to events (e.g. a new viral infection) or conditions (e.g. presence of antibodies) affecting from <1% to 10% of the survey population.
1.B Distinguishing surveys of rare characteristics and surveys of rare populations
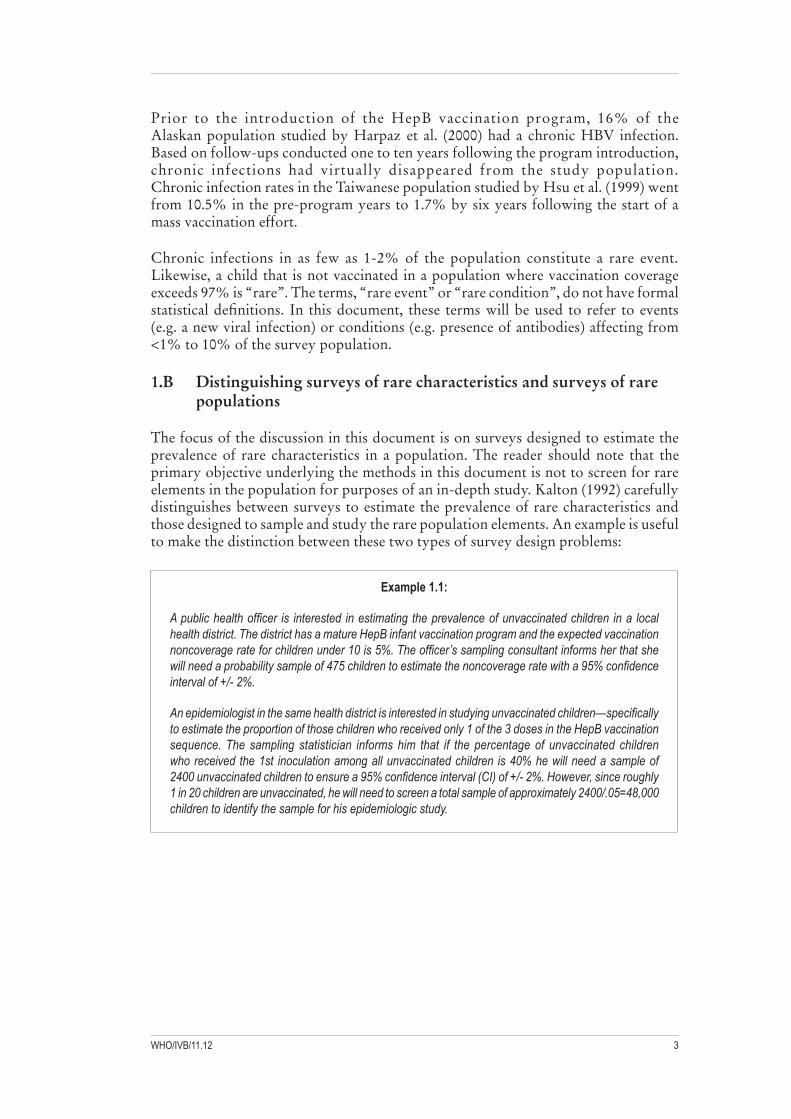
The focus of the discussion in this document is on surveys designed to estimate the prevalence of rare characteristics in a population. The reader should note that the primary objective underlying the methods in this document is not to screen for rare elements in the population for purposes of an in-depth study. Kalton (1992) carefully distinguishes between surveys to estimate the prevalence of rare characteristics and those designed to sample and study the rare population elements. An example is useful to make the distinction between these two types of survey design problems:
Example 1.1:
A public health officer is interested in estimating the prevalence of unvaccinated children in a local health district. The district has a mature HepB infant vaccination program and the expected vaccination noncoverage rate for children under 10 is 5%. The officer’s sampling consultant informs her that she will need a probability sample of 475 children to estimate the noncoverage rate with a 95% confidence interval of +/- 2%.
An epidemiologist in the same health district is interested in studying unvaccinated children—specifically to estimate the proportion of those children who received only 1 of the 3 doses in the HepB vaccination sequence. The sampling statistician informs him that if the percentage of unvaccinated children who received the 1st inoculation among all unvaccinated children is 40% he will need a sample of 2400 unvaccinated children to ensure a 95% confidence interval (CI) of +/- 2%. However, since roughly 1 in 20 children are unvaccinated, he will need to screen a total sample of approximately 2400/.05=48,000 children to identify the sample for his epidemiologic study.
Sample design and procedures for Hepatitis B immunization surveys: A companion to the WHO cluster survey reference manual4
This example illustrates an important point. If the population characteristic is rare, preferred sample designs and survey procedures for estimating the prevalence of the rare characteristic in a general population may be very different from those for a study that aims to study traits and risk factors of the subset of individuals who possess that rare characteristic. Optimal sample designs for the latter epidemiological survey of affected individuals will emphasize screening efficiency--often at the price of increased sampling variance and nonsampling errors. Techniques such as disproportionate sampling, dual-frame sampling (Hartley, 1962 and 1974) or multiplicity sampling (Sirken, 1970 and 1972) may be employed to more effectively screen for eligible members of the rare population of interest.
1.C Organization of the report
Including this brief introduction, this report is organized in seven chapters with each chapter covering a specific aspect of the survey design, implementation and analysis for Hepatitis B immunization surveys. Each chapter makes extensive use of references to existing WHO guidance documents as well as several recent, readily available publications by the United Nations and other international agencies. Survey population definitions and sampling frames for vaccination coverage or sero-prevalence surveys are covered in Chapters 2 and 3. Chapter 4 describes the advantages and disadvantages of the major classes of sample design methods that can be used in immunization surveys. Sample size determination and complex sample design effects for immunization surveys are covered in Chapter 5. Because nonsampling error is such an important consideration in surveys of rare characteristics, Chapter 6 presents an in-depth discussion of total survey error and its nonsampling error components. Chapter 7 provides guidance on procedures and programs for estimation of sampling errors for complex sample designs that are typically used in immunization surveys.

5WHO/IVB/11.12
The process of designing a sero-survey begins with the specification of the survey objectives and the designation of the population that will be the “target” for estimation and inferences that are based on the final sample data. What population subgroup is included in the target population is always dependent on the survey objectives and the measurements that are used. The goal of a sero-survey should always be to measure a (random) sample of every individual that is per definition included in the target population. Due to practical issues it might, however, not be possible to achieve this. In this case, it is necessary to define a survey population from which the sample ultimately can be drawn. This chapter reviews the possible target populations and survey objectives for Hepatitis B sero-prevalence surveys as well as possible restrictions that might require defining a survey population.
2.A Target populations for vaccination coverage and impact assessment of Hepatitis B vaccination programs through serological surveys
The main goal for any survey is to acquire high quality sample data that enables estimation of statistics, e.g. the prevalence of HBsAg, in the target population as defined by the research team. A target population must be defined in terms of (1) content, (2) units, (3) extent and (4) time (Kish 1965, p.7). These specific characteristics of the target population are dependent on the objective of the survey.
Generally, Hepatitis B sero-surveys are conducted for two reasons. The first one is to establish baseline prevalence; the second one is to assess the prevalence after a vaccination program has been introduced and either comparing it to the baseline prevalence or across subgroups of the population. Comparing different prevalence estimates allows making conclusions about the success of a vaccination program in the general population and in subgroups. It should be noted, however, that a comparison is only feasible if the two surveys have been conducted in similar ways.
The specific statistics of interest that can be used to assess the impact of a Hepatitis B vaccination program will also determine how the target population is defined. Table 2.1 provides a number of examples of possible target populations for Hepatitis B sero-prevalence surveys for a number of different statistics of interest.
2. Target populations and survey populations

Sample design and procedures for Hepatitis B immunization surveys: A companion to the WHO cluster survey reference manual6
Table 2.1: Target populations for Hepatitis B vaccination program assessments
Statistic of Interest Target Population
HepB birth dose coverage Children 12-23 months of age
HepB3 coverage Children 12-23 months of age
Population with HBsAg, AntiHBc, etc. Children, young adults ≥3 years of age
2.B Survey populations
Ideally, the target population to which we want to draw inferences and the survey population from which we will draw a sample are the same. In practice, however, there are geographical, political, social and temporal factors that restrict our ability to identify and access individual elements in the complete target population and the coverage of the survey is limited to the survey population. Examples of geographic restrictions on the survey population could include persons living in remote, sparsely populated areas such as islands, deserts or wilderness areas. Rebellions, civil strife, governmental restrictions on travel can limit access to populations living in the affected areas. Homelessness, institutionalization, military service, nomadic occupations, physical and mental conditions and language barriers are social and personal factors that can affect the coverage of households and individuals in the target population.
The timing of the survey can also affect the coverage of the target population. The target population definition for a survey assumes that the data are collected as a “snapshot” in time. For example, the target population for a survey of children may be defined to be 5-9 year-olds living in the immunization program implementation area as of January 1, 2006. In fact, the survey observations will be collected over a window of time that spans weeks or even months (e.g. January 1 to May 31, 2006). For populations that remain stable and relatively unchanged during the survey period, the time lapse required to collect the data may not lead to bias for target population estimates. However, if the population is not stable, considerable change can occur during the window of time that the survey population is being observed. For example, if the survey takes place during the growing season the coverage of migratory agricultural workers and their children can be greatly affected.
The following examples provide information about how previous studies have defined the survey population to represent the target population of the study with regard to content, units, extent, and time.

7WHO/IVB/11.12
Example 2.1:
Reference: Chongsriswat et al. (2006)One of the objectives of this survey was to establish the prevalence of Hepatitis B surface antigen (HBsAg) carriers among children <18 years of age. The target population is therefore defined as all children <18 years of age (content), from all types of families (units) living in Thailand (extent) in 2004 (time). The survey population, however, includes all children attending well baby clinics or outpatient clinics in provincial and district hospitals (content), from all types of families (units), living in one of four selected provinces (Chiangrai, Udon Thani, Chonburi, and Nakhon Si Thammarat) in Thailand (extent) between May and October 2004 (time).
Example 2.2:
Reference: Jain and Hennessey (2009)The objective of this survey was to assess Hepatitis B vaccination coverage through health care providers reported immunization histories. The target population was defined as all teenagers aged 13-17 years (content) living in households (units) in the United States (location) in 2006 (time). The survey population, however, was defined as all teenagers aged 13-17 years who can provide contact information of their vaccination providers (content), living in households with a telephone landline (units) in the United States not including the territories (location) between October 2006 and February 2007 (time).
In surveys of rare conditions or events, potential noncoverage bias due to identification or access restrictions that apply to the target populations deserves special attention (see Chapter 6). Rare events and conditions may not be uniformly distributed in the target population. Infectious diseases, lack of immunization and other disease risk may be geographically clustered, concentrated in social and language groups, or exhibit seasonal variation that coincides with sources of noncoverage.
Subject to obvious constraints on the survey budget, necessary steps to avoid serious noncoverage in studies of rare events and conditions include:
Avoid major exclusions of geographic subareas of the target population.•
Design survey procedures and staff training to maximize coverage of hard to •identify or difficult to access population elements.
Plan survey materials and translate questionnaires to accommodate major ethnic •minorities and language groups in the target population.
Consider the timing of the survey data collection and how seasonal residential •and work patterns may affect the survey population coverage of the target population.

Sample design and procedures for Hepatitis B immunization surveys: A companion to the WHO cluster survey reference manual8
2.C Survey populations and time
Surveys that are repeated in time (longitudinal survey programs, pre/post comparison surveys) or replicated across areas for comparative purposes require that special attention be given to maintaining consistency in the definition of the survey population. This is particularly true for surveys of rare events that we have noted may be seriously affected by the time of year that the survey is conducted as well as demographic and geographic exclusions from the survey population.
Example 2.3:
A study of Hepatitis B immunization coverage is planned for a regional population of children. The health agency that is responsible for the study has defined the target population for the survey to include all children age 5-9 that reside in the region. After evaluating sample design and frame alternatives, the survey planners choose to employ enrollments in the region’s government-operated primary schools as the basis for the sample selection (see Section 4.B below). The survey population is therefore restricted to children in the target age range who are formally enrolled in a public school. Age-eligible children who do not attend school (due to e.g. the gender of the child or the non-existence of schools in the area), who are schooled at home or attend a private school therefore belong to the noncovered segment of the target population. Such sample noncoverage can introduce bias to the final study data if the excluded children have different rates of immunization from their public school counterparts (see Chapter 6).
Sample noncoverage can even extend to the sampling of students within publicly operated schools. Student enrollments in schools are highly dynamic with many students changing schools as their families change residence. Some students enroll late or leave early to fulfill work obligations to family farms and businesses. For these and other reasons, a student list that is prepared on November 1st of a school year will be different than one prepared September 1st. The recommended practice for selecting samples from student enrollment lists is to create the list frame at a point in the school year when the annual enrollments have stabilized. This is often assumed to be 1 to 2 months after the start of the annual school year.

9WHO/IVB/11.12
The WHO Cluster Survey Reference Manual describes in detail a cluster sampling technique using an area-based sampling frame. This chapter introduces sampling frames that might be considered as alternatives to an area sampling frame for immunization coverage or sero-prevalence surveys.
Sampling frames are rarely simply available for use. It is also rare that a sampling frame can be constructed with one step. Most often, several steps are needed to construct a sampling frame that represents the target population of a nation. The sampling methods used for building these sampling frames and drawing those samples are known as multi-stage sampling procedures and the resulting samples are called multi-stage samples. Groups of individuals that occur during the sampling can either be called strata or clusters. Strata are defined as distinct subpopulations that are formed to ensure that each subpopulation will contribute sufficient individuals to the sample. Definition criteria can be geographic characteristics (e.g. rural vs. urban), administrative differences (e.g. private vs. public schools), or individual characteristics (e.g. gender, socio-economic status, or age). Criteria that are used to define strata are generally hypothesized to be correlated with the survey statistic of interest, for example the prevalence of HBsAg. Clusters, however, are usually encountered as part of the sampling frame or they are formed for efficiencies in survey implementation. Natural clusters can be schools and class rooms in a school based sampling frame. Villages and households are clusters that are naturally encountered in area probability sampling frames. Clusters that are formed for efficiency and cost reductions can be geographical areas that are defined as the basis for the Expanded Programme on Immunization (EPI) cluster survey method (Henderson and Sundaresan, 1982).
3.A Evaluating sampling frame alternatives
Sampling frames are lists or enumeration procedures that allow identifying every individual of the target population (Kish, 1965; Kalton, 1983).1 The simplest form of a sample frame is a target population list or database in which each individual of the target population is uniquely identified. Before choosing a sampling frame for immunization coverage or sero-prevalence surveys, the survey coordinator should carefully consider the following aspects that are important to potentially increase the quality of and decrease bias in the collected data.
1 It is assumed that the target population has been redefined to be equivalent to the survey population. We will use from here on the term “target population”.
3. Sampling frames

Sample design and procedures for Hepatitis B immunization surveys: A companion to the WHO cluster survey reference manual10
Target population: 1)
Immunization surveys typically focus on three quite different target populations: Infants, school-aged children, and adults. Different types of sampling frames can be more or less suitable for these different target populations.
Frame coverage: 2)
The selected sampling frame should provide the highest possible coverage of the target population by including as many target population members as possible. Incomplete frames that miss target population members or frames that include individuals who do not fit in the target population definition or frames that include individuals more than once should be avoided. Given certain circumstances these errors can lead to biases (see Section 6.B).
Timeliness and quality of information:3)
It is critical to use a sampling frame that is up to date (not obsolete). In addition, the information in the sampling frame (e.g. addresses, stratifying variables, size measures) is as accurate as possible. As described above, target populations are not static. Therefore, the older the sampling frame is the greater the likelihood that the sampling frame will be out-of-date and the data for target population members will be inaccurate.
Cost of updating, development, and use:4)
It is rare that the information included on sampling frames is completely current. The fact that a frame is out-of-date doesn’t mean that it cannot be used. In some instances, it is possible to update the frame information before the sample is selected. For example, in area probability samples of households it is possible to use a procedure, called the half-open interval, to update the frame for small amounts of new housing construction (Kish 1965). In other cases, updating a sampling frame can be too costly or time consuming and might not be feasible. When a survey team has the option of using an existing sampling frame, the costs of updating that frame must also be weighed against the substantial costs of building a completely new frame for the target population. Frame choice can also affect the costs of actual survey data collection. If the target population is spread across a large geographic area, a frame that does not allow these individuals to be clustered into smaller geographic areas prior to sample selection will lead to high field travel costs because selected individuals cannot be efficiently assigned to interviewers. A frame that has high coverage of the individuals in the target population, but lacks detailed address information, will require added time and effort to track and locate the sample individual for the interview.
The following sections briefly review the various sample frame options that may be applicable to selecting a sample of individuals for immunization coverage or sero-prevalence surveys.

11WHO/IVB/11.12
3.B Household sampling frames based on multi-stage area probability sampling
Household frames based on area sampling can be used for all different types of target populations—infants, children and adults (see Section 4.A). Area probability sampling frames have universal application to studies of populations living in households. Procedures for developing a multi-stage area probability sampling frame are well documented (Kish, 1965) and statistical agencies and researchers worldwide have extensive experience in using area frames for demographic and epidemiologic surveys.
Example 3.1:
Liang et al. (2009) constructed their sampling frame by dividing 160 disease surveillance points in 31 provinces of China into 6 major regional groups (strata). Each disease surveillance point was defined by a county. Overall, 369 townships were randomly selected from these counties (1-4 per county) using simple random sample. As a next step, one village was randomly selected from each township. The final step for building the sampling frame consisted of the enumeration of all residents from 1 to 59 years old within the selected villages. This list of all residents in the different villages was used as the sampling frame for the sero-survey.
As this example shows, area probability frames generally provide a very high level of coverage for household populations. The primary disadvantage to area probability sample frames is that they require a substantial amount of time and effort to develop.
3.C Sampling frames based on population registers
Many countries, regions or states maintain population registers for administrative or other purposes although the coverage and quality of these registers varies widely depending on the country and the purpose for which they are developed and maintained. Sampling frames based on administrative or population registers can be used for samples of any age group provided all individuals enter the register at birth and the lists are carefully maintained as listed individuals grow older. If the register is maintained at the national level, it is possible to select a stratified random sample of the target population directly from the list. For registers maintained on a local level or in cases where a stratified random sample from a national register would not permit a cost effective survey, a primary stage sample of local administrative units could initially be selected. A second stage cluster of eligible individuals could then be selected from the population registers for selected sample localities.
3.D Sampling frames based on schools enrollments
If the target population of the immunization survey is school-aged children and school enrollment among all age-eligible children is close to 100% across the whole country it is convenient to use school registers as a sampling frame. Usually the lists of students within each school are not merged into one national list of students. Therefore the most common approach is to select a primary stage sample of schools from a master data base and the select a second stage sample of students from the enrollment registers for each school (see section 4.B).

Sample design and procedures for Hepatitis B immunization surveys: A companion to the WHO cluster survey reference manual12
It is not uncommon in developing countries that school enrollment is variable based on the gender of the child or on the socio-economic status of the family. In these situations, it is not recommended to use school registers as sampling frames because survey estimates are likely to be not representative of the general population and potentially biased.
Example 3.2:
One study that used a school-based sampling frame is the sero-survey conducted in Mongolia in 2004 (Davaalkham et al., 2007). The country was first divided into five initial strata: one metropolitain area and four regions. Each region was further then further divided into the province center and rural Soums. Lists of public schools existed for the metropolitain area, the province centers and the Soums. Overall, 25 schools were selected. As a next step, two classes were selected from a list of all second grade classes and all students in these selected classes were included in the sample.
3.E Sampling frames based on other population lists
Besides administrative population and school registers it might also be feasible to use other types of population lists as a sampling frame. Election registers, for example, can be used as a frame for immunization surveys among adults if the vast majority of the adults are listed in these election registers. Depending on circumstances in individual countries and localities, possible lists that can be considered as a sampling frame are tax roles maintained by local governmental units, postal delivery lists, patient lists for medical clinics and providers, household addresses from utility providers (electricity, water providers, etc.). Before selecting such a list as a sampling frame for an immunization survey, the survey team should carefully evaluate its quality using the four criteria listed at the beginning of this chapter.
13WHO/IVB/11.12
Several sampling approaches are available to health professionals tasked with planning a Hepatitis B immunization coverage or sero-prevalence survey. The alternative approaches differ in the nature of their sampling frames (see Chapter 3) and the taxonomy of their design features: stratification, clustering, sampling rates, number of sampling stages and sampling phases. The plans also differ in their ancillary data requirements, time and costs to develop and the level of statistical sophistication required to implement the method and to analyze the data once it is collected.
It should be noted that the recommended approaches described in this section are all based on probability sampling methods if not otherwise noted. A probability sampling approach needs to be able to assign each person of the survey population a known, non-zero sampling probability. This ensures that every person has the chance to be selected into the sample and that this probability is known so that estimates for the population can be adjusted using sampling weights. Surveys fulfilling these conditions are classified as probability sample surveys and have two advantages over all other non-probability sampling methods. First, they permit us to compute unbiased estimates of population characteristics, and second we are able to characterize the uncertainty (sampling error) of these estimates based only on the known properties of the sample design and the survey data. It is important to recognize that no single probability sampling approach is optimal for all immunization studies. Each approach has specific advantages and disadvantages depending on the survey population, the quality and availability of appropriate sampling frames, the survey budget and resources and the specific objectives of the survey program. Therefore, different sampling designs should be considered when planning an immunization coverage or sero-prevalence survey.
The following subsections describe major sampling approaches that could be used in a Hepatitis B immunization coverage or sero-prevalence study:
Multi-stage (clustered) area probability sampling of households. •
Multi-stage, clustered sampling of children enrolled in schools.•
Multi-stage sampling based on clinics, medical practices, and related units.•
• SpecialMethods
The final section is this chapter discusses non-probability sampling methods such as quota sampling, convenience sampling, respondent driven sampling or “snowball sampling”. While such methods may occasionally be used for exploratory or developmental studies, for reasons outlined in the final section, we do not recommend their use in scientific studies of immunization coverage or program effectiveness because their approach does neither allow us to compute unbiased estimates of population characteristics nor to characterize the uncertainty of the estimates.
4. Choosing a sampling design

Sample design and procedures for Hepatitis B immunization surveys: A companion to the WHO cluster survey reference manual14
4.A Conventional area-probability cluster sampling of households
Section A.2.1.5 of the WHO Cluster Survey Reference Manual outlines procedures for multi-stage cluster sampling of households. Multi-stage sampling becomes necessary if a list of all members of the survey population is not available. Since this is usually the case, several sampling designs have been developed to draw subsequent, also called multi-stage samples. A potential respondent is identified by drawing a sample of higher-level units such as districts, followed by a sample of counties within each of the sampled districts, and followed by a sample of households within each of the sampled counties. For over six decades, multi-stage, area probability sample designs (Kish 1965) have been the mainstay of scientific survey research in the areas of demography, fertility, epidemiology and other health-related disciplines. Area probability sample designs include the classification of a geographic area, e.g. a whole country, into smaller areas which are then sampled in the first stage of a multi-stage, area-probability sample design.
Figure 4.1: Examples of stages of area-probability sample design
Primary sampling units (PSU) covering geographically the whole survey populationTotal number of units: ANumber of sampled units: a
Secondary stage sampling units covering (geographically) each of the selected PSUsTotal number of units within each sampled PSU: BNumber of sampled units within each sampled PSU: b
Examples:• Counties• Enumeration areas• Districts
Examples:• Enumeration areas, wards or smaller administrative units within the sample districts• Households in the sampled enumerations areas
The WHO’s Expanded Programme on Immunization (EPI) cluster survey method (Henderson and Sundaresan, 1982) is itself a very simple two-stage cluster sample design developed to be low cost and practicable and to deliver useful but not highly precise estimates of vaccination rates in target populations. Several authors have proposed improvements in basic features of the original EPI cluster survey method (Lemeshow et al. 1985; Brogan et al. 1994; Turner et al. 1996; Milligan et al. 2004). The improvements suggested by these authors have focused on changes in sample frames, sample selection and estimation procedures which bring the method more in line with “best practices” for probability sampling of populations and improve the ability of the survey design to develop sample estimates that have increased levels of precision and reduced potential for unwanted bias.

15WHO/IVB/11.12
The aim of this report is not to repeat the critical analysis of these very capable statisticians and epidemiologists but instead to review updated guidance on the cluster survey method as presented in the revised WHO “Immunization Cluster Survey Reference Manual” as it applies to Hepatitis B immunization coverage or HBV sero-prevalence surveys.
The general advantages of the multi-stage area probability sampling approach for immunization coverage and sero-prevalence surveys are:
Coverage: 1)
There is usually a high degree of coverage for household survey populations because sampling frames are usually constructed or at least updated during the survey process and in theory all households can be sampled.
Infrastructure: 2)
Established sampling frames and expertise in national or local statistical agencies are also potentially available. Survey planners are encouraged to seek the assistance of professional survey researchers in national or regional statistical agencies. Often, these agencies are willing to share their expertise and many are able to share an existing sampling frame at a reasonable cost to the immunization survey program.
Cost: 3)
Clustering of sample households can be used to reduce household screening costs and the follow-up travel costs for medical specialists and technicians (i.e. nurses, phlebotomists) required in collecting blood specimens.
Flexibility: 4)
This approach allows screening sample households based on specific eligibility criteria. The method applies for studies of all ages including infants, children and adults.
Access: 5)
Respondents can be conveniently interviewed in their own homes.

Sample design and procedures for Hepatitis B immunization surveys: A companion to the WHO cluster survey reference manual16
The specific disadvantages of choosing the multi-stage area probability sampling of households for Hepatitis B immunization surveys are:
Screening efficiency: 1)
Large numbers of sample households may need to be screened to identify the required number of eligible infants, children or adults for the sample.
Statistical efficiency: 2)
Immunization coverage or infections (e.g. current infection measured by HBsAg and Anti-HBc) may not be randomly distributed in the population but geographically clustered (Lemeshow 1985). Cluster sampling of households becomes statistically inefficient through larger standard errors that increase as the degree of “clustering” of the population characteristic increases. If there is strong a priori evidence that the object of the survey investigation is highly concentrated in a small number of geographic pockets, it may not be feasible to obtain precise prevalence estimates and confidence intervals using a conventional multi-stage sample of households. In such cases, adaptive sampling methods (Thompson 1997) as described in section 4.D.5 might be considered.
Screening nonresponse: 3)
Household sampling approaches that require screening to identify eligible population elements face additional screening nonresponse. Due to cultural norms, crime risks or other reasons, household members may be unwilling to speak to a strange interviewer and list all the household members so that household members eligible for the survey cannot be identified.
Efficient procedures for multi-stage sampling of households are covered in detail in a number of texts and guidance documents (Kish 1965 and 1989; WHO 2005; United Nations 2005). However, it is important to emphasize several areas that require special attention in designing a multi-stage, area probability sample of households for a Hepatitis B immunization coverage or sero-prevalence survey.
Multi-stage design:
The EPI cluster sampling procedure specified a two-stage sample design—a primary stage sample of geographic clusters followed by a second stage sample of households within these geographic clusters. Unless travel costs are prohibitive, a two-stage design that employs many smaller geographic primary stage units and smaller subsamples of eligible subjects per geographic cluster is preferred. This design decreases the overall degree of clustering and hence decreases the sample size needed for the study (see Chapter 5). A common multi-stage sample design mistake is to draw a very small sample of very large geographic areas at the primary stage of the sampling process (e.g. 4 of 13 states, 12 of 30 regions). Such designs have all the properties of a multi-stage probability sample, but their statistical efficiency is poor due to increased standard errors because of the small number of clusters. If the geographic area spanned by the survey population is large and a three- or four-stage design is required, it is recommended to choose primary sampling units (clusters at the primary stage of the sampling design) that are many in number and to select a sample at this first stage with no fewer than 30-40 of the clusters (primary sampling units (PSUs)).
17WHO/IVB/11.12
Primary sampling units (PSUs):
The choice of PSUs or “first-stage clusters” used in the primary stage of sample selection must balance two seemingly conflicting criteria: geographic clusters should be large enough to contain a population that is heterogeneous with respect to the survey variables of interest, e.g. the prevalence of HBsAg, yet small enough to minimize the travel-related costs of data collection through the clustering of the potential sample members. In many countries, the enumeration areas (EAs) used by national statistical agencies in the census of the population are good primary stage units. Census population data is most of the time readily available for these enumeration areas and they have well-defined geographic boundaries. As noted above, in cases where more than two sampling stages are used, it is not acceptable to use a design in which the selected primary sampling units constitute a very small sample of very large geographic regions of the survey population.
Example 4.1:
A public health official is designing a multi-stage probability sample of households in a region that spans 1000 kilometers. She has determined that a total sample of n=1000 households is required to meet the precision requirements for her study which will estimate HepB immunization coverage for the total population and its major subgroups. To efficiently organize the work loads and travel schedules for the interviewing teams, she considers two options:
1) a two-stage sample with a primary stage sample of a=100 EAs and roughly b=10 households per EA: the first-stage clusters, or primary sampling units, consist of enumeration areas (EA) while the second stage of the sample consists of households in those sampled enumeration areas.
2) a three-stage sample with a primary stage sample a=50 of A=500 districts, b=5 EAs per sample district, and approximately c=4 households per EA: the primary sampling units are districts, the sampling units of the second stage consist of enumeration areas in the selected districts followed by the third-stage sampling units, the households in these selected enumeration areas.
In this example, the second design option may be the cost-effective alternative. In general practice, the optimal choice for the number of sampling stages and the allocation of the total sample to each stage is determined by the cost structures and the clustering of the population characteristic to be estimated in the survey population. Kish (1965) is a good source for readers interested in optimal designs and sample allocation for multi-stage surveys.
Stratification:
Stratification serves several purposes in multi-stage samples of households. It can be used to improve the precision of a probability sample of a fixed size or it can serve to facilitate the administration of the survey. The WHO Cluster Survey Reference Manual discusses sample stratification in Section A.2.1.4, highlighting its advantages and disadvantages. For Hepatitis B immunization coverage and sero-prevalence surveys it is important to note that the key statistics to be estimated in the survey are usually prevalence rates (proportions). After the implementation of an immunization program, the values of these prevalence estimates will be small ( ˆ 0.1p < ). Unfortunately, significant stratification gains are difficult to achieve for estimates of this type (Kalton 1992).

Sample design and procedures for Hepatitis B immunization surveys: A companion to the WHO cluster survey reference manual18
Preferred method for sampling of households:
To achieve the highest sample quality, the preferred method for sampling households within sampling units (primary or higher-stage sampling units) is to begin with an enumerative list of the households in the selected enumeration or local area unit. Kish (1965) describes procedures for housing unit enumeration or listing that can be applied in most every setting including densely settled urban neighborhoods as well as sparsely settled villages and rural areas. A simple random sample or systematic random sample of the housing unit addresses is then selected from the enumerative listing and provided to the field interviewers for contact, screen, and interview of eligible sample individuals. Strict control is exercised over the original sample selection. Interviewers contact pre-designated sample households and are not permitted to substitute a new address for a sample household that cannot be contacted or refuses to participate.
Random walk method:
The original EPI cluster survey methodology recommended that the random walk method be used to sample households within primary sampling clusters (Lemeshow, 1985). A random walk sampling does not require a complete listing of the housing units in the sample cluster. Instead, it is based on selecting households by walking a route through the cluster that begins at a predetermined starting point and follows established rules of travel out from that point. As the interviewer walks this route, they follow instructions to select and contact every 1 in K (e.g. 1 in 4) housing units along that route. Despite its apparent “randomness” and objectivity, the random walk is technically not a probability sampling method. Even when its rules are strictly followed the probabilities of selection for individual housing units are unequal and more importantly they are not known. Brogan et al. (1994) and Turner et al. (1996) describe the potential sources of bias associated with the random walk method. The actual extent of bias (if any) that results from the use of the random walk method to select sample housing units is not known and cannot be measured.
Household Screening:
Immunization surveys typically focus on specific population subgroups, e.g. infants, school children, and adults. When household frames are used to select final respondents it is possible that not every sample household includes members of the target population, (e.g. many household do not have a 12-23 month-old child). In these cases households must be screened for eligibility before the survey can be conducted. The screening of the household is performed at the first contact with the household. One of two methods is then used to determine if one or more eligible persons reside in the household. The first method is to ask a direct question of the household reporter, e.g. “Do any children age 12-23 months old live in this household?”. The second method requires the interviewer to ask questions of the reporter to create a roster of all household members and to record key variables (e.g. age, gender) needed to determine if each household member is eligible for the survey, or not.

19WHO/IVB/11.12
The process of household screening has several important implications:
The initially needed sample size of households to be screened for the survey must •be adjusted according to the estimated household eligibility rate in order to reach the specified sample size of n respondents. For example, assume that census data show that 15% of the households have at least one child who is eligible for an immunization coverage survey. The total sample of households must therefore be inflated by a factor of 1/0.15=6.67 in order to screen a specified sample size, n, of eligible children.• Screening interviews have to be designed carefully because the enumeration of all household members can be perceived as threatening. This can increase refusals in the subsequent main interviews. The survey coordinator should therefore select the least invasive screening question and be prepared to explain the purpose of the screening interview.Screening procedures can only work properly if the informant lists truthfully •all the people that are living in the household contacted by the interviewer. The interviewer should encourage respondents to communicate enumeration problems and help the respondent to understand the household definition as used by the survey.
The recommended steps for a multi-stage area-probability sample of households are therefore:
Determine the statistically necessary sample size of respondents and adjust it 1) based on the eligibility rate of respondents within households (if screening is necessary) and the expected percentage of respondents and/or households that will be nonrespondents.Select geographical units that cover geographically the whole target population, 2) also called PSUs. Choose the geographical units in a way that they are large in number and represent small geographical areas.Select second-stage sampling units that cover each PSU and can be sampled.3) Select higher-stage (i.e. primary and secondary stage) sampling units until it 4) is possible to enumerate households or get a list of them for the highest-stage sampling unit. Typically two or three stages of sampling will be required to select the probability sample of households.Determine the number of units to be sampled at each stage to reach the sample 5) size, adjusted for nonresponse and eligibility rates.Sample the determined number of PSUs, 6) a, among all PSUs, A. Sample the determined number of second-stage sampling units, 7) b, from all second-stage sampling units, B, within each of the sampled PSUs.Continue until higher-sampling units contain households as the next level.8) Determine if list of households exists within highest-stage sampling unit and if 9) this list needs to be updated; or if households should be enumerated.Send interviewer to screen household for eligible survey respondents.10) Whenever possible, use an equal probability of selection (EPSEM) method to 11) select the final sample of households, see Kish, 1965; or Cochran, 1977 for the preferred technique in which units are sample with probability proportionate to size (PPS) in all of the initial stages and households are selected with probability inversely proportionate to size in the final stage of sample selection.
Sample design and procedures for Hepatitis B immunization surveys: A companion to the WHO cluster survey reference manual20
4.B Multi-stage clustered sample of children enrolled in schools
Multi-stage sampling of schools and students is an appropriate design option for Hepatitis B sero-prevalence surveys or other immunization studies where school-aged children comprise the study population. The advantages of a school-based approach to sampling children include:
• Cost:
Sample selection is relatively low cost and can be statistically efficient.
• Authority:
Sample recruitment through schools can provide an added element of “legitimacy” and improve parents’ receptivity to the survey request.
• Surveylocation:
Schools may be used as centralized data collection sites.
The disadvantages to a school-based approach are:
• Nonresponse:
Unless there is strong governmental support or a directive, local school administrators may refuse to participate in the survey.
• Noncoverage:
Not all eligible children in the study population may be enrolled in a school. School enrollment may vary geographically, by tribe, by the gender of the child, or by socio-economic status of the family. Sample frames for religious or private schools may be incomplete or not available to the research team. In addition, if schools have been used as a basis for the implementation of the vaccination program and attendance of eligible children is not 100%, bias is likely to be present in prevalence estimates and the effectiveness of the immunization program might be overestimated.
School-based sampling of children can therefore be both statistically efficient and cost effective provided:
• The research team has the support of government officials and schooladministrators to use schools as a basis for selecting eligible children and obtaining parental permission to include the sample children in the study.
• Current school names, location and contact information for each school areavailable in a central database or such a database can be efficiently constructed from regional or local sources. Ideally, this database will include counts of student enrollments by grade or by age as well as additional data on school characteristics that may be used to improve the efficiency of sample stratification and selection.
If these prerequisites are met, the recommended steps in the design and implementation of a two-stage school-based survey of children are:
Determine the total required sample size, including numbers of schools to select 1) and average number of students to select per school (Section 5.D);

21WHO/IVB/11.12
Secure permission and access to the database for the primary stage sampling of 2) schools;
Stratify the frame of school units;3)
Select a sample of schools with probability proportionate to size (PPS) where the 4) measure of size for each school is the count of enrolled students who are eligible for the survey (Kish, 1965; Cochran, 1977);
Compile a roster of eligible students for each sampled school;5)
Select the second stage “cluster” of students from each primary stage sample 6) school at a pre-determined sampling rate to achieve an equal probability sample of students (Kish, 1965);
Initiate the process for contacting parents, obtaining consent and collecting the 7) data and specimens.
As suggested by this seven-step process, the design of a multi-stage sample of schools and students has many similarities to the development of a two-stage sample of households. The following paragraphs contain a few observations on how to improve the effectiveness of a multi-stage sample of schools and students.
Multi-stage design:
If the survey population includes a large geographic area such as an entire country or a major region, it may be necessary to employ a three-stage design—an initial sampling of geographic primary stage units (e.g. municipalities and rural administrative districts), a second stage sample of multiple (e.g. 2-4) schools within each sampled geographic PSU and a third stage sample of students with the selected schools. In general though, researchers should consider a two-stage sample—a primary stage sample of schools from the frame database followed by a second stage sample of students within the primary stage sample of schools.
Primary sampling units:
For two-stage sample designs, the logical primary sampling unit is the individual school facility. If a local area is served by many very small schools, individual school facilities can be combined before selection to create a multiple school PSU that meets a minimum size criterion (e.g. a minimum of 20 eligible students in the combined school unit).
Stratification:
Stratification of the sample selection can be employed at both the primary stage (e.g. stratification by school location or school type) and the second stage (e.g. stratification by gender) if appropriate stratification variables are present on the school frame or on the student lists that are used in sample selection.
Sample size determination:
In a two-stage design, a cluster of students will be selected from each sample school. Therefore, sample size calculations must include an adjustment for the intraclass correlation for students who attend the same school (Section 5.D).

Sample design and procedures for Hepatitis B immunization surveys: A companion to the WHO cluster survey reference manual22
4.C Clustered sampling based on medical providers, clinics, other non- household units
The previous section described the potential advantages of school-based sampling when school-aged children comprise the target population of interest. A primary advantage of the school-based approach is that is provides direct, controlled access to the survey population and avoids the costs and some of the potential nonsampling error (noncoverage, nonresponse) associated with a household sampling and screening for eligible population members. Occasionally there may be special circumstances in which sampling of medical providers, clinics and other nonhousehold organizations could be used as the basis for an immunization coverage or sero-prevalence survey.
Survey planners should be open to the possibility of using a two-stage approach that samples such units or organizations and then subsamples eligible population members that are uniquely linked to these organizations. However, special caution is needed in reviewing these options. Surveys and other studies of clinical populations or “populations under care” are very susceptible to selection bias if a large share or special subgroups of the target population are not patients, clients or affiliates of these units or organizations.
If the survey team ascertains that the selection bias associated with this approach is not a serious threat to the validity of the data or is acceptable for the intended purpose (e.g. monitoring for gross change, see Malison et al.,1987), the implementation of the sample design follows the same sequence of steps as a school-based sampling of children:
Determine total required sample size, including numbers of clinics/units to select 1) and average number of individuals to select per unit (Section 5.D);
Develop a database for the primary stage sampling of the clinics/units;2)
Stratify the primary stage frame of units (optional);3)
Select a sample of units with probability proportionate to size (PPS) where the 4) measure of size for each unit is the count of eligible individuals affiliated with the unit (Kish, 1965; Cochran, 1977);
Compile a roster of eligible individuals associated with each sampled unit;5)
Select the second stage “cluster” of eligible individuals from each primary stage 6) sample unit at a pre-determined sampling rate to achieve an equal probability sample of eligible individuals (Kish, 1965); and
Initiate the process for obtaining consent and collecting the data and 7) specimens.
One variation on this approach that can be considered for prospective studies of infants and young children is to select a sample of clinics or health care providers that routinely participate in the care of pregnant women or newborns and to then recruit a sample of women from these clinics and providers for longitudinal follow-up. The design and aims of this procedure are illustrated by the following example.

23WHO/IVB/11.12
Example 4.2:
Medical facilities, health providers and public health clinics in the immunization coverage area all participate in an intensive program to reach expectant mothers and provide a basic program of pre-natal and post-natal care. When the HepB immunization program is launched in this area, the program directors also plan a future coverage survey that will assess compliance with the full HepB vaccination schedule. The survey will be administered when the first infants eligible for the program reach three years of age. To prepare for the survey, a sample of a=30 facilities, providers and clinics providing pre-natal care to the expectant mothers is selected. A sample of b=20 pregnant women is selected from each selected pre-natal care provider and is asked to consent to be recontacted in future years for a follow-up study. Detailed recontact information is obtained for this prospective sample and updated until the three years have elapsed and mother/child pair is recontacted for the immunization coverage survey.
Such prospective cohort studies offer a number of advantages. The procedure efficiently pre-identifies a sample of the eligible population. There are also important statistical advantages to such a design, not the least of which is the ability to survey the mother/child pair at multiple points in the child’s development and build a longitudinal profile for a sample of children with known risk factors. The main disadvantage to such prospective cohort recruitment designs is that they do not cover eligible population members that are not patients of a clinic or a health provider. Generally, it is expected that selection bias is inherent in cohort studies and that these studies have great limitations when results should be generalized to the whole population. In addition, eligible women and children who are initially recruited may also be lost to follow-up or later refuse to participate when the actual survey is fielded.
4.D Some special sampling approaches for immunization program assessments
The appeal and acceptance of the original WHO EPI Cluster Survey Method (Henderson and Sundaresan, 1982) was its simplicity and general utility as a tool for assessing immunization survey coverage. As noted above, today’s immunization surveys face tougher demands for information and greater statistical challenges in the design and conduct of surveys that have to be able to answer those more difficult questions. By the same turn, today’s health research professionals are better prepared due to worldwide experience with immunization and other epidemiologic surveys, better and more universal training in research methods and improved software for survey design and analysis. The following sections briefly describe several advanced methods that, depending on objectives and circumstances, could be employed in immunization survey assessments. Survey programs that are interested in considering one of these special approaches are encouraged to consult with a specialist in survey statistics who can guide them through the more complicated design steps and assist in the analysis of the resulting survey data.

Sample design and procedures for Hepatitis B immunization surveys: A companion to the WHO cluster survey reference manual24
4.D.1 Disproportionate sampling of strata
A sample that is proportionately allocated to well-defined strata of the survey population generally has better sample precision (lower standard errors) than an unstratified sample of equivalent size. In immunization survey populations where the prevalence of the characteristics of interest differ greatly across the strata, a disproportionate allocation of the sample to the design strata may result in additional improvements in precision for sample estimates (Cochran, 1977). Kalton (1992) describes the potential gains from such optimal allocation sample designs, noting that for estimates of prevalences or other proportions that major improvements in precision can only be achieved if the range of prevalences across strata is great and the proportions of the population in each of the individual strata are also relatively large.
A more common use of disproportionate sampling of strata in an immunization survey would be to deliberately increase the sample size for a subpopulation of interest to achieve the sample size necessary for calculating survey estimates with a determined precision. An illustration of a sample design that disproportionately oversampled the rural population stratum to increase the precision of prevalence estimates for that geographic domain is given in Example 5.3 (below). Survey planners appreciate the flexibility to oversample smaller subpopulations. It can provide them increased precision for sample estimates for special groups such as administrative regions within the catchment area or urban/rural domains of the survey population. However, they may not realize that this flexibility to over- or under-sample specific strata of the survey population results in a loss of precision for weighted population estimates that combine sample observations across strata. Section 5.D (below) describes the “design effect” that disproportionate sampling and weighting have on the standard errors of total sample estimates.
4.D.2 Multiple-frame samples
Probability samples for immunization surveys can be selected using multiple frame sample designs (Hartley, 1962, 1974; Kalton, 1992). As the label implies, multiple frame survey designs use more than one sampling frame to identify and sample eligible members of the survey population. Typically, a multi-frame design combines samples from a low cost and possibly low coverage sample frame (e.g. a list or registry) with a high cost, high coverage frame such as an area probability sampling of households.
Example 4.3:
An immunization program is planning a vaccination coverage survey for children age 12-23 months. A member of the survey planning team suggests that many young children in the catchment area receive routine care through pediatric clinics and that as part of a public health monitoring program, the names and contact information for the mothers and young children are maintained in a centralized data base. It would be very cost efficient to select a sample of mothers and children directly from this database. A second member of the team points out that the catchment area includes a number of impoverished residential areas and children born in these areas are unlikely to be seen at the pediatric clinics and therefore will not be covered by the data base. The team decides to employ a dual-frame design that combines a stratified random sample from the pediatric database with area sampling and screening of households in the poorest EAs.

25WHO/IVB/11.12
The dual-frame sample design described in this example illustrates an important feature of multiple frame samples. Some elements in the survey population may have positive, non-zero probability of being selected from both frames. Therefore, a critical step in the survey process is to determine the probability that the sample individual could be selected from each frame. Special multiple-frame estimators are then used to combine the separate estimates from each frame sample to develop an unbiased estimate of the population prevalence (Hartley, 1974).
4.D.3 Multiplicity sampling
Multiplicity sampling (Sirken, 1970, 1972; Sirken and Levy, 1974; Kalton, 1992) is a sampling design and survey measurement technique that can improve the efficiency of measuring rare events or to increase the screening efficiency for locating elements of a rare population. Multiplicity sampling begins with a standard probability sampling of population elements. Each sampled element is asked to provide a report of his/her own status. They are then asked to also report the status of individuals in a carefully defined network of persons (their children, siblings, parents). Unbiased estimates of the population prevalence of a characteristic (e.g. HIV infection) are then derived using individual weights that are based on a total count of the number of eligible persons in the respondent’s defined network.
The key to successful application of multiplicity sampling is that the characteristic of interest (e.g. HIV infection) must be known for all members in the sample individual’s network. This will be difficult in many immunization survey applications where the outcomes of interest can include verified proof of a complete HepB immunization sequence or presence of HBsAg antigen in the bloodstream.
4.D.4 Lot Sampling
If the primary objective of the survey is to simply assess whether an immunization survey program has met a specific target (e.g. H0: population sero-prevalence of HBsAg has been reduced below P0=8%), lot quality assurance (LQA) sampling is a cost effective alternative to conventional survey designs. The epidemiological literature contains a number of publications on the lot sampling method. A detailed statistical review including procedures for determining required sample sizes to test specific hypotheses concerning population immunization coverage or prevalence rates is provided by Lemeshow et al. (1991). Specific applications of the lot sampling method in immunization coverage surveys are described by Lanata et al. (1990) and Singh et al. (1995). Robertson et al. (1997) provide a review of global applications of the lot sampling method to assessments of health services and in disease surveillance. A comparison of the lot sampling approach to the traditional EPI cluster survey method for immunization surveys is provided in Hoshard-Woodward (2001).
As its name implies, lot sampling is a technique borrowed from quality control procedures employed in manufacturing and other industries. In those original applications, the “lots” are batches of products that can be sampled and individual parts in the larger lot can be inspected for defects or failures. The “lots” in immunization survey applications of this technique are immunization program catchment areas that are surveyed for the characteristic of interest (e.g. not immunized, HBsAg). In both applications, the observations are used to estimate the probability that the prevalence of “failures” in the lot does not exceed a target level.
Sample design and procedures for Hepatitis B immunization surveys: A companion to the WHO cluster survey reference manual26
Example 4.4:
At its formation, a HepB immunization program set a long term goal of reducing the sero-prevalence of HBsAg in school-age children to less than 4%. Eight years after HepB immunizations were first administered to infants, a lot sampling design was employed using a sampling of 5-9 year old children enrolled in schools in the catchment area. With statistical power of 80% and confidence level of a=.05, the study accepted the null hypothesis, H0: P<.04. To the small level of statistical uncertainty inherent in this hypothesis test, the program concluded it had met its goal.
LQA is a cost efficient method for providing a yes/no answer to the question of whether a specific program target has been met. Although there are weighted estimation procedures that permit derivation of point estimates and confidence intervals from LQA samples, the method is not efficient for this purpose. WHO (2005) also points out that the LQA sampling method cannot be applied in sero-prevalence surveys or surveys where the outcome of interest cannot be immediately determined by the interviewer or data collection specialist in the field.
4.D.5 Other adaptive sampling procedures
Disproportionate stratified sampling and lot quality assurance sampling are simple examples of adaptive sampling methods. A current hot topic in the field of sampling design is adaptive sampling methods for identifying rare population elements, measuring the prevalence of rare characteristics or even providing data needed to model epidemics and other processes for the spread of disease. Just as LQA sampling has its roots in quality assurance in industry, many adaptive sampling methods have their origin in studies of natural populations (forestry, fisheries) or geology. Thompson (1997) provides coverage of adaptive stratified and adaptive cluster sample designs along with the required estimation strategies that might prove useful in immunization surveys where the characteristic of interest is both rare and highly isolated in specific geographic pockets. For the present, we note that such designs are highly specialized and survey planners are encouraged to consult an experienced statistician to discuss the use of these methods for immunization program assessments. In the future, readers are encouraged to follow the literature in epidemiology and related fields for new developments in this area and novel applications of these methods.
4.E Quota sampling and other non-probability sampling methods
In practice, the seemingly simple requirements of a probability sample survey design—known, non-zero selection probability for each sample element—are not fulfilled without effort or cost. The construction of a comprehensive frame for the survey population and the rigorous adherence to procedures for selection of survey households or individuals require technical training and appear to add costs to already costly survey data collections. Due to lack of statistical or technical expertise or simply to cut costs in the survey process, many commercial and even scientific research organizations will use non-probability sampling methods to choose the collection of households or individuals that will be interviewed for the survey. Non-probability sampling techniques used in practice include quota samples and other forms of convenience samples.

27WHO/IVB/11.12
In quota sampling, specific sample size quotas or target sample sizes are set for subclasses of the target population. Generally the sample quotas are based on simple demographic characteristics, for example quotas for gender, age groups and geographic region subclasses.
Example 4.5:
A researcher conducting a quota sample survey of 2500 adults from a household population requires that n=25 women age 20-24 be interviewed in a region. Interviewers are directed to specific neighborhoods or villages to begin their search for interviewees but are free to select any individual they choose so long the quota for that person’s demographic group has not already been filled.
The target sample sizes for the demographic and geographic quotas are often based on census data or other sources of population estimates. By matching the marginal proportion of sample cases in each quota cell to the corresponding population proportions, the quota sampler hopes to achieve a “representative sample”, that is a sample for which the survey data will yield unbiased estimates of population characteristics. However, this is only a hope; the data obtained from the quota sample provide no statistical basis for determining that the goal of a representative sample was actually achieved. Individual probabilities of selection for population elements are unknown since the selection of respondents is arbitrary and does not employ true randomization. Interviewers may choose any convenient individual who meets an open quota.
Quick, topical surveys or opinion polls commonly use convenience samples of individuals as respondents. Intercepting and interviewing respondents in high traffic areas such as shopping centers, transit locations, athletic events, etc. constitutes a sampling of “convenient”, easily accessible persons. Likewise, open solicitations to respond to a survey in a newspaper or magazine, on the Internet or via a broadcast e-mail constitute a convenience sample. Such samples are highly vulnerable to sample selection biases and in fact are often used by advocacy organizations to collect “survey data” that support their position on public issues or policy actions.
In the strictest sense, these and other forms of non-probability sampling lack a statistical basis for making inference from the chosen sample to the population that sample is designed to represent. The common analytical approach that is often used with non-probability sample data is to compute population estimates, standard errors and confidence intervals just as though a probability sample of the population had been drawn. This “substitution” of a non-probability sample for a probability sample in estimation and inference assumes unbiasedness of the arbitrary procedure used to identify the sample. Now in fact, all non-probability samples are not necessarily seriously biased. The problem is that given the arbitrary nature of respondent choice biases are highly likely and are impossible to measure. The true error of the sample estimates generated from non-probability samples cannot be estimated.

Sample design and procedures for Hepatitis B immunization surveys: A companion to the WHO cluster survey reference manual28
This chapter serves as a guide to study planners who have the responsibility for determining the sample size required to meet the objectives of a specific immunization coverage or sero-prevalence survey. The chapter’s sections follow the sequence of practical steps that must be followed to properly determine the sample size requirements for the survey:
Specify the primary analysis objectives.1)
Determine the precision requirements for each objective.2)
Determine sample size under simple random sampling (SRS) assumption.3)
Evaluate potential size of design effects for different sampling design options.4)
Adjust SRS sample size computations for the chosen complex sampling design.5)
Re-evaluate steps 1, 2, and 4 based on implied costs of the chosen design and 6) required samples sizes.
Steps 1 and 2 in this six step process are decision steps and are the responsibility of the senior health professionals, program administrators or planners for the immunization program evaluation or sero-prevalence survey. A survey plan that fails to address its primary objectives or lacks sufficient statistical precision to clearly answer the questions embodied in those objectives is a waste of valuable resources. By the same turn, a survey plan that addresses the primary objectives but entails extremely high standards for statistical precision may be unnecessarily expending resources that could be put to other purposes. Therefore, careful considerations are advised so that the final sample size is based on the primary analysis objectives and the minimum precision requirements for each objective given available resources. Standard statistical texts on sample size calculations often ignore these two most important steps in the process of sample size determination, focusing instead on the mathematical and computational detail of step 3. The mathematics and the computations of sample size determination are, of course, important in the process. This chapter, however, will emphasize steps 1 and 2 and elaborate on general statistical principles of sample size computation for immunization and sero-prevalence surveys. References to excellent tools that are now available for performing these calculations are also provided.
5. Determining the required sample size

29WHO/IVB/11.12
5.A Specifying the primary analysis objectives
At first glance, the specification of the primary analysis objectives should be a simple task. Consider the following example: A sero-prevalence survey is planned for the population of elementary school students 5-9 years of age in the whole country that have received in theory all three recommended doses of Hepatitis B vaccines as infants. The sero-prevalence survey objective is to obtain a point estimate and a 95% confidence interval for the current HBsAg sero-prevalence in this population of school children.
The objective of the planned survey seems clear. However, before proceeding to the specification of precision and calculation of the required sample size, we need to explore the objective further and determine further important details:
Prevalence estimates for subpopulations• :
Survey planners often neglect to account during the sample size determination for critical subpopulation analysis requirements. If subpopulation estimates are important, they need to be considered in determining the sample size for the study. In our example, another goal of the sero-prevalence survey might be to calculate a prevalence estimate for specific subgroup of all first grade students, such as an ethnic minority or students in certain geographic areas of the country.
• Prevalence estimate comparisons to other populations or to a fixed standard:
If the prevalence estimates of the planned survey will be compared to other estimates it is important to reflect this objective in sample size calculations. The comparison of the estimate of the planned survey could be made to other estimates that have been established previously by other surveys or to a target value itself. For our example, it could be possible that the goal is to compare the calculated estimate to a baseline estimate based on a survey before the immunization program has been introduced. Other possible comparisons would be among different geographic regions of the country or different ethnic groups. It would neither be uncommon to aim to compare the computed prevalence estimate of the planned survey to a program evaluation standard or goal, such as the prevalence target set by WPRO to achieve Hepatitis B control certification.
• Types of survey statistics:
The general objective of Hepatitis B sero-prevalence survey focuses on estimates and confidence intervals for Hepatitis B prevalence in the specified population. It is, however, not uncommon that due to restrictions of resources one survey is used to establish the prevalence of another infectious disease besides Hepatitis B. In our example, it might also be of interest to determine the prevalence of HIV besides the prevalence of HBsAg. In addition, sero-prevalence surveys are most of the time not just conducted to provide prevalence estimates. They also collect other data such as family characteristics or disease histories. Other forms of statistical analyses, besides estimates of proportions, are usually performed on these data as well. In our example, it could also be of interest for the planning of future vaccination programs to determine predictors of immunity and to fit a logistic regression model, in addition to calculating the HBsAg prevalence estimate.

Sample design and procedures for Hepatitis B immunization surveys: A companion to the WHO cluster survey reference manual30
5.B Determine the required precision for each objective
In surveys where the objective is to estimate the population prevalence of a rare characteristic, the investigator typically chooses to express the sample-based information in the form of a confidence interval for the population prevalence:
= the (1- /2) % critical value for the Fisher's distribution
1.96
where:= the sample estimate (unbiased) of the population prevalence rate;
z ,1 /2df
(standard normal distribution) with df degrees of freedom; and
= the standard error of estimated from the sample data.
zp̂
p̂
CI(p)ˆ z ,1 /2dfp̂
(p)ˆse
(p)ˆse
p̂ for =.05 and large n(p)ˆse
This standard expression for the confidence interval of an estimated prevalence rate is applicable for situations where the sample size n is large. However, if the estimated prevalence rate p̂ is very small, Fleiss (1981, p.14) provides an alternative expression that accounts for the fact that the lower bound of the confidence interval must be greater than or equal to zero.2
After having set the main objective and the way we would like to express the uncertainty of sample estimate with regard to the inference we can make about the true population preference we need to determine the desired precision level of our estimate. The precision level indicates the amount of uncertainty that we are willing to accept that our survey estimate does not reflect the population value. There are several ways how precision levels can be chosen. On the one hand, it can be expressed through choosing a fixed confidence interval.
95 ˆ ˆ ˆ( ) 1.96 ( )CI p p se p= ± ×
For example, the survey planner can decide that the confidence interval should not be larger than , meaning that the standard error of our prevalence estimate should be no larger than 0.005. On the other hand, we can express our level of precision through a relative precision target that expresses our allowable sampling error (the allowable uncertainty) as a proportion of the estimated prevalence, also called a coefficient of variation.
ˆ( )ˆ( )ˆ
se pcv pp
=
2 It is assumed that the size of the sample of participants is relatively large, e.g. more than 150 respondents. Should the sample size be smaller than that exact procedures should be used to calculate the confidence interval. For small prevalence estimates and a small sample size please refer to the Agresti-Coull confidence interval estimation of proportions (Agresti and Coull, 1998).

31WHO/IVB/11.12
For example, the survey planner can decide that the proportion of sampling error should not exceed ˆ( ) 0.1.cv p = The choice between the two types of precision targets is difficult when estimating the prevalence of a rare characteristic. A fixed precision level of is meaningless in a study where the expected population prevalence is near 0.02. At the other extreme, a sample designed to achieve a 95% confidence interval of ( ) ( )95 ˆ ˆ ˆ1.96 0.02 1.96 0.001CI p p se p= ± × = ± × is probably excessively precise (and thus is wasting resources).
There are no fixed guidelines for choosing how precise sample estimates for surveys of rare population characteristics have to be. In fact, the chosen precision targets must balance the importance of knowing the range of the true population value with only a small degree of uncertainty vs. the need of an increased sample size and higher survey costs required to reduce sampling error to low levels. Table 5.1 uses a simple example of a large scale study to illustrate how the required sample size varies according to the prevalence rate in the population and the method for determining the target precision levels for sample estimates. The first panel in this table shows how the required sample size varies if the precision target is set at a fixed value of ( )ˆ 0.005se p = which results approximately in a 95% confidence interval of ( )95 ˆ ˆ 0.01CI p p= ± . If the population prevalence is 0.02, a sample of 784 is required for a 95% confidence interval with these specifications. However, if the precision requirement for this same sample estimate of prevalence is based on a relative precision target, namely a coefficient of variation of
( )ˆ 0.1cv p = , the required sample size will be n=4900.
Table 5.1: Sample sizes needed to estimate the prevalence of a population characteristic based on normal approximation
(assuming large scale study and simple random sampling)
Population Prevalence (P)
Equal Precision (Standard Error)
Equal Relative Precision (Coefficient of Variation)
se( p̂ ) N cv( p̂ ) se( p̂ ) n
.01 .005 396 .10 .001 9900
.02 .005 784 .10 .002 4900
.05 .005 1900 .10 .005 1900
.10 .005 3600 .10 .010 900
.20 .005 6400 .10 .020 400
In real survey applications, the ambiguity over the target precision level may be resolved by the requirements of the agency that is sponsoring the survey. For example, the sponsor may stipulate that sero-prevalence in the population should be estimated with a confidence interval of no wider than +/- 0.01.

Sample design and procedures for Hepatitis B immunization surveys: A companion to the WHO cluster survey reference manual32
5.C Determine the required sample size under simple random sampling (SRS) assumptions
For simple random samples (SRS) selected from large populations, the estimated standard error for an estimated prevalence rate, as well as any other dichotomous characteristic, is:
= SRS sample size; and
= the population size.
where:
np = the sample estimate of a prevalence rate or proportion;
N
ˆ ˆ(1 )ˆ( ) (1 / )1
ˆ ˆ(1 ) if N is large
p pse p n Nn
p pn
From this formula it is clear that for simple random samples from large populations, the standard error of the sample proportion is a simple function of the prevalence p̂and the sample size n. This simple equation is easily rearranged to express the required sample size as a function of the estimated population prevalence and the targeted precision level:
for large populations.n
2
ˆ ˆ(1 )ˆ( )
P Pse P
Figure 5.1 shows the relationship between the ( )se p and the SRS sample size for values of 0.01, 0.05,and 0.10p p p= = =
- values that span the range of prevalences of interest in studies of rare population characteristics. Two features of the relationship of sample size to the standard error of sample estimates are important to note. The first is that
( )se p decreases as the estimated prevalence of the characteristic to be assessed moves farther away from 0.50p = . The second is that higher levels of precision, i.e. smaller standard errors and therefore narrower confidence limits, require larger sample sizes.

33WHO/IVB/11.12
Figure 5.1: Relationship of SRS standard error of a proportion to sample size
0.035
0.03
0.025
0.02
0.015
0.01
0.005
0100 250 500 750 1000 1250 1500 1750 2000 2250 2500
Sample Size
Stan
dard
Err
or o
f p-h
at p-hat = 0.10
p-hat = 0.02
p-hat = 0.01
Obviously, the researcher does not know the value of P before the survey is conducted —the intent of the survey is to estimate this quantity with a known level of precision. However, it is generally the case that researchers have an expectation for the range in which P is believed to lie (e.g. between 0.01 and 0.05). In such cases, it is recommended to use the value of p̂ in the range that is closest to p̂ =0.50 since the standard error of p̂ is greatest at this value.
Example 5.1:
A health ministry is planning a large scale sero-prevalence survey in a population of 5-9 year olds that were included in a vaccination program with three doses of HepB vaccine as infants. The precision objective is to estimate the population HBsAg prevalence with standard error of ( ) 0.01se p = (for a large scale survey this will result in a 95% confidence interval of 95 1.96 ( ) 1.96 0.01 0.02CI se p= ± × = ± × ≈ ± . Coverage of the infant vaccination was known to be good but incomplete. Based on studies conducted in other regions, the ministry estimates that the true population prevalence could be as low as 0.02P =
(2%) or as high as 0.10P =
(10%). The ministry’s statistician recommends using 0.10P =
, since for a given sample size, the maximum standard error will occur for the prevalence near the upper bound of the probable range. For 0.10P =
, the SRS sample size needs to be n=865 to achieve a standard error of
( ) 0.01se p = . However, if the survey results show that the program was much more effective than originally thought the achieved standard error will be smaller. For example, if the survey estimate of prevalence is
0.02p = then the 95% confidence interval for the population value using the sample size of n=865 will be
95CI
p×(1−p)n
=0.02±0.0048=(0.0152;0.0248)=(1.52%;2.48%)
= p±1.96×se(p)=p±1.96×
= 0.02±1.96 × 0.02×(1−0.02)
865
Sample size calculators for exact sample sizes and other statistics, e.g. the difference between two proportions, are available in EpiInfo, nQuery, PASS and other software packages. Readers interested in learning more about sample size calculations should consult Lemeshow et al. (1990). Additional guidance can also be found in the Immunization Coverage Cluster Survey Reference Manual (WHO, 2005).

Sample design and procedures for Hepatitis B immunization surveys: A companion to the WHO cluster survey reference manual34
5.D Effects of a complex sample design on sample size
The preceding section addressed the relationship between the precision target for an immunization coverage survey and the required sample size when simple random sampling methods are used for the survey. Most practical sample designs that are employed in immunization surveys or other health-related studies are not SRS designs. As introduced in Chapter 4, practical sampling designs usually consist of multiple stages and include strata and clusters. The sample size computation under the simple random sampling condition serves only as the first step or “benchmark” for the determination of the sample size required for the more complex sampling designs. Stratification is generally introduced to increase the statistical and administrative efficiency of the sample. Clusters as part of a sampling design are often unavoidable. The potential members of a sample are either part of a natural cluster, e.g. a household, or they are selected as clusters to reduce travel costs and improve interviewing efficiency. It is not uncommon for multi-stage sampling designs to use disproportionate sampling of population members to increase the sample sizes for subpopulations of special interest. This results in unequal probabilities for potential sample members to be included in the sample and therefore also in the need to employ weighting in the estimation of population prevalence or other descriptive statistics. Relative to simple random sampling, each of these complex sample design features influences the size of standard errors for survey estimates. Figure 5.2 illustrates the effects of these design features on standard errors of estimates. The curve plotted in this figure represents the SRS standard error of an estimate as a function of sample size. At any chosen sample size, the effect of sample stratification is generally a reduction in standard errors relative to SRS. Clustering of sample elements and designs that require weighting for unbiased estimation generally have larger standard errors than an SRS sample of equal size (Kish, 1965). Following the same logic, for any chosen standard error of p̂ , sample stratification decreases the sample size while clustering and weighting increase the sample size needed compared to SRS.
Figure 5.2: Complex sample design effects on standard errors of prevalence estimates
0.035
0.03
0.025
0.02
0.015
0.01
0.005
0100 250 500 750 1000 1250 1500 1750 2000 2250 2500
Sample Size
Stan
dard
Erro
r of p
-hat
Strata
Clustering
Weighting

35WHO/IVB/11.12
The combined effects of stratification, clustering and weighting on the standard errors of estimates are termed the design effect and are measured by the following ratio:
( ) = the simple random sample variance of
( ) ( )se p
( ) ( )se p var p= =
2
2
ˆ ˆ
:
= the design effect;
ˆ( ) = the complex sample design variance of ; and
ˆ
complex complex
srs srs
complex
srs
Deff
where
Deff
var p
var p
var p
ˆ ˆ
p̂
p̂
To determine the required sample size for a complex sample design that incorporates stratification, clustering, and weighting, most survey statisticians employ the following steps:
Follow the steps described in Sections 5.A to 5.C to determine the survey 1) objectives, desired precision levels, and the required sample size assuming the sampling design was simple random sampling SRS.
Use knowledge about the specific complex sample design being considered as 2) well as existing data from past surveys or surveys in other areas or even other countries along with a simple model to approximate the value of the design effect, Deff, for key survey estimates.
Determine the adjusted sample size using the following simple formula:3)
where:
the SRS sample size required to meet the desired precision target;
Deff the approximate complex sample design effect; and
the required sample size for a complex sample design adjusting
complex srs
srs
complex
n n Deff
n
n
= ×
=
=
=
for design effects.
As described in Section 5.C, researchers can use the approximate SRS sample size formulas directly or can turn to software programs to compute the required exact SRS sample size. To determine the final sample size required to achieve the same level of precision from a sample that includes stratification, clustering, and/or weighting, a good approximation is needed for the design effect, Deff. A somewhat simplistic, but useful model of design effects that can be used to plan a sample survey is (Heeringa et al., 2010):

Sample design and procedures for Hepatitis B immunization surveys: A companion to the WHO cluster survey reference manual36
1
where:
the relative gain in precision from stratified sampling compared to SRS;
the relative loss of precision due to clustered selection of sample elements; and
strata cluster weighting
strata
clusters
Deff G L L
G
L
− + +
=
=
the relative loss due to unequal weighting for sample elements.weightingL =
The value of the design effect for a particular immunization survey design will be the net effect of the combined influences of the stratification, clustering, and weighting. The following sections describe how to estimate values for the relative gain due to stratification and the relative losses due to clusters and weighting.
Relative gain in precision from stratification
The reader is referred to Cochran (1977) and Kish (1965) for a detailed description of the precision gains of stratification, Gstrata. Here, we only note that for estimates of low prevalences and other proportions that are key statistics in immunization coverage surveys, it is difficult to achieve large reductions in standard errors through sample stratification (Kalton, 1992). A conservative approach in planning most immunization coverage and sero-prevalence surveys is to assume that Gstrata≈ 0.
Relative loss in precision from weighting
Increases in standard errors due to weighting are related to the distribution and in particular the variance of the weight values assigned to the individual cases. A simple approximation used by sampling statisticians to anticipate the relative loss of precision, Lweighting, is:
s(w)
L cv (w)s (w) 2
22
2
where:
= the standard deviation of the sample weights; and
= the mean of the sample weights.
=weightingw
cv (w)
w
= the relative variance of the sample weights;
The sample weight of each individual sample case is calculated by first determining the probabilities of selection at each stage of the sampling design, then multiplying them, and lastly taking the reciprocal of the sample selection probability to establish the sample selection weight for each case.

37WHO/IVB/11.12
Example 5.2
After conducting a sero-prevalence survey selection weights are calculated by the survey statistician based on the different probabilities of selection at each stage of the multi-stage area probability survey. The survey statistician wants to calculate the overall selection probability of individual A. The sampling design used as primary sampling units government districts. Of the 80 districts, 60 were selected as PSUs with a probability of selection of 60/80=0.75. Individual A lives in government district 22 that includes 43 enumeration areas which were chosen as second-stage sampling units. Of the 43 enumeration areas, 20 were sampled with a probability of selection of 20/43=0.47. Individual A lives in enumeration area 15 that includes 419 households. Of those 419 households, 60 were sampled with a probability of selection of 60/419=0.14. In the household in which individual A lives 4 eligible respondents were found and individual A was randomly selected with a probability of selection of 1/4=0.25. The overall probability of selection for individual A amounts to 0.75X0.47X0.14X0.25=0.01234. The associated selection weight for individual A is therefore 1/0.01234=81.04.
The mean of all individual weights was estimated to be 38.24 with a standard deviation of 15.8. An estimate of Lweighting due to natural clusters in the sampling design is therefore calculated as (15.8)2/(38.24)2=0.17. This implies that the final sample size for survey must be ncomplex=nsrs x 1.17 or 17% larger than the SRS sample size in order to meet a set precision level for a prevalence estimate.
Other design elements of the sampling design also have to be taken into account when calculating the relative loss in precision due to weighting. For example, is not uncommon in sero-prevalence surveys that want to estimate prevalence of chronic Hep B in subgroups of the population to disproportionately sample members of these subgroups.
Example 5.3:
A survey is planned for a coverage area that includes both urban and rural populations of children. Eighty percent of the area’s population lives in the urban domain and 20% lives in the rural villages. The agency sponsoring the survey would like to have roughly equal precision for prevalence estimates for urban and rural children and decides to allocate the sample equally (50:50) to the two geographic domains. They recognize that this will require weighting to obtain unbiased estimates for the combined area. Urban cases will need to be weighted up by a factor proportional to 0.80/0.50=1.6 and rural cases will need to be weighted down by a factor proportional to 0.2/0.5=0.4. To estimate Lweighting they compute the relative variance of these weights for a sample that is 50% urban and 50% rural. They determine that Lweighting ≈ cv2(w) =0.36. Ignoring clustering for the moment, this implies that the final sample size for survey must be ncomplex=nsrs x 1.36 or 36% larger than the SRS sample size in order to meet a set precision level for a prevalence estimate for the combined area.
The reader should note that Lweighting is often nontrivial. Survey designs that call for disproportionate sampling of geographic areas or other subpopulations should be carefully considered – balancing the analysis objectives against the cost of the added sample size needed to offset the precision losses due to weighting.

Sample design and procedures for Hepatitis B immunization surveys: A companion to the WHO cluster survey reference manual38
Relative loss in precision due to clustering
The increase in the design effect, Deff, due to either single stage or multi-stage clustered sampling is caused by correlations due to non-independence of observations within sample clusters. Many characteristics of natural clusters such as children in a school classroom or adults living in the same neighborhood are correlated. Socio-economic status, access to health care, vaccination coverage and presence of a chronic or past infection are all examples of individual characteristics that individuals in sample clusters may share to a greater degree compared to a person outside the sample cluster. When such group similarity is present, the amount of “statistical information” contained in a clustered sample of n persons is less than in a purely random sample of the same size. Hence, clustered sampling increases the standard errors of estimates relative to a SRS of equivalent size. A statistic that is frequently used to quantify the amount of homogeneity that exists with sample clusters is the intraclass correlation r (Kish, 1965).3
Sections 4.A-4.C of this report described three major approaches to sample designs for immunization coverage and sero-prevalence surveys. Each of these approaches incorporates clustered sampling: households within enumeration areas (EAs), children within schools, and patients and clients within health clinics or providers. In each of these designs, the process of determining the required sample size needs to take into account how many clusters and how many individuals in each cluster will be selected, or in other words how the sample will be allocated to each stage of the sample. For example, a total sample of n=1,000 could be reached through a sampling design using a=100 clusters of size b=10 or a design of a=50 clusters, each of size b=20. While each sampling design yields a total sample of n=1,000, the cost and statistical efficiency of the two allocations will differ. In practice, the optimal allocation of the total sample size to the separate stages of sampling is determined by the intraclass correlation for the characteristic of interest, r, and the relative costs of adding sample units at each stage of the sampling design.4
When the primary objective of an immunization survey is to estimate prevalence, proportions or means of population characteristics, the following model can be used to approximate the relative loss of precision, Lclusters, (Kish, 1965):
×
where:
the intraclass correlation for the characteristic of interest; and
B the size of the sample cluster of observations in each PSU.
clusters (B - 1)
=
=
L
3 See Kish et al. (1976) for an in-depth discussion of intraclass correlations observed in the World Fertility Surveys.
4 The detailed mathematical rules are beyond the scope of this report. Readers who are interested in the mathematical formulae for optimal sample allocation in multi-stage designs are referred to Kish (1965).

39WHO/IVB/11.12
The value of r is specific to the population characteristic (e.g. sero-prevalence) and the size of the clusters (districts, EAs, schools, classrooms) over which it is measured. Generally, the value of r decreases as the geographical size and scope (i.e., the heterogeneity) of the cluster increases. Typical observed values of r for general population characteristics range from 0.00 to 0.20 with most between 0.005 and 0.100 (Kish et al., 1976).
Example 5.3:
The researchers planning the survey described in the preceding example decide to use a two-stage sample of households, a primary stage sample of EAs followed by a second stage sample of 10 households from each sampled EA. The relevant cluster size is B=10. The survey statistician on the research team contacts a colleague in another health region to obtain data from a similar sero-prevalence survey that the other region recently completed. The statistician uses the data from that cluster sample to determine an estimate of the intraclass correlation for chronic infection—the estimate proves to be ρ=.10. Using this value, the relative increase in variance due to clustering is estimated to be Lcluster = 0.10(10-1) = 0.90. Combining the modeled losses due to clustering and weighting for the proposed survey design, the complex sample design effect is estimated to be Deff = 1-Gstrat+Lcluster+Lweight = 1-0+0.90+0.36 = 2.26. The survey statistician has already determined the SRS sample size required to meet the total sample precision objectives. Adjusting for the complex sample design effects, the actual sample size that must be fielded for the two-stage cluster sample with disproportionate allocation to urban and rural regions is ncomplex = 2.26 x nsrs. The number of clusters (PSUs) of size 10 required for the survey is ncomplex/10.
Figure 5.3 illustrates how the complex sample design effect influences the relationship between the sample size and the precision of estimates of sample prevalence. To illustrate the principle, the lower curve plots the relationship between sample size and standard error of a prevalence estimate when the true prevalence is near 0.10 and the sampling design used is simple random sampling. For sample sizes ranging from 100 to 2500, the upper curve demonstrates the increase in the standard error of the prevalence estimate when the prevalence is near 0.10 but a complex sample design with a design effect Deff = 2.0 is used.
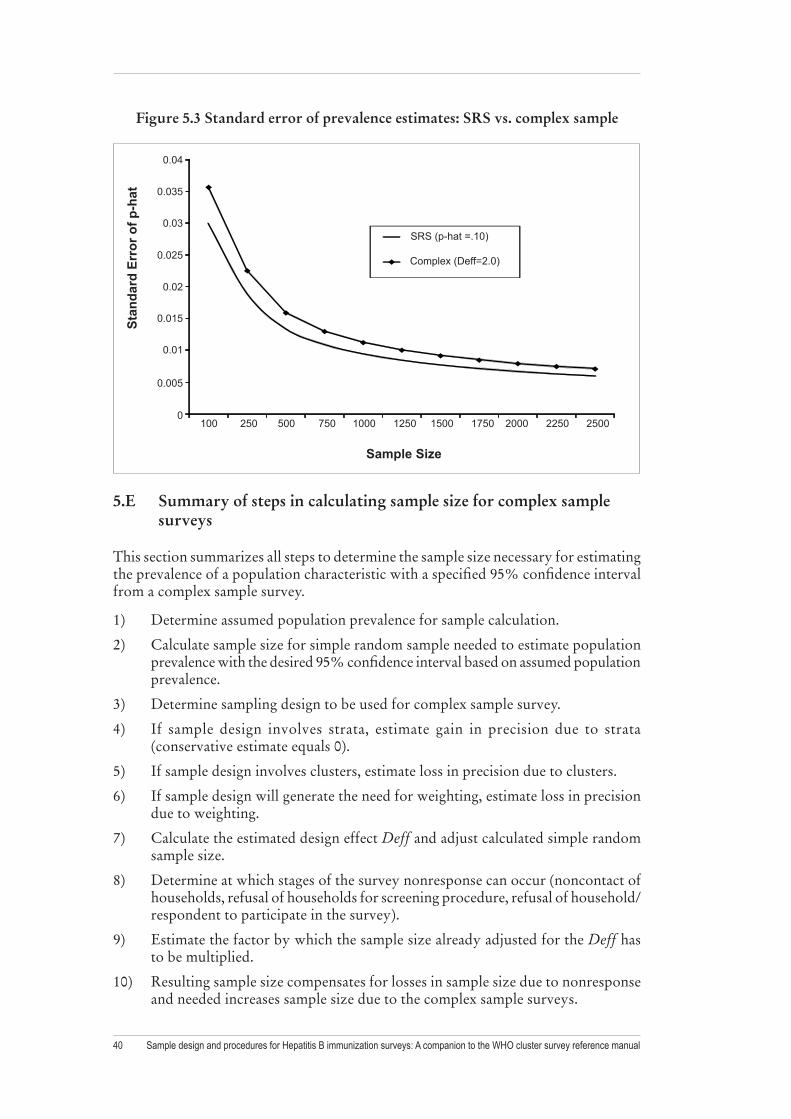
Sample design and procedures for Hepatitis B immunization surveys: A companion to the WHO cluster survey reference manual40
Figure 5.3 Standard error of prevalence estimates: SRS vs. complex sample
0.035
0.03
0.025
0.02
0.015
0.01
0.005
0100 250 500 750 1000 1250 1500 1750 2000 2250 2500
Sample Size
Stan
dard
Err
or o
f p-h
at
0.04
SRS (p-hat =.10)
Complex (Deff=2.0)
5.E Summary of steps in calculating sample size for complex sample surveys
This section summarizes all steps to determine the sample size necessary for estimating the prevalence of a population characteristic with a specified 95% confidence interval from a complex sample survey.
Determine assumed population prevalence for sample calculation.1)
Calculate sample size for simple random sample needed to estimate population 2) prevalence with the desired 95% confidence interval based on assumed population prevalence.
Determine sampling design to be used for complex sample survey.3)
If sample design involves strata, estimate gain in precision due to strata 4) (conservative estimate equals 0).
If sample design involves clusters, estimate loss in precision due to clusters.5)
If sample design will generate the need for weighting, estimate loss in precision 6) due to weighting.
Calculate the estimated design effect 7) Deff and adjust calculated simple random sample size.
Determine at which stages of the survey nonresponse can occur (noncontact of 8) households, refusal of households for screening procedure, refusal of household/respondent to participate in the survey).
Estimate the factor by which the sample size already adjusted for the9) Deff has to be multiplied.
Resulting sample size compensates for losses in sample size due to nonresponse 10) and needed increases sample size due to the complex sample surveys.
41WHO/IVB/11.12
Besides discussing practical issues related to sample design choice, sample selection methods, and procedures for minimizing sampling error, this report wants to emphasize the impact nonsampling errors can have on the quality of Hepatitis B immunization survey statistics. It is important to be aware of the possibility that nonsampling errors may dominate the overall error of a survey estimate, also called the total mean squared error (MSE). Immunization survey planners should also be able to identify situations in which the influence of nonsampling errors cannot be neglected and has to be accounted for. This chapter aims at making the reader more sensitive to possible implications of nonsampling errors so that researchers explicitly include them along with sampling error in their consideration of survey error and survey cost trade-off decisions.
6.A Total survey error
The WHO “Immunization Cluster Survey Reference Manual” (WHO, 2005) provides guidance on conducting high quality cluster surveys to assess vaccination program impact. The quality of the survey is herein defined as the amount of sampling error in the statistic of interest. Sampling error, however, is not the only survey error that has implications on the quality of survey estimates. Nonsampling errors influence as well the quality of survey estimates throughout the survey process (Figure 6.1) and in certain situations these influences can substantially exceed those of sampling error. For high-quality Hepatitis B infection estimates it is therefore important to consider the prevalence and impact of all of these errors when conducting an immunization survey.
Nonsampling errors are classified into target population coverage, nonresponse, measurement, processing error, and adjustment error5 (Groves, 1989). Target population coverage and nonresponse error are also known as non-observation errors since they occur before any measurements have taken place. In contrast, measurement and processing error are classified as observation errors. Each type of error can either be generated through variable or systematic error. Variance or variable error is assumed to be random and has therefore no expected impact on survey estimates themselves, but on their precision. Bias or systematic error is directional and alters estimates.
5 Adjustment error will not be covered in this report.
6. Total survey error and its impact on
immunization surveys

Sample design and procedures for Hepatitis B immunization surveys: A companion to the WHO cluster survey reference manual42
Every survey should make efforts to measure and/or reduce sampling, coverage, nonresponse, measurement, and processing error. Measuring the possible impact of nonsampling errors will help the researcher to judge the quality of survey estimates. However, limited budgets seldom allow researchers to measure and/or reduce all of these errors at the same time. Survey costs and the predetermined survey budget usually determine the amount of effort that can be undertaken to measure and reduce all or a subset of these survey errors. These cost and error trade-offs are common in survey designs and mostly based on limited information on the occurrence and gravity of survey errors for the specific situation. Therefore, researchers have to estimate which of these errors are most likely to increase the overall error in the survey estimate for a given survey, also called the mean squared error (MSE), and prioritize error reduction efforts. The following sections provide an overview of the different nonsampling errors, present survey design features that can measure and/or reduce errors, and provide examples that illustrate possible implications nonsampling errors might have on estimates of Hepatitis B program impact assessments or Hepatitis B sero-prevalence surveys. Because biases or systematic errors are generally of greater concern to survey planners than variable error or variances, this chapter will focus on the assessment and reduction of biases: target population coverage bias, nonresponse bias, measurement bias, and processing bias.

43WHO/IVB/11.12
Figure 6.1 Total survey error paradigm (adapted from Groves et al., 2004)
Validity
MeasurementError
ProcessingError
Construct
Measurement
Response
EditedResponse
TargetPopulation
SamplingFrame
Sample
Respondents
PostsurveyAdjustments
CoverageError
SamplingError
NonresponseError
AdjustmentError
Survey Statistic
MEASUREMENT REPRESENTATION
6.B Target population coverage bias
Target population coverage bias, also simply called coverage bias6, occurs when some units of the target population cannot be part of the survey population, or in other words have no chance to be selected into the sample. The amount and direction of the coverage bias for descriptive statistics, like prevalence estimates or proportions, is a function of both, the proportion of the target population that is not covered by the sampling frame (non-coverage rate) and the difference between the proportions of the covered and non-covered target population units with regard to the statistic of interest (Groves, 1989; Groves et al., 2004):7
6 It should be noted that the term “coverage bias” from here on refers to target population coverage bias and not to a biased estimate of vaccination coverage.
7 The formulas for proportions presented in Chapter 6 are also applicable for means.

Sample design and procedures for Hepatitis B immunization surveys: A companion to the WHO cluster survey reference manual44
=
( )Coverage Bias:
where:
= proportion in the entire (total) target population;
= estimated proportion in the survey population (covered target population);
= estimated proportion in the non-covered target population;
T
C
NC
N
N
P
P
P
= number of members of the entire (total) target population; and
= number of members of the target population not covered by the survey population.T
NC
N
N
NCC T
NCPT
CP P P
This implies that coverage bias in descriptive statistics only occurs when both of these conditions are met: a part of the target population that is not covered by the survey population AND a difference in the proportions or prevalence estimates for the covered and non-covered target population. Therefore, if the statistic of interest is geographically clustered, concentrated in social and language groups, or exhibits seasonal variation AND these areas or population groups are not covered by the survey population, coverage bias will occur. In other words, if the occurrence of the to be measured population characteristic, e.g. HIV infection, is highly correlated with the likelihood that a subgroup of the target population is not covered by the survey population, then coverage bias is likely to occur.
Example 6.1:
Due to increased conflict activities in a country it is not possible to survey a large number of remote villages in the mountain ranges. The overall prevalence of chronic Hepatitis B infections in the country as measured by the survey is 1.2%. Earlier studies have shown that people of these remote areas have a higher prevalence of chronic Hepatitis B infections of about 9.8%. The target population includes children from 0 to 14 years and is estimated to be 10,900,000 children. The number of children that cannot be included is estimated to be about 500,000 children. The prevalence of chronic Hepatitis B infection is underestimated by about 0.4%:
Using percentages: 1.2− X100% = X (1.2%−9.8%) = −0.3945%500,000
10,900,000
Using proportions: 0.012− = X (0.012−0.098=−0.003945
NCP
NCP500,000
10,900,000
Depending on the type of sampling frame used, coverage bias can be based on either non-coverage of geographical units (area frames), households (list frames, or later stages in multi-stage designs) or of sampling persons within households or schools (WHO, 2005).
45WHO/IVB/11.12
Target population coverage bias in the prevalence estimate of chronic Hepatitis B infections of an immunization survey using an area sampling frame could occur if the persons living in the following areas are excluded from the survey population and chronic Hepatitis B infections are clustered in these areas:
remote and sparsely populated areas;•
areas that cannot be reached due to conflict activities that would endanger survey •personnel; and
areas with indigenous languages that would require extensive training for the •interviewers employed; and
areas that may have great changes in population numbers due to migrant workers •or nomads at certain times during the year.
Target population coverage bias in the prevalence estimate of chronic Hepatitis B infections of an immunization survey using a list frame (e.g. school lists or address lists) could occur if elements of the target population are not part of the list which defines the survey population and these not-covered elements show substantially higher or lower prevalence rates of chronic Hepatitis B infections:
small and remote schools in school samples that are not part of the list; •
privately educated children in private schools that are not part of the list; •
children of low socio-economic status and/or certain gender (mostly female) •that are not part of the list;
address lists that do not include certain population groups (nomads or population •groups in rural areas without official addresses).
Within-household coverage bias in the prevalence estimate of chronic Hepatitis B infections of an immunization survey could occur if certain persons in the household who might have chronic Hepatitis B infections are not reported when the interviewer lists household members. The exclusion might be due to either a misunderstanding of who belongs to the household or to the fact that the informant deliberately excludes children, elderly, or persons with health problems due to personal reasons, e.g. embarrassment.
There are several possible means to diminish the impact that coverage bias can have on the statistic of interest (WHO, 2005):
improvement in field procedures, the use of multiple frames, updated lists, •and improved listing protocols and processes involved in the survey (Kish, 1965; Groves, 1989);
reporting properties of non-covered areas, houses, or persons as well as possible •in the survey report (WHO, 2005);
measuring the target population coverage bias and reporting it in the survey •documentation; this requires the creation of or access to data that are independent from the survey data themselves, e.g. census data (Groves, 1989); and
attempting to compensate for the target population coverage bias through •statistical adjustments (also refer to Kish, 1965, and Groves, 1989).

Sample design and procedures for Hepatitis B immunization surveys: A companion to the WHO cluster survey reference manual46
6.C Nonresponsebias
Nonresponse occurs when complete measurements of the sample or each of the sample units are not obtained. Unit nonresponse refers to the non-measurement of a sampling unit due to either non-contact or a refusal of the informant and/or the respondent to participate in the survey. Item nonresponse, also known as missing data, refers to the lack of an answer to a certain question by the respondent.
Nonresponse bias in descriptive statistics is –as for target population coverage bias- a function of the percentage of units of the sampling frame that could not be measured (nonresponse rate) and the difference between the measured and non-measured units with regard to the statistic of interest, e.g. the prevalence of chronic HBV infections (Groves, 1989).
=
( )Nonresponse bias:
where:
= proportion in the entire (total) sample;
= proportion of the respondents;
= proportion of the non-respondents;
T
R
NR
N
N
P
P
P
= number of members of the entire sample; and
= number of members of the sample, who did not respond to the survey.T
NR
N
N
NRR
NRPT
RP P P
Nonresponse bias in prevalence estimates of chronic Hepatitis B infections due to unit nonresponse could occur if the respondents could not be contacted or refused to participate because of reasons that are or could be associated with the prevalence of Hepatitis B:
Contact could not be made with the household because none of the household •members was ever at home when the interviewer visited because family members are working long hours in bad sanitary conditions due to the low socio-economic status of their family.
Households that did not participate in the immunization survey because of their •fear with regard to the survey procedures, e.g. finger prick.
Households that did not participate in the immunization survey because they •did not want to know anyone that they have not immunized their children or have not completed the full course of immunizations.
Communication problems between the interviewer and the people living in certain •households due to language barriers might lead to unit nonresponse for people with low Hepatitis B immunization coverage.
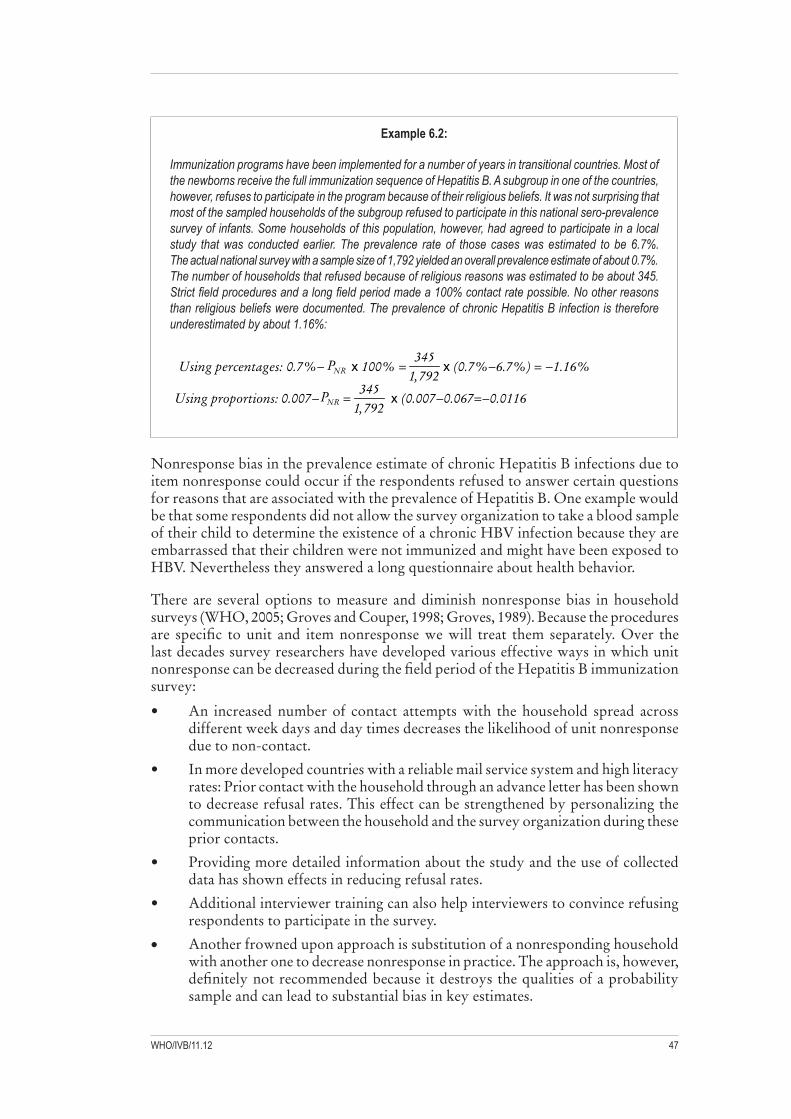
47WHO/IVB/11.12
Example 6.2:
Immunization programs have been implemented for a number of years in transitional countries. Most of the newborns receive the full immunization sequence of Hepatitis B. A subgroup in one of the countries, however, refuses to participate in the program because of their religious beliefs. It was not surprising that most of the sampled households of the subgroup refused to participate in this national sero-prevalence survey of infants. Some households of this population, however, had agreed to participate in a local study that was conducted earlier. The prevalence rate of those cases was estimated to be 6.7%. The actual national survey with a sample size of 1,792 yielded an overall prevalence estimate of about 0.7%. The number of households that refused because of religious reasons was estimated to be about 345. Strict field procedures and a long field period made a 100% contact rate possible. No other reasons than religious beliefs were documented. The prevalence of chronic Hepatitis B infection is therefore underestimated by about 1.16%:
Using percentages: 0.7%− x 100% = x (0.7%−6.7%) = −1.16%345
1,792
Using proportions: 0.007− = x (0.007−0.067=−0.0116
NRP
NRP 3451,792
Nonresponse bias in the prevalence estimate of chronic Hepatitis B infections due to item nonresponse could occur if the respondents refused to answer certain questions for reasons that are associated with the prevalence of Hepatitis B. One example would be that some respondents did not allow the survey organization to take a blood sample of their child to determine the existence of a chronic HBV infection because they are embarrassed that their children were not immunized and might have been exposed to HBV. Nevertheless they answered a long questionnaire about health behavior.
There are several options to measure and diminish nonresponse bias in household surveys (WHO, 2005; Groves and Couper, 1998; Groves, 1989). Because the procedures are specific to unit and item nonresponse we will treat them separately. Over the last decades survey researchers have developed various effective ways in which unit nonresponse can be decreased during the field period of the Hepatitis B immunization survey:
An increased number of contact attempts with the household spread across •different week days and day times decreases the likelihood of unit nonresponse due to non-contact.
In more developed countries with a reliable mail service system and high literacy •rates: Prior contact with the household through an advance letter has been shown to decrease refusal rates. This effect can be strengthened by personalizing the communication between the household and the survey organization during these prior contacts.
Providing more detailed information about the study and the use of collected •data has shown effects in reducing refusal rates.
Additional interviewer training can also help interviewers to convince refusing •respondents to participate in the survey.
• Another frowned upon approach is substitution of a nonresponding household with another one to decrease nonresponse in practice. The approach is, however, definitely not recommended because it destroys the qualities of a probability sample and can lead to substantial bias in key estimates.
Sample design and procedures for Hepatitis B immunization surveys: A companion to the WHO cluster survey reference manual48
Despite all efforts to reduce unit nonresponse bias during the field period there will always be cases that remain nonrespondents. It is therefore recommended to conduct follow-up studies of nonrespondents after the end of the field period. These studies can involve more visits to the samples household to get in contact with them, refusal conversion and a shortened questionnaire. The newly gathered information can then be used to quantify nonresponse bias for at least the estimates of the key statistics. It is also very common to create nonresponse adjustment weights that will be used in statistical analyses to decrease possible nonresponse bias in key estimates.
Like for unit nonresponse, there are also some possibilities to reduce item nonresponse during the survey interview:
Change the structure of the questions so that the interview and the questions •appear less threatening to the respondent, e.g. ask for identifying information at the end of the interview.
Instruct the interviewers to probe nondirective if the respondent answers a •question with “don’t know” or refuses to answer the question. In the latter case it is recommended to reassure the respondent of the confidentiality of the data.
Although these procedures have proven to be quite effective they will never completely erase item nonresponse. A common remedy for this situation is to replace missing values through imputation of data. There are several techniques to impute values for a missing value; the most recommended of them is multiple imputation (Little and Rubin, 2002).
6.D Measurement bias
Measurement bias occurs during the data collection process in a survey and can be classified by its source. Overall, four different measurement bias sources are distinguished (Groves, 1989): the questionnaire, the data collection method, the interviewer, and the respondent. Independent from its source, measurement bias is classified as the difference between the true (but unknown) value of the characteristic to be measured and the value that the respondent provides as an answer. The reader should also keep in mind that measurement bias of a survey estimate cannot only occur due to one of these sources but also through a combination of these as they can interact with each other.
Measurement Bias:
where:
= proportion of the total number of cases that were measured;
= proportion of the cases that were correctly measured;
= proportion of the cases that were incorrectly measured;
CM T
CM
IM
IMPP −P =
MP
P
P
P
= number of all measured cases; and
= number of cases that were measured with error.M
IM
N
N
CM IM(P −P )
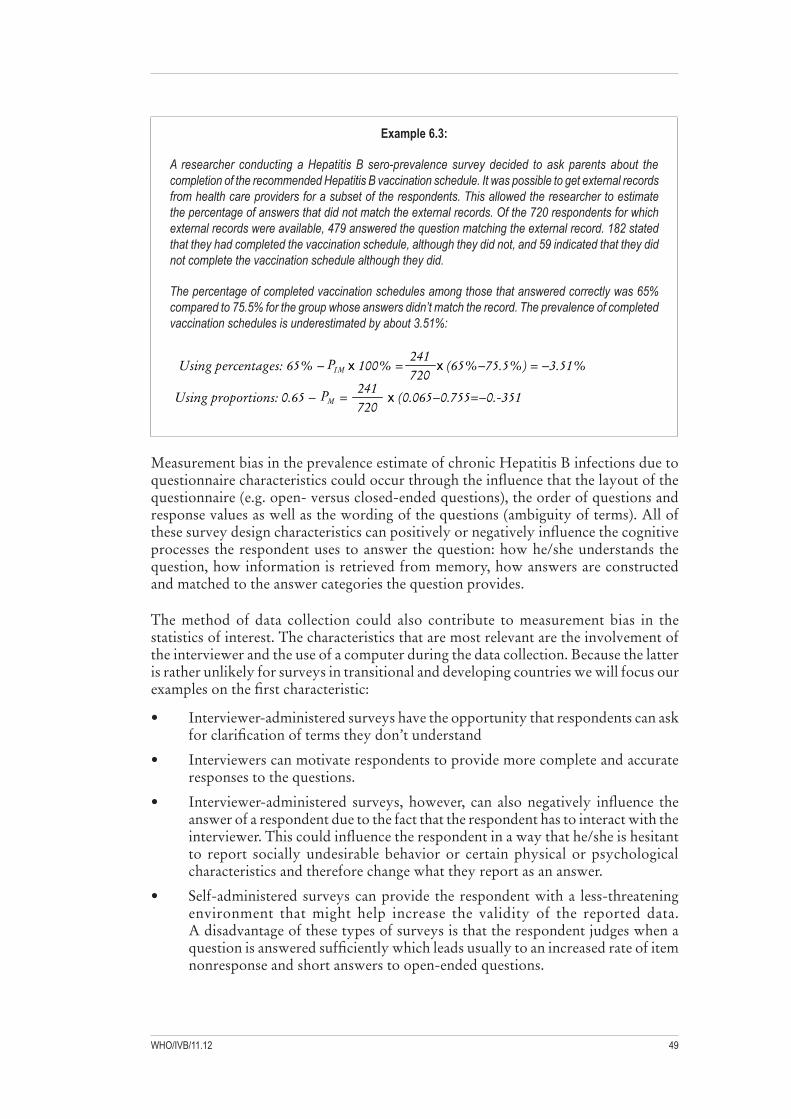
49WHO/IVB/11.12
Example 6.3:
A researcher conducting a Hepatitis B sero-prevalence survey decided to ask parents about the completion of the recommended Hepatitis B vaccination schedule. It was possible to get external records from health care providers for a subset of the respondents. This allowed the researcher to estimate the percentage of answers that did not match the external records. Of the 720 respondents for which external records were available, 479 answered the question matching the external record. 182 stated that they had completed the vaccination schedule, although they did not, and 59 indicated that they did not complete the vaccination schedule although they did.
The percentage of completed vaccination schedules among those that answered correctly was 65% compared to 75.5% for the group whose answers didn’t match the record. The prevalence of completed vaccination schedules is underestimated by about 3.51%:
Using percentages: 65% − x 100% = x (65%−75.5%) = −3.51%241720
Using proportions: 0.65 − = x (0.065−0.755=−0.-351
IMP
MP 241720
Measurement bias in the prevalence estimate of chronic Hepatitis B infections due to questionnaire characteristics could occur through the influence that the layout of the questionnaire (e.g. open- versus closed-ended questions), the order of questions and response values as well as the wording of the questions (ambiguity of terms). All of these survey design characteristics can positively or negatively influence the cognitive processes the respondent uses to answer the question: how he/she understands the question, how information is retrieved from memory, how answers are constructed and matched to the answer categories the question provides.
The method of data collection could also contribute to measurement bias in the statistics of interest. The characteristics that are most relevant are the involvement of the interviewer and the use of a computer during the data collection. Because the latter is rather unlikely for surveys in transitional and developing countries we will focus our examples on the first characteristic:
Interviewer-administered surveys have the opportunity that respondents can ask •for clarification of terms they don’t understand
Interviewers can motivate respondents to provide more complete and accurate •responses to the questions.
Interviewer-administered surveys, however, can also negatively influence the •answer of a respondent due to the fact that the respondent has to interact with the interviewer. This could influence the respondent in a way that he/she is hesitant to report socially undesirable behavior or certain physical or psychological characteristics and therefore change what they report as an answer.
Self-administered surveys can provide the respondent with a less-threatening •environment that might help increase the validity of the reported data. A disadvantage of these types of surveys is that the respondent judges when a question is answered sufficiently which leads usually to an increased rate of item nonresponse and short answers to open-ended questions.

Sample design and procedures for Hepatitis B immunization surveys: A companion to the WHO cluster survey reference manual50
As important as interviewer involvement is with regard to measurement bias introduced by various data collection methods, the characteristics of the interviewer itself can also have tremendous impact on data quality as the following examples will show:
The interviewers might differ among each other in the way they read the question, •follow skip patterns in the questionnaire, answer questions of the respondent and provide feedback.
Even the intonation of their voice or other personal characteristics can alter the •way a respondent understands and answers a question.
These examples emphasize the need for standardized interviewing procedures and thorough interviewing training and monitoring.
Besides the questionnaire itself, the method of data collection and the interviewer, the respondent himself/herself can be seen as one of the main sources of measurement bias in the data. The following examples try to cover instances throughout the cognitive process used to answer a question that could create measurement bias:
• The respondent could have encoded the information needed to answer the question imperfectly and therefore has to reconstruct a memory.
The question itself could have been understood in a way that differs from the •intentions of the questionnaire designer.
When retrieving information to answer the question it is possible that the •respondent misses information because of the retrieval strategy he/she uses.
Once information pieces have been collected to answer the question, biases can •be introduced because the respondent has to combine the information to provide an answer that matches the answer categories. At that point the respondent also judges if the answer is appropriate.
Especially for sensitive questions, respondents can also introduce bias by changing •their answer to match social standards when they communicate their answers.
As for previous sources of bias they are various ways to either decrease or quantify measurement bias. It is possible to find for each measurement bias source approaches that aim at reducing measurement bias (Groves, 1989):
• Cognitive interviews:
Concurrent or retrospective verbal reports during the questionnaire development help the questionnaire designer to gain insight where respondents of various backgrounds have difficulties of understanding certain questions, how respondents interpret questions, and how they compose an answer.
• Pre-tests of questionnaires:
Once a final draft of the questionnaire exists it is recommended to do pre-tests with respondents that were not sampled for the survey. In a pretest, the interview should include all the procedures as to identify problems within the questionnaire, like incorrect skip patterns, as well as with the administration of the questionnaire.

51WHO/IVB/11.12
• Interviewer training:
Interviewer training should be used to educate interviewers about the interviewer material, definition of terms that are used, appropriate interviewer behavior, household screening, and respondent selection. It also should help to standardize interviewer behavior as much as possible.
• Interviewer supervision:
Interviewers should be supervised and monitored at all stages through document monitoring or even revisiting of sampling units or household. This minimizes the likelihood of interviewer falsification and provides opportunity to determine interviewers that might have problems.
Again, we cannot expect that all our efforts to reduce measurement boas will eliminate it. Therefore it is helpful to use also techniques that are aimed to quantify measurement bias (WHO, 2005; Groves, 1989):
• Randomized experiments:
Randomized experiments can be used to compare a small number of design alternatives (e.g. different question orders or alternative question wording) and quantify the differences in the statistic of interest between them.
• Reinterview studies:
Reinterview studies include a replication of measurement on at least some of the sampling units and a comparison between the answers the respondent provided at each time.
• Record check studies:
The assessment of measurement bias via a record check study is only possible if records that represent the “truth” are available from another source than the respondent him- or herself. The answers of the respondents are then checked against the records and disagreements can be quantified.
6.E Processing bias
Processing bias occurs when the collected data are incorrectly processed into a format that makes statistical analysis feasible. The many steps of data processing include data entry, data editing, possible imputation of missing values, coding of open-ended responses, and preparation of final datasets. Because of the large number of tasks that are involved in this process there are also various mechanisms that can introduce processing bias. Overall, the computerization of these processes has generally minimized the amount of mistakes, systematic as well as random, when interviewers are comfortable and well trained in using them. Especially the use of computers and consistency checks at the time the data are collected greatly improved the quality of the data with regard to processing bias. However, in many developing and transitional countries computers may be not available to support interviewers during the data collection itself. It can be expected that data collected by paper-and-pencil interviewing are more vulnerable to processing bias. The next examples show situations where processing bias might occur if the statistic of interest is associated with mistakes made during the data processing.

Sample design and procedures for Hepatitis B immunization surveys: A companion to the WHO cluster survey reference manual52
Processing bias in the prevalence estimate of chronic Hepatitis B infections of an immunization survey could occur if respondents with substantially higher or lower chronic Hepatitis B infections are the cases where mistakes (random or systematic) are made. Examples for processing mistakes that can be made are:
The occurrence of keying errors when the collected data was entered in a computer •because e.g. the handwriting of the interviewer wasn’t legible and a wrong answer was asserted or the wrong key was pressed when entering numerical information or coded responses.
The miscoding of open-ended responses by applying randomly or consistently the •wrong code to a particular class of open-ended responses. This could potentially misclassify a subgroup of respondents.
The incorrect or inconsistent application of editing rules like checking the skip •patterns, the logical consistency of answers from a respondent, or assessing the plausibility of answers as provided by the respondent.
Processing Bias:
where:
CP T
CP
IP
P −P = IPN
PN
P
P
P
P
IP
N
N
CP IP(P −P )
TP = proportion of all processed cases;
= proportion of the correctly processed cases;
= proportion of the incorrectly processed cases;
= number of all processed cases; and
= number of cases that were processed incorrectly.
Example 6.4:
A sero-prevalence survey of Hepatitis B in a subarea with known high Hepatitis B prevalence was conducted and included a longer questionnaire on health habits of the household. After the ending of the field period the data were entered into the computer. Because the sampling units (n=412) were widespread and not documented on maps interviewers were locally hired to conduct the survey. For all questions, interviewers wrote the respondents’ answers on a paper data sheet. One of these questions concerned hygienic habits like how often the respondent washed with boiling water the things their babies come in contact with in the past week. After the data entry a careful analyst notes that one village (n=32) showed a much higher average (8.7) than all other villages in the reported frequency (0.7). The researcher asked his staff to clarify this abnormality. It turns out that the interviewer’s handwriting was difficult to be read and so the personnel that entered the data took the number 0 for a number 9. If the analyst had not been that careful the estimate of the average frequency that households of this subarea disinfect the things their children come in contact with per week would have been overestimated by 0.62:
Using percentages: 0.7% − x100% = x (8.7%−0.7%) = 0.621%32
412
Using proportions: 0.007 − = x (0.087−0.007)=0.00621
IPP
IPP 32412

53WHO/IVB/11.12
There are several possible approaches to detect and possibly diminish processing bias:
Open-ended response coding can be checked by a second coding of a different •coder without knowledge about the code the first coder assigned. This can be either done for all open-ended responses or only for a randomly selected subset. The existence of two independent codings allows establishing intercoder reliability and can give the researcher an impression on how consistent answers were coded.
When data are entered from closed-ended questions the computer can be used •to perform range and consistency checks and diminish the amount of keying errors.
Double entry of data also reduces keying errors in the dataset because inconsistent •items can be clarified based on the original interview documents, e.g. questionnaire or interviewer notes.
In cases where inconsistencies in answers to important questions cannot be •reconciled call-backs to the household can be justified.

Sample design and procedures for Hepatitis B immunization surveys: A companion to the WHO cluster survey reference manual54
7.A Sampling error computation methods and programs
Over the past 50 years, advances in survey sampling theory have guided the development of a number of methods for correctly estimating variances from complex sample data sets. A number of sampling error programs that implement these complex sample variance estimation methods are available to data analysts.8 The two most common approaches to the estimation of sampling error for complex sample data are through the use of a Taylor Series linearization of the estimator (and corresponding approximation to its variance) or through the use of resampling variance estimation procedures such as Balanced Repeated Replication (BRR) or Jackknife Repeated Replication (JRR) (Rust, 1985).
7.A.1 Taylor series linearization method:
STATA Release 9+, SAS V9+, SUDAAN Version 9 and the most recent releases of SPSS are commercially available statistical software packages that include procedures that apply the Taylor series method to estimation and inference for complex sample data.
Stata (StataCorp, 2003) is a more recent commercial entry to the available software for analysis of complex sample survey data and has a growing body of research users. STATA includes special versions of its standard analysis routines that are designed for the analysis of complex sample survey data. Special survey analysis programs are available for descriptive estimation of means (SVYMEAN), ratios (SVYRATIO), proportions (SVYTOT) and population totals (SVYTOTAL). STATA programs for multivariate analysis of survey data include linear regression (SVYREG), logistic regression (SVYLOGIT) and probit regression (SVYPROBT). STATA program offerings for survey data analysts are constantly being expanded. Information on the STATA analysis software system can be found on the Web at: http://www.stata.com.
Programs in SAS Versions 8 and 9 (www.sas.com) also use the Taylor Series or replication methods to estimate variances of means (PROC SurveyMeans), proportions and cross-tabular analysis (PROC SurveyFreq), linear regression (PROC SurveyReg) and logistic regression (PROC SurveyLogistic).
8 Heeringa et al (2010) provide an overview of how to analyze data from complex sample surveys for different software packages (Stata, SAS, SUDAAN and SPSS) including examples for different types of analyses and the resulting analysis results.
7. Analyzing data collected through
complex sample surveys

55WHO/IVB/11.12
SUDAAN (RTI, 2004) is a commercially available software system developed and marketed by the Research Triangle Institute of Research Triangle Park, North Carolina (USA). SUDAAN was developed as a stand-alone software system with capabilities for the more important methods for descriptive and multivariate analysis of survey data, including: estimation and inference for means, proportions and rates (PROC DESCRIPT and PROC RATIO); contingency table analysis (PROC CROSSTAB); linear regression (PROC REGRESS); logistic regression (PROC LOGISTIC); log-linear models (PROC CATAN); and survival analysis (PROC SURVIVAL). SUDAAN V9.0 and earlier versions were designed to read directly from ASCII and SAS system data sets. The latest versions of SUDAAN permit procedures to be called directly from the SAS system. Information on SUDAAN is available at the following web site address: www.rti.org.
SPSS Version 14.0+ (http://www.spss.com) users can obtain the SPSS Complex Samples module which supports Taylor Series Linearization estimation of sampling errors for descriptive statistics (CSDESCRIPTIVES), cross-tabulated data (CSTABULATE), general linear models (CSGLM) and logistic regression (CSLOGISTIC).
7.A.2 Resampling methods:
BRR, JRR and the bootstrap comprise a second class of nonparametric methods for conducting estimation and inference from complex sample data. As suggested by the generic label for this class of methods, BRR, JRR and the bootstrap utilize replicated subsampling of the sample database to develop sampling variance estimates for linear and nonlinear statistics.
WesVar PC (Westat, Inc., 2000) is a software system for personal computers that employs replicated variance estimation methods to conduct the more common types of statistical analysis of complex sample survey data. WesVar PC was developed by Westat, Inc. and is distributed along with documentation to researchers at Westat’s Web site: http://www.westat.com/wesvarpc/. WesVar PC includes a Windows-based application generator that enables the analyst to select the form of data input (SAS data file, SPSS for Windows data base, ASCII data set) and the computation method (BRR or JRR methods). Analysis programs contained in WesVar PC provide the capability for basic descriptive (means, proportions, totals, cross tabulations) and regression (linear, logistic) analysis of complex sample survey data. WesVar also provides the best facility for estimating quantiles of continuous variables (e.g. 95%-tile of a cognitive test score) from survey data. WesVar Complex Samples 4.0 is the latest version of WesVar. Researchers who wish to analyze the complex sample survey data using WesVar PC should choose the BRR or JRR (JK2) replication option.
STATA V9 and SAS V9+ have introduced the option to use JRR or BRR calculation methods as an alternative to the Taylor Series method for all of its svy command options. SUDAAN V9.0 also allows the analysts to select the JRR method for computing sampling variances of survey estimates.

Sample design and procedures for Hepatitis B immunization surveys: A companion to the WHO cluster survey reference manual56
IVEWare is another software option for the JRR estimation of sampling errors for survey statistics. IVEWare has been developed by the Survey Methodology Program of the Survey Research Center and is available free of charge to users at: http://www.isr.umich.edu/src/smp/ive/. IVEWare is based on SAS Macros and requires SAS Version 6.12 or higher. The system includes programs for multiple imputation of item missing data as well as programs for variance estimation in descriptive (means, proportions) and multivariate (regression, logistic regression, survival analysis) analysis of complex sample survey data.
These new and updated software packages include an expanded set of user-friendly, well-documented analysis procedures. Difficulties with sample design specification, data preparation, and data input in the earlier generations of survey analysis software created a barrier to use by analysts who were not survey design specialists. The new software enables the user to input data and output results in a variety of common formats, and the latest versions accommodate direct input of data files from the major analysis software systems.
7.B Sampling error computation models
Regardless of whether the Taylor Series linearization method or a resampling approach is used, estimation of variances for complex sample survey estimates requires the specification of a sampling error computation model. Data analysts who are interested in performing sampling error computations should be aware that the estimation programs identified in the preceding section assume a specific sampling error computation model and will require special sampling error codes. Individual records in the analysis data set must be assigned sampling error codes that identify to the programs the complex structure of the sample (stratification, clustering) and are compatible with the computation algorithms of the various programs. To facilitate the computation of sampling error for statistics based on immunization survey data, design-specific sampling error codes will have to be routinely included in the data set.
Two sampling error code variables have to be defined for each case based on the sample design stratum and primary stage unit (PSU) cluster in which the sample respondent resided. The sampling error strata represent the strata chosen while the sampling error clusters represent the “ultimate clusters” of the sample selection process (Kalton, 1977). The cluster variable code of a multi-stage area probability sample therefore reflects the geographic clustering of sample observations based on the PSUs to which they are assigned. If the PSUs of a complex sample surveys are school districts then the cluster variable code will reflect the clustering of sample observations based on the school district in which they are located.
Although minor recoding may be required to conform to the input requirements of the individual programs, the sampling error codes that are provided should enable analysts to conduct either Taylor Series or Replicated estimation of sampling errors for survey statistics. In programs that use the Taylor Series linearization method, the sampling error codes (stratum and cluster) will typically be input as keyword statements (SAS V9+, SUDAAN V9.0+) or as global settings (STATA V9+) and will be used directly in the computational algorithms. Programs that permit BRR or JRR computations will require the user supplied sampling error codes to construct “replicates weights” that are required for these approaches to variance estimation.

57WHO/IVB/11.12
7.C Summary: preparation of data files of complex sample surveys
To allow the correct analysis of complex sample survey data the data file must contain all the information reflecting the sample selection process. This includes at least the following information is available for each individual respondent in the data set:
Sample design strata (sampling error strata code)1)
Primary sampling unit (sampling error cluster code)2)
Higher-stage sampling unit if applicable3)
Sample weights reflecting the probability of selection and correcting for 4) disproportionate sampling
Sample weights compensating for survey nonresponse due to screening, 5) noncontact and refusal (if desired)
The calculation of sampling weights can be complicated and sampling statisticians should be consulted if complex situations arise.

Sample design and procedures for Hepatitis B immunization surveys: A companion to the WHO cluster survey reference manual58
Agresti, Alan; Coull, Brent A. (1998). “Approximate is better than ‘exact’ for interval estimation of binomial proportions”. The American Statistician 52: 119–126.
Bennett, S. and Woods, T. (1991). “A simplified general method for cluster- sample surveys of developing countries.” World Health Statistics Quarterly, 44(3), pp. 98-106.
Brogan, D., Flagg, E.W., Deming, M., and Waldman, R. (1994). “Increasing the accuracy of the Expanded Programme on Immunization’s cluster survey design.” Annals of Epidemiology, 4(4), pp. 302-311.
Chang MH, Chen CJ, Lai, MS, Hsu HM, Wu TC, Kong MS, Liang DC, Shau WY, Chen DS (1997). Universal hepatitis B vaccination in Taiwan and the incidence of hepatocellular carcinoma in children. Taiwan Childhood Hepatoma Study Group. New England Journal of Medicine, 336 (26), pp. 1855–1859.
Chongsrisawat, V., Yoocharoen, P., Theamboonlers, A., Tharmaphornpilas, P., Warinsathien, P., Sinlaparatsamee, S., Paupunwatana, S., Chaier, K., Khwanjaipanich, S., and Poovorawan, Y. (2006). “Hepatitis B sero-prevalence in Thailand: 12 years after hepatitis B vaccine integration into the national expanded programme on immunization.” Tropical Medicine and International Health, 11(10), pp. 1496-1502.
Cochran, W.G. (1977). Sampling Techniques. Chichester: John Wiley & Sons.
Davaalkham,D.,Ojima,T.,Nymadawa,P.,Tsend,N.,Lkhagvasuren,T.,Wiersma,S.,Uehara,R.,Watanabe,M.,Oki,I.,andNakamura,Y. (2007). “Seroepidemiology of hepatitis B virus infection among children in Mongolia: Results of a nationwide survey.” Pediatrics International, 49, pp.368-374.
Da Villa, G., Piccinino, F., Scolastico, C. Fusco, M., Picciniono, R. and Sepe, A. (1998). “ Long-term epidemiological survey of hepatitis B virus infection in a hyperdemic area (Afragola, southern Italy): results of a pilot vaccination project.” Research in Virology, 149(5), pp. 263-270.
Fleiss, J.M. (1981). Statistical Methods for Rates and Proportions. New York: Wiley.
Groves, R.M. (1989). Survey Errors and Survey Costs. New York: Wiley.
Groves, R.M. and Couper, M.P. (1998). Nonresponse in Household Interview Surveys. New York: Wiley.
Groves, R.M., Fowler, F.J., Couper, M.P., Lepkowski, J.M., Singer, E. and Tourangeau, R. (2004): Survey Methodology. New Work: Wiley.
8. References

59WHO/IVB/11.12
Harpaz, R., McMahon, B.J., Margolis, H.S., Shapiro, C.N., Havron, D., Carpenter, G., Bulkow, L.R., and Wainwright, R.B. (2000). “Elimination of new chronic Hepatitis B virus infections: results of the Alaska immunization program.” The Journal of Infectious Diseases, 181, pp.413-418.
Hartley, H.O. (1962). “Multiple frame surveys.” Proceedings of the Social Science Section of the American Statistical Association Meeting, Minneaspolis, Minnesota.
Hartley, H.O. (1974). “Multiple Frame Methodology and Selected Applications.” Sankhya, Series C, 3, pp. 99-118.
Heeringa, S.G., West, B.T., and Berglund, P.A. (2010). Applied Survey Data Analysis. Boca Raton: Chapman & Hall.
Henderson, R.H. and Sundaresan, T. (1982). “Cluster sampling to assess immunization coverage: a review of experience with a simplified sampling method.” Bulletin of the World Health Organization, 60(2), pp. 253-260.
Hoshard-Woodward, S. (2001). Description and comparison of the methods of cluster sampling and lot quality assurance sampling to assess immunization coverage. (WHO/V&B/01.26). Geneva: World Health Organization.
Hsu, H.M., Lu, C.F. , Lee, S .C. Lin, S .R. and Chen, D.S. (1999) . Seroepidemiologic survey for hepatitis B virus infection in Taiwan: the effect of hepatitis B mass vaccination. Journal of Infectious Diseases, 179, pp. 367-370.
Jain, N., and Hennessey, K. (2009). “Hepatitis B Vaccination Coverage among U.S. Adolescents, National Immunization Survey-Teen, 2006”. Journal of Adolescent Health, 44, pp.561-567.
Kalton, G. (1977). “Practical methods for estimating survey sampling errors.” Bulletin of the International Statistical Institute, 47(3), pp. 495-514.
Kalton, G. (1983). Introduction to survey sampling. Beverly Hills: Sage.
Kalton, G. (1992). Sampling Rare and Elusive Populations. INT-92-P80-16E. Department for Economic and Social Information and Policy Analysis.
Kish, L. (1949). “A procedure for objective respondent selection within the household.” Journal of the American Statistical Association, 44, pp. 380-387.
Kish, L. (1965). Survey Sampling. New York: Wiley.
Kish, L., Groves, R.M, Krotki, K.P. (1976). “Sampling Errors for Fertility Surveys”, Occasional Papers, No.17, Voorburg: International Statistical Institute.
Kish, L. (1988). “Multipurpose sample designs.” Survey Methodology, 14, pp.19-32.
Kish, L. (1989). Sampling Methods for Agricultural Surveys. FAO Statistical Development Series 3, Food and Agriculture Organization of the United Nations, Rome.
Lanata, C.F. and Black, R.E. (1990). “Lot quality assurance sampling techniques in health surveys in developing countries: advantages and current constraints.” World Health Statistics Quarterly, 44(3), pp. 133-139.

Sample design and procedures for Hepatitis B immunization surveys: A companion to the WHO cluster survey reference manual60
Lemeshow, S. & Robinson, D. (1985). “Surveys to measure programme coverage and impact: a review of the methodology used by the expanded programme on immunization.” World Health Statistics Quarterly, 38, pp. 65-75.
Lemeshow, S., Tserkovnyi, A.G., Tulloch, J.L., Dowd, J.E., Lwanga, S.K. and Keja, J. (1985). “A computer simulation of the EPI Survey Stategy.” International Journal of Epidemiology, 14(3), pp. 391-399.
Lemeshow, S. (1990). Adequacy of sample size in health studies. Chichester: Wiley.
Lemeshow, S. and Taber, S. (1991). “Lot quality assurance sampling: single- and double-sampling plans.” World Health Statistics Quarterly, 44(3), pp. 115-132.
Liang, X., Bi, S., Yang, W., Wang, L., Cui, G., Cui, F., Zhang, Y., Liu, J., Gong, X., Chen, Y., Wang, F., Zheng, H., Wang, F., Guo, J., Jia, Z., Ma, J., Wang, H., Luo, H., Li, L., Jin, S., Hadler, S.C., and Wang, Y. “Epidemiological serosurvey of Hepatitis B in China – Declining HBV prevalence due to Hepatitis B vaccination. Vaccine, 27, pp.6550-6557.
Little, R.J.A. and Rubin, D.B. (2002): Statistical Analysis with Missing Data. New York: Wiley.
Madani, T.A. (2007). “Trend in incidence of hepatitis B virus infection during a decade of universal childhood hepatitis B vaccination in Saudi Arabia.” Transactions of the Royal Society of Tropical Medicine and Hygiene, 101, pp.278-283.
Malison, M.D., Sekeito, P., Henderson, P.L., Hawkins, R.V.,Okware, S.I., Jones, T.S. (1987). “Estimating healths ervice utilization, immunization coverage, and childhood mortality: a new approach in Uganda. Bulletin of the World Health Organization, 65 (3), pp. 325-330.
Mast, E., Mahoney, F., Kane, M. and Margiolis, H. (2004). Hepatitis B vaccine. In: Plotkin, S.A., and Orenstein, W.A. (eds.). Vaccines, pp.299-337. Philadelphia: Saunders.
Mele, A., Tosti, M.E., Mariano, A., Pizzuti, R., Ferro, A., Borrini, B., Zotti, C., Lopalco, P., Curtale, F., Balocchini, E., and Spada, E., for the National Surveillance System for Acute Viral Hepatitis (SEIEVA) Collaboration Group (2008). “Acute Hepatitis B 14 Years after the Implementation of Universal Vaccination in Italy: Areas of Improvement and Emerging Challenges.” Clinical Infectious Diseases, 46, pp.868-875.
Milligan,P.,Njie,A.andBennett,S. (2004). “Comparison of two cluster sampling methods for health surveys in developing countries.” International Journal of Epidemiology, 33(3), pp. 469-476.
Research Triangle Institute (RTI) (2004). SUDAAN 9.0 User’s Manual: Software for Statistical Analysis of Correlated Data. Research Triangle Park, NC: Research Triangle Institute.
Robertson, S.E., et al. (1997). “The lot quality technique: a global review of applications in the assessment of health services and disease surveillance.” World Health Statistics Quarterly, 50(3-4), pp. 199-209.
Rust, K. (1985). “Variance estimation for complex estimators in sample surveys,” Journal of Official Statistics, 1(4), pp. 381-397.

61WHO/IVB/11.12
SAS Institute, Inc. (2003). SAS/STAT® User’s Guide, Version 9. Cary, NC: SAS Institute, Inc.
Singh, J., Sharma, R.S., Goel, R.K. and Verghese, T. (1995). “Concurrent evaluation of immunization programme by lot quality assurance sampling. Journal of Tropical Pediatric, 41(4), pp. 215-220.
Sirken, M.G. (1970). ”Household surveys with multiplicity.” Journal of the American Statistical Association, 65(329), pp. 257-277.
Sirken, M.G. (1972). “Stratified sample surveys with multiplicity.” Journal of the American Statistical Association, 65(337), pp. 224-227.
Sirken, M.G. and Levy, P.S. (1974). “Multiplicity estimation of proportions based on ratios of random variables.” Journal of the American Statistical Association, 69, pp. 68-73.
Skinner, C.J., Holt, D., & Smith, T.M.F. (1989). Analysis of Complex Surveys. New York: John Wiley & Sons.
STATA Corp. (2003). STATA Release 8.0-Survey Data. College Station, TX: STATA Corporation.
Thompson, S.K. (1997). Adaptive Sampling. New York: Wiley.
Turner, A.G., Magnani, R.J. and Shuaib, M. (1996). “A Not Quite as Quick but Much Cleaner Alternative to the Expanded Programme on Immunization (EPI) Cluster Survey Design.” International Journal of Epidemiology, 25(1), pp. 198-203.
United Nations (2005). Household Sample Surveys in Developing and Transition Countries. Studies in Methods, Series E, No. 96. New York: United Nations, Statistics Division, Department of Economic and Social Affairs.
Viviani, S., Jack, A., Hall, A.J., Maine, N. Mendy, M., Montesano, R. and Whittle, H.C. (1999). Hepatitis B vaccination in infancy in the Gambia: protection against carriage at 9 years of age. Vaccine, 17, pp. 2946-2950.
Westat, Inc. (2000). WesVar 4.0 User’s Guide. Rockville, MD: Westat, Inc.
World Health Organization (WHO) Vaccine Assessment and Monitoring Team of the Department of Immunization, Vaccines and Biologicals (2005): Immunization Coverage Cluster Survey Reference Manual. WHO/IVB/04.23. Geneva: World Health Organization.
Wolter, K.M. (1985). Introduction to Variance Estimation. New York: Springer.
World Health Organization – Western Pacific Regional Office (WPRO) (2005): Measles Elimination, Hepatitis B Control and Poliomyelitis Eradication. WPR/RC56.R8. Manila: World Health Organization – Western Pacific Regional Office. Available from: http://www.wpro.who.int/rcm/en/archives/rc56/rc_resolutions/wpr_rc56_r08.htm
WPRO year? http://www.wpro.who.int/internet/resources.ashx/epi/docs/hepb/hepbcontrolcertifguidelines.pdf

The World Health Organization has provided technical support to its Member States in the field of vaccine-preventable diseases since 1975. The office carrying out this function at WHO headquarters is the Department of Immunization, Vaccines and Biologicals (IVB).
IVB’s mission is the achievement of a world in which all people at risk are protected against vaccine-preventable diseases. The Department covers a range of activities including research and development, standard-setting, vaccine regulation and quality, vaccine supply and immunization financing, and immunization system strengthening.
These activities are carried out by three technical units: the Initiative for Vaccine Research; the Quality, Safety and Standards team; and the Expanded Programme on Immunization.
The Initiative for Vaccine Research guides, facilitates and provides a vision for worldwide vaccine and immunization technology research and development efforts. It focuses on current and emerging diseases of global public health importance, including pandemic influenza. Its main activities cover: i ) research and development of key candidate vaccines; ii ) implementation research to promote evidence-based decision-making on the early introduction of new vaccines; and iii ) promotion of the development, evaluation and future availability of HIV, tuberculosis and malaria vaccines.
The Quality, Safety and Standards team focuses on supporting the use of vaccines, other biological products and immunization-related equipment that meet current inter-national norms and standards of quality and safety. Activities cover: i ) setting norms and standards and establishing reference preparation materials; ii ) ensuring the use of quality vaccines and immunization equipment through prequalification activities and strengthening national regulatory authorities; and iii ) monitoring, assessing and responding to immunization safety issues of global concern.
The Expanded Programme on Immunization focuses on maximizing access to high quality immunization services, accelerating disease control and linking to other health interventions that can be delivered during immunization contacts. Activities cover: i ) immunization systems strengthening, including expansion of immunization services beyond the infant age group; ii ) accelerated control of measles and maternal and neonatal tetanus; iii ) introduction of new and underutilized vaccines; iv ) vaccine supply and immunization financing; and v ) disease surveillance and immunization coverage monitoring for tracking global progress.
The Director’s Office directs the work of these units through oversight of immunization programme policy, planning, coordination and management. It also mobilizes resources and carries out communication, advocacy and media-related work.
Family and Community Health
World Health Organization 20, Avenue Appia
CH-1211 Geneva 27 Switzerland
E-mail: [email protected] Web site: http://www.who.int/immunization/en/
Department of Immunization, Vaccines and Biologicals