sample pages elastic behavior of polymer melts
TRANSCRIPT

Sample Pages
Elastic Behavior of Polymer Melts
Helmut Münstedt
ISBN (Book): 978-1-56990-754-2 ISBN (E-Book): 978-1-56990-755-9
For further information and order see
www.hanserpublications.com (in the Americas)
www.hanser-fachbuch.de (outside the Americas)
© Carl Hanser Verlag, München

Textbooks about the rheology of polymeric materials are widely available. Most of them deal in great detail with viscous properties, and the viscoelastic behavior typical of polymer melts is frequently addressed by presenting the storage modu-lus from dynamic-mechanical experiments and the normal stress difference from stressing experiments. However, these quantities are determined by viscous and elastic properties, and the elastic behavior has to be extracted from them. This fact and the particular significance of elastic properties for processing and a complete rheological characterization of polymer melts were the source of the idea to pres-ent the scarce and scattered knowledge in this field from the literature in one book, and complement it with results mainly obtained from investigations documented in doctoral theses under the author’s supervision at the Institute of Polymer Mate-rials of the Friedrich-Alexander-University Erlangen-Nuremberg. The elastic be-havior of polymer melts is the property around which this book is written and this concept distinguishes it from other publications on rheology.
Some of the results presented have been used in lecture courses at the Institute and, therefore, the book may be of interest for students in their advanced studies of polymeric materials. Moreover, many parts of this book may support scientists and engineers working in the field of applications of polymers to achieve a deeper un-derstanding of the elastic behavior of polymer melts, which is often neglected in comparison with the viscous properties, but can become a key factor for the opti-mization of processing and products.
To make the book understandable on its own, the rheological basics and definitions of the used quantities necessary for an understanding of its contents are given in introductory chapters. The list of references is kept relatively short. Some—in the author’s opinion—important papers and books are quoted and it is easy to track the special literature in which the reader is interested from these citations.
In terms of materials, unfilled commercial polymeric materials like polyethylenes, polypropylenes, and polystyrenes are covered, together with some polymers of par-ticularly designed molecular structures. Moreover, elastic properties of polymer matrices filled with rigid particles of micro- and nanosize and those of polymer
Preface
VI Preface
blends are discussed, the more complete rheological properties of which, together with their morphologies, are presented in the author’s book Rheological and Mor-phological Properties of Dispersed Polymeric Materials, published by Hanser in 2016.
Stress and time dependences of the elastic behavior are extensively presented, par-ticularly with respect to linear and nonlinear properties. Besides a thorough dis-cussion of the influence of molar mass, its distribution, and long-chain branching on the linear recoverable compliance as a well-defined elastic quantity, the analytic power of recovery measurements and, in particular, the role of retardation spectra calculated from them as a molecular fingerprint, are demonstrated on examples. Furthermore, relations between elastic properties and the “refining” process, which is of interest for product modifications, are discussed.
A special part of the book is dedicated to the relevance of the elastic behavior for processing. In this regard, the extrudate swell in its various facets is extensively discussed. The relevance of elasticity at short times, characterized by the Deborah number, is considered, and special relations between this quantity and the film drawing performance are presented. The interplay between segmental orientation and recoverable strain is addressed. The role of this quantity for mechanical prop-erties of injection-molded parts is discussed. As special applications strongly de-termined by recoverable deformation stretch and shrink films are described.
Some of the results presented were taken from doctoral theses performed at the Institute of Polymer Materials over the years and were not published before. I would like to express my thanks to the following former doctoral students of mine, who gave me their kind permissions to use their results in this book: Dr. Claus Gabriel, Dr. Julia Gobl-Resch, Dr. Hans-Jürgen Griess, Dr. Jens Hepperle, Dr. Nikolaos Katsikis, Dr. Andreas Kirchberger, Dr. Michael Schmidt, and Dr. Christian Triebel. Dr. Johannes Krückel and Dipl. Ing. Steffen Berger are thanked for the electron micrograph on carbon black and the measurements on the refined polypropylene, respectively.
I gratefully acknowledge the critical reading of some chapters by Dr. Mathias Bechert, Dr. Ulrich A. Handge, Dr. Joachim Kaschta, Prof. Dr. Florian Stadler, Prof. Dr. Martin Zatloukal, and Dr. Friedrich Wolff. Their comments and the many fruit-ful discussions are highly appreciated.
Last but not least, I would like to thank M.Sc. Michael Redel from the Institute of Polymer Materials for his efficient support in preparing the figures and Dr. Julia Diaz Luque from Carl Hanser Verlag, Munich, for the very competent editing of the manuscript.
Erlangen, January 2019 Helmut Münstedt

Prof. Dr. Helmut Münstedt is a retired professor of the Friedrich-Alexander-Univer-sity Erlangen-Nuremberg. He was in charge of the Institute of Polymer Materials at the Department of Materials Science and Engineering. His research was centered on the properties of polymeric materials in a wide field, from medical applications to processing. Fundamental work has been performed on the influence of molecu-lar structure on the many facets of the rheological behavior. One main aspect was the relationship between rheology and processing and the other the role of rheo-logy in characterizing polymers. For measurements of elongational properties and quantitative investigations of capillary flows of polymer melts, special experimen-tal methods were developed that became the basis of innovative insights. Modifica-tions of polymeric materials using physical means were performed by the addition of various fillers and blending of polymer components. Applications of these mate-rials cover wide fields and range from antimicrobial to electrically conducting pol-ymers, for example.
Before becoming a professor, H. Münstedt worked at BASF SE, Ludwigshafen, Ger-many, in various positions in the research, development, and application of poly-meric materials. He received his diploma and doctoral degree in physics from the University of Stuttgart.
Prof. Münstedt published more than 200 research papers in various highly estab-lished scientific journals and contributed articles to several textbooks. Together with Prof. Dr. F. R. Schwarzl he is the author of the book “Deformation and Flow of Polymeric Materials”, which appeared in 2014 (Springer). In 2016, his book “ Rheological and Morphological Properties of Dispersed Polymeric Materials” was published by Hanser.
About the Author

Preface . . . . . . . . . . . . . . . . . . . . . . . . . . . . . . . . . . . . . . . . . . . . . . . . . . . . . . . . . . . . . . . V
About the Author . . . . . . . . . . . . . . . . . . . . . . . . . . . . . . . . . . . . . . . . . . . . . . . . . . . . . VII
List of Symbols Used in the Book . . . . . . . . . . . . . . . . . . . . . . . . . . . . . . . . . . . IX
1 Introduction . . . . . . . . . . . . . . . . . . . . . . . . . . . . . . . . . . . . . . . . . . . . . . . . . . . . . 11.1 References . . . . . . . . . . . . . . . . . . . . . . . . . . . . . . . . . . . . . . . . . . . . . . . . . . . . . . . . 2
2 Phenomenological Evidence of Elasticity . . . . . . . . . . . . . . . . . . . . . . 32.1 Effects Due to Normal Stresses . . . . . . . . . . . . . . . . . . . . . . . . . . . . . . . . . . . . . . 3
2.2 Extrudate Swell . . . . . . . . . . . . . . . . . . . . . . . . . . . . . . . . . . . . . . . . . . . . . . . . . . . . 4
2.3 Contraction Flow . . . . . . . . . . . . . . . . . . . . . . . . . . . . . . . . . . . . . . . . . . . . . . . . . . 4
2.4 Time Dependence . . . . . . . . . . . . . . . . . . . . . . . . . . . . . . . . . . . . . . . . . . . . . . . . . . 5
2.5 References . . . . . . . . . . . . . . . . . . . . . . . . . . . . . . . . . . . . . . . . . . . . . . . . . . . . . . . . 6
3 Principles of the Determination of Elastic Properties . . . . . . . . . 73.1 Creep Recovery Experiment and Retardation Spectrum . . . . . . . . . . . . . . . 7
3.2 Relaxation Experiment and Relaxation Spectrum . . . . . . . . . . . . . . . . . . . . 11
3.3 Dynamic-Mechanical Experiment . . . . . . . . . . . . . . . . . . . . . . . . . . . . . . . . . . . 12
3.4 Stressing Experiment . . . . . . . . . . . . . . . . . . . . . . . . . . . . . . . . . . . . . . . . . . . . . . 15
3.5 Capillary Rheometry . . . . . . . . . . . . . . . . . . . . . . . . . . . . . . . . . . . . . . . . . . . . . . . 16
3.6 Recoverable Elongation . . . . . . . . . . . . . . . . . . . . . . . . . . . . . . . . . . . . . . . . . . . . . 18
3.7 References . . . . . . . . . . . . . . . . . . . . . . . . . . . . . . . . . . . . . . . . . . . . . . . . . . . . . . . . 19
Contents

XVI Contents
4 Experimental Basics of Various Methods for Measuring the Elastic Behavior . . . . . . . . . . . . . . . . . . . . . . . . . . . . . . . . . . . . . . . . . . . . . 21
4.1 Thermal Stability . . . . . . . . . . . . . . . . . . . . . . . . . . . . . . . . . . . . . . . . . . . . . . . . . . 21
4.2 Linearity and Stationarity . . . . . . . . . . . . . . . . . . . . . . . . . . . . . . . . . . . . . . . . . . 234.2.1 Creep Recovery Experiment . . . . . . . . . . . . . . . . . . . . . . . . . . . . . . . . . . 234.2.2 Relaxation Experiment . . . . . . . . . . . . . . . . . . . . . . . . . . . . . . . . . . . . . . . 274.2.3 Dynamic-Mechanical Experiments . . . . . . . . . . . . . . . . . . . . . . . . . . . . 274.2.4 Stressing Experiments . . . . . . . . . . . . . . . . . . . . . . . . . . . . . . . . . . . . . . . 284.2.5 Extrudate Swell . . . . . . . . . . . . . . . . . . . . . . . . . . . . . . . . . . . . . . . . . . . . . 294.2.6 Recoverable Elongation . . . . . . . . . . . . . . . . . . . . . . . . . . . . . . . . . . . . . . 31
4.3 References . . . . . . . . . . . . . . . . . . . . . . . . . . . . . . . . . . . . . . . . . . . . . . . . . . . . . . . . 34
5 Dependence of Elastic Quantities on Experimental Parameters 375.1 Recoverable Compliance . . . . . . . . . . . . . . . . . . . . . . . . . . . . . . . . . . . . . . . . . . . . 37
5.1.1 Stress Dependence . . . . . . . . . . . . . . . . . . . . . . . . . . . . . . . . . . . . . . . . . . 375.1.2 Temperature Dependence . . . . . . . . . . . . . . . . . . . . . . . . . . . . . . . . . . . . 38
5.2 Relaxation Modulus . . . . . . . . . . . . . . . . . . . . . . . . . . . . . . . . . . . . . . . . . . . . . . . . 41
5.3 Storage Modulus . . . . . . . . . . . . . . . . . . . . . . . . . . . . . . . . . . . . . . . . . . . . . . . . . . . 44
5.4 Normal Stress Difference . . . . . . . . . . . . . . . . . . . . . . . . . . . . . . . . . . . . . . . . . . . 45
5.5 Recoverable Elongation . . . . . . . . . . . . . . . . . . . . . . . . . . . . . . . . . . . . . . . . . . . . . 48
5.6 Extrudate Swell . . . . . . . . . . . . . . . . . . . . . . . . . . . . . . . . . . . . . . . . . . . . . . . . . . . . 505.6.1 General Features of Extrudate Swell . . . . . . . . . . . . . . . . . . . . . . . . . . 505.6.2 Detailed Analysis of Extrudate Swell . . . . . . . . . . . . . . . . . . . . . . . . . . 525.6.3 Extrudate Swell for Various Die Geometries . . . . . . . . . . . . . . . . . . . 53
5.7 References . . . . . . . . . . . . . . . . . . . . . . . . . . . . . . . . . . . . . . . . . . . . . . . . . . . . . . . . 54
6 Dependence of Elastic Properties on Molecular Structure . . . . 576.1 Analysis of Molecular Structure . . . . . . . . . . . . . . . . . . . . . . . . . . . . . . . . . . . . . 57
6.1.1 Molar Mass Distribution and Its Characteristic Quantities . . . . . . 576.1.2 Branches and Their Analysis . . . . . . . . . . . . . . . . . . . . . . . . . . . . . . . . . 60
6.2 Influence of Molar Mass . . . . . . . . . . . . . . . . . . . . . . . . . . . . . . . . . . . . . . . . . . . . 646.2.1 Linear Elastic Properties . . . . . . . . . . . . . . . . . . . . . . . . . . . . . . . . . . . . . 646.2.2 Nonlinear Elastic Properties . . . . . . . . . . . . . . . . . . . . . . . . . . . . . . . . . . 66
6.3 Influence of Molar Mass Distribution . . . . . . . . . . . . . . . . . . . . . . . . . . . . . . . . 686.3.1 Linear Elastic Properties . . . . . . . . . . . . . . . . . . . . . . . . . . . . . . . . . . . . . 68
6.3.1.1 Dependence on the Polydispersity Index . . . . . . . . . . . . . . . 696.3.1.2 Effect of High Molar Mass Components . . . . . . . . . . . . . . . . 73
6.3.2 Nonlinear Elastic Properties . . . . . . . . . . . . . . . . . . . . . . . . . . . . . . . . . . 77

XVIIContents
6.4 Influence of Long-Chain Branching . . . . . . . . . . . . . . . . . . . . . . . . . . . . . . . . . . 836.4.1 Linear Elastic Properties . . . . . . . . . . . . . . . . . . . . . . . . . . . . . . . . . . . . . 83
6.4.1.1 Long-Chain Branched Polystyrenes . . . . . . . . . . . . . . . . . . . . 836.4.1.2 Long-Chain Branched Polyolefins . . . . . . . . . . . . . . . . . . . . . . 846.4.1.3 Temperature Dependence of Linear Elastic Compliances 866.4.1.4 Retardation Spectra . . . . . . . . . . . . . . . . . . . . . . . . . . . . . . . . . . 886.4.1.5 Relaxation Spectra . . . . . . . . . . . . . . . . . . . . . . . . . . . . . . . . . . . 92
6.4.2 Nonlinear Elastic Properties . . . . . . . . . . . . . . . . . . . . . . . . . . . . . . . . . . 946.4.2.1 Recoverable Compliance . . . . . . . . . . . . . . . . . . . . . . . . . . . . . . 946.4.2.2 Damping Function . . . . . . . . . . . . . . . . . . . . . . . . . . . . . . . . . . . 956.4.2.3 Extrudate Swell . . . . . . . . . . . . . . . . . . . . . . . . . . . . . . . . . . . . . . 966.4.2.4 Recoverable Elongation . . . . . . . . . . . . . . . . . . . . . . . . . . . . . . . 99
6.5 Influence of Mechanical Pretreatments on Elastic Properties . . . . . . . . . . 1016.5.1 Extrudate Swell of Long-Chain Branched Polyethylenes . . . . . . . . 1016.5.2 Elastic Properties of a Long-Chain Branched and a Linear
Polypropylene . . . . . . . . . . . . . . . . . . . . . . . . . . . . . . . . . . . . . . . . . . . . . . . 104
6.6 References . . . . . . . . . . . . . . . . . . . . . . . . . . . . . . . . . . . . . . . . . . . . . . . . . . . . . . . . 106
7 Models for the Description of Elastic Effects . . . . . . . . . . . . . . . . . . 1117.1 Spring-Dashpot Models . . . . . . . . . . . . . . . . . . . . . . . . . . . . . . . . . . . . . . . . . . . . . 111
7.2 Entanglements . . . . . . . . . . . . . . . . . . . . . . . . . . . . . . . . . . . . . . . . . . . . . . . . . . . . 114
7.3 Doi-Edwards Theory . . . . . . . . . . . . . . . . . . . . . . . . . . . . . . . . . . . . . . . . . . . . . . . 116
7.4 Theory for Long-Chain Branched Polymers . . . . . . . . . . . . . . . . . . . . . . . . . . 117
7.5 Mixing Rule for the Linear Steady-State Recoverable Compliance of Blends . . . . . . . . . . . . . . . . . . . . . . . . . . . . . . . . . . . . . . . . . . . . . . . . . . . . . . . . . . 119
7.6 Numerical Description of the Nonlinear Behavior of the Steady-State Recoverable Compliance . . . . . . . . . . . . . . . . . . . . . . . . . . . . . . . . . . . . . . . . . . . . 123
7.7 Numerical Descriptions of Extrudate Swell . . . . . . . . . . . . . . . . . . . . . . . . . . 1257.7.1 Entry Region . . . . . . . . . . . . . . . . . . . . . . . . . . . . . . . . . . . . . . . . . . . . . . . . 1257.7.2 Flow within the Capillary . . . . . . . . . . . . . . . . . . . . . . . . . . . . . . . . . . . . 126
7.8 References . . . . . . . . . . . . . . . . . . . . . . . . . . . . . . . . . . . . . . . . . . . . . . . . . . . . . . . . 128
8 Elastic Behavior and Its Relevance for Various Applications . . 1318.1 Creep Recovery Experiments as a Contribution to Molecular Analysis . 131
8.1.1 Creep Recovery Compliance . . . . . . . . . . . . . . . . . . . . . . . . . . . . . . . . . . 1318.1.2 Retardation Spectra . . . . . . . . . . . . . . . . . . . . . . . . . . . . . . . . . . . . . . . . . . 1338.1.3 Calculation of Dynamic-Mechanical Quantities from
Retardation Spectra . . . . . . . . . . . . . . . . . . . . . . . . . . . . . . . . . . . . . . . . . . 135
8.2 Elastic Properties and Entrance Flow Patterns . . . . . . . . . . . . . . . . . . . . . . . 137

XVIII Contents
8.3 Elastic Behavior of Refined Polyethylenes and Their Relation to End-Use Properties . . . . . . . . . . . . . . . . . . . . . . . . . . . . . . . . . . . . . . . . . . . . . . . . 1408.3.1 Application-Related Properties of IUPAC C in Comparison
with IUPAC A . . . . . . . . . . . . . . . . . . . . . . . . . . . . . . . . . . . . . . . . . . . . . . . 1418.3.2 Optical Properties of Various Polyethylenes After
Mechanical Pretreatments . . . . . . . . . . . . . . . . . . . . . . . . . . . . . . . . . . . . 141
8.4 Extrudate Swell as a Quantity for Qualitative Material Specifications . . 142
8.5 References . . . . . . . . . . . . . . . . . . . . . . . . . . . . . . . . . . . . . . . . . . . . . . . . . . . . . . . . 144
9 Polymeric Materials with Microparticles . . . . . . . . . . . . . . . . . . . . . . . 1479.1 General Experimental Features . . . . . . . . . . . . . . . . . . . . . . . . . . . . . . . . . . . . . 147
9.1.1 Slip and Edge Fracture . . . . . . . . . . . . . . . . . . . . . . . . . . . . . . . . . . . . . . . 1479.1.2 Yielding . . . . . . . . . . . . . . . . . . . . . . . . . . . . . . . . . . . . . . . . . . . . . . . . . . . . 148
9.2 Glass Beads as Fillers . . . . . . . . . . . . . . . . . . . . . . . . . . . . . . . . . . . . . . . . . . . . . . 1509.2.1 Determination of Yield Stresses . . . . . . . . . . . . . . . . . . . . . . . . . . . . . . . 1509.2.2 Recoverable Strain . . . . . . . . . . . . . . . . . . . . . . . . . . . . . . . . . . . . . . . . . . . 1539.2.3 Colloidal Glasses . . . . . . . . . . . . . . . . . . . . . . . . . . . . . . . . . . . . . . . . . . . . 1559.2.4 Model for Suspended Glass Beads of Microsize . . . . . . . . . . . . . . . . 1559.2.5 Dynamic-Mechanical Measurements . . . . . . . . . . . . . . . . . . . . . . . . . . 157
9.3 Normal Stress Differences and Recoverable Strain . . . . . . . . . . . . . . . . . . . . 159
9.4 Extrudate Swell . . . . . . . . . . . . . . . . . . . . . . . . . . . . . . . . . . . . . . . . . . . . . . . . . . . . 163
9.5 Various Microfillers . . . . . . . . . . . . . . . . . . . . . . . . . . . . . . . . . . . . . . . . . . . . . . . . 165
9.6 References . . . . . . . . . . . . . . . . . . . . . . . . . . . . . . . . . . . . . . . . . . . . . . . . . . . . . . . . 165
10 Polymeric Materials with Nanoparticles . . . . . . . . . . . . . . . . . . . . . . . 16710.1 Nanoparticles Investigated . . . . . . . . . . . . . . . . . . . . . . . . . . . . . . . . . . . . . . . . . 168
10.2 Dynamic-Mechanical Experiments . . . . . . . . . . . . . . . . . . . . . . . . . . . . . . . . . . 17110.2.1 Determination of Linear Behavior . . . . . . . . . . . . . . . . . . . . . . . . . . . . . 17110.2.2 Melts with Various Concentrations of Nanoparticles . . . . . . . . . . . 172
10.3 Creep and Creep Recovery Experiments . . . . . . . . . . . . . . . . . . . . . . . . . . . . . 17610.3.1 Influence of a Particle Network . . . . . . . . . . . . . . . . . . . . . . . . . . . . . . . 17610.3.2 Nanosilica-Filled PMMA as a Model System . . . . . . . . . . . . . . . . . . . 17710.3.3 Retardation Spectra . . . . . . . . . . . . . . . . . . . . . . . . . . . . . . . . . . . . . . . . . . 179
10.4 Model . . . . . . . . . . . . . . . . . . . . . . . . . . . . . . . . . . . . . . . . . . . . . . . . . . . . . . . . . . . . . 18010.4.1 Experimental Results Supporting the Model . . . . . . . . . . . . . . . . . . . 182
10.4.1.1 Dependence of the Recoverable Compliance on Filler Size . . . . . . . . . . . . . . . . . . . . . . . . . . . . . . . . . . . . . . . . . . . 182
10.4.1.2 Stress Dependence of the Recoverable Compliance . . . . . 182

XIXContents
10.5 Temperature Dependence of Creep and Creep Recovery . . . . . . . . . . . . . . 185
10.6 Influence of the Polymer Matrix on the Linear Steady-State Recoverable Compliance . . . . . . . . . . . . . . . . . . . . . . . . . . . . . . . . . . . . . . . . . . . . 188
10.7 Linear Elastic Properties of Melts with Various Nanofillers . . . . . . . . . . . . 19010.7.1 Polymethylmethacrylate with Nanoclay . . . . . . . . . . . . . . . . . . . . . . . 19110.7.2 Polymethylmethacrylate with Graphite . . . . . . . . . . . . . . . . . . . . . . . . 19210.7.3 Polymethylmethacrylate, Polycarbonate, and Polypropylene
with Carbon Nanotubes . . . . . . . . . . . . . . . . . . . . . . . . . . . . . . . . . . . . . . 193
10.8 Nonlinear Elastic Properties . . . . . . . . . . . . . . . . . . . . . . . . . . . . . . . . . . . . . . . . 19510.8.1 Extrudate Swell . . . . . . . . . . . . . . . . . . . . . . . . . . . . . . . . . . . . . . . . . . . . . 19510.8.2 Recoverable Elongation . . . . . . . . . . . . . . . . . . . . . . . . . . . . . . . . . . . . . . 196
10.9 Comparison of Nonlinear and Linear Elastic Properties . . . . . . . . . . . . . . . 198
10.10 References . . . . . . . . . . . . . . . . . . . . . . . . . . . . . . . . . . . . . . . . . . . . . . . . . . . . . . . . 198
11 Immiscible Polymer Blends . . . . . . . . . . . . . . . . . . . . . . . . . . . . . . . . . . . . . 20111.1 Linear Elastic Behavior . . . . . . . . . . . . . . . . . . . . . . . . . . . . . . . . . . . . . . . . . . . . . 202
11.1.1 Dynamic-Mechanical Experiments . . . . . . . . . . . . . . . . . . . . . . . . . . . . 20211.1.2 Recoverable Shear . . . . . . . . . . . . . . . . . . . . . . . . . . . . . . . . . . . . . . . . . . . 208
11.2 Nonlinear Elastic Behavior . . . . . . . . . . . . . . . . . . . . . . . . . . . . . . . . . . . . . . . . . 21111.2.1 Recoverable Elongation . . . . . . . . . . . . . . . . . . . . . . . . . . . . . . . . . . . . . . 21211.2.2 Extrudate Swell . . . . . . . . . . . . . . . . . . . . . . . . . . . . . . . . . . . . . . . . . . . . . 215
11.3 References . . . . . . . . . . . . . . . . . . . . . . . . . . . . . . . . . . . . . . . . . . . . . . . . . . . . . . . . 217
12 Influence of Elastic Properties on Processing . . . . . . . . . . . . . . . . . 21912.1 Measurement of Elastic Quantities at High Shear Rates . . . . . . . . . . . . . . . 219
12.2 The Role of Extrudate Swell in the Shape of Extruded Parts . . . . . . . . . . . 222
12.3 The Role of Extrudate Swell in Pelletizing . . . . . . . . . . . . . . . . . . . . . . . . . . . . . . 223
12.4 The Role of Extrudate Swell in Additive Manufacturing by Material Extrusion . . . . . . . . . . . . . . . . . . . . . . . . . . . . . . . . . . . . . . . . . . . . . . . . . 224
12.5 Extrudate Swell and Extrusion through an Annular Die . . . . . . . . . . . . . . 225
12.6 Extrudate Swell of Rectangular Dies . . . . . . . . . . . . . . . . . . . . . . . . . . . . . . . . . 228
12.7 Influence of Tensile Stress on Extrudate Swell . . . . . . . . . . . . . . . . . . . . . . . 231
12.8 Elastic Properties of Polymer Melts and Their Relation with Film Drawing . . . . . . . . . . . . . . . . . . . . . . . . . . . . . . . . . . . . . . . . . . . . . . . . . . . . . . 23312.8.1 Basic Features of Film Drawing . . . . . . . . . . . . . . . . . . . . . . . . . . . . . . . 23312.8.2 Models for the Drawing Process . . . . . . . . . . . . . . . . . . . . . . . . . . . . . . 23412.8.3 Drawing Experiments on Three Polypropylenes . . . . . . . . . . . . . . . . 236

XX Contents
12.9 Draw Resonance . . . . . . . . . . . . . . . . . . . . . . . . . . . . . . . . . . . . . . . . . . . . . . . . . . . 23812.9.1 Film Drawing . . . . . . . . . . . . . . . . . . . . . . . . . . . . . . . . . . . . . . . . . . . . . . . 23812.9.2 Fiber Spinning . . . . . . . . . . . . . . . . . . . . . . . . . . . . . . . . . . . . . . . . . . . . . . 24212.9.3 Comparison with Results from the Literature . . . . . . . . . . . . . . . . . . 243
12.10 References . . . . . . . . . . . . . . . . . . . . . . . . . . . . . . . . . . . . . . . . . . . . . . . . . . . . . . . . 244
13 Influences of Processing on Molecular Orientation and Recoverable Strain . . . . . . . . . . . . . . . . . . . . . . . . . . . . . . . . . . . . . . . . . . . . . . 247
13.1 General Influence of Processing . . . . . . . . . . . . . . . . . . . . . . . . . . . . . . . . . . . . . 247
13.2 Molecular Orientation and Recoverable Strain . . . . . . . . . . . . . . . . . . . . . . . 249
13.3 Injection-Molded Parts from Amorphous Polymers . . . . . . . . . . . . . . . . . . . 25213.3.1 Recoverable Strain within an Injection-Molded Part . . . . . . . . . . . . 25213.3.2 Mechanical Properties of Injection-Molded Parts . . . . . . . . . . . . . . . 254
13.4 Films from Semi-crystalline Polymers . . . . . . . . . . . . . . . . . . . . . . . . . . . . . . . 25713.4.1 Stretch Films . . . . . . . . . . . . . . . . . . . . . . . . . . . . . . . . . . . . . . . . . . . . . . . . 25813.4.2 Shrink Films . . . . . . . . . . . . . . . . . . . . . . . . . . . . . . . . . . . . . . . . . . . . . . . . 261
13.4.2.1 Thermal Shrinkage of Uniaxially Stretched Films . . . . . . . 26213.4.2.2 Shrinkage of Biaxially Stretched Films . . . . . . . . . . . . . . . . . 263
13.4.3 Role of Molecular Orientation for Applications . . . . . . . . . . . . . . . . . 26513.4.3.1 Applications of Stretch Films . . . . . . . . . . . . . . . . . . . . . . . . . . 26513.4.3.2 Applications of Shrink Films . . . . . . . . . . . . . . . . . . . . . . . . . . 266
13.5 References . . . . . . . . . . . . . . . . . . . . . . . . . . . . . . . . . . . . . . . . . . . . . . . . . . . . . . . . 267
Index . . . . . . . . . . . . . . . . . . . . . . . . . . . . . . . . . . . . . . . . . . . . . . . . . . . . . . . . . . . . . . . . . . 269
3�� 3.1� Creep Recovery Experiment and
Retardation Spectrum
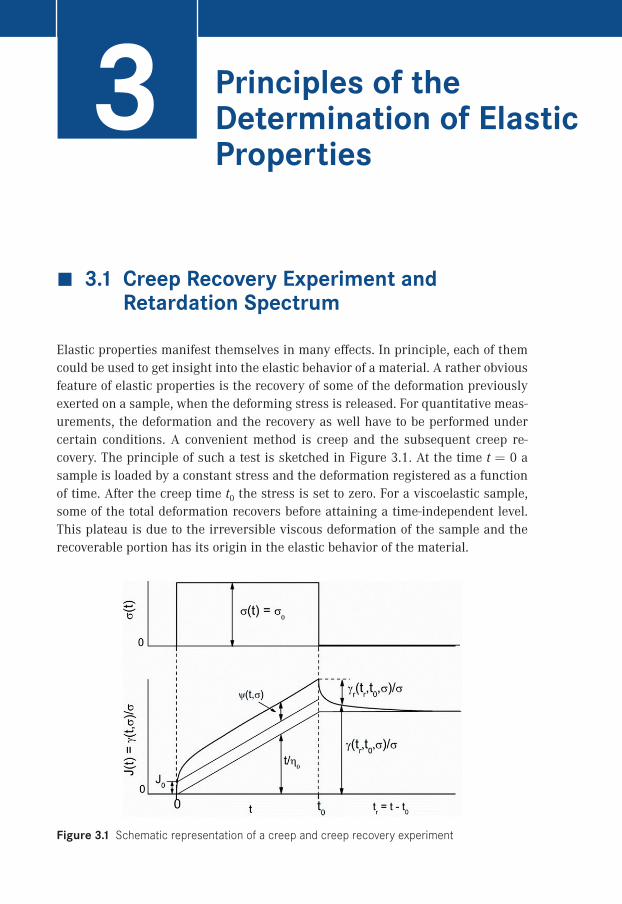
Elastic properties manifest themselves in many effects. In principle, each of them could be used to get insight into the elastic behavior of a material. A rather obvious feature of elastic properties is the recovery of some of the deformation previously exerted on a sample, when the deforming stress is released. For quantitative meas-urements, the deformation and the recovery as well have to be performed under certain conditions. A convenient method is creep and the subsequent creep re-covery. The principle of such a test is sketched in Figure 3.1. At the time t = 0 a sample is loaded by a constant stress and the deformation registered as a function of time. After the creep time t0 the stress is set to zero. For a viscoelastic sample, some of the total deformation recovers before attaining a time-independent level. This plateau is due to the irreversible viscous deformation of the sample and the recoverable portion has its origin in the elastic behavior of the material.
Figure 3.1 Schematic representation of a creep and creep recovery experiment
Principles of the Determination of Elastic Properties

8 3 Principles of the Determination of Elastic Properties
The deformation itself depends on material properties and on external parameters. Therefore, in the case of creep experiments, the compliance defined as the defor-mation related to the stress is discussed as the corresponding material-specific function. In Figure 3.1 the creep compliance
(3.1)
is plotted, with the variable being the constant shear stress applied and the resulting total shear. According to the Boltzmann superposition principle the creep compliance can be written as (see, e. g., [3.1])
(3.2)
is the instantaneous compliance, the time-dependent recoverable compli-ance or creep function, and the viscosity. This additivity is visualized in Fig-ure 3.1. It should be mentioned, however, that the superposition principle was de-rived by Boltzmann for the linear case, in which the creep function and the viscosity are independent of the stress applied. Many experimental results have shown that the decomposition of the creep compliance as given by Equation 3.2 can be used in the nonlinear regime too.
Because the instantaneous compliance is comparatively small and the creep func-tion attains a constant value after some time, for long enough creep times the vis-cous part dominates the compliance and the viscosity can be obtained from Equa-tion 3.2:
(3.3)
For correspondingly small stresses in the linear regime, the zero-shear viscosity follows as
(3.4)
In the linear regime the creep function can be described numerically by
(3.5)
with being discrete retardation times and the corresponding retardation strengths. For a continuous retardation spectrum it follows:

93.1 Creep Recovery Experiment and Retardation Spectrum
(3.6)
with the retardation function .
The recoverable portion of shear and therewith the recoverable compliance as functions of the recovery time are dependent in general on the stress and the time of the preceding creep; that means
(3.7)
Because the recoverable compliance is defined as the difference between the total compliance and the viscous portion, Equation 3.7 can be written as
(3.8)
For polymer melts and solutions the time-dependent recoverable compliance at-tains a constant value at sufficiently long creep and recovery times, and one gets for the steady-state recoverable compliance:
(3.9)
and for the linear steady-state recoverable compliance:
(3.10)
This quantity is of great interest insofar as it is related to the retardation spectrum by
(3.11)
where designates the retardation time. For a discrete retardation spectrum one can write, according to Equation 3.5,
(3.12)
with being the retardation strengths. More detailed information on the deriva-tion of these relations can be found in [3.1], for example. For polymer melts the

10 3 Principles of the Determination of Elastic Properties
instantaneous compliance is negligibly small in comparison with the time- dependent recoverable compliance. Thus, from creep recovery experiments in the linear range the retardation spectrum can be determined directly, which is a fin-gerprint of molecular motions. That is the reason why measurements of the recov-erable compliance have found much attention recently as a rheological tool for the characterization of polymers. Examples are given in Section 10.3.3.
In the linear steady-state regime the creep compliance can be written as
(3.13)
where
(3.14)
is defined as the longest retardation time according to the Voigt-Kelvin model (see, e. g., [3.1]), with being the zero-shear viscosity.
Three distinct times are used to discuss creep recovery: describes the time scale of the experiment and is assigned to the duration of the creep experiment. Then, the recovery time follows as it is obvious from Figure 3.1 and Figure 3.2. As a matter of convention, for recovery and creep the same time scales are used, and then creep compliance and recoverable compliance can be compared conven-iently.
Figure 3.2 Different representations of a creep experiment
As sketched in Figure 3.2, the strain increases during creep and consequently the compliance as the corresponding material-specific function shows a similar behavior. During recovery the total strain decreases, but the recoverable strain becomes larger. Thus, the recoverable compliance is a material-specific function increasing with time and, therefore, it is reasonable to present on the same scale

776.3 Influence of Molar Mass Distribution
Table 6.1 Characteristic Molecular Data of PS I and PS II
[kg/mol] [Pa–1]
PS I 74 1.2 6.9 ∙ 10–6
PS II 39 1.1 1.1 ∙ 10–4
Reprinted with permission from [6.27]; copyright 1980 The Society of Rheology.
PS II is distinguished from PS I by a distinct high molar mass component, while PS I shows a weak high molar mass tail sometimes found with anionic polystyrenes. The high molar mass component of PS II is not reflected by the polydispersity in-dex (cf. Table 6.1), but it has a significant effect on the elastic properties as can be seen from the linear steady-state recoverable elongational compliance (cf. Equa-tion 3.51) listed in Table 6.1. For PS II this quantity is higher by a factor of 16 than for PS I. These results are in accordance with those on polystyrene blends pre-sented in Figure 6.12.
The technique of measuring recoverable elongations is described in Section 4.2.6. The compliances in Table 6.1 were measured at a tensile stress of = 103 Pa, which was found to be in the linear range of deformation for the narrowly distrib-uted polystyrenes [6.27].
6.3.2�Nonlinear Elastic Properties
As was shown in Figure 4.3 for a PP, the recoverable compliance is stress-in-dependent for small stresses and then distinctly decreases with stress. The non-linear steady-state values are attained at recovery times shorter than in the linear range. From Figure 5.1 it can be concluded for a commercial polypropylene that the stress dependence of is more distinct than that of the shear viscosity h. It is well-established that the viscosity decrease with shear rate or stress, respectively, becomes more pronounced the broader the molar mass distribution. This is demon-strated in the left part of Figure 6.15 for the three polypropylenes PP 2, PP 4, and PP 6 with the polydispersity indices 3.5, 6.4, and 7.7, respectively [6.7]. For a clearer presentation, the viscosities were normalized by their zero-shear values . At the shear stress of 103 Pa, has decreased by about 30% for the sample with the narrowest distribution and by 60% for that with the broadest one.

78 6 Dependence of Elastic Properties on Molecular Structure
100 101 102 103 1040.4
0.6
0.8
1
1.2
PP 2 Mw/Mn = 3.5 PP 4 Mw/Mn = 6.4 PP 6 Mw/Mn = 7.7
�/�0
� [Pa]
T = 180°C
100 101 102 103 104
0.1
1
PP 2 Je0(180°C) = 2.66�10-4 Pa-1
PP 4 Je0(180°C) = 9.32�10-4 Pa-1
PP 6 Je0(180°C) = 1.21�10-3Pa-1
Je/J0e
� [Pa]
T = 180°C
Figure 6.15 Normalized viscosity (left) and normalized steady-state recoverable compliance (right) as functions of shear stress for three polypropylenes with the different polydisper-
sity indices given in the inset [6 .7]
The stress dependence of the compliance is much more pronounced than that of the viscosity, as becomes obvious from the right part of Figure 6.15. Here the steady-state recoverable compliance normalized by its linear value is plotted as a function of stress. For the smallest molar mass distribution it becomes smaller by about 80 % and even 90 % for the broader one at = 103 Pa. In the inset of Fig-ure 6.15, the of the three samples is listed. increases by a factor of 3.5 from PP 2 to PP 4, but only by a factor of 1.3 from PP 4 to PP 6. These differences in the linear quantities are reflected by the compliances in the nonlinear regime, too, presented in Figure 6.15.
Considering the transition from the linear to the nonlinear regime it is obvious for the viscosities that the critical stress becomes lower with increasing polydisper-sity. The same can be observed for the recoverable compliances, but in general a deviation from the linear range is observed at stresses lower than for the viscosity.
A behavior similar to that of the polypropylenes is presented for the metallo-cene-polymerized linear low density polyethylenes in Figure 6.16. Their molecular data are given in Table 6.2. According to the polymerization technique, long-chain branching is not to be expected and could not be found analytically. As seen from the data in Table 6.2, increases with the polydispersity index, which reflects the molar mass distributions of the equally polymerized polyethylenes. Like for the polypropylenes in Figure 6.15, the sample with the broadest distribution exhibits the strongest stress dependence of the recoverable compliance and starts to devi-ate from the linear behavior at the smallest stress. The mLLDPE with a polydisper-sity index between the two others behaves as expected. These results may allow the conclusion that for the three polyethylenes the polydispersity indices mirror the distributions.

796.3 Influence of Molar Mass Distribution
Table 6.2 Characteristic Data of Metallocene Polymerized Linear Low Density Polyethylenes with Hexene as Comonomer [6 .7]
[kg/mol] [10–5 Pa–1]
mLLDPE 1 69 2.2 2.0mLLDPE 4 116 2.5 3.0mLLDPE 5 124 2.9 4.5
100 101 102 103 1040.2
0.4
0.6
0.8
1
1.2
mLLDPE 1 mLLDPE 4 mLLDPE 5
Je/J0e
� [Pa]
T0 = 170°C
Figure 6.16 Normalized recoverable compliance as a function of shear stress for the three metallocene linear low density polyethylenes (mLLDPE) whose molecular data are given in Table 6 .2 [6 .7]
Another function describing nonlinearity is the damping function defined by Equation 5.1. In [6.17] it is shown for a series of linear polyethylenes and polypro-pylenes that does not depend on the molar mass distribution. The same can be concluded from investigations on polystyrenes in [6.26].
A typical nonlinear elastic quantity is extrudate swell. As already mentioned in Section 6.2.2, in which the influence of molar mass on nonlinear elastic properties is discussed, there are not many studies in the literature on the extrudate swell of well-defined samples and some of them are even contradictory to each other. For example, in [6.18] it is reported for HDPE that the extrudate swell decreases with increasing . Just the opposite behavior is found for HDPE in [6.19]. An in-sight into the complexity of the relations may be obtained from [6.28], where it was shown on binary blends of HDPE prepared by Ziegler-Natta catalysts that for a fixed composition the extrudate swell reaches a maximum as a function of the molar mass of the higher molar mass component. Additionally, it came out that for

80 6 Dependence of Elastic Properties on Molecular Structure
two given blend components the higher molar mass fraction, which was changed between 0.3 and 0.6, has some influence on the extrudate swell. The extrudate swell was determined at a shear rate of 300 s–1 compared to 3 s–1 in [6.18] and 3 s–1 and 153 s–1 in [6.19]. Furthermore, the geometries of the capillaries used were different. According to Section 5.6, these different experimental conditions make a quantitative comparison of the results not meaningful. Nevertheless, the results on the blends may throw some light on the contrary findings from the literature on the HDPE described above. Due to the various structural features of commercial HDPE, comprising rather often broad molar mass distributions and small amounts of branching, their molecular compositions may be different, giving rise to an ex-trudate swell increasing or decreasing with . Such an explanation is not satis-factory, however, neither from a practical nor from a fundamental point of view. Therefore, measurements on polystyrene being linear by nature may be able to ex-plore some aspects of the effects of the molar mass distribution on extrudate swell.
The extrudate swell of two polystyrenes with very similar molar masses , but different molar mass distributions, is presented in Figure 6.17 [6.2]. It is evident that the broader molar mass distribution results in a significantly higher extrudate swell. Similar to the results in Figure 6.6, the measured data can be described by a straight line in the double-logarithmic plot chosen, representing a power law be-tween extrudate swell and shear stress at the wall of the capillary. For the reasons mentioned before, this relationship is empirical and valid only in a limited range of stresses. The viscosity functions of the two different polystyrenes presented in Fig-ure 6.17 are discussed in [6.29].
Figure 6.17 Extrudate swell S = d / d0 - 1 as a function of the stress at the wall of a capil-lary with the length to radius ratio = 20 for two polystyrenes of similar molar masses , but different molar mass distributions . The extrusion temperature was 190 °C . Reprinted from [6 .2] with permission from Springer Nature

8�� 8.1� Creep Recovery Experiments as a
Contribution to Molecular Analysis
Measurements of creep recovery have the advantage that the time dependence of the viscoelastic behavior of polymer melts can be obtained with high accuracy, because the viscous deformation does not mask the elastic effects, which may be comparatively small. Furthermore, the creep and creep recovery, respectively, can be extended to long experimental times, which are only limited by the thermal stability of a sample. Thus, processes with long retardation times can be investi-gated. The features of creep recovery and its analytical power are demonstrated in the following on a linear low density polyethylene (LLDPE) in comparison with a typical low density long-chain branched polyethylene (LDPE).
8.1.1�Creep Recovery Compliance
The LDPE considered is a common high pressure polyethylene polymerized in a tubular reactor. The LLDPE studied is an ethylene/octene copolymer synthesized by a Ziegler-Natta catalyst. The LDPE has a polydispersity index of = 14 and for the LLDPE = 3 is found [8.1]. The long-chain branches of the LDPE are arranged in a tree-like structure, while for the LLDPE it can be assumed that even a small amount of long-chain branches is excluded due to the polymerization technique used. The GPC traces do not show any indication of a distinct high molar mass component in the two materials [8.1].
As discussed before (see Section 4.2.1), the creep recovery curve depends on the previous creep time if the steady state has not been reached. This feature is demonstrated in Figure 8.1 for the LLDPE studied in the linear range of deforma-tion. In comparison with Figure 4.2 the recovery curves look different. At creep times t0 around 100 s a steady-state compliance, independent from the previous creep, seems to be approached (see the filled circles and triangles in Figure 8.1).
Elastic Behavior and Its Relevance for Various Applications

132 8 Elastic Behavior and Its Relevance for Various Applications
But then the steady-state compliance distinctly increases with t0 again. This be-havior becomes more evident from Figure 8.2. In this figure, the steady-state recov-erable compliance is plotted linearly as a function of the creep time presented on a logarithmic scale.
10-1 100 101 102 103 104 10510-5
10-4
10-3
LLDPE T = 150 °C t0 = 12 s
t0 = 33 s t0 = 73 s t0 = 164 s t0 = 201 s t0 = 325 s t0 = 674 s t0 = 1263 s
J r(t r,
t 0) [P
a-1]
tr [s]
Figure 8.1 Creep recovery compliance in the linear range of deformation as a function of the recovery time for the LLDPE at different creep times . Reprinted from [8 .1] with permission from Springer Nature
101 102 103 1040.0000
0.0005
0.0010
0.0015
0.0020
LLDPE LDPE
T = 150 °C
J e(t 0
) [10
-3 P
a-1]
t0 [s]
Figure 8.2 Steady-state recoverable compliance as a function of the creep time in the linear range of deformation for the LLDPE and the LDPE . Reprinted from [8 .1] with permission from Springer Nature

1338.1 Creep Recovery Experiments as a Contribution to Molecular Analysis
For the LDPE a continuous increase in up to a plateau is found. The compliance of the LLDPE increases moderately first, but then jumps up steeply and within the scatter of the experiments reaches a plateau for long creep times, which is dis-tinctly higher than that of the LDPE. These results lead to the conclusion that for the LLDPE two deformation processes may be assumed, the time dependencies of which are different.
It is interesting to see how the different ecovery behavior of each of the two sam-ples as a function of the previous creep time in Figure 8.2 is reflected by the de-pendence of the recoverable compliance on the recovery time , represented in Figure 8.3. At shorter times, the of the LDPE is higher than that of the LLDPE. But the steady-state value and the time at which it is reached are significantly smaller than for the LLDPE. In the double-logarithmic plot of Figure 8.3 the step of the compliance for the LLDPE revealed by the linear presentation in Figure 8.2 is hard to detect. It is indicated by a slight change in slope, marked by the arrow.
10-2 10-1 100 101 102 103 104 10510-5
10-4
10-3
LDPE LLDPE
T = 150 °CJr(tr ) [Pa-1]
tr [s]
Figure 8.3 Recoverable compliance as a function of the recovery time in the linear range of deformation for LDPE and LLDPE in a double-logarithmic plot . Reprinted from [8 .1] with permission from Springer Nature
8.1.2�Retardation Spectra
Some evidence for the two retardation processes that are evident from Figure 8.2 is obtained from the retardation spectra in Figure 8.4. They were calculated accord-ing to [8.2] and [8.3], based on the relation
(8.1)

134 8 Elastic Behavior and Its Relevance for Various Applications
with being the discrete retardation times and the retardation strengths. Equa-tion 8.1 follows from Equation 3.5 according to
(8.2)
with the instantaneous compliance being negligibly small for polymer melts.
Figure 8.4 Retardation spectra of the LDPE and the LLDPE calculated from Figure 8 .3 . The symbols represent the discrete retardation strengths for the chosen retardation times, and the full lines describe the continuous retardation spectra , where the step width was chosen as 10 . Reprinted from [8 .1] with permission from Springer Nature
The full lines describe the continuous retardation spectra according to Equation 6.8:
For the LDPE a “smooth” spectrum is obtained, while for the LLDPE a shoulder be-comes visible, which indicates two retardation processes superposing each other.
As it is demonstrated by Figure 8.2 and Figure 8.4, measurements of the recovera-ble compliance are a sensitive tool to detect different retardation processes within a polymer melt. However, it is not possible to draw conclusions from the retar-dation spectra on the relevant molecular structures underlying the processes. For such kind of analysis other methods have to be applied, as shown and discussed in [8.1]. From differential scanning calorimetry (DSC) and temperature rising elution fractionation (TREF) it was concluded that the LLDPE may consist of two species with different concentrations of comonomers, which are not miscible with each other and give rise to the two different retardation processes observed.

1358.1 Creep Recovery Experiments as a Contribution to Molecular Analysis
8.1.3� Calculation of Dynamic-Mechanical Quantities from Retardation Spectra
According to the linear theory of viscoelasticity, the real part and the imaginary part of the complex compliance as functions of the angular frequency w are related to the discrete retardation spectrum, defined in Equation 8.1, by (see, e. g., [8.4]):
(8.3)
and
(8.4)
with being the zero-shear viscosity.
For the LLDPE, and , calculated according to Equation 8.3 and Equation 8.4 from the spectrum in Figure 8.4, are presented in Figure 8.5 (open symbols) by setting
(8.5)
10-5 10-4 10-3 10-2 10-1 100 101 10210-6
10-5
10-4
10-3
10-2
10-1
100
101
J´ [P
a-1],
J´´ [
Pa-1]
J´(�) measured J´´(�) measured J´(�) from spectrum J´´(�) from spectrum
LLDPE T = 150 °C
���s-1]
Figure 8.5 Real part and imaginary part of the complex compliance calculated from the discrete retardation spectrum in Figure 8 .4 as functions of the discrete angular frequencies wk (symbols) in comparison with the functions measured with a rotational rheometer (curves)

168 10 Polymeric Materials with Nanoparticles
in the following, the emphasis lies on elastic properties of various combinations of matrices and nanofillers.
�� 10.1�Nanoparticles Investigated
As a reference filler material, silica particles are used. They are produced on an industrial scale by flame pyrolysis and are commercially available. The median dia meters d50 of the two kinds of beads investigated are 20 and 70 nm [10.3]. The advantage of these particles is their compact spherical structure, which does not change under the stress exerted on them in a melt during flow. They are very suit-able for fundamental investigations, but their importance as nanofillers for com-mercial polymeric materials is rather limited.
Of more practical relevance are nanoclays. Detailed information about the struc-ture of this montmorillonite can be obtained from the corresponding literature ([10.4], for example). Nanoclays consist of many platelets about 1 nm thick, with lateral dimensions of 100 to 500 nm, that are stacked together. To obtain a high specific surface area for interactions with the matrix molecules, the stacks have to be exfoliated as extensively as possible. Procedures for the preparation of polyme-thylmethacrylate (PMMA) with nanoclay and the control of particle exfoliation and distribution are described in [10.5].
Another widely available natural product with a platelet structure is graphite. The edges of the platelets measure several microns but the thickness is around 200 nm, resulting in aspect ratios between 10 and 20. Graphite consists of layers with thicknesses down to atomic dimensions. The complete exfoliation of the graphite layers is very challenging, but bears a high potential for carbon materials with new properties. In 2004, the first free-standing two-dimensional sheet consisting of one layer of carbon atoms was described, which was obtained from the cleavage of graphite [10.6]. This material is called graphene and is distinguished by large spe-cific surface areas, a high tear strength, remarkable electrical conductivity, and good transparency. Its exploration as a promising new filler for polymeric materi-als is irrelevant, however, as long as an efficient production on a larger scale is not available. Nevertheless, it follows from [10.7], for example, that interesting proper-ties could be generated in polymeric materials by the addition of graphene-type fillers even if carbon monolayers are not obtained by the cleavage of particularly pretreated graphite.
Another carbon-based filler available in several modifications on an industrial scale is carbon black (CB). An overview of the properties of carbon black is given in [10.8], for example. Carbon black has been used widely in the rubber industry

16910.1 Nanoparticles Investigated
and, therefore, rheological properties of mainly elastomers filled with CB can be found in the literature ([10.9], for example). A systematic investigation of the rheo-logical properties of a thermoplastic material with carbon black is published in [10.10], using polystyrene as the matrix. However, elastic properties of melts of polymeric materials with carbon black have been investigated only very sparsely. Interpretations of rheological measurements are complex insofar as the primary particles of carbon black with diameters of about 50 nm may form larger agglom-erates, an example of which is given in Figure 10.1. The shape of the agglomerates depends on many factors, such as the type of carbon black, the matrix polymer, and the compounding process.
Figure 10.1 Transmission electron micrographs of different magnifications for a PMMA filled with the carbon black PRINTEX XE 2 [10 .11] at a volume fraction of = 0 .05 . Adapted from [10 .12]
Aspect ratios of the carbon black agglomerates are difficult to assess, but may be assumed to lie at around 10 to 20. The carbon black aggregates are able to form a three-dimensional network that is decisive for the electrical conductivity of a com-posite (see [10.5], for example).
Carbon nanotubes (CNT) are nanofillers with potential for interesting applications. They were discovered at the beginning of the 1990s [10.13] and their fundamental properties were investigated in the following years on small amounts manufac-tured on a laboratory scale. From 2010 onward, CNT have been produced industri-ally, and since that time it is possible to exploit their potential as fillers in poly-meric materials. Due to their graphitic structures, carbon nanotubes can be considered as wrapped up graphene sheets. One distinguishes nanotubes consist-ing of a single wall (SWCNT) and those with multiple walls (MWCNT) of numbers typically between 3 and 15. The inner diameters of CNT lie at several nm; the outer ones, between 10 and 20 nm. The lengths of the nanotubes are not uniform. They may differ between 1 and more than 10 μm and are prone to breakage during pro-cessing in a melt. CNT are materials with nanoscale dimensions in only one direc-

170 10 Polymeric Materials with Nanoparticles
tion. The filament structure of a CNT is the reason for a flexibility that may lead to statistically distributed entanglements of fibers. These morphological features make it difficult to find relations between properties of polymeric materials filled with nanotubes and their geometries.
The short discussion above on the morphology of particle-filled polymer melts ad-dresses the problem of getting a reliable picture of the real filler distribution within a sample. Even in the case of the simple geometry of silica beads the arrangement of the fillers within a sample may be difficult to assess, as has to be concluded from Figure 10.2, which shows the distribution of 2.1 vol % of the silica beads with 20 nm of mean diameter in a PMMA matrix. The silica beads are not totally sepa-rated from each other, but form agglomerates of various shapes. The specific sur-face area of such agglomerate is difficult to assess because of its rugged shape and some kind of porosity, which may offer areas within the pores for interactions with the matrix molecules. In any case, it has to be stated that the diameter of a particle may only represent a nominal quantity and that the real morphology may be de-pendent on properties of the filler and the matrix and the way of processing. This example throws light on the difficulties which arise in compounding when a good separation of filler particles has to be achieved. The optimal dispersion of nano-particles is a big problem in polymer processing, particularly when cost-effective processes based on melt extrusion are applied.
Figure 10.2 Transmission electron micrograph of two magnifications for PMMA filled with silica beads of a nominal diameter of 20 nm . Adapted from [10 .3]
Aactivation energy 90additive manufacturing – elastic properties 224 – extrudate swell 224
annular die – extrudate swell 226
Bbirefringence – annealing temperature 250 – molecular orientation 249
branching structure 61 – GPC/MALLS 61 – infrared spectroscopy 61 – linear low density polyethylene (LLDPE) 62 – long-chain branched polyethylene 63 – long-chain branches 61 – metallocene-catalyzed polyethylene 63 – nuclear magnetic resonance 61 – radius of gyration 62 – short-chain branches 60
Ccapillary rheometer 31 – entrance pressure loss 31 – shear rate 31 – shear stress 31
capillary rheometry 16colloidal glasses as fillers 155complex compliance 14, 135 – calculation from retardation spectrum 135 – real part 14, 75
complex modulus 13 – calculation from retardation spectrum 136 – loss modulus 13
– polycarbonate (PC) with carbon nanotubes 174
– polycarbonate (PC) with graphite 172 – polymethylmethacrylate (PMMA) with carbon black 173
– storage modulus 13compliance 8 – creep compliance 8 – instantaneous compliance 8 – linear steady-state recoverable compliance 9, 14, 15
– recoverable compliance 8, 9 – recoverable compliance in elongation 19 – recoverable tensile compliance 49 – steady-state recoverable compliance 9
creep 7 – creep function 8
creep compliance 23 – filler concentration 178 – PMMA with graphite 192 – PMMA with nanoclay 191 – PMMA with nanotubes 193 – temperature dependence 38
creep experiment 10 – polycarbonate (PC) with carbon nanotubes 176
creep recovery 7 – correction method 25 – magnetic bearing 25 – measuring technique 25 – molecular analysis 131 – residual torque 25
creep recovery experiments 7 – nanofillers 176 – polycarbonate with nanotubes 193 – polymethylmethacrylate (PMMA) with silica 178
Index

270 Index
D
damping function 43, 95 – irradiated polypropylene 96 – long-chain branching 95 – molar mass 66 – molar mass distribution 79 – numerical description 43, 123
Deborah number 6 – characteristic external time 6 – film drawing 234
drawn films – numerical simulation 232
draw ratio 233draw resonance 238 – critical draw ratio 240 – extrusion velocity 238 – film width 238 – resonance frequency 241 – results from literature 243
dynamic-mechanical experiment 12, 27 – linear behavior 171 – nanoparticle-filled melts 171 – terminal regime 28
E
elasticity 3 – characteristic internal time 5 – contraction flow 4 – entanglements 5 – phenomenological evidence 3 – rubber 3 – silly putty 5 – time dependence 5
elastic properties – applications 131 – deformation history 101 – entrance flow pattern 137 – filled polymer melts 167 – film drawing 233 – high molar mass component 73 – high shear rates 219 – long-chain branched polyethylenes 84 – long-chain branched polyolefins 84 – long-chain branched polystyrenes 83 – long-chain branching 83 – mechanical pretreatment 101 – models 111 – molar mass 64 – molar mass distribution 68 – molecular structure 57 – processing 219
elastic properties of polystyrene blends – molar mass distribution of matrix 76
emulsion model of Choi and Schowalter 206
entanglements 114 – conformations in the melt 115
entrance flow – samples with different elasticity 138 – strain hardening 140
entrance pressure loss – Bagley plot 224
extrudate swell 4, 16, 29, 50 – additive manufacturing 224 – annular die 225 – comparison of different procedures 221 – dependence on die geometry 51 – dependence on stress 51 – dependence on temperature 51 – detailed analysis 52 – entrance flow 51 – entry region 125 – experimental conditions 29 – flow within capillary 126 – LDPE with glass beads 163 – LDPE with glass fibers 164 – linear polyethylenes 67 – long capillary 52 – long-chain branching 96 – molar mass 67 – molar mass distribution 80 – nanoparticle-filled polymers 195 – normal stress difference 51 – numerical descriptions 125, 220 – passing time through capillary 126 – pelletizing 223 – polydispersity index 79 – polystyrenes 67 – quality control with melt flow indexer 143 – recoverable shear 220 – recoverable strain 126 – rectangular dies 228 – refining process 140 – relation to entrance flow 138 – SAN/PP blend 215 – shape of extruded parts 222 – short capillary 52 – stress dependence 30 – tensile stress 231 – time dependence 30 – various die shapes 53

271Index
Ffiber spinnning – draw resonance 242
filled polymers – extrudate swell 195 – linear and nonlinear elastic properties in comparison 198
– recoverable elongation 196film drawing – basic features 233 – Deborah number 234 – draw resonance 233 – edge-bead 233 – models 234 – polypropylenes 236
films – biaxial stretching 263 – load holding force 258 – semi-crystalline polymers 257
– shrink film 261 – stretch film 258 – ultimate stretch 258
film width – Deborah number 237 – draw ratio 236 – strain hardening 237
G
glass beads as fillers 150 – creep experiments 152 – dynamic-mechanical experiments 151, 157
– recoverable compliance 154 – recoverable strain 153 – relaxation experiments 151 – yield behavior 151
H
hole pressure 17
I
immiscible polymer blends 201 – loss modulus 202 – polyisobutylene (PIB)/polydimethylsiloxane (PDMS) 202
– storage modulus 202impact strength – injection velocity 256
injection-molded part – local distribution of recoverable strain 252 – mechanical properties 254
injection molding – frozen-in deformations 247 – shrinkage of test bars 248
interfacial tension 203 – Palierne’s theory 204
interparticle distance 158 – silica 180
Llinear behavior 23 – creep experiment 24 – creep recovery experiment 24 – dynamic-mechanical experiment 27
linear recoverable compliance – entanglements 72 – high molar mass tail 76 – molar mass averages 71 – polyethylenes 71, 86
linear steady-state recoverable compliance – anionic polystyrene 64 – high molar mass component 73 – linear low density polyethylene 88 – LLDPE of different polydispersity 78 – long-chain-branched polyethylene 88 – long-chain branching 83 – matrix influence of filled polymers 188 – mixing rule 119 – molar mass 65 – molar mass distribution 68 – polydispersity index 70 – polypropylene 87 – polystyrene blends 74 – star-shaped molecules 117 – temperature dependence 86, 89 – temperature dependence of PMMA with silica 185
liquid-solid transition 157, 174load holding force – drawing parameters 259 – film shrinkage 260
Mmaster curve 39, 45 – creep compliance 39 – normal stress coefficient 46 – recoverable compliance 39 – viscosity 45
Maxwell model 13, 111

272 Index
mechanical pretreatment – blown film 141 – elastic properties 101 – elongational properties 103 – extrudate swell of LDPE 101 – linear polypropylene 106 – long-chain branched polypropylene 104 – optical properties 141 – reversibility 101 – tensile force at break 140
models – Doi-Edwards theory 116 – elastic properties 111 – entanglements 114 – Kelvin model 112 – Maxwell elements 111 – mixing rules for bimodal blends 120 – nanoparticles in a polymer matrix 180 – reptation model 116 – spring-dashpot 111 – tube model 116
molar mass distribution 57 – centrifuge average 59 – gel permeation chromatography 57 – number average molar mass 57 – polydispersity index 59 – weight average molar mass 59
molecular orientation 249 – birefringence 250 – bulk properties 251 – influence on properties 256
morphology – different states of recovery 214 – PS/LLDPE blend 213 – SAN/PP blend 210, 216
Nnanoparticles – carbon black 168 – dispersion 169 – graphene 168 – graphite 168 – model for filled polymer melts 180 – nanoclay 168 – nanotubes 169 – silica 168
normal stress difference 15, 29, 45 – dependence on shear rate 45 – dependence on time 45 – normal stress coefficient 15, 45 – polystyrene with calcium carbonate 160 – recoverable shear 47
– relation with G' and G" 46normal stresses 3 – hole pressure effect 3
nuclear magnetic resonance (NMR) 189 – silica particles 181
PPalierne’s theory 203Payne effect 171PMMA/PS blend – loss modulus 204 – Palierne’s theory 204 – relaxation spectrum 206 – reversed recovery 208 – storage modulus 205
processing – molecular orientation 247 – recoverable deformation 247
PS/LLDPE blend – morphology 213 – recoverable elongation 213
PS/PMMA blend – recoverable elongation 212
Rradius of gyration – polymethylmethacrylate (PMMA) 180
recoverable compliance 23, 26 – filler concentration 178 – filler size 182 – glass beads as fillers 153 – molar mass distribution 70 – numerical description of nonlinear behavior 123
– PMMA/PS blend 208, 209 – PMMA with graphite 192 – PMMA with nanoclay 191 – PMMA with nanotubes 193 – polypropylenes 69 – polypropylene with nanotubes 194 – SAN/PP blend 210 – stress dependence 37 – stress dependence of filled PMMA 182 – temperature dependence 38 – time dependence of an LLDPE and an LDPE 133
recoverable elongation 18, 31, 48 – Cauchy strain 18 – experimental methods 32 – HDPE with glass fibers 162 – Hencky strain 18

273Index
– irradiated polypropylene 99 – long-chain branching 99 – nanoparticle-filled polymers 196 – PS/LLDPE blend 213 – PS/PMMA blend 212 – sample uniformity 34 – steady-state recoverable strain 48 – temperature dependence 49
recoverable shear 9 – extrudate swell 220 – HDPE with glass fibers 162 – high shear rates 220
recoverable strain 162, 249 – annealing temperature 250 – dependence on deformation 249 – injection conditions 253 – injection velocity 254 – shrinkage ratio 250 – stretching ratio 18
rectangular dies – extrudate swell 228
relaxation experiment 11, 27relaxation modulus 41 – damping function 41 – time-deformation separability 42
relaxation spectrum 12, 13, 92 – relaxation strengths 12 – relaxation times 12 – temperature dependence 92
retardation spectrum 8, 89 – comparison of an LLDPE and an LDPE 133
– creep recovery experiment 89 – longest retardation time 10 – polymethylmethacrylate with nanoclay 179
– retardation function 9 – retardation strengths 8 – retardation times 8 – thermorheologically complex polymer 91 – thermorheologically simple polymer 90
rubber elasticity 44 – molar masses of entanglements 45 – plateau modulus 44
SSAN/PP blend – recoverable compliance 210
shift factor – polyethylene 90
shrink film – applications 266
– dependence of shrinkage on time and temperature 262
slit die – theoretical description of swell 230
stationary behavior 23 – creep recovery 23
steady-state recoverable compliance – comparison of an LLDPE and an LDPE 132
storage modulus 21 – amplitude dependence 171 – amplitude dependence of PMMA with silica 183
– anionic polystyrenes 44 – dependence on molar mass 21, 22 – immiscible polymer blends 202 – Palierne’s theory 206 – polyisobutylene with glass beads 157 – silica in ethylene glycol/glycerol 157
stress dependence 78 – compliance 78 – influence of long-chain branching 94 – influence of polydispersity index 77 – recoverable compliance of filled PMMA 182
– viscosity 78stressing experiment 28stretch film – applications 265
Ttemperature dependence – branching analysis 91 – PMMA with silica 185
tensile stress – extrudate swell 231
thermal stability 21 – experimental determination 22 – storage modulus 21
thermorheological complexity 90 – PMMA with silica 187
thermorheological simplicity 39, 89 – polymethylmethacrylate (PMMA) 186
Uultimate stretch – drawing parameters 259 – film shrinkage 259

274 Index
Vviscosity 8 – stress dependence 37
Voigt-Kelvin model 10
WWeissenberg number 6
Yyielding behavior – creep experiment 150 – dynamic-mechanical experiment 150 – relaxation experiment 148
Zzero-shear viscosity 8, 15, 21 – dependence on molar mass 21