san francisco municipal transportation agency fiscal and
TRANSCRIPT

Fiscal and Management Update
Fiscal and Management UpdateSan Francisco Municipal Transportation Agency
All-StaffNovember 30, 2020

Fiscal and Management Update
Fiscal Status by Fiscal YearAs mobility and economic data settle, new trends are forming which allow projections in FY 21 and FY 22. Additional expenditure reductions in FY 21 of $30.5 million and use of rainy-day reserves of $37.5 million are required. The FY 22 projected deficit likely results in service reductions and layoffs.
Revenue Loss
($234 m)Net Deficit(Projected)
$0 mExpenditure Savings
$37 m
Revenue Loss (Projected)
($186 m)
Net Deficit(Projected)
($68 m)
Expenditure Savings (Projected)
$118 m
Revenue Loss(Projected)
($187 m)
Net Deficit(Projected)
($168 m)
Expenditure Savings(Projected)
$19 m
FY 2
02
0FY
20
21
FY 2
02
2
Revenue losses due to economic shock; $197 m of CARES applied.
Expenditure controls; hiring freeze; overtime management; $177 m of CARES applied.
Revenue growth from FY 21 results in deficit; high end deficit up to $222 m. Eliminates MTAB reserve in FY 22.
Fiscal Status Risk Analysis
2
Monthly Financial Data & Projections Available at:https://www.sfmta.com/budgetdashboards
Federal Relief Next Steps

Fiscal and Management Update
FY 2021 Expenditure SavingsThe SFMTA is currently projecting a total savings of $118 m in FY 2021. The majority of the savings have been in non-labor costs. Additional savings outside of labor will be continuingly difficult.
$806 M, 64%
$453 M, 36%
Labor Non-Labor
Non-Labor Savings(Projected)
($68 m*)($17 m) in Materials & Supplies
Labor Savings(Projected)
($50 m)
No
n-La
bo
rLa
bor
FY 21 Savings Estimate = $118 m
% of Other Non-Labor
15%23% of Materials & Supplies
% of Labor
6%
FY 2020-21 Operating Budget
3
*Includes the Board Reserve at $16 m
Fiscal Status Risk Analysis Federal Relief Next Steps

Fiscal and Management Update
Fiscal Management Strategy (as approved in April 2020)The SFMTA Board as part of the adoption of the FY 2021 and FY 2022 budget approved a budget plan allowing for changing economic conditions.
1
Eliminate MTAB Reserve
2
Overtime Controls
3
Hiring Freeze
4
Contract Expenditure Controls
6
Use of Rainy-Day Reserve
7
Workforce Reductions (Layoffs)
5
Capitalize Operating Costs
FY 21 savings of $16 m
FY 22 savings of $19 m
Overtime projected to be 53% less than FY 19 and 48% less than FY 20 ($37 m)
Hiring freeze for all but mission critical positions resulting in $13 m savings
Strict review in place, total savings at $51 m e.g. faregate maint. ($5 m), fuel and lubricants ($6 m)
Working toward shifting labor costs to maintenance campaigns e.g. midlife overhaul program
Current assumption is use of 30% or $37.5 million in FY 21, est. $91.5 m available in FY 22
If deficits exceed reserves, layoffs may be required.
FY 21 Savings Estimate = $118 m
4
Fiscal Status Risk Analysis Federal Relief Next Steps

Fiscal and Management Update
Structural Deficit
5
500
700
900
1,100
1,300
1,500
1,700
FY21 FY22 FY23 FY24 FY25
Revenue Expenditures
Operating Budget, $M FY21 FY22 FY23 FY24 FY25
Revenue Ongoing 1,073 1,118 1,234 1,290 1,323
Expenditures 1,141 1,286 1,353 1,403 1,457
Revenue Less Expenditures (68) (168) (119) (113) (134)
12/1/20 –SFMTA 5-Year Forecast
($168M)($119M)
($113M) ($134M)
($68M)
Fiscal Status Risk Analysis Federal Relief Next Steps

Fiscal and Management Update
Risk AnalysisWhile the fiscal picture becomes clear with monthly fiscal data and stabilizing mobility data, the SFMTA must continue to assume a high level of risk, due to continuing levels of uncertainty. The total risk over the 2-year budget period, after savings and use of the rainy-day reserve, is estimated at $154.5 m to $284.5 m.
$68.0 m deficit
Fiscal Year 2021 Fiscal Year 2022
$37.5 m rainy-day reserve
$30.5 m savings TBD
$168.0 m deficit $ 44.0 m rainy-day reserve
$ 32.5 m savings TBD $80.0 m revenue risk $ 54.0 m revenue risk
$30.5 m - $110.5 m risk $124.0 - $178.0 m risk• $118 m savings realized; over time finding
additional non-labor savings will be difficult
• Revenues appear to be flattening; second shut down not assumed in budget projection
• Strong fiscal management should result in similar savings to FY 21, est. $32.5 m
• As revenues in FY 21 flatten, gaps grow between revenue and expense in FY 22
6
Fiscal Status Risk Analysis Federal Relief Next Steps

Fiscal and Management Update
Possible Risk
Risk Management –FY 21 and FY 22 Possible ScenariosVarious scenarios have been analyzed assuming the best case and worst cases in terms of revenue losses and expenditures. Analysis indicates now that workforce reduction is likely.
7
$222 m$37.5 m $68 m $178 m
FY 21
FY 22
$80 m $91m $110m $135m $148m $168m
Worst Case$19 mSavingsNo Reserve
Best Case$148.5Savings$37.5Reserve
DeficitAmount
Est. FTELayoff 1620274 504 1299593 668 815 989 1096 1226
Min. Loss$118 m Savings$37.5 m Reserve
MaxLoss$118 m Savings$68 m Reserve
Min Loss$51.5 m Savings$44.5m Reserve
MaxLoss$118 m Savings$37.5 m Reserve
Min Loss$19 m Savings$44.5m Reserve
MaxLoss$118 SavingsNoReserve
Min Loss$19 m SavingsNoReserve
MaxLoss$19 m Savings$44.5 MReserve
Likely
Fiscal Status Risk Analysis Federal Relief Next Steps

Fiscal and Management Update
Risk Management –Scenarios FY 2022Various scenarios have been analyzed assuming the best case and worst cases in terms of revenue losses and expenditures. Analysis indicates now that service and workforce reduction is likely.
Revenue Loss$187 m
Expenditure Savings
$19 m
Risk$54 m
Reserve$44 m
8
Deficit$168 m
Deficit$54 m
A deficit of this magnitude equals 1,226 FTEMinimum is 989 FTE
+394 FTE
Savings TBD$32.5 m
Forecasts show layoffs of 989 – 1,226 FTE or up to 22% of the workforce necessary to close FY 22 projected deficit.
Fiscal Status Risk Analysis Federal Relief Next Steps
Fiscal and Management Update
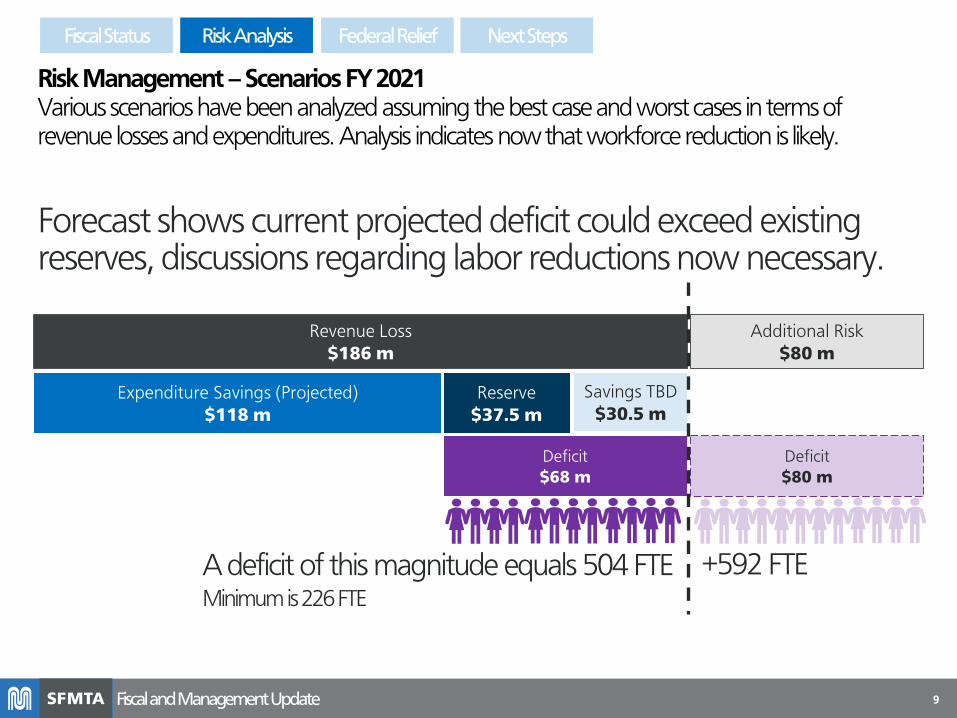
Risk Management –Scenarios FY 2021Various scenarios have been analyzed assuming the best case and worst cases in terms of revenue losses and expenditures. Analysis indicates now that workforce reduction is likely.
Revenue Loss$186 m
Expenditure Savings (Projected)$118 m
Additional Risk$80 m
Reserve$37.5 m
Savings TBD$30.5 m
9
Deficit$68 m
Deficit$80 m
A deficit of this magnitude equals 504 FTEMinimum is 226 FTE
+592 FTE
Forecast shows current projected deficit could exceed existing reserves, discussions regarding labor reductions now necessary.
Fiscal Status Risk Analysis Federal Relief Next Steps

Fiscal and Management Update
Federal Relief –CARES and BeyondThe Coronavirus Aid, Relief, and Economic Security (CARES) Act funded $25 billion in transit relief. The Bay Area received $1.3 billion and of that amount the SFMTA received 29.3%, $373.8 million. Without CARES revenue losses at their highest could be up to $900 million through FY 22.
Revenue Loss$187 m
Risk$54 m
Revenue Loss$186 m
Risk$80 m
CARES Act$197 m
Expenditure Savings
$37 m
CARES Act$177 m
FY 20
FY 21
FY 22
($234 m)
($443 m)
.
10
($241 m)
Fiscal Status Risk Analysis Federal Relief Next Steps

Fiscal and Management Update
Federal Relief –CARES and BeyondThe Coronavirus Aid, Relief, and Economic Security (CARES) Act funded $25 billion in transit relief. The Bay Area received $1.3 billion and of that amount the SFMTA received 29.3%, $373.8 million. Without CARES revenue losses at their highest could be up to $900 million through FY 22.
Revenue Loss$187 m
Risk$54 m
Revenue Loss$186 m
Risk$80 m
CARES Act$197 m
Expenditure Savings
$37 m
CARES Act$177 m
FY 20
FY 21
FY 22
($234 m)
($443 m)
Without the CARES Act the SFMTA would have used $197 m of the Fund Balance to close FY 20, leaving $129 m. Facilities improvements and the meter replacement project would have been cancelled.
.
11
Fund Balance Use$197 m
($241 m)
Fiscal Status Risk Analysis Federal Relief Next Steps

Fiscal and Management Update
Federal Relief –CARES and BeyondThe Coronavirus Aid, Relief, and Economic Security (CARES) Act funded $25 billion in transit relief. The Bay Area received $1.3 billion and of that amount the SFMTA received 29.3%, $373.8 million. Without CARES revenue losses at their highest could be up to $900 million through FY 22.
Revenue Loss$187 m
Risk$54 m
Revenue Loss$186 m
Risk$80 m
CARES Act$197 m
Expenditure Savings
$37 m
CARES Act
$48 m
FY 20
FY 21
FY 22
($234 m)
($443 m)
($241 m)
Without the CARES Act the SFMTA would have used $197 m of the Fund Balance to close FY 20, leaving $129 m. Facilities improvements and the meter replacement project would have been cancelled.
12
Fund Balance Use$197 m
Fund Balance Use$129 m
Fiscal Status Risk Analysis Federal Relief Next Steps

Fiscal and Management Update
Federal Relief –CARES and BeyondThe Coronavirus Aid, Relief, and Economic Security (CARES) Act funded $25 billion in transit relief. The Bay Area received $1.3 billion and of that amount the SFMTA received 29.3%, $373.8 million. Without CARES revenue losses at their highest could be up to $900 million through FY 22.
Un-Closable Deficit
$85.5 mRisk
$80 m
CARES Act$197 m
Expenditure Savings
$37 m
CARES Act
$48 m
FY 20
FY 21
FY 22
($234 m)
($443 m)
($241 m)
The remaining $129 million in fund balance would have been used to close the revenue shortfall, after expenditure savings an un-closable deficit would have remained of $85.5 - $196 million resulting in service reductions and layoffs at the beginning of FY 21 of 633 FTE and up to 1,452 FTE.
Without the CARES Act the SFMTA would have used $197 m of the Fund Balance to close FY 20, leaving $129 m. Facilities improvements and the meter replacement project would have been cancelled.
.
13
Fund Balance Use$197 m
Fund Balance Use$129 m
Savings$118 m
TBD Savings
$30.5 m
Savings$19 m
Deficit
$189.5 mAn additional deficit would occur in FY 22 of $189.5 million, and potentially lead to an additional layoffs of 750 FTE.
TBD Savings
$32.5 m
Fiscal Status Risk Analysis Federal Relief Next Steps
Fiscal and Management Update
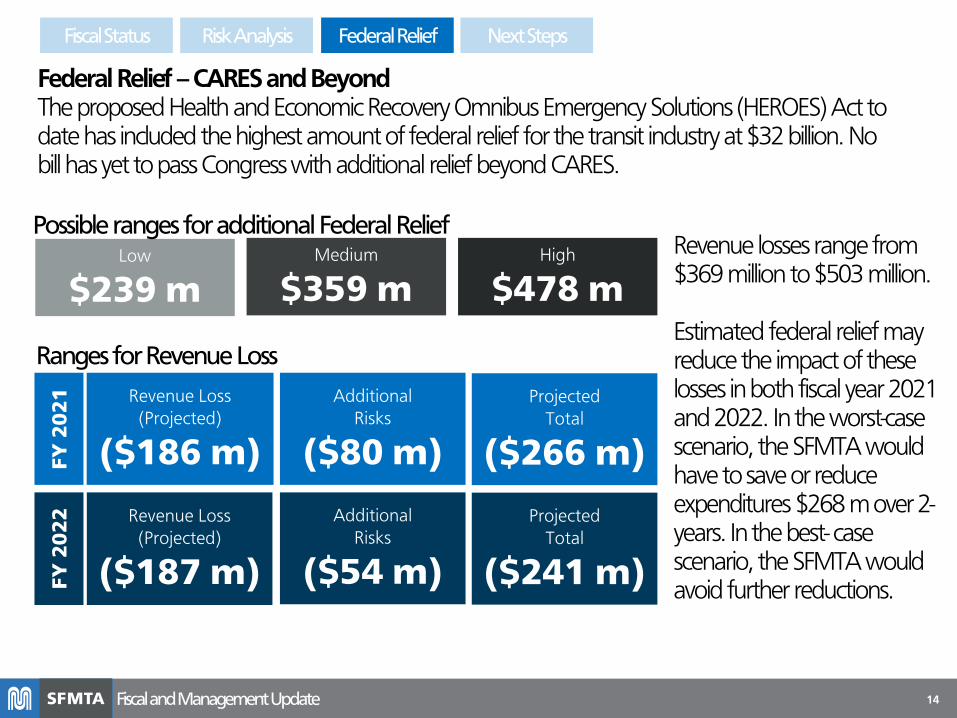
Federal Relief –CARES and BeyondThe proposed Health and Economic Recovery Omnibus Emergency Solutions (HEROES) Act to date has included the highest amount of federal relief for the transit industry at $32 billion. No bill has yet to pass Congress with additional relief beyond CARES.
Revenue Loss (Projected)
($186 m)
Revenue Loss(Projected)
($187 m)
FY 2
02
1FY
20
22
Low
$239 mMedium
$359 mHigh
$478 m
Ranges for Revenue LossAdditional
Risks
($80 m)
Additional Risks
($54 m)
Projected Total
($266 m)
Projected Total
($241 m)
Possible ranges for additional Federal ReliefRevenue losses range from $369 million to $503 million.
Estimated federal relief may reduce the impact of these losses in both fiscal year 2021 and 2022. In the worst-case scenario, the SFMTA would have to save or reduce expenditures $268 m over 2-years. In the best- case scenario, the SFMTA would avoid further reductions.
14
Fiscal Status Risk Analysis Federal Relief Next Steps

Fiscal and Management Update
Key Programmatic Priorities –Short TermThe SFMTA has several planned programs to create service stability and revenue certainty. Advancing these programs supports the agency’s ability to minimize layoffs and cut less.
Priority Programs
• Implementation of new transit fare compliance program and return to all door boarding for facilitate fare collection
• Develop post-vaccine marketing program to promote confidence in the Muni System and increase ridership
• Continue phased roll-out as well as outreach with merchants and the faith community of extended parking hours and Sunday parking enforcement hours on commercial corridors
15
Fiscal Status Risk Analysis Federal Relief Next Steps

Fiscal and Management Update 16
$350 m General
Obligation Bond
$70 m/AnnualCommunity
Facilities District
Prop K Transportation
Sales Tax Reauthorization
Consider: VLF (date TBD)$50 m/Annual
$250 million SFMTA Facilities• Projects such as Potrero Yard
Modernization Project; facility renewals consistent with Facilities Condition Assessments
$60 million Better Transit• Project such as Better Market
Street Phase II: F-Loop; other major Muni Forward Projects; investments consistent with the Muni Reliability Working Group Recommendations
$40 million Safer Streets• Projects related to advancing the
city’s Vision Zero Goal; major street reconstruction projects
$70 - 120 million initial estimate; reviewing legislative process now, drafting potential fee structures
Focus on core maintenance/system vulnerabilities/SGR needs:• Capital Maintenance Track• Capital Maintenance OHL• Capital Maintenance Signals• Capital Maintenance Facilities
Sustainable/Equitable Transit – core service (fill structural operational gap), Muni Equity Strategy Funding.
Revolving/regular revenue bond program allowing for large upfront capital investments
Congestion Pricing (2024)Focus MWG Service + Service Equity Strategy
Current ½ sales tax raises approximately $90 – 100 million annually.
No tax increase currently proposed.
Multiple Prop K programs are running out of money; a new expenditure plan allows emerging priorities through financing
Transportation 2050: Sustainable Transportation Funding (Preliminary Programs)Key Programmatic Priorities –Long Term
Fiscal Status Risk Analysis Federal Relief Next Steps

Thank you.