sanbag non-motorized transportation plan draft...
TRANSCRIPT

San Bernardino County Non-Motorized Transportation Plan
- Review Draft -
prepared by San Bernardino Associated
Governments
in collaboration with Local Jurisdictions in San
Bernardino County
February 22, 2011

San Bernardino County Non-Motorized Transportation Plan – Table of Contents (Draft, 2/22/11)
Table of Contents
Executive Summary (to be added) 1. Introduction 1-1 2. System Overview and Policies 2-1 3. Bicycle Planning 3-1 4. Pedestrian Planning 4-1 5. Local Jurisdiction Bicycle Plans 5-1 6. Design Guidelines 6-1 7. Plan Implementation 7-1

San Bernardino County Non-Motorized Transportation Plan - Chapter 1 (Draft, 2/22/11)
1-1
1.0 Introduction
1.1 Purpose and Need for the Non-Motorized Transportation Plan A safe, interconnected cycling and walking system can be a major asset to both individual communities and to an urban area, particularly one as well suited to these activities as San Bernardino County. The climate and topography are highly conducive for these and other outdoor pursuits. Both natural and man-made corridors provide ideal opportunities for development of a comprehensive system of cycling facilities, pathways, and trails. Even though San Bernardino County is known for its recreational opportunities, such a system is not well developed in many areas of the County. However, progress is being made. In 2001, the combined total of centerline miles of bicycle infrastructure for all jurisdictions was 53 miles. As of 2011, the combined total of centerline miles of bicycle infrastructure for all jurisdictions is 468 miles. This represents an eight-fold growth in the County’s bicycle infrastructure. It is not difficult to convince the public that the provision of bicycle and walking facilities makes sense as a community investment. One of the themes emerging from the public meetings to develop a County vision is that residents place high value on cycling and walking features within their communities. Cycling and walking trails have been listed in the County’s “Countywide Vision Project” meetings as a part of our infrastructure needing improvement and are also commonly highlighted as a selling point in advertising for new communities. These facilities, and the activities enabled by them, are good for our health, good for our economy, good for our environment, and good for our quality of life. The facilities can also be implemented without great expense. There is every reason to believe that San Bernardino County can and should be one of the centers of cycling and pedestrian activity in Southern California. The challenge ahead involves developing a cohesive, integrated plan and identifying sources of funds to implement that plan. This is the goal of the San Bernardino County Non-Motorized Transportation Plan (NMTP). The NMTP of 2001 and the 2006 update have taken us part way there. This 2011 Plan hopes to take the development of such systems to another level. It identifies a comprehensive network, with a focus on the bicycle system. It is also a response, in part, to the initiatives to reduce vehicle travel and greenhouse gas emissions embedded in California Senate Bill 375 (SB 375). Implementation of the Plan will be a win-win on multiple fronts, and a strong partnership among local governments, transportation agencies, and the citizens of San Bernardino County can make it happen. The 2011 San Bernardino County NMTP will serve as a vehicle for communicating the non-motorized vision for the County, which is represented by the collective visions of each jurisdiction. Although the jurisdictions will be responsible for implementation of the Plan, it is important to have a Plan that cuts across subareas and jurisdictions so that coordination can occur on a physical facility level as well as in scheduling and funding. The remainder of Chapter 1 describes the context of San Bernardino County, the process of NMTP development, and the relationship to other plans.

San Bernardino County Non-Motorized Transportation Plan - Chapter 1 (Draft, 2/22/11)
1-2
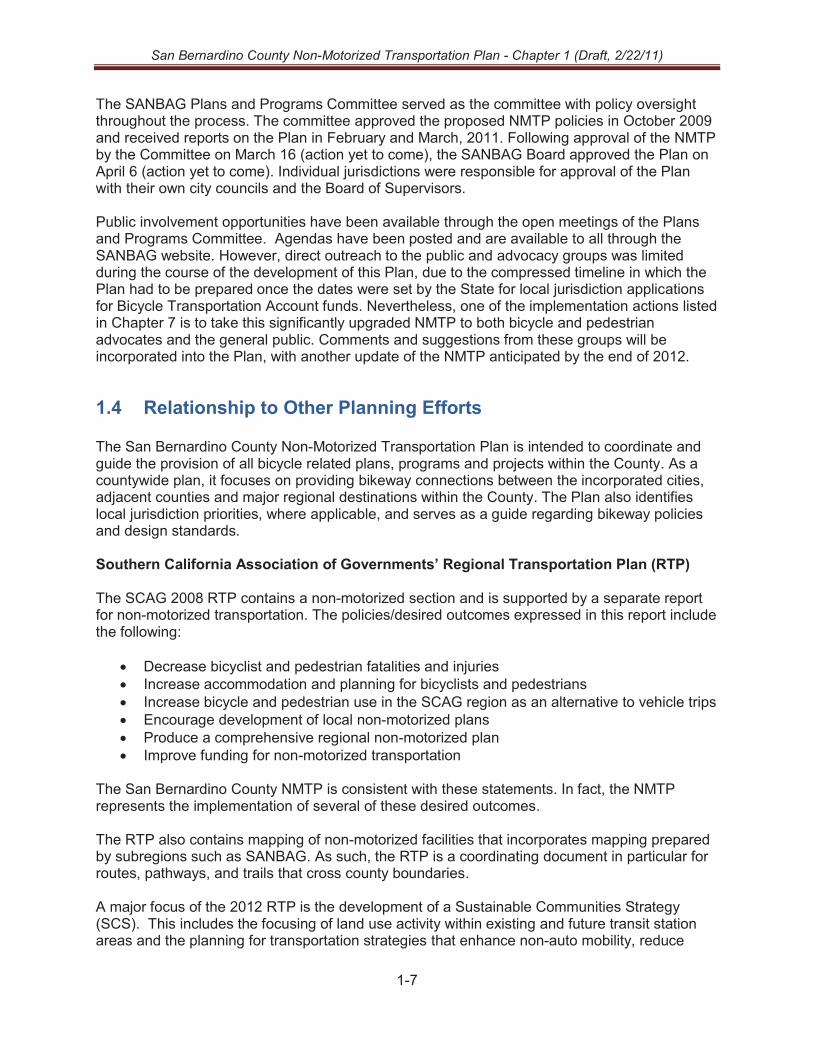
1.2 The San Bernardino County Setting San Bernardino County, located in the northeastern portion of Southern California, boasts a wide variety of urban and rural settings. Framed by Los Angeles County on the west, Riverside County to the south, and extending to Nevada and Arizona to the east, the County serves as a major gateway into and out of the Southland. Interstate 10, State Route 60, and State Route 210 provide substantial east-west mobility in the Valley Region. Interstates 15 and 215 and SR-71 provide north-south freeway connectivity. I-15 connects Riverside and San Diego Counties to the south, and continues over the Cajon pass to the cities of the high desert and northward to Las Vegas. See map of the County and its subareas in Figure 1-1. State Routes 18 and 330 and Scenic State Highway 38 provide connections to the mountains surrounding the Valley, providing linkages for tourists and residents from the Valley to Lake Arrowhead, Big Bear Lake and other mountain communities. State Routes 18, 62, 138, and 247 provide additional connectivity in the Victor Valley, Morongo Basin and surrounding communities. The County is connected to other regional centers by scheduled transit and commuter rail service provided by Metrolink. The San Bernardino Metrolink line is the most heavily traveled commuter rail line in Southern California, providing 36 trains per day to and from San Bernardino, Los Angeles and intervening cities. Metrolink service also is provided from San Bernardino to Riverside and Orange Counties, with 8 trains per day. Omnitrans provides local and express bus service within the County and into adjacent communities. Five other transit operators provide transportation for work and non-work trips. The SANBAG Long Range Transit Plan provides a vision for rail and transit service in the Valley Region of San Bernardino County and is a framework around which some of the bicycle and pedestrian facilities can be planned. LA/Ontario International Airport (ONT) is located in the west valley and is the third busiest passenger airport in Southern California after Los Angeles International Airport (LAX) and John Wayne Airport in Orange County. It is also the second busiest hub for freight movement and is adjacent to one of the principal focal points of logistics and distribution in California. San Bernardino County is known for its world-class transportation and distribution centers, owing much to its historic role as a crossroads of rail transportation and now also serving the same function for truck transportation. The area is also known for its historic agricultural heritage in citrus and vineyard operations, although today, the residential and commercial growth has severely curtailed agriculture in the Valley. The environment for cycling and walking in San Bernardino County is ideal. The climate is temperate, with a range in average high temperatures for the Valley of 67 to 96 degrees, in the Victor Valley from 60 to 98 degrees, and in the Morongo Basin from 64 to 108 degrees. The average high temperatures in Big Bear Lake range from 47 to 81 degrees. Rainfall is moderate and concentrated in the November through March timeframe, while humidity is generally low. The topography outside of the mountain areas is typically flat to moderately sloping.

n
n
n
n
n
n
n
n!.
!.
!.
!.
!.
!.
!.
!.
!.
!.
!.!.
!.
!.
!.
!.
!.
ADELANTOAPPLEVALLEY
VICTORVILLE
HESPERIA
TWENTYNINEPALMS
YUCCAVALLEYFONTANA
REDLANDS
ONTARIO
YUCAIPA
CHINO
CHINOHILLS
·|}þ330
·|}þ189
·|}þ62
·|}þ247
·|}þ138
·|}þ18
·|}þ142
·|}þ38
·|}þ83
·|}þ2
·|}þ173
·|}þ18
·|}þ210
·|}þ71
§̈¦10
§̈¦15
§̈¦15
§̈¦40
§̈¦215
£¤395
NORTHDESERT
VICTORVALLEY
MORONGOBASIN
VALLEYMOUNTAINS
CitizensBank Arena
Epicenter FontanaSpeedway
Ontario MillsShopping Ctr.
OntarioInt'l
Airport
MontclairMall
VictoriaGardens
Shopping Ctr.
Inland ValleyShopping Ctr.
66ersStadium
Citrus PlazaShopping Ctr.
SnowSummit
BearMountain
SnowValley
ArrowheadVillage
San ManuelCasino
VictorValleyMall
Mt BaldySki Resort
COPPER MTN.COMMUN.
COLL.
LOMA LINDAUNIVERSITY
CHAFFEYCOLLEGE
CRAFTONHILLS
COLLEGE
SAN BERNARDINOVALLEY COLLEGE
CAL STATE SANBERNARDINO
VICTORVALLEY
COLLEGE
UNIVERSITYOF REDLANDS
San Bernardino CountySubarea Map
±0 9 184.5
Miles
Legend!. Major Centers
n Colleges/Universities
Subarea Boundary
§̈¦15
§̈¦15
§̈¦40
£¤95
£¤395
NORTHDESERT
COLORADORIVER
VICTORVALLEY
MORONGOBASIN
VALLEY
MOUNTAINS
Countywide Map

San Bernardino County Non-Motorized Transportation Plan - Chapter 1 (Draft, 2/22/11)
1-4
Despite the suitability of the climate and topography, relatively little commuter-related cycling occurs. Statistics from the American Community Survey (2006-2009) indicate the percentage of trips to work by bicycling and walking. The bike-to-work percentage varies by jurisdiction, but is only about 0.4% countywide. The walk-to-work percentage is higher, but still only about 1.5%, and this statistic was heavily influenced by very high walk-to-work percentages at the Twentynine Palms Marine Base. Table 1-1 shows that the percent of trips to work by bicycle are low throughout Southern California, and presumably throughout the rest of the United States. The counties are not greatly different from one another in terms of the percentage of bike/walk trips to work.
Table 1-1. Percent of Trips to Work by Bicycle and Walking for Southern California Counties (Source: American Community Survey 2006-2009)
COUNTY Total Trips to Work
No. of Bike Trips
No. of Walk Trips
% Bike Trips
% Walk Trips
Imperial 43,205 195 685 0.45% 1.59% Los Angeles 3,858,750 20,975 54,630 0.54% 1.42% Orange 1,313,985 9,500 13,220 0.72% 1.01% Riverside 590,515 2,825 5,810 0.48% 0.98% San Bernardino 658,710 2,475 10,070 0.38% 1.53% Ventura 345,660 2,165 3,930 0.63% 1.14% TOTAL 6,810,825 38,135 88,345 0.56% 1.30%
Streets and Highways Code Section 891.2 requires an estimate of the number of existing bicycle commuters in San Bernardino County and an estimate of the number of bicycle commuters that may be present upon implementation of the NMTP. Given that the number of workers in San Bernardino County is approximately 870,000, one can estimate that there are currently 3300 commuting cyclists daily in the County. A reasonable goal for increased bicycle mode share is to achieve the region-wide average (0.56%) over the life of the plan. This increased mode share taken together with an increase in workers would result in approximately 5500 commuting cyclists within the next 20 years. Anecdotal evidence indicates that substantial recreational cycling occurs in San Bernardino County in areas where facilities are available. If San Bernardino County is generally representative of the nation, the following national statistics help to characterize the cycling and walking habits of the population (Source: National Survey of Bicyclist and Pedestrian Attitudes and Behavior, National Highway Traffic Safety Administration, August 2008.). The survey was of persons age 16 and older. National Bicycling Statistics
� 27% of the population age 16 and older rode a bicycle at least once in the last 30 days; translated to San Bernardino County, this would mean approximately 300,000 persons 16 and older road their bike in the last month.
� 19% indicate that they ride at least once per week in the summer months; 57% indicate that they never ride a bike

San Bernardino County Non-Motorized Transportation Plan - Chapter 1 (Draft, 2/22/11)
1-5
� 29% of bicycle trips are for recreational purposes, 24% are for exercise/health, 14% are for personal errands, and only 5% are for commuting to work or school
� Access to bicycles - Slightly less than half (46%) of those 16 and older have regular access to a bicycle, with access increasing with increases in household income.
� About 43 percent ride a bicycle at least once in the summer months. � Bicycling declines with age, with those under 20 most likely to bicycle and doing so more
frequently, while the majority over 45 did not bicycle during the summer months. � About half of all trips (48%) were made on paved roads. An additional 13 percent were
on shoulders of paved roads, and 5 percent on bike lanes on roads. One in 7 was made on sidewalks (14%) and 13% were made on bike trails/paths.
� Half of bicyclists nationally say bike paths are available in the area they ride, while 32 percent say bike lanes are available.
� Over half of those who do not use available bicycle paths or lanes say they don’t use them because they are not convenient, available, or go where they need to go.
� More than one in 10 bicyclists (13%) felt threatened for their personal safety on the most recent day they rode their bicycle, 88 percent of these feeling threatened by motorists.
� About 4 percent of bicyclists, or 2.04 million nationally, were injured while riding in the past two years. About 25% of these were hit by a motorist.
� Nearly half (48%) of those 16 and older are satisfied with how their local community is designed for making bicycle riding safer.
� Almost half (48%) of those 16 and older would like to see improvements to bicycle facilities, including more bike lanes (38%) and bike paths (30%).
National Walking Statistics
� About 86 percent of people 16 or older walked, jogged or ran outdoors for 5 minutes or more during the summer months, with 78 percent doing so within the past 30 days.
� Walking in the past 30 days decreases to 66 percent for those over 64. � Personal errands (38%), exercise (28%) and recreation (21%) are the most common
reasons for walking trips. � Nearly half (45%) of the walking trips were mostly made on sidewalks, and 25 percent
were mostly on paved roads. Just 6 percent were made mostly on bike or walk paths or trails.
� About 6 percent of pedestrians felt their personal safety threatened on their most recent trip, with 62 percent saying they felt threatened by motorists.
� Almost three-quarters of people 16 and older (73%) are satisfied with how their local community is designed for walking, though one-third would like to see changes including more sidewalks (42%) and more street lights (17%).
The physical infrastructure for cycling and walking varies widely from one city to another and within cities as well. Some of the newer communities such as Rancho Cucamonga have worked closely with developers to create walkable residential areas with an abundance of trails, bicycle facilities and other amenities. Some older communities such as Redlands have had the historical benefit of sidewalks, grid streets, and streets wide enough for bicycles and autos to co-exist. Each city or unincorporated area has its strengths and weaknesses with respect to the suitability of infrastructure for walking and cycling. One of the purposes of the NMTP is to re-think the role of some of the streets in our communities – who uses them, how they function, and how they are designed. It is while the infrastructure of the new century is being designed and constructed that the needs of all transportation users must be taken into account. Quality is an easier goal to achieve when

San Bernardino County Non-Motorized Transportation Plan - Chapter 1 (Draft, 2/22/11)
1-6
designed from the beginning – and prohibitively expensive to add after the fact. California’s “Complete Streets” legislation (AB 1358) pushes local governments to think multi-modally when constructing roadway infrastructure, and not consider autos and trucks exclusively.
1.3 Overview of the NMTP Development Process The development of the 2011 NMTP was a collaborative effort between SANBAG and local jurisdictions in San Bernardino County, with policy oversight by the SANBAG Board of Directors. The existing 2006 update of the NMTP and the associated local jurisdiction plans provided the starting point, but the 2011 Plan represents a wholesale upgrade of the entire document, focusing principally on the bicycle system, but on the walking environment as well. SANBAG staff conducted an initial inventory of all existing Class I, II and III bicycle facilities in the County and rode most of the facilities personally. This was supplemented by local jurisdiction inventory data. Existing facilities were then mapped, and proposed facilities from the prior plan were superimposed. This served as the starting point for network development, representing an interactive process between SANBAG and local jurisdiction staff. Basic criteria were applied to gauge the need and feasibility for additional bicycle facilities, including:
� Connections to major destination points and trip generators � Connectivity within and across jurisdictional boundaries � Potential for usage of exclusive rights-of-way (i.e. for Class I facilities) � Physical characteristics of roadways and suitability for accommodation of bicycle
facilities (i.e. for Class II and III facilities) � Closing gaps between existing facilities � Constructability and cost issues
Accident data were tabulated from the Statewide Integrated Traffic Records System (SWITRS), both by jurisdiction and for the County as a whole. A comprehensive countywide map of existing and proposed facilities was then prepared, and a draft subarea map was prepared for each jurisdiction. Each map was accompanied by tables of existing and proposed facilities, and a narrative was prepared describing both existing conditions and the bikeway plan for each. Construction costs were estimated for each improvement type and segment based on current unit cost factors (in 2010 dollars). The relevant sections were provided to each jurisdiction for review. Typically two to three review cycles were undertaken before the city-level maps, tables, and text were finalized. These represented the “core” of the bicycle portion of the plan and were incorporated into Chapter 4. The Transportation Technical Advisory Committee (TTAC) served as a focal point for discussion of technical issues related to the NMTP. Periodic reviews of NMTP status were provided to the TTAC beginning in 2009. The body of the report was completed and provided for local jurisdiction review in mid-February 2011. The report was reviewed by the TTAC and by individual jurisdictions, and comments were reflected in the text, as appropriate.
San Bernardino County Non-Motorized Transportation Plan - Chapter 1 (Draft, 2/22/11)
1-7
The SANBAG Plans and Programs Committee served as the committee with policy oversight throughout the process. The committee approved the proposed NMTP policies in October 2009 and received reports on the Plan in February and March, 2011. Following approval of the NMTP by the Committee on March 16 (action yet to come), the SANBAG Board approved the Plan on April 6 (action yet to come). Individual jurisdictions were responsible for approval of the Plan with their own city councils and the Board of Supervisors. Public involvement opportunities have been available through the open meetings of the Plans and Programs Committee. Agendas have been posted and are available to all through the SANBAG website. However, direct outreach to the public and advocacy groups was limited during the course of the development of this Plan, due to the compressed timeline in which the Plan had to be prepared once the dates were set by the State for local jurisdiction applications for Bicycle Transportation Account funds. Nevertheless, one of the implementation actions listed in Chapter 7 is to take this significantly upgraded NMTP to both bicycle and pedestrian advocates and the general public. Comments and suggestions from these groups will be incorporated into the Plan, with another update of the NMTP anticipated by the end of 2012.
1.4 Relationship to Other Planning Efforts The San Bernardino County Non-Motorized Transportation Plan is intended to coordinate and guide the provision of all bicycle related plans, programs and projects within the County. As a countywide plan, it focuses on providing bikeway connections between the incorporated cities, adjacent counties and major regional destinations within the County. The Plan also identifies local jurisdiction priorities, where applicable, and serves as a guide regarding bikeway policies and design standards. Southern California Association of Governments’ Regional Transportation Plan (RTP) The SCAG 2008 RTP contains a non-motorized section and is supported by a separate report for non-motorized transportation. The policies/desired outcomes expressed in this report include the following:
� Decrease bicyclist and pedestrian fatalities and injuries � Increase accommodation and planning for bicyclists and pedestrians � Increase bicycle and pedestrian use in the SCAG region as an alternative to vehicle trips � Encourage development of local non-motorized plans � Produce a comprehensive regional non-motorized plan � Improve funding for non-motorized transportation
The San Bernardino County NMTP is consistent with these statements. In fact, the NMTP represents the implementation of several of these desired outcomes. The RTP also contains mapping of non-motorized facilities that incorporates mapping prepared by subregions such as SANBAG. As such, the RTP is a coordinating document in particular for routes, pathways, and trails that cross county boundaries. A major focus of the 2012 RTP is the development of a Sustainable Communities Strategy (SCS). This includes the focusing of land use activity within existing and future transit station areas and the planning for transportation strategies that enhance non-auto mobility, reduce

San Bernardino County Non-Motorized Transportation Plan - Chapter 1 (Draft, 2/22/11)
1-8
energy consumption, and reduce greenhouse gases. Non-motorized transportation modes will play a prominent role in the SCS. SANBAG Long Range Transit Plan (LRTP) The Long Range Transit Plan addresses the County’s travel challenges and provides a system of transit facilities and services that can increase transit’s role in the future. Given the large and diverse nature of the county, the plan is split geographically into three areas: San Bernardino Valley; Victor Valley; and rural areas. In the San Bernardino Valley, the LRTP includes major projects such the Redlands Rail system between San Bernardino and downtown Redlands, extension of the Gold Line to Montclair, with additional planning to LA/Ontario International Airport, and extensive Bus Rapid Transit network. The first segment of the BRT system between Cal State San Bernardino and Loma Linda is scheduled to be in operational service by 2015. There are many transit stations around which non-motorized facilities should be planned. Figure 1-2 shows the existing and future LRTP network in the Valley and approximate station locations around which land use and pedestrian/bicycle connectivity can be planned.
Figure 1-2. Existing and Future Long Range Transit Plan Network
Improvement to Transit Access for Cyclists and Pedestrians SANBAG has received a grant from Caltrans under the Statewide or Urban Transit Planning Studies program for an effort entitled “Improvement to Transit Access for Cyclists and Pedestrians.” The project seeks to identify a range of physical infrastructure improvements, such as more or better bicycle parking, better way-finding signage and better connections to nearby pedestrian paths, trails and bike lanes to encourage more people to walk or bike to Metrolink and planned E Street sbX stations. Such infrastructure improvements would provide
San Bernardino County Non-Motorized Transportation Plan - Chapter 1 (Draft, 2/22/11)
1-9
Metrolink and sbX users with additional modal alternatives to and from the transit system, thereby decreasing automobile traffic within station catchment areas and reducing the need for automobile parking at station locations. Moreover, providing improved infrastructure within transit catchment areas will promote increased safety for pedestrians and cyclists. This planning effort should be completed near the end of Fiscal Year 2011-2012. Measure I 2010-2040 Strategic Plan The SANBAG Board of Directors approved the Strategic Plan on April 1, 2009. The Strategic Plan is the reference manual and policy document for the administration of Measure I 2010-2040 programs by SANBAG and its member agencies. Measure I funds come from the 1/2 cent sales tax approved by voters in 1989 and extended by the voters to 2040 in the 2004 elections. The report is presented in two parts and a series of appendices. Part 1 provides an overview of Measure I 2010-2040, describes the scope of each Measure I program, presents financial information, and provides an overview of the policy structure for each program. Part 2 presents the specific policies by which each Measure I program will be administered. Roadway-based non-motorized facilities are included as eligible expenditures through the Valley Major Street/Arterial program and through the Major/Local Highways programs for Mountain/Desert Subareas. In addition, planning and project development activities may be funded through the Traffic Management System programs in each subarea. U.S. Forest Service Plans and Mapping The U.S. Forest Service maintains Forest Management Plans that identify and plan for pathways and trails within the National Forest system, including the San Bernardino National Forest. In addition, maps are available showing trails and forest roads for hiking and mountain biking. See the following link to the San Bernardino National Forest: http://www.fs.usda.gov/wps/portal/fsinternet/!ut/p/c4/04_SB8K8xLLM9MSSzPy8xBz9CP0os3gjAwhwtDDw9_AI8zPwhQoY6BdkOyoCAPkATlA!/?ss=110512&navtype=BROWSEBYSUBJECT&navid=091000000000000&pnavid=null&recid=null&actid=null&groupid=null&ttype=main&pname=San Bernardino National Forest- Home. Caltrans Bicycle Transportation Account Although not a plan, the Bicycle Transportation Account (BTA) is an important program that annually provides State funds for city and county projects that improve safety and convenience for bicycle commuters. To be eligible for BTA funds, a city or county must prepare and adopt a Bicycle Transportation Plan (BTP) that complies with Streets and Highways Code Section 891.2. The BTP must be approved by the local agency’s Regional Transportation Planning Agency. Caltrans anticipates an appropriation of $7.2 million annually for projects that improve safety and convenience for bicycle commuters. Streets and Highways Code (S&HC) Section 2106 stipulates the annual BTA funding level, subject to appropriation in the approved State budget. Per S&HC 891.4(b), funds are allocated to cities and counties on a matching basis that requires the applicant to furnish a minimum of 10 percent of the total project cost. No applicant shall receive more than 25 percent of the total amount transferred to the BTA in a single fiscal year.

San Bernardino County Non-Motorized Transportation Plan - Chapter 1 (Draft, 2/22/11)
1-10
Additional information on funding sources for cycling and walking facilities is provided in Chapter 7.
1.5 Structure of the NMTP The Non-motorized Transportation Plan is organized into the following chapters: Executive Summary 1. Introduction 2. Regional System Overview and Goals, Objectives, and Policies 3. Bicycle Planning 4. Pedestrian Planning 5. Local Jurisdiction Bicycle Plans 6. Design Guidelines 7. Plan Implementation Chapter 5 is the key chapter showing the NMTP for bikeways at the jurisdiction level. It includes an inventory of existing and proposed facilities, mileage statistics, accident data, and a narrative that ties each plan together. SANBAG acknowledges several Non-Motorized Transportation Plans prepared for other California jurisdictions from which information, graphics, and examples were drawn for inclusion in the San Bernardino County NMTP, specifically, bicycle plans for Stanislaus County, San Francisco Bay Area, and City of Portland. Additional information was extracted from the Caltrans Design Manual, Chapter 1000 – Bikeway Planning and Design, American Association of State Highway and Transportation Officials (AASHTO) Guidelines for the Development of Bicycle Facilities, and the Federal Highway Administration’s Manual on Uniform Traffic Control Devices (MUTCD). To be eligible for Bicycle Transportation Account (BTA) funds, a city or county must prepare and adopt a Bicycle Transportation Plan that addresses items a. - k. in Streets and Highways Code Section 891.2. Caltrans has prepared a checklist of requirements under this code section, and the NMTP references the pages of the Plan that address those requirements. These are listed in Table 1-2.

San Bernardino County Non-Motorized Transportation Plan - Chapter 1 (Draft, 2/22/11)
1-11
Table 1-2. Requirements of Streets and Highways Code Section 891.2 and References to
Pages in the Plan that Address these Requirements
Requirement Pages a) The estimated number of existing bicycle commuters in the plan area and the estimated increase in the number of bicycle commuters resulting from implementation of the plan.
To be provided in final
b) A map and description of existing and proposed land use and settlement patterns which shall include, but not be limited to, locations of residential neighborhoods, schools, shopping centers, public buildings, and major employment centers.
To be provided in final
c) A map and description of existing and proposed bikeways. To be provided in final
d) A map and description of existing and proposed end-of-trip bicycle parking facilities. These shall include, but not be limited to, parking at schools, shopping centers, public buildings, and major employment centers.
To be provided in final
e) A map and description of existing and proposed bicycle transport and parking facilities for connections with and use of other transportation modes. These shall include, but not be limited to, parking facilities at transit stops, rail and transit terminals, ferry docks and landings, park and ride lots, and provisions for transporting bicyclists and bicycles on transit or rail vehicles or ferry vessels.
To be provided in final
f) A map and description of existing and proposed facilities for changing and storing clothes
To be provided in final
g) A description of bicycle safety and education programs conducted in the area included within the plan, efforts by the law enforcement agency having primary traffic law enforcement responsibility in the area to enforce provisions of the Vehicle Code pertaining to bicycle operation, and the resulting effect on accidents involving bicyclists.
To be provided in final
h) A description of the extent of citizen and community involvement in development of the plan, including, but not limited to, letters of support.
To be provided in final
i) A description of how the bicycle transportation plan has been coordinated and is consistent with other local or regional transportation, air quality, or energy conservation plans, including, but not limited to, programs that provide incentives for bicycle commuting.
To be provided in final
j) A description of the projects proposed in the plan and a listing of their priorities for implementation.
To be provided in final
k) A description of past expenditures for bicycle facilities and future financial needs for projects that improve safety and convenience for bicycle commuters in the plan area.
To be provided in final