sans analytics and intelligence survey - logrhythm.com
TRANSCRIPT
SANS 2016 Security Analytics Survey
©2016 SANS™ Institute
A SANS Survey
Written by Dave Shackleford
December 2016
Sponsored by
AlienVault, Anomali, LogRhythm, LookingGlass Cyber Solutions, and Rapid7

When SANS started conducting its security analytics surveys in 2013,1 few organizations
were actively leveraging security analytics platforms, intelligence tools and services.
Fewer still had highly or fully automated processes in place for analyzing data and
producing effective detection and response strategies. Since then, survey respondents
have become more aware of the value of analytics and have moved beyond using them
simply for detection and response to using them to measure and aid in
improving their overall risk posture.
Of their top three use cases for security analytics data, 38% use analytics
for assessing risk, 35% for identifying malicious behaviors within the
environment, and 31% for meeting compliance mandates.
While usage of analytics has matured since SANS started conducting
this survey, organizations appear to be losing ground on breaches
and significant attacks, based on this year’s survey results. Fewer
respondents (17% in 2016 compared to 25% in 2015)2 stated that they
had not experienced a breach.
As in our past surveys, respondents report they are short on skilled
professionals, as well as short on funding and resources to support
security analytics. Worse, they’re still having trouble baselining “normal”
behavior in their environments, a metric necessary to accurately detect,
inspect and block anomalous behaviors.
Automation has a lot to do with helping to overcome these issues, yet
only 4% consider their analytics capabilities fully automated, and just
22% of respondents are currently using tools that incorporate machine
learning. Machine learning offers more insights that could help less-
skilled analysts with faster detection, automatic reuse of patterns
detected and more.
We’ve got a long way to go before analytics truly progresses in many
security organizations. Without a doubt, the event management,
analysis and security operations skills shortage is the biggest inhibitor,
and it’s also the area most organizations rank as the top focus for future
spending.
SANS ANALYST PROGRAMSANS 2016 Security Analytics Survey1
Executive Summary
1 “SANS Security Analytics Survey,” www.sans.org/reading-room/whitepapers/analyst/security-analytics-survey-34980
2 “2015 Analytics and Intelligence Survey,” www.sans.org/reading-room/whitepapers/analyst/2015-analytics-intelligence-survey-36432, p. 15.
utilize analytics to some degree in their
prevention programs, 89% in their detection
programs and 86% in response programs
utilize in-house analytics systems of
various types
(on average) of respondents do not utilize
analytics or don’t know if they do
(the largest group) integrate analytics
functions with SIEM systems
Analytics Usage
66%
11%
88%
33%
consider their analytics processes “fairly”
automated
consider their analytics capabilities fully
automated, and only 10% consider their
environments ”highly” automated
are able to quantify improvements in
detection and response by using analytics
Automation and Improvements
54%
4%
44%
About the Respondents
SANS ANALYST PROGRAMSANS 2016 Security Analytics Survey2
Most of the 348 participants who took the 2016 SANS Security Analytics survey were
security analysts or administrators, with 37% representing this group. Another 24%
were IT or security managers—12% were IT managers, directors or CTOs; and 12% were
security managers, directors or CSOs. Various titles, such as security architect, auditor
and developer, were lightly represented, with one write-in job title of cyber threat
intelligence analyst.
Industry Types
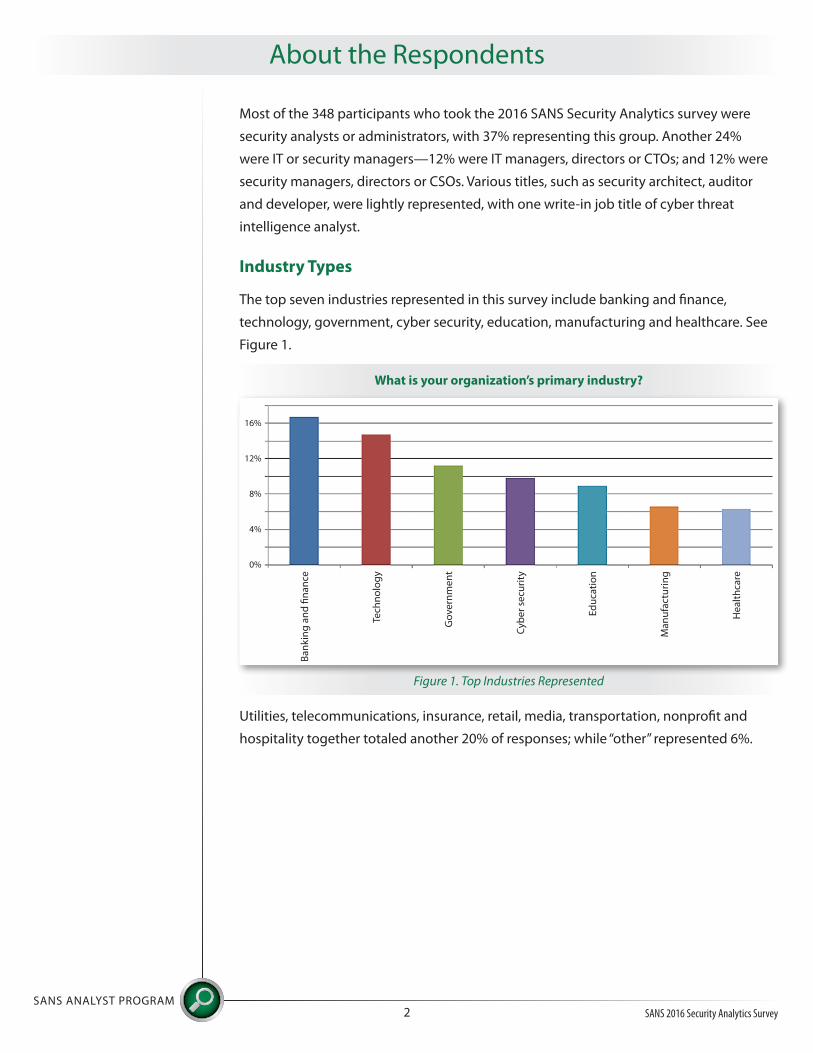
The top seven industries represented in this survey include banking and finance,
technology, government, cyber security, education, manufacturing and healthcare. See
Figure 1.
Utilities, telecommunications, insurance, retail, media, transportation, nonprofit and
hospitality together totaled another 20% of responses; while “other” represented 6%.
What is your organization’s primary industry?
Ma
nu
fact
uri
ng
Go
ve
rnm
en
t
Ba
nk
ing
an
d fi
na
nce
He
alt
hca
re
Cy
be
r se
curi
ty
Tech
no
log
y
Ed
uca
tio
n
Figure 1. Top Industries Represented
16%
12%
8%
4%
0%
About the Respondents (CONTINUED)
SANS ANALYST PROGRAMSANS 2016 Security Analytics Survey3
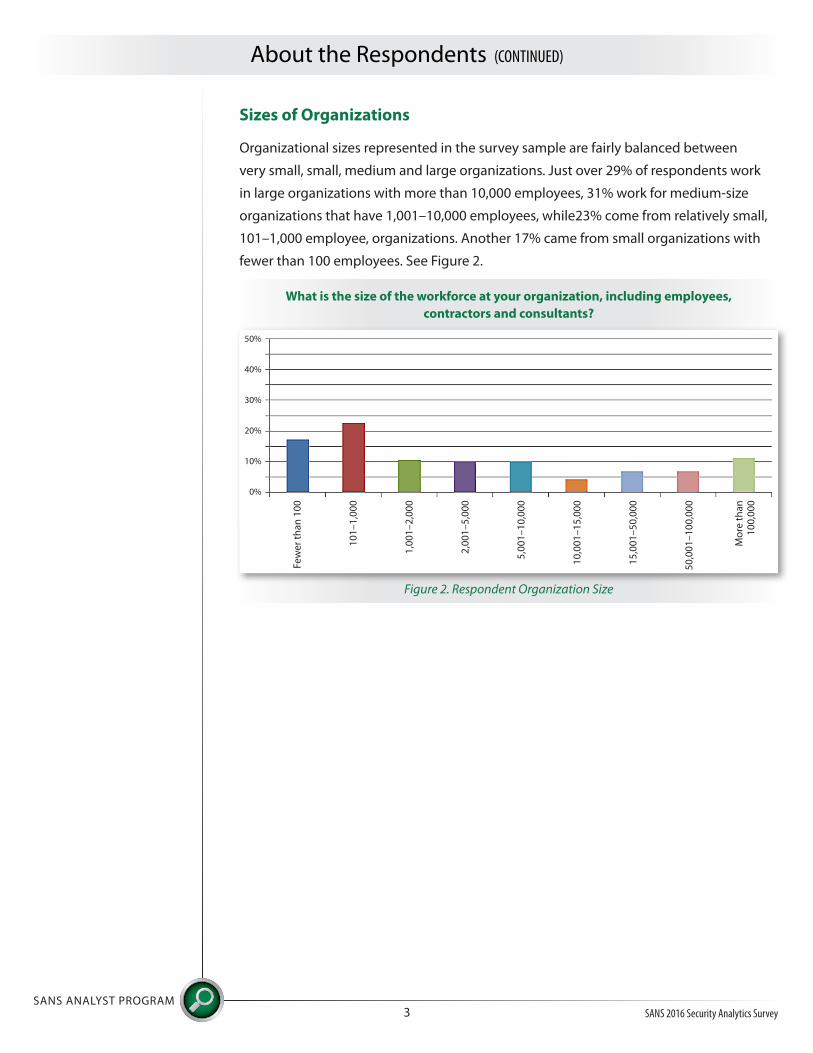
Sizes of Organizations
Organizational sizes represented in the survey sample are fairly balanced between
very small, small, medium and large organizations. Just over 29% of respondents work
in large organizations with more than 10,000 employees, 31% work for medium-size
organizations that have 1,001–10,000 employees, while23% come from relatively small,
101–1,000 employee, organizations. Another 17% came from small organizations with
fewer than 100 employees. See Figure 2.
Figure 2. Respondent Organization Size
What is the size of the workforce at your organization, including employees,
contractors and consultants?
10
,00
1–
15
,00
0
Mo
re t
ha
n
10
0,0
00
1,0
01
–2
,00
0
Few
er
tha
n 1
00
15
,00
1–
50
,00
0
2,0
01
–5
,00
0
10
1–
1,0
00
50
,00
1–
10
0,0
00
5,0
01
–1
0,0
00
Figure 2. Respondent Organization Size
50%
40%
30%
20%
10%
0%
About the Respondents (CONTINUED)
SANS ANALYST PROGRAMSANS 2016 Security Analytics Survey4
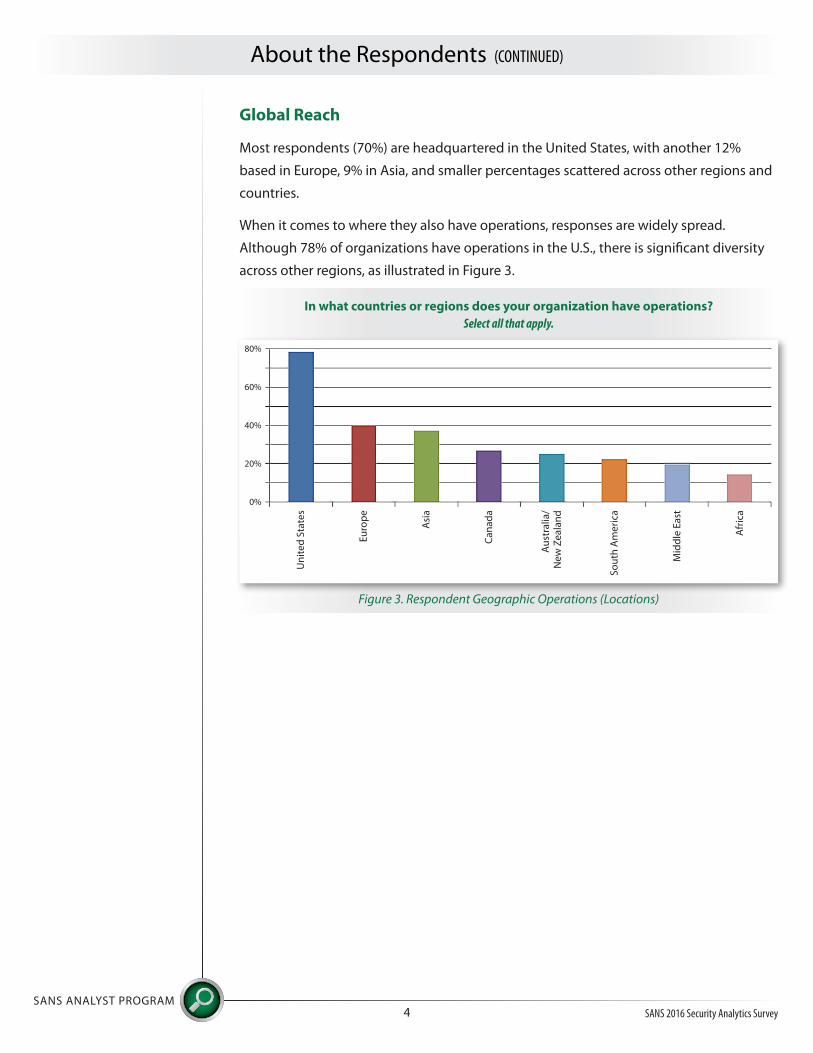
Global Reach
Most respondents (70%) are headquartered in the United States, with another 12%
based in Europe, 9% in Asia, and smaller percentages scattered across other regions and
countries.
When it comes to where they also have operations, responses are widely spread.
Although 78% of organizations have operations in the U.S., there is significant diversity
across other regions, as illustrated in Figure 3.
In what countries or regions does your organization have operations?
Select all that apply.
So
uth
Am
eri
ca
Asi
a
Un
ite
d S
tate
s
Mid
dle
Ea
st
Ca
na
da
Eu
rop
e
Afr
ica
Au
stra
lia/
Ne
w Z
ea
lan
d
Figure 3. Respondent Geographic Operations (Locations)
80%
60%
40%
20%
0%

Based on the trends we saw emerging in 2015, organizations are focusing on collecting
more and more data to perform analytics processing. The more data security teams
can collect, the more data can be normalized and baselined to detect malicious or
anomalous behavior.
Security Data from Everywhere
Currently, the most common types of data being gathered and aggregated for use with
analytics platforms include application logs and events, network security events and
vulnerability management data. Host-based anti-malware tools and other endpoint
security tools are also popular today. More than half of respondents are gathering data
from common security technologies, such as SIEM, log management, and network
packet capture and detection tools, too. See Table 1.
SANS ANALYST PROGRAMSANS 2016 Security Analytics Survey5
Security Data and Analytics
Table 1. Systems, Services and Applications Used for Data Collection Today
Systems, Services and Applications
Application information (event logs, audit logs)
Network-based firewalls/IPS/IDS/UTM devices
Vulnerability management tools (scanners, configuration and patch management, etc.)
Endpoint protection (MDM, NAC, log collectors)
Host-based anti-malware
Dedicated log management platform
Whois/DNS/Dig and other Internet lookup tools
Security intelligence feeds from third-party services
Network packet-based detection
SIEM technologies and systems
Intelligence from your security vendors
Host-based IPS/IDS
Relational database management systems (transactions, event logs, audit logs)
ID/IAM (identity and access management) systems
User behavior monitoring
Network-based malware sandbox platforms
Cloud activity/Security data
Management systems for unstructured data sources (NoSQL, Hadoop)
Other
Response
86.3%
82.5%
77.6%
72.0%
70.6%
65.0%
62.4%
60.9%
60.3%
59.8%
58.6%
57.1%
53.4%
50.1%
41.7%
41.4%
36.2%
24.8%
4.7%
Security Data and Analytics (CONTINUED)
SANS ANALYST PROGRAMSANS 2016 Security Analytics Survey6
In our 2015 survey, 29% conducted intelligence on their cloud environments.3 In this
year’s survey, 36% are doing security analytics on their cloud activity, while 45% say
they’ll be doing so in the future. This increase illustrates the growth potential that
analyzing cloud activity represents, which may be driven by organizations beginning to
store more critical data in cloud applications.
Other growth areas include unstructured data management tools, with 40% planning
this for the future, and user-behavior monitoring, planned for future investment by
37%. Given that network malware sandboxes are still a growing technology, the 41%
of respondents’ organizations actively incorporating data from them is still lower than
some other tools, but another 33% plan to gather data from them in the future, as well.
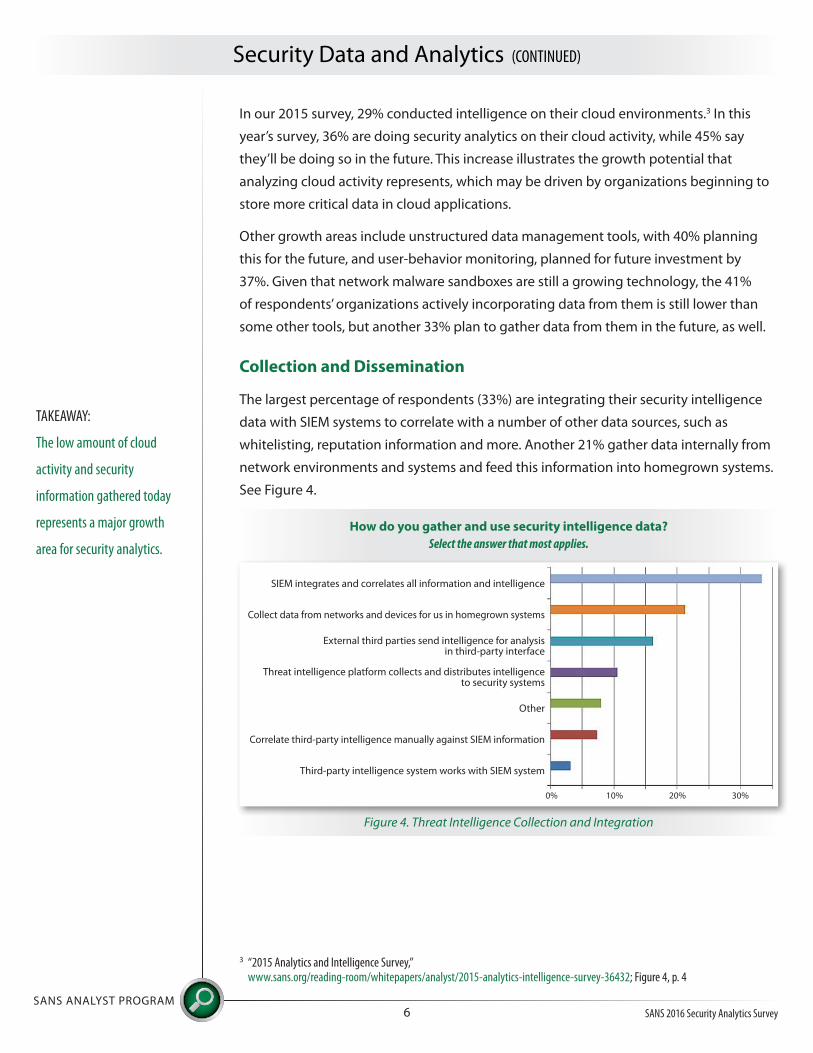
Collection and Dissemination
The largest percentage of respondents (33%) are integrating their security intelligence
data with SIEM systems to correlate with a number of other data sources, such as
whitelisting, reputation information and more. Another 21% gather data internally from
network environments and systems and feed this information into homegrown systems.
See Figure 4.
3 “2015 Analytics and Intelligence Survey,” www.sans.org/reading-room/whitepapers/analyst/2015-analytics-intelligence-survey-36432; Figure 4, p. 4
How do you gather and use security intelligence data?
Select the answer that most applies.
Correlate third-party intelligence manually against SIEM information
External third parties send intelligence for analysis in third-party interface
SIEM integrates and correlates all information and intelligence
Third-party intelligence system works with SIEM system
Threat intelligence platform collects and distributes intelligence to security systems
Collect data from networks and devices for us in homegrown systems
Other
Figure 4. Threat Intelligence Collection and Integration
0% 20%10% 30%
TAKEAWAY:
The low amount of cloud
activity and security
information gathered today
represents a major growth
area for security analytics.

The development and maintenance of “homegrown systems” often requires significant
time from skilled analysts utilizing manual processes. The heavy use of homegrown
systems also ties to more security analytics systems being managed in-house. In the
survey, 66% are running commercial systems internally, 38% use internally managed
open source tools, and 29% use custom-developed in-house systems for analytics
processing. Only 27% are leveraging cloud-based tools.
Lagging in Automation
In 2015,4 only 3% felt that their analytics processes were fully automated, and another
6% stated that they had a “highly automated” intelligence and analytics environment.
This year’s results were almost identical for these values: 4% were fully automated, while
10% were “highly automated” (a slight increase). In 2015, 51% of respondents stated that
their analytics processes were “fairly automated” through internal development, third-
party tools or a combination of both. That number went up slightly in 2016 to 54%. Last
year, 7% said that their level of automation in pattern recognition was unknown. This
number is up to 11% this year, but we also found that 22% are not automated at all. See
Table 2.
On one hand, the number of “unknown” answers is higher in 2016, but the number of
organizations completely lacking in automation has gone down significantly (from 32%
in 2015 to 22%). This is still a new technology for many, and it will likely take some time
for organizations to truly automate partially or fully.
Security Data and Analytics (CONTINUED)
SANS ANALYST PROGRAMSANS 2016 Security Analytics Survey7
4 “2015 Analytics and Intelligence Survey,” www.sans.org/reading-room/whitepapers/analyst/2015-analytics-intelligence-survey-36432, p. 6.
Table 2. Automation of Pattern Recognition 2015 and 2016
Fairly Automated
Highly Automated
Fully Automated
Not Automated
Unknown
2015
51.1%
6.4%
3.4%
31.8%
7.4%
2016
53.7%
9.9%
3.6%
22.1%
10.5%
How automated is your pattern recognition process (i.e., ability to develop meaningful patterns of information from your data)?
Percentage of analytics
programs that are not
automated at all
22%

Machine learning, an essential part of automating the analytics process, is still not widely
utilized by security teams. In our 2016 survey, only 22% are utilizing machine learning
capabilities in their analytics programs, while 54% are not. The remaining 24% weren’t
sure. These results may be affected by differences in the way vendors promote their
products as including machine learning and by the number of analysts responding to
this survey. Analysts without direct access to the thresholds and algorithms driving their
systems may not know whether machine learning is involved.
Detecting Breaches
While machine learning holds promise, a lack of automation capabilities and data science
skills to analyze data from multiple tool sets may be partly responsible for a spike in
successful breaches and attacks reported in this year’s survey. In 2015, just over 23%
of respondents didn’t know whether they’d been breached; in 2016, 30% couldn’t tell
whether they’d been breached. Fewer respondents stated that they had not experienced
a breach in 2016 (17% versus 25% in 2015), and the number of respondents experiencing
one to five breaches increased to 32% from 30% in 2015. One positive note is that the
number of organizations that experienced 11 to 50 breaches decreased from 11% to 6%.
In both 2015 and 2016, less than 5% experienced more than 50 breaches. See Figure 5.
Security Data and Analytics (CONTINUED)
SANS ANALYST PROGRAMSANS 2016 Security Analytics Survey8
How many breaches or significant attacks has your organization experienced
in the past two years that required response and remediation?
21
–5
0
1–
5
Un
kn
ow
n
51
–1
00
6–
10
No
ne
Mo
re t
ha
n 1
00
11
–2
0
Figure 5. 2016 Breaches Reported
50%
40%
30%
20%
10%
0%
TAKEAWAY:
Based on the survey data,
organizations are using
analytics more across
the board, are seeing
improvements in all phases
of their security strategies,
and have better visibility
and response time within
their environments, but the
number of breaches is rising
nonetheless.
MACHINE LEARNING
Machine learning is the
development and use of
algorithms that can analyze
data, discern patterns and
make predictions based on the
data and patterns detected,
typically using system-to-
system-based interactions on
a large scale.
These results may indicate an increase in attack quantity or sophistication, or that
organizations are still learning how best to utilize analytics tools and other controls
for effective prevention, detection and response. As analytics systems go online,
respondents may be more aware of threats they didn’t know about before. We hope to
see those numbers start coming down as organizations get better at using advanced
analytics tools over time.
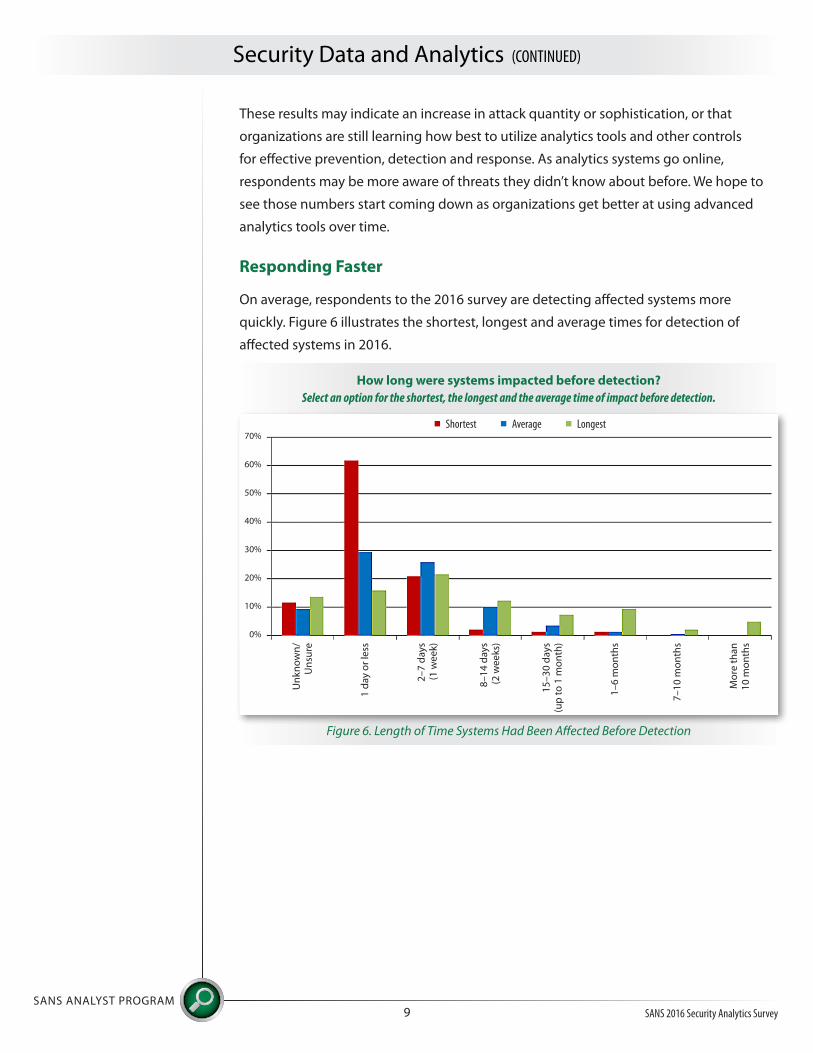
Responding Faster
On average, respondents to the 2016 survey are detecting affected systems more
quickly. Figure 6 illustrates the shortest, longest and average times for detection of
affected systems in 2016.
Security Data and Analytics (CONTINUED)
SANS ANALYST PROGRAMSANS 2016 Security Analytics Survey9
How long were systems impacted before detection?
Select an option for the shortest, the longest and the average time of impact before detection.
Figure 6. Length of Time Systems Had Been Affected Before Detection
70%
60%
50%
40%
30%
20%
10%
0%
Shortest Average Longest
1–
6 m
on
ths
2–
7 d
ays
(1
we
ek)
Un
kn
ow
n/
Un
sure
7–
10
mo
nth
s
8–
14
da
ys
(2 w
ee
ks)
1 d
ay
or
less
Mo
re t
ha
n
10
mo
nth
s
15
–3
0 d
ays
(u
p t
o 1
mo
nth
)
Those time frames are somewhat shorter, in general, than those reported in 2015:
• Average time to detection decreased. In 2015, for those that had experienced
breaches, 37% indicated that the average time to detection for an impacted
system was one week or less. This number decreased to 26% in 2016. In fact, for
both years, 30% reported that they could detect an impacted system in one day or
less.
• Shortest time to detection increased. In 2015, when asked about the shortest
time to detection, 71% indicated breaches were usually detected within the same
day. In 2016, the shortest time to detect (the same day) decreased to 62%.
However, the second most frequent response shows a small improvement. In 2015,
the second most common response to the shortest time to detection was within
one week, chosen by 18%. In 2016, 21% chose within one week.
Together, the shortest time to detection reported in 2016 is slightly slower than in
2015. Teams appear to be taking somewhat longer to detect and remediate overall,
which could also be related to the quantity of breaches, sophistication of attackers,
or both.
• Longest time to detection decreased. In 2015, some 7% of organizations
indicated their longest time to detection was more than 10 months, and this
number decreased to 5% in 2016.
Security Data and Analytics (CONTINUED)
SANS ANALYST PROGRAMSANS 2016 Security Analytics Survey10
TAKEAWAY:
Security analytics should
improve detection
and response times as
organizations automate more
of their processes and learn
to accurately baseline normal
behavior.

Alerting Mechanisms
Endpoint security tools were the top means by which organizations were alerted to
their breaches in this year’s survey, which is a change from 2015, where the top alerting
mechanisms were network and perimeter protection tools such as firewall and IDS. SIEM
and other analytics were the second means of alerting in 2016, whereas this was third
in 2015. Another noteworthy result was with regard to analytics platform alerting (aside
from SIEM), which has increased in importance since 2014,5 when analytics platform
alerting was not even mentioned (again matching the earlier data showing heavier use
and reliance on analytics in all phases).
Figure 7 shows the full list of alerting mechanisms that played a role in events and
detection scenarios in 2016.
Security Data and Analytics (CONTINUED)
SANS ANALYST PROGRAMSANS 2016 Security Analytics Survey11
5 “Analytics and Intelligence Survey 2014, www.sans.org/reading-room/whitepapers/analyst/analytics-intelligence-survey-2014-35507
How were these events brought to the attention of the IT and/or security department?
User reports
Automated alerts from other analytics platforms besides SIEM
Outside party report of malicious behavior coming from within our network
Endpoint monitoring software alerts
Searching manually through our SIEM
Conducting searches with our security analytics platform (not SIEM)
Perimeter defenses (IPS/IDS/Firewall) alerts
Intelligence services provider alerts
Automated alert from our SIEM
Retrospective review of logs or SIEM-related data (largely manual)
Error messages or application alerts
Detected through third-party vendor partner
Other
Figure 7. Alerting Mechanisms During Incidents
0% 20% 40%10% 30% 50%
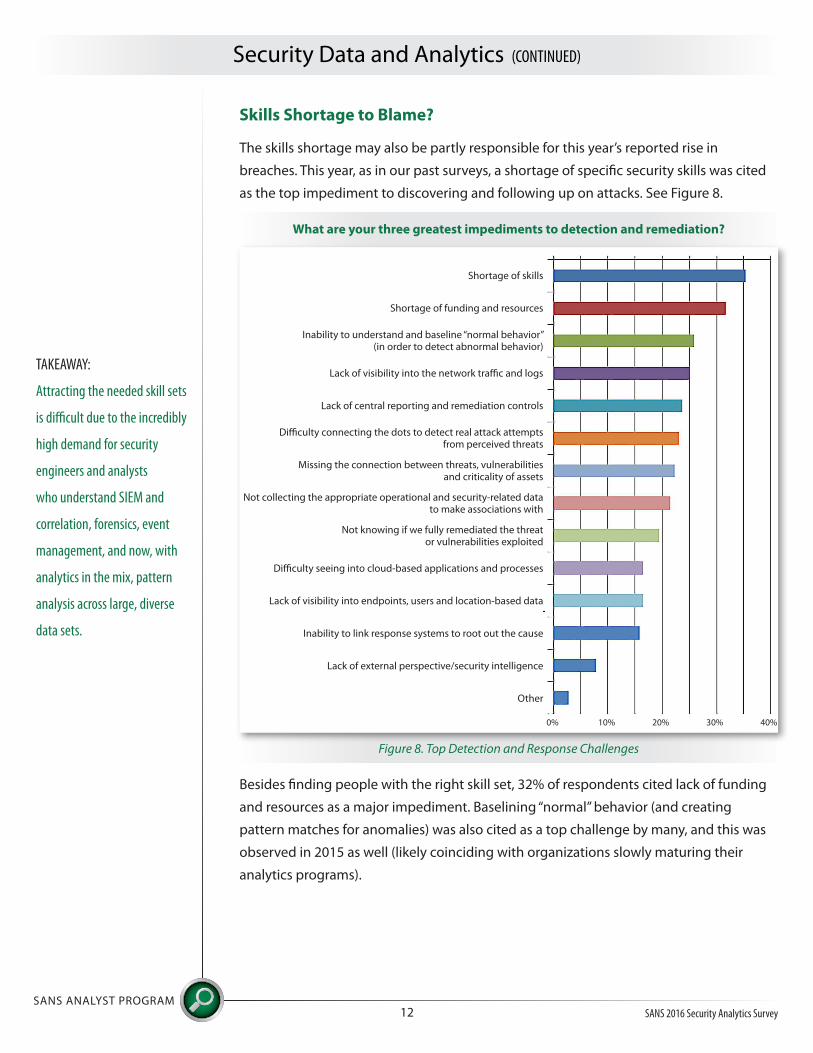
Skills Shortage to Blame?
The skills shortage may also be partly responsible for this year’s reported rise in
breaches. This year, as in our past surveys, a shortage of specific security skills was cited
as the top impediment to discovering and following up on attacks. See Figure 8.
Figure 8. Top Detection and Response Challenges
Besides finding people with the right skill set, 32% of respondents cited lack of funding
and resources as a major impediment. Baselining “normal” behavior (and creating
pattern matches for anomalies) was also cited as a top challenge by many, and this was
observed in 2015 as well (likely coinciding with organizations slowly maturing their
analytics programs).
Security Data and Analytics (CONTINUED)
SANS ANALYST PROGRAMSANS 2016 Security Analytics Survey12
What are your three greatest impediments to detection and remediation?
Figure 8. Top Detection and Response Challenges
0% 20% 40%10% 30%
Difficulty connecting the dots to detect real attack attempts from perceived threats
Inability to understand and baseline “normal behavior” (in order to detect abnormal behavior)
Lack of visibility into endpoints, users and location-based data
Shortage of skills
Not knowing if we fully remediated the threat or vulnerabilities exploited
Missing the connection between threats, vulnerabilities and criticality of assets
Lack of visibility into the network traffic and logs
Inability to link response systems to root out the cause
Shortage of funding and resources
Difficulty seeing into cloud-based applications and processes
Not collecting the appropriate operational and security-related data to make associations with
Lack of central reporting and remediation controls
Lack of external perspective/security intelligence
Other
TAKEAWAY:
Attracting the needed skill sets
is difficult due to the incredibly
high demand for security
engineers and analysts
who understand SIEM and
correlation, forensics, event
management, and now, with
analytics in the mix, pattern
analysis across large, diverse
data sets.
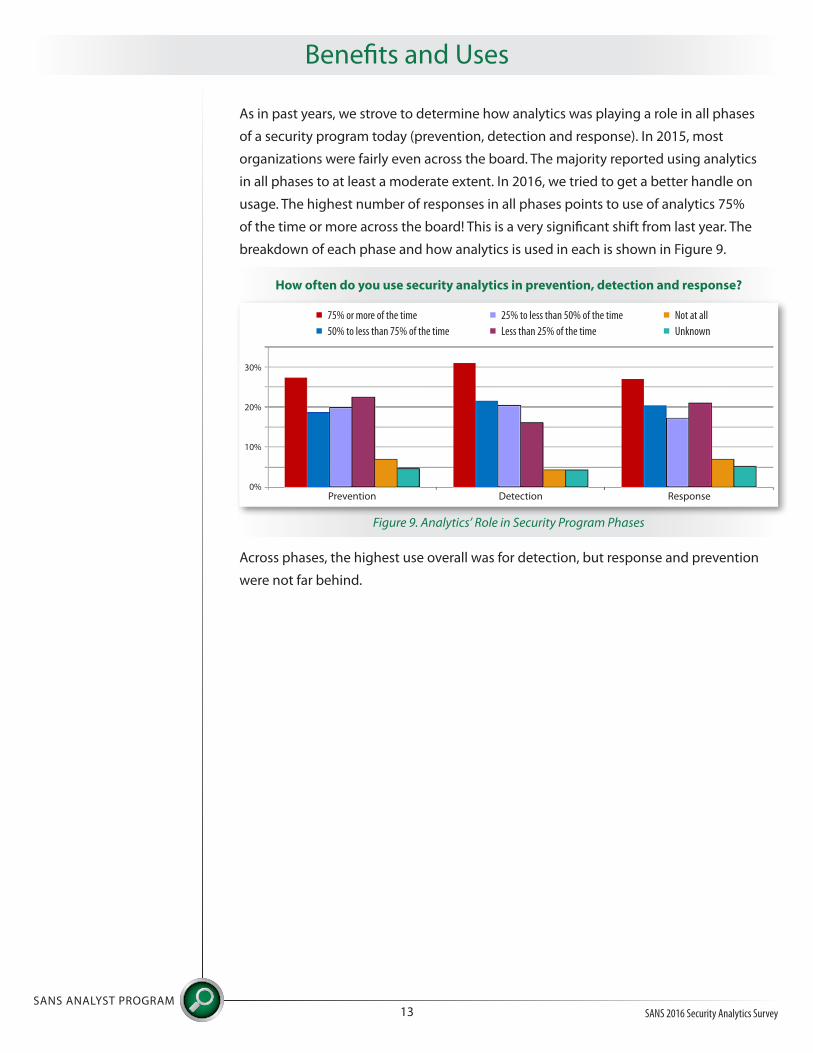
As in past years, we strove to determine how analytics was playing a role in all phases
of a security program today (prevention, detection and response). In 2015, most
organizations were fairly even across the board. The majority reported using analytics
in all phases to at least a moderate extent. In 2016, we tried to get a better handle on
usage. The highest number of responses in all phases points to use of analytics 75%
of the time or more across the board! This is a very significant shift from last year. The
breakdown of each phase and how analytics is used in each is shown in Figure 9.
Across phases, the highest use overall was for detection, but response and prevention
were not far behind.
SANS ANALYST PROGRAMSANS 2016 Security Analytics Survey13
Benefits and Uses
How often do you use security analytics in prevention, detection and response?
Prevention Detection Response
Figure 9. Analytics’ Role in Security Program Phases
30%
20%
10%
0%
75% or more of the time
50% to less than 75% of the time
25% to less than 50% of the time
Less than 25% of the time
Not at all
Unknown
Benefits and Uses (CONTINUED)
SANS ANALYST PROGRAMSANS 2016 Security Analytics Survey14
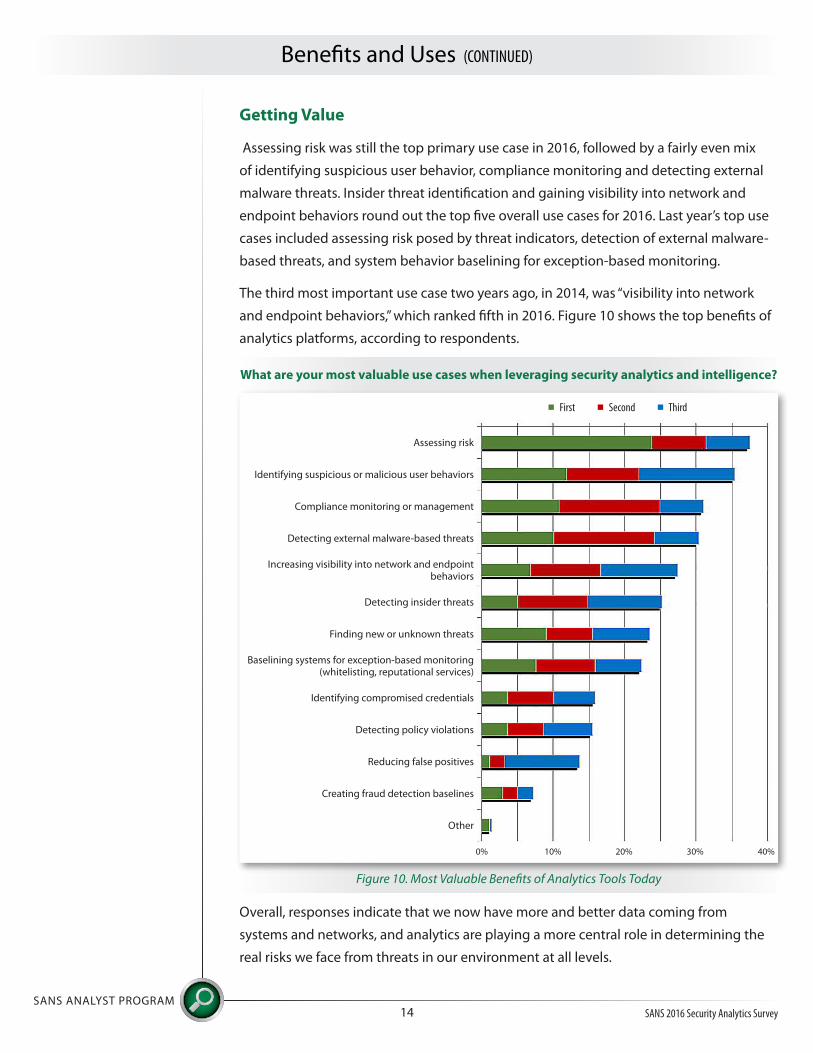
Getting Value
Assessing risk was still the top primary use case in 2016, followed by a fairly even mix
of identifying suspicious user behavior, compliance monitoring and detecting external
malware threats. Insider threat identification and gaining visibility into network and
endpoint behaviors round out the top five overall use cases for 2016. Last year’s top use
cases included assessing risk posed by threat indicators, detection of external malware-
based threats, and system behavior baselining for exception-based monitoring.
The third most important use case two years ago, in 2014, was “visibility into network
and endpoint behaviors,” which ranked fifth in 2016. Figure 10 shows the top benefits of
analytics platforms, according to respondents.
Overall, responses indicate that we now have more and better data coming from
systems and networks, and analytics are playing a more central role in determining the
real risks we face from threats in our environment at all levels.
What are your most valuable use cases when leveraging security analytics and intelligence?
Figure 10. Most Valuable Benefits of Analytics Tools Today
0% 20% 40%10% 30%
First Second Third
Detecting insider threats
Compliance monitoring or management
Reducing false positives
Assessing risk
Identifying compromised credentials
Finding new or unknown threats
Detecting external malware-based threats
Creating fraud detection baselines
Identifying suspicious or malicious user behaviors
Detecting policy violations
Baselining systems for exception-based monitoring (whitelisting, reputational services)
Increasing visibility into network and endpoint behaviors
Other
Benefits and Uses (CONTINUED)
SANS ANALYST PROGRAMSANS 2016 Security Analytics Survey15
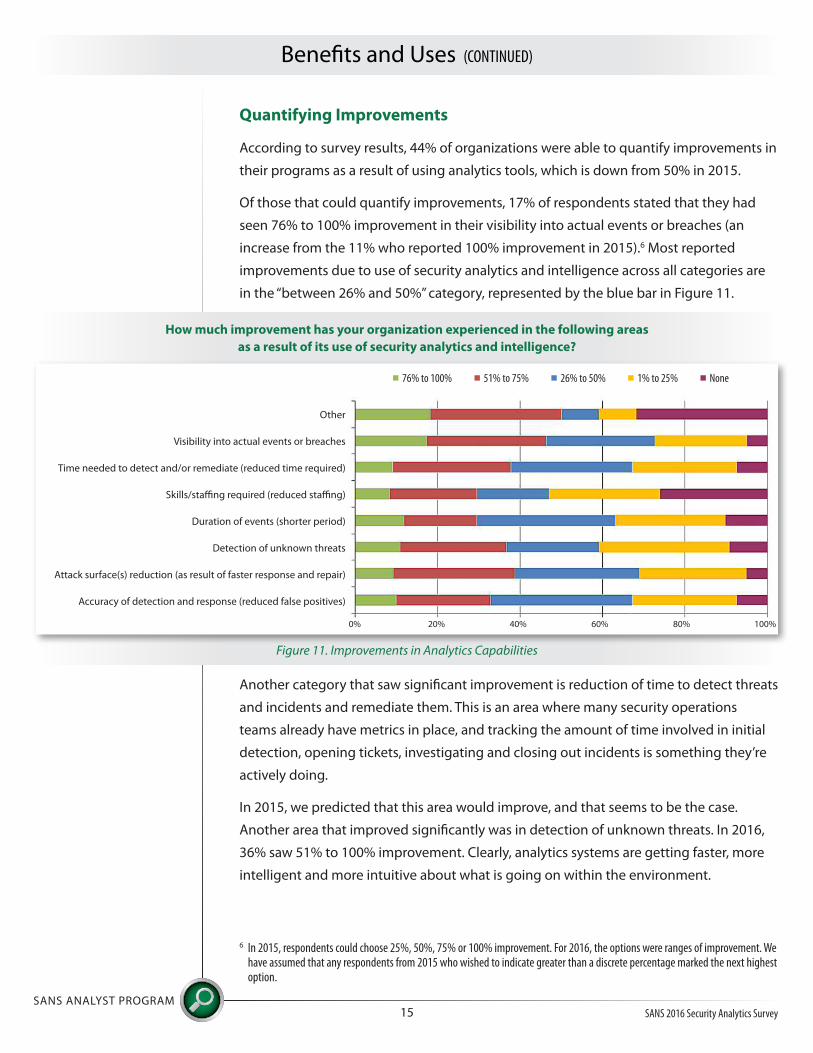
Quantifying Improvements
According to survey results, 44% of organizations were able to quantify improvements in
their programs as a result of using analytics tools, which is down from 50% in 2015.
Of those that could quantify improvements, 17% of respondents stated that they had
seen 76% to 100% improvement in their visibility into actual events or breaches (an
increase from the 11% who reported 100% improvement in 2015).6 Most reported
improvements due to use of security analytics and intelligence across all categories are
in the “between 26% and 50%” category, represented by the blue bar in Figure 11.
Another category that saw significant improvement is reduction of time to detect threats
and incidents and remediate them. This is an area where many security operations
teams already have metrics in place, and tracking the amount of time involved in initial
detection, opening tickets, investigating and closing out incidents is something they’re
actively doing.
In 2015, we predicted that this area would improve, and that seems to be the case.
Another area that improved significantly was in detection of unknown threats. In 2016,
36% saw 51% to 100% improvement. Clearly, analytics systems are getting faster, more
intelligent and more intuitive about what is going on within the environment.
6 In 2015, respondents could choose 25%, 50%, 75% or 100% improvement. For 2016, the options were ranges of improvement. We have assumed that any respondents from 2015 who wished to indicate greater than a discrete percentage marked the next highest option.
How much improvement has your organization experienced in the following areas
as a result of its use of security analytics and intelligence?
Figure 11. Improvements in Analytics Capabilities
0% 40% 80% 100%20% 60%
76% to 100% 51% to 75% 26% to 50% 1% to 25% None
Detection of unknown threats
Time needed to detect and/or remediate (reduced time required)
Other
Attack surface(s) reduction (as result of faster response and repair)
Skills/staffing required (reduced staffing)
Visibility into actual events or breaches
Accuracy of detection and response (reduced false positives)
Duration of events (shorter period)

Capabilities Improving
Regardless of their lack of automation, survey respondents are finding analytics tools
and capabilities more valuable in improving their detection and response capabilities.
In this year’s survey, as in past surveys, few respondents are currently “very satisfied”
with the capabilities of their analytics platforms. Yet, satisfaction with various capabilities
is inching higher. In 2016, 15% were very satisfied in the system’s ability to identify
compromised credentials and phishing attacks, up 1% from 2015. Ability to baseline
what is normal behavior and then alert on exceptions also improved by 1% from 13% in
2015 to 14% in 2016.
In this year’s survey (2016), 16% of organizations were “very satisfied” with their time
to detect, followed by identifying compromised credentials, and the same percentage
was “very satisfied” with integration with detection and response systems. Another 54%
were satisfied with performance and response time, tied with appropriate queries and
reports, followed by time to respond. Inversely, 46% were least satisfied with visibility
into the adversary infrastructure, followed by ability to accurately predict and prevent
unknown threats.
The level of satisfaction with various analytics capabilities is shown in Table 3, which
is ordered from the highest level of combined satisfaction to the lowest, with yellow
shading indicating the highest percentage and blue shading representing the second
highest percentage.
Benefits and Uses (CONTINUED)
SANS ANALYST PROGRAMSANS 2016 Security Analytics Survey16
Table 3. Satisfaction with Analytics Capabilities
Answer Options
Performance and response time
Appropriate queries/meaningful reports
Alert based on exceptions to what is “normal” and approved
Time to respond
Identify compromised credentials and phishing attacks
Quickly correlate events to users
Time to detect
False positives and/or false negatives
Integration with detection and response systems
Cost of tools, maintenance and personnel
Accurately predict and prevent unknown threats
Visibility into actionable security events across disparate systems and users, including cloud services and mobile devices
Single consistent view across reports and alerts
Visibility into external adversary infrastructure
Other
Not Satisfied
26.5%
28.0%
27.6%
30.1%
30.1%
31.9%
34.1%
34.8%
34.8%
37.6%
40.9%
38.7%
39.1%
45.5%
6.1%
Satisfied
54.1%
54.1%
53.4%
53.8%
49.5%
51.3%
47.3%
49.8%
45.5%
47.0%
43.7%
42.3%
38.7%
36.2%
7.2%
Very Satisfied
15.1%
12.9%
13.6%
12.9%
15.4%
12.5%
16.1%
11.5%
15.4%
10.8%
11.8%
12.2%
14.7%
9.3%
3.2%

The level of satisfaction went down in some areas since last year. For example, in our
2015 survey, 15% said they were very satisfied with the capability to quickly correlate
events to users, and only 13% were very satisfied with this capability in 2016.
Many respondents were still unsatisfied with visibility into external adversary
infrastructures based on intelligence and analytics processing, but the situation has
improved slightly, as illustrated by a decrease in dissatisfaction from 53% in 2015 to 46%
in 2016. An additional 41% were also dissatisfied with their analytics tools’ capabilities of
accurately predicting and preventing unknown threats, followed by dissatisfaction with
the ability to have a single consistent view across reports and alerts and visibility into
actionable security events across disparate systems and users, including cloud services
and mobile devices (both roughly 10 percentage points down from 2015).
Big Data vs. Security Analytics
In 2015, security teams were evenly split on whether they thought “security analytics”
and “big data security analytics” were different in any meaningful way. That’s changed in
2016, where more teams DO feel there is a distinction between true “big data analytics”
and “security analytics,” as shown in Figure 12.
Most security teams seem to feel that large quantities of data are crucial to proper
analytics processing, but for the first time, more are making a distinction between
“security analytics” and “big data security analytics.” This trend is heartening, because
security analytics bakes in the technologies needed to analyze large datasets into
solutions designed for security professionals to use.
Benefits and Uses (CONTINUED)
SANS ANALYST PROGRAMSANS 2016 Security Analytics Survey17
TAKEAWAY:
The percentage of those not
satisfied with performance
and response time has actually
improved (27% were not
satisfied with this capability
in 2016, compared to 32%
in 2015). This means the
products in use have gotten
faster, even with higher data
quantities and processing
requirements.
In 2015, the majority of organizations acknowledged that
“big data analytics” is here to stay, and many said it provided better visibility
into events. Do you see a distinction between security analytics
and “big data” security analytics? If so, why?
Figure 12. Distinctions Between Security and “Big Data” Analytics
No, there is no distinction. Security data, by the nature of its volume and complexity, already meets the basic definition of big data. The processes and tools being used are the same for both.
No, there is no distinction. Big data as applied to security analytics is just a buzzword. We are still waiting for adequate tools to analyze the data and recognize meaningful patterns.
Yes, the distinction depends on the complexity of the environment and the data being collected and analyzed. The process and tool set used are different.
Unknown/Unsure

Looking Ahead
Organizations will continue to work on staffing and skills for as long as there are
shortages. Much like 2015, training and staffing topped the list of future investments
organizations will make to fill the gaps in their security analytics and intelligence
programs, with 49% selecting this option in our current survey. See Figure 13.
In 2016, we saw organizations choosing to invest in detection and security operations
center upgrades (42%) and incident response integration (29%). In 2015, however, SIEM
tools came in second place, with incident response tools in third. Security intelligence
products and services decreased from 43% in 2015 to 18% overall in 2016, which may
indicate organizations are currently placing more emphasis on internal data collection
than on third-party products and services.
Benefits and Uses (CONTINUED)
SANS ANALYST PROGRAMSANS 2016 Security Analytics Survey18
What are your top three areas for future investment related to security analytics and
security intelligence to enable a stronger security posture for your organization?
Figure 13. Future Investments Related to Security Analytics
0% 20% 40% 50%10% 30%
Integration among disparate sources of security information
Incident response integration
Managed security service providers
Personnel/Training
Security intelligence products, platforms or services
Automated workflow management
Security information and event management (SIEM) tools or systems
Standalone analytics platforms
Detection/Security operations center upgrades
Convergence technologies (middleware/APIs)
Automated mitigation solutions for known bad threats
Big data analytics engines and tools
Other

Despite the varying degrees of maturity represented in this survey, organizations
are feeling more confident than ever in their use of security analytics. In this year’s
survey, 21% indicated that they were highly confident that their security analytics and
intelligence systems were effectively protecting their organizations, and another 52%
were somewhat confident. When asked to compare their confidence levels, 39% were
more confident in their capabilities this year than last year, with another 36% indicating
no change in their confidence.
Security folks are hesitant to be overconfident, so these numbers are encouraging.
Despite the nasty breach landscape we’re facing, security teams feel as if they are
getting better at finding threats with analytics and hope they are preventing attacks and
breaches from occurring as well.
More teams are using analytics tools, and we’re definitely collecting more and better
data. Our biggest issue today, much as it was in 2015, is that we’re not using the data
very well to improve detection and response. Even though we’re finding unknown
threats more readily, we’re still not doing a good job of prioritizing threats, centralizing
remediation and reporting, or baselining normal patterns of behavior versus those that
are anomalous in nature.
Much of this is due to a chronic lack of skills in the security operations center (SOC), as
well as a surprising lack of management support and funding for more advanced tools
and tactics for detection and response. Teams are having a difficult time finding the
right skills today, and as in the 2015 survey, many organizations are planning to invest in
training and hiring in the future.
Utilization of security analytics is slowly improving, and we’ve done a much better job
of collecting data, but more effort is needed to detect, respond and report results using
analytics before we can say we’re really maturing in this space.
SANS ANALYST PROGRAMSANS 2016 Security Analytics Survey19
Conclusion

Dave Shackleford, a SANS analyst, instructor, course author, GIAC technical director and member of
the board of directors for the SANS Technology Institute, is the founder and principal consultant with
Voodoo Security. He has consulted with hundreds of organizations in the areas of security, regulatory
compliance, and network architecture and engineering. A VMware vExpert, Dave has extensive
experience designing and configuring secure virtualized infrastructures. He previously worked as chief
security officer for Configuresoft and CTO for the Center for Internet Security. Dave currently helps lead
the Atlanta chapter of the Cloud Security Alliance.
SANS ANALYST PROGRAMSANS 2016 Security Analytics Survey20
About the Author
Sponsors
SANS would like to thank this survey’s sponsors: