santa clara county i-280 corridor studyvtaorgcontent.s3-us-west-1.amazonaws.com/site_content/i-280...
TRANSCRIPT
1-1
B
SANTA CLARA COUNTY I-280 CORRIDOR STUDY
Appendix 2
Technical Memorandum Existing Transportation Condition Memo
SANTA CLARA VALLEY TRANSPORTATION AUTHORITY (VTA)
1-1
I-280 Corridor Study SANTA CLARA COUNTY
Introduction
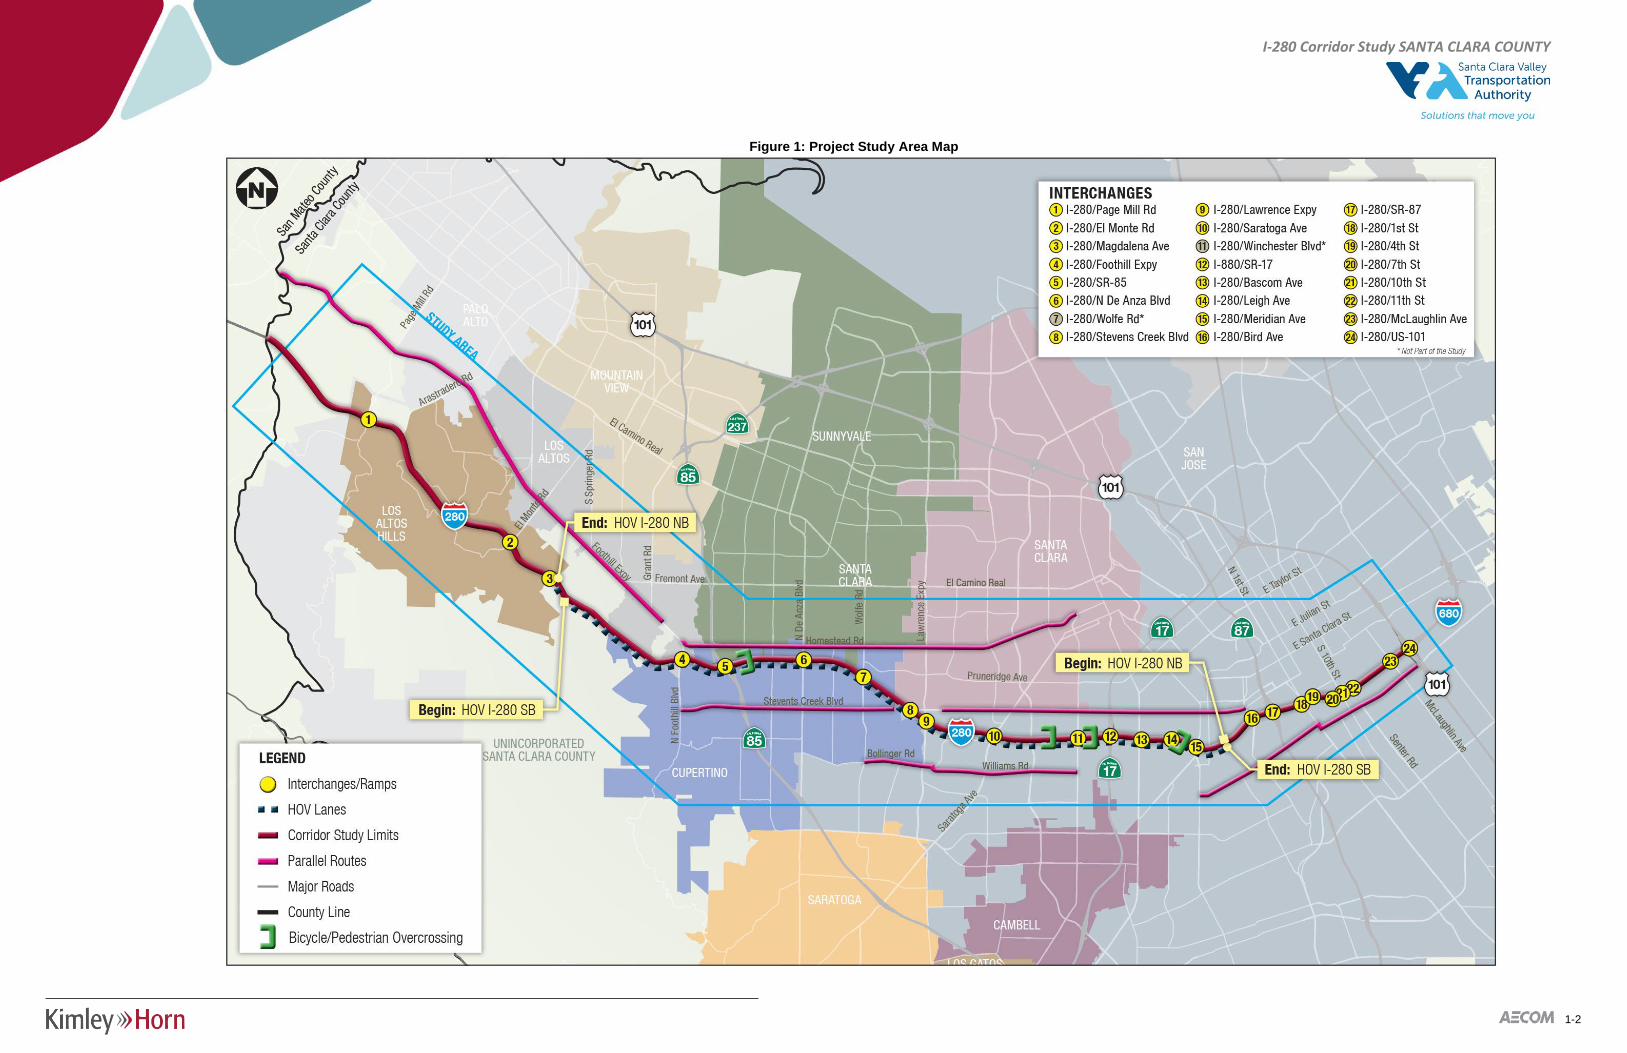
The I-280 Corridor Study within Santa Clara County is a highway planning study led by the Santa Clara Valley Transportation Authority (VTA), in partnership with the City of Cupertino. The purpose of this study is to develop a strategic transportation improvement plan to identify areas of the transportation system that require short term and long range planning for the I-280 Corridor in Santa Clara County. The study extends approximately 22 miles between the San Mateo county line at the west and I-280/I-680/US 101 interchange in the City of San Jose at the east. Figure 1 illustrates the study corridor and the project limits.
This technical memorandum summarizes the existing traffic conditions along the study corridor. The existing traffic conditions are based on a combination of data collected from a variety of sources including Caltrans Census Data, PeMS, ramp metering studies, manual counts and field observations of the freeway operating conditions.
During the a.m. peak period, the peak direction of traffic is northbound on I-280 and during the p.m. peak period, the peak direction of traffic is southbound on I-280.
Existing Vehicular Traffic Data Sources
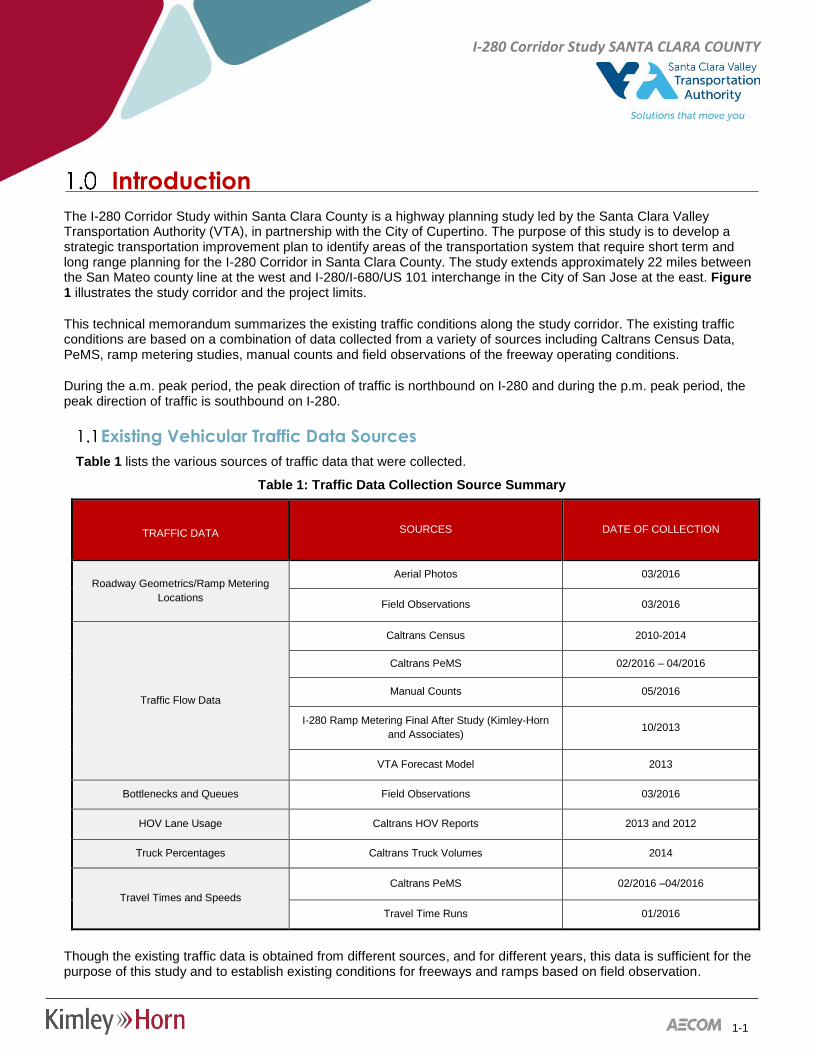
Table 1 lists the various sources of traffic data that were collected.
Table 1: Traffic Data Collection Source Summary
TRAFFIC DATA SOURCES DATE OF COLLECTION
Roadway Geometrics/Ramp Metering Locations
Aerial Photos 03/2016
Field Observations 03/2016
Traffic Flow Data
Caltrans Census 2010-2014
Caltrans PeMS 02/2016 – 04/2016
Manual Counts 05/2016
I-280 Ramp Metering Final After Study (Kimley-Horn and Associates) 10/2013
VTA Forecast Model 2013
Bottlenecks and Queues Field Observations 03/2016
HOV Lane Usage Caltrans HOV Reports 2013 and 2012
Truck Percentages Caltrans Truck Volumes 2014
Travel Times and Speeds Caltrans PeMS 02/2016 –04/2016
Travel Time Runs 01/2016
Though the existing traffic data is obtained from different sources, and for different years, this data is sufficient for the purpose of this study and to establish existing conditions for freeways and ramps based on field observation.
1-2
I-280 Corridor Study SANTA CLARA COUNTY
Figure 1: Project Study Area Map
1-3
I-280 Corridor Study SANTA CLARA COUNTY
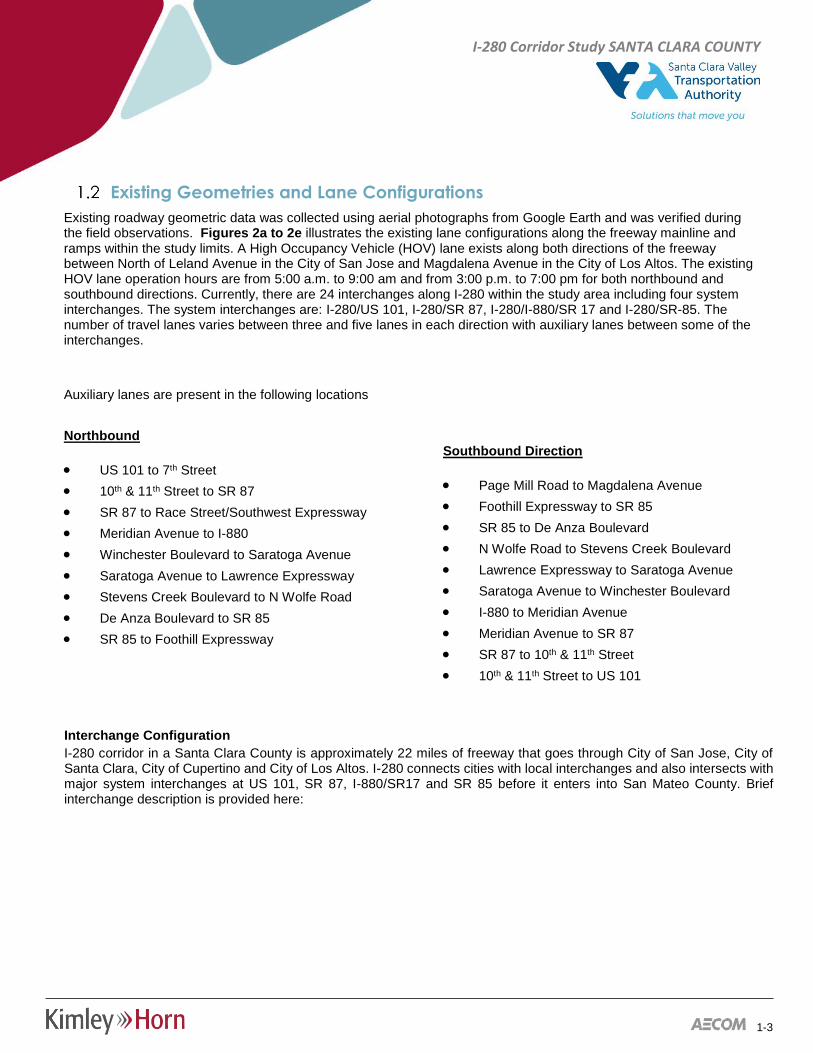
Existing Geometries and Lane Configurations
Existing roadway geometric data was collected using aerial photographs from Google Earth and was verified during the field observations. Figures 2a to 2e illustrates the existing lane configurations along the freeway mainline and ramps within the study limits. A High Occupancy Vehicle (HOV) lane exists along both directions of the freeway between North of Leland Avenue in the City of San Jose and Magdalena Avenue in the City of Los Altos. The existing HOV lane operation hours are from 5:00 a.m. to 9:00 am and from 3:00 p.m. to 7:00 pm for both northbound and southbound directions. Currently, there are 24 interchanges along I-280 within the study area including four system interchanges. The system interchanges are: I-280/US 101, I-280/SR 87, I-280/I-880/SR 17 and I-280/SR-85. The number of travel lanes varies between three and five lanes in each direction with auxiliary lanes between some of the interchanges.
Auxiliary lanes are present in the following locations
Northbound
• US 101 to 7th Street • 10th & 11th Street to SR 87 • SR 87 to Race Street/Southwest Expressway • Meridian Avenue to I-880 • Winchester Boulevard to Saratoga Avenue • Saratoga Avenue to Lawrence Expressway • Stevens Creek Boulevard to N Wolfe Road • De Anza Boulevard to SR 85 • SR 85 to Foothill Expressway
Southbound Direction
• Page Mill Road to Magdalena Avenue • Foothill Expressway to SR 85 • SR 85 to De Anza Boulevard • N Wolfe Road to Stevens Creek Boulevard • Lawrence Expressway to Saratoga Avenue • Saratoga Avenue to Winchester Boulevard • I-880 to Meridian Avenue • Meridian Avenue to SR 87 • SR 87 to 10th & 11th Street • 10th & 11th Street to US 101
Interchange Configuration
I-280 corridor in a Santa Clara County is approximately 22 miles of freeway that goes through City of San Jose, City of Santa Clara, City of Cupertino and City of Los Altos. I-280 connects cities with local interchanges and also intersects with major system interchanges at US 101, SR 87, I-880/SR17 and SR 85 before it enters into San Mateo County. Brief interchange description is provided here:
1-4
I-280 Corridor Study SANTA CLARA COUNTY
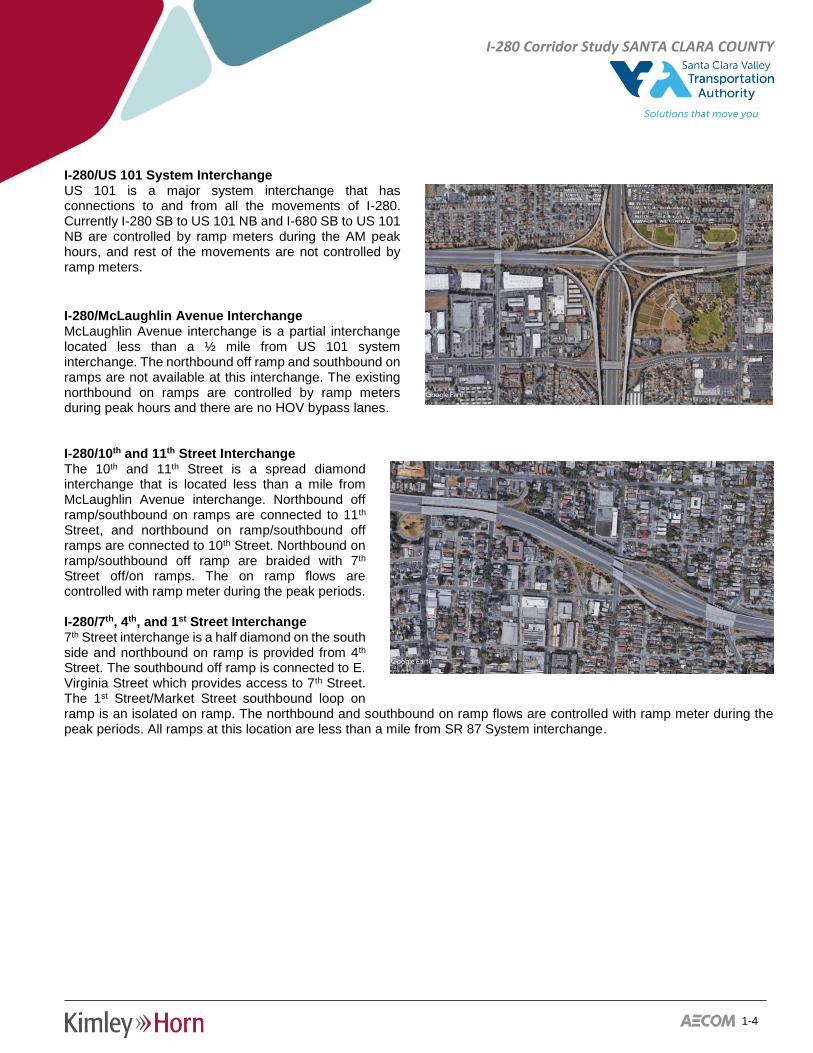
I-280/US 101 System Interchange US 101 is a major system interchange that has connections to and from all the movements of I-280. Currently I-280 SB to US 101 NB and I-680 SB to US 101 NB are controlled by ramp meters during the AM peak hours, and rest of the movements are not controlled by ramp meters.
I-280/McLaughlin Avenue Interchange McLaughlin Avenue interchange is a partial interchange located less than a ½ mile from US 101 system interchange. The northbound off ramp and southbound on ramps are not available at this interchange. The existing northbound on ramps are controlled by ramp meters during peak hours and there are no HOV bypass lanes.
I-280/10th and 11th Street Interchange The 10th and 11th Street is a spread diamond interchange that is located less than a mile from McLaughlin Avenue interchange. Northbound off ramp/southbound on ramps are connected to 11th Street, and northbound on ramp/southbound off ramps are connected to 10th Street. Northbound on ramp/southbound off ramp are braided with 7th Street off/on ramps. The on ramp flows are controlled with ramp meter during the peak periods. I-280/7th, 4th, and 1st Street Interchange 7th Street interchange is a half diamond on the south side and northbound on ramp is provided from 4th Street. The southbound off ramp is connected to E. Virginia Street which provides access to 7th Street. The 1st Street/Market Street southbound loop on ramp is an isolated on ramp. The northbound and southbound on ramp flows are controlled with ramp meter during the peak periods. All ramps at this location are less than a mile from SR 87 System interchange.
1-5
I-280 Corridor Study SANTA CLARA COUNTY
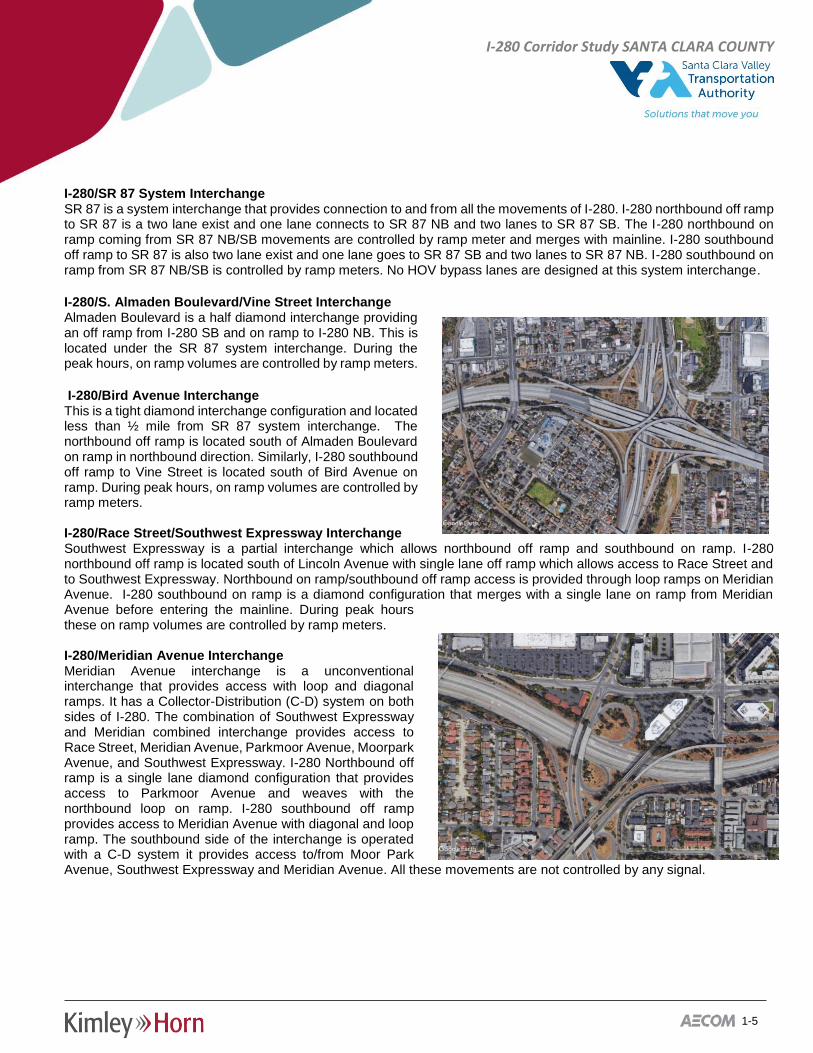
I-280/SR 87 System Interchange SR 87 is a system interchange that provides connection to and from all the movements of I-280. I-280 northbound off ramp to SR 87 is a two lane exist and one lane connects to SR 87 NB and two lanes to SR 87 SB. The I-280 northbound on ramp coming from SR 87 NB/SB movements are controlled by ramp meter and merges with mainline. I-280 southbound off ramp to SR 87 is also two lane exist and one lane goes to SR 87 SB and two lanes to SR 87 NB. I-280 southbound on ramp from SR 87 NB/SB is controlled by ramp meters. No HOV bypass lanes are designed at this system interchange. I-280/S. Almaden Boulevard/Vine Street Interchange Almaden Boulevard is a half diamond interchange providing an off ramp from I-280 SB and on ramp to I-280 NB. This is located under the SR 87 system interchange. During the peak hours, on ramp volumes are controlled by ramp meters. I-280/Bird Avenue Interchange This is a tight diamond interchange configuration and located less than ½ mile from SR 87 system interchange. The northbound off ramp is located south of Almaden Boulevard on ramp in northbound direction. Similarly, I-280 southbound off ramp to Vine Street is located south of Bird Avenue on ramp. During peak hours, on ramp volumes are controlled by ramp meters.
I-280/Race Street/Southwest Expressway Interchange Southwest Expressway is a partial interchange which allows northbound off ramp and southbound on ramp. I-280 northbound off ramp is located south of Lincoln Avenue with single lane off ramp which allows access to Race Street and to Southwest Expressway. Northbound on ramp/southbound off ramp access is provided through loop ramps on Meridian Avenue. I-280 southbound on ramp is a diamond configuration that merges with a single lane on ramp from Meridian Avenue before entering the mainline. During peak hours these on ramp volumes are controlled by ramp meters. I-280/Meridian Avenue Interchange Meridian Avenue interchange is a unconventional interchange that provides access with loop and diagonal ramps. It has a Collector-Distribution (C-D) system on both sides of I-280. The combination of Southwest Expressway and Meridian combined interchange provides access to Race Street, Meridian Avenue, Parkmoor Avenue, Moorpark Avenue, and Southwest Expressway. I-280 Northbound off ramp is a single lane diamond configuration that provides access to Parkmoor Avenue and weaves with the northbound loop on ramp. I-280 southbound off ramp provides access to Meridian Avenue with diagonal and loop ramp. The southbound side of the interchange is operated with a C-D system it provides access to/from Moor Park Avenue, Southwest Expressway and Meridian Avenue. All these movements are not controlled by any signal.
1-6
I-280 Corridor Study SANTA CLARA COUNTY
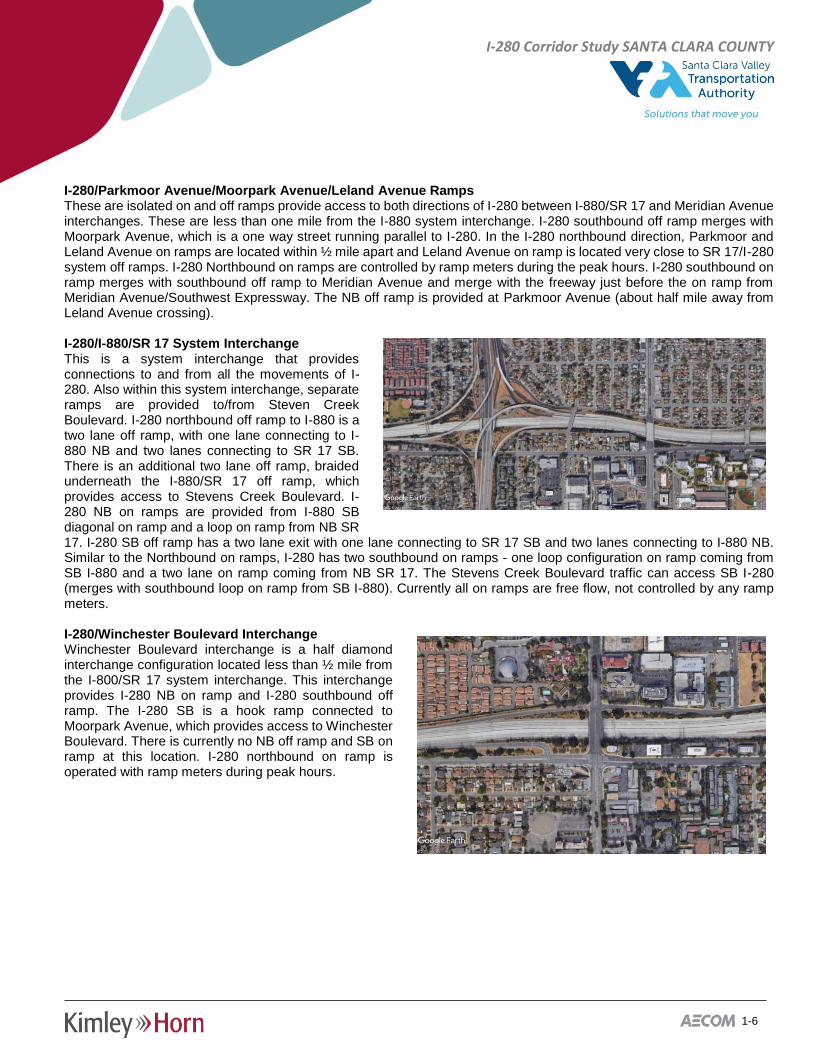
I-280/Parkmoor Avenue/Moorpark Avenue/Leland Avenue Ramps These are isolated on and off ramps provide access to both directions of I-280 between I-880/SR 17 and Meridian Avenue interchanges. These are less than one mile from the I-880 system interchange. I-280 southbound off ramp merges with Moorpark Avenue, which is a one way street running parallel to I-280. In the I-280 northbound direction, Parkmoor and Leland Avenue on ramps are located within ½ mile apart and Leland Avenue on ramp is located very close to SR 17/I-280 system off ramps. I-280 Northbound on ramps are controlled by ramp meters during the peak hours. I-280 southbound on ramp merges with southbound off ramp to Meridian Avenue and merge with the freeway just before the on ramp from Meridian Avenue/Southwest Expressway. The NB off ramp is provided at Parkmoor Avenue (about half mile away from Leland Avenue crossing). I-280/I-880/SR 17 System Interchange This is a system interchange that provides connections to and from all the movements of I-280. Also within this system interchange, separate ramps are provided to/from Steven Creek Boulevard. I-280 northbound off ramp to I-880 is a two lane off ramp, with one lane connecting to I-880 NB and two lanes connecting to SR 17 SB. There is an additional two lane off ramp, braided underneath the I-880/SR 17 off ramp, which provides access to Stevens Creek Boulevard. I-280 NB on ramps are provided from I-880 SB diagonal on ramp and a loop on ramp from NB SR 17. I-280 SB off ramp has a two lane exit with one lane connecting to SR 17 SB and two lanes connecting to I-880 NB. Similar to the Northbound on ramps, I-280 has two southbound on ramps - one loop configuration on ramp coming from SB I-880 and a two lane on ramp coming from NB SR 17. The Stevens Creek Boulevard traffic can access SB I-280 (merges with southbound loop on ramp from SB I-880). Currently all on ramps are free flow, not controlled by any ramp meters. I-280/Winchester Boulevard Interchange Winchester Boulevard interchange is a half diamond interchange configuration located less than ½ mile from the I-800/SR 17 system interchange. This interchange provides I-280 NB on ramp and I-280 southbound off ramp. The I-280 SB is a hook ramp connected to Moorpark Avenue, which provides access to Winchester Boulevard. There is currently no NB off ramp and SB on ramp at this location. I-280 northbound on ramp is operated with ramp meters during peak hours.
1-7
I-280 Corridor Study SANTA CLARA COUNTY
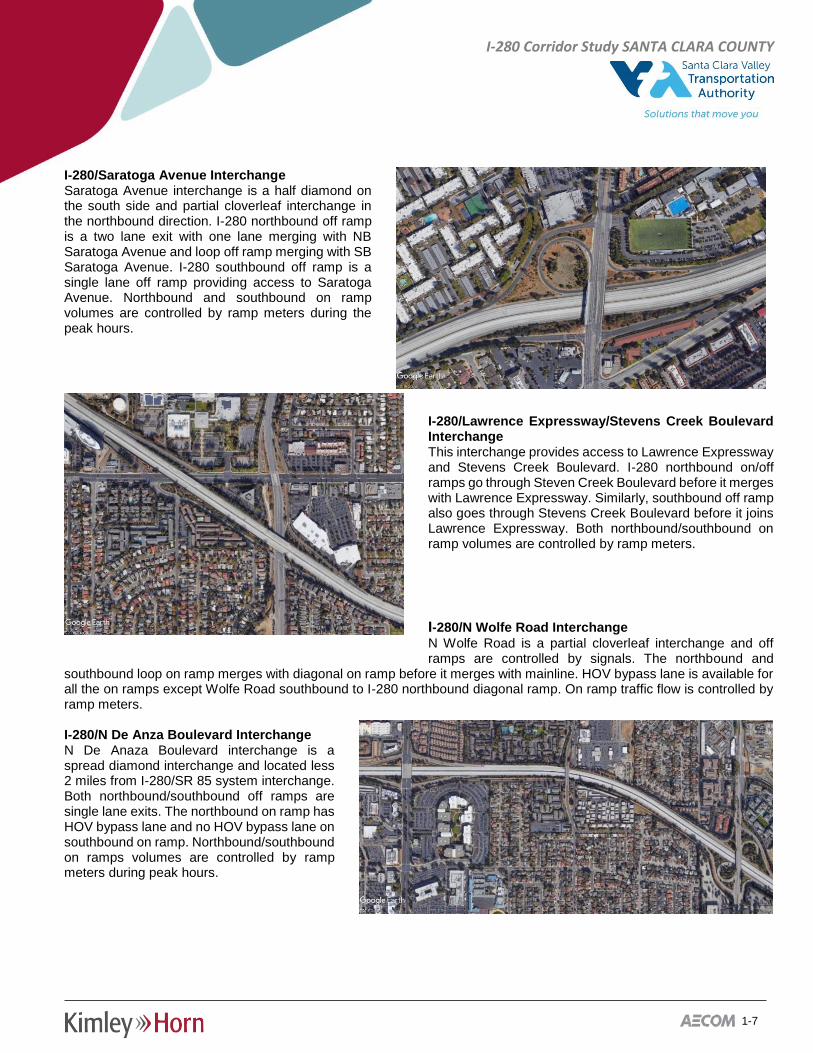
I-280/Saratoga Avenue Interchange Saratoga Avenue interchange is a half diamond on the south side and partial cloverleaf interchange in the northbound direction. I-280 northbound off ramp is a two lane exit with one lane merging with NB Saratoga Avenue and loop off ramp merging with SB Saratoga Avenue. I-280 southbound off ramp is a single lane off ramp providing access to Saratoga Avenue. Northbound and southbound on ramp volumes are controlled by ramp meters during the peak hours.
I-280/Lawrence Expressway/Stevens Creek Boulevard Interchange This interchange provides access to Lawrence Expressway and Stevens Creek Boulevard. I-280 northbound on/off ramps go through Steven Creek Boulevard before it merges with Lawrence Expressway. Similarly, southbound off ramp also goes through Stevens Creek Boulevard before it joins Lawrence Expressway. Both northbound/southbound on ramp volumes are controlled by ramp meters.
I-280/N Wolfe Road Interchange
N Wolfe Road is a partial cloverleaf interchange and off ramps are controlled by signals. The northbound and
southbound loop on ramp merges with diagonal on ramp before it merges with mainline. HOV bypass lane is available for all the on ramps except Wolfe Road southbound to I-280 northbound diagonal ramp. On ramp traffic flow is controlled by ramp meters. I-280/N De Anza Boulevard Interchange N De Anaza Boulevard interchange is a spread diamond interchange and located less 2 miles from I-280/SR 85 system interchange. Both northbound/southbound off ramps are single lane exits. The northbound on ramp has HOV bypass lane and no HOV bypass lane on southbound on ramp. Northbound/southbound on ramps volumes are controlled by ramp meters during peak hours.
1-8
I-280 Corridor Study SANTA CLARA COUNTY
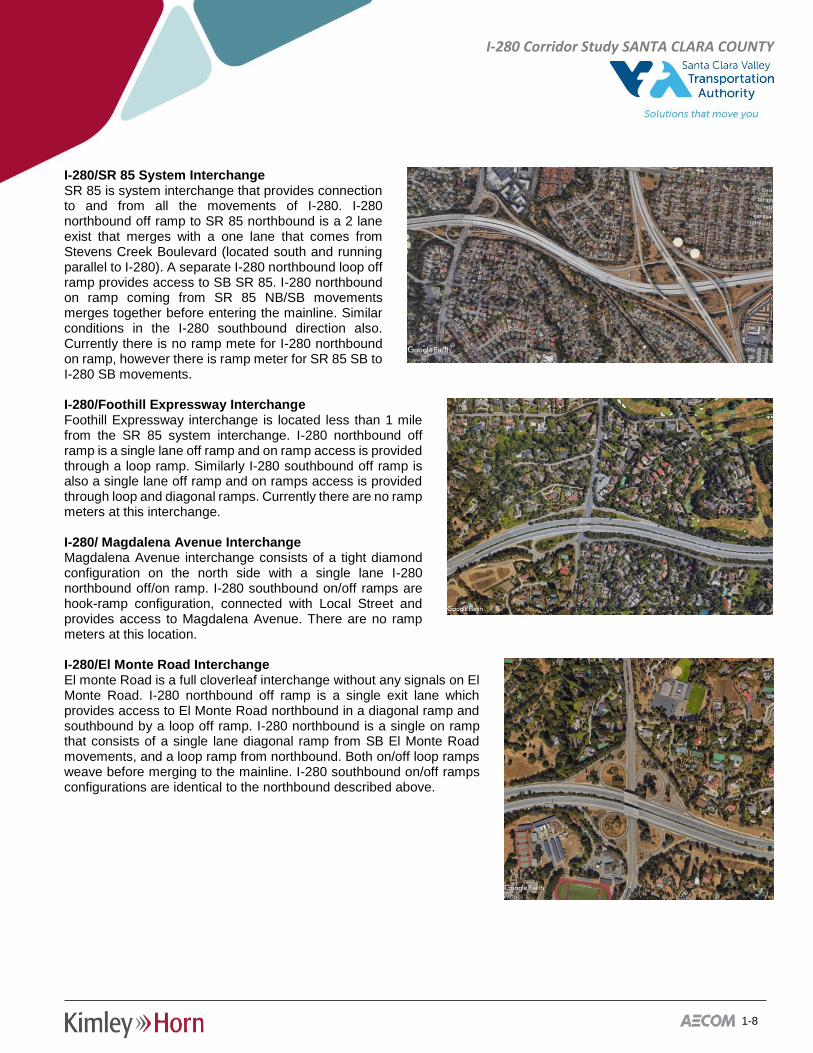
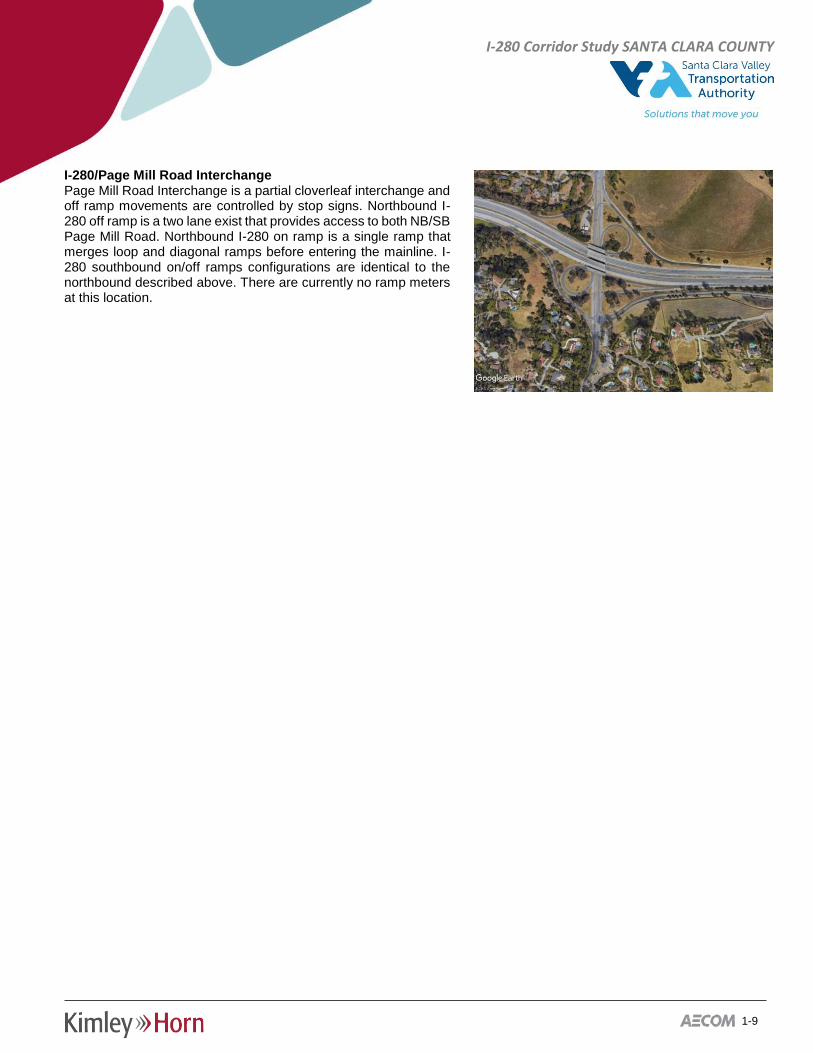
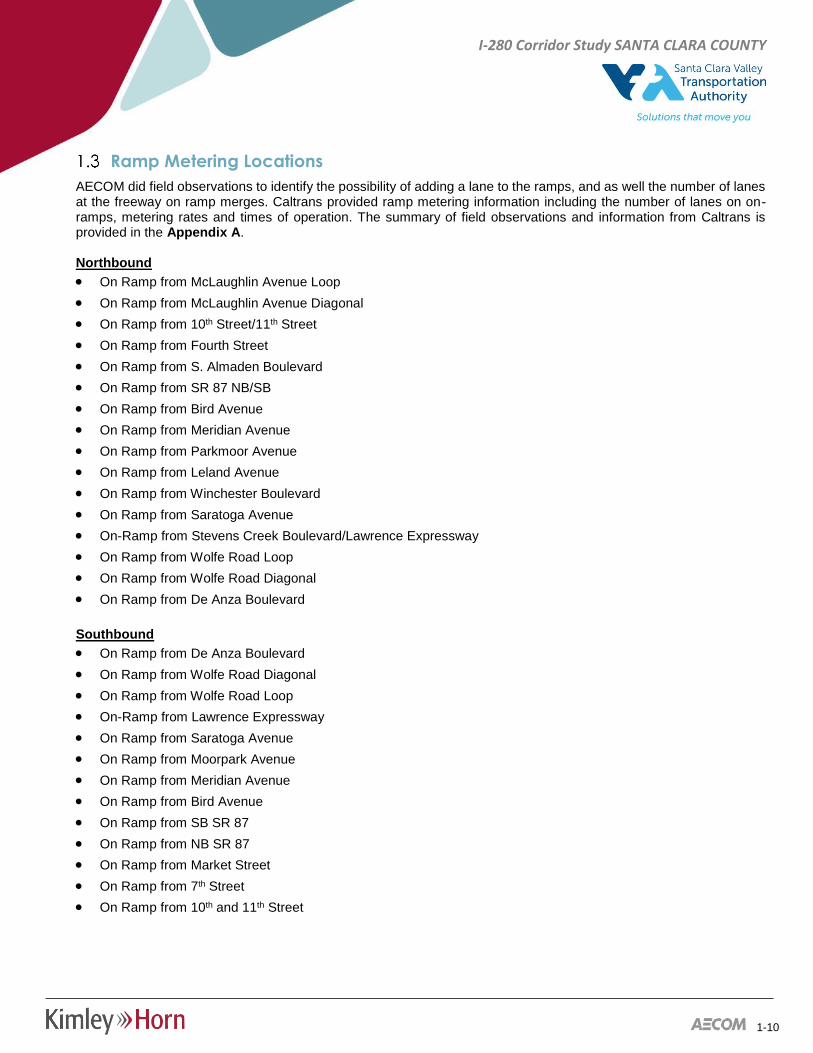
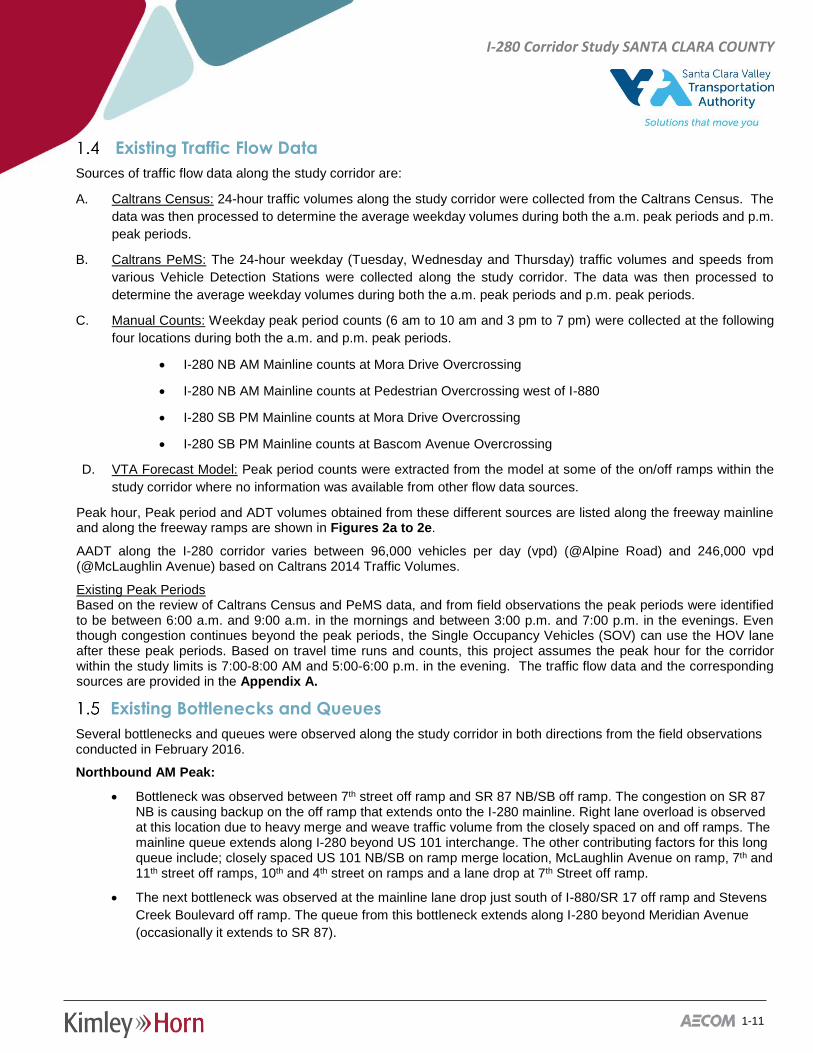
I-280/SR 85 System Interchange SR 85 is system interchange that provides connection to and from all the movements of I-280. I-280 northbound off ramp to SR 85 northbound is a 2 lane exist that merges with a one lane that comes from Stevens Creek Boulevard (located south and running parallel to I-280). A separate I-280 northbound loop off ramp provides access to SB SR 85. I-280 northbound on ramp coming from SR 85 NB/SB movements merges together before entering the mainline. Similar conditions in the I-280 southbound direction also. Currently there is no ramp mete for I-280 northbound on ramp, however there is ramp meter for SR 85 SB to I-280 SB movements. I-280/Foothill Expressway Interchange Foothill Expressway interchange is located less than 1 mile from the SR 85 system interchange. I-280 northbound off ramp is a single lane off ramp and on ramp access is provided through a loop ramp. Similarly I-280 southbound off ramp is also a single lane off ramp and on ramps access is provided through loop and diagonal ramps. Currently there are no ramp meters at this interchange. I-280/ Magdalena Avenue Interchange Magdalena Avenue interchange consists of a tight diamond configuration on the north side with a single lane I-280 northbound off/on ramp. I-280 southbound on/off ramps are hook-ramp configuration, connected with Local Street and provides access to Magdalena Avenue. There are no ramp meters at this location. I-280/El Monte Road Interchange El monte Road is a full cloverleaf interchange without any signals on El Monte Road. I-280 northbound off ramp is a single exit lane which provides access to El Monte Road northbound in a diagonal ramp and southbound by a loop off ramp. I-280 northbound is a single on ramp that consists of a single lane diagonal ramp from SB El Monte Road movements, and a loop ramp from northbound. Both on/off loop ramps weave before merging to the mainline. I-280 southbound on/off ramps configurations are identical to the northbound described above.
1-9
I-280 Corridor Study SANTA CLARA COUNTY
I-280/Page Mill Road Interchange Page Mill Road Interchange is a partial cloverleaf interchange and off ramp movements are controlled by stop signs. Northbound I-280 off ramp is a two lane exist that provides access to both NB/SB Page Mill Road. Northbound I-280 on ramp is a single ramp that merges loop and diagonal ramps before entering the mainline. I-280 southbound on/off ramps configurations are identical to the northbound described above. There are currently no ramp meters at this location.
1-10
I-280 Corridor Study SANTA CLARA COUNTY
Ramp Metering Locations
AECOM did field observations to identify the possibility of adding a lane to the ramps, and as well the number of lanes at the freeway on ramp merges. Caltrans provided ramp metering information including the number of lanes on on-ramps, metering rates and times of operation. The summary of field observations and information from Caltrans is provided in the Appendix A.
Northbound
• On Ramp from McLaughlin Avenue Loop • On Ramp from McLaughlin Avenue Diagonal • On Ramp from 10th Street/11th Street • On Ramp from Fourth Street • On Ramp from S. Almaden Boulevard • On Ramp from SR 87 NB/SB • On Ramp from Bird Avenue • On Ramp from Meridian Avenue • On Ramp from Parkmoor Avenue • On Ramp from Leland Avenue • On Ramp from Winchester Boulevard • On Ramp from Saratoga Avenue • On-Ramp from Stevens Creek Boulevard/Lawrence Expressway • On Ramp from Wolfe Road Loop • On Ramp from Wolfe Road Diagonal • On Ramp from De Anza Boulevard
Southbound • On Ramp from De Anza Boulevard • On Ramp from Wolfe Road Diagonal • On Ramp from Wolfe Road Loop • On-Ramp from Lawrence Expressway • On Ramp from Saratoga Avenue • On Ramp from Moorpark Avenue • On Ramp from Meridian Avenue • On Ramp from Bird Avenue • On Ramp from SB SR 87 • On Ramp from NB SR 87 • On Ramp from Market Street • On Ramp from 7th Street • On Ramp from 10th and 11th Street
1-11
I-280 Corridor Study SANTA CLARA COUNTY
Existing Traffic Flow Data
Sources of traffic flow data along the study corridor are:
A. Caltrans Census: 24-hour traffic volumes along the study corridor were collected from the Caltrans Census. The data was then processed to determine the average weekday volumes during both the a.m. peak periods and p.m. peak periods.
B. Caltrans PeMS: The 24-hour weekday (Tuesday, Wednesday and Thursday) traffic volumes and speeds from various Vehicle Detection Stations were collected along the study corridor. The data was then processed to determine the average weekday volumes during both the a.m. peak periods and p.m. peak periods.
C. Manual Counts: Weekday peak period counts (6 am to 10 am and 3 pm to 7 pm) were collected at the following four locations during both the a.m. and p.m. peak periods.
• I-280 NB AM Mainline counts at Mora Drive Overcrossing
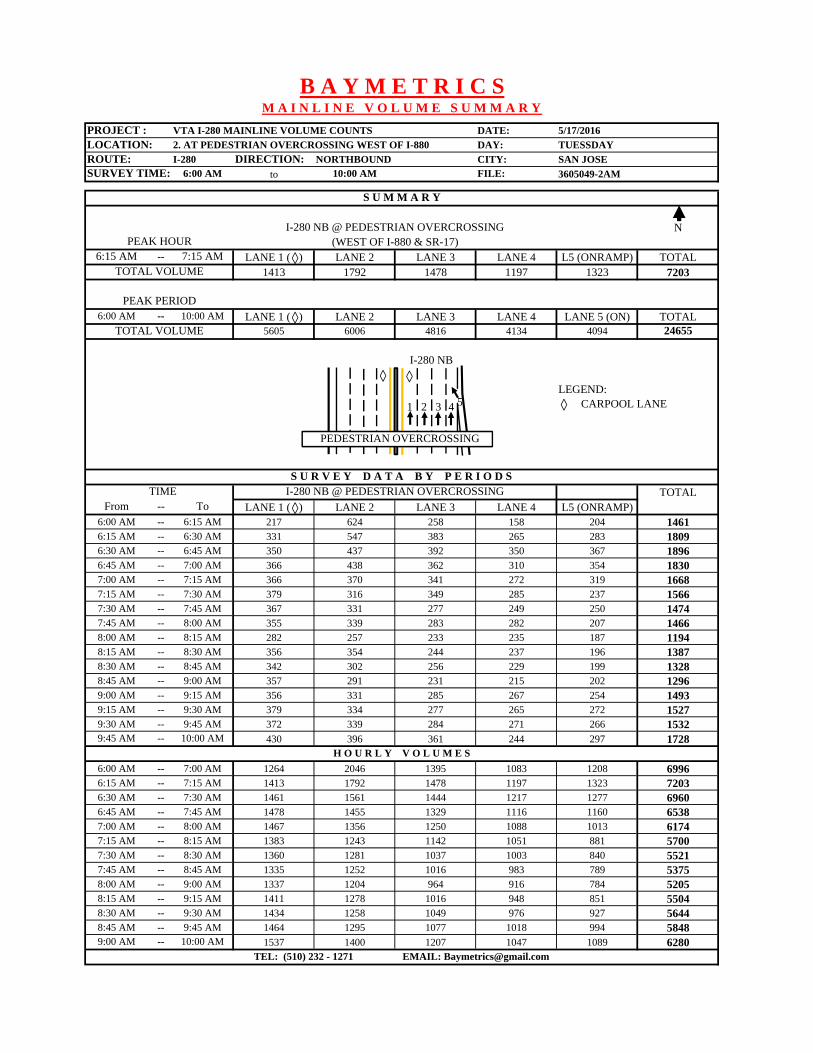
• I-280 NB AM Mainline counts at Pedestrian Overcrossing west of I-880
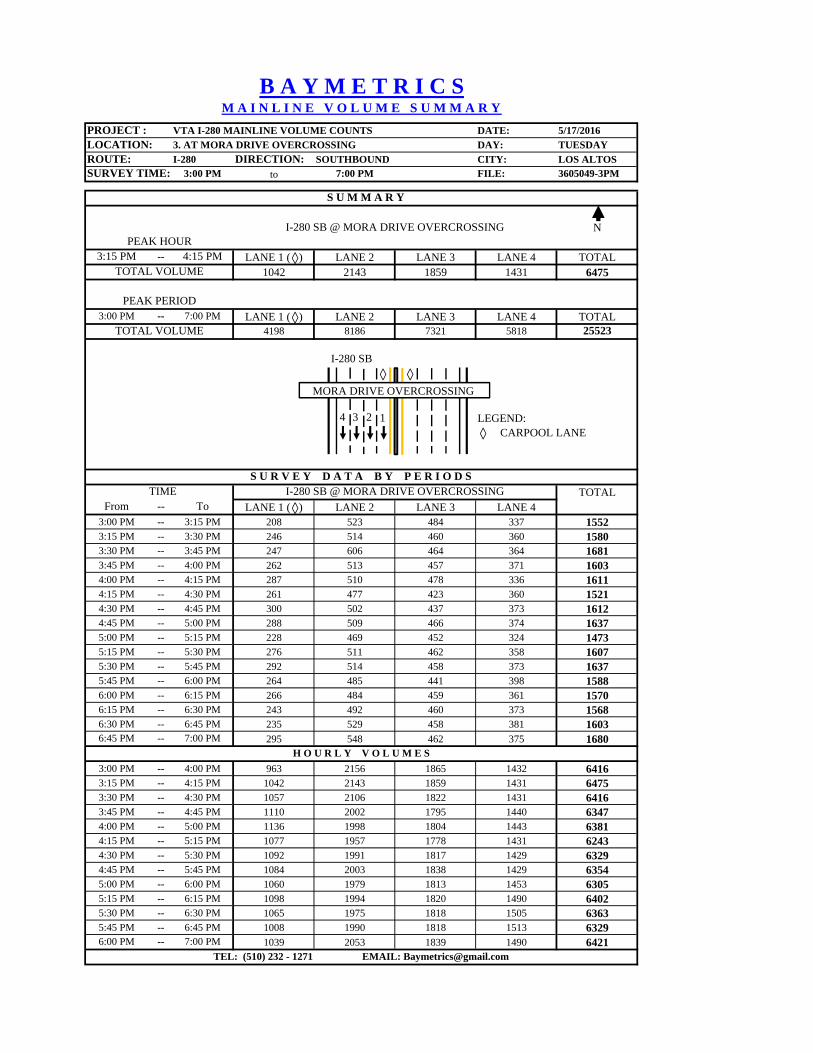
• I-280 SB PM Mainline counts at Mora Drive Overcrossing
• I-280 SB PM Mainline counts at Bascom Avenue Overcrossing
D. VTA Forecast Model: Peak period counts were extracted from the model at some of the on/off ramps within the study corridor where no information was available from other flow data sources.
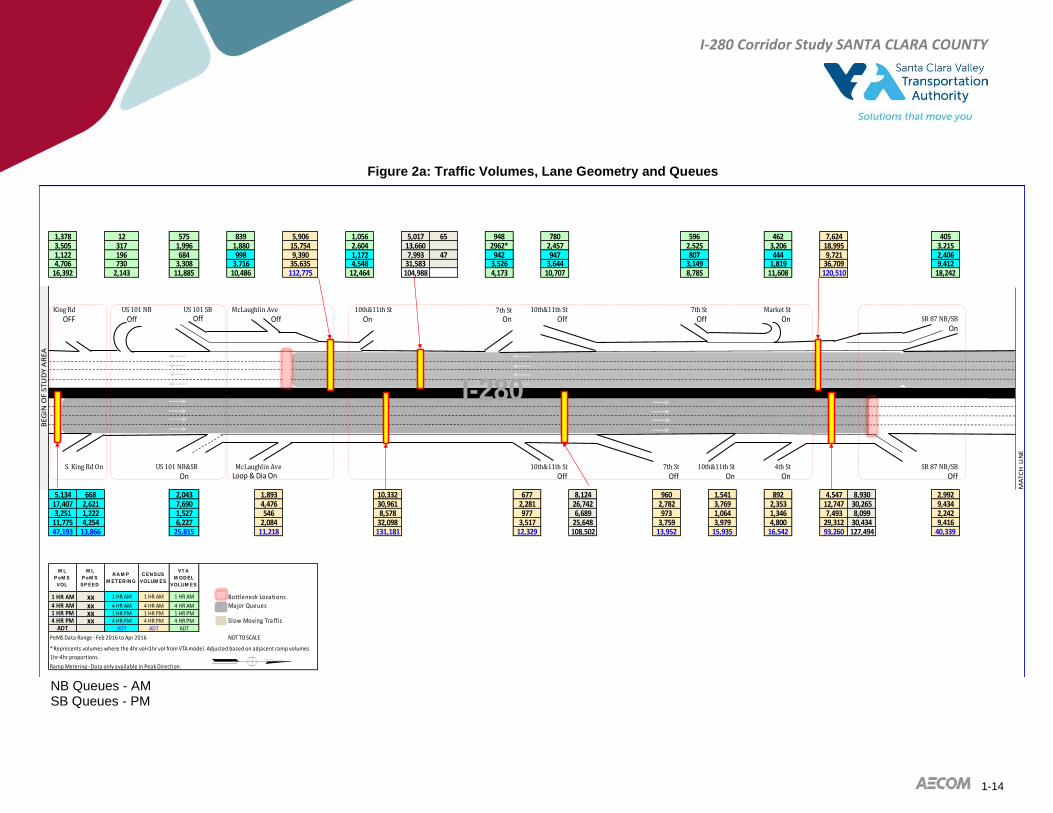
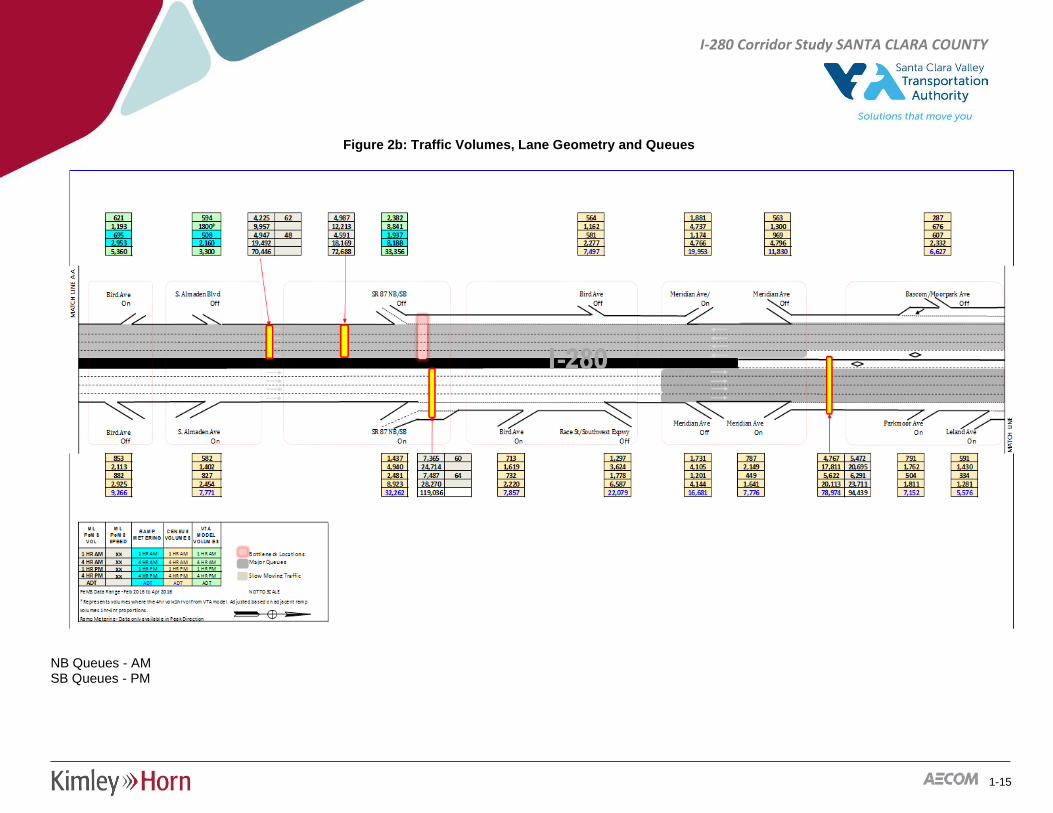
Peak hour, Peak period and ADT volumes obtained from these different sources are listed along the freeway mainline and along the freeway ramps are shown in Figures 2a to 2e.
AADT along the I-280 corridor varies between 96,000 vehicles per day (vpd) (@Alpine Road) and 246,000 vpd (@McLaughlin Avenue) based on Caltrans 2014 Traffic Volumes.
Existing Peak Periods Based on the review of Caltrans Census and PeMS data, and from field observations the peak periods were identified to be between 6:00 a.m. and 9:00 a.m. in the mornings and between 3:00 p.m. and 7:00 p.m. in the evenings. Even though congestion continues beyond the peak periods, the Single Occupancy Vehicles (SOV) can use the HOV lane after these peak periods. Based on travel time runs and counts, this project assumes the peak hour for the corridor within the study limits is 7:00-8:00 AM and 5:00-6:00 p.m. in the evening. The traffic flow data and the corresponding sources are provided in the Appendix A.
Existing Bottlenecks and Queues
Several bottlenecks and queues were observed along the study corridor in both directions from the field observations conducted in February 2016.
Northbound AM Peak:
• Bottleneck was observed between 7th street off ramp and SR 87 NB/SB off ramp. The congestion on SR 87 NB is causing backup on the off ramp that extends onto the I-280 mainline. Right lane overload is observed at this location due to heavy merge and weave traffic volume from the closely spaced on and off ramps. The mainline queue extends along I-280 beyond US 101 interchange. The other contributing factors for this long queue include; closely spaced US 101 NB/SB on ramp merge location, McLaughlin Avenue on ramp, 7th and 11th street off ramps, 10th and 4th street on ramps and a lane drop at 7th Street off ramp.
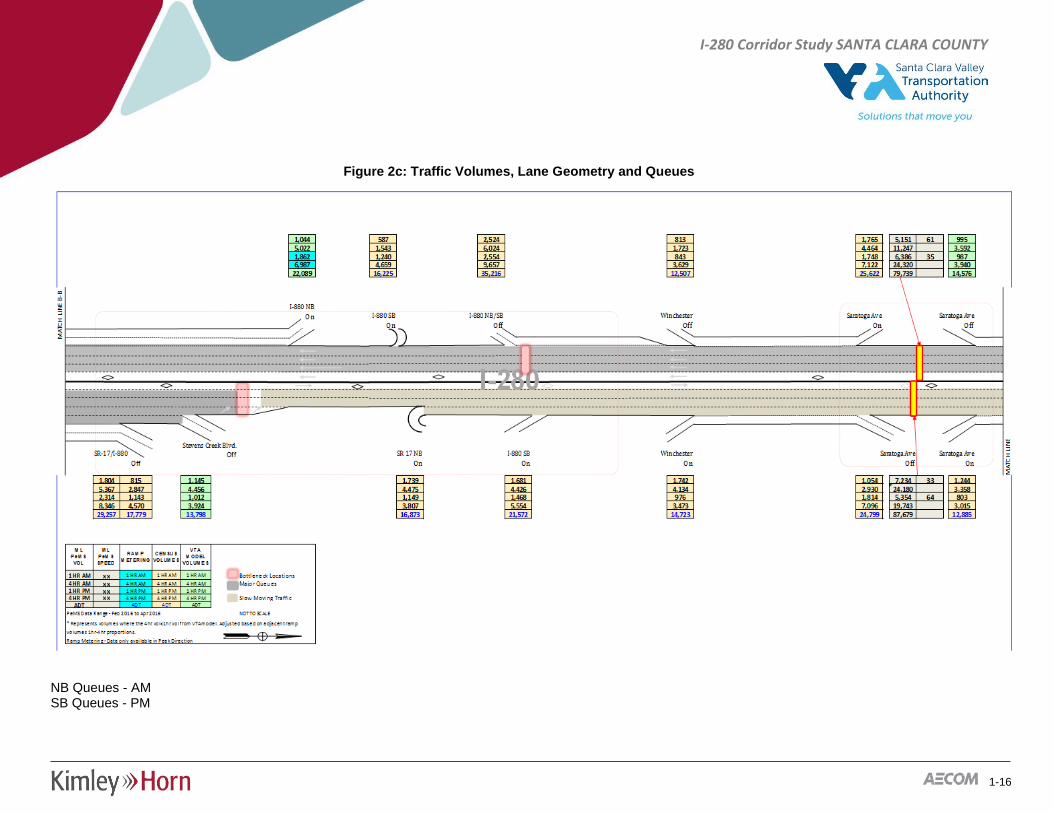
• The next bottleneck was observed at the mainline lane drop just south of I-880/SR 17 off ramp and Stevens Creek Boulevard off ramp. The queue from this bottleneck extends along I-280 beyond Meridian Avenue (occasionally it extends to SR 87).
1-12
I-280 Corridor Study SANTA CLARA COUNTY
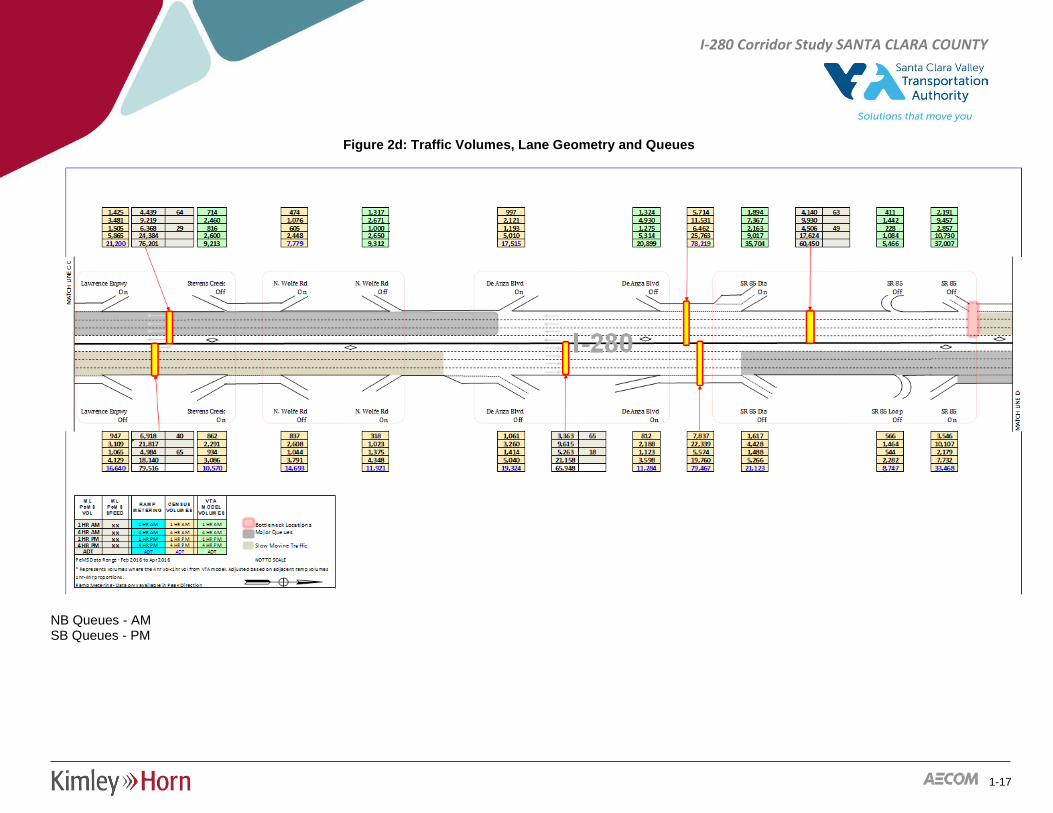
• Slow moving traffic was observed in all lanes from SR17/I-880 to De Anza Boulevard because of heavy on ramp traffic from SR 17/I-880 and off ramp traffic at Lawrence Expressway, Wolfe Road, and De Anza Boulevard interchanges.
• Another bottleneck was observed between SR 85 on ramp and Foothill Expressway off ramp due to heavy weaving and less interchange spacing. The queue from this bottleneck extends beyond the SR 85 interchange (occasionally it extends to De Anza Boulevard).
• HOV Lane was observed to be congested from Meridian Avenue to Saratoga Avenue due to heavy traffic merge and weave between HOV lane and SOV lane at SR17/I-880 interchange.
Northbound PM Peak:
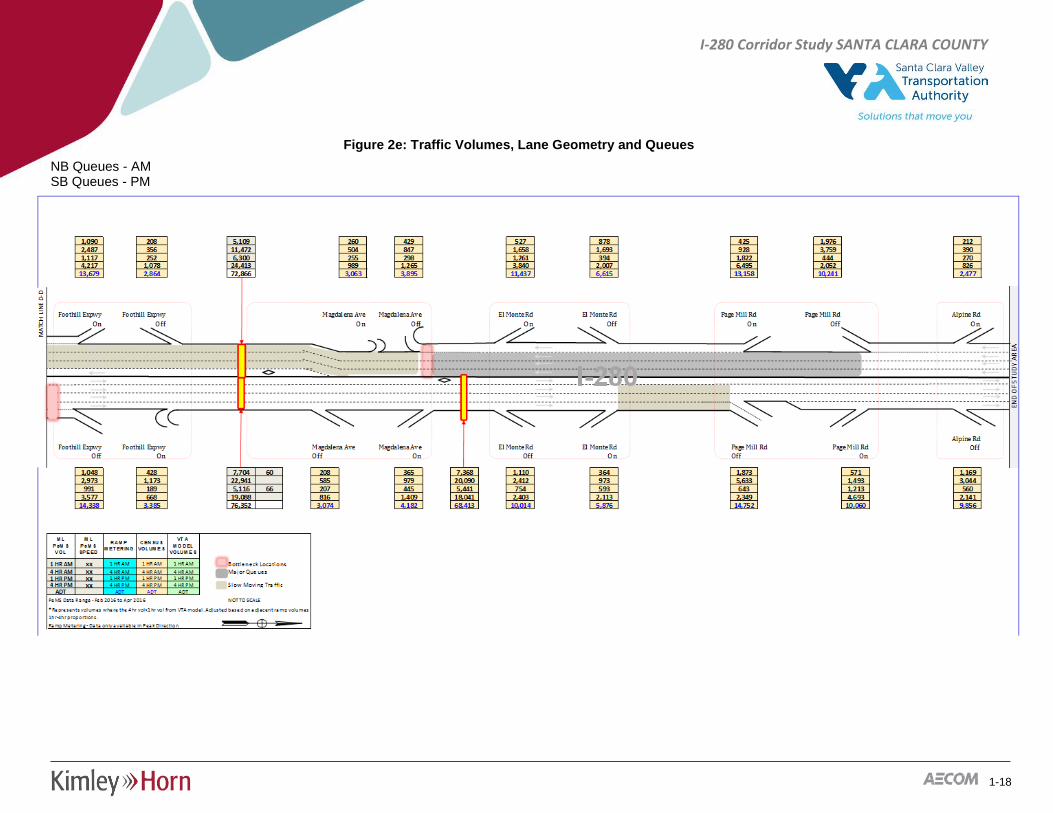
• Slow moving traffic observed at the Page Mill Road due to a lane drop before the Page Mill Road interchange.
Southbound AM Peak:
• There is no congestion observed in southbound direction during AM peak, except for a very short segment from 11th Street to 7th Street. This segment is observed to have slow moving traffic.
Southbound PM Peak:
• A bottleneck was observed at Magdalena Avenue off ramp due to inadequate mainline capacity and one of the mainline lane becomes exit lane for the off ramp. The queue from this bottleneck extends beyond the Page Mill Road interchange.
• Another bottleneck was observed at the SR 85 off ramp due to heavy off ramp volume to SR 85 southbound and the mainline capacity constraint of SR 85. The queue from this bottleneck extend up to Magdalena Avenue and join the upstream bottleneck at Magdalena Avenue.
• Several major bottlenecks were observed at SR 17/I-280, SR 87/I-280 and US 101/I-280 interchange due to inadequate capacity of the intersecting freeways such as SR 17 southbound, SR 87 southbound and US 101 southbound. The queues from these bottlenecks connect each other and extend to De Anza Boulevard.
Figures 2a-2e summarize the bottleneck and queues observed for northbound am and southbound pm peak periods.
1-13
I-280 Corridor Study SANTA CLARA COUNTY
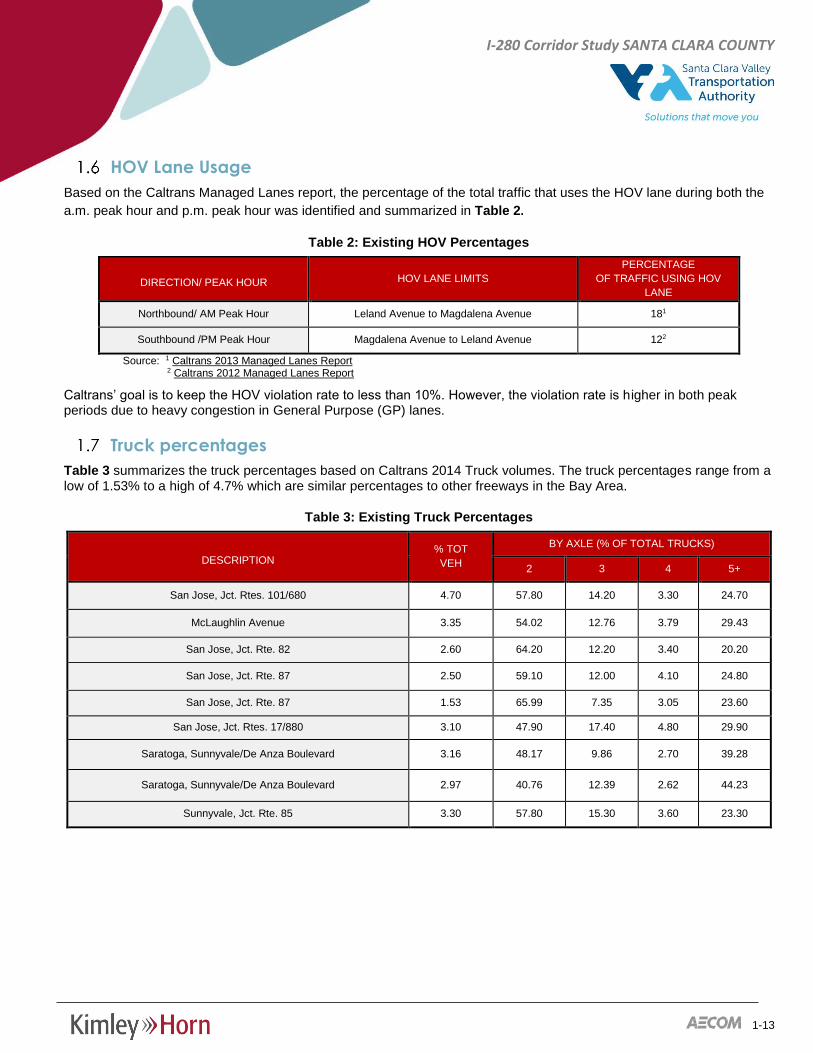
HOV Lane Usage
Based on the Caltrans Managed Lanes report, the percentage of the total traffic that uses the HOV lane during both the a.m. peak hour and p.m. peak hour was identified and summarized in Table 2.
Table 2: Existing HOV Percentages
DIRECTION/ PEAK HOUR HOV LANE LIMITS PERCENTAGE
OF TRAFFIC USING HOV LANE
Northbound/ AM Peak Hour Leland Avenue to Magdalena Avenue 181
Southbound /PM Peak Hour Magdalena Avenue to Leland Avenue 122
Source: 1 Caltrans 2013 Managed Lanes Report 2 Caltrans 2012 Managed Lanes Report
Caltrans’ goal is to keep the HOV violation rate to less than 10%. However, the violation rate is higher in both peak periods due to heavy congestion in General Purpose (GP) lanes.
Truck percentages
Table 3 summarizes the truck percentages based on Caltrans 2014 Truck volumes. The truck percentages range from a low of 1.53% to a high of 4.7% which are similar percentages to other freeways in the Bay Area.
Table 3: Existing Truck Percentages
DESCRIPTION % TOT VEH
BY AXLE (% OF TOTAL TRUCKS)
2 3 4 5+
San Jose, Jct. Rtes. 101/680 4.70 57.80 14.20 3.30 24.70
McLaughlin Avenue 3.35 54.02 12.76 3.79 29.43
San Jose, Jct. Rte. 82 2.60 64.20 12.20 3.40 20.20
San Jose, Jct. Rte. 87 2.50 59.10 12.00 4.10 24.80
San Jose, Jct. Rte. 87 1.53 65.99 7.35 3.05 23.60
San Jose, Jct. Rtes. 17/880 3.10 47.90 17.40 4.80 29.90
Saratoga, Sunnyvale/De Anza Boulevard 3.16 48.17 9.86 2.70 39.28
Saratoga, Sunnyvale/De Anza Boulevard 2.97 40.76 12.39 2.62 44.23
Sunnyvale, Jct. Rte. 85 3.30 57.80 15.30 3.60 23.30
1-14
I-280 Corridor Study SANTA CLARA COUNTY
Figure 2a: Traffic Volumes, Lane Geometry and Queues
NB Queues - AM SB Queues - PM
1,378 12 575 839 5,906 1,056 5,017 65 948 780 596 462 7,624 4053,505 317 1,996 1,880 15,754 2,604 13,660 2962* 2,457 2,525 3,206 18,995 3,2151,122 196 684 998 9,390 1,172 7,993 47 942 947 807 444 9,721 2,4064,706 730 3,308 3,716 35,635 4,548 31,583 3,526 3,644 3,149 1,819 36,709 9,412
16,392 2,143 11,885 10,486 112,775 12,464 104,988 4,173 10,707 8,785 11,608 120,510 18,242
King Rd 7th StOFF Off Off On On Off Off On
On
S. King Rd On US 101 NB&SB
On Off Off On On Off
5,134 668 2,043 1,893 10,332 677 8,124 960 1,541 892 4,547 8,930 2,99217,407 2,621 7,690 4,476 30,961 2,281 26,742 2,782 3,769 2,353 12,747 30,265 9,4343,251 1,222 1,527 546 8,578 977 6,689 973 1,064 1,346 7,493 8,099 2,242
11,775 4,254 6,227 2,084 32,098 3,517 25,648 3,759 3,979 4,800 29,312 30,434 9,41647,193 13,866 25,815 11,218 131,181 12,329 108,502 13,952 15,935 16,542 93,260 127,494 40,339
M L
P eM S
VOL
M L
P eM S
SP EED
R A M P
M ET ER IN G
C EN SUS
VOLUM ES
VT A
M OD EL
VOLUM ES
1 HR AM xx 1 HR AM 1 HR AM 1 HR AM Bottleneck Locations4 HR AM xx 4 HR AM 4 HR AM 4 HR AM Major Queues1 HR PM xx 1 HR PM 1 HR PM 1 HR PM4 HR PM xx 4 HR PM 4 HR PM 4 HR PM Slow Moving Traffic
ADT ADT ADT ADT
PeMS Data Range - Feb 2016 to Apr 2016 NOT TO SCALE
Ramp Metering - Data only available in Peak Direction
* Represents volumes where the 4hr vol<1hr vol from VTA model. Adjusted based on adjacent ramp volumes
1hr-4hr proportions.
BE
GIN
OF
ST
UD
Y A
RE
A
McLaughlin AveUS 101 SBUS 101 NBOff
Loop & Dia On
10th&11th St 10th&11th St 7th St Market St
McLaughlin Ave 10th&11th St 7th St 10th&11th St 4th St SR 87 NB/SB
SR 87 NB/SB
MA
TC
H L
INE
MA
TC
H L
INE
A-A
I-280
1-15
I-280 Corridor Study SANTA CLARA COUNTY
Figure 2b: Traffic Volumes, Lane Geometry and Queues
NB Queues - AM SB Queues - PM
1-16
I-280 Corridor Study SANTA CLARA COUNTY
Figure 2c: Traffic Volumes, Lane Geometry and Queues
NB Queues - AM SB Queues - PM
1-17
I-280 Corridor Study SANTA CLARA COUNTY
Figure 2d: Traffic Volumes, Lane Geometry and Queues
NB Queues - AM SB Queues - PM
1-18
I-280 Corridor Study SANTA CLARA COUNTY
Figure 2e: Traffic Volumes, Lane Geometry and Queues
NB Queues - AM SB Queues - PM
1-19
I-280 Corridor Study SANTA CLARA COUNTY
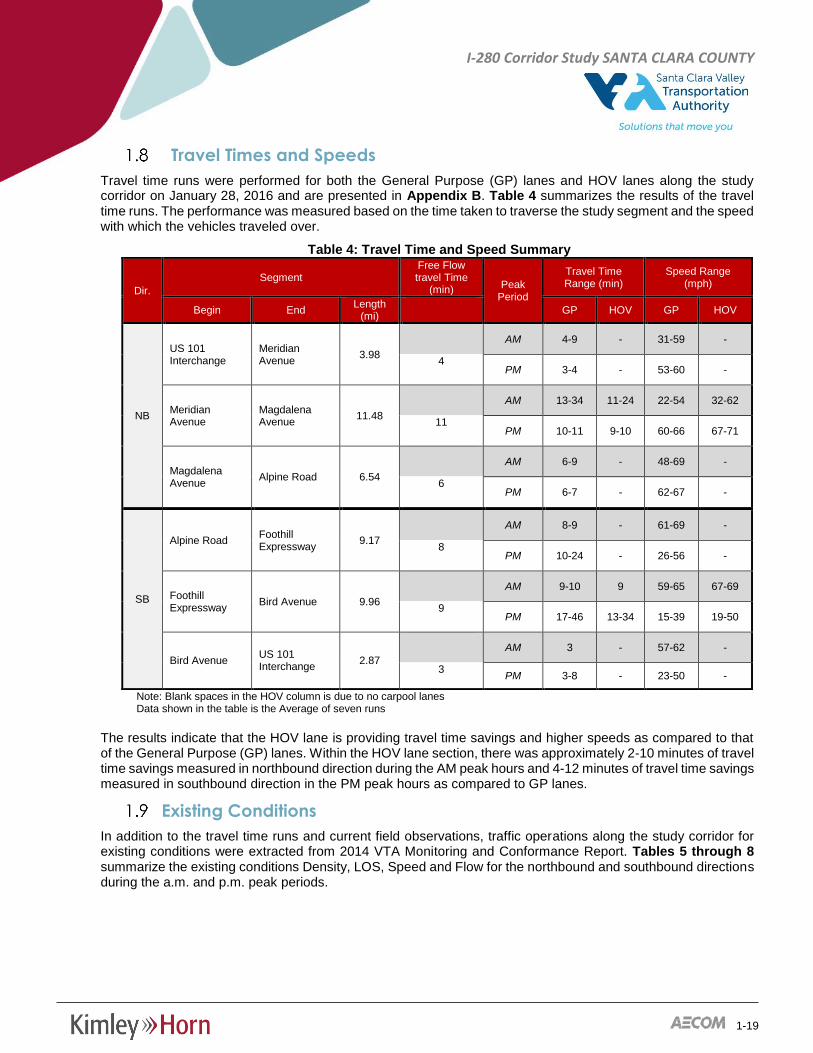
Travel Times and Speeds
Travel time runs were performed for both the General Purpose (GP) lanes and HOV lanes along the study corridor on January 28, 2016 and are presented in Appendix B. Table 4 summarizes the results of the travel time runs. The performance was measured based on the time taken to traverse the study segment and the speed with which the vehicles traveled over.
Table 4: Travel Time and Speed Summary
Dir. Segment
Free Flow travel Time
(min) Peak Period
Travel Time Range (min)
Speed Range (mph)
Begin End Length (mi)
GP HOV GP HOV
NB
US 101 Interchange
Meridian Avenue 3.98
AM 4-9 - 31-59 -
4 PM 3-4 - 53-60 -
Meridian Avenue
Magdalena Avenue 11.48
AM 13-34 11-24 22-54 32-62
11 PM 10-11 9-10 60-66 67-71
Magdalena Avenue Alpine Road 6.54
AM 6-9 - 48-69 -
6 PM 6-7 - 62-67 -
SB
Alpine Road Foothill Expressway 9.17
AM 8-9 - 61-69 -
8 PM 10-24 - 26-56 -
Foothill Expressway Bird Avenue 9.96
AM 9-10 9 59-65 67-69
9 PM 17-46 13-34 15-39 19-50
Bird Avenue US 101 Interchange 2.87
AM 3 - 57-62 -
3 PM 3-8 - 23-50 -
Note: Blank spaces in the HOV column is due to no carpool lanes Data shown in the table is the Average of seven runs
The results indicate that the HOV lane is providing travel time savings and higher speeds as compared to that of the General Purpose (GP) lanes. Within the HOV lane section, there was approximately 2-10 minutes of travel time savings measured in northbound direction during the AM peak hours and 4-12 minutes of travel time savings measured in southbound direction in the PM peak hours as compared to GP lanes.
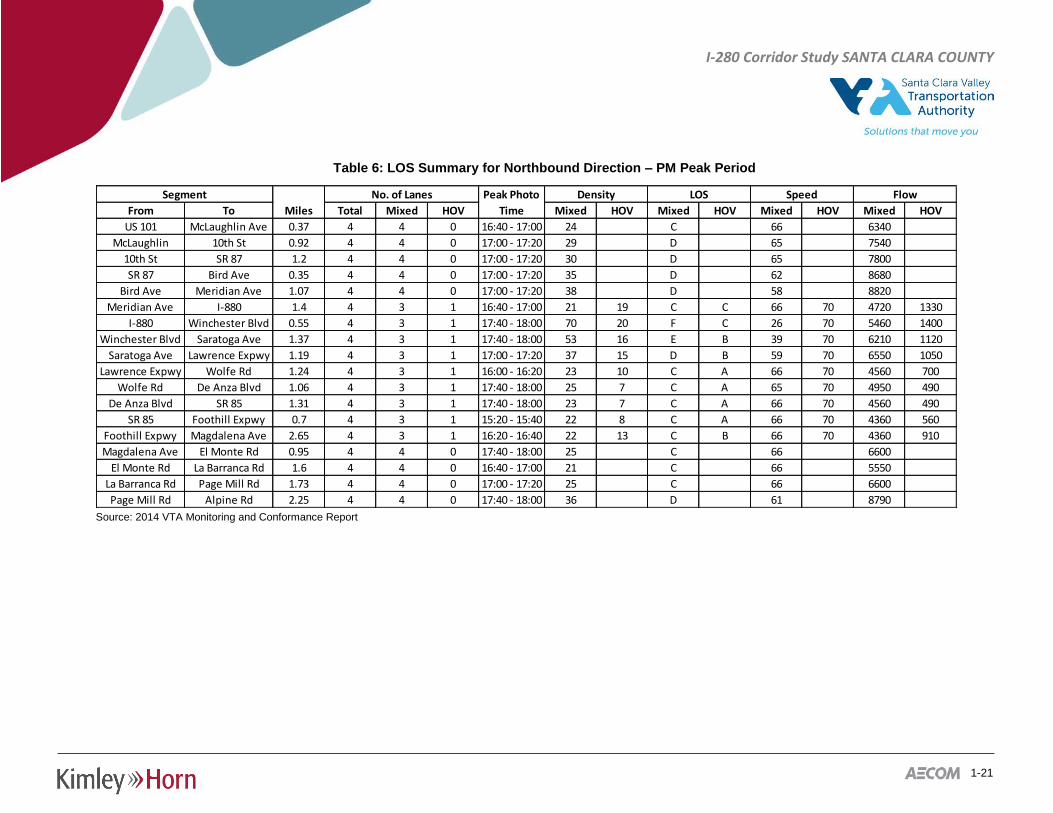
Existing Conditions
In addition to the travel time runs and current field observations, traffic operations along the study corridor for existing conditions were extracted from 2014 VTA Monitoring and Conformance Report. Tables 5 through 8 summarize the existing conditions Density, LOS, Speed and Flow for the northbound and southbound directions during the a.m. and p.m. peak periods.

1-20
I-280 Corridor Study SANTA CLARA COUNTY
Table 5: LOS Summary for Northbound Direction – AM Peak Period
Source: 2014 VTA Monitoring and Conformance Report
From To Total Mixed HOV Mixed HOV Mixed HOV Mixed HOV Mixed HOV
US 101 McLaughlin Ave 0.37 4 4 0 06:40 ‐ 07:00 101 F 14 5660
McLaughlin 10th St 0.92 4 4 0 08:20 ‐ 08:40 84 F 19 6390
10th St SR 87 1.2 4 4 0 07:20 ‐ 07:40 80 F 21 6720
SR 87 Bird Ave 0.35 4 4 0 07:20 ‐ 07:40 83 F 20 6640
Bird Ave Meridian Ave 1.07 4 4 0 07:40 ‐ 08:00 89 F 18 6410
Meridian Ave I‐880 1.4 4 3 1 07:20 ‐ 07:40 100 70 F F 14 26 4760 1820
I‐880 Winchester Blvd 0.55 4 3 1 07:20 ‐ 07:40 94 63 F F 16 31 4520 1960
Winchester Blvd Saratoga Ave 1.37 4 3 1 08:00 ‐ 08:20 78 48 F E 22 45 5150 2160
Saratoga Ave Lawrence Expwy 1.19 4 3 1 08:40 ‐ 09:00 89 78 F F 18 22 4810 1720
Lawrence Expwy Wolfe Rd 1.24 4 3 1 08:40 ‐ 09:00 81 46 F D 21 47 5110 2170
Wolfe Rd De Anza Blvd 1.06 4 3 1 08:40 ‐ 09:00 62 57 F E 32 36 5960 2060
De Anza Blvd SR 85 1.31 4 3 1 08:00 ‐ 08:20 73 45 F D 25 48 5480 2160
SR 85 Foothill Expwy 0.7 4 3 1 08:20 ‐ 08:40 70 58 F E 26 35 5460 2030
Foothill Expwy Magdalena Ave 2.65 4 3 1 08:40 ‐ 09:00 37 53 D E 59 39 6550 2070
Magdalena Ave El Monte Rd 0.95 4 4 0 09:20 ‐ 09:40 48 E 45 8640
El Monte Rd La Barranca Rd 1.6 4 4 0 09:20 ‐ 09:40 39 D 57 8900
La Barranca Rd Page Mill Rd 1.73 4 4 0 09:00 ‐ 09:20 32 D 64 8200
Page Mill Rd Alpine Rd 2.25 4 4 0 09:00 ‐ 09:20 32 C 66 6080
LOS Speed FlowNo. of LanesSegment
Miles
Peak Photo
Time
Density
1-21
I-280 Corridor Study SANTA CLARA COUNTY
Table 6: LOS Summary for Northbound Direction – PM Peak Period
Source: 2014 VTA Monitoring and Conformance Report
From To Total Mixed HOV Mixed HOV Mixed HOV Mixed HOV Mixed HOV
US 101 McLaughlin Ave 0.37 4 4 0 16:40 ‐ 17:00 24 C 66 6340
McLaughlin 10th St 0.92 4 4 0 17:00 ‐ 17:20 29 D 65 7540
10th St SR 87 1.2 4 4 0 17:00 ‐ 17:20 30 D 65 7800
SR 87 Bird Ave 0.35 4 4 0 17:00 ‐ 17:20 35 D 62 8680
Bird Ave Meridian Ave 1.07 4 4 0 17:00 ‐ 17:20 38 D 58 8820
Meridian Ave I‐880 1.4 4 3 1 16:40 ‐ 17:00 21 19 C C 66 70 4720 1330
I‐880 Winchester Blvd 0.55 4 3 1 17:40 ‐ 18:00 70 20 F C 26 70 5460 1400
Winchester Blvd Saratoga Ave 1.37 4 3 1 17:40 ‐ 18:00 53 16 E B 39 70 6210 1120
Saratoga Ave Lawrence Expwy 1.19 4 3 1 17:00 ‐ 17:20 37 15 D B 59 70 6550 1050
Lawrence Expwy Wolfe Rd 1.24 4 3 1 16:00 ‐ 16:20 23 10 C A 66 70 4560 700
Wolfe Rd De Anza Blvd 1.06 4 3 1 17:40 ‐ 18:00 25 7 C A 65 70 4950 490
De Anza Blvd SR 85 1.31 4 3 1 17:40 ‐ 18:00 23 7 C A 66 70 4560 490
SR 85 Foothill Expwy 0.7 4 3 1 15:20 ‐ 15:40 22 8 C A 66 70 4360 560
Foothill Expwy Magdalena Ave 2.65 4 3 1 16:20 ‐ 16:40 22 13 C B 66 70 4360 910
Magdalena Ave El Monte Rd 0.95 4 4 0 17:40 ‐ 18:00 25 C 66 6600
El Monte Rd La Barranca Rd 1.6 4 4 0 16:40 ‐ 17:00 21 C 66 5550
La Barranca Rd Page Mill Rd 1.73 4 4 0 17:00 ‐ 17:20 25 C 66 6600
Page Mill Rd Alpine Rd 2.25 4 4 0 17:40 ‐ 18:00 36 D 61 8790
Segment
Miles
Peak Photo
Time
Density LOS Speed FlowNo. of Lanes

1-22
I-280 Corridor Study SANTA CLARA COUNTY
Table 7: LOS Summary for Southbound Direction – AM Peak Period
Source: 2014 VTA Monitoring and Conformance Report
From To Total Mixed HOV Mixed HOV Mixed HOV Mixed HOV Mixed HOV
Alpine Rd Page Mill Rd 2.25 4 4 0 09:20 ‐ 09:40 25 C 66 6600
Page La Barranca Rd 1.73 4 4 0 08:00 ‐ 08:20 21 C 66 5550
La Barranca Rd El Monte Rd 1.6 4 4 0 08:40 ‐ 09:00 20 C 66 5280
El Monte Rd Magdalena Ave 0.95 4 4 0 09:20 ‐ 09:40 20 C 66 5280
Magdalena Ave Foothill Expwy 2.65 4 3 1 08:40 ‐ 09:00 23 12 C B 66 67 4560 810
Foothill Expwy SR 85 0.7 4 3 1 08:40 ‐ 09:00 33 14 D B 64 67 6340 940
SR 85 De Anza Blvd 1.31 4 3 1 08:40 ‐ 09:00 24 9 C A 66 67 4760 610
De Anza Blvd Wolfe Rd 1.06 4 3 1 08:20 ‐ 08:40 36 10 D A 61 67 6590 670
Wolfe Rd Lawrence Expwy 1.24 4 3 1 08:40 ‐ 09:00 35 16 D B 62 67 6510 1080
Lawrence Expwy Saratoga Ave 1.19 4 3 1 08:00 ‐ 08:20 37 10 D A 59 67 6550 670
Saratoga Ave Winchester Blvd 1.37 4 3 1 08:40 ‐ 09:00 32 10 D B 64 67 6150 740
Winchester Blvd I‐880 0.55 4 3 1 08:20 ‐ 08:40 33 14 C B 64 67 6340 940
I‐880 Meridian Ave 1.4 4 3 1 08:20 ‐ 08:40 26 18 C B 66 67 5150 670
Meridian Ave Bird Ave 1.07 4 4 0 08:00 ‐ 08:20 36 D 61 8790
Bird Ave SR 87 0.35 4 4 0 07:40 ‐ 08:00 20 C 66 5280
SR 87 10th St 1.2 4 4 0 08:20 ‐ 08:40 17 B 67 4530
10th St McLaughlin Ave 0.92 4 4 0 09:40 ‐ 09:20 19 C 66 5020
McLaughlin Ave US 101 0.37 4 4 0 07:40 ‐ 08:00 22 C 66 5810
Density LOS Speed FlowNo. of LanesSegment
Miles
Peak Photo
Time
1-23
I-280 Corridor Study SANTA CLARA COUNTY
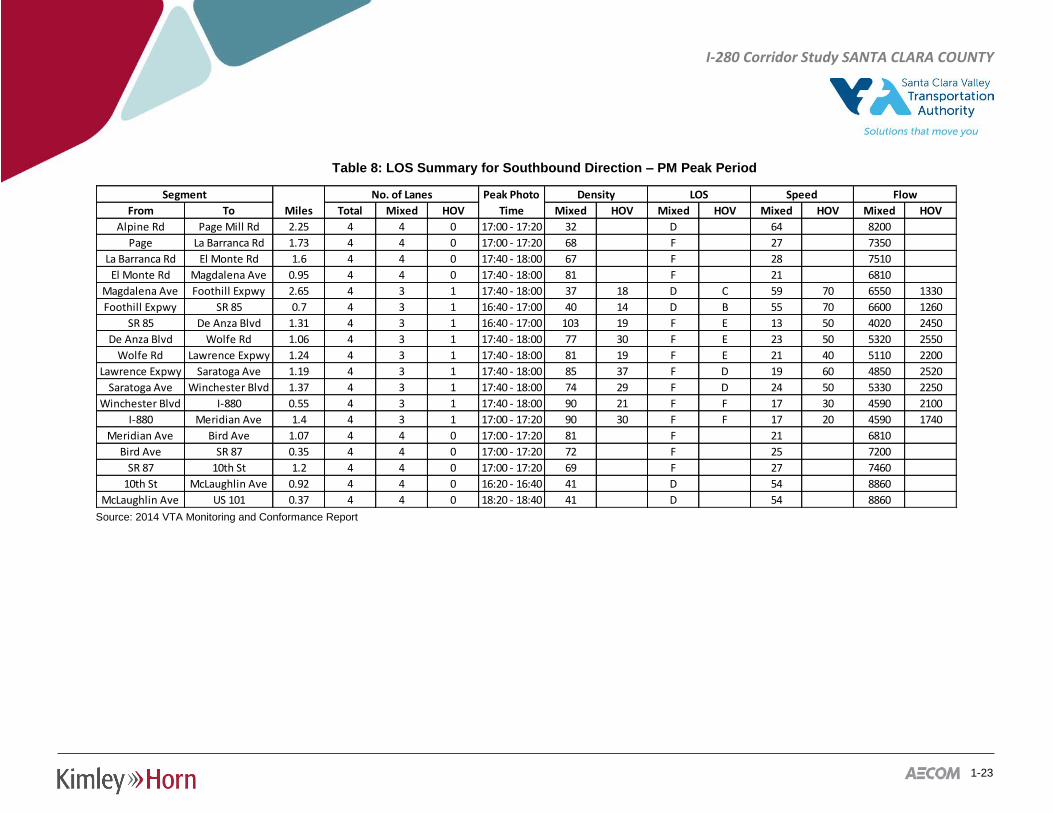
Table 8: LOS Summary for Southbound Direction – PM Peak Period
Source: 2014 VTA Monitoring and Conformance Report
From To Total Mixed HOV Mixed HOV Mixed HOV Mixed HOV Mixed HOV
Alpine Rd Page Mill Rd 2.25 4 4 0 17:00 ‐ 17:20 32 D 64 8200
Page La Barranca Rd 1.73 4 4 0 17:00 ‐ 17:20 68 F 27 7350
La Barranca Rd El Monte Rd 1.6 4 4 0 17:40 ‐ 18:00 67 F 28 7510
El Monte Rd Magdalena Ave 0.95 4 4 0 17:40 ‐ 18:00 81 F 21 6810
Magdalena Ave Foothill Expwy 2.65 4 3 1 17:40 ‐ 18:00 37 18 D C 59 70 6550 1330
Foothill Expwy SR 85 0.7 4 3 1 16:40 ‐ 17:00 40 14 D B 55 70 6600 1260
SR 85 De Anza Blvd 1.31 4 3 1 16:40 ‐ 17:00 103 19 F E 13 50 4020 2450
De Anza Blvd Wolfe Rd 1.06 4 3 1 17:40 ‐ 18:00 77 30 F E 23 50 5320 2550
Wolfe Rd Lawrence Expwy 1.24 4 3 1 17:40 ‐ 18:00 81 19 F E 21 40 5110 2200
Lawrence Expwy Saratoga Ave 1.19 4 3 1 17:40 ‐ 18:00 85 37 F D 19 60 4850 2520
Saratoga Ave Winchester Blvd 1.37 4 3 1 17:40 ‐ 18:00 74 29 F D 24 50 5330 2250
Winchester Blvd I‐880 0.55 4 3 1 17:40 ‐ 18:00 90 21 F F 17 30 4590 2100
I‐880 Meridian Ave 1.4 4 3 1 17:00 ‐ 17:20 90 30 F F 17 20 4590 1740
Meridian Ave Bird Ave 1.07 4 4 0 17:00 ‐ 17:20 81 F 21 6810
Bird Ave SR 87 0.35 4 4 0 17:00 ‐ 17:20 72 F 25 7200
SR 87 10th St 1.2 4 4 0 17:00 ‐ 17:20 69 F 27 7460
10th St McLaughlin Ave 0.92 4 4 0 16:20 ‐ 16:40 41 D 54 8860
McLaughlin Ave US 101 0.37 4 4 0 18:20 ‐ 18:40 41 D 54 8860
Speed FlowSegment
Miles
Peak Photo
Time
Density LOSNo. of Lanes

2-1
I-280 Corridor Study SANTA CLARA COUNTY
The results from the VTA CMP report are in line with the field observations conducted by AECOM.
Existing Conditions - Local Streets
ROADWAY FACILITIES
I-280 has 24 interchanges and local road crossings within the study area (some minor local roads are paired with a nearby local road or interchange). The 24 interchanges and local road crossings are Page Mill Road, El Monte Avenue, Magdalena Avenue, Foothill Expressway, State Route 85 (SR-85), De Anza Boulevard, Wolfe Road, Stevens Creek Boulevard, Lawrence Expressway, Saratoga Avenue, Winchester Boulevard, Interstate 880 (I-880), Bascom Avenue, Leigh Avenue, Meridian Avenue/Race Street, Bird Avenue, State Route 87 (SR-87), Almaden Boulevard/First Street, 4th Street, 6th Street/7th Street, 10th Street, 11th Street, McLaughlin Avenue, and US Route 101 (US-101). These interchanges are briefly described below. Note that the alignment I-280 changes between north-south and east-west along the study area. When referencing direction of travel on I-280, the designation of northbound I-280 (towards San Francisco) and southbound I-280 (towards San Jose) will always be used. When describing cross-streets or interchanges relative to I-280, normal directional convention will be used.
Page Mill Road is a 4-lane major arterial north of I-280 and a 2-lane minor arterial south of I-280. It is served by VTA Express Bus routes 101, 102, 103, 104, 182 and pull out DB1 which is operated by multiple agencies. Bike lanes exist south of I-280 and a sidewalk exists on the east side of the street at I-280. Northbound and southbound I-280 are accessible while traveling in either direction on Page Mill Road. Page Mill Road is operated by the County of Santa Clara.
El Monte Avenue is a 4-lane major arterial. It is served by VTA local bus routes 40 and 52. There are striped shoulders that exist east and west of I-280. There is no sidewalk on the south side of the street at I-280, however there is a shared-use pathway in the median of El Monte Avenue between the westbound and eastbound travel lanes. Northbound and southbound I-280 are accessible while traveling in either direction on El Monte Avenue.
Magdalena Avenue is a 4-lane collector north of I-280 and a 2-lane collector south of I-280. There are sidewalks on both sides of the street at
I-280 and existing bike facilities east of I-280. Northbound and southbound I-280 are accessible while traveling in either direction on Magdalena Avenue.
Foothill Expressway is a 4-lane expressway at I-280. It is served by VTA local bus route 81. There is a sidewalk on the east side of the street at I-280 and wide enough shoulders to accommodate bikes. Northbound and Southbound I-280 may be accessed from either direction on Foothill Expressway. Foothill Expressway is operated by the County of Santa Clara.
SR-85 is a 6-lane freeway with an auxiliary lane in some locations. VTA Express Bus route 102 operates on SR-85. Northbound and southbound I-280 are accessible while traveling in either direction on SR-85.
De Anza Boulevard is a 6-lane major arterial north of I-280 and a 7-lane major arterial south of I-280. There are 10 lanes on the overpass at I-280 (includes turn lanes). De Anza Boulevard is served by VTA local bus route 55. There are bike lanes striped north and south of I-280. Sidewalks exist on both sides of the street at I-280. Northbound and southbound I-280 are accessible while traveling in either direction on De Anza Boulevard.
Wolfe Road¹ is a 6-lane major arterial north of I-280 and a 4-lane minor arterial south of Stevens Creek Boulevard. It is served by VTA local bus route 26 and express bus route 101. There are bike lanes in both directions at I-280, as well as sidewalks on each side of the street. Northbound and southbound I-280 are accessible while traveling in either direction on Wolfe Road.
Stevens Creek Boulevard is a 6-lane major arterial that runs east-west at I-280. It is served by VTA local bus route 23, Express Bus routes 101 and 182, and Rapid Bus route 323. There are existing bike lanes and sidewalks in each direction. Northbound I-280 is accessible while traveling west on Stevens Creek Boulevard.
2-2
I-280 Corridor Study SANTA CLARA COUNTY
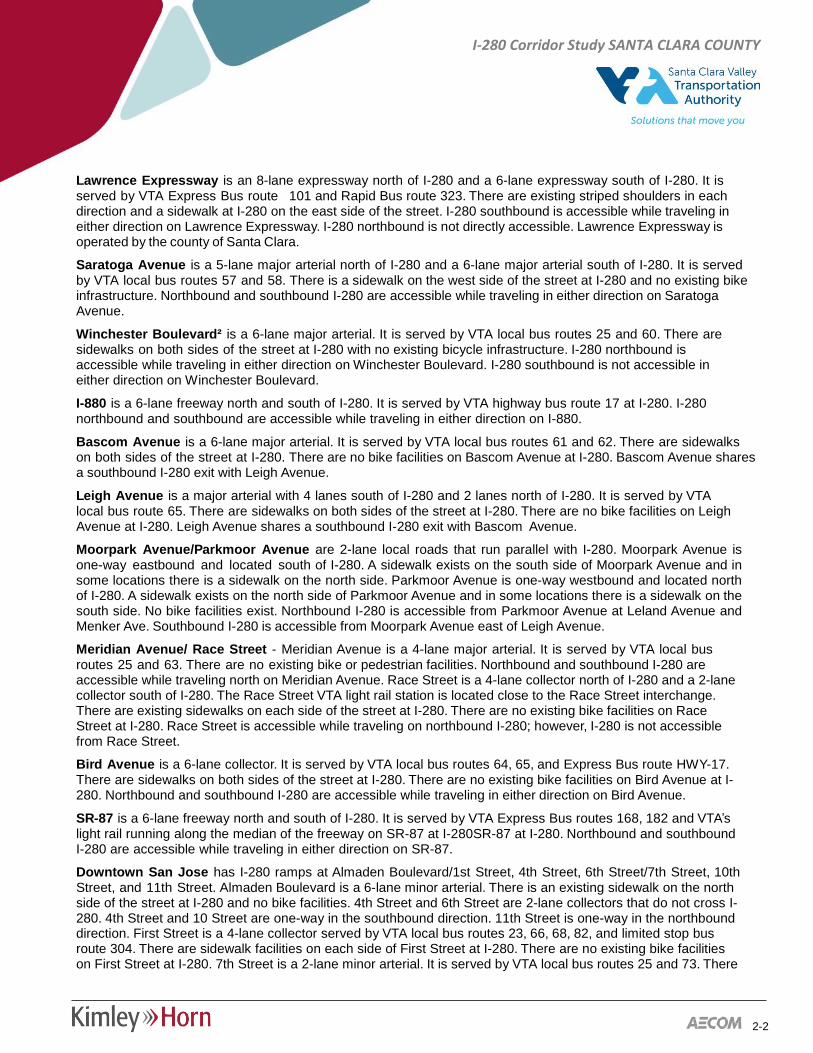
Lawrence Expressway is an 8-lane expressway north of I-280 and a 6-lane expressway south of I-280. It is served by VTA Express Bus route 101 and Rapid Bus route 323. There are existing striped shoulders in each direction and a sidewalk at I-280 on the east side of the street. I-280 southbound is accessible while traveling in either direction on Lawrence Expressway. I-280 northbound is not directly accessible. Lawrence Expressway is operated by the county of Santa Clara.
Saratoga Avenue is a 5-lane major arterial north of I-280 and a 6-lane major arterial south of I-280. It is served by VTA local bus routes 57 and 58. There is a sidewalk on the west side of the street at I-280 and no existing bike infrastructure. Northbound and southbound I-280 are accessible while traveling in either direction on Saratoga Avenue.
Winchester Boulevard² is a 6-lane major arterial. It is served by VTA local bus routes 25 and 60. There are sidewalks on both sides of the street at I-280 with no existing bicycle infrastructure. I-280 northbound is accessible while traveling in either direction on Winchester Boulevard. I-280 southbound is not accessible in either direction on Winchester Boulevard.
I-880 is a 6-lane freeway north and south of I-280. It is served by VTA highway bus route 17 at I-280. I-280 northbound and southbound are accessible while traveling in either direction on I-880.
Bascom Avenue is a 6-lane major arterial. It is served by VTA local bus routes 61 and 62. There are sidewalks on both sides of the street at I-280. There are no bike facilities on Bascom Avenue at I-280. Bascom Avenue shares a southbound I-280 exit with Leigh Avenue.
Leigh Avenue is a major arterial with 4 lanes south of I-280 and 2 lanes north of I-280. It is served by VTA local bus route 65. There are sidewalks on both sides of the street at I-280. There are no bike facilities on Leigh Avenue at I-280. Leigh Avenue shares a southbound I-280 exit with Bascom Avenue.
Moorpark Avenue/Parkmoor Avenue are 2-lane local roads that run parallel with I-280. Moorpark Avenue is one-way eastbound and located south of I-280. A sidewalk exists on the south side of Moorpark Avenue and in some locations there is a sidewalk on the north side. Parkmoor Avenue is one-way westbound and located north of I-280. A sidewalk exists on the north side of Parkmoor Avenue and in some locations there is a sidewalk on the south side. No bike facilities exist. Northbound I-280 is accessible from Parkmoor Avenue at Leland Avenue and Menker Ave. Southbound I-280 is accessible from Moorpark Avenue east of Leigh Avenue.
Meridian Avenue/ Race Street - Meridian Avenue is a 4-lane major arterial. It is served by VTA local bus routes 25 and 63. There are no existing bike or pedestrian facilities. Northbound and southbound I-280 are accessible while traveling north on Meridian Avenue. Race Street is a 4-lane collector north of I-280 and a 2-lane collector south of I-280. The Race Street VTA light rail station is located close to the Race Street interchange. There are existing sidewalks on each side of the street at I-280. There are no existing bike facilities on Race Street at I-280. Race Street is accessible while traveling on northbound I-280; however, I-280 is not accessible from Race Street.
Bird Avenue is a 6-lane collector. It is served by VTA local bus routes 64, 65, and Express Bus route HWY-17. There are sidewalks on both sides of the street at I-280. There are no existing bike facilities on Bird Avenue at I-280. Northbound and southbound I-280 are accessible while traveling in either direction on Bird Avenue.
SR-87 is a 6-lane freeway north and south of I-280. It is served by VTA Express Bus routes 168, 182 and VTA’s light rail running along the median of the freeway on SR-87 at I-280SR-87 at I-280. Northbound and southbound I-280 are accessible while traveling in either direction on SR-87.
Downtown San Jose has I-280 ramps at Almaden Boulevard/1st Street, 4th Street, 6th Street/7th Street, 10th Street, and 11th Street. Almaden Boulevard is a 6-lane minor arterial. There is an existing sidewalk on the north side of the street at I-280 and no bike facilities. 4th Street and 6th Street are 2-lane collectors that do not cross I-280. 4th Street and 10 Street are one-way in the southbound direction. 11th Street is one-way in the northbound direction. First Street is a 4-lane collector served by VTA local bus routes 23, 66, 68, 82, and limited stop bus route 304. There are sidewalk facilities on each side of First Street at I-280. There are no existing bike facilities on First Street at I-280. 7th Street is a 2-lane minor arterial. It is served by VTA local bus routes 25 and 73. There
2-3
I-280 Corridor Study SANTA CLARA COUNTY
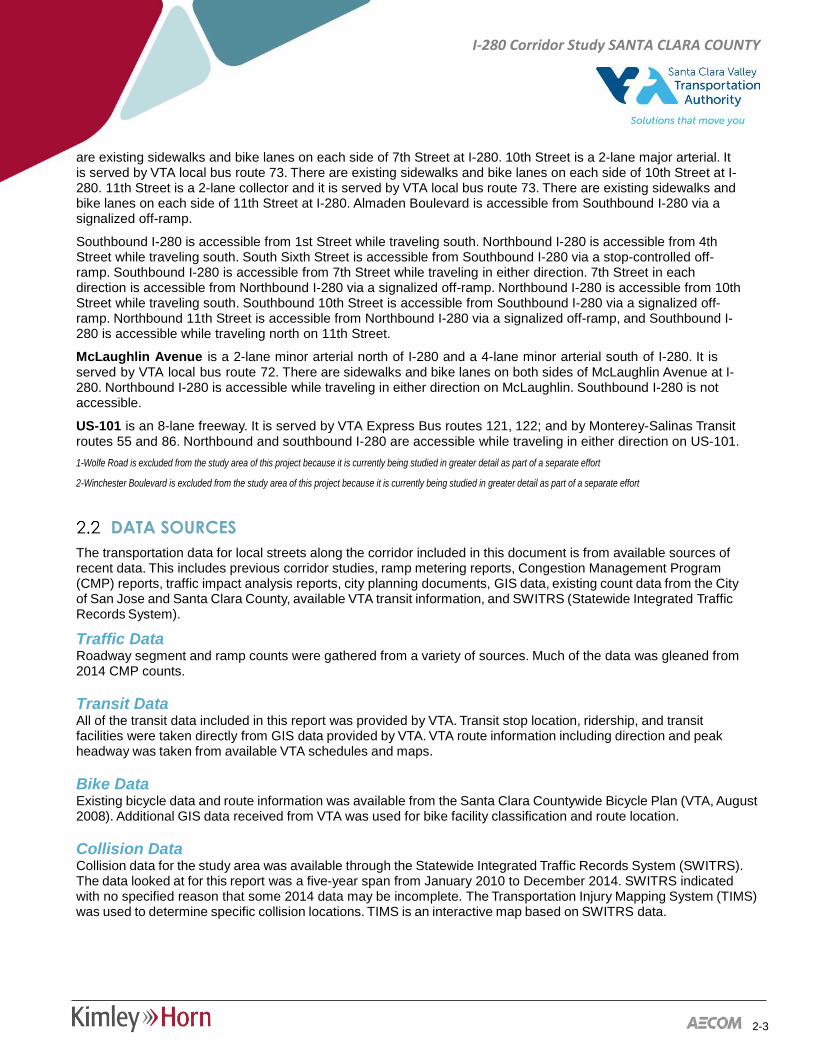
are existing sidewalks and bike lanes on each side of 7th Street at I-280. 10th Street is a 2-lane major arterial. It is served by VTA local bus route 73. There are existing sidewalks and bike lanes on each side of 10th Street at I-280. 11th Street is a 2-lane collector and it is served by VTA local bus route 73. There are existing sidewalks and bike lanes on each side of 11th Street at I-280. Almaden Boulevard is accessible from Southbound I-280 via a signalized off-ramp.
Southbound I-280 is accessible from 1st Street while traveling south. Northbound I-280 is accessible from 4th Street while traveling south. South Sixth Street is accessible from Southbound I-280 via a stop-controlled off-ramp. Southbound I-280 is accessible from 7th Street while traveling in either direction. 7th Street in each direction is accessible from Northbound I-280 via a signalized off-ramp. Northbound I-280 is accessible from 10th Street while traveling south. Southbound 10th Street is accessible from Southbound I-280 via a signalized off-ramp. Northbound 11th Street is accessible from Northbound I-280 via a signalized off-ramp, and Southbound I-280 is accessible while traveling north on 11th Street.
McLaughlin Avenue is a 2-lane minor arterial north of I-280 and a 4-lane minor arterial south of I-280. It is served by VTA local bus route 72. There are sidewalks and bike lanes on both sides of McLaughlin Avenue at I-280. Northbound I-280 is accessible while traveling in either direction on McLaughlin. Southbound I-280 is not accessible.
US-101 is an 8-lane freeway. It is served by VTA Express Bus routes 121, 122; and by Monterey-Salinas Transit routes 55 and 86. Northbound and southbound I-280 are accessible while traveling in either direction on US-101. 1-Wolfe Road is excluded from the study area of this project because it is currently being studied in greater detail as part of a separate effort
2-Winchester Boulevard is excluded from the study area of this project because it is currently being studied in greater detail as part of a separate effort
DATA SOURCES
The transportation data for local streets along the corridor included in this document is from available sources of recent data. This includes previous corridor studies, ramp metering reports, Congestion Management Program (CMP) reports, traffic impact analysis reports, city planning documents, GIS data, existing count data from the City of San Jose and Santa Clara County, available VTA transit information, and SWITRS (Statewide Integrated Traffic Records System).
Traffic Data Roadway segment and ramp counts were gathered from a variety of sources. Much of the data was gleaned from 2014 CMP counts.
Transit Data All of the transit data included in this report was provided by VTA. Transit stop location, ridership, and transit facilities were taken directly from GIS data provided by VTA. VTA route information including direction and peak headway was taken from available VTA schedules and maps.
Bike Data Existing bicycle data and route information was available from the Santa Clara Countywide Bicycle Plan (VTA, August 2008). Additional GIS data received from VTA was used for bike facility classification and route location.
Collision Data Collision data for the study area was available through the Statewide Integrated Traffic Records System (SWITRS). The data looked at for this report was a five-year span from January 2010 to December 2014. SWITRS indicated with no specified reason that some 2014 data may be incomplete. The Transportation Injury Mapping System (TIMS) was used to determine specific collision locations. TIMS is an interactive map based on SWITRS data.
2-4
I-280 Corridor Study SANTA CLARA COUNTY
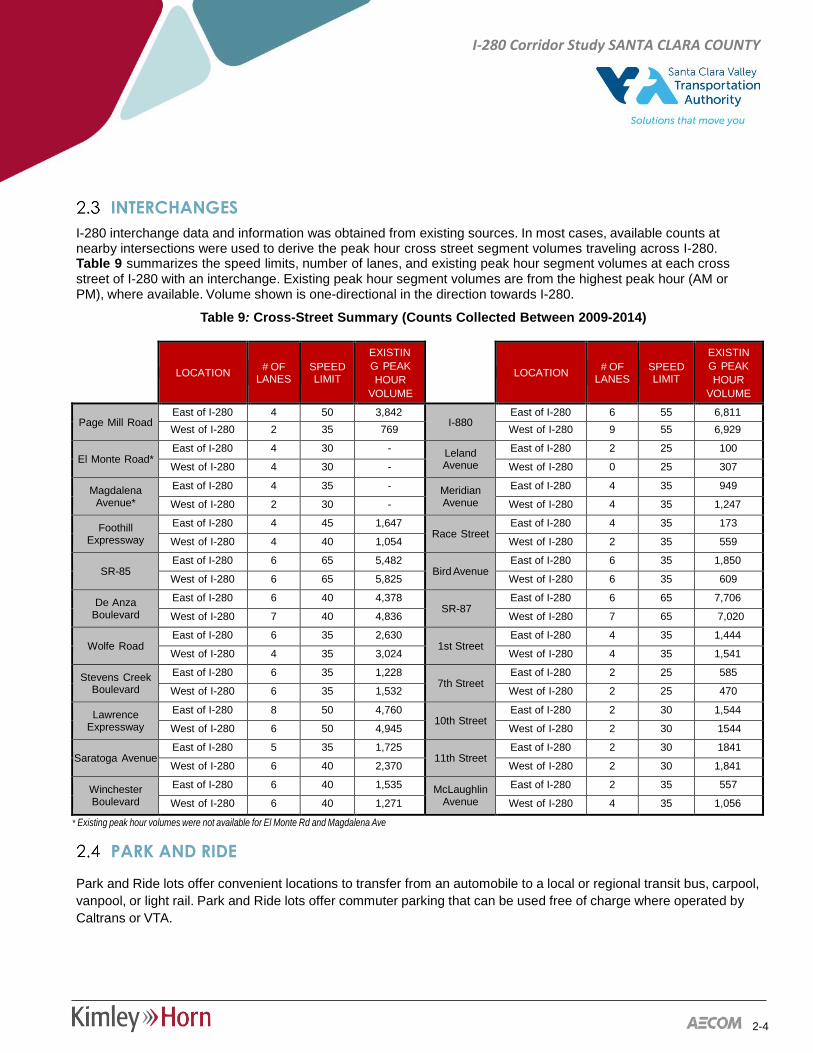
INTERCHANGES
I-280 interchange data and information was obtained from existing sources. In most cases, available counts at nearby intersections were used to derive the peak hour cross street segment volumes traveling across I-280. Table 9 summarizes the speed limits, number of lanes, and existing peak hour segment volumes at each cross street of I-280 with an interchange. Existing peak hour segment volumes are from the highest peak hour (AM or PM), where available. Volume shown is one-directional in the direction towards I-280.
Table 9: Cross-Street Summary (Counts Collected Between 2009-2014)
LOCATION # OF
LANES SPEED LIMIT
EXISTING PEAK HOUR
VOLUME
LOCATION # OF
LANES SPEED LIMIT
EXISTING PEAK HOUR
VOLUME
Page Mill Road East of I-280 4 50 3,842
I-880 East of I-280 6 55 6,811
West of I-280 2 35 769 West of I-280 9 55 6,929
El Monte Road* East of I-280 4 30 - Leland
Avenue East of I-280 2 25 100
West of I-280 4 30 - West of I-280 0 25 307
Magdalena Avenue*
East of I-280 4 35 - Meridian Avenue
East of I-280 4 35 949
West of I-280 2 30 - West of I-280 4 35 1,247
Foothill Expressway
East of I-280 4 45 1,647 Race Street
East of I-280 4 35 173
West of I-280 4 40 1,054 West of I-280 2 35 559
SR-85 East of I-280 6 65 5,482
Bird Avenue East of I-280 6 35 1,850
West of I-280 6 65 5,825 West of I-280 6 35 609
De Anza Boulevard
East of I-280 6 40 4,378 SR-87
East of I-280 6 65 7,706
West of I-280 7 40 4,836 West of I-280 7 65 7,020
Wolfe Road East of I-280 6 35 2,630
1st Street East of I-280 4 35 1,444
West of I-280 4 35 3,024 West of I-280 4 35 1,541
Stevens Creek Boulevard
East of I-280 6 35 1,228 7th Street
East of I-280 2 25 585
West of I-280 6 35 1,532 West of I-280 2 25 470
Lawrence Expressway
East of I-280 8 50 4,760 10th Street
East of I-280 2 30 1,544
West of I-280 6 50 4,945 West of I-280 2 30 1544
Saratoga Avenue East of I-280 5 35 1,725
11th Street East of I-280 2 30 1841
West of I-280 6 40 2,370 West of I-280 2 30 1,841
Winchester Boulevard
East of I-280 6 40 1,535 McLaughlin Avenue
East of I-280 2 35 557
West of I-280 6 40 1,271 West of I-280 4 35 1,056
* Existing peak hour volumes were not available for El Monte Rd and Magdalena Ave
PARK AND RIDE
Park and Ride lots offer convenient locations to transfer from an automobile to a local or regional transit bus, carpool, vanpool, or light rail. Park and Ride lots offer commuter parking that can be used free of charge where operated by Caltrans or VTA.
2-5
I-280 Corridor Study SANTA CLARA COUNTY
Park and Ride lots located in the vicinity of our study area are at the following locations:
• Page Mill Road & Arastadero Road (Operated by Caltrans)
• Vallco Shopping Center (Wolfe Road) (Operated by VTA)
• Diridon Caltrain Station (Operated by VTA)
• Tamien Light Rail/Caltrain Station (Operated by VTA)
VTA continue to seek out new Park and Ride opportunities in order to improve the productivity of the existing transit system.
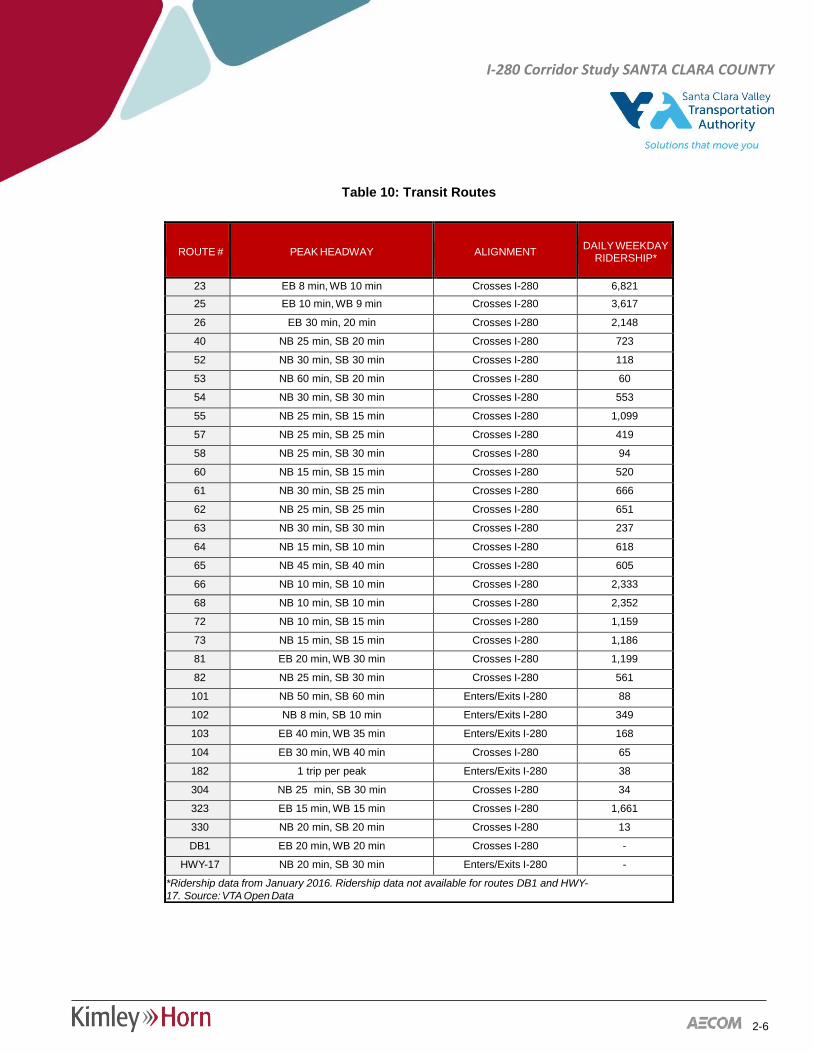
TRANSIT FACILITIES
VTA provides express bus service along the Interstate 280 corridor and on many of the side streets nearby. Express bus routes that operate on Interstate 280 include Routes 101, 102, 103, and 182. Within the study area, the 101 provides service from Page Mill Road to Lawrence Expressway. The following bus routes provide service that stretches nearly the entire length of the study area:
• Route 102 operates on I-280 from Page Mill Road to SR-85
• Route 103 operates on I-280 from Page Mill Road to I-680. It exits at Race Street and Southwest Expressway
• Route 182 operates on I-280 from Page Mill Road to SR-87
• Highway 17 Express operates on I-280 from Highway 17 to Bird Avenue. This route is operated by a multi-agency consortium of Amtrak, Capitol Corridor, VTA, Santa Clara Metro, and MST
In addition to bus service, VTA light rail also runs through the study area. It crosses the I-280 corridor at Southwest Expressway and within the median of SR-87. The Race Street Station, Fruitdale Station, and Virginia Station are located closest to I-280.
Table 10 and Appendix D show existing transit services within the study area.
2-6
I-280 Corridor Study SANTA CLARA COUNTY
Table 10: Transit Routes
ROUTE # PEAK HEADWAY ALIGNMENT DAILY WEEKDAY
RIDERSHIP*
23 EB 8 min, WB 10 min Crosses I-280 6,821 25 EB 10 min, WB 9 min Crosses I-280 3,617
26 EB 30 min, 20 min Crosses I-280 2,148
40 NB 25 min, SB 20 min Crosses I-280 723
52 NB 30 min, SB 30 min Crosses I-280 118
53 NB 60 min, SB 20 min Crosses I-280 60
54 NB 30 min, SB 30 min Crosses I-280 553
55 NB 25 min, SB 15 min Crosses I-280 1,099
57 NB 25 min, SB 25 min Crosses I-280 419
58 NB 25 min, SB 30 min Crosses I-280 94
60 NB 15 min, SB 15 min Crosses I-280 520
61 NB 30 min, SB 25 min Crosses I-280 666
62 NB 25 min, SB 25 min Crosses I-280 651
63 NB 30 min, SB 30 min Crosses I-280 237
64 NB 15 min, SB 10 min Crosses I-280 618
65 NB 45 min, SB 40 min Crosses I-280 605
66 NB 10 min, SB 10 min Crosses I-280 2,333
68 NB 10 min, SB 10 min Crosses I-280 2,352
72 NB 10 min, SB 15 min Crosses I-280 1,159
73 NB 15 min, SB 15 min Crosses I-280 1,186
81 EB 20 min, WB 30 min Crosses I-280 1,199
82 NB 25 min, SB 30 min Crosses I-280 561
101 NB 50 min, SB 60 min Enters/Exits I-280 88
102 NB 8 min, SB 10 min Enters/Exits I-280 349
103 EB 40 min, WB 35 min Enters/Exits I-280 168
104 EB 30 min, WB 40 min Crosses I-280 65
182 1 trip per peak Enters/Exits I-280 38
304 NB 25 min, SB 30 min Crosses I-280 34
323 EB 15 min, WB 15 min Crosses I-280 1,661
330 NB 20 min, SB 20 min Crosses I-280 13
DB1 EB 20 min, WB 20 min Crosses I-280 -
HWY-17 NB 20 min, SB 30 min Enters/Exits I-280 -
*Ridership data from January 2016. Ridership data not available for routes DB1 and HWY-
17. Source: VTA Open Data
2-7
I-280 Corridor Study SANTA CLARA COUNTY
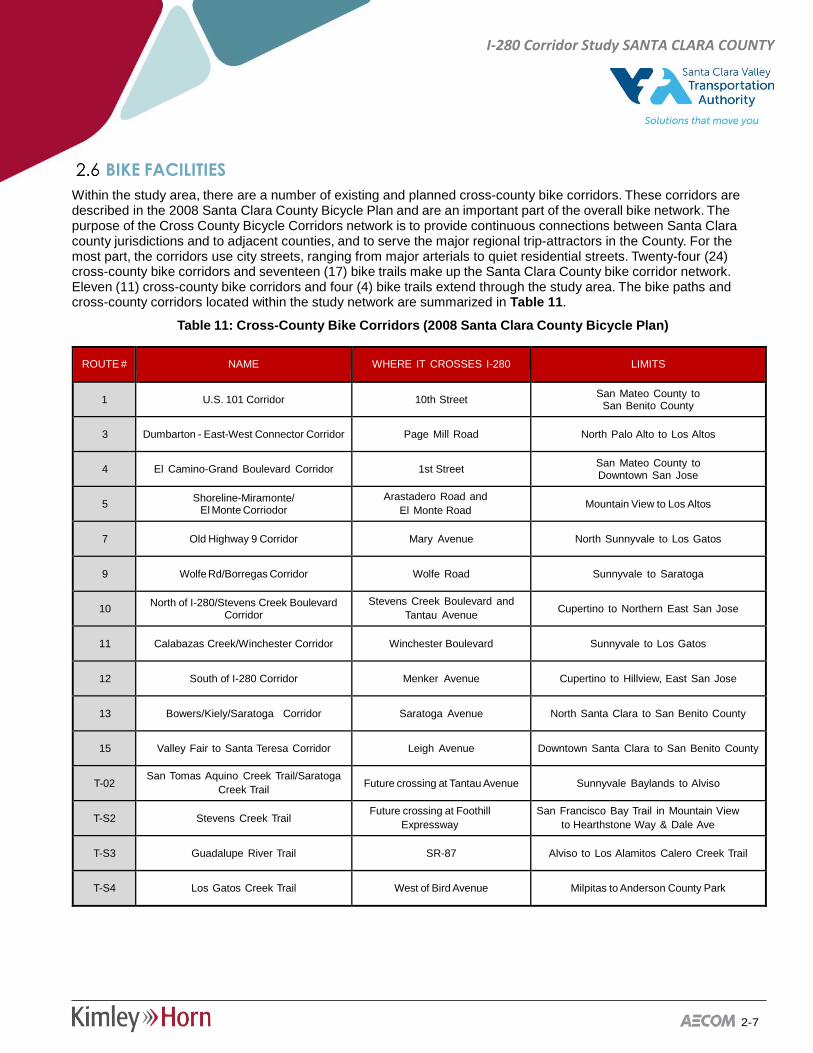
BIKE FACILITIES
Within the study area, there are a number of existing and planned cross-county bike corridors. These corridors are described in the 2008 Santa Clara County Bicycle Plan and are an important part of the overall bike network. The purpose of the Cross County Bicycle Corridors network is to provide continuous connections between Santa Clara county jurisdictions and to adjacent counties, and to serve the major regional trip-attractors in the County. For the most part, the corridors use city streets, ranging from major arterials to quiet residential streets. Twenty-four (24) cross-county bike corridors and seventeen (17) bike trails make up the Santa Clara County bike corridor network. Eleven (11) cross-county bike corridors and four (4) bike trails extend through the study area. The bike paths and cross-county corridors located within the study network are summarized in Table 11.
Table 11: Cross-County Bike Corridors (2008 Santa Clara County Bicycle Plan)
ROUTE #
NAME
WHERE IT CROSSES I-280
LIMITS
1 U.S. 101 Corridor 10th Street San Mateo County to San Benito County
3 Dumbarton - East-West Connector Corridor Page Mill Road North Palo Alto to Los Altos
4 El Camino-Grand Boulevard Corridor 1st Street San Mateo County to Downtown San Jose
5 Shoreline-Miramonte/ El Monte Corriodor
Arastadero Road and El Monte Road Mountain View to Los Altos
7 Old Highway 9 Corridor Mary Avenue North Sunnyvale to Los Gatos
9 Wolfe Rd/Borregas Corridor Wolfe Road Sunnyvale to Saratoga
10 North of I-280/Stevens Creek Boulevard Corridor
Stevens Creek Boulevard and Tantau Avenue Cupertino to Northern East San Jose
11 Calabazas Creek/Winchester Corridor Winchester Boulevard Sunnyvale to Los Gatos
12 South of I-280 Corridor Menker Avenue Cupertino to Hillview, East San Jose
13 Bowers/Kiely/Saratoga Corridor Saratoga Avenue North Santa Clara to San Benito County
15 Valley Fair to Santa Teresa Corridor Leigh Avenue Downtown Santa Clara to San Benito County
T-02 San Tomas Aquino Creek Trail/Saratoga
Creek Trail Future crossing at Tantau Avenue Sunnyvale Baylands to Alviso
T-S2 Stevens Creek Trail Future crossing at Foothill
Expressway San Francisco Bay Trail in Mountain View
to Hearthstone Way & Dale Ave
T-S3 Guadalupe River Trail SR-87 Alviso to Los Alamitos Calero Creek Trail
T-S4 Los Gatos Creek Trail West of Bird Avenue Milpitas to Anderson County Park
2-8
I-280 Corridor Study SANTA CLARA COUNTY
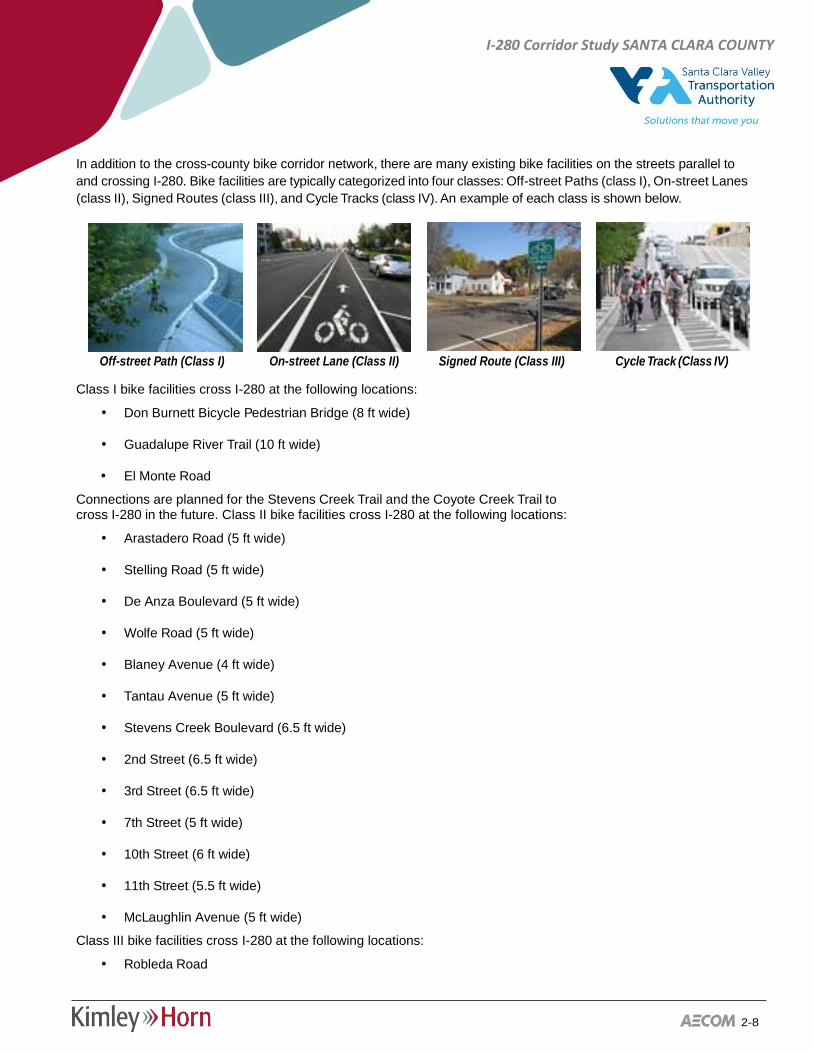
In addition to the cross-county bike corridor network, there are many existing bike facilities on the streets parallel to and crossing I-280. Bike facilities are typically categorized into four classes: Off-street Paths (class I), On-street Lanes (class II), Signed Routes (class III), and Cycle Tracks (class IV). An example of each class is shown below.
Off-street Path (Class I) On-street Lane (Class II) Signed Route (Class III) Cycle Track (Class IV)
Class I bike facilities cross I-280 at the following locations:
• Don Burnett Bicycle Pedestrian Bridge (8 ft wide)
• Guadalupe River Trail (10 ft wide)
• El Monte Road
Connections are planned for the Stevens Creek Trail and the Coyote Creek Trail to cross I-280 in the future. Class II bike facilities cross I-280 at the following locations:
• Arastadero Road (5 ft wide)
• Stelling Road (5 ft wide)
• De Anza Boulevard (5 ft wide)
• Wolfe Road (5 ft wide)
• Blaney Avenue (4 ft wide)
• Tantau Avenue (5 ft wide)
• Stevens Creek Boulevard (6.5 ft wide)
• 2nd Street (6.5 ft wide)
• 3rd Street (6.5 ft wide)
• 7th Street (5 ft wide)
• 10th Street (6 ft wide)
• 11th Street (5.5 ft wide)
• McLaughlin Avenue (5 ft wide)
Class III bike facilities cross I-280 at the following locations:
• Robleda Road
2-9
I-280 Corridor Study SANTA CLARA COUNTY
Appendix E shows the existing bike facilities in the I-280 study area.
Across Barrier Connections In some locations within the study area, I-280 creates an impermeable barrier for pedestrians and bicyclists. Even when a roadway crosses, it may have inadequate or have no accommodations for bicycles (bike lanes or shoulders meeting bike lane standards) and/or pedestrians (sidewalks). The 2008 Santa Clara Countywide Bicycle Plan identifies these barriers as an issue that should be addressed with "across barrier connections".
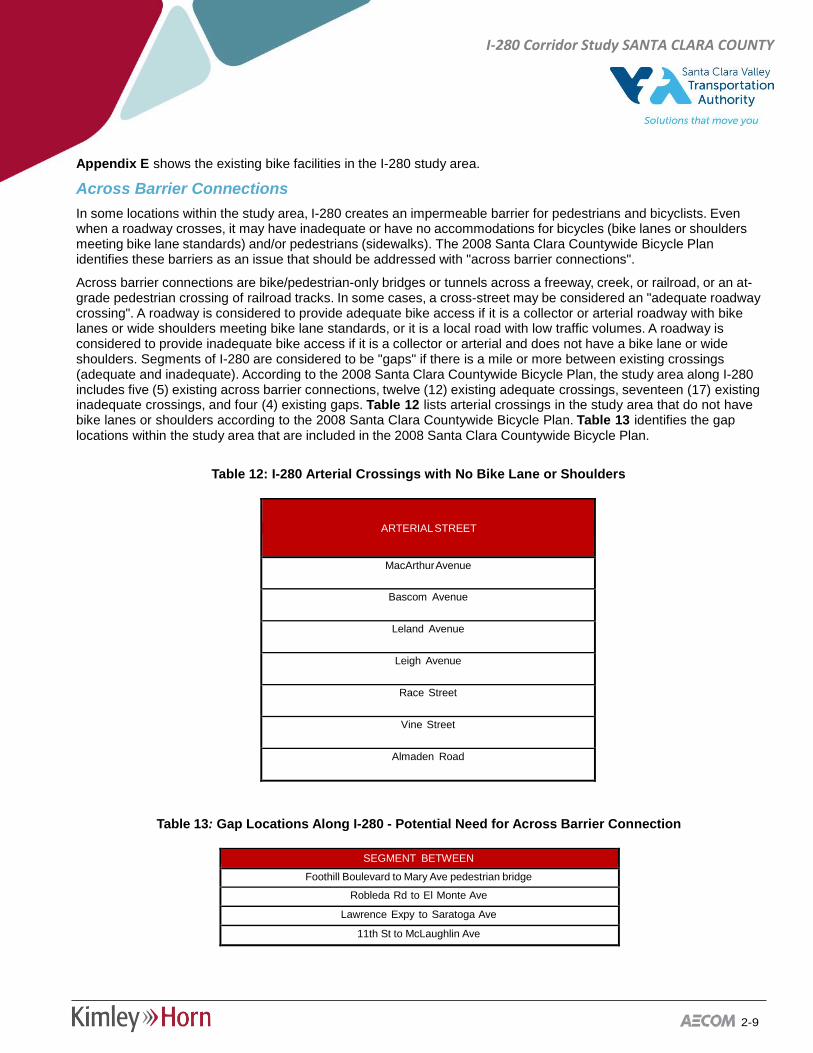
Across barrier connections are bike/pedestrian-only bridges or tunnels across a freeway, creek, or railroad, or an at-grade pedestrian crossing of railroad tracks. In some cases, a cross-street may be considered an "adequate roadway crossing". A roadway is considered to provide adequate bike access if it is a collector or arterial roadway with bike lanes or wide shoulders meeting bike lane standards, or it is a local road with low traffic volumes. A roadway is considered to provide inadequate bike access if it is a collector or arterial and does not have a bike lane or wide shoulders. Segments of I-280 are considered to be "gaps" if there is a mile or more between existing crossings (adequate and inadequate). According to the 2008 Santa Clara Countywide Bicycle Plan, the study area along I-280 includes five (5) existing across barrier connections, twelve (12) existing adequate crossings, seventeen (17) existing inadequate crossings, and four (4) existing gaps. Table 12 lists arterial crossings in the study area that do not have bike lanes or shoulders according to the 2008 Santa Clara Countywide Bicycle Plan. Table 13 identifies the gap locations within the study area that are included in the 2008 Santa Clara Countywide Bicycle Plan.
Table 12: I-280 Arterial Crossings with No Bike Lane or Shoulders
ARTERIAL STREET
MacArthur Avenue
Bascom Avenue
Leland Avenue
Leigh Avenue
Race Street
Vine Street
Almaden Road
Table 13: Gap Locations Along I-280 - Potential Need for Across Barrier Connection
SEGMENT BETWEEN
Foothill Boulevard to Mary Ave pedestrian bridge
Robleda Rd to El Monte Ave
Lawrence Expy to Saratoga Ave
11th St to McLaughlin Ave
2-10
I-280 Corridor Study SANTA CLARA COUNTY
PEDESTRIAN FACILITIES
Pedestrian facilities consist of sidewalks, bridges, crosswalks, and pedestrian signals. Along the I-280 corridor study area, there are four pedestrian overcrossings. These overcrossings are shown in Figure 1 and listed below.
I-280 Pedestrian Overcrossing Locations:
• 0.30 miles east of SR-85 (Don Burnett Bicycle Pedestrian Bridge)
• 0.18 miles east of San Tomas Expressway
• 0.17 miles west of I-880
• 0.27 miles east of Leigh Avenue
Aside from pedestrian overcrossings, many of the streets crossing I-280 have existing sidewalks for pedestrians. Table 14 summarizes the existing sidewalks at each cross street within the study area
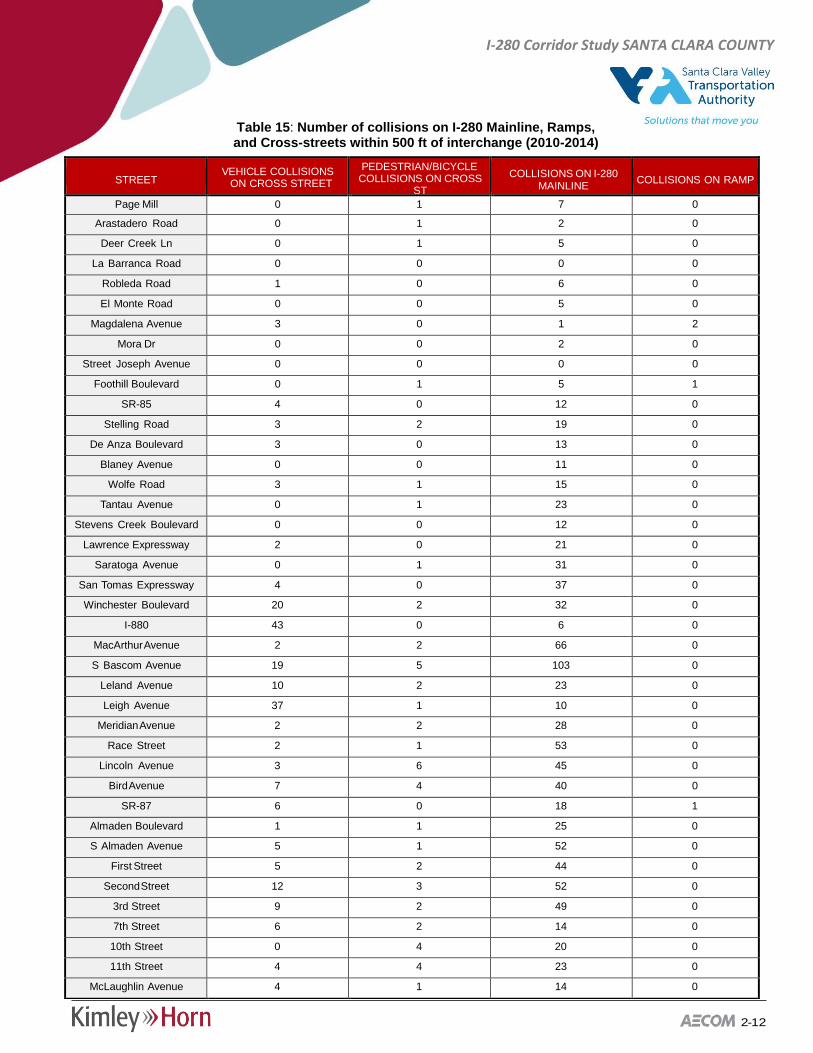
COLLISION DATA
Collision data was gathered from the Statewide Integrated Traffic Records System (SWITRS). This corridor study looked at five (5) years of collision data within 500 ft of each interchange. This included collisions on the mainline, on-ramps, off-ramps, and cross-streets. The most recent five-year span with available data is 2010- 2014. The data shows a higher concentration
of collisions along the eastern portion of the study corridor. S Bascom Avenue has the highest number of vehicle collisions within 500 feet of the interchange with 122. The cross street with the highest number of pedestrian/bicycle collisions from 2010-2014 is Lincoln Avenue with 6. The complete data is shown in Table 15. Appendix F shows the distribution of collisions along the I-280 corridor study.

2-11
I-280 Corridor Study SANTA CLARA COUNTY
Table 14: Existing Sidewalks
CROSS STREET
EXISTING SIDEWALKS -NORTH SIDE
WIDTH OF SIDEWALK - NORTH SIDE
(FT)
EXISTING SIDEWALKS - SOUTH SIDE
WIDTH OF SIDEWALK - SOUTH SIDE
(FT)
Page Mill Road No - Yes 6 Arastadero Road No - No - Deer Creek Ln No - No -
La Barranca Road Yes 5 No - Robleda Road No - No - El Monte Road Yes 5 Yes 5
Magdalena Avenue Yes 4 Yes 4 Mora Dr Yes 5 No -
Street Joseph Avenue No - No - Foothill Boulevard No - Yes 5
SR-85 No - No - Stelling Road Yes 6 Yes 6
De Anza Boulevard Yes 5 Yes 5 Blaney Avenue Yes 5 Yes 5
Wolfe Road Yes 6 Yes 5 Tantau Avenue Yes 5 Yes 5
Stevens Creek Boulevard Yes 5 Yes 5 Lawrence Expressway No - Yes 5
Saratoga Avenue Yes 5 No - San Tomas Expressway Yes 5 No - Winchester Boulevard Yes 7 Yes 8
I-880 No - No - MacArthur Avenue Yes 5 Yes 5 S Bascom Avenue Yes 5 Yes 5
Leland Avenue Yes 6 Yes 6 Leigh Avenue Yes 5 Yes 5
Meridian Avenue No - No - Race Street Yes 6 Yes 6
Lincoln Avenue Yes 5 Yes 5 Bird Avenue Yes 5 Yes 4
SR-87 No - No - Almaden Boulevard Yes 9 No - S Almaden Avenue No - Yes 10
S First Street Yes 8 Yes 9 S Second Street Yes 5 Yes 8
S 3rd Street Yes 5 Yes 5 S 7th Street Yes 6 Yes 6
10th Yes 6 Yes 6 S 11th Street Yes 6 Yes 6
McLaughlin Avenue Yes 5 Yes 6
2-12
I-280 Corridor Study SANTA CLARA COUNTY
Table 15: Number of collisions on I-280 Mainline, Ramps, and Cross-streets within 500 ft of interchange (2010-2014)
STREET
VEHICLE COLLISIONS ON CROSS STREET
PEDESTRIAN/BICYCLE COLLISIONS ON CROSS
ST
COLLISIONS ON I-280
MAINLINE
COLLISIONS ON RAMP
Page Mill 0 1 7 0
Arastadero Road 0 1 2 0
Deer Creek Ln 0 1 5 0
La Barranca Road 0 0 0 0
Robleda Road 1 0 6 0
El Monte Road 0 0 5 0
Magdalena Avenue 3 0 1 2
Mora Dr 0 0 2 0
Street Joseph Avenue 0 0 0 0
Foothill Boulevard 0 1 5 1
SR-85 4 0 12 0
Stelling Road 3 2 19 0
De Anza Boulevard 3 0 13 0
Blaney Avenue 0 0 11 0
Wolfe Road 3 1 15 0
Tantau Avenue 0 1 23 0
Stevens Creek Boulevard 0 0 12 0
Lawrence Expressway 2 0 21 0
Saratoga Avenue 0 1 31 0
San Tomas Expressway 4 0 37 0
Winchester Boulevard 20 2 32 0
I-880 43 0 6 0
MacArthur Avenue 2 2 66 0
S Bascom Avenue 19 5 103 0
Leland Avenue 10 2 23 0
Leigh Avenue 37 1 10 0
Meridian Avenue 2 2 28 0
Race Street 2 1 53 0
Lincoln Avenue 3 6 45 0
Bird Avenue 7 4 40 0
SR-87 6 0 18 1
Almaden Boulevard 1 1 25 0
S Almaden Avenue 5 1 52 0
First Street 5 2 44 0
Second Street 12 3 52 0
3rd Street 9 2 49 0
7th Street 6 2 14 0
10th Street 0 4 20 0
11th Street 4 4 23 0
McLaughlin Avenue 4 1 14 0

2-13
SANTA CLARA COUNTY I-280 CORRIDOR STUDY
Appendix A – Ramp Metering Data
SANTA CLARA VALLEY TRANSPORTATION AUTHORITY (VTA)
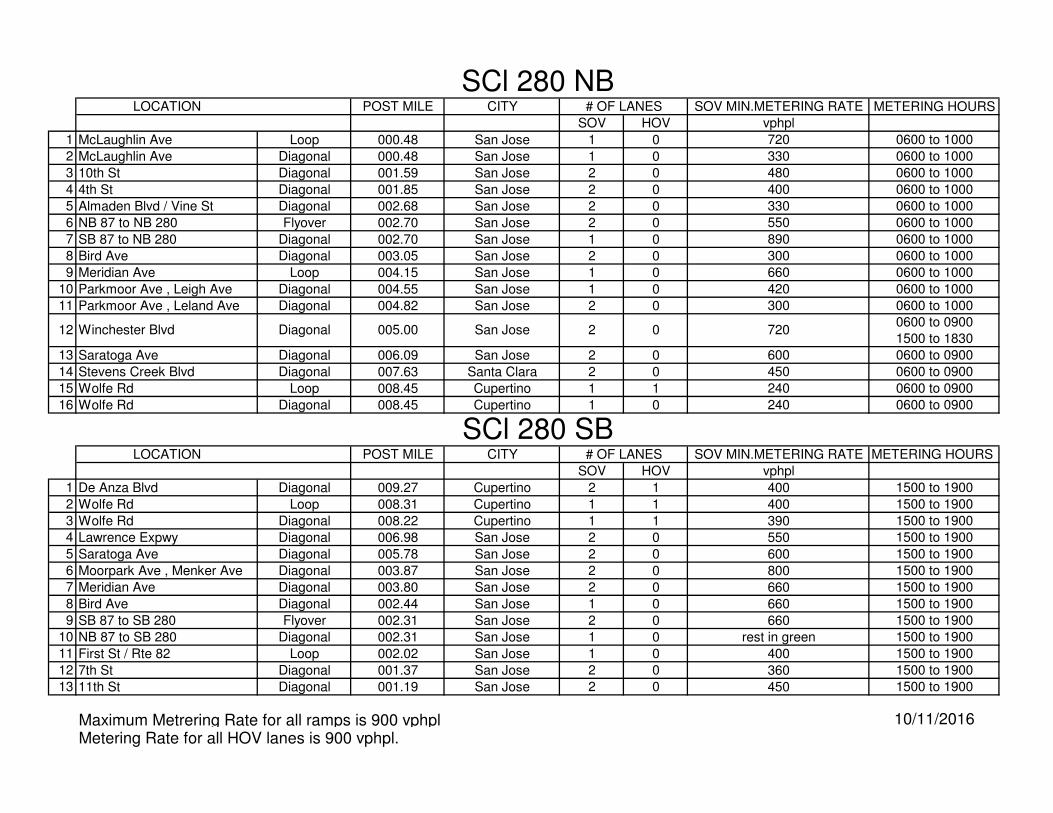
LOCATION POST MILE CITY SOV MIN.METERING RATE METERING HOURS
SOV HOV vphpl
1 McLaughlin Ave Loop 000.48 San Jose 1 0 720 0600 to 1000
2 McLaughlin Ave Diagonal 000.48 San Jose 1 0 330 0600 to 1000
3 10th St Diagonal 001.59 San Jose 2 0 480 0600 to 1000
4 4th St Diagonal 001.85 San Jose 2 0 400 0600 to 1000
5 Almaden Blvd / Vine St Diagonal 002.68 San Jose 2 0 330 0600 to 1000
6 NB 87 to NB 280 Flyover 002.70 San Jose 2 0 550 0600 to 1000
7 SB 87 to NB 280 Diagonal 002.70 San Jose 1 0 890 0600 to 1000
8 Bird Ave Diagonal 003.05 San Jose 2 0 300 0600 to 1000
9 Meridian Ave Loop 004.15 San Jose 1 0 660 0600 to 1000
10 Parkmoor Ave , Leigh Ave Diagonal 004.55 San Jose 1 0 420 0600 to 1000
11 Parkmoor Ave , Leland Ave Diagonal 004.82 San Jose 2 0 300 0600 to 1000
0600 to 0900
1500 to 1830
13 Saratoga Ave Diagonal 006.09 San Jose 2 0 600 0600 to 0900
14 Stevens Creek Blvd Diagonal 007.63 Santa Clara 2 0 450 0600 to 0900
15 Wolfe Rd Loop 008.45 Cupertino 1 1 240 0600 to 0900
16 Wolfe Rd Diagonal 008.45 Cupertino 1 0 240 0600 to 0900
LOCATION POST MILE CITY SOV MIN.METERING RATE METERING HOURS
SOV HOV vphpl
1 De Anza Blvd Diagonal 009.27 Cupertino 2 1 400 1500 to 1900
2 Wolfe Rd Loop 008.31 Cupertino 1 1 400 1500 to 1900
3 Wolfe Rd Diagonal 008.22 Cupertino 1 1 390 1500 to 1900
4 Lawrence Expwy Diagonal 006.98 San Jose 2 0 550 1500 to 1900
5 Saratoga Ave Diagonal 005.78 San Jose 2 0 600 1500 to 1900
6 Moorpark Ave , Menker Ave Diagonal 003.87 San Jose 2 0 800 1500 to 1900
7 Meridian Ave Diagonal 003.80 San Jose 2 0 660 1500 to 1900
8 Bird Ave Diagonal 002.44 San Jose 1 0 660 1500 to 1900
9 SB 87 to SB 280 Flyover 002.31 San Jose 2 0 660 1500 to 1900
10 NB 87 to SB 280 Diagonal 002.31 San Jose 1 0 rest in green 1500 to 1900
11 First St / Rte 82 Loop 002.02 San Jose 1 0 400 1500 to 1900
12 7th St Diagonal 001.37 San Jose 2 0 360 1500 to 1900
13 11th St Diagonal 001.19 San Jose 2 0 450 1500 to 1900
Maximum Metrering Rate for all ramps is 900 vphpl 10/11/2016
Metering Rate for all HOV lanes is 900 vphpl.
12
# OF LANES
# OF LANES
SCl 280 NB
SCl 280 SB
Winchester Blvd Diagonal 005.00 San Jose 2 7200
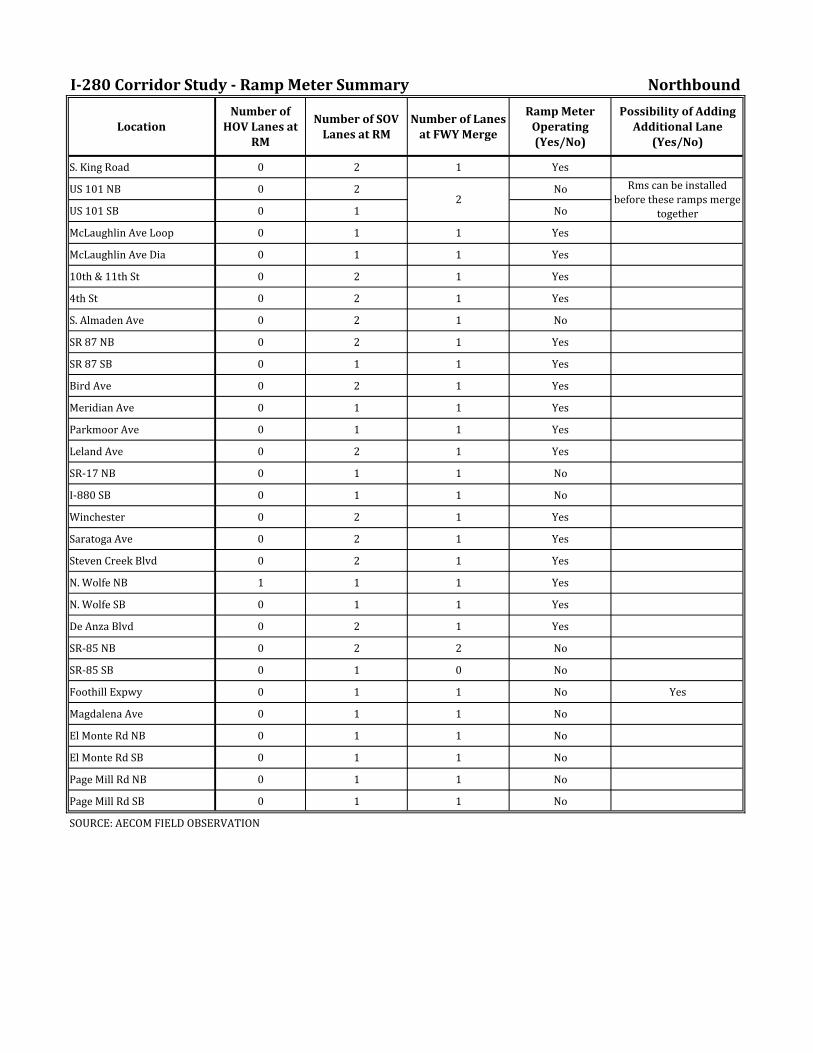
I-280 Corridor Study - Ramp Meter Summary Northbound
Location
Number of
HOV Lanes at
RM
Number of SOV
Lanes at RM
Number of Lanes
at FWY Merge
Ramp Meter
Operating
(Yes/No)
Possibility of Adding
Additional Lane
(Yes/No)
S. King Road 0 2 1 Yes
US 101 NB 0 2 No
US 101 SB 0 1 No
McLaughlin Ave Loop 0 1 1 Yes
McLaughlin Ave Dia 0 1 1 Yes
10th & 11th St 0 2 1 Yes
4th St 0 2 1 Yes
S. Almaden Ave 0 2 1 No
SR 87 NB 0 2 1 Yes
SR 87 SB 0 1 1 Yes
Bird Ave 0 2 1 Yes
Meridian Ave 0 1 1 Yes
Parkmoor Ave 0 1 1 Yes
Leland Ave 0 2 1 Yes
SR-17 NB 0 1 1 No
I-880 SB 0 1 1 No
Winchester 0 2 1 Yes
Saratoga Ave 0 2 1 Yes
Steven Creek Blvd 0 2 1 Yes
N. Wolfe NB 1 1 1 Yes
N. Wolfe SB 0 1 1 Yes
De Anza Blvd 0 2 1 Yes
SR-85 NB 0 2 2 No
SR-85 SB 0 1 0 No
Foothill Expwy 0 1 1 No Yes
Magdalena Ave 0 1 1 No
El Monte Rd NB 0 1 1 No
El Monte Rd SB 0 1 1 No
Page Mill Rd NB 0 1 1 No
Page Mill Rd SB 0 1 1 No
SOURCE: AECOM FIELD OBSERVATION
2
Rms can be installed
before these ramps merge
together
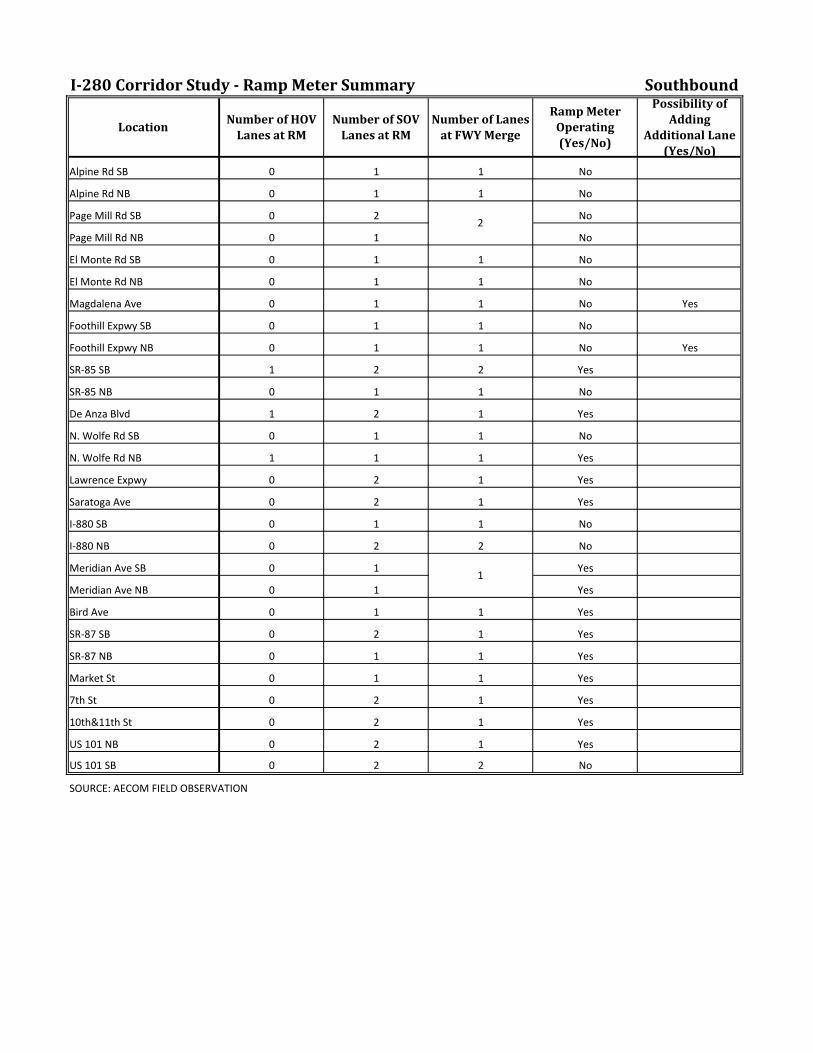
I‐280CorridorStudy‐RampMeterSummary Southbound
LocationNumberofHOVLanesatRM
NumberofSOVLanesatRM
NumberofLanesatFWYMerge
RampMeterOperating(Yes/No)
PossibilityofAdding
AdditionalLane(Yes/No)
Alpine Rd SB 0 1 1 No
Alpine Rd NB 0 1 1 No
Page Mill Rd SB 0 2 No
Page Mill Rd NB 0 1 No
El Monte Rd SB 0 1 1 No
El Monte Rd NB 0 1 1 No
Magdalena Ave 0 1 1 No Yes
Foothill Expwy SB 0 1 1 No
Foothill Expwy NB 0 1 1 No Yes
SR‐85 SB 1 2 2 Yes
SR‐85 NB 0 1 1 No
De Anza Blvd 1 2 1 Yes
N. Wolfe Rd SB 0 1 1 No
N. Wolfe Rd NB 1 1 1 Yes
Lawrence Expwy 0 2 1 Yes
Saratoga Ave 0 2 1 Yes
I‐880 SB 0 1 1 No
I‐880 NB 0 2 2 No
Meridian Ave SB 0 1 Yes
Meridian Ave NB 0 1 Yes
Bird Ave 0 1 1 Yes
SR‐87 SB 0 2 1 Yes
SR‐87 NB 0 1 1 Yes
Market St 0 1 1 Yes
7th St 0 2 1 Yes
10th&11th St 0 2 1 Yes
US 101 NB 0 2 1 Yes
US 101 SB 0 2 2 No
SOURCE: AECOM FIELD OBSERVATION
1
2

2-13
SANTA CLARA COUNTY I-280 CORRIDOR STUDY
Appendix B – Traffic Flow Diagram
SANTA CLARA VALLEY TRANSPORTATION AUTHORITY (VTA)
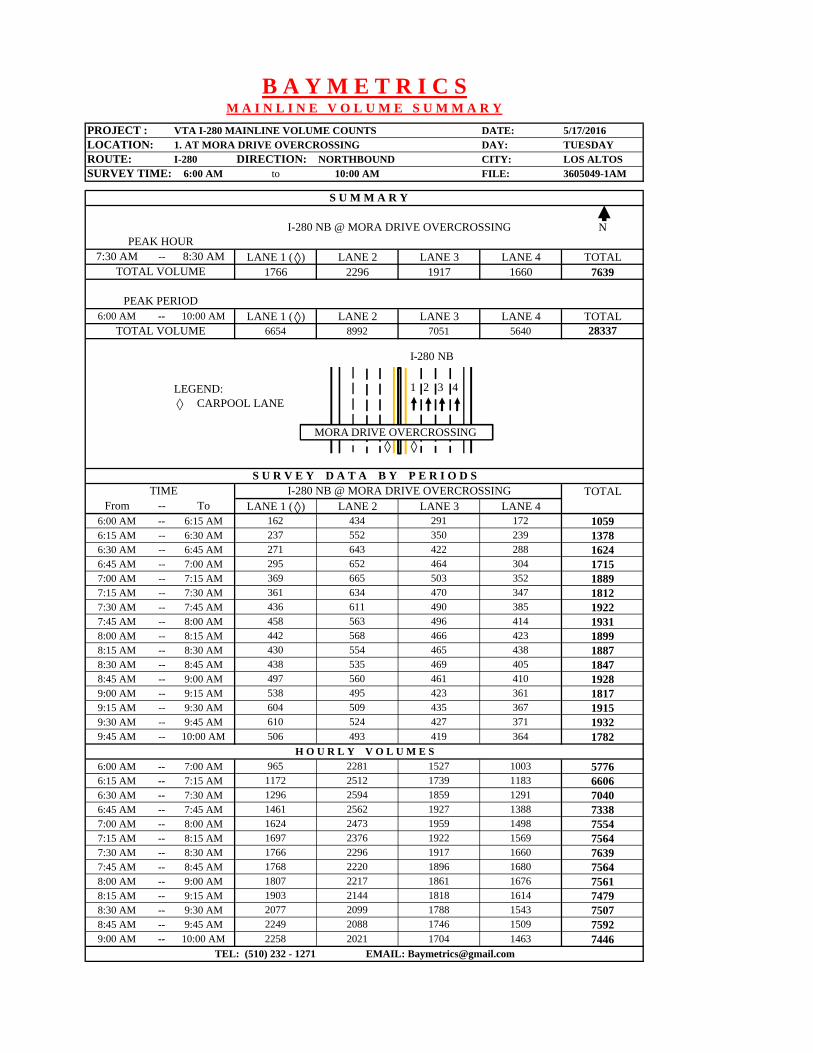
PROJECT : VTA I-280 MAINLINE VOLUME COUNTS DATE: 5/17/2016LOCATION: 1. AT MORA DRIVE OVERCROSSING DAY: TUESDAYROUTE: I-280 DIRECTION: NORTHBOUND CITY: LOS ALTOSSURVEY TIME: 6:00 AM to 10:00 AM FILE: 3605049-1AM
N
7:30 AM -- 8:30 AM LANE 1 ( ) LANE 2 LANE 3 LANE 4 TOTAL1766 2296 1917 1660 7639
6:00 AM -- 10:00 AM LANE 1 ( ) LANE 2 LANE 3 LANE 4 TOTAL6654 8992 7051 5640 28337
LEGEND: CARPOOL LANE
TIME TOTALFrom -- To LANE 1 ( ) LANE 2 LANE 3 LANE 4
6:00 AM -- 6:15 AM 162 434 291 172 10596:15 AM -- 6:30 AM 237 552 350 239 13786:30 AM -- 6:45 AM 271 643 422 288 16246:45 AM -- 7:00 AM 295 652 464 304 17157:00 AM -- 7:15 AM 369 665 503 352 18897:15 AM -- 7:30 AM 361 634 470 347 18127:30 AM -- 7:45 AM 436 611 490 385 19227:45 AM -- 8:00 AM 458 563 496 414 19318:00 AM -- 8:15 AM 442 568 466 423 18998:15 AM -- 8:30 AM 430 554 465 438 18878:30 AM -- 8:45 AM 438 535 469 405 18478:45 AM -- 9:00 AM 497 560 461 410 19289:00 AM -- 9:15 AM 538 495 423 361 18179:15 AM -- 9:30 AM 604 509 435 367 19159:30 AM -- 9:45 AM 610 524 427 371 19329:45 AM -- 10:00 AM 506 493 419 364 1782
6:00 AM -- 7:00 AM 965 2281 1527 1003 57766:15 AM -- 7:15 AM 1172 2512 1739 1183 66066:30 AM -- 7:30 AM 1296 2594 1859 1291 70406:45 AM -- 7:45 AM 1461 2562 1927 1388 73387:00 AM -- 8:00 AM 1624 2473 1959 1498 75547:15 AM -- 8:15 AM 1697 2376 1922 1569 75647:30 AM -- 8:30 AM 1766 2296 1917 1660 76397:45 AM -- 8:45 AM 1768 2220 1896 1680 75648:00 AM -- 9:00 AM 1807 2217 1861 1676 75618:15 AM -- 9:15 AM 1903 2144 1818 1614 74798:30 AM -- 9:30 AM 2077 2099 1788 1543 75078:45 AM -- 9:45 AM 2249 2088 1746 1509 75929:00 AM -- 10:00 AM 2258 2021 1704 1463 7446
B A Y M E T R I C SM A I N L I N E V O L U M E S U M M A R Y
TEL: (510) 232 - 1271 EMAIL: [email protected]
S U M M A R Y
PEAK HOUR
H O U R L Y V O L U M E S
S U R V E Y D A T A B Y P E R I O D SI-280 NB @ MORA DRIVE OVERCROSSING
I-280 NB @ MORA DRIVE OVERCROSSING
PEAK PERIOD
TOTAL VOLUME
TOTAL VOLUME
1 2 3 4
I-280 NB
MORA DRIVE OVERCROSSING
PROJECT : VTA I-280 MAINLINE VOLUME COUNTS DATE:
LOCATION: 2. AT PEDESTRIAN OVERCROSSING WEST OF I-880 DAY:
ROUTE: I-280 DIRECTION: NORTHBOUND CITY:SURVEY TIME: 6:00 AM to 10:00 AM FILE:
N
6:15 AM -- 7:15 AM LANE 1 ( ) LANE 2 LANE 3 LANE 4 L5 (ONRAMP) TOTAL1413 1792 1478 1197 1323 7203
6:00 AM -- 10:00 AM LANE 1 ( ) LANE 2 LANE 3 LANE 4 LANE 5 (ON) TOTAL5605 6006 4816 4134 4094 24655
LEGEND: CARPOOL LANE
TIME TOTALFrom -- To LANE 1 ( ) LANE 2 LANE 3 LANE 4 L5 (ONRAMP)
6:00 AM -- 6:15 AM 217 624 258 158 204 14616:15 AM -- 6:30 AM 331 547 383 265 283 18096:30 AM -- 6:45 AM 350 437 392 350 367 18966:45 AM -- 7:00 AM 366 438 362 310 354 18307:00 AM -- 7:15 AM 366 370 341 272 319 16687:15 AM -- 7:30 AM 379 316 349 285 237 15667:30 AM -- 7:45 AM 367 331 277 249 250 14747:45 AM -- 8:00 AM 355 339 283 282 207 14668:00 AM -- 8:15 AM 282 257 233 235 187 11948:15 AM -- 8:30 AM 356 354 244 237 196 13878:30 AM -- 8:45 AM 342 302 256 229 199 13288:45 AM -- 9:00 AM 357 291 231 215 202 12969:00 AM -- 9:15 AM 356 331 285 267 254 14939:15 AM -- 9:30 AM 379 334 277 265 272 15279:30 AM -- 9:45 AM 372 339 284 271 266 15329:45 AM -- 10:00 AM 430 396 361 244 297 1728
6:00 AM -- 7:00 AM 1264 2046 1395 1083 1208 69966:15 AM -- 7:15 AM 1413 1792 1478 1197 1323 72036:30 AM -- 7:30 AM 1461 1561 1444 1217 1277 69606:45 AM -- 7:45 AM 1478 1455 1329 1116 1160 65387:00 AM -- 8:00 AM 1467 1356 1250 1088 1013 61747:15 AM -- 8:15 AM 1383 1243 1142 1051 881 57007:30 AM -- 8:30 AM 1360 1281 1037 1003 840 55217:45 AM -- 8:45 AM 1335 1252 1016 983 789 53758:00 AM -- 9:00 AM 1337 1204 964 916 784 52058:15 AM -- 9:15 AM 1411 1278 1016 948 851 55048:30 AM -- 9:30 AM 1434 1258 1049 976 927 56448:45 AM -- 9:45 AM 1464 1295 1077 1018 994 58489:00 AM -- 10:00 AM 1537 1400 1207 1047 1089 6280
PEAK PERIOD
TOTAL VOLUME
S U R V E Y D A T A B Y P E R I O D SI-280 NB @ PEDESTRIAN OVERCROSSING
H O U R L Y V O L U M E S
TEL: (510) 232 - 1271 EMAIL: [email protected]
3605049-2AM
S U M M A R Y
I-280 NB @ PEDESTRIAN OVERCROSSINGPEAK HOUR (WEST OF I-880 & SR-17)
TOTAL VOLUME
B A Y M E T R I C SM A I N L I N E V O L U M E S U M M A R Y
5/17/2016
TUESSDAY
SAN JOSE
1 2 3 4
I-280 NB
PEDESTRIAN OVERCROSSING
5
PROJECT : VTA I-280 MAINLINE VOLUME COUNTS DATE: 5/17/2016
LOCATION: 3. AT MORA DRIVE OVERCROSSING DAY: TUESDAY
ROUTE: I-280 DIRECTION: SOUTHBOUND CITY: LOS ALTOSSURVEY TIME: 3:00 PM to 7:00 PM FILE: 3605049-3PM
N
3:15 PM -- 4:15 PM LANE 1 ( ) LANE 2 LANE 3 LANE 4 TOTAL1042 2143 1859 1431 6475
3:00 PM -- 7:00 PM LANE 1 ( ) LANE 2 LANE 3 LANE 4 TOTAL4198 8186 7321 5818 25523
LEGEND: CARPOOL LANE
TIME TOTALFrom -- To LANE 1 ( ) LANE 2 LANE 3 LANE 4
3:00 PM -- 3:15 PM 208 523 484 337 15523:15 PM -- 3:30 PM 246 514 460 360 15803:30 PM -- 3:45 PM 247 606 464 364 16813:45 PM -- 4:00 PM 262 513 457 371 16034:00 PM -- 4:15 PM 287 510 478 336 16114:15 PM -- 4:30 PM 261 477 423 360 15214:30 PM -- 4:45 PM 300 502 437 373 16124:45 PM -- 5:00 PM 288 509 466 374 16375:00 PM -- 5:15 PM 228 469 452 324 14735:15 PM -- 5:30 PM 276 511 462 358 16075:30 PM -- 5:45 PM 292 514 458 373 16375:45 PM -- 6:00 PM 264 485 441 398 15886:00 PM -- 6:15 PM 266 484 459 361 15706:15 PM -- 6:30 PM 243 492 460 373 15686:30 PM -- 6:45 PM 235 529 458 381 16036:45 PM -- 7:00 PM 295 548 462 375 1680
3:00 PM -- 4:00 PM 963 2156 1865 1432 64163:15 PM -- 4:15 PM 1042 2143 1859 1431 64753:30 PM -- 4:30 PM 1057 2106 1822 1431 64163:45 PM -- 4:45 PM 1110 2002 1795 1440 63474:00 PM -- 5:00 PM 1136 1998 1804 1443 63814:15 PM -- 5:15 PM 1077 1957 1778 1431 62434:30 PM -- 5:30 PM 1092 1991 1817 1429 63294:45 PM -- 5:45 PM 1084 2003 1838 1429 63545:00 PM -- 6:00 PM 1060 1979 1813 1453 63055:15 PM -- 6:15 PM 1098 1994 1820 1490 64025:30 PM -- 6:30 PM 1065 1975 1818 1505 63635:45 PM -- 6:45 PM 1008 1990 1818 1513 63296:00 PM -- 7:00 PM 1039 2053 1839 1490 6421
TEL: (510) 232 - 1271 EMAIL: [email protected]
TOTAL VOLUME
PEAK PERIOD
TOTAL VOLUME
S U R V E Y D A T A B Y P E R I O D SI-280 SB @ MORA DRIVE OVERCROSSING
H O U R L Y V O L U M E S
B A Y M E T R I C SM A I N L I N E V O L U M E S U M M A R Y
S U M M A R Y
I-280 SB @ MORA DRIVE OVERCROSSINGPEAK HOUR
1234
I-280 SB
MORA DRIVE OVERCROSSING

PROJECT : VTA I-280 MAINLINE VOLUME COUNTS DATE: 5/17/2016LOCATION: 4. AT BASCOM AVENUE OVERCROSSING DAY: TUESDAYROUTE: I-280 DIRECTION: SOUTHBOUND CITY: SAN JOSESURVEY TIME: 3:00 PM to 7:00 PM FILE: 3605049-4PM
N
4:15 PM -- 5:15 PM LANE 1 ( ) LANE 2 LANE 3 LANE 4 LANE 5 TOTAL1250 1262 1195 1297 1992 6996
3:00 PM -- 7:00 PM LANE 1 ( ) LANE 2 LANE 3 LANE 4 LANE 5 TOTAL4469 4709 4504 4823 7091 25596
LEGEND: CARPOOL LANE
TIME TOTALFrom -- To LANE 1 ( ) LANE 2 LANE 3 LANE 4 LANE 5
3:00 PM -- 3:15 PM 273 265 274 321 409 15423:15 PM -- 3:30 PM 269 269 249 327 418 15323:30 PM -- 3:45 PM 318 312 299 352 440 17213:45 PM -- 4:00 PM 260 259 298 302 379 14984:00 PM -- 4:15 PM 307 354 325 321 333 16404:15 PM -- 4:30 PM 346 392 360 338 436 18724:30 PM -- 4:45 PM 297 294 271 343 515 17204:45 PM -- 5:00 PM 286 278 267 300 501 16325:00 PM -- 5:15 PM 321 298 297 316 540 17725:15 PM -- 5:30 PM 268 241 237 259 516 15215:30 PM -- 5:45 PM 228 220 203 204 422 12775:45 PM -- 6:00 PM 269 245 232 240 483 14696:00 PM -- 6:15 PM 272 275 254 284 516 16016:15 PM -- 6:30 PM 315 297 279 306 474 16716:30 PM -- 6:45 PM 224 356 337 302 394 16136:45 PM -- 7:00 PM 216 354 322 308 315 1515
3:00 PM -- 4:00 PM 1120 1105 1120 1302 1646 62933:15 PM -- 4:15 PM 1154 1194 1171 1302 1570 63913:30 PM -- 4:30 PM 1231 1317 1282 1313 1588 67313:45 PM -- 4:45 PM 1210 1299 1254 1304 1663 67304:00 PM -- 5:00 PM 1236 1318 1223 1302 1785 68644:15 PM -- 5:15 PM 1250 1262 1195 1297 1992 69964:30 PM -- 5:30 PM 1172 1111 1072 1218 2072 66454:45 PM -- 5:45 PM 1103 1037 1004 1079 1979 62025:00 PM -- 6:00 PM 1086 1004 969 1019 1961 60395:15 PM -- 6:15 PM 1037 981 926 987 1937 58685:30 PM -- 6:30 PM 1084 1037 968 1034 1895 60185:45 PM -- 6:45 PM 1080 1173 1102 1132 1867 63546:00 PM -- 7:00 PM 1027 1282 1192 1200 1699 6400
TEL: (510) 232 - 1271 EMAIL: [email protected]
TOTAL VOLUME
PEAK PERIOD
TOTAL VOLUME
S U R V E Y D A T A B Y P E R I O D SI-280 SB @ BASCOM AVENUE OVERCROSSING
H O U R L Y V O L U M E S
B A Y M E T R I C SM A I N L I N E V O L U M E S U M M A R Y
P E A K H O U R S U M M A R Y
I-280 SB @ BASCOM AVENUE OVERCROSSINGPEAK HOUR
1234
I-280 SB
5
BASCOM AVENUE OVERCROSSING
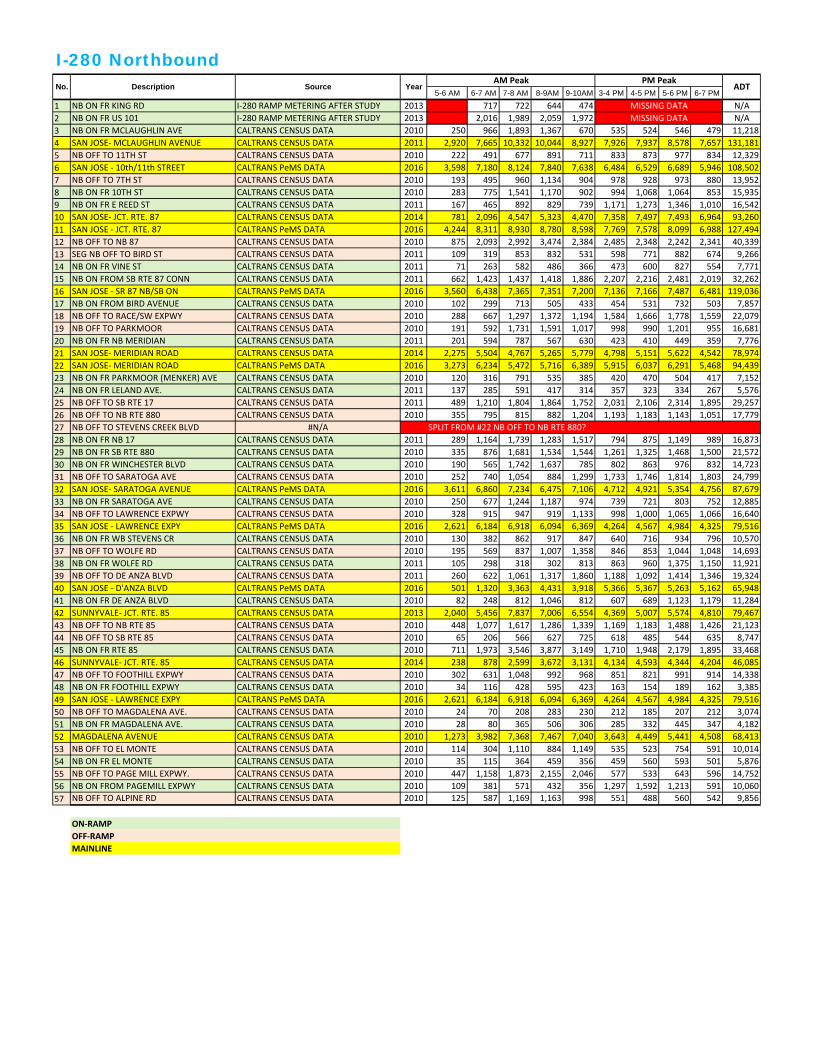
I-280 Northbound5-6 AM 6-7 AM 7-8 AM 8-9AM 9-10AM 3-4 PM 4-5 PM 5-6 PM 6-7 PM
1 NB ON FR KING RD I‐280 RAMP METERING AFTER STUDY 2013 0 717 722 644 474 N/A
2 NB ON FR US 101 I‐280 RAMP METERING AFTER STUDY 2013 0 2,016 1,989 2,059 1,972 N/A
3 NB ON FR MCLAUGHLIN AVE CALTRANS CENSUS DATA 2010 250 966 1,893 1,367 670 535 524 546 479 11,218
4 SAN JOSE‐ MCLAUGHLIN AVENUE CALTRANS CENSUS DATA 2011 2,920 7,665 10,332 10,044 8,927 7,926 7,937 8,578 7,657 131,181
5 NB OFF TO 11TH ST CALTRANS CENSUS DATA 2010 222 491 677 891 711 833 873 977 834 12,329
6 SAN JOSE ‐ 10th/11th STREET CALTRANS PeMS DATA 2016 3,598 7,180 8,124 7,840 7,638 6,484 6,529 6,689 5,946 108,502
7 NB OFF TO 7TH ST CALTRANS CENSUS DATA 2010 193 495 960 1,134 904 978 928 973 880 13,952
8 NB ON FR 10TH ST CALTRANS CENSUS DATA 2010 283 775 1,541 1,170 902 994 1,068 1,064 853 15,935
9 NB ON FR E REED ST CALTRANS CENSUS DATA 2011 167 465 892 829 739 1,171 1,273 1,346 1,010 16,542
10 SAN JOSE‐ JCT. RTE. 87 CALTRANS CENSUS DATA 2014 781 2,096 4,547 5,323 4,470 7,358 7,497 7,493 6,964 93,260
11 SAN JOSE ‐ JCT. RTE. 87 CALTRANS PeMS DATA 2016 4,244 8,311 8,930 8,780 8,598 7,769 7,578 8,099 6,988 127,494
12 NB OFF TO NB 87 CALTRANS CENSUS DATA 2010 875 2,093 2,992 3,474 2,384 2,485 2,348 2,242 2,341 40,339
13 SEG NB OFF TO BIRD ST CALTRANS CENSUS DATA 2011 109 319 853 832 531 598 771 882 674 9,266
14 NB ON FR VINE ST CALTRANS CENSUS DATA 2011 71 263 582 486 366 473 600 827 554 7,771
15 NB ON FROM SB RTE 87 CONN CALTRANS CENSUS DATA 2011 662 1,423 1,437 1,418 1,886 2,207 2,216 2,481 2,019 32,262
16 SAN JOSE ‐ SR 87 NB/SB ON CALTRANS PeMS DATA 2016 3,560 6,438 7,365 7,351 7,200 7,136 7,166 7,487 6,481 119,036
17 NB ON FROM BIRD AVENUE CALTRANS CENSUS DATA 2010 102 299 713 505 433 454 531 732 503 7,857
18 NB OFF TO RACE/SW EXPWY CALTRANS CENSUS DATA 2010 288 667 1,297 1,372 1,194 1,584 1,666 1,778 1,559 22,079
19 NB OFF TO PARKMOOR CALTRANS CENSUS DATA 2010 191 592 1,731 1,591 1,017 998 990 1,201 955 16,681
20 NB ON FR NB MERIDIAN CALTRANS CENSUS DATA 2011 201 594 787 567 630 423 410 449 359 7,776
21 SAN JOSE‐ MERIDIAN ROAD CALTRANS CENSUS DATA 2014 2,275 5,504 4,767 5,265 5,779 4,798 5,151 5,622 4,542 78,974
22 SAN JOSE‐ MERIDIAN ROAD CALTRANS PeMS DATA 2016 3,273 6,234 5,472 5,716 6,389 5,915 6,037 6,291 5,468 94,439
23 NB ON FR PARKMOOR (MENKER) AVE CALTRANS CENSUS DATA 2010 120 316 791 535 385 420 470 504 417 7,152
24 NB ON FR LELAND AVE. CALTRANS CENSUS DATA 2011 137 285 591 417 314 357 323 334 267 5,576
25 NB OFF TO SB RTE 17 CALTRANS CENSUS DATA 2011 489 1,210 1,804 1,864 1,752 2,031 2,106 2,314 1,895 29,257
26 NB OFF TO NB RTE 880 CALTRANS CENSUS DATA 2010 355 795 815 882 1,204 1,193 1,183 1,143 1,051 17,779
27 NB OFF TO STEVENS CREEK BLVD #N/A SPLIT FROM #22 NB OFF TO NB RTE 880?
28 NB ON FR NB 17 CALTRANS CENSUS DATA 2011 289 1,164 1,739 1,283 1,517 794 875 1,149 989 16,873
29 NB ON FR SB RTE 880 CALTRANS CENSUS DATA 2010 335 876 1,681 1,534 1,544 1,261 1,325 1,468 1,500 21,572
30 NB ON FR WINCHESTER BLVD CALTRANS CENSUS DATA 2010 190 565 1,742 1,637 785 802 863 976 832 14,723
31 NB OFF TO SARATOGA AVE CALTRANS CENSUS DATA 2010 252 740 1,054 884 1,299 1,733 1,746 1,814 1,803 24,799
32 SAN JOSE‐ SARATOGA AVENUE CALTRANS PeMS DATA 2016 3,611 6,860 7,234 6,475 7,106 4,712 4,921 5,354 4,756 87,679
33 NB ON FR SARATOGA AVE CALTRANS CENSUS DATA 2010 250 677 1,244 1,187 974 739 721 803 752 12,885
34 NB OFF TO LAWRENCE EXPWY CALTRANS CENSUS DATA 2010 328 915 947 919 1,133 998 1,000 1,065 1,066 16,640
35 SAN JOSE ‐ LAWRENCE EXPY CALTRANS PeMS DATA 2016 2,621 6,184 6,918 6,094 6,369 4,264 4,567 4,984 4,325 79,516
36 NB ON FR WB STEVENS CR CALTRANS CENSUS DATA 2010 130 382 862 917 847 640 716 934 796 10,570
37 NB OFF TO WOLFE RD CALTRANS CENSUS DATA 2010 195 569 837 1,007 1,358 846 853 1,044 1,048 14,693
38 NB ON FR WOLFE RD CALTRANS CENSUS DATA 2011 105 298 318 302 813 863 960 1,375 1,150 11,921
39 NB OFF TO DE ANZA BLVD CALTRANS CENSUS DATA 2011 260 622 1,061 1,317 1,860 1,188 1,092 1,414 1,346 19,324
40 SAN JOSE ‐ D'ANZA BLVD CALTRANS PeMS DATA 2016 501 1,320 3,363 4,431 3,918 5,366 5,367 5,263 5,162 65,948
41 NB ON FR DE ANZA BLVD CALTRANS CENSUS DATA 2010 82 248 812 1,046 812 607 689 1,123 1,179 11,284
42 SUNNYVALE‐ JCT. RTE. 85 CALTRANS CENSUS DATA 2013 2,040 5,456 7,837 7,006 6,554 4,369 5,007 5,574 4,810 79,467
43 NB OFF TO NB RTE 85 CALTRANS CENSUS DATA 2010 448 1,077 1,617 1,286 1,339 1,169 1,183 1,488 1,426 21,123
44 NB OFF TO SB RTE 85 CALTRANS CENSUS DATA 2010 65 206 566 627 725 618 485 544 635 8,747
45 NB ON FR RTE 85 CALTRANS CENSUS DATA 2010 711 1,973 3,546 3,877 3,149 1,710 1,948 2,179 1,895 33,468
46 SUNNYVALE‐ JCT. RTE. 85 CALTRANS CENSUS DATA 2014 238 878 2,599 3,672 3,131 4,134 4,593 4,344 4,204 46,085
47 NB OFF TO FOOTHILL EXPWY CALTRANS CENSUS DATA 2010 302 631 1,048 992 968 851 821 991 914 14,338
48 NB ON FR FOOTHILL EXPWY CALTRANS CENSUS DATA 2010 34 116 428 595 423 163 154 189 162 3,385
49 SAN JOSE ‐ LAWRENCE EXPY CALTRANS PeMS DATA 2016 2,621 6,184 6,918 6,094 6,369 4,264 4,567 4,984 4,325 79,516
50 NB OFF TO MAGDALENA AVE. CALTRANS CENSUS DATA 2010 24 70 208 283 230 212 185 207 212 3,074
51 NB ON FR MAGDALENA AVE. CALTRANS CENSUS DATA 2010 28 80 365 506 306 285 332 445 347 4,182
52 MAGDALENA AVENUE CALTRANS CENSUS DATA 2010 1,273 3,982 7,368 7,467 7,040 3,643 4,449 5,441 4,508 68,413
53 NB OFF TO EL MONTE CALTRANS CENSUS DATA 2010 114 304 1,110 884 1,149 535 523 754 591 10,014
54 NB ON FR EL MONTE CALTRANS CENSUS DATA 2010 35 115 364 459 356 459 560 593 501 5,876
55 NB OFF TO PAGE MILL EXPWY. CALTRANS CENSUS DATA 2010 447 1,158 1,873 2,155 2,046 577 533 643 596 14,752
56 NB ON FROM PAGEMILL EXPWY CALTRANS CENSUS DATA 2010 109 381 571 432 356 1,297 1,592 1,213 591 10,060
57 NB OFF TO ALPINE RD CALTRANS CENSUS DATA 2010 125 587 1,169 1,163 998 551 488 560 542 9,856
ON‐RAMP
OFF‐RAMP
MAINLINE
ADTDescription
MISSING DATA
MISSING DATA
SourceAM Peak
No.PM Peak
Year
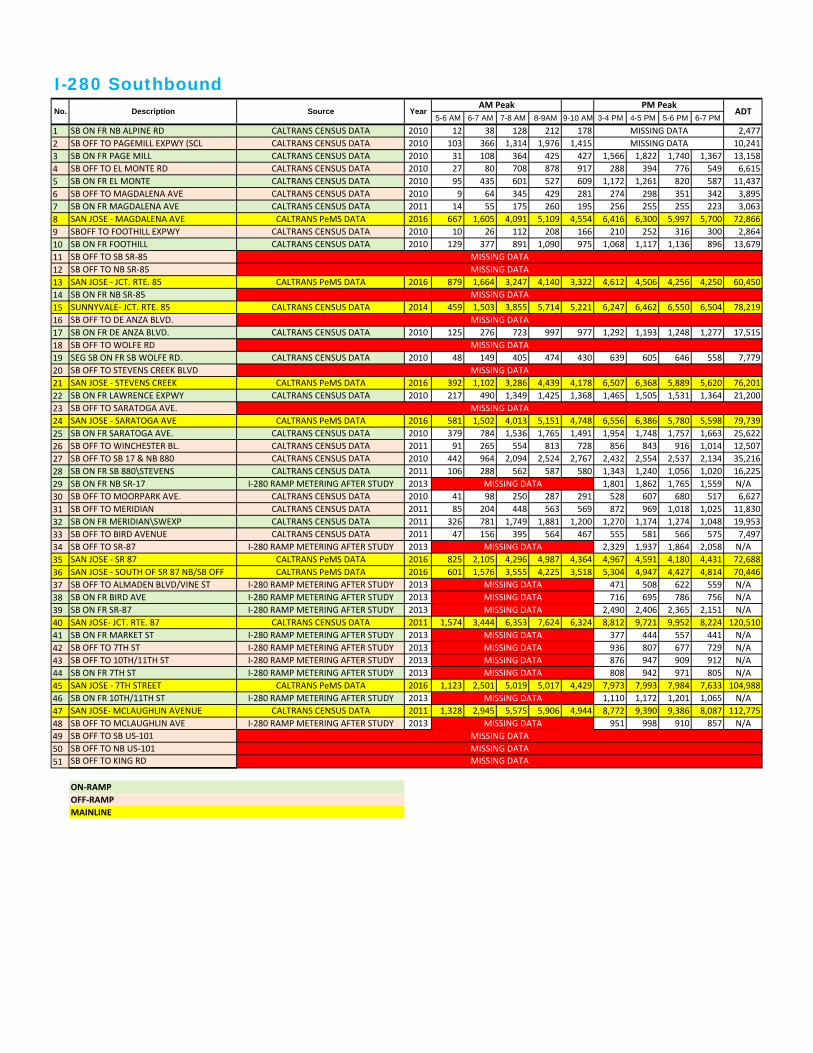
I-280 Southbound
5-6 AM 6-7 AM 7-8 AM 8-9AM 9-10 AM 3-4 PM 4-5 PM 5-6 PM 6-7 PM
1 SB ON FR NB ALPINE RD CALTRANS CENSUS DATA 2010 12 38 128 212 178 2,477
2 SB OFF TO PAGEMILL EXPWY (SCL CALTRANS CENSUS DATA 2010 103 366 1,314 1,976 1,415 10,241
3 SB ON FR PAGE MILL CALTRANS CENSUS DATA 2010 31 108 364 425 427 1,566 1,822 1,740 1,367 13,158
4 SB OFF TO EL MONTE RD CALTRANS CENSUS DATA 2010 27 80 708 878 917 288 394 776 549 6,615
5 SB ON FR EL MONTE CALTRANS CENSUS DATA 2010 95 435 601 527 609 1,172 1,261 820 587 11,437
6 SB OFF TO MAGDALENA AVE CALTRANS CENSUS DATA 2010 9 64 345 429 281 274 298 351 342 3,895
7 SB ON FR MAGDALENA AVE CALTRANS CENSUS DATA 2011 14 55 175 260 195 256 255 255 223 3,063
8 SAN JOSE ‐ MAGDALENA AVE CALTRANS PeMS DATA 2016 667 1,605 4,091 5,109 4,554 6,416 6,300 5,997 5,700 72,866
9 SBOFF TO FOOTHILL EXPWY CALTRANS CENSUS DATA 2010 10 26 112 208 166 210 252 316 300 2,864
10 SB ON FR FOOTHILL CALTRANS CENSUS DATA 2010 129 377 891 1,090 975 1,068 1,117 1,136 896 13,679
11 SB OFF TO SB SR‐85
12 SB OFF TO NB SR‐85
13 SAN JOSE ‐ JCT. RTE. 85 CALTRANS PeMS DATA 2016 879 1,664 3,247 4,140 3,322 4,612 4,506 4,256 4,250 60,450
14 SB ON FR NB SR‐85
15 SUNNYVALE‐ JCT. RTE. 85 CALTRANS CENSUS DATA 2014 459 1,503 3,855 5,714 5,221 6,247 6,462 6,550 6,504 78,219
16 SB OFF TO DE ANZA BLVD.
17 SB ON FR DE ANZA BLVD. CALTRANS CENSUS DATA 2010 125 276 723 997 977 1,292 1,193 1,248 1,277 17,515
18 SB OFF TO WOLFE RD
19 SEG SB ON FR SB WOLFE RD. CALTRANS CENSUS DATA 2010 48 149 405 474 430 639 605 646 558 7,779
20 SB OFF TO STEVENS CREEK BLVD
21 SAN JOSE ‐ STEVENS CREEK CALTRANS PeMS DATA 2016 392 1,102 3,286 4,439 4,178 6,507 6,368 5,889 5,620 76,201
22 SB ON FR LAWRENCE EXPWY CALTRANS CENSUS DATA 2010 217 490 1,349 1,425 1,368 1,465 1,505 1,531 1,364 21,200
23 SB OFF TO SARATOGA AVE.
24 SAN JOSE ‐ SARATOGA AVE CALTRANS PeMS DATA 2016 581 1,502 4,013 5,151 4,748 6,556 6,386 5,780 5,598 79,739
25 SB ON FR SARATOGA AVE. CALTRANS CENSUS DATA 2010 379 784 1,536 1,765 1,491 1,954 1,748 1,757 1,663 25,622
26 SB OFF TO WINCHESTER BL. CALTRANS CENSUS DATA 2011 91 265 554 813 728 856 843 916 1,014 12,507
27 SB OFF TO SB 17 & NB 880 CALTRANS CENSUS DATA 2010 442 964 2,094 2,524 2,767 2,432 2,554 2,537 2,134 35,216
28 SB ON FR SB 880\STEVENS CALTRANS CENSUS DATA 2011 106 288 562 587 580 1,343 1,240 1,056 1,020 16,225
29 SB ON FR NB SR‐17 I‐280 RAMP METERING AFTER STUDY 2013 1,801 1,862 1,765 1,559 N/A
30 SB OFF TO MOORPARK AVE. CALTRANS CENSUS DATA 2010 41 98 250 287 291 528 607 680 517 6,627
31 SB OFF TO MERIDIAN CALTRANS CENSUS DATA 2011 85 204 448 563 569 872 969 1,018 1,025 11,830
32 SB ON FR MERIDIAN\SWEXP CALTRANS CENSUS DATA 2011 326 781 1,749 1,881 1,200 1,270 1,174 1,274 1,048 19,953
33 SB OFF TO BIRD AVENUE CALTRANS CENSUS DATA 2011 47 156 395 564 467 555 581 566 575 7,497
34 SB OFF TO SR‐87 I‐280 RAMP METERING AFTER STUDY 2013 2,329 1,937 1,864 2,058 N/A
35 SAN JOSE ‐ SR 87 CALTRANS PeMS DATA 2016 825 2,105 4,296 4,987 4,364 4,967 4,591 4,180 4,431 72,688
36 SAN JOSE ‐ SOUTH OF SR 87 NB/SB OFF CALTRANS PeMS DATA 2016 601 1,576 3,555 4,225 3,518 5,304 4,947 4,427 4,814 70,446
37 SB OFF TO ALMADEN BLVD/VINE ST I‐280 RAMP METERING AFTER STUDY 2013 471 508 622 559 N/A
38 SB ON FR BIRD AVE I‐280 RAMP METERING AFTER STUDY 2013 716 695 786 756 N/A
39 SB ON FR SR‐87 I‐280 RAMP METERING AFTER STUDY 2013 2,490 2,406 2,365 2,151 N/A
40 SAN JOSE‐ JCT. RTE. 87 CALTRANS CENSUS DATA 2011 1,574 3,444 6,353 7,624 6,324 8,812 9,721 9,952 8,224 120,510
41 SB ON FR MARKET ST I‐280 RAMP METERING AFTER STUDY 2013 377 444 557 441 N/A
42 SB OFF TO 7TH ST I‐280 RAMP METERING AFTER STUDY 2013 936 807 677 729 N/A
43 SB OFF TO 10TH/11TH ST I‐280 RAMP METERING AFTER STUDY 2013 876 947 909 912 N/A
44 SB ON FR 7TH ST I‐280 RAMP METERING AFTER STUDY 2013 808 942 971 805 N/A
45 SAN JOSE ‐ 7TH STREET CALTRANS PeMS DATA 2016 1,123 2,501 5,019 5,017 4,429 7,973 7,993 7,984 7,633 104,988
46 SB ON FR 10TH/11TH ST I‐280 RAMP METERING AFTER STUDY 2013 1,110 1,172 1,201 1,065 N/A
47 SAN JOSE‐ MCLAUGHLIN AVENUE CALTRANS CENSUS DATA 2011 1,328 2,945 5,575 5,906 4,944 8,772 9,390 9,386 8,087 112,775
48 SB OFF TO MCLAUGHLIN AVE I‐280 RAMP METERING AFTER STUDY 2013 951 998 910 857 N/A
49 SB OFF TO SB US‐101
50 SB OFF TO NB US‐101
51 SB OFF TO KING RD
ON‐RAMP
OFF‐RAMP
MAINLINE
MISSING DATA
MISSING DATA
MISSING DATA
MISSING DATA
MISSING DATA
MISSING DATA
MISSING DATA
MISSING DATA
MISSING DATA
MISSING DATA
MISSING DATA
MISSING DATA
MISSING DATA
MISSING DATA
MISSING DATA
MISSING DATA
MISSING DATA
MISSING DATA
MISSING DATA
MISSING DATA
MISSING DATA
ADTNo. Description YearAM Peak PM Peak
Source
MISSING DATA
MISSING DATA
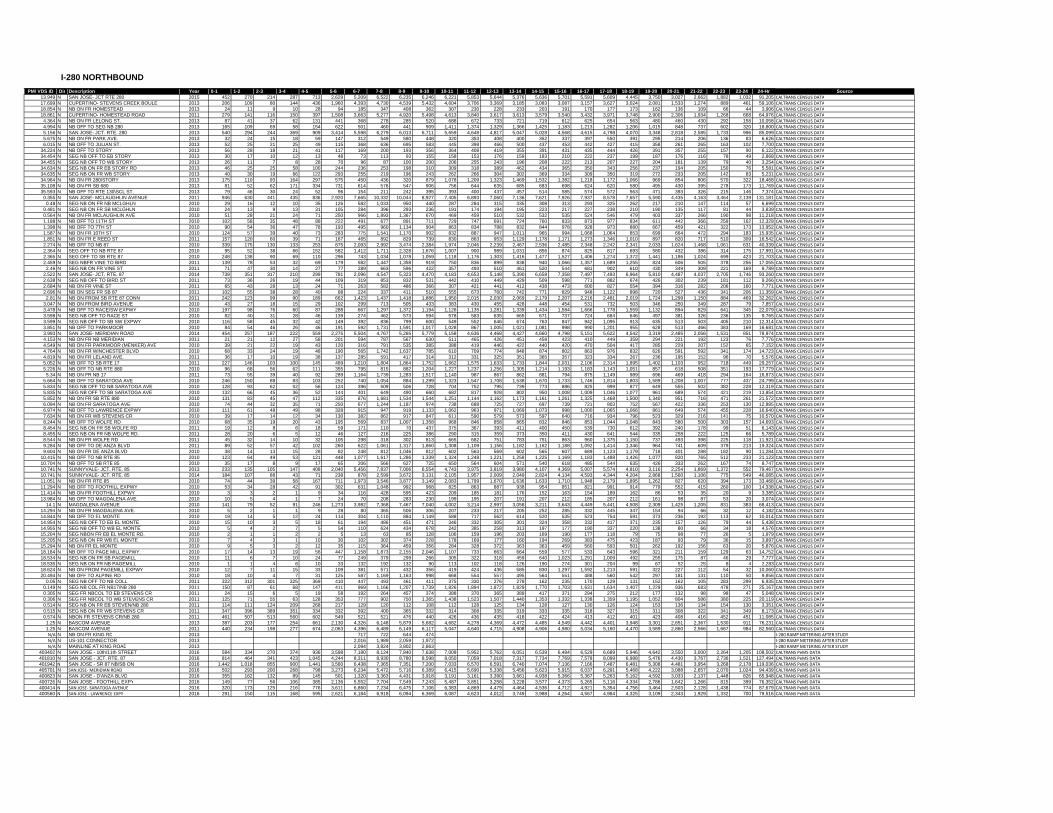
PM/ VDS ID Dir Description Year 0-1 1-2 2-3 3-4 4-5 5-6 6-7 7-8 8-9 9-10 10-11 11-12 12-13 13-14 14-15 15-16 16-17 17-18 18-19 19-20 20-21 21-22 22-23 23-24 24-Hr Source
13.949 N SAN JOSE- JCT RTE 280 2015 452 270 214 287 713 2,629 5,209 6,522 6,235 6,246 6,221 5,853 5,644 5,376 5,636 5,701 5,591 5,609 4,445 3,750 3,027 2,662 1,882 1,032 91,205 CALTRANS CENSUS DATA17.699 N CUPERTINO- STEVENS CREEK BOULE 2013 206 109 80 144 436 1,960 4,393 4,730 4,539 5,432 4,604 3,706 3,369 3,185 3,083 3,087 3,157 3,627 3,024 2,081 1,533 1,274 889 461 59,106 CALTRANS CENSUS DATA18.854 N NB ON FR HOMESTEAD 2013 24 11 9 10 28 94 185 347 408 362 307 230 228 233 203 191 170 177 173 162 136 109 66 44 3,906 CALTRANS CENSUS DATA18.861 N CUPERTINO- HOMESTEAD ROAD 2011 279 141 116 150 397 1,508 3,663 5,277 4,920 5,498 4,613 3,840 3,617 3,613 3,579 3,540 3,432 3,971 3,748 2,900 2,306 1,934 1,268 668 64,976 CALTRANS CENSUS DATA
4.364 N NB ON FR LELONG ST. 2013 87 41 37 62 131 441 368 278 285 520 688 672 733 721 719 612 625 654 563 480 460 430 292 158 10,058 CALTRANS CENSUS DATA4.994 N NB OFF TO SEG NB 280 2013 165 109 69 58 154 622 501 460 441 909 1,411 1,374 1,329 1,366 1,425 1,183 1,213 1,282 1,206 1,015 848 737 602 320 18,800 CALTRANS CENSUS DATA5.156 N SAN JOSE- JCT. RTE. 280 2013 540 294 244 369 909 3,414 5,598 6,279 6,013 6,711 5,659 4,648 4,817 5,047 5,028 4,568 4,615 4,798 4,070 3,348 2,818 2,585 1,733 996 85,099 CALTRANS CENSUS DATA5.675 N NB ON FR PARK AVE. 2013 32 24 15 18 59 147 312 549 580 448 320 353 408 400 352 337 397 550 391 295 214 206 136 83 6,626 CALTRANS CENSUS DATA6.015 N NB OFF TO JULIAN ST. 2013 52 25 21 25 49 115 368 636 695 583 445 398 466 500 437 453 442 427 415 358 261 265 163 102 7,700 CALTRANS CENSUS DATA
34.224 N NB OFF TO STORY 2013 56 28 18 21 41 117 169 200 193 356 364 408 419 355 391 431 435 444 426 391 357 255 157 90 6,122 CALTRANS CENSUS DATA34.454 N SEG NB OFF TO EB STORY 2013 30 17 10 12 13 48 73 113 93 155 158 153 176 159 183 210 222 237 199 187 176 116 78 49 2,868 CALTRANS CENSUS DATA34.455 N SEG NB OFF TO WB STORY 2013 26 11 7 8 28 70 96 87 100 200 206 255 243 196 208 222 213 207 227 204 181 139 79 40 3,254 CALTRANS CENSUS DATA34.634 N SEG NB ON FR EB STORY RD 2013 46 25 25 58 100 244 236 253 198 310 309 318 389 462 434 365 350 343 256 237 194 205 150 76 5,581 CALTRANS CENSUS DATA34.635 N SEG NB ON FR WB STORY 2013 40 30 19 66 122 293 255 219 196 243 262 266 304 302 369 334 309 350 319 272 233 205 142 83 5,231 CALTRANS CENSUS DATA34.964 N NB ON FR 280\STORY 2013 175 110 93 164 297 575 450 436 320 879 1,078 1,209 1,323 1,469 1,532 1,382 1,218 1,172 1,066 969 854 806 570 322 18,468 CALTRANS CENSUS DATA35.108 N NB ON FR SB 680 2013 81 52 62 171 334 731 614 576 547 906 756 644 635 685 683 698 624 620 580 495 430 395 278 173 11,769 CALTRANS CENSUS DATA35.593 N NB OFF TO RTE 130\SCL ST. 2013 79 46 30 24 52 96 154 211 242 395 393 400 437 457 514 585 574 572 563 471 393 326 215 146 7,374 CALTRANS CENSUS DATA
0.355 N SAN JOSE- MCLAUGHLIN AVENUE 2011 946 630 441 435 836 2,920 7,665 10,332 10,044 8,927 7,405 6,893 7,060 7,136 7,621 7,926 7,937 8,578 7,657 5,590 4,435 4,163 3,464 2,139 131,181 CALTRANS CENSUS DATA0.48 N SEG NB ON FR NB MCLGHLN 2010 29 16 12 10 35 126 582 1,033 950 440 287 284 315 335 308 313 293 325 262 217 210 147 114 57 6,699 CALTRANS CENSUS DATA
0.481 N SEG NB ON FR SB MCLGHLN 2010 24 13 9 13 31 105 284 396 293 236 191 174 194 195 223 217 227 238 210 190 135 117 81 44 3,839 CALTRANS CENSUS DATA0.564 N NB ON FR MCLAUGHLIN AVE 2010 51 28 21 24 71 250 966 1,893 1,367 670 469 459 510 532 532 535 524 546 479 403 337 266 190 98 11,218 CALTRANS CENSUS DATA1.188 N NB OFF TO 11TH ST 2010 102 58 35 48 88 222 491 677 891 711 729 747 691 724 760 833 873 977 834 611 442 366 259 162 12,329 CALTRANS CENSUS DATA1.398 N NB OFF TO 7TH ST 2010 90 54 36 47 78 193 495 960 1,134 904 863 834 788 832 844 978 928 973 880 667 459 421 322 173 13,952 CALTRANS CENSUS DATA1.587 N NB ON FR 10TH ST 2010 124 57 39 40 73 283 775 1,541 1,170 902 832 887 947 1,011 965 994 1,068 1,064 853 699 664 472 294 183 15,935 CALTRANS CENSUS DATA1.851 N NB ON FR E REED ST 2011 157 120 60 39 71 167 465 892 829 739 830 863 953 1,129 1,178 1,171 1,273 1,346 1,010 897 820 717 510 309 16,542 CALTRANS CENSUS DATA2.274 N NB OFF TO NB 87 2010 339 175 130 133 253 875 2,093 2,992 3,474 2,384 1,974 2,046 2,239 2,467 2,536 2,485 2,348 2,242 2,341 2,033 1,624 1,468 1,061 631 40,339 CALTRANS CENSUS DATA2.364 N SEG OFF TO NB RTE 87 2010 95 52 38 66 152 582 1,412 1,711 2,328 1,676 1,007 900 989 1,031 856 874 825 817 693 580 432 386 314 175 17,991 CALTRANS CENSUS DATA2.365 N SEG OFF TO SB RTE 87 2010 248 138 90 69 110 296 743 1,034 1,078 1,059 1,118 1,176 1,303 1,416 1,477 1,527 1,406 1,274 1,372 1,441 1,186 1,024 699 423 21,703 CALTRANS CENSUS DATA2.459 N SEG NBFR VINE TO BIRD 2011 139 78 53 32 69 179 582 1,447 1,358 919 750 836 899 838 940 1,066 1,357 1,689 1,255 824 606 505 378 256 17,055 CALTRANS CENSUS DATA
2.46 N SEG NB ON FR VINE ST 2011 71 47 30 14 27 77 289 663 596 422 357 493 510 461 520 544 681 902 610 430 349 309 221 169 8,789 CALTRANS CENSUS DATA2.522 N SAN JOSE- JCT. RTE. 87 2014 739 351 317 210 299 781 2,096 4,547 5,323 4,470 4,183 4,653 5,148 5,390 6,658 7,358 7,497 7,493 6,964 5,810 4,487 4,037 2,705 1,746 93,260 CALTRANS CENSUS DATA2.638 N SEG NB OFF TO BIRD ST 2011 73 36 26 19 44 109 319 853 832 531 442 410 449 429 509 598 771 882 674 426 302 239 181 112 9,266 CALTRANS CENSUS DATA2.684 N NB ON FR VINE ST 2011 65 43 28 13 24 71 263 582 486 366 307 421 441 412 438 473 600 827 554 394 316 282 206 160 7,771 CALTRANS CENSUS DATA2.696 N NB ON SEG FR SB 87 2011 102 55 38 28 40 88 224 337 411 510 555 673 760 742 771 829 948 1,122 898 720 527 436 341 206 11,359 CALTRANS CENSUS DATA
2.81 N NB ON FROM SB RTE 87 CONN 2011 242 123 99 90 189 662 1,423 1,437 1,418 1,886 1,950 2,015 2,030 2,069 2,179 2,207 2,216 2,481 2,019 1,724 1,299 1,150 884 469 32,262 CALTRANS CENSUS DATA3.047 N NB ON FROM BIRD AVENUE 2010 43 27 18 15 29 102 299 713 505 433 383 430 455 428 448 454 531 732 503 346 250 349 287 79 7,857 CALTRANS CENSUS DATA3.478 N NB OFF TO RACE/SW EXPWY 2010 197 98 76 60 87 288 667 1,297 1,372 1,194 1,126 1,135 1,281 1,339 1,434 1,584 1,666 1,778 1,559 1,132 894 829 641 345 22,079 CALTRANS CENSUS DATA3.598 N SEG NB OFF TO RACE ST 2010 82 40 31 28 46 139 274 462 573 594 578 583 635 665 671 737 724 684 646 497 381 326 236 135 9,765 CALTRANS CENSUS DATA3.599 N SEG NB OFF TO SB SW EXPWY 2010 116 58 45 32 42 149 392 836 799 600 549 552 646 674 763 847 942 1,095 913 635 513 503 405 210 12,314 CALTRANS CENSUS DATA3.851 N NB OFF TO PARKMOOR 2010 84 54 46 26 46 191 592 1,731 1,591 1,017 1,028 867 1,005 1,021 1,081 998 990 1,201 955 628 513 466 383 169 16,681 CALTRANS CENSUS DATA3.993 N SAN JOSE- MERIDIAN ROAD 2014 454 257 187 222 559 2,275 5,504 4,767 5,265 5,779 5,158 4,636 4,468 4,427 4,660 4,798 5,151 5,622 4,542 3,319 2,485 2,056 1,531 851 78,974 CALTRANS CENSUS DATA4.153 N NB ON FR NB MERIDIAN 2011 21 21 12 27 58 201 594 787 567 630 511 465 426 451 458 423 410 449 359 294 221 192 123 76 7,776 CALTRANS CENSUS DATA4.549 N NB ON FR PARKMOOR (MENKER) AVE 2010 39 21 22 19 43 120 316 791 535 385 388 419 446 422 440 420 470 504 417 285 229 207 152 65 7,152 CALTRANS CENSUS DATA4.764 N NB ON FR WINCHESTER BLVD 2010 68 33 24 19 48 190 565 1,742 1,637 785 610 709 774 848 874 802 863 976 832 626 591 592 341 174 14,723 CALTRANS CENSUS DATA4.819 N NB ON FR LELAND AVE. 2011 36 17 10 19 38 137 285 591 417 314 312 331 325 351 365 357 323 334 267 236 195 152 96 70 5,576 CALTRANS CENSUS DATA5.052 N NB OFF TO SB RTE 17 2011 227 146 103 100 145 489 1,210 1,804 1,864 1,752 1,662 1,575 1,633 1,733 1,844 2,031 2,106 2,314 1,895 1,402 1,103 952 718 449 29,257 CALTRANS CENSUS DATA5.226 N NB OFF TO NB RTE 880 2010 96 68 56 62 111 355 795 815 882 1,204 1,227 1,237 1,256 1,305 1,214 1,193 1,183 1,143 1,051 857 618 508 351 193 17,779 CALTRANS CENSUS DATA
5.34 N NB ON FR NB 17 2011 73 55 39 40 92 289 1,164 1,739 1,283 1,517 1,140 987 867 862 881 794 875 1,149 989 696 469 418 294 164 16,873 CALTRANS CENSUS DATA5.664 N NB OFF TO SARATOGA AVE 2010 246 150 88 83 103 252 740 1,054 884 1,299 1,323 1,547 1,708 1,538 1,670 1,733 1,746 1,814 1,803 1,589 1,208 1,007 777 437 24,799 CALTRANS CENSUS DATA5.834 N SEG NB OFF TO NB SARATOGA AVE 2010 128 93 62 52 56 124 396 509 506 728 704 752 795 739 773 886 825 999 877 649 555 502 382 228 12,319 CALTRANS CENSUS DATA5.835 N SEG NB OFF TO SB SARATOGA AVE 2010 132 66 45 36 52 144 401 649 490 660 682 817 928 802 950 1,008 1,009 1,046 1,077 961 689 574 421 219 13,854 CALTRANS CENSUS DATA5.852 N NB ON FR SB RTE 880 2010 131 83 45 47 112 335 876 1,681 1,534 1,544 1,251 1,144 1,162 1,173 1,161 1,261 1,325 1,468 1,500 1,340 951 716 471 261 21,572 CALTRANS CENSUS DATA6.094 N NB ON FR SARATOGA AVE 2010 74 44 32 35 71 250 677 1,244 1,187 974 738 688 725 727 697 739 721 803 752 567 422 336 253 130 12,885 CALTRANS CENSUS DATA6.974 N NB OFF TO LAWRENCE EXPWY 2010 111 61 48 49 98 328 915 947 919 1,133 1,062 963 971 1,069 1,073 998 1,000 1,065 1,066 861 649 574 455 228 16,640 CALTRANS CENSUS DATA7.634 N NB ON FR WB STEVENS CR 2010 39 17 14 12 34 130 382 862 917 847 611 590 579 573 597 640 716 934 796 523 329 216 141 75 10,570 CALTRANS CENSUS DATA8.244 N NB OFF TO WOLFE RD 2010 68 35 19 20 43 195 569 837 1,007 1,358 968 846 858 865 832 846 853 1,044 1,048 843 580 500 303 157 14,693 CALTRANS CENSUS DATA8.454 N SEG NB ON FR SB WOLFE RD 2011 19 12 8 6 18 59 171 110 70 437 375 367 393 411 400 450 539 730 612 392 240 178 99 51 6,143 CALTRANS CENSUS DATA8.455 N SEG NB ON FR NB WOLFE RD. 2011 28 20 6 5 12 46 127 216 225 386 290 315 359 373 350 411 430 641 544 335 258 222 125 66 5,789 CALTRANS CENSUS DATA8.544 N NB ON FR WOLFE RD 2011 45 32 14 10 32 105 298 318 302 813 665 682 751 783 751 863 960 1,375 1,150 737 493 398 225 118 11,921 CALTRANS CENSUS DATA9.284 N NB OFF TO DE ANZA BLVD 2011 89 52 57 42 102 260 622 1,061 1,317 1,860 1,308 1,109 1,156 1,182 1,162 1,188 1,092 1,414 1,346 964 741 609 379 213 19,324 CALTRANS CENSUS DATA9.604 N NB ON FR DE ANZA BLVD 2010 38 14 13 15 28 82 248 812 1,046 812 602 563 569 602 565 607 689 1,123 1,179 718 401 288 182 90 11,284 CALTRANS CENSUS DATA
10.415 N NB OFF TO NB RTE 85 2010 123 64 49 53 121 448 1,077 1,617 1,286 1,339 1,324 1,248 1,221 1,258 1,225 1,169 1,183 1,488 1,426 1,077 820 765 512 233 21,123 CALTRANS CENSUS DATA10.704 N NB OFF TO SB RTE 85 2010 35 17 8 9 17 65 206 566 627 725 650 564 604 571 540 618 485 544 635 426 333 262 167 74 8,747 CALTRANS CENSUS DATA10.741 N SUNNYVALE- JCT. RTE. 85 2013 233 135 105 147 408 2,040 5,456 7,837 7,006 6,554 4,743 3,975 3,819 3,980 4,107 4,369 5,007 5,574 4,810 3,116 2,254 1,869 1,372 552 79,467 CALTRANS CENSUS DATA10.741 N SUNNYVALE- JCT. RTE. 85 2014 184 107 88 43 71 238 878 2,599 3,672 3,131 2,105 1,957 2,009 2,049 2,824 4,134 4,593 4,344 4,204 2,868 1,560 1,106 775 549 46,085 CALTRANS CENSUS DATA11.051 N NB ON FR RTE 85 2010 74 44 39 58 167 711 1,973 3,546 3,877 3,149 2,083 1,799 1,670 1,636 1,633 1,710 1,948 2,179 1,895 1,262 827 620 394 173 33,468 CALTRANS CENSUS DATA11.294 N NB OFF TO FOOTHILL EXPWY 2010 53 34 28 42 91 302 631 1,048 992 968 825 863 887 938 954 851 821 991 914 779 552 415 260 100 14,338 CALTRANS CENSUS DATA11.414 N NB ON FR FOOTHILL EXPWY 2010 3 3 2 1 9 34 116 428 595 423 209 185 181 176 152 163 154 189 162 86 53 35 20 9 3,385 CALTRANS CENSUS DATA13.984 N NB OFF TO MAGDALENA AVE. 2010 10 5 4 1 7 24 70 208 283 230 199 195 207 191 207 212 185 207 212 161 98 87 53 20 3,074 CALTRANS CENSUS DATA
14.1 N MAGDALENA AVENUE 2010 141 79 52 91 246 1,273 3,982 7,368 7,467 7,040 4,002 3,214 2,997 3,058 3,211 3,643 4,449 5,441 4,508 2,309 1,425 1,205 831 383 68,413 CALTRANS CENSUS DATA14.294 N NB ON FR MAGDALENA AVE. 2010 5 2 1 1 9 28 80 365 506 306 207 233 217 205 252 285 332 445 347 154 94 66 32 12 4,182 CALTRANS CENSUS DATA14.844 N NB OFF TO EL MONTE 2010 19 14 5 12 24 114 304 1,110 884 1,149 588 717 562 614 520 535 523 754 591 373 236 192 113 62 10,014 CALTRANS CENSUS DATA14.954 N SEG NB OFF TO EB EL MONTE 2010 15 10 3 5 18 61 194 486 451 471 346 332 305 301 324 358 332 417 371 235 157 126 79 44 5,438 CALTRANS CENSUS DATA14.955 N SEG NB OFF TO WB EL MONTE 2010 5 4 2 7 5 54 110 624 434 678 242 385 258 313 197 177 190 337 220 138 80 66 34 18 4,576 CALTRANS CENSUS DATA15.204 N SEG NBON FR EB EL MONTE RD. 2010 2 1 1 2 2 5 13 63 85 128 106 159 196 203 169 190 177 118 79 75 98 77 26 5 1,979 CALTRANS CENSUS DATA15.205 N SEG NB ON FR WB EL MONTE 2010 7 4 3 1 10 30 102 302 374 228 178 169 177 160 194 269 383 475 423 187 93 79 36 15 3,897 CALTRANS CENSUS DATA15.294 N NB ON FR EL MONTE 2010 9 5 3 2 12 35 115 364 459 356 284 328 372 363 363 459 560 593 501 262 192 156 63 20 5,876 CALTRANS CENSUS DATA18.184 N NB OFF TO PAGE MILL EXPWY. 2010 17 14 13 19 56 447 1,158 1,873 2,155 2,046 1,107 733 663 664 559 577 533 643 596 321 211 159 129 63 14,752 CALTRANS CENSUS DATA18.534 N SEG NB ON FR SB PAGEMILL 2010 11 6 7 10 24 77 249 379 299 266 305 322 318 459 640 1,023 1,291 1,009 492 255 175 87 46 29 7,777 CALTRANS CENSUS DATA18.535 N SEG NB ON FR NB PAGEMILL 2010 1 1 4 6 10 33 132 192 132 90 113 102 118 126 190 274 301 204 99 67 52 25 8 4 2,283 CALTRANS CENSUS DATA18.624 N NB ON FROM PAGEMILL EXPWY 2010 12 7 11 15 33 109 381 571 432 356 419 424 436 585 830 1,297 1,592 1,213 591 322 227 112 54 32 10,060 CALTRANS CENSUS DATA20.494 N NB OFF TO ALPINE RD 2010 18 10 4 7 31 125 587 1,169 1,163 998 668 554 557 495 564 551 488 560 542 297 181 131 110 50 9,856 CALTRANS CENSUS DATA
0.05 N SEG NB OFF TO NB COLL 2011 322 312 301 325 369 410 447 493 461 411 375 330 276 278 162 235 170 129 131 152 162 105 283 299 6,935 CALTRANS CENSUS DATA0.149 N SEG NB COL FR NB17/NB 280 2011 150 87 61 68 147 411 969 1,166 1,207 1,739 1,826 1,894 1,872 1,829 1,770 1,703 1,631 1,634 1,407 1,229 936 683 478 271 25,167 CALTRANS CENSUS DATA0.305 N SEG FR NBCOL TO EB STEVENS CR 2011 24 15 6 5 19 58 192 264 457 374 388 370 365 389 417 371 294 275 212 177 132 98 98 47 5,048 CALTRANS CENSUS DATA0.306 N SEG FR NBCOL TO WB STEVENS CR 2011 125 71 55 63 128 353 777 902 750 1,365 1,438 1,523 1,507 1,440 1,353 1,332 1,338 1,359 1,195 1,052 804 586 380 225 20,119 CALTRANS CENSUS DATA0.514 N SEG NB ON FR EB STEVEN/NB 280 2011 114 111 124 209 268 217 129 120 112 108 112 128 125 134 128 127 130 126 124 153 136 134 154 130 3,351 CALTRANS CENSUS DATA0.515 N SEG NB ON FR WB STEVENS CR 2011 347 396 389 351 334 332 392 400 365 332 314 308 335 319 333 335 318 327 315 311 308 322 341 349 8,173 CALTRANS CENSUS DATA0.574 N NBON FR STEVENS CR/NB 280 2011 461 507 513 560 602 549 521 521 476 440 426 436 435 418 422 424 413 412 401 423 408 416 452 451 11,085 CALTRANS CENSUS DATA
1.25 N BASCOM AVENUE 2013 387 203 177 254 661 2,130 4,326 6,148 5,879 5,682 4,682 4,278 4,369 4,472 4,485 4,549 4,442 4,401 3,948 3,301 2,651 2,367 1,530 911 76,231 CALTRANS CENSUS DATA1.25 N BASCOM AVENUE 2011 440 234 198 277 674 2,063 4,396 6,489 6,149 6,117 5,047 4,640 4,715 4,908 4,906 4,980 5,034 5,160 4,470 3,589 2,860 2,566 1,667 984 82,560 CALTRANS CENSUS DATAN/A N NB ON FR KING RD 2013 717 722 644 474 I‐280 RAMP METERING AFTER STUDYN/A N US-101 CONNECTOR 2013 2,016 1,989 2,059 1,972 I‐280 RAMP METERING AFTER STUDYN/A N MAINLINE AT KING ROAD 2013 2,094 3,824 3,802 2,863 I‐280 RAMP METERING AFTER STUDY
403402 N SAN JOSE - 10th/11th STREET 2016 584 334 270 374 936 3,598 7,180 8,124 7,840 7,638 7,009 5,952 5,762 6,051 6,539 6,484 6,529 6,689 5,946 4,642 3,550 3,000 2,264 1,205 108,502 CALTRANS PeMS DATA401810 N SAN JOSE - JCT. RTE. 87 2016 814 464 341 423 1,045 4,244 8,311 8,930 8,780 8,598 8,050 7,059 7,018 7,317 7,734 7,769 7,578 8,099 6,988 5,476 4,430 3,767 2,736 1,521 127,494 CALTRANS PeMS DATA401942 N SAN JOSE - SR 87 NB/SB ON 2016 1,442 1,018 855 900 1,441 3,560 6,438 7,365 7,351 7,200 7,033 6,570 6,591 6,740 7,074 7,136 7,166 7,487 6,481 5,308 4,481 3,954 3,268 2,178 119,036 CALTRANS PeMS DATA405701 N SAN JOSE‐ MERIDIAN ROAD 2016 502 293 200 268 798 3,273 6,234 5,472 5,716 6,389 6,415 5,690 5,338 5,456 5,623 5,915 6,037 6,291 5,468 4,222 3,088 2,657 2,070 1,024 94,439 CALTRANS PeMS DATA400823 N SAN JOSE - D'ANZA BLVD 2016 355 162 132 89 145 501 1,320 3,363 4,431 3,918 3,191 3,161 3,390 3,661 4,938 5,366 5,367 5,263 5,162 4,592 3,033 2,137 1,448 826 65,948 CALTRANS PeMS DATA400726 N SAN JOSE - FOOTHILL EXPY 2016 149 77 56 106 385 2,136 5,552 7,704 7,549 7,243 5,487 3,851 3,258 3,228 3,577 4,373 5,265 5,116 4,334 2,786 1,642 1,266 815 399 76,352 CALTRANS PeMS DATA400414 N SAN JOSE‐ SARATOGA AVENUE 2016 320 173 125 216 776 3,611 6,860 7,234 6,475 7,106 6,383 4,869 4,479 4,464 4,536 4,712 4,921 5,354 4,756 3,464 2,503 2,128 1,438 774 87,679 CALTRANS PeMS DATA400560 N SAN JOSE ‐ LAWRENCE EXPY 2016 291 150 115 168 595 2,621 6,184 6,918 6,094 6,369 6,087 4,623 4,012 3,749 3,988 4,264 4,567 4,984 4,325 3,109 2,343 1,929 1,332 700 79,516 CALTRANS PeMS DATA
I-280 NORTHBOUND
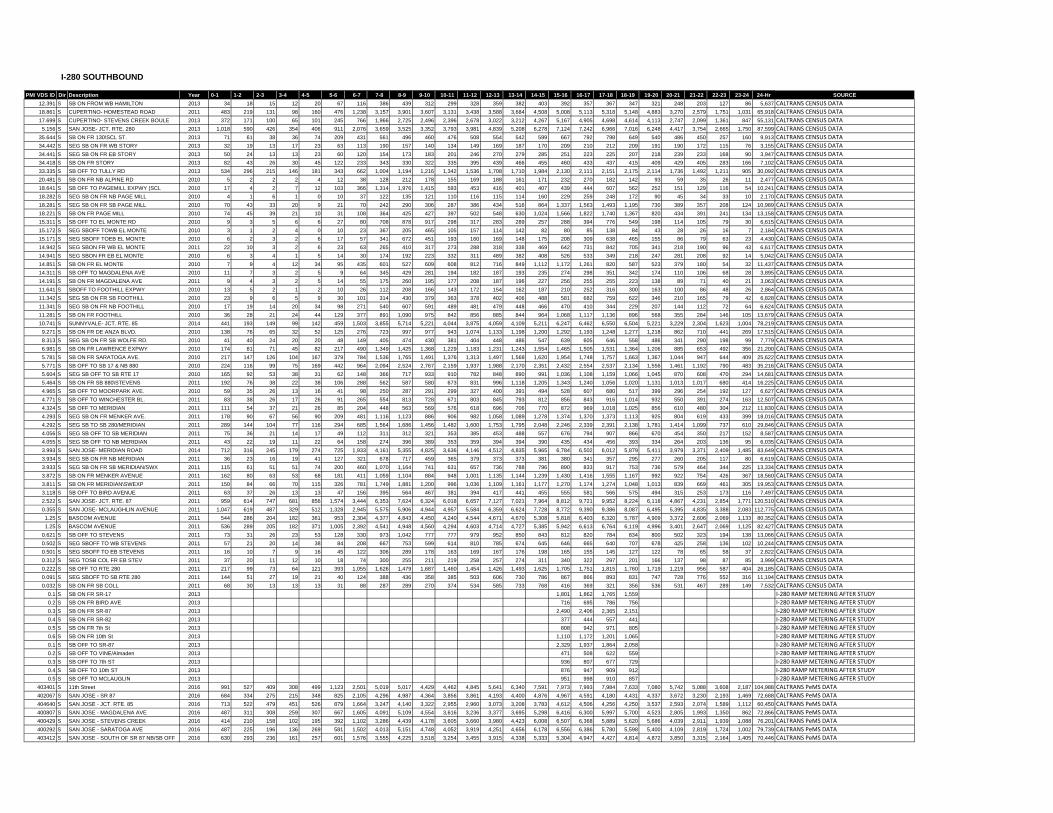
PM/ VDS ID Dir Description Year 0-1 1-2 2-3 3-4 4-5 5-6 6-7 7-8 8-9 9-10 10-11 11-12 12-13 13-14 14-15 15-16 16-17 17-18 18-19 19-20 20-21 21-22 22-23 23-24 24-Hr SOURCE
12.391 S SB ON FROM WB HAMILTON 2013 34 18 15 12 20 67 116 386 439 312 299 328 359 382 403 392 357 367 347 321 248 203 127 86 5,637 CALTRANS CENSUS DATA
18.861 S CUPERTINO- HOMESTEAD ROAD 2011 483 219 131 98 160 476 1,238 3,157 3,901 3,607 3,131 3,438 3,588 3,684 4,508 5,008 5,113 5,318 5,148 4,883 3,270 2,579 1,751 1,031 65,918 CALTRANS CENSUS DATA
17.699 S CUPERTINO- STEVENS CREEK BOULE 2013 372 171 100 65 101 245 766 1,966 2,725 2,496 2,396 2,678 3,022 3,212 4,267 5,167 4,905 4,698 4,614 4,113 2,747 2,099 1,361 847 55,131 CALTRANS CENSUS DATA
5.156 S SAN JOSE- JCT. RTE. 280 2013 1,018 590 426 354 406 911 2,076 3,659 3,525 3,352 3,793 3,981 4,839 5,208 6,278 7,124 7,242 6,966 7,016 6,248 4,417 3,754 2,665 1,750 87,599 CALTRANS CENSUS DATA
35.644 S SB ON FR 130\SCL ST. 2013 71 61 38 36 74 209 431 561 496 460 476 508 554 542 599 667 792 798 649 540 486 450 257 160 9,913 CALTRANS CENSUS DATA
34.442 S SEG SB ON FR WB STORY 2013 32 19 13 17 23 63 113 190 157 140 134 149 169 187 170 209 210 212 209 191 190 172 115 76 3,155 CALTRANS CENSUS DATA
34.441 S SEG SB ON FR EB STORY 2013 50 24 13 13 23 60 120 154 173 183 201 246 270 279 285 251 223 225 207 218 239 233 168 90 3,947 CALTRANS CENSUS DATA
34.418 S SB ON FR STORY 2013 82 43 26 30 45 122 233 343 330 322 335 395 439 466 455 460 433 437 415 409 429 405 283 166 7,102 CALTRANS CENSUS DATA
33.335 S SB OFF TO TULLY RD 2013 534 296 215 146 181 343 662 1,004 1,194 1,216 1,342 1,536 1,708 1,710 1,984 2,130 2,111 2,151 2,175 2,114 1,736 1,492 1,211 905 30,092 CALTRANS CENSUS DATA
20.481 S SB ON FR NB ALPINE RD 2010 5 2 2 2 4 12 38 128 212 178 155 169 188 161 171 232 270 182 142 93 59 35 26 11 2,477 CALTRANS CENSUS DATA
18.641 S SB OFF TO PAGEMILL EXPWY (SCL 2010 17 4 2 7 12 103 366 1,314 1,976 1,415 593 453 416 401 407 439 444 607 562 252 151 129 116 54 10,241 CALTRANS CENSUS DATA
18.282 S SEG SB ON FR NB PAGE MILL 2010 4 1 6 1 0 10 37 122 135 121 110 116 115 114 160 229 259 248 172 90 45 34 33 10 2,170 CALTRANS CENSUS DATA
18.281 S SEG SB ON FR SB PAGE MILL 2010 70 43 33 20 9 21 70 242 290 306 287 386 434 516 864 1,337 1,563 1,493 1,195 730 389 357 208 124 10,989 CALTRANS CENSUS DATA
18.221 S SB ON FR PAGE MILL 2010 74 45 39 21 10 31 108 364 425 427 397 502 548 630 1,024 1,566 1,822 1,740 1,367 820 434 391 241 134 13,158 CALTRANS CENSUS DATA
15.311 S SB OFF TO EL MONTE RD 2010 9 3 5 6 6 27 80 708 878 917 298 317 283 289 257 288 394 776 549 198 114 105 79 30 6,615 CALTRANS CENSUS DATA
15.172 S SEG SBOFF TOWB EL MONTE 2010 3 1 2 4 0 10 23 367 205 465 105 157 114 142 82 80 85 138 84 43 28 26 16 7 2,184 CALTRANS CENSUS DATA
15.171 S SEG SBOFF TOEB EL MONTE 2010 6 2 3 2 6 17 57 341 672 451 193 160 169 148 175 208 309 638 465 155 86 79 63 23 4,430 CALTRANS CENSUS DATA
14.942 S SEG SBON FR WB EL MONTE 2011 22 10 3 2 6 23 63 265 410 317 273 288 318 338 469 642 731 842 705 341 218 190 96 43 6,617 CALTRANS CENSUS DATA
14.941 S SEG SBON FR EB EL MONTE 2010 6 3 4 1 5 14 30 174 192 223 332 311 489 382 408 526 533 349 218 247 281 208 92 14 5,042 CALTRANS CENSUS DATA
14.851 S SB ON FR EL MONTE 2010 7 9 4 12 34 95 435 601 527 609 608 812 716 849 1,112 1,172 1,261 820 587 523 379 180 54 32 11,437 CALTRANS CENSUS DATA
14.311 S SB OFF TO MAGDALENA AVE 2010 11 7 3 2 5 9 64 345 429 281 194 182 187 193 235 274 298 351 342 174 110 106 68 28 3,895 CALTRANS CENSUS DATA
14.191 S SB ON FR MAGDALENA AVE 2011 9 4 3 2 5 14 55 175 260 195 177 208 187 196 227 256 255 255 223 138 89 71 40 21 3,063 CALTRANS CENSUS DATA
11.641 S SBOFF TO FOOTHILL EXPWY 2010 13 5 2 1 2 10 26 112 208 166 143 172 154 162 187 210 252 316 300 163 100 86 48 26 2,864 CALTRANS CENSUS DATA
11.342 S SEG SB ON FR SB FOOTHILL 2010 23 9 6 5 9 30 101 314 430 379 363 378 402 406 488 581 682 759 622 346 210 165 79 42 6,828 CALTRANS CENSUS DATA
11.341 S SEG SB ON FR NB FOOTHILL 2010 17 19 14 20 34 98 271 540 607 591 489 481 479 448 466 470 410 344 229 207 144 112 72 64 6,624 CALTRANS CENSUS DATA
11.281 S SB ON FR FOOTHILL 2010 36 28 21 24 44 129 377 891 1,090 975 842 856 885 844 964 1,068 1,117 1,136 896 568 355 284 146 105 13,679 CALTRANS CENSUS DATA
10.741 S SUNNYVALE- JCT. RTE. 85 2014 441 193 149 99 142 459 1,503 3,855 5,714 5,221 4,044 3,875 4,059 4,109 5,211 6,247 6,462 6,550 6,504 5,221 3,229 2,304 1,623 1,004 78,219 CALTRANS CENSUS DATA
9.271 S SB ON FR DE ANZA BLVD. 2010 138 76 65 32 52 125 276 723 997 977 943 1,074 1,133 1,198 1,200 1,292 1,193 1,248 1,277 1,218 862 710 441 269 17,515 CALTRANS CENSUS DATA
8.313 S SEG SB ON FR SB WOLFE RD. 2010 41 40 24 20 20 48 149 405 474 430 381 404 448 486 547 639 605 646 558 486 341 290 198 99 7,779 CALTRANS CENSUS DATA
6.981 S SB ON FR LAWRENCE EXPWY 2010 174 81 71 45 82 217 490 1,349 1,425 1,368 1,229 1,183 1,231 1,243 1,554 1,465 1,505 1,531 1,364 1,206 885 653 492 356 21,200 CALTRANS CENSUS DATA
5.781 S SB ON FR SARATOGA AVE. 2010 217 147 126 104 167 379 784 1,536 1,765 1,491 1,376 1,313 1,497 1,568 1,620 1,954 1,748 1,757 1,663 1,367 1,044 947 644 409 25,622 CALTRANS CENSUS DATA
5.771 S SB OFF TO SB 17 & NB 880 2010 224 116 99 75 169 442 964 2,094 2,524 2,767 2,159 1,937 1,988 2,170 2,351 2,432 2,554 2,537 2,134 1,556 1,461 1,192 790 483 35,216 CALTRANS CENSUS DATA
5.604 S SEG SB OFF TO SB RTE 17 2010 165 92 53 38 31 62 148 366 717 933 910 782 848 890 991 1,036 1,108 1,159 1,066 1,045 870 608 470 294 14,681 CALTRANS CENSUS DATA
5.464 S SB ON FR SB 880\STEVENS 2011 192 76 38 22 38 106 288 562 587 580 673 831 996 1,118 1,205 1,343 1,240 1,056 1,020 1,131 1,013 1,017 680 414 16,225 CALTRANS CENSUS DATA
4.965 S SB OFF TO MOORPARK AVE. 2010 59 35 26 13 16 41 98 250 287 291 299 327 400 391 494 528 607 680 517 399 296 254 192 127 6,627 CALTRANS CENSUS DATA
4.771 S SB OFF TO WINCHESTER BL. 2011 83 38 26 17 26 91 265 554 813 728 671 803 845 793 812 856 843 916 1,014 932 550 391 274 163 12,507 CALTRANS CENSUS DATA
4.324 S SB OFF TO MERIDIAN 2011 111 54 37 21 26 85 204 448 563 569 576 618 696 706 770 872 969 1,018 1,025 856 610 480 304 212 11,830 CALTRANS CENSUS DATA
4.293 S SEG SB ON FR MENKER AVE. 2011 178 90 67 56 90 209 481 1,116 1,123 886 906 982 1,058 1,089 1,278 1,374 1,370 1,373 1,113 925 804 619 433 399 18,016 CALTRANS CENSUS DATA
4.292 S SEG SB TO SB 280/MERIDIAN 2011 289 144 104 77 116 294 685 1,564 1,686 1,456 1,482 1,600 1,753 1,795 2,048 2,246 2,339 2,391 2,138 1,781 1,414 1,099 737 610 29,846 CALTRANS CENSUS DATA
4.056 S SEG SB OFF TO SB MERIDIAN 2011 75 36 21 14 17 49 112 311 312 321 353 385 453 488 557 676 794 907 866 670 454 350 217 152 8,587 CALTRANS CENSUS DATA
4.055 S SEG SB OFF TO NB MERIDIAN 2011 43 22 19 11 22 64 158 274 396 389 353 359 394 394 390 435 434 456 393 334 264 203 136 95 6,035 CALTRANS CENSUS DATA
3.993 S SAN JOSE- MERIDIAN ROAD 2014 712 316 245 179 274 725 1,933 4,161 5,355 4,825 3,636 4,146 4,512 4,835 5,965 6,784 6,502 6,012 5,879 5,411 3,979 3,371 2,409 1,485 83,649 CALTRANS CENSUS DATA
3.934 S SEG SB ON FR NB MERIDIAN 2011 36 23 16 19 41 127 321 678 717 459 365 379 373 373 381 380 341 357 295 277 260 205 117 80 6,619 CALTRANS CENSUS DATA
3.933 S SEG SB ON FR SB MERIDIAN/SWX 2011 115 61 51 51 74 200 460 1,070 1,164 741 631 657 736 788 796 890 833 917 753 736 579 464 344 225 13,334 CALTRANS CENSUS DATA
3.872 S SB ON FR MENKER AVENUE 2011 162 80 63 53 68 181 411 1,059 1,104 884 948 1,001 1,135 1,144 1,239 1,430 1,416 1,555 1,167 992 922 754 426 367 18,560 CALTRANS CENSUS DATA
3.811 S SB ON FR MERIDIAN\SWEXP 2011 150 84 66 70 115 326 781 1,749 1,881 1,200 996 1,036 1,109 1,161 1,177 1,270 1,174 1,274 1,048 1,013 839 669 461 305 19,953 CALTRANS CENSUS DATA
3.118 S SB OFF TO BIRD AVENUE 2011 63 37 26 13 13 47 156 395 564 467 381 394 417 441 455 555 581 566 575 494 315 253 173 116 7,497 CALTRANS CENSUS DATA
2.522 S SAN JOSE- JCT. RTE. 87 2011 959 614 747 681 856 1,574 3,444 6,353 7,624 6,324 6,018 6,657 7,127 7,021 7,964 8,812 9,721 9,952 8,224 6,118 4,867 4,231 2,854 1,771 120,510 CALTRANS CENSUS DATA
0.355 S SAN JOSE- MCLAUGHLIN AVENUE 2011 1,047 619 487 329 512 1,328 2,945 5,575 5,906 4,944 4,957 5,584 6,359 6,624 7,728 8,772 9,390 9,386 8,087 6,495 5,395 4,835 3,388 2,083 112,775 CALTRANS CENSUS DATA
1.25 S BASCOM AVENUE 2011 544 286 204 182 361 953 2,304 4,377 4,843 4,450 4,240 4,544 4,671 4,670 5,308 5,818 6,403 6,320 5,787 4,909 3,372 2,606 2,069 1,133 80,352 CALTRANS CENSUS DATA
1.25 S BASCOM AVENUE 2011 536 289 205 182 371 1,005 2,392 4,541 4,948 4,560 4,294 4,603 4,714 4,727 5,385 5,942 6,613 6,764 6,119 4,996 3,401 2,647 2,069 1,125 82,427 CALTRANS CENSUS DATA
0.621 S SB OFF TO STEVENS 2011 73 31 26 23 53 128 330 973 1,042 777 777 979 952 850 843 812 820 784 834 800 502 323 194 138 13,066 CALTRANS CENSUS DATA
0.502 S SEG SBOFF TO WB STEVENS 2011 57 21 20 14 38 84 208 667 753 599 614 810 785 674 645 646 665 640 707 678 425 258 136 102 10,244 CALTRANS CENSUS DATA
0.501 S SEG SBOFF TO EB STEVENS 2011 16 10 7 9 16 45 122 306 289 178 163 169 167 176 198 165 155 145 127 122 78 65 58 37 2,822 CALTRANS CENSUS DATA
0.312 S SEG TOSB COL FR EB STEV 2011 37 20 11 12 10 18 74 300 255 211 219 258 257 274 311 340 322 297 201 166 137 98 87 85 3,999 CALTRANS CENSUS DATA
0.222 S SB OFF TO RTE 280 2011 217 99 73 64 121 393 1,055 1,626 1,479 1,687 1,460 1,454 1,426 1,493 1,625 1,705 1,751 1,815 1,760 1,719 1,219 956 587 404 26,185 CALTRANS CENSUS DATA
0.091 S SEG SBOFF TO SB RTE 280 2011 144 51 27 19 21 40 124 388 436 358 385 503 606 730 786 867 866 893 831 747 728 776 552 316 11,194 CALTRANS CENSUS DATA
0.032 S SB ON FR SB COLL 2011 68 30 13 13 13 31 88 287 289 270 374 534 585 733 768 416 369 321 356 536 531 467 289 149 7,532 CALTRANS CENSUS DATA
0.1 S SB ON FR SR-17 2013 1,801 1,862 1,765 1,559 I‐280 RAMP METERING AFTER STUDY
0.2 S SB ON FR BIRD AVE 2013 716 695 786 756 I‐280 RAMP METERING AFTER STUDY
0.3 S SB ON FR SR-87 2013 2,490 2,406 2,365 2,151 I‐280 RAMP METERING AFTER STUDY
0.4 S SB ON FR SR-82 2013 377 444 557 441 I‐280 RAMP METERING AFTER STUDY
0.5 S SB ON FR 7th St 2013 808 942 971 805 I‐280 RAMP METERING AFTER STUDY
0.6 S SB ON FR 10th St 2013 1,110 1,172 1,201 1,065 I‐280 RAMP METERING AFTER STUDY
0.1 S SB OFF TO SR-87 2013 2,329 1,937 1,864 2,058 I‐280 RAMP METERING AFTER STUDY
0.2 S SB OFF TO VINE/Almaden 2013 471 508 622 559 I‐280 RAMP METERING AFTER STUDY
0.3 S SB OFF TO 7th ST 2013 936 807 677 729 I‐280 RAMP METERING AFTER STUDY
0.4 S SB OFF TO 10th ST 2013 876 947 909 912 I‐280 RAMP METERING AFTER STUDY
0.5 S SB OFF TO MCLAUGLIN 2013 951 998 910 857 I‐280 RAMP METERING AFTER STUDY
403401 S 11th Street 2016 991 527 409 308 499 1,123 2,501 5,019 5,017 4,429 4,462 4,845 5,641 6,340 7,591 7,973 7,993 7,984 7,633 7,080 5,742 5,088 3,608 2,187 104,988 CALTRANS PeMS DATA
402067 S SAN JOSE - SR 87 2016 684 334 275 215 348 825 2,105 4,296 4,987 4,364 3,856 3,861 4,193 4,400 4,876 4,967 4,591 4,180 4,431 4,337 3,672 3,230 2,193 1,469 72,688 CALTRANS PeMS DATA
404640 S SAN JOSE - JCT. RTE. 85 2016 713 522 479 451 526 879 1,664 3,247 4,140 3,322 2,955 2,960 3,073 3,208 3,783 4,612 4,506 4,256 4,250 3,537 2,593 2,074 1,589 1,112 60,450 CALTRANS PeMS DATA
400807 S SAN JOSE - MAGDALENA AVE 2016 487 311 308 259 307 667 1,605 4,091 5,109 4,554 3,616 3,236 3,377 3,695 5,298 6,416 6,300 5,997 5,700 4,523 2,805 1,993 1,350 862 72,866 CALTRANS PeMS DATA
400429 S SAN JOSE - STEVENS CREEK 2016 414 210 158 102 195 392 1,102 3,286 4,439 4,178 3,605 3,660 3,980 4,423 6,008 6,507 6,368 5,889 5,620 5,686 4,039 2,911 1,939 1,088 76,201 CALTRANS PeMS DATA
400292 S SAN JOSE - SARATOGA AVE 2016 487 225 196 136 269 581 1,502 4,013 5,151 4,748 4,052 3,919 4,251 4,656 6,178 6,556 6,386 5,780 5,598 5,400 4,109 2,819 1,724 1,002 79,739 CALTRANS PeMS DATA
403412 S SAN JOSE - SOUTH OF SR 87 NB/SB OFF 2016 630 293 236 161 257 601 1,576 3,555 4,225 3,518 3,254 3,455 3,915 4,338 5,333 5,304 4,947 4,427 4,814 4,872 3,850 3,315 2,164 1,405 70,446 CALTRANS PeMS DATA
I-280 SOUTHBOUND
2-14
SANTA CLARA COUNTY I-280 CORRIDOR STUDY
Appendix C – Travel Time Runs Data
SANTA CLARA VALLEY TRANSPORTATION AUTHORITY (VTA)
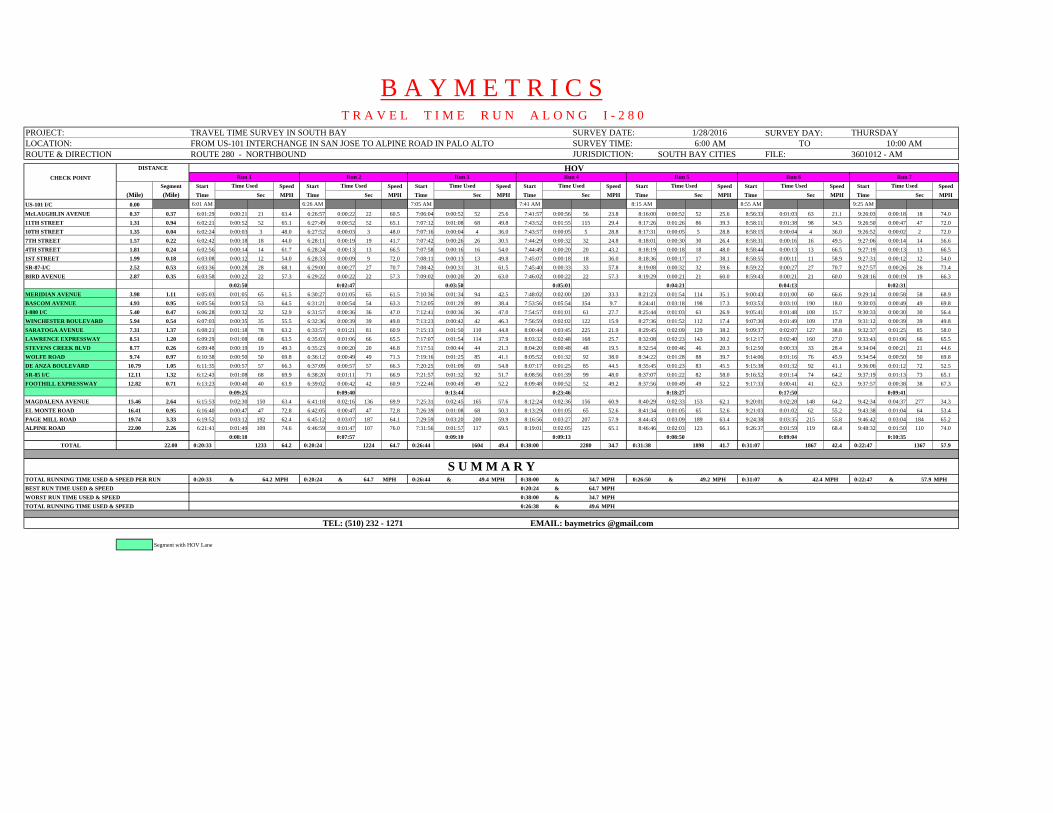
SURVEY DAY:TO
CHECK POINT
Segment Start Speed Start Speed Start Speed Start Speed Start Speed Start Speed Start Speed
(Mile) (Mile) Time Sec MPH Time Sec MPH Time Sec MPH Time Sec MPH Time Sec MPH Time Sec MPH Time Sec MPH
US-101 I/C 0.00 6:01 AM 6:26 AM 7:05 AM 7:41 AM 8:15 AM 8:55 AM 9:25 AM
McLAUGHLIN AVENUE 0.37 0.37 6:01:29 0:00:21 21 63.4 6:26:57 0:00:22 22 60.5 7:06:04 0:00:52 52 25.6 7:41:57 0:00:56 56 23.8 8:16:00 0:00:52 52 25.6 8:56:33 0:01:03 63 21.1 9:26:03 0:00:18 18 74.011TH STREET 1.31 0.94 6:02:21 0:00:52 52 65.1 6:27:49 0:00:52 52 65.1 7:07:12 0:01:08 68 49.8 7:43:52 0:01:55 115 29.4 8:17:26 0:01:26 86 39.3 8:58:11 0:01:38 98 34.5 9:26:50 0:00:47 47 72.010TH STREET 1.35 0.04 6:02:24 0:00:03 3 48.0 6:27:52 0:00:03 3 48.0 7:07:16 0:00:04 4 36.0 7:43:57 0:00:05 5 28.8 8:17:31 0:00:05 5 28.8 8:58:15 0:00:04 4 36.0 9:26:52 0:00:02 2 72.07TH STREET 1.57 0.22 6:02:42 0:00:18 18 44.0 6:28:11 0:00:19 19 41.7 7:07:42 0:00:26 26 30.5 7:44:29 0:00:32 32 24.8 8:18:01 0:00:30 30 26.4 8:58:31 0:00:16 16 49.5 9:27:06 0:00:14 14 56.64TH STREET 1.81 0.24 6:02:56 0:00:14 14 61.7 6:28:24 0:00:13 13 66.5 7:07:58 0:00:16 16 54.0 7:44:49 0:00:20 20 43.2 8:18:19 0:00:18 18 48.0 8:58:44 0:00:13 13 66.5 9:27:19 0:00:13 13 66.51ST STREET 1.99 0.18 6:03:08 0:00:12 12 54.0 6:28:33 0:00:09 9 72.0 7:08:11 0:00:13 13 49.8 7:45:07 0:00:18 18 36.0 8:18:36 0:00:17 17 38.1 8:58:55 0:00:11 11 58.9 9:27:31 0:00:12 12 54.0SR-87-I/C 2.52 0.53 6:03:36 0:00:28 28 68.1 6:29:00 0:00:27 27 70.7 7:08:42 0:00:31 31 61.5 7:45:40 0:00:33 33 57.8 8:19:08 0:00:32 32 59.6 8:59:22 0:00:27 27 70.7 9:27:57 0:00:26 26 73.4BIRD AVENUE 2.87 0.35 6:03:58 0:00:22 22 57.3 6:29:22 0:00:22 22 57.3 7:09:02 0:00:20 20 63.0 7:46:02 0:00:22 22 57.3 8:19:29 0:00:21 21 60.0 8:59:43 0:00:21 21 60.0 9:28:16 0:00:19 19 66.3
0:02:50 0:02:47 0:03:50 0:05:01 0:04:21 0:04:13 0:02:31
MERIDIAN AVENUE 3.98 1.11 6:05:03 0:01:05 65 61.5 6:30:27 0:01:05 65 61.5 7:10:36 0:01:34 94 42.5 7:48:02 0:02:00 120 33.3 8:21:23 0:01:54 114 35.1 9:00:43 0:01:00 60 66.6 9:29:14 0:00:58 58 68.9BASCOM AVENUE 4.93 0.95 6:05:56 0:00:53 53 64.5 6:31:21 0:00:54 54 63.3 7:12:05 0:01:29 89 38.4 7:53:56 0:05:54 354 9.7 8:24:41 0:03:18 198 17.3 9:03:53 0:03:10 190 18.0 9:30:03 0:00:49 49 69.8I-880 I/C 5.40 0.47 6:06:28 0:00:32 32 52.9 6:31:57 0:00:36 36 47.0 7:12:41 0:00:36 36 47.0 7:54:57 0:01:01 61 27.7 8:25:44 0:01:03 63 26.9 9:05:41 0:01:48 108 15.7 9:30:33 0:00:30 30 56.4WINCHESTER BOULEVARD 5.94 0.54 6:07:03 0:00:35 35 55.5 6:32:36 0:00:39 39 49.8 7:13:23 0:00:42 42 46.3 7:56:59 0:02:02 122 15.9 8:27:36 0:01:52 112 17.4 9:07:30 0:01:49 109 17.8 9:31:12 0:00:39 39 49.8SARATOGA AVENUE 7.31 1.37 6:08:21 0:01:18 78 63.2 6:33:57 0:01:21 81 60.9 7:15:13 0:01:50 110 44.8 8:00:44 0:03:45 225 21.9 8:29:45 0:02:09 129 38.2 9:09:37 0:02:07 127 38.8 9:32:37 0:01:25 85 58.0LAWRENCE EXPRESSWAY 8.51 1.20 6:09:29 0:01:08 68 63.5 6:35:03 0:01:06 66 65.5 7:17:07 0:01:54 114 37.9 8:03:32 0:02:48 168 25.7 8:32:08 0:02:23 143 30.2 9:12:17 0:02:40 160 27.0 9:33:43 0:01:06 66 65.5STEVENS CREEK BLVD 8.77 0.26 6:09:48 0:00:19 19 49.3 6:35:23 0:00:20 20 46.8 7:17:51 0:00:44 44 21.3 8:04:20 0:00:48 48 19.5 8:32:54 0:00:46 46 20.3 9:12:50 0:00:33 33 28.4 9:34:04 0:00:21 21 44.6WOLFE ROAD 9.74 0.97 6:10:38 0:00:50 50 69.8 6:36:12 0:00:49 49 71.3 7:19:16 0:01:25 85 41.1 8:05:52 0:01:32 92 38.0 8:34:22 0:01:28 88 39.7 9:14:06 0:01:16 76 45.9 9:34:54 0:00:50 50 69.8DE ANZA BOULEVARD 10.79 1.05 6:11:35 0:00:57 57 66.3 6:37:09 0:00:57 57 66.3 7:20:25 0:01:09 69 54.8 8:07:17 0:01:25 85 44.5 8:35:45 0:01:23 83 45.5 9:15:38 0:01:32 92 41.1 9:36:06 0:01:12 72 52.5SR-85 I/C 12.11 1.32 6:12:43 0:01:08 68 69.9 6:38:20 0:01:11 71 66.9 7:21:57 0:01:32 92 51.7 8:08:56 0:01:39 99 48.0 8:37:07 0:01:22 82 58.0 9:16:52 0:01:14 74 64.2 9:37:19 0:01:13 73 65.1FOOTHILL EXPRESSWAY 12.82 0.71 6:13:23 0:00:40 40 63.9 6:39:02 0:00:42 42 60.9 7:22:46 0:00:49 49 52.2 8:09:48 0:00:52 52 49.2 8:37:56 0:00:49 49 52.2 9:17:33 0:00:41 41 62.3 9:37:57 0:00:38 38 67.3
0:09:25 0:09:40 0:13:44 0:23:46 0:18:27 0:17:50 0:09:41
MAGDALENA AVENUE 15.46 2.64 6:15:53 0:02:30 150 63.4 6:41:18 0:02:16 136 69.9 7:25:31 0:02:45 165 57.6 8:12:24 0:02:36 156 60.9 8:40:29 0:02:33 153 62.1 9:20:01 0:02:28 148 64.2 9:42:34 0:04:37 277 34.3EL MONTE ROAD 16.41 0.95 6:16:40 0:00:47 47 72.8 6:42:05 0:00:47 47 72.8 7:26:39 0:01:08 68 50.3 8:13:29 0:01:05 65 52.6 8:41:34 0:01:05 65 52.6 9:21:03 0:01:02 62 55.2 9:43:38 0:01:04 64 53.4PAGE MILL ROAD 19.74 3.33 6:19:52 0:03:12 192 62.4 6:45:12 0:03:07 187 64.1 7:29:59 0:03:20 200 59.9 8:16:56 0:03:27 207 57.9 8:44:43 0:03:09 189 63.4 9:24:38 0:03:35 215 55.8 9:46:42 0:03:04 184 65.2ALPINE ROAD 22.00 2.26 6:21:41 0:01:49 109 74.6 6:46:59 0:01:47 107 76.0 7:31:56 0:01:57 117 69.5 8:19:01 0:02:05 125 65.1 8:46:46 0:02:03 123 66.1 9:26:37 0:01:59 119 68.4 9:48:32 0:01:50 110 74.0
0:08:18 0:07:57 0:09:10 0:09:13 0:08:50 0:09:04 0:10:35
TOTAL 22.00 0:20:33 1233 64.2 0:20:24 1224 64.7 0:26:44 1604 49.4 0:38:00 2280 34.7 0:31:38 1898 41.7 0:31:07 1867 42.4 0:22:47 1367 57.9
0:20:33 & 64.2 MPH 0:20:24 & 64.7 MPH 0:26:44 & 49.4 MPH 0:38:00 & 34.7 MPH 0:26:50 & 49.2 MPH 0:31:07 & 42.4 MPH 0:22:47 & 57.9 MPH
0:20:24 & 64.7 MPH
0:38:00 & 34.7 MPH
0:26:38 & 49.6 MPH
Segment with HOV Lane
TOTAL RUNNING TIME USED & SPEED PER RUN
BEST RUN TIME USED & SPEED
WORST RUN TIME USED & SPEED
TOTAL RUNNING TIME USED & SPEED
DISTANCE
Time Used Time Used
Run 3
Time Used
Run 1 Run 2HOV
Time Used
Run 7
Time Used
Run 6
TEL: (510) 232 - 1271 EMAIL: baymetrics @gmail.com
S U M M A R Y
B A Y M E T R I C ST R A V E L T I M E R U N A L O N G I - 2 8 0
PROJECT:LOCATION:ROUTE & DIRECTION
TRAVEL TIME SURVEY IN SOUTH BAYFROM US-101 INTERCHANGE IN SAN JOSE TO ALPINE ROAD IN PALO ALTOROUTE 280 - NORTHBOUND FILE:
THURSDAY
3601012 - AM
SURVEY DATE:SURVEY TIME:JURISDICTION:
6:00 AM 10:00 AM1/28/2016
SOUTH BAY CITIES
Run 4
Time Used
Run 5
Time Used
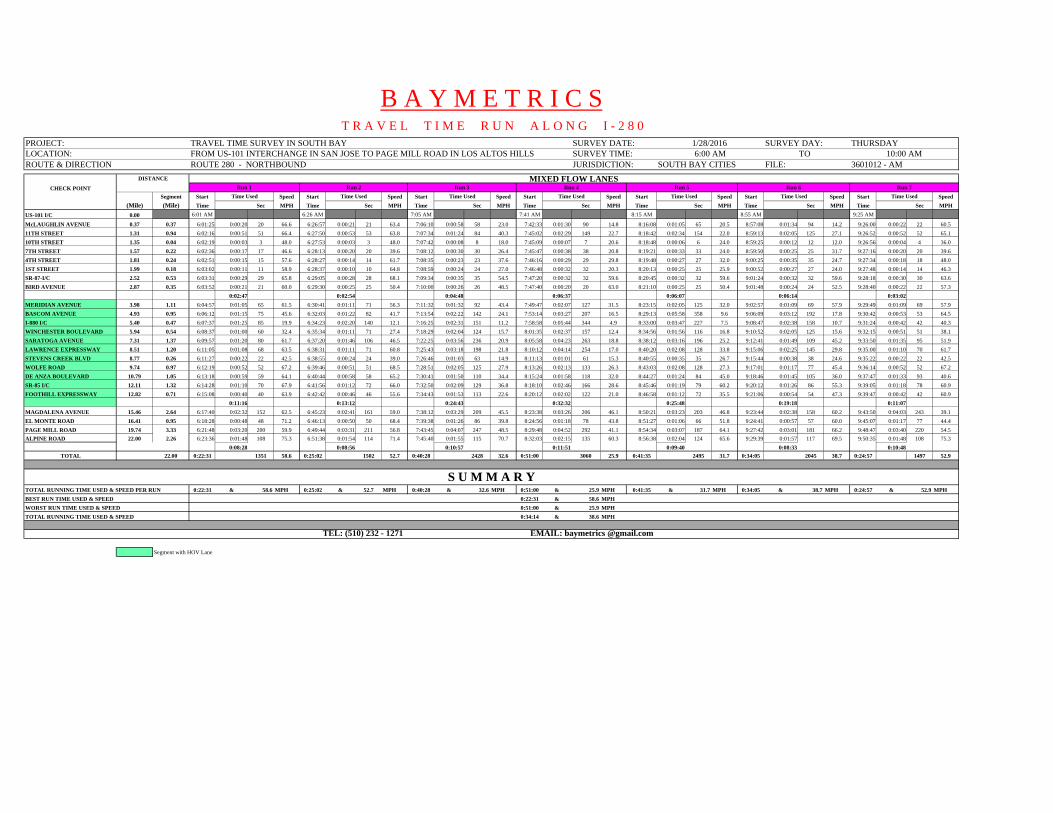
SURVEY DAY:TO
CHECK POINT
Segment Start Speed Start Speed Start Speed Start Speed Start Speed Start Speed Start Speed
(Mile) (Mile) Time Sec MPH Time Sec MPH Time Sec MPH Time Sec MPH Time Sec MPH Time Sec MPH Time Sec MPH
US-101 I/C 0.00 6:01 AM 6:26 AM 7:05 AM 7:41 AM 8:15 AM 8:55 AM 9:25 AM
McLAUGHLIN AVENUE 0.37 0.37 6:01:25 0:00:20 20 66.6 6:26:57 0:00:21 21 63.4 7:06:10 0:00:58 58 23.0 7:42:33 0:01:30 90 14.8 8:16:08 0:01:05 65 20.5 8:57:08 0:01:34 94 14.2 9:26:00 0:00:22 22 60.511TH STREET 1.31 0.94 6:02:16 0:00:51 51 66.4 6:27:50 0:00:53 53 63.8 7:07:34 0:01:24 84 40.3 7:45:02 0:02:29 149 22.7 8:18:42 0:02:34 154 22.0 8:59:13 0:02:05 125 27.1 9:26:52 0:00:52 52 65.110TH STREET 1.35 0.04 6:02:19 0:00:03 3 48.0 6:27:53 0:00:03 3 48.0 7:07:42 0:00:08 8 18.0 7:45:09 0:00:07 7 20.6 8:18:48 0:00:06 6 24.0 8:59:25 0:00:12 12 12.0 9:26:56 0:00:04 4 36.07TH STREET 1.57 0.22 6:02:36 0:00:17 17 46.6 6:28:13 0:00:20 20 39.6 7:08:12 0:00:30 30 26.4 7:45:47 0:00:38 38 20.8 8:19:21 0:00:33 33 24.0 8:59:50 0:00:25 25 31.7 9:27:16 0:00:20 20 39.64TH STREET 1.81 0.24 6:02:51 0:00:15 15 57.6 6:28:27 0:00:14 14 61.7 7:08:35 0:00:23 23 37.6 7:46:16 0:00:29 29 29.8 8:19:48 0:00:27 27 32.0 9:00:25 0:00:35 35 24.7 9:27:34 0:00:18 18 48.01ST STREET 1.99 0.18 6:03:02 0:00:11 11 58.9 6:28:37 0:00:10 10 64.8 7:08:59 0:00:24 24 27.0 7:46:48 0:00:32 32 20.3 8:20:13 0:00:25 25 25.9 9:00:52 0:00:27 27 24.0 9:27:48 0:00:14 14 46.3SR-87-I/C 2.52 0.53 6:03:31 0:00:29 29 65.8 6:29:05 0:00:28 28 68.1 7:09:34 0:00:35 35 54.5 7:47:20 0:00:32 32 59.6 8:20:45 0:00:32 32 59.6 9:01:24 0:00:32 32 59.6 9:28:18 0:00:30 30 63.6BIRD AVENUE 2.87 0.35 6:03:52 0:00:21 21 60.0 6:29:30 0:00:25 25 50.4 7:10:00 0:00:26 26 48.5 7:47:40 0:00:20 20 63.0 8:21:10 0:00:25 25 50.4 9:01:48 0:00:24 24 52.5 9:28:40 0:00:22 22 57.3
0:02:47 0:02:54 0:04:48 0:06:37 0:06:07 0:06:14 0:03:02
MERIDIAN AVENUE 3.98 1.11 6:04:57 0:01:05 65 61.5 6:30:41 0:01:11 71 56.3 7:11:32 0:01:32 92 43.4 7:49:47 0:02:07 127 31.5 8:23:15 0:02:05 125 32.0 9:02:57 0:01:09 69 57.9 9:29:49 0:01:09 69 57.9BASCOM AVENUE 4.93 0.95 6:06:12 0:01:15 75 45.6 6:32:03 0:01:22 82 41.7 7:13:54 0:02:22 142 24.1 7:53:14 0:03:27 207 16.5 8:29:13 0:05:58 358 9.6 9:06:09 0:03:12 192 17.8 9:30:42 0:00:53 53 64.5I-880 I/C 5.40 0.47 6:07:37 0:01:25 85 19.9 6:34:23 0:02:20 140 12.1 7:16:25 0:02:31 151 11.2 7:58:58 0:05:44 344 4.9 8:33:00 0:03:47 227 7.5 9:08:47 0:02:38 158 10.7 9:31:24 0:00:42 42 40.3WINCHESTER BOULEVARD 5.94 0.54 6:08:37 0:01:00 60 32.4 6:35:34 0:01:11 71 27.4 7:18:29 0:02:04 124 15.7 8:01:35 0:02:37 157 12.4 8:34:56 0:01:56 116 16.8 9:10:52 0:02:05 125 15.6 9:32:15 0:00:51 51 38.1SARATOGA AVENUE 7.31 1.37 6:09:57 0:01:20 80 61.7 6:37:20 0:01:46 106 46.5 7:22:25 0:03:56 236 20.9 8:05:58 0:04:23 263 18.8 8:38:12 0:03:16 196 25.2 9:12:41 0:01:49 109 45.2 9:33:50 0:01:35 95 51.9LAWRENCE EXPRESSWAY 8.51 1.20 6:11:05 0:01:08 68 63.5 6:38:31 0:01:11 71 60.8 7:25:43 0:03:18 198 21.8 8:10:12 0:04:14 254 17.0 8:40:20 0:02:08 128 33.8 9:15:06 0:02:25 145 29.8 9:35:00 0:01:10 70 61.7STEVENS CREEK BLVD 8.77 0.26 6:11:27 0:00:22 22 42.5 6:38:55 0:00:24 24 39.0 7:26:46 0:01:03 63 14.9 8:11:13 0:01:01 61 15.3 8:40:55 0:00:35 35 26.7 9:15:44 0:00:38 38 24.6 9:35:22 0:00:22 22 42.5WOLFE ROAD 9.74 0.97 6:12:19 0:00:52 52 67.2 6:39:46 0:00:51 51 68.5 7:28:51 0:02:05 125 27.9 8:13:26 0:02:13 133 26.3 8:43:03 0:02:08 128 27.3 9:17:01 0:01:17 77 45.4 9:36:14 0:00:52 52 67.2DE ANZA BOULEVARD 10.79 1.05 6:13:18 0:00:59 59 64.1 6:40:44 0:00:58 58 65.2 7:30:41 0:01:50 110 34.4 8:15:24 0:01:58 118 32.0 8:44:27 0:01:24 84 45.0 9:18:46 0:01:45 105 36.0 9:37:47 0:01:33 93 40.6SR-85 I/C 12.11 1.32 6:14:28 0:01:10 70 67.9 6:41:56 0:01:12 72 66.0 7:32:50 0:02:09 129 36.8 8:18:10 0:02:46 166 28.6 8:45:46 0:01:19 79 60.2 9:20:12 0:01:26 86 55.3 9:39:05 0:01:18 78 60.9FOOTHILL EXPRESSWAY 12.82 0.71 6:15:08 0:00:40 40 63.9 6:42:42 0:00:46 46 55.6 7:34:43 0:01:53 113 22.6 8:20:12 0:02:02 122 21.0 8:46:58 0:01:12 72 35.5 9:21:06 0:00:54 54 47.3 9:39:47 0:00:42 42 60.9
0:11:16 0:13:12 0:24:43 0:32:32 0:25:48 0:19:18 0:11:07
MAGDALENA AVENUE 15.46 2.64 6:17:40 0:02:32 152 62.5 6:45:23 0:02:41 161 59.0 7:38:12 0:03:29 209 45.5 8:23:38 0:03:26 206 46.1 8:50:21 0:03:23 203 46.8 9:23:44 0:02:38 158 60.2 9:43:50 0:04:03 243 39.1EL MONTE ROAD 16.41 0.95 6:18:28 0:00:48 48 71.2 6:46:13 0:00:50 50 68.4 7:39:38 0:01:26 86 39.8 8:24:56 0:01:18 78 43.8 8:51:27 0:01:06 66 51.8 9:24:41 0:00:57 57 60.0 9:45:07 0:01:17 77 44.4PAGE MILL ROAD 19.74 3.33 6:21:48 0:03:20 200 59.9 6:49:44 0:03:31 211 56.8 7:43:45 0:04:07 247 48.5 8:29:48 0:04:52 292 41.1 8:54:34 0:03:07 187 64.1 9:27:42 0:03:01 181 66.2 9:48:47 0:03:40 220 54.5ALPINE ROAD 22.00 2.26 6:23:36 0:01:48 108 75.3 6:51:38 0:01:54 114 71.4 7:45:40 0:01:55 115 70.7 8:32:03 0:02:15 135 60.3 8:56:38 0:02:04 124 65.6 9:29:39 0:01:57 117 69.5 9:50:35 0:01:48 108 75.3
0:08:28 0:08:56 0:10:57 0:11:51 0:09:40 0:08:33 0:10:48
TOTAL 22.00 0:22:31 1351 58.6 0:25:02 1502 52.7 0:40:28 2428 32.6 0:51:00 3060 25.9 0:41:35 2495 31.7 0:34:05 2045 38.7 0:24:57 1497 52.9
0:22:31 & 58.6 MPH 0:25:02 & 52.7 MPH 0:40:28 & 32.6 MPH 0:51:00 & 25.9 MPH 0:41:35 & 31.7 MPH 0:34:05 & 38.7 MPH 0:24:57 & 52.9 MPH
0:22:31 & 58.6 MPH
0:51:00 & 25.9 MPH
0:34:14 & 38.6 MPH
Segment with HOV Lane
FROM US-101 INTERCHANGE IN SAN JOSE TO PAGE MILL ROAD IN LOS ALTOS HILLS SURVEY TIME: 6:00 AM 10:00 AMROUTE 280 - NORTHBOUND JURISDICTION: SOUTH BAY CITIES FILE: 3601012 - AM
TEL: (510) 232 - 1271 EMAIL: baymetrics @gmail.com
ROUTE & DIRECTION
S U M M A R Y
LOCATION:
TOTAL RUNNING TIME USED & SPEED PER RUN
BEST RUN TIME USED & SPEED
WORST RUN TIME USED & SPEED
TOTAL RUNNING TIME USED & SPEED
Time Used Time Used
Run 4 Run 5
Time Used Time Used Time Used Time Used Time Used
Run 6 Run 7MIXED FLOW LANESDISTANCE
Run 1 Run 2 Run 3
B A Y M E T R I C ST R A V E L T I M E R U N A L O N G I - 2 8 0
PROJECT: TRAVEL TIME SURVEY IN SOUTH BAY SURVEY DATE: 1/28/2016 THURSDAY
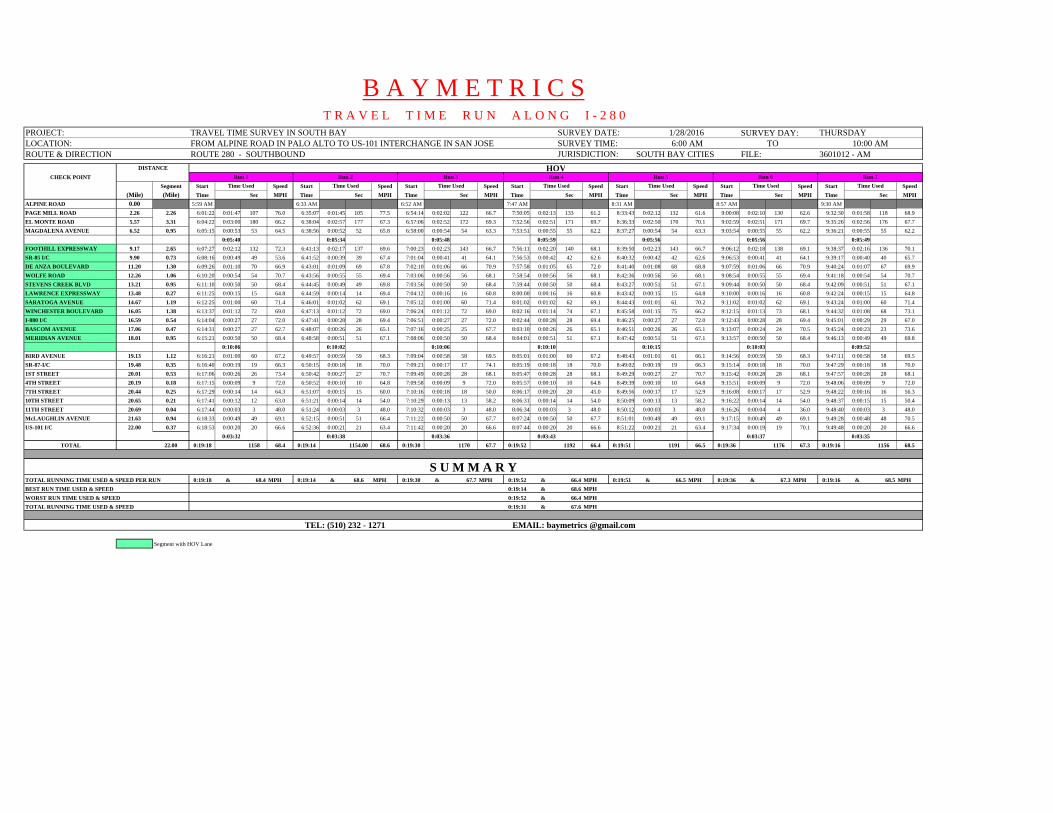
SURVEY DAY:TO
CHECK POINT
Segment Start Speed Start Speed Start Speed Start Speed Start Speed Start Speed Start Speed
(Mile) (Mile) Time Sec MPH Time Sec MPH Time Sec MPH Time Sec MPH Time Sec MPH Time Sec MPH Time Sec MPH
ALPINE ROAD 0.00 5:59 AM 6:33 AM 6:52 AM 7:47 AM 8:31 AM 8:57 AM 9:30 AMPAGE MILL ROAD 2.26 2.26 6:01:22 0:01:47 107 76.0 6:35:07 0:01:45 105 77.5 6:54:14 0:02:02 122 66.7 7:50:05 0:02:13 133 61.2 8:33:43 0:02:12 132 61.6 9:00:08 0:02:10 130 62.6 9:32:30 0:01:58 118 68.9EL MONTE ROAD 5.57 3.31 6:04:22 0:03:00 180 66.2 6:38:04 0:02:57 177 67.3 6:57:06 0:02:52 172 69.3 7:52:56 0:02:51 171 69.7 8:36:33 0:02:50 170 70.1 9:02:59 0:02:51 171 69.7 9:35:26 0:02:56 176 67.7MAGDALENA AVENUE 6.52 0.95 6:05:15 0:00:53 53 64.5 6:38:56 0:00:52 52 65.8 6:58:00 0:00:54 54 63.3 7:53:51 0:00:55 55 62.2 8:37:27 0:00:54 54 63.3 9:03:54 0:00:55 55 62.2 9:36:21 0:00:55 55 62.2
0:05:40 0:05:34 0:05:48 0:05:59 0:05:56 0:05:56 0:05:49
FOOTHILL EXPRESSWAY 9.17 2.65 6:07:27 0:02:12 132 72.3 6:41:13 0:02:17 137 69.6 7:00:23 0:02:23 143 66.7 7:56:11 0:02:20 140 68.1 8:39:50 0:02:23 143 66.7 9:06:12 0:02:18 138 69.1 9:38:37 0:02:16 136 70.1SR-85 I/C 9.90 0.73 6:08:16 0:00:49 49 53.6 6:41:52 0:00:39 39 67.4 7:01:04 0:00:41 41 64.1 7:56:53 0:00:42 42 62.6 8:40:32 0:00:42 42 62.6 9:06:53 0:00:41 41 64.1 9:39:17 0:00:40 40 65.7DE ANZA BOULEVARD 11.20 1.30 6:09:26 0:01:10 70 66.9 6:43:01 0:01:09 69 67.8 7:02:10 0:01:06 66 70.9 7:57:58 0:01:05 65 72.0 8:41:40 0:01:08 68 68.8 9:07:59 0:01:06 66 70.9 9:40:24 0:01:07 67 69.9WOLFE ROAD 12.26 1.06 6:10:20 0:00:54 54 70.7 6:43:56 0:00:55 55 69.4 7:03:06 0:00:56 56 68.1 7:58:54 0:00:56 56 68.1 8:42:36 0:00:56 56 68.1 9:08:54 0:00:55 55 69.4 9:41:18 0:00:54 54 70.7STEVENS CREEK BLVD 13.21 0.95 6:11:10 0:00:50 50 68.4 6:44:45 0:00:49 49 69.8 7:03:56 0:00:50 50 68.4 7:59:44 0:00:50 50 68.4 8:43:27 0:00:51 51 67.1 9:09:44 0:00:50 50 68.4 9:42:09 0:00:51 51 67.1LAWRENCE EXPRESSWAY 13.48 0.27 6:11:25 0:00:15 15 64.8 6:44:59 0:00:14 14 69.4 7:04:12 0:00:16 16 60.8 8:00:00 0:00:16 16 60.8 8:43:42 0:00:15 15 64.8 9:10:00 0:00:16 16 60.8 9:42:24 0:00:15 15 64.8SARATOGA AVENUE 14.67 1.19 6:12:25 0:01:00 60 71.4 6:46:01 0:01:02 62 69.1 7:05:12 0:01:00 60 71.4 8:01:02 0:01:02 62 69.1 8:44:43 0:01:01 61 70.2 9:11:02 0:01:02 62 69.1 9:43:24 0:01:00 60 71.4WINCHESTER BOULEVARD 16.05 1.38 6:13:37 0:01:12 72 69.0 6:47:13 0:01:12 72 69.0 7:06:24 0:01:12 72 69.0 8:02:16 0:01:14 74 67.1 8:45:58 0:01:15 75 66.2 9:12:15 0:01:13 73 68.1 9:44:32 0:01:08 68 73.1I-880 I/C 16.59 0.54 6:14:04 0:00:27 27 72.0 6:47:41 0:00:28 28 69.4 7:06:51 0:00:27 27 72.0 8:02:44 0:00:28 28 69.4 8:46:25 0:00:27 27 72.0 9:12:43 0:00:28 28 69.4 9:45:01 0:00:29 29 67.0BASCOM AVENUE 17.06 0.47 6:14:31 0:00:27 27 62.7 6:48:07 0:00:26 26 65.1 7:07:16 0:00:25 25 67.7 8:03:10 0:00:26 26 65.1 8:46:51 0:00:26 26 65.1 9:13:07 0:00:24 24 70.5 9:45:24 0:00:23 23 73.6MERIDIAN AVENUE 18.01 0.95 6:15:21 0:00:50 50 68.4 6:48:58 0:00:51 51 67.1 7:08:06 0:00:50 50 68.4 8:04:01 0:00:51 51 67.1 8:47:42 0:00:51 51 67.1 9:13:57 0:00:50 50 68.4 9:46:13 0:00:49 49 69.8
0:10:06 0:10:02 0:10:06 0:10:10 0:10:15 0:10:03 0:09:52
BIRD AVENUE 19.13 1.12 6:16:21 0:01:00 60 67.2 6:49:57 0:00:59 59 68.3 7:09:04 0:00:58 58 69.5 8:05:01 0:01:00 60 67.2 8:48:43 0:01:01 61 66.1 9:14:56 0:00:59 59 68.3 9:47:11 0:00:58 58 69.5SR-87-I/C 19.48 0.35 6:16:40 0:00:19 19 66.3 6:50:15 0:00:18 18 70.0 7:09:21 0:00:17 17 74.1 8:05:19 0:00:18 18 70.0 8:49:02 0:00:19 19 66.3 9:15:14 0:00:18 18 70.0 9:47:29 0:00:18 18 70.01ST STREET 20.01 0.53 6:17:06 0:00:26 26 73.4 6:50:42 0:00:27 27 70.7 7:09:49 0:00:28 28 68.1 8:05:47 0:00:28 28 68.1 8:49:29 0:00:27 27 70.7 9:15:42 0:00:28 28 68.1 9:47:57 0:00:28 28 68.14TH STREET 20.19 0.18 6:17:15 0:00:09 9 72.0 6:50:52 0:00:10 10 64.8 7:09:58 0:00:09 9 72.0 8:05:57 0:00:10 10 64.8 8:49:39 0:00:10 10 64.8 9:15:51 0:00:09 9 72.0 9:48:06 0:00:09 9 72.07TH STREET 20.44 0.25 6:17:29 0:00:14 14 64.3 6:51:07 0:00:15 15 60.0 7:10:16 0:00:18 18 50.0 8:06:17 0:00:20 20 45.0 8:49:56 0:00:17 17 52.9 9:16:08 0:00:17 17 52.9 9:48:22 0:00:16 16 56.310TH STREET 20.65 0.21 6:17:41 0:00:12 12 63.0 6:51:21 0:00:14 14 54.0 7:10:29 0:00:13 13 58.2 8:06:31 0:00:14 14 54.0 8:50:09 0:00:13 13 58.2 9:16:22 0:00:14 14 54.0 9:48:37 0:00:15 15 50.411TH STREET 20.69 0.04 6:17:44 0:00:03 3 48.0 6:51:24 0:00:03 3 48.0 7:10:32 0:00:03 3 48.0 8:06:34 0:00:03 3 48.0 8:50:12 0:00:03 3 48.0 9:16:26 0:00:04 4 36.0 9:48:40 0:00:03 3 48.0McLAUGHLIN AVENUE 21.63 0.94 6:18:33 0:00:49 49 69.1 6:52:15 0:00:51 51 66.4 7:11:22 0:00:50 50 67.7 8:07:24 0:00:50 50 67.7 8:51:01 0:00:49 49 69.1 9:17:15 0:00:49 49 69.1 9:49:28 0:00:48 48 70.5US-101 I/C 22.00 0.37 6:18:53 0:00:20 20 66.6 6:52:36 0:00:21 21 63.4 7:11:42 0:00:20 20 66.6 8:07:44 0:00:20 20 66.6 8:51:22 0:00:21 21 63.4 9:17:34 0:00:19 19 70.1 9:49:48 0:00:20 20 66.6
0:03:32 0:03:38 0:03:36 0:03:43 0:03:37 0:03:35
TOTAL 22.00 0:19:18 1158 68.4 0:19:14 1154.00 68.6 0:19:30 1170 67.7 0:19:52 1192 66.4 0:19:51 1191 66.5 0:19:36 1176 67.3 0:19:16 1156 68.5
0:19:18 & 68.4 MPH 0:19:14 & 68.6 MPH 0:19:30 & 67.7 MPH 0:19:52 & 66.4 MPH 0:19:51 & 66.5 MPH 0:19:36 & 67.3 MPH 0:19:16 & 68.5 MPH
0:19:14 & 68.6 MPH
0:19:52 & 66.4 MPH
0:19:31 & 67.6 MPH
Segment with HOV Lane
TOTAL RUNNING TIME USED & SPEED
TEL: (510) 232 - 1271 EMAIL: baymetrics @gmail.com
DISTANCE
Time Used Time Used Time Used
Run 2 Run 7Run 6Run 5Run 4
Time Used Time Used Time Used Time Used
S U M M A R YTOTAL RUNNING TIME USED & SPEED PER RUN
BEST RUN TIME USED & SPEED
WORST RUN TIME USED & SPEED
LOCATION: FROM ALPINE ROAD IN PALO ALTO TO US-101 INTERCHANGE IN SAN JOSE SURVEY TIME: 6:00 AM 10:00 AM
B A Y M E T R I C ST R A V E L T I M E R U N A L O N G I - 2 8 0
PROJECT: TRAVEL TIME SURVEY IN SOUTH BAY SURVEY DATE: 1/28/2016 THURSDAY
HOV
ROUTE 280 - SOUTHBOUND JURISDICTION: SOUTH BAY CITIES FILE: 3601012 - AMROUTE & DIRECTION
Run 1 Run 3
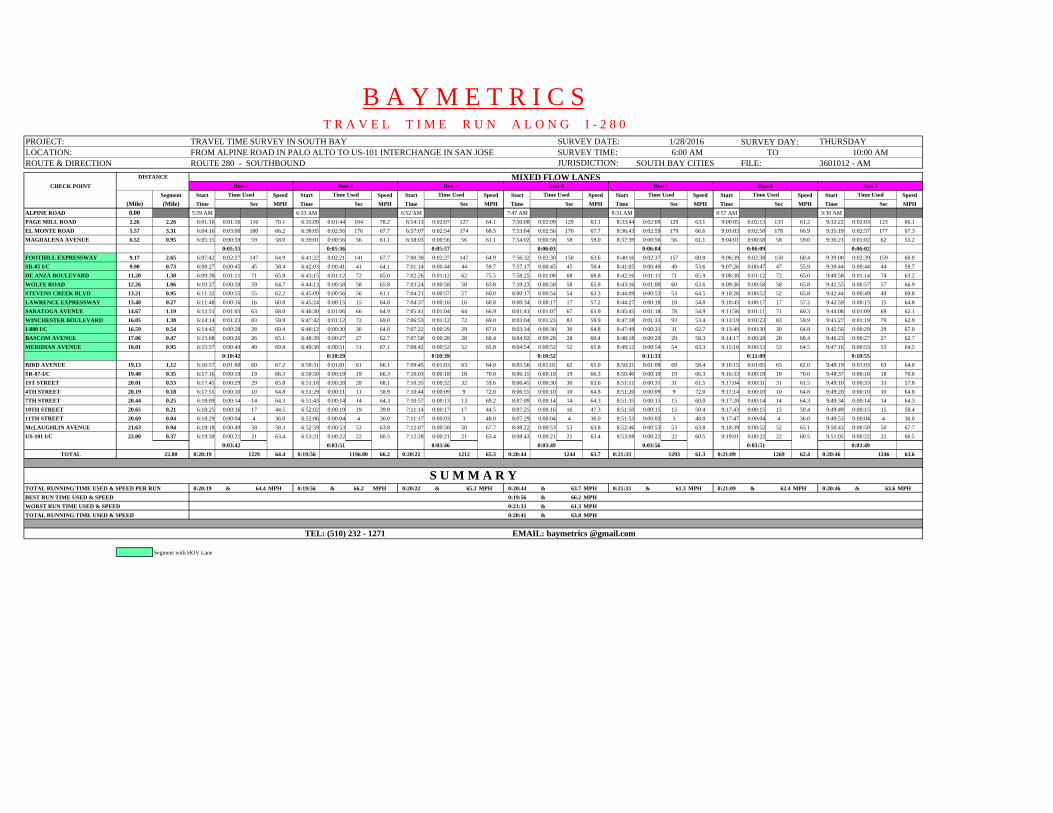
SURVEY DAY:TO
CHECK POINT
Segment Start Speed Start Speed Start Speed Start Speed Start Speed Start Speed Start Speed
(Mile) (Mile) Time Sec MPH Time Sec MPH Time Sec MPH Time Sec MPH Time Sec MPH Time Sec MPH Time Sec MPH
ALPINE ROAD 0.00 5:59 AM 6:33 AM 6:52 AM 7:47 AM 8:31 AM 8:57 AM 9:30 AMPAGE MILL ROAD 2.26 2.26 6:01:16 0:01:56 116 70.1 6:35:09 0:01:44 104 78.2 6:54:13 0:02:07 127 64.1 7:50:08 0:02:09 129 63.1 8:33:44 0:02:09 129 63.1 9:00:05 0:02:13 133 61.2 9:32:22 0:02:03 123 66.1EL MONTE ROAD 5.57 3.31 6:04:16 0:03:00 180 66.2 6:38:05 0:02:56 176 67.7 6:57:07 0:02:54 174 68.5 7:53:04 0:02:56 176 67.7 8:36:43 0:02:59 179 66.6 9:03:03 0:02:58 178 66.9 9:35:19 0:02:57 177 67.3MAGDALENA AVENUE 6.52 0.95 6:05:15 0:00:59 59 58.0 6:39:01 0:00:56 56 61.1 6:58:03 0:00:56 56 61.1 7:54:02 0:00:58 58 59.0 8:37:39 0:00:56 56 61.1 9:04:01 0:00:58 58 59.0 9:36:21 0:01:02 62 55.2
0:05:55 0:05:36 0:05:57 0:06:03 0:06:04 0:06:09 0:06:02
FOOTHILL EXPRESSWAY 9.17 2.65 6:07:42 0:02:27 147 64.9 6:41:22 0:02:21 141 67.7 7:00:30 0:02:27 147 64.9 7:56:32 0:02:30 150 63.6 8:40:16 0:02:37 157 60.8 9:06:39 0:02:38 158 60.4 9:39:00 0:02:39 159 60.0SR-85 I/C 9.90 0.73 6:08:27 0:00:45 45 58.4 6:42:03 0:00:41 41 64.1 7:01:14 0:00:44 44 59.7 7:57:17 0:00:45 45 58.4 8:41:05 0:00:49 49 53.6 9:07:26 0:00:47 47 55.9 9:39:44 0:00:44 44 59.7DE ANZA BOULEVARD 11.20 1.30 6:09:38 0:01:11 71 65.9 6:43:15 0:01:12 72 65.0 7:02:26 0:01:12 62 75.5 7:58:25 0:01:08 68 68.8 8:42:16 0:01:11 71 65.9 9:08:38 0:01:12 72 65.0 9:40:58 0:01:14 74 63.2WOLFE ROAD 12.26 1.06 6:10:37 0:00:59 59 64.7 6:44:13 0:00:58 58 65.8 7:03:24 0:00:58 58 65.8 7:59:23 0:00:58 58 65.8 8:43:16 0:01:00 60 63.6 9:09:36 0:00:58 58 65.8 9:41:55 0:00:57 57 66.9STEVENS CREEK BLVD 13.21 0.95 6:11:32 0:00:55 55 62.2 6:45:09 0:00:56 56 61.1 7:04:21 0:00:57 57 60.0 8:00:17 0:00:54 54 63.3 8:44:09 0:00:53 53 64.5 9:10:28 0:00:52 52 65.8 9:42:44 0:00:49 49 69.8LAWRENCE EXPRESSWAY 13.48 0.27 6:11:48 0:00:16 16 60.8 6:45:24 0:00:15 15 64.8 7:04:37 0:00:16 16 60.8 8:00:34 0:00:17 17 57.2 8:44:27 0:00:18 18 54.0 9:10:45 0:00:17 17 57.2 9:42:59 0:00:15 15 64.8SARATOGA AVENUE 14.67 1.19 6:12:51 0:01:03 63 68.0 6:46:30 0:01:06 66 64.9 7:05:41 0:01:04 64 66.9 8:01:41 0:01:07 67 63.9 8:45:45 0:01:18 78 54.9 9:11:56 0:01:11 71 60.3 9:44:08 0:01:09 69 62.1WINCHESTER BOULEVARD 16.05 1.38 6:14:14 0:01:23 83 59.9 6:47:42 0:01:12 72 69.0 7:06:53 0:01:12 72 69.0 8:03:04 0:01:23 83 59.9 8:47:18 0:01:33 93 53.4 9:13:19 0:01:23 83 59.9 9:45:27 0:01:19 79 62.9I-880 I/C 16.59 0.54 6:14:42 0:00:28 28 69.4 6:48:12 0:00:30 30 64.8 7:07:22 0:00:29 29 67.0 8:03:34 0:00:30 30 64.8 8:47:49 0:00:31 31 62.7 9:13:49 0:00:30 30 64.8 9:45:56 0:00:29 29 67.0BASCOM AVENUE 17.06 0.47 6:15:08 0:00:26 26 65.1 6:48:39 0:00:27 27 62.7 7:07:50 0:00:28 28 60.4 8:04:02 0:00:28 28 60.4 8:48:18 0:00:29 29 58.3 9:14:17 0:00:28 28 60.4 9:46:23 0:00:27 27 62.7MERIDIAN AVENUE 18.01 0.95 6:15:57 0:00:49 49 69.8 6:49:30 0:00:51 51 67.1 7:08:42 0:00:52 52 65.8 8:04:54 0:00:52 52 65.8 8:49:12 0:00:54 54 63.3 9:15:10 0:00:53 53 64.5 9:47:16 0:00:53 53 64.5
0:10:42 0:10:29 0:10:39 0:10:52 0:11:33 0:11:09 0:10:55
BIRD AVENUE 19.13 1.12 6:16:57 0:01:00 60 67.2 6:50:31 0:01:01 61 66.1 7:09:45 0:01:03 63 64.0 8:05:56 0:01:02 62 65.0 8:50:21 0:01:09 69 58.4 9:16:15 0:01:05 65 62.0 9:48:19 0:01:03 63 64.0SR-87-I/C 19.48 0.35 6:17:16 0:00:19 19 66.3 6:50:50 0:00:19 19 66.3 7:10:03 0:00:18 18 70.0 8:06:15 0:00:19 19 66.3 8:50:40 0:00:19 19 66.3 9:16:33 0:00:18 18 70.0 9:48:37 0:00:18 18 70.01ST STREET 20.01 0.53 6:17:45 0:00:29 29 65.8 6:51:18 0:00:28 28 68.1 7:10:35 0:00:32 32 59.6 8:06:45 0:00:30 30 63.6 8:51:11 0:00:31 31 61.5 9:17:04 0:00:31 31 61.5 9:49:10 0:00:33 33 57.84TH STREET 20.19 0.18 6:17:55 0:00:10 10 64.8 6:51:29 0:00:11 11 58.9 7:10:44 0:00:09 9 72.0 8:06:55 0:00:10 10 64.8 8:51:20 0:00:09 9 72.0 9:17:14 0:00:10 10 64.8 9:49:20 0:00:10 10 64.87TH STREET 20.44 0.25 6:18:09 0:00:14 14 64.3 6:51:43 0:00:14 14 64.3 7:10:57 0:00:13 13 69.2 8:07:09 0:00:14 14 64.3 8:51:35 0:00:15 15 60.0 9:17:28 0:00:14 14 64.3 9:49:34 0:00:14 14 64.310TH STREET 20.65 0.21 6:18:25 0:00:16 17 44.5 6:52:02 0:00:19 19 39.8 7:11:14 0:00:17 17 44.5 8:07:25 0:00:16 16 47.3 8:51:50 0:00:15 15 50.4 9:17:43 0:00:15 15 50.4 9:49:49 0:00:15 15 50.411TH STREET 20.69 0.04 6:18:29 0:00:04 4 36.0 6:52:06 0:00:04 4 36.0 7:11:17 0:00:03 3 48.0 8:07:29 0:00:04 4 36.0 8:51:53 0:00:03 3 48.0 9:17:47 0:00:04 4 36.0 9:49:53 0:00:04 4 36.0McLAUGHLIN AVENUE 21.63 0.94 6:19:18 0:00:49 58 58.3 6:52:59 0:00:53 53 63.8 7:12:07 0:00:50 50 67.7 8:08:22 0:00:53 53 63.8 8:52:46 0:00:53 53 63.8 9:18:39 0:00:52 52 65.1 9:50:43 0:00:50 50 67.7US-101 I/C 22.00 0.37 6:19:39 0:00:21 21 63.4 6:53:21 0:00:22 22 60.5 7:12:28 0:00:21 21 63.4 8:08:43 0:00:21 21 63.4 8:53:08 0:00:22 22 60.5 9:19:01 0:00:22 22 60.5 9:51:05 0:00:22 22 60.5
0:03:42 0:03:51 0:03:46 0:03:49 0:03:56 0:03:51 0:03:49
TOTAL 22.00 0:20:19 1229 64.4 0:19:56 1196.00 66.2 0:20:22 1212 65.3 0:20:44 1244 63.7 0:21:33 1293 61.3 0:21:09 1269 62.4 0:20:46 1246 63.6
0:20:19 & 64.4 MPH 0:19:56 & 66.2 MPH 0:20:22 & 65.3 MPH 0:20:44 & 63.7 MPH 0:21:33 & 61.3 MPH 0:21:09 & 62.4 MPH 0:20:46 & 63.6 MPH
0:19:56 & 66.2 MPH
0:21:33 & 61.3 MPH
0:20:41 & 63.8 MPH
Segment with HOV Lane
6:00 AM 10:00 AMROUTE & DIRECTION ROUTE 280 - SOUTHBOUND JURISDICTION: SOUTH BAY CITIES FILE: 3601012 - AM
Run 1 Run 2 Run 3
DISTANCE
TOTAL RUNNING TIME USED & SPEED PER RUN
BEST RUN TIME USED & SPEED
WORST RUN TIME USED & SPEED
TOTAL RUNNING TIME USED & SPEED
TEL: (510) 232 - 1271 EMAIL: baymetrics @gmail.com
S U M M A R Y
B A Y M E T R I C ST R A V E L T I M E R U N A L O N G I - 2 8 0
PROJECT: TRAVEL TIME SURVEY IN SOUTH BAY SURVEY DATE: 1/28/2016 THURSDAYLOCATION: FROM ALPINE ROAD IN PALO ALTO TO US-101 INTERCHANGE IN SAN JOSE SURVEY TIME:
Run 4 Run 5 Run 6 Run 7
Time Used Time UsedTime Used Time Used Time Used Time Used Time Used
MIXED FLOW LANES
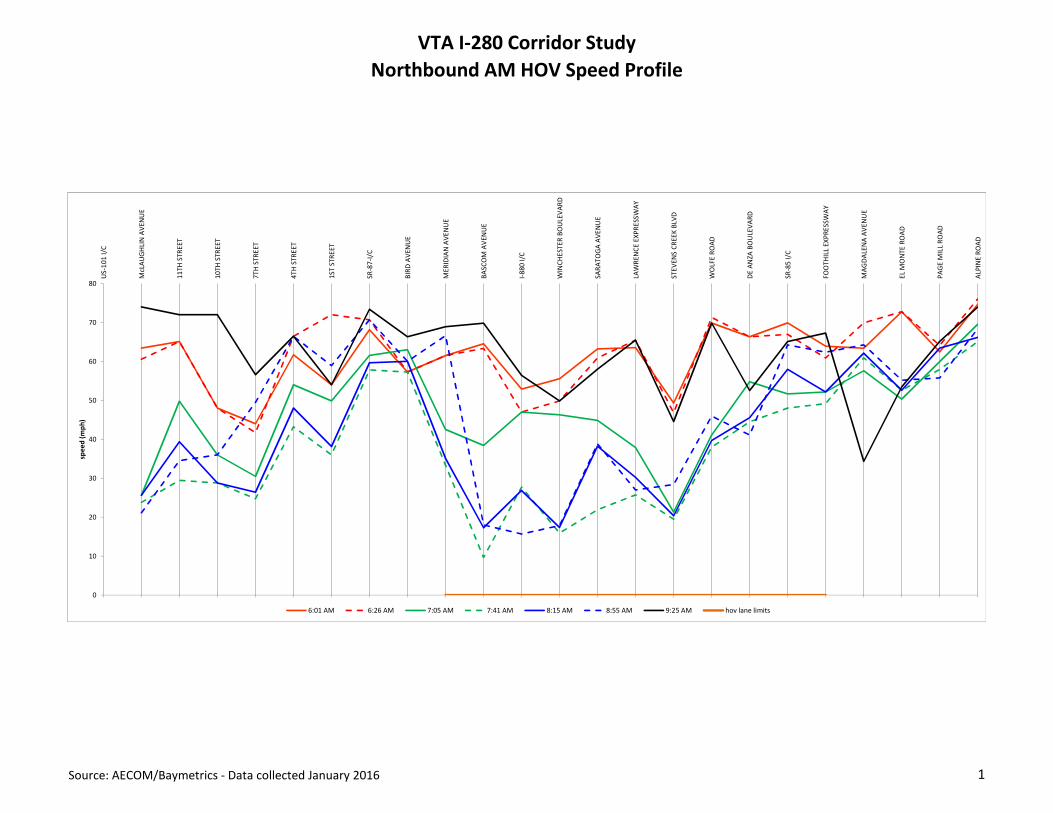
VTA I-280 Corridor Study
Northbound AM HOV Speed Profile
Source: AECOM/Baymetrics - Data collected January 2016 1
0
10
20
30
40
50
60
70
80
US
-10
1 I
/C
McL
AU
GH
LIN
AV
EN
UE
11
TH
ST
RE
ET
10
TH
ST
RE
ET
7T
H S
TR
EE
T
4T
H S
TR
EE
T
1S
T S
TR
EE
T
SR
-87
-I/C
BIR
D A
VE
NU
E
ME
RID
IAN
AV
EN
UE
BA
SC
OM
AV
EN
UE
I-8
80
I/C
WIN
CH
ES
TE
R B
OU
LEV
AR
D
SA
RA
TO
GA
AV
EN
UE
LAW
RE
NC
E E
XP
RE
SSW
AY
ST
EV
EN
S C
RE
EK
BLV
D
WO
LFE
RO
AD
DE
AN
ZA
BO
ULE
VA
RD
SR
-85
I/C
FO
OT
HIL
L E
XP
RE
SS
WA
Y
MA
GD
ALE
NA
AV
EN
UE
EL
MO
NT
E R
OA
D
PA
GE
MIL
L R
OA
D
ALP
INE
RO
AD
spe
ed
(m
ph
)
6:01 AM 6:26 AM 7:05 AM 7:41 AM 8:15 AM 8:55 AM 9:25 AM hov lane limits
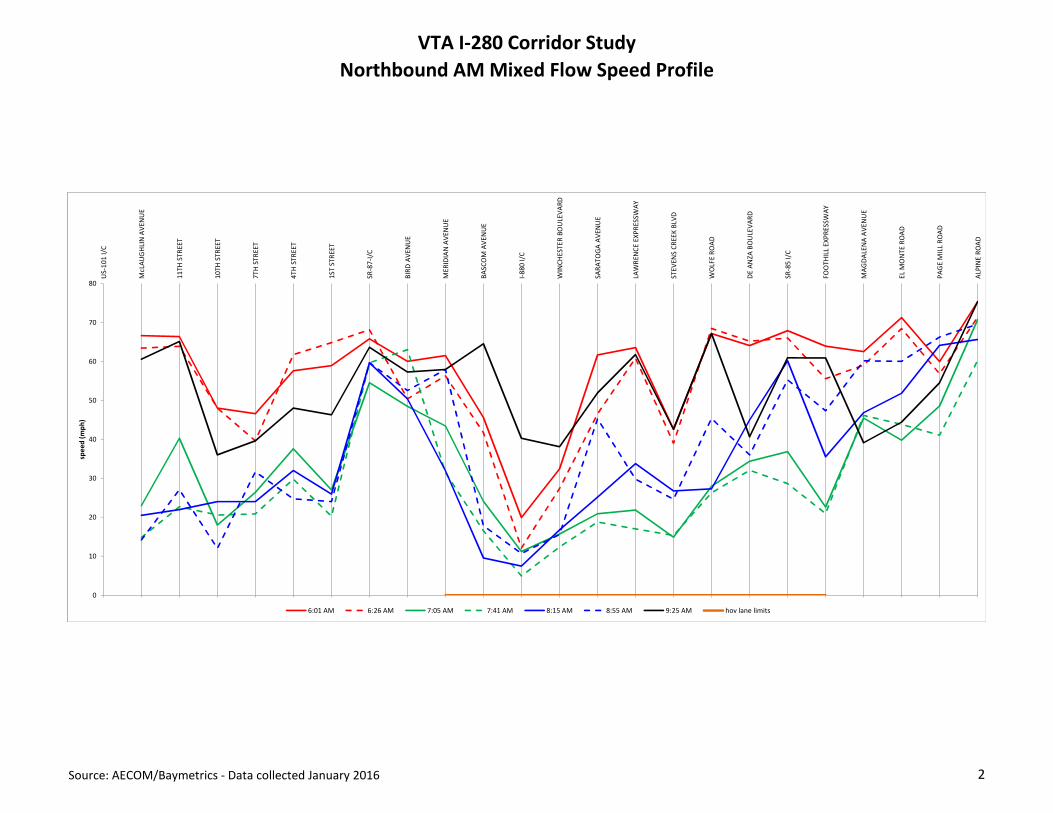
VTA I-280 Corridor Study
Northbound AM Mixed Flow Speed Profile
Source: AECOM/Baymetrics - Data collected January 2016 2
0
10
20
30
40
50
60
70
80
US
-10
1 I
/C
McL
AU
GH
LIN
AV
EN
UE
11
TH
ST
RE
ET
10
TH
ST
RE
ET
7T
H S
TR
EE
T
4T
H S
TR
EE
T
1S
T S
TR
EE
T
SR
-87
-I/C
BIR
D A
VE
NU
E
ME
RID
IAN
AV
EN
UE
BA
SC
OM
AV
EN
UE
I-8
80
I/C
WIN
CH
ES
TE
R B
OU
LEV
AR
D
SA
RA
TO
GA
AV
EN
UE
LAW
RE
NC
E E
XP
RE
SS
WA
Y
ST
EV
EN
S C
RE
EK
BLV
D
WO
LFE
RO
AD
DE
AN
ZA
BO
ULE
VA
RD
SR
-85
I/C
FO
OT
HIL
L E
XP
RE
SS
WA
Y
MA
GD
ALE
NA
AV
EN
UE
EL
MO
NT
E R
OA
D
PA
GE
MIL
L R
OA
D
ALP
INE
RO
AD
spe
ed
(m
ph
)
6:01 AM 6:26 AM 7:05 AM 7:41 AM 8:15 AM 8:55 AM 9:25 AM hov lane limits
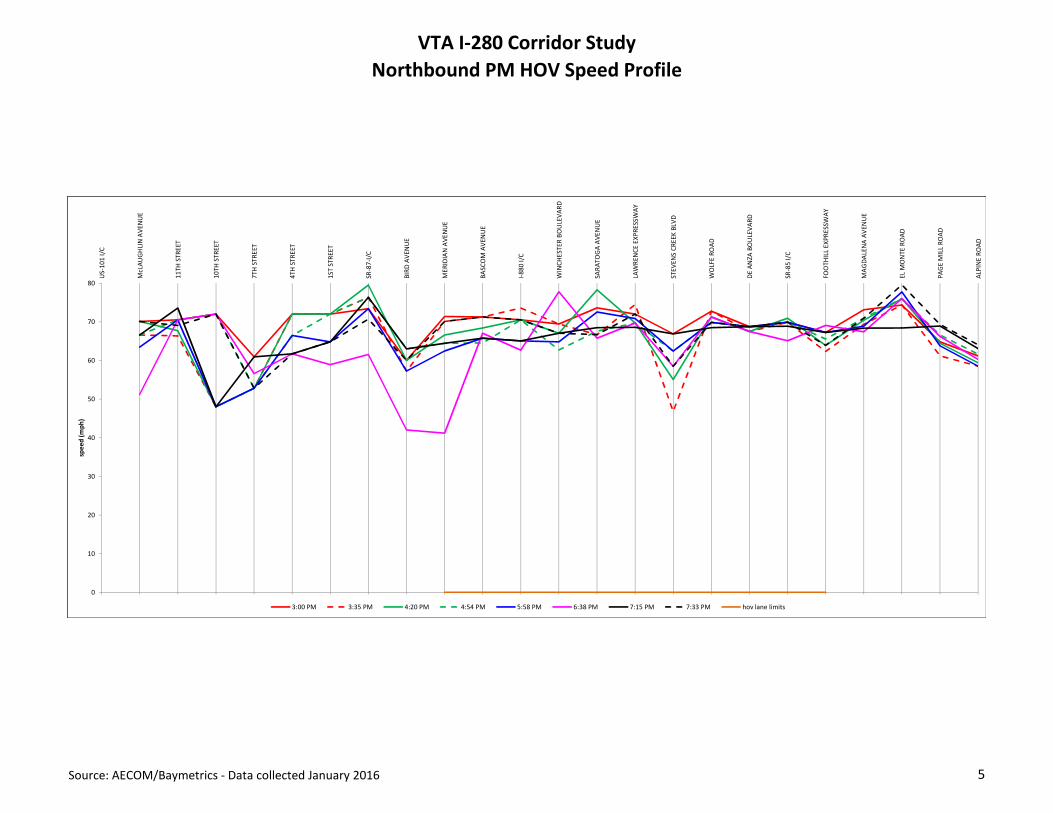
VTA I-280 Corridor Study
Northbound PM HOV Speed Profile
Source: AECOM/Baymetrics - Data collected January 2016 5
0
10
20
30
40
50
60
70
80
US
-10
1 I
/C
McL
AU
GH
LIN
AV
EN
UE
11
TH
ST
RE
ET
10
TH
ST
RE
ET
7T
H S
TR
EE
T
4T
H S
TR
EE
T
1S
T S
TR
EE
T
SR-8
7-I
/C
BIR
D A
VE
NU
E
ME
RID
IAN
AV
EN
UE
BA
SC
OM
AV
EN
UE
I-8
80
I/C
WIN
CH
EST
ER
BO
ULE
VA
RD
SAR
AT
OG
A A
VE
NU
E
LAW
RE
NC
E E
XP
RE
SSW
AY
STE
VE
NS
CR
EE
K B
LVD
WO
LFE
RO
AD
DE
AN
ZA
BO
ULE
VA
RD
SR-8
5 I
/C
FOO
TH
ILL
EX
PR
ES
SW
AY
MA
GD
ALE
NA
AV
EN
UE
EL
MO
NT
E R
OA
D
PA
GE
MIL
L R
OA
D
ALP
INE
RO
AD
spe
ed
(m
ph
)
3:00 PM 3:35 PM 4:20 PM 4:54 PM 5:58 PM 6:38 PM 7:15 PM 7:33 PM hov lane limits
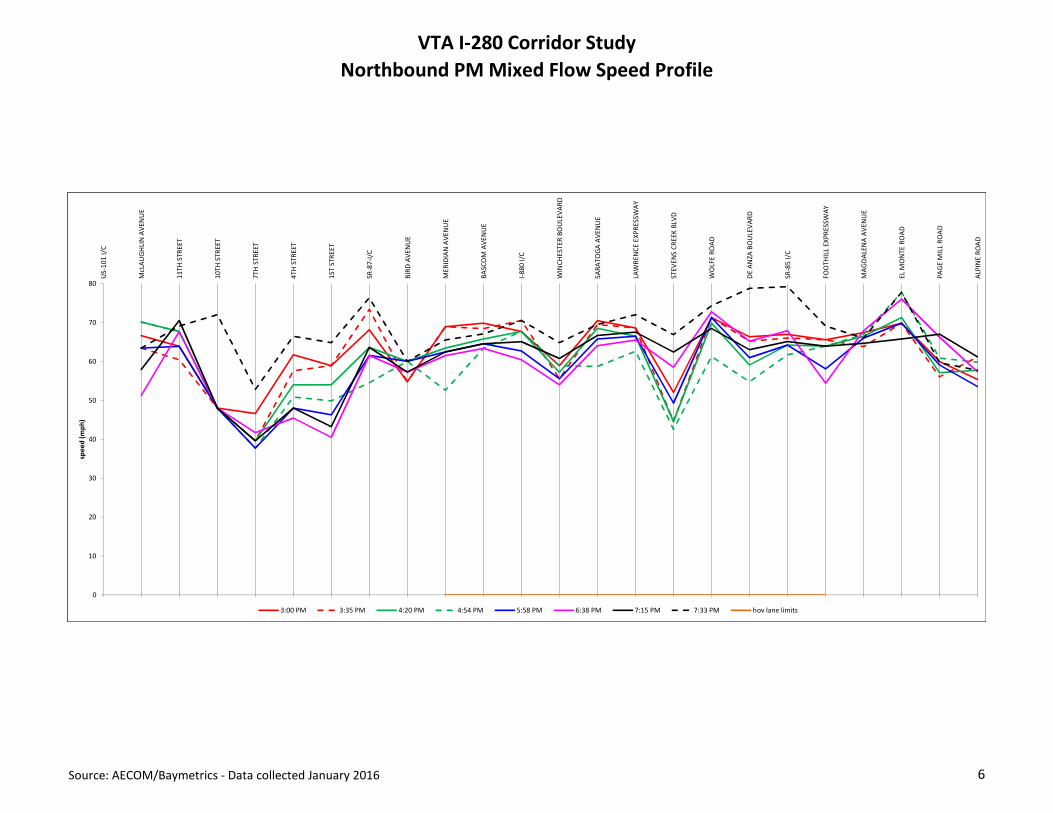
VTA I-280 Corridor Study
Northbound PM Mixed Flow Speed Profile
Source: AECOM/Baymetrics - Data collected January 2016 6
0
10
20
30
40
50
60
70
80
US
-10
1 I
/C
McL
AU
GH
LIN
AV
EN
UE
11
TH
ST
RE
ET
10
TH
ST
RE
ET
7T
H S
TR
EE
T
4T
H S
TR
EE
T
1S
T S
TR
EE
T
SR
-87
-I/C
BIR
D A
VE
NU
E
ME
RID
IAN
AV
EN
UE
BA
SCO
M A
VE
NU
E
I-8
80
I/C
WIN
CH
ES
TE
R B
OU
LEV
AR
D
SA
RA
TO
GA
AV
EN
UE
LAW
RE
NC
E E
XP
RE
SS
WA
Y
ST
EV
EN
S C
RE
EK
BLV
D
WO
LFE
RO
AD
DE
AN
ZA
BO
ULE
VA
RD
SR
-85
I/C
FO
OT
HIL
L E
XP
RE
SS
WA
Y
MA
GD
ALE
NA
AV
EN
UE
EL
MO
NT
E R
OA
D
PA
GE
MIL
L R
OA
D
ALP
INE
RO
AD
spe
ed
(m
ph
)
3:00 PM 3:35 PM 4:20 PM 4:54 PM 5:58 PM 6:38 PM 7:15 PM 7:33 PM hov lane limits
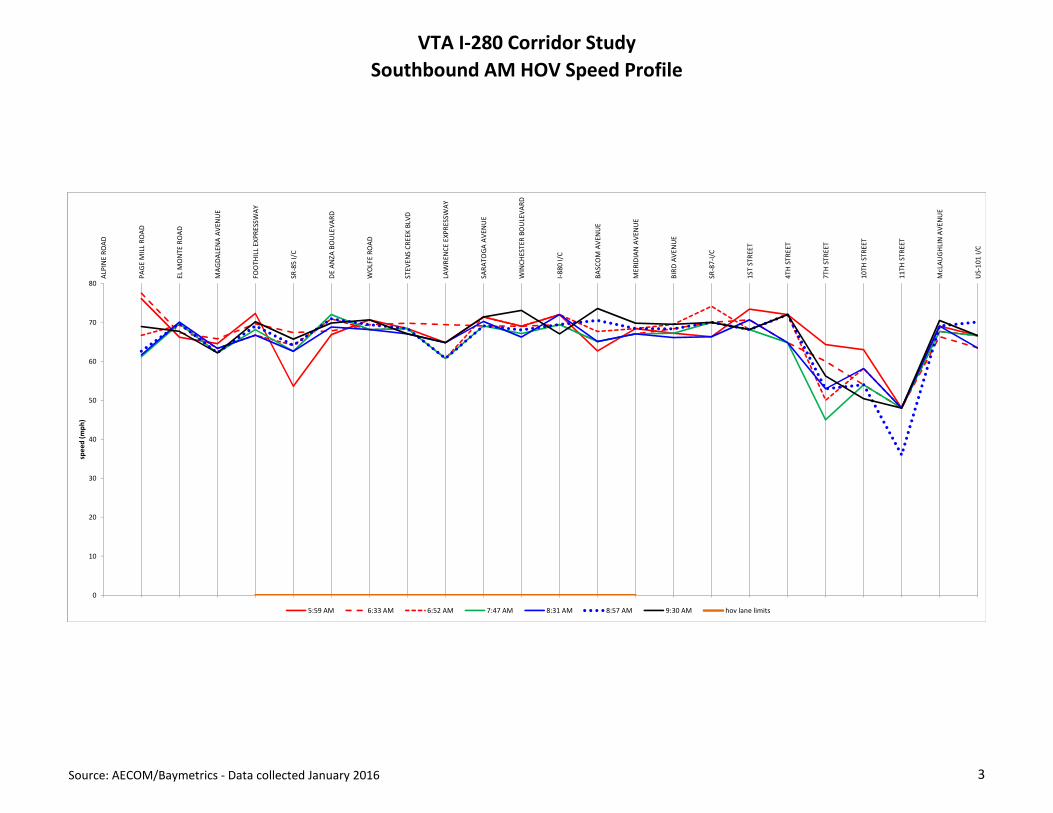
VTA I-280 Corridor Study
Southbound AM HOV Speed Profile
Source: AECOM/Baymetrics - Data collected January 2016 3
0
10
20
30
40
50
60
70
80
ALP
INE
RO
AD
PA
GE
MIL
L R
OA
D
EL
MO
NT
E R
OA
D
MA
GD
ALE
NA
AV
EN
UE
FO
OT
HIL
L E
XP
RE
SSW
AY
SR
-85
I/C
DE
AN
ZA
BO
ULE
VA
RD
WO
LFE
RO
AD
ST
EV
EN
S C
RE
EK
BLV
D
LAW
RE
NC
E E
XP
RE
SS
WA
Y
SA
RA
TO
GA
AV
EN
UE
WIN
CH
ES
TE
R B
OU
LEV
AR
D
I-8
80
I/C
BA
SC
OM
AV
EN
UE
ME
RID
IAN
AV
EN
UE
BIR
D A
VE
NU
E
SR
-87
-I/C
1S
T S
TR
EE
T
4T
H S
TR
EE
T
7T
H S
TR
EE
T
10
TH
ST
RE
ET
11
TH
ST
RE
ET
McL
AU
GH
LIN
AV
EN
UE
US
-10
1 I
/C
spe
ed
(m
ph
)
5:59 AM 6:33 AM 6:52 AM 7:47 AM 8:31 AM 8:57 AM 9:30 AM hov lane limits
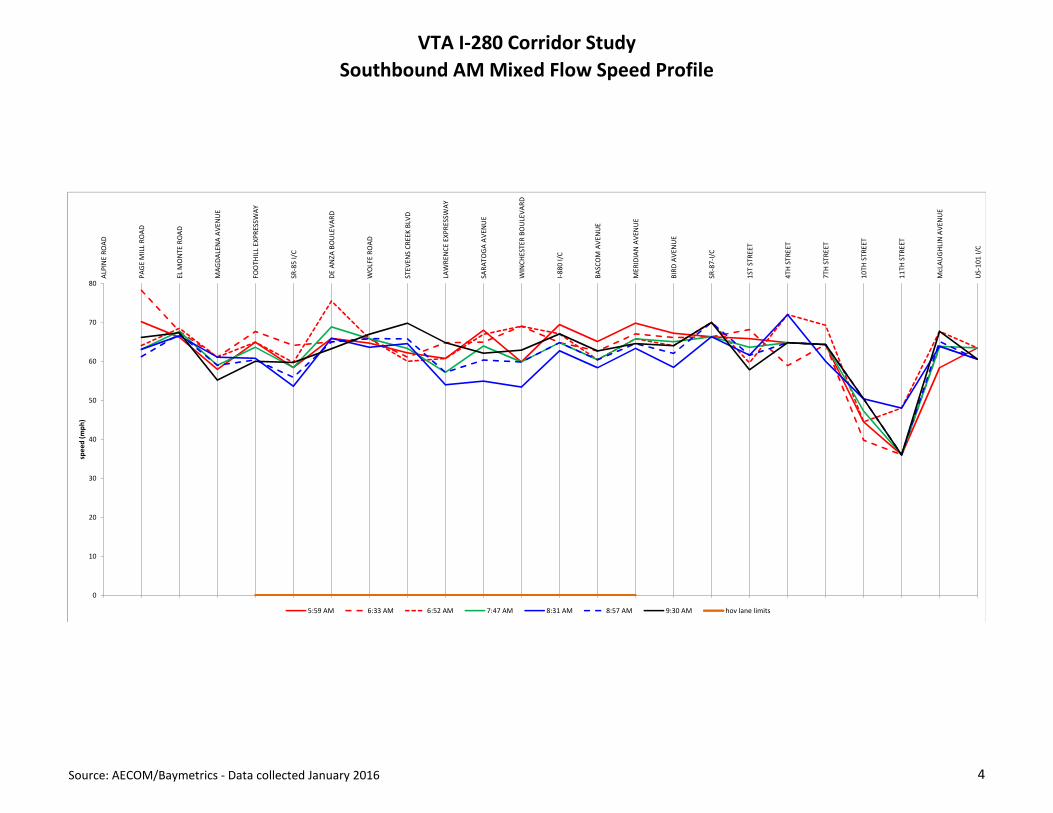
VTA I-280 Corridor Study
Southbound AM Mixed Flow Speed Profile
Source: AECOM/Baymetrics - Data collected January 2016 4
0
10
20
30
40
50
60
70
80
ALP
INE
RO
AD
PA
GE
MIL
L R
OA
D
EL
MO
NT
E R
OA
D
MA
GD
ALE
NA
AV
EN
UE
FO
OT
HIL
L E
XP
RE
SS
WA
Y
SR
-85
I/C
DE
AN
ZA
BO
ULE
VA
RD
WO
LFE
RO
AD
ST
EV
EN
S C
RE
EK
BLV
D
LAW
RE
NC
E E
XP
RE
SS
WA
Y
SA
RA
TO
GA
AV
EN
UE
WIN
CH
ES
TE
R B
OU
LEV
AR
D
I-8
80
I/C
BA
SC
OM
AV
EN
UE
ME
RID
IAN
AV
EN
UE
BIR
D A
VE
NU
E
SR
-87
-I/C
1S
T S
TR
EE
T
4T
H S
TR
EE
T
7T
H S
TR
EE
T
10
TH
ST
RE
ET
11
TH
ST
RE
ET
McL
AU
GH
LIN
AV
EN
UE
US
-10
1 I
/C
spe
ed
(m
ph
)
5:59 AM 6:33 AM 6:52 AM 7:47 AM 8:31 AM 8:57 AM 9:30 AM hov lane limits
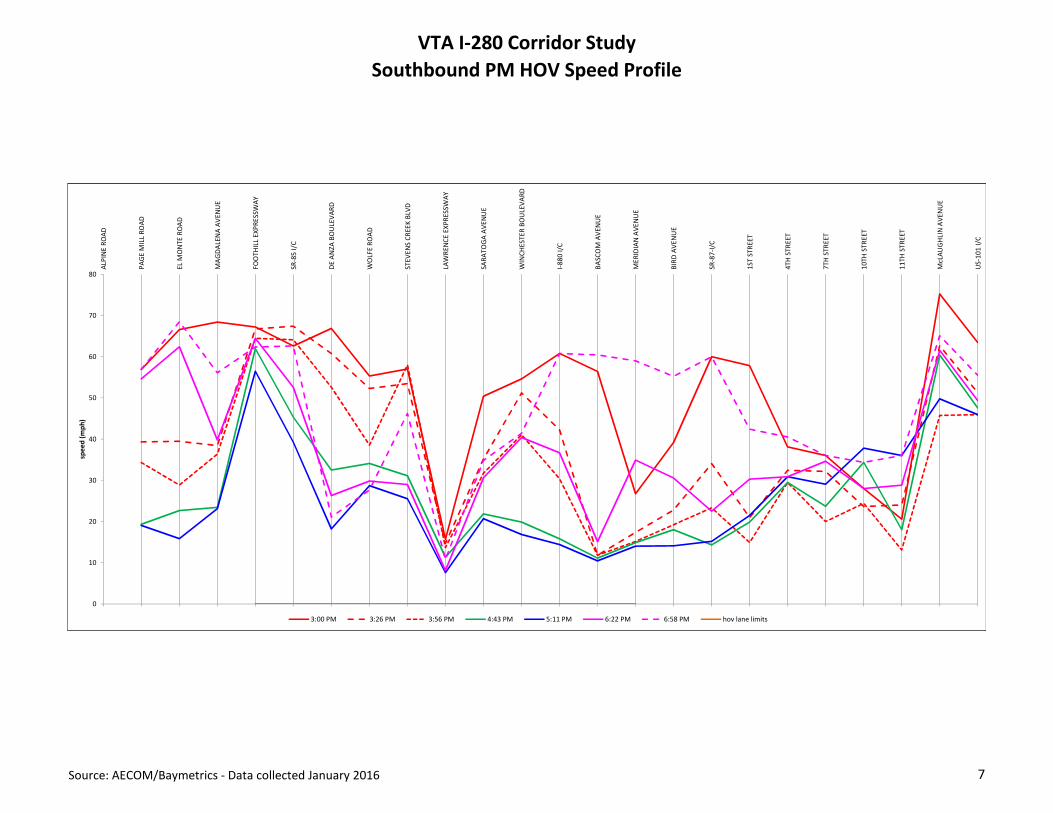
VTA I-280 Corridor Study
Southbound PM HOV Speed Profile
Source: AECOM/Baymetrics - Data collected January 2016 7
0
10
20
30
40
50
60
70
80
ALP
INE
RO
AD
PA
GE
MIL
L R
OA
D
EL
MO
NT
E R
OA
D
MA
GD
ALE
NA
AV
EN
UE
FO
OT
HIL
L E
XP
RE
SS
WA
Y
SR
-85
I/C
DE
AN
ZA
BO
ULE
VA
RD
WO
LFE
RO
AD
ST
EV
EN
S C
RE
EK
BLV
D
LAW
RE
NC
E E
XP
RE
SS
WA
Y
SA
RA
TO
GA
AV
EN
UE
WIN
CH
ES
TE
R B
OU
LEV
AR
D
I-8
80
I/C
BA
SCO
M A
VE
NU
E
ME
RID
IAN
AV
EN
UE
BIR
D A
VE
NU
E
SR
-87
-I/C
1S
T S
TR
EE
T
4T
H S
TR
EE
T
7T
H S
TR
EE
T
10
TH
ST
RE
ET
11
TH
ST
RE
ET
McL
AU
GH
LIN
AV
EN
UE
US
-10
1 I
/C
spe
ed
(m
ph
)
3:00 PM 3:26 PM 3:56 PM 4:43 PM 5:11 PM 6:22 PM 6:58 PM hov lane limits
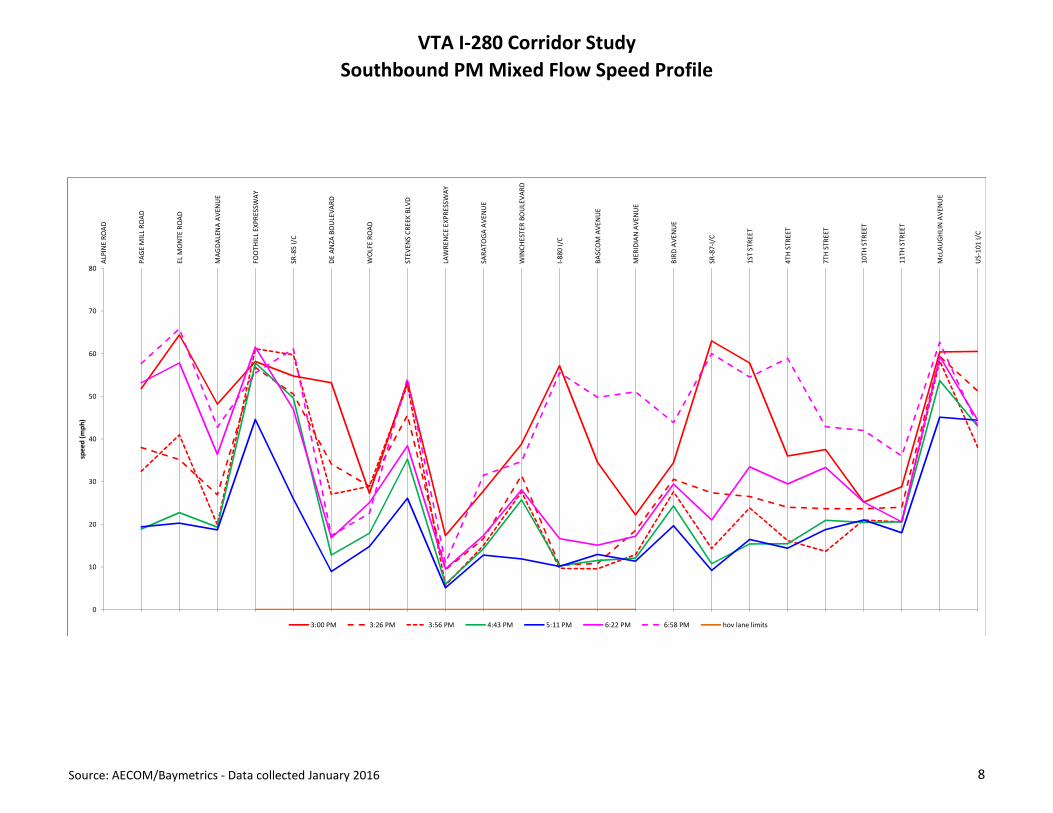
VTA I-280 Corridor Study
Southbound PM Mixed Flow Speed Profile
Source: AECOM/Baymetrics - Data collected January 2016 8
0
10
20
30
40
50
60
70
80
ALP
INE
RO
AD
PA
GE
MIL
L R
OA
D
EL
MO
NT
E R
OA
D
MA
GD
ALE
NA
AV
EN
UE
FO
OT
HIL
L E
XP
RE
SS
WA
Y
SR
-85
I/C
DE
AN
ZA
BO
ULE
VA
RD
WO
LFE
RO
AD
ST
EV
EN
S C
RE
EK
BLV
D
LAW
RE
NC
E E
XP
RE
SSW
AY
SA
RA
TO
GA
AV
EN
UE
WIN
CH
EST
ER
BO
ULE
VA
RD
I-8
80
I/C
BA
SC
OM
AV
EN
UE
ME
RID
IAN
AV
EN
UE
BIR
D A
VE
NU
E
SR
-87
-I/C
1S
T S
TR
EE
T
4T
H S
TR
EE
T
7T
H S
TR
EE
T
10
TH
ST
RE
ET
11
TH
ST
RE
ET
McL
AU
GH
LIN
AV
EN
UE
US
-10
1 I
/C
spe
ed
(m
ph
)
3:00 PM 3:26 PM 3:56 PM 4:43 PM 5:11 PM 6:22 PM 6:58 PM hov lane limits

2-15
SANTA CLARA COUNTY I-280 CORRIDOR STUDY
Appendix D – Transit Maps SANTA CLARA VALLEY TRANSPORTATION AUTHORITY (VTA)
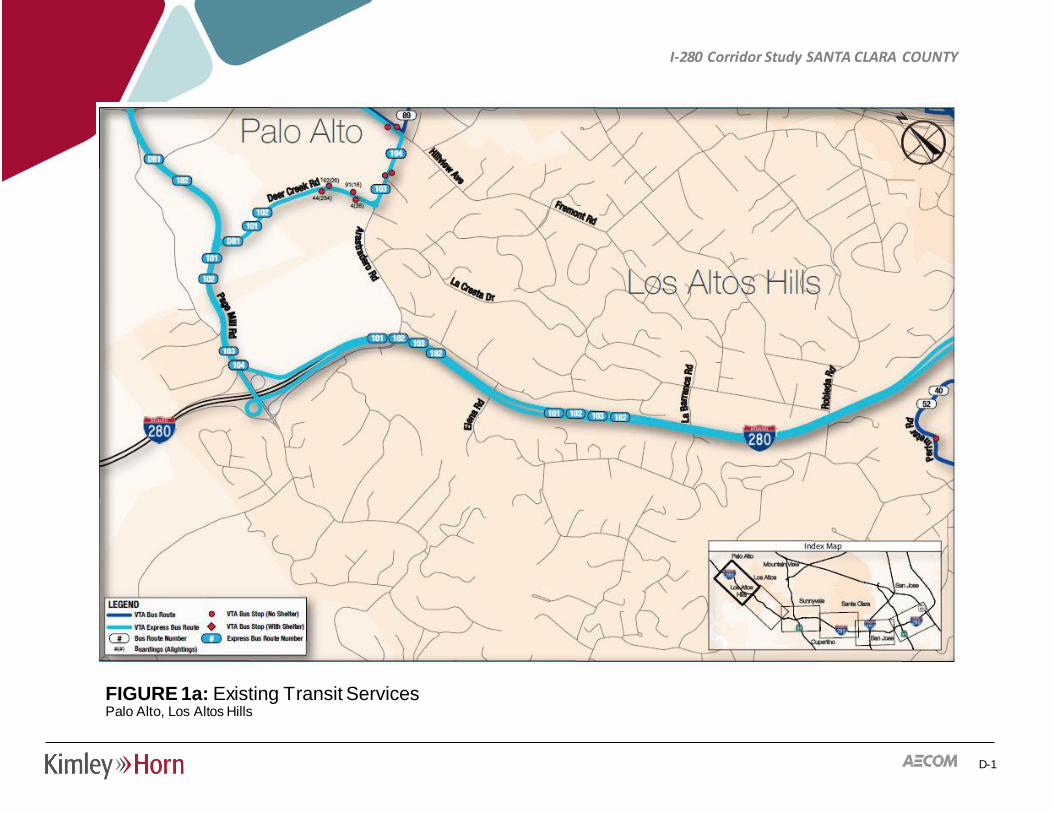
D-1
I-280 Corridor Study SANTA CLARA COUNTY
FIGURE 1a: Existing Transit Services Palo Alto, Los Altos Hills
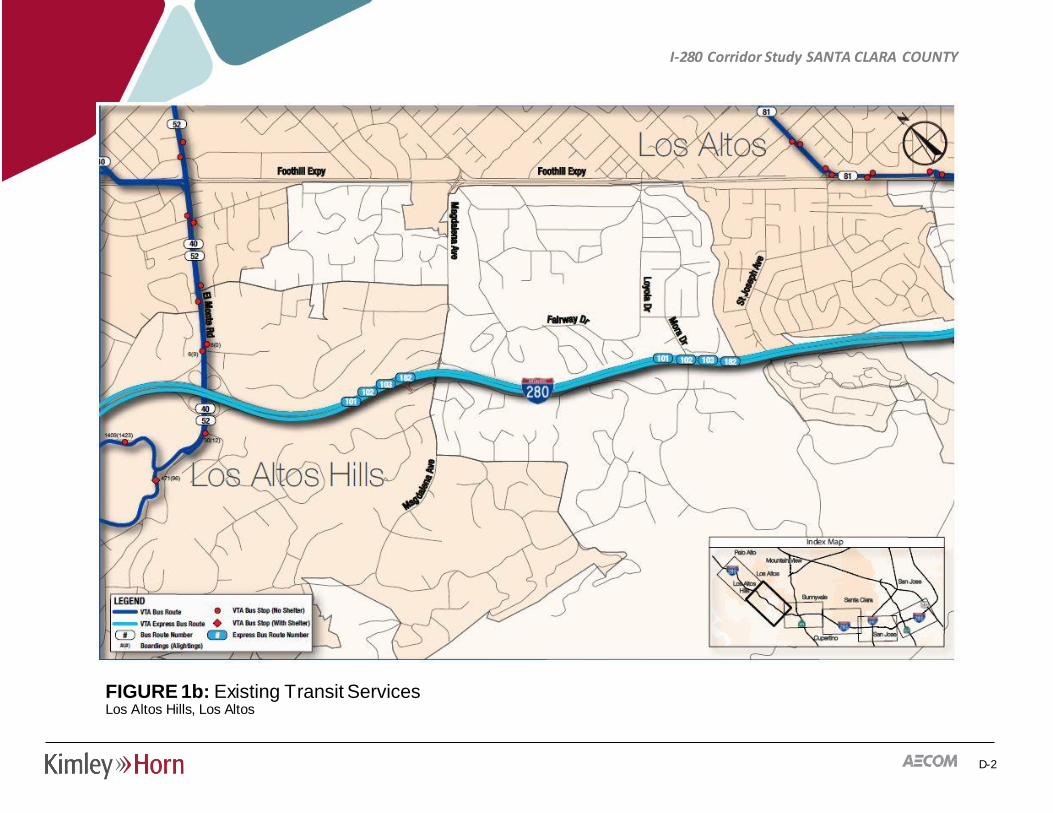
D-2
I-280 Corridor Study SANTA CLARA COUNTY
FIGURE 1b: Existing Transit Services Los Altos Hills, Los Altos
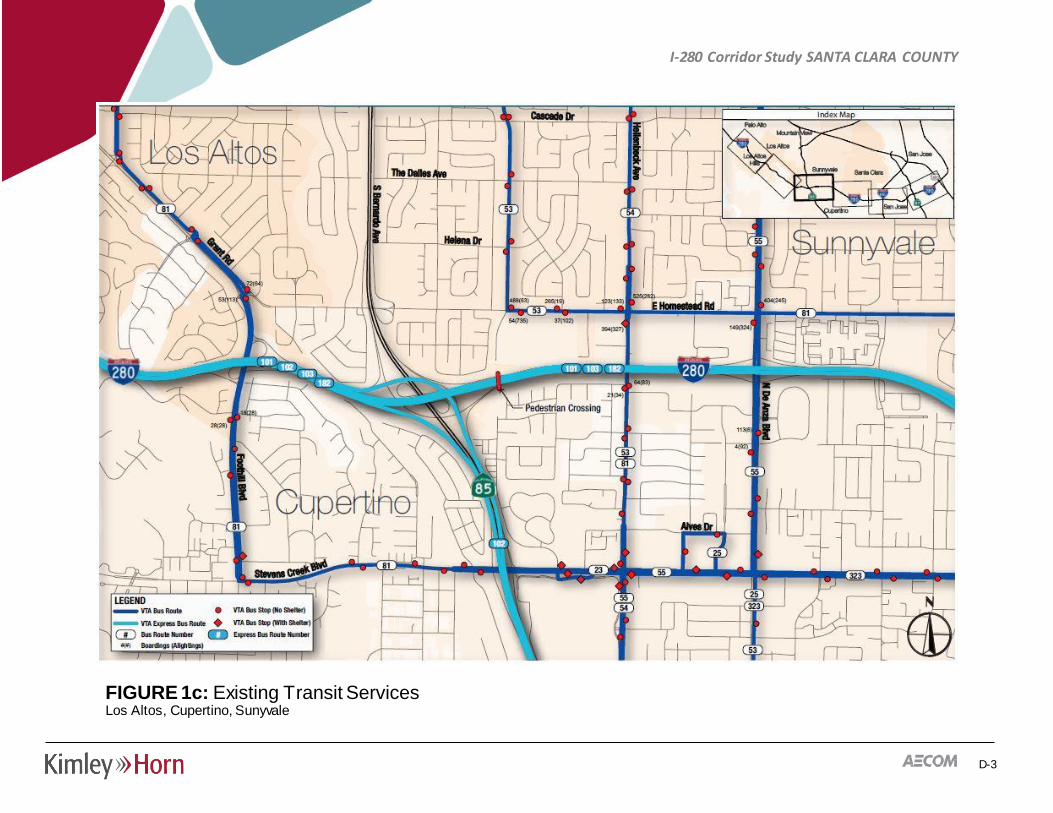
D-3
I-280 Corridor Study SANTA CLARA COUNTY
FIGURE 1c: Existing Transit Services Los Altos, Cupertino, Sunyvale
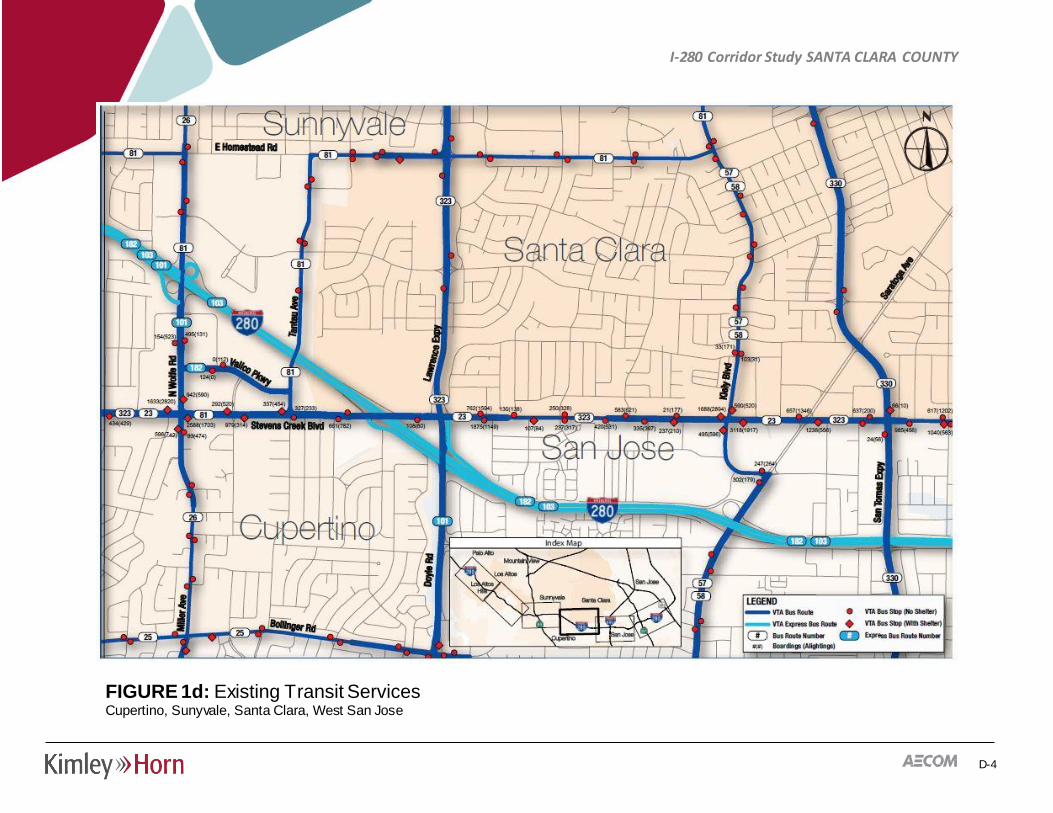
D-4
I-280 Corridor Study SANTA CLARA COUNTY
FIGURE 1d: Existing Transit Services Cupertino, Sunyvale, Santa Clara, West San Jose
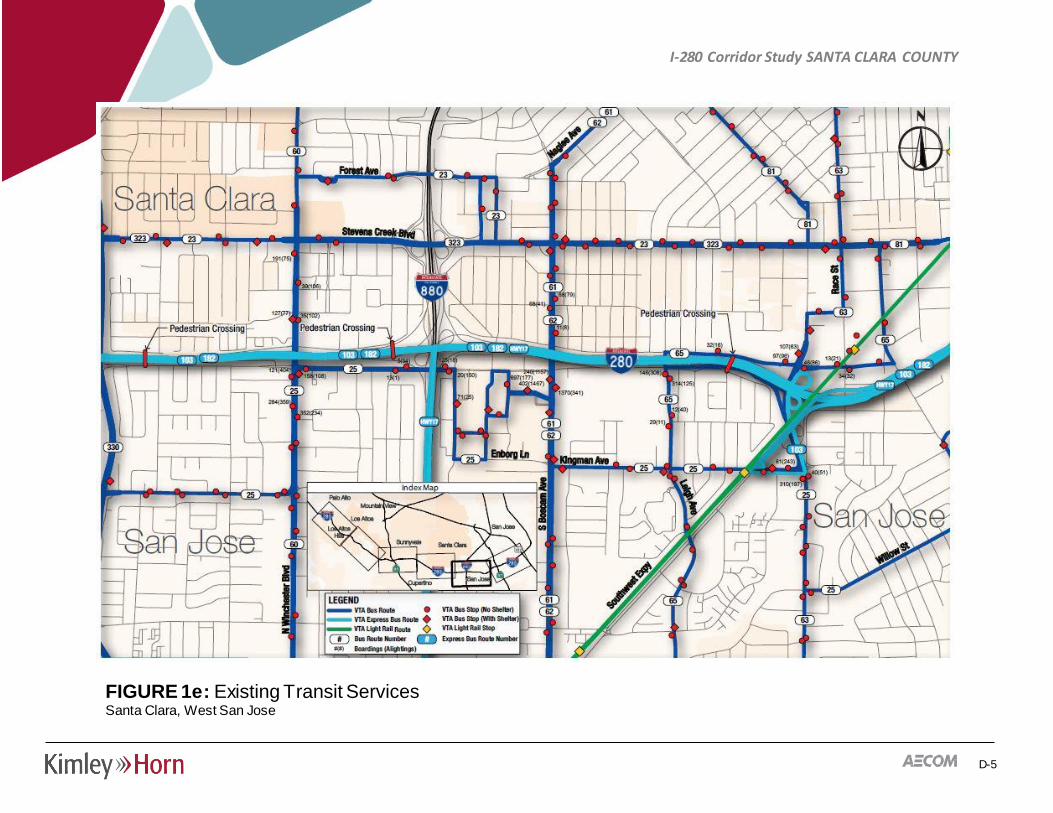
D-5
I-280 Corridor Study SANTA CLARA COUNTY
FIGURE 1e: Existing Transit Services Santa Clara, West San Jose
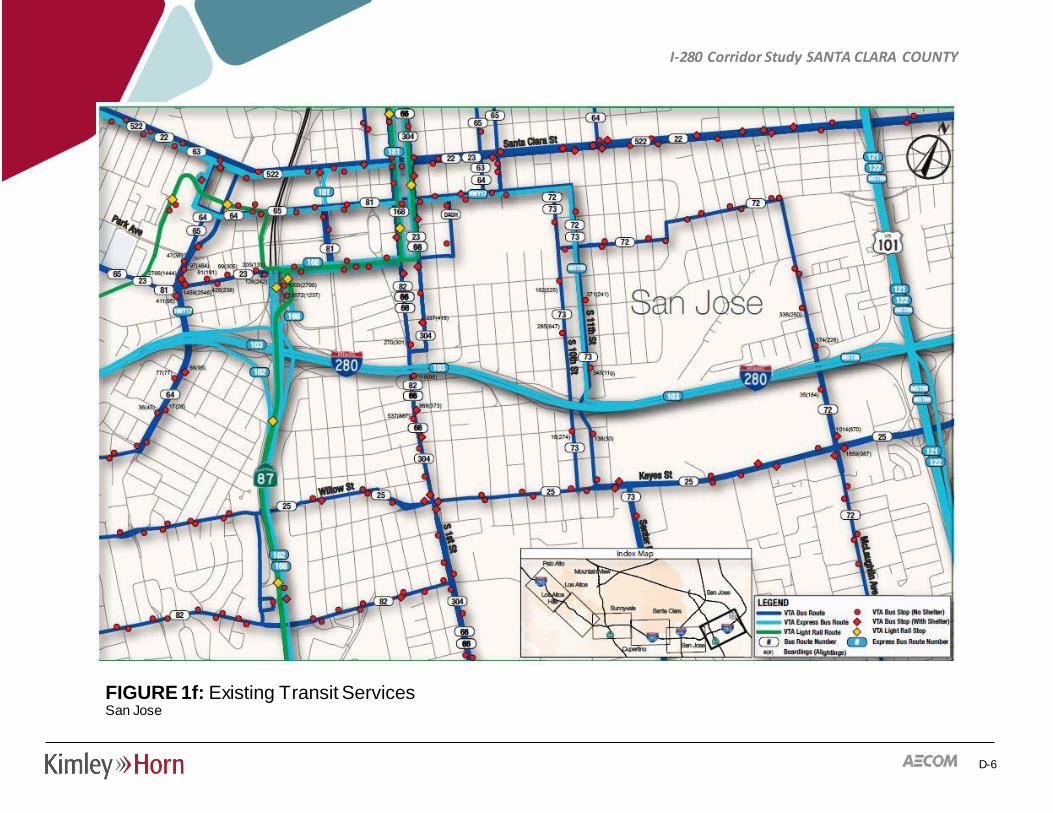
D-6
I-280 Corridor Study SANTA CLARA COUNTY
FIGURE 1f: Existing Transit Services San Jose
2-16
SANTA CLARA COUNTY I-280 CORRIDOR STUDY
Appendix E – Bike Maps SANTA CLARA VALLEY TRANSPORTATION AUTHORITY (VTA)
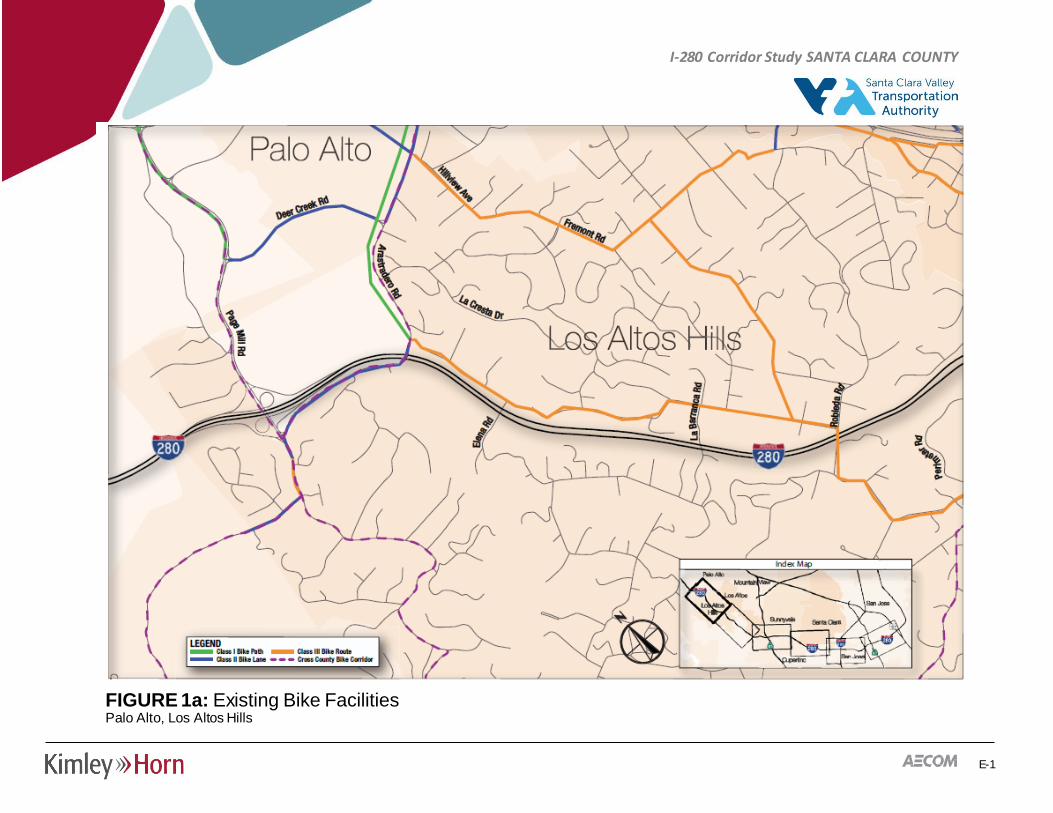
E-1
I-280 Corridor Study SANTA CLARA COUNTY
FIGURE 1a: Existing Bike Facilities Palo Alto, Los Altos Hills
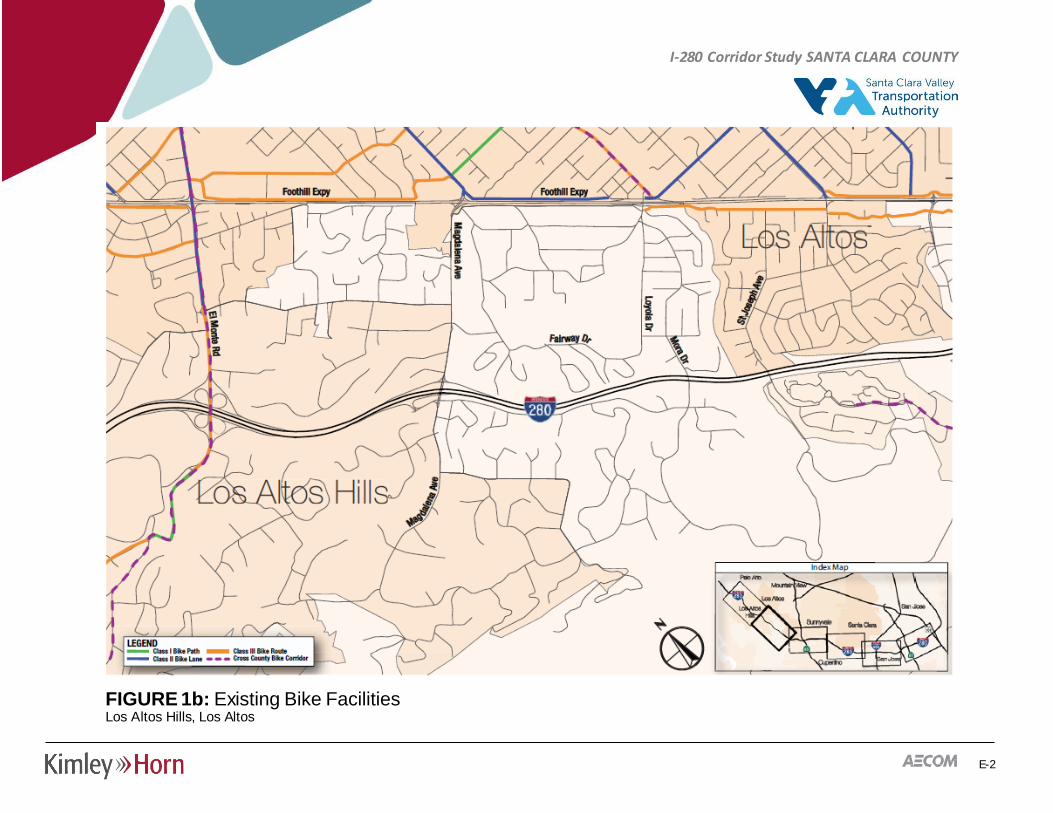
E-2
I-280 Corridor Study SANTA CLARA COUNTY
FIGURE 1b: Existing Bike Facilities Los Altos Hills, Los Altos
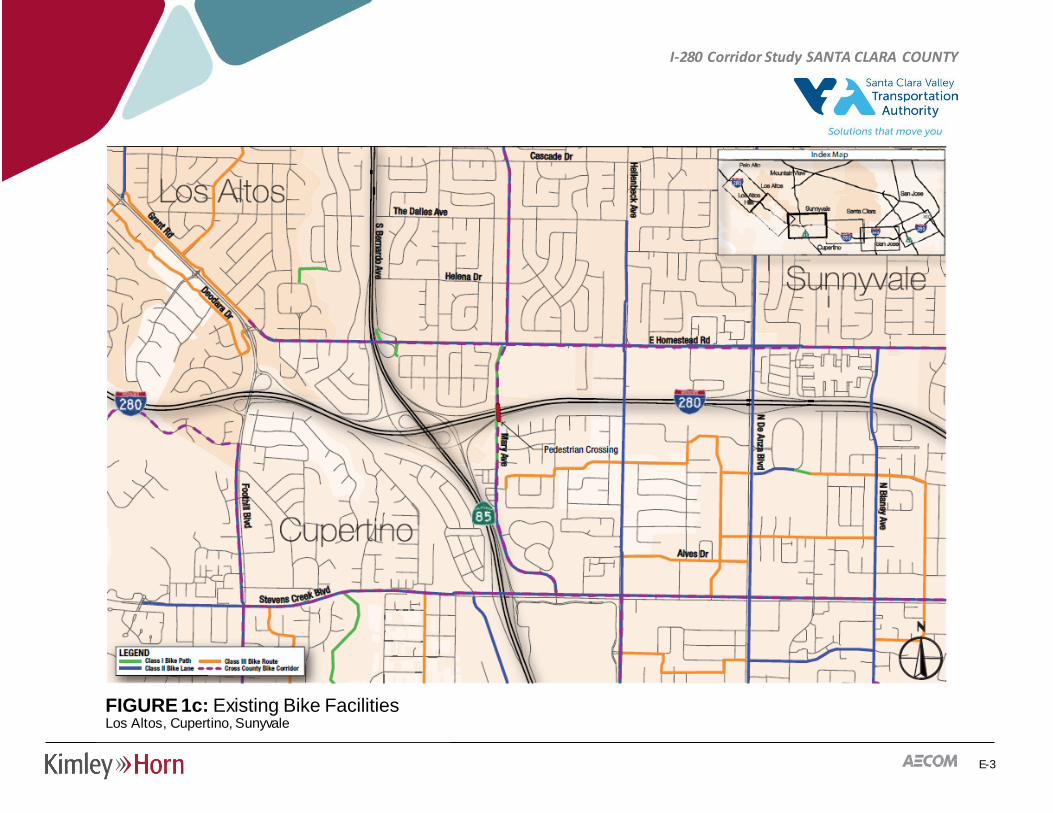
E-3
I-280 Corridor Study SANTA CLARA COUNTY
FIGURE 1c: Existing Bike Facilities Los Altos, Cupertino, Sunyvale
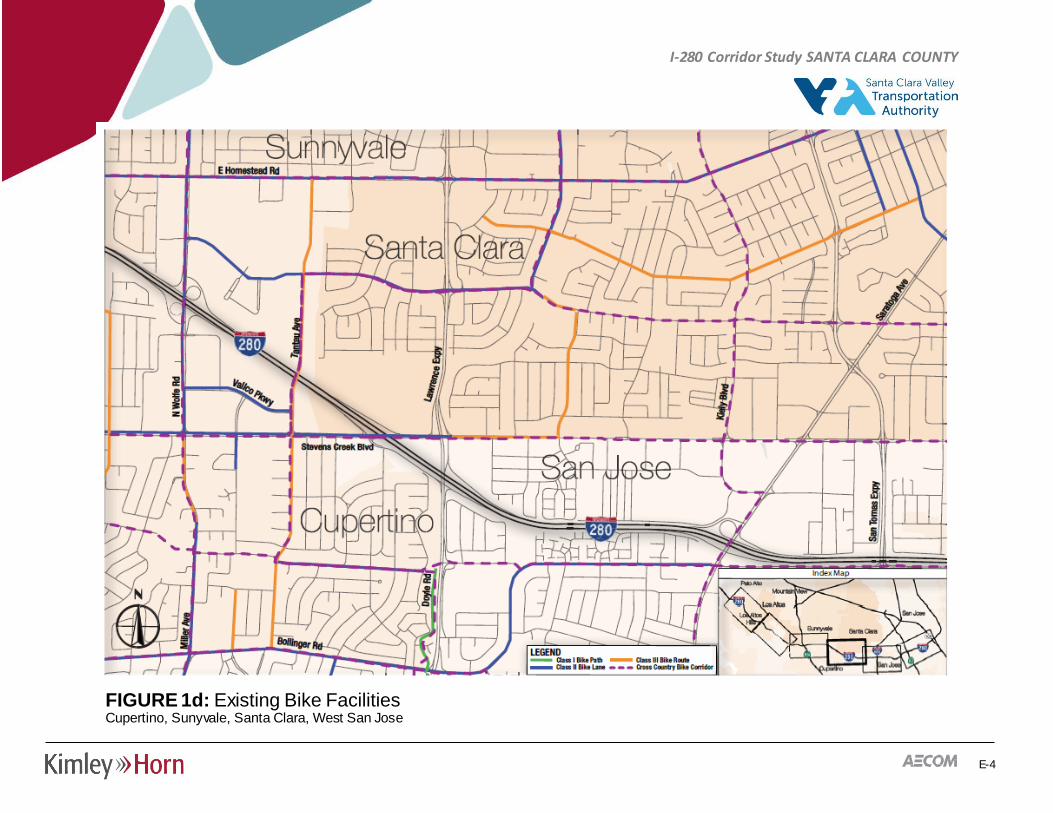
E-4
I-280 Corridor Study SANTA CLARA COUNTY
FIGURE 1d: Existing Bike Facilities Cupertino, Sunyvale, Santa Clara, West San Jose
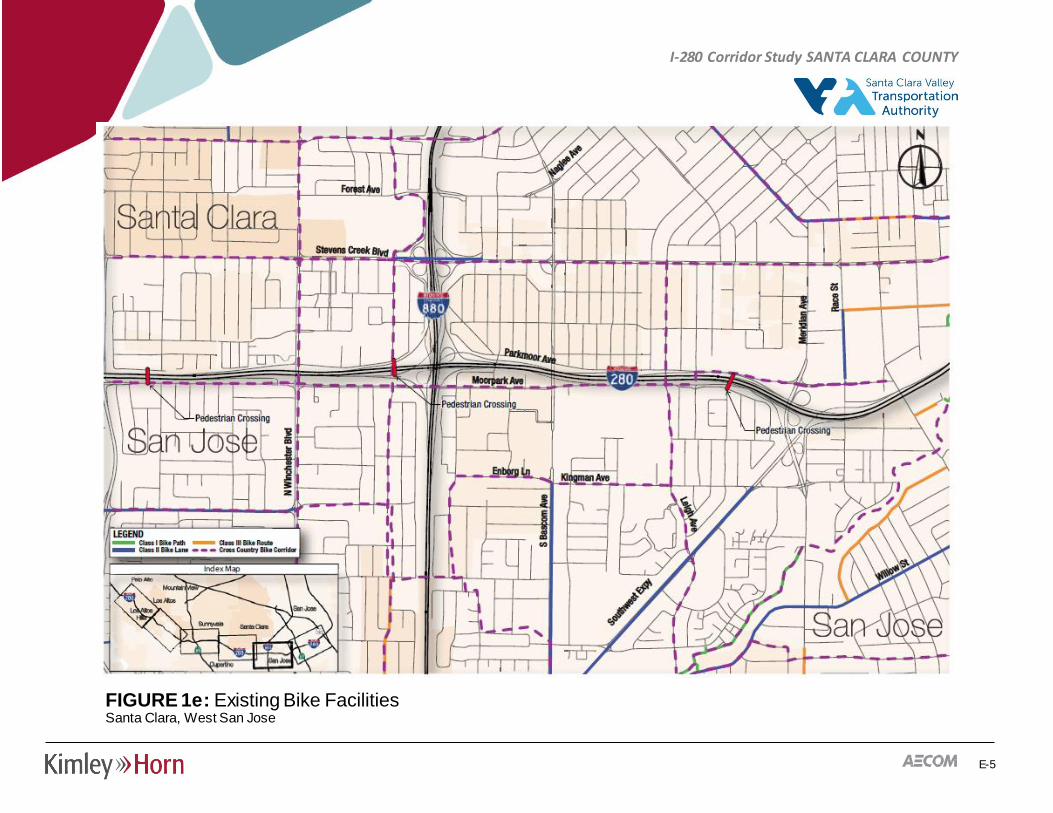
E-5
I-280 Corridor Study SANTA CLARA COUNTY
FIGURE 1e: Existing Bike Facilities Santa Clara, West San Jose
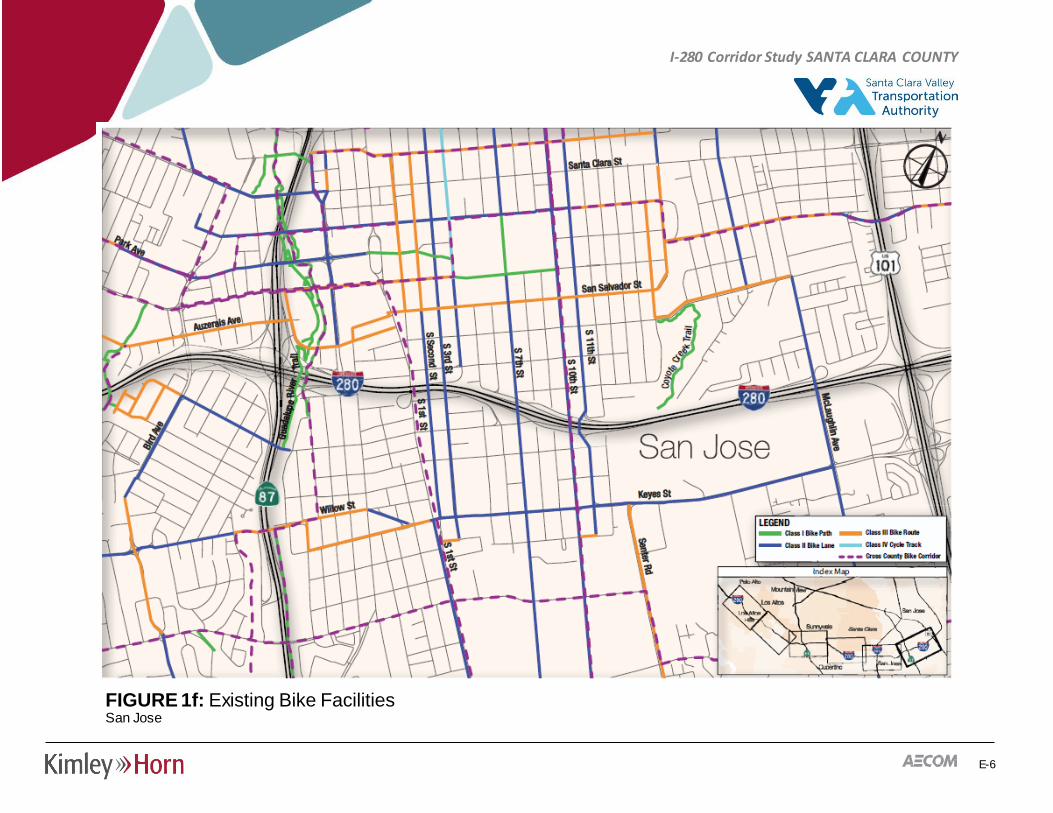
E-6
I-280 Corridor Study SANTA CLARA COUNTY
FIGURE 1f: Existing Bike Facilities San Jose

2-17
SANTA CLARA COUNTY I-280 CORRIDOR STUDY
Appendix F – Collision Maps SANTA CLARA VALLEY TRANSPORTATION AUTHORITY (VTA)
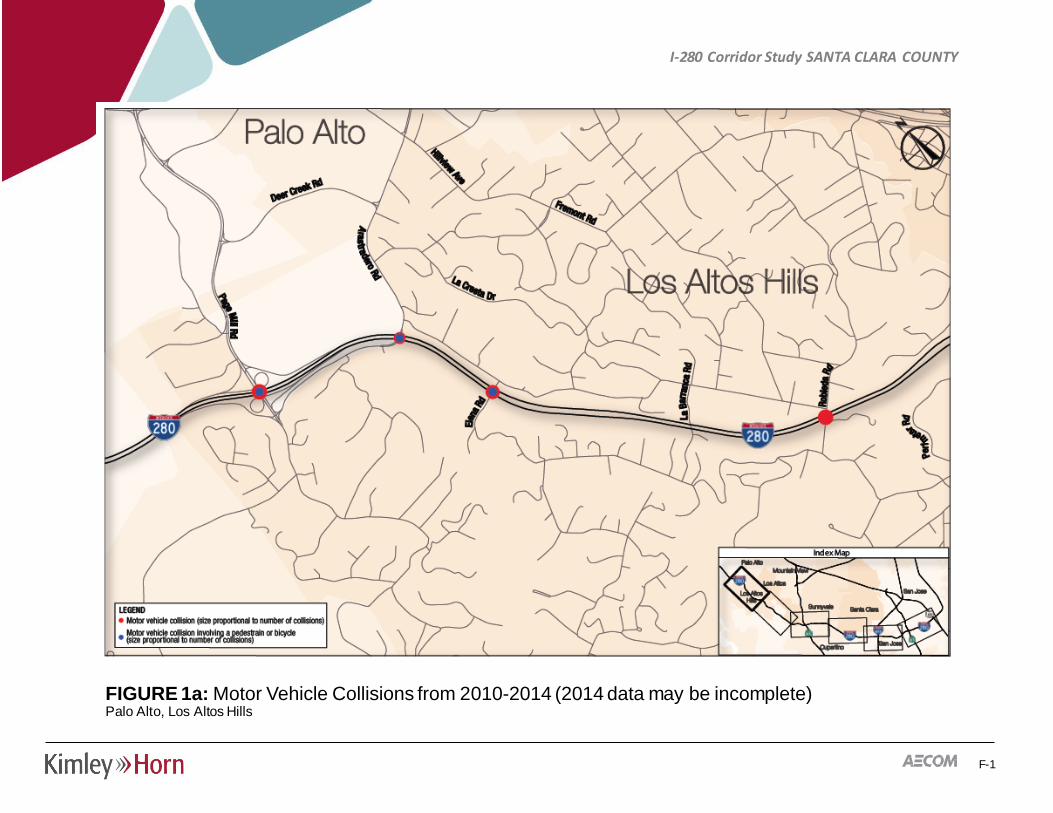
F-1
I-280 Corridor Study SANTA CLARA COUNTY
FIGURE 1a: Motor Vehicle Collisions from 2010-2014 (2014 data may be incomplete) Palo Alto, Los Altos Hills
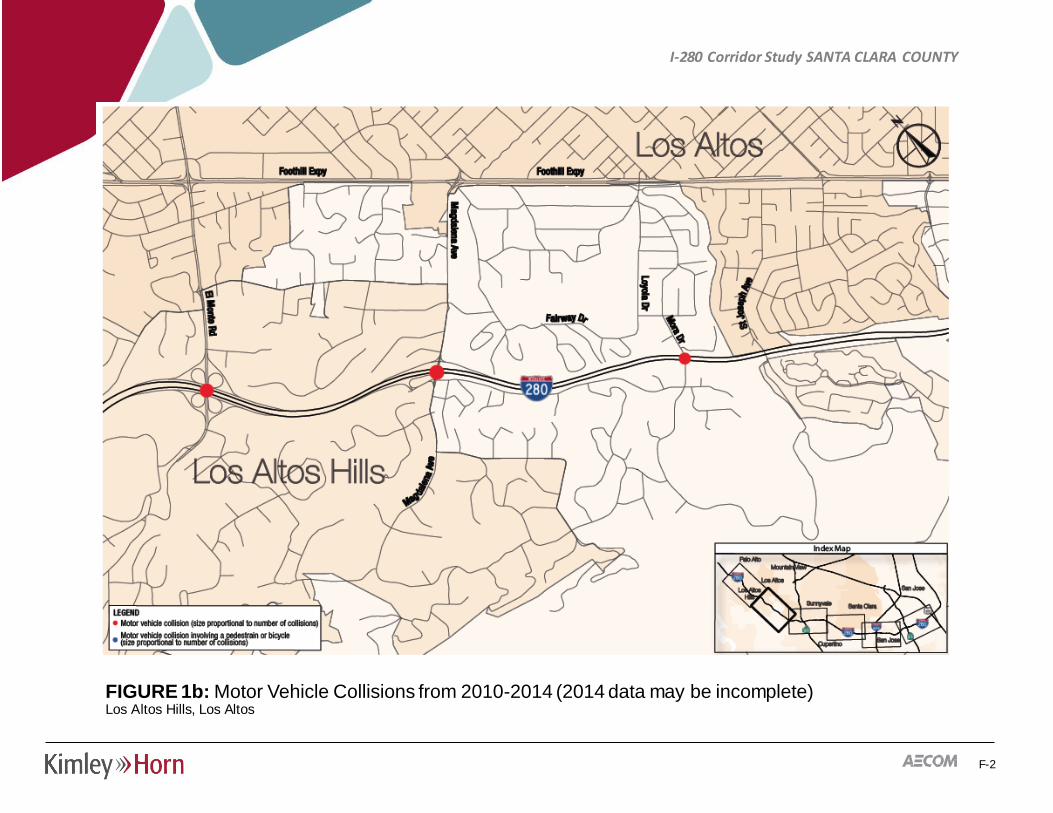
F-2
I-280 Corridor Study SANTA CLARA COUNTY
FIGURE 1b: Motor Vehicle Collisions from 2010-2014 (2014 data may be incomplete) Los Altos Hills, Los Altos
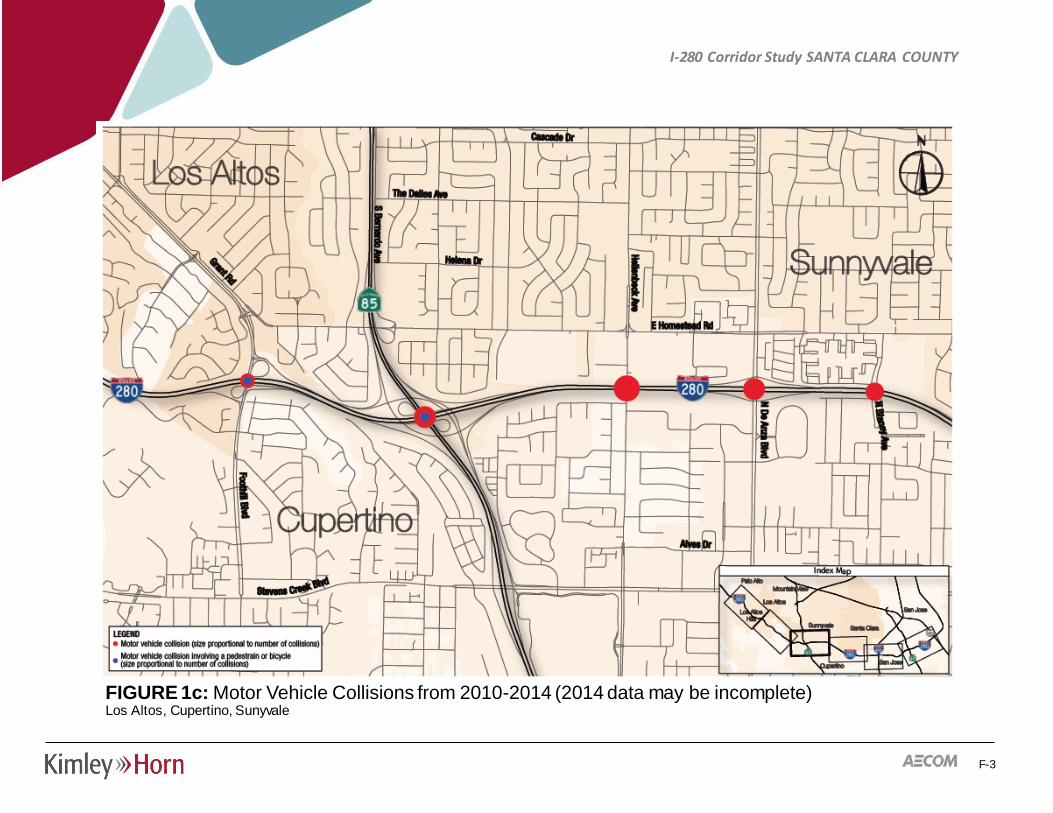
F-3
I-280 Corridor Study SANTA CLARA COUNTY
FIGURE 1c: Motor Vehicle Collisions from 2010-2014 (2014 data may be incomplete) Los Altos, Cupertino, Sunyvale
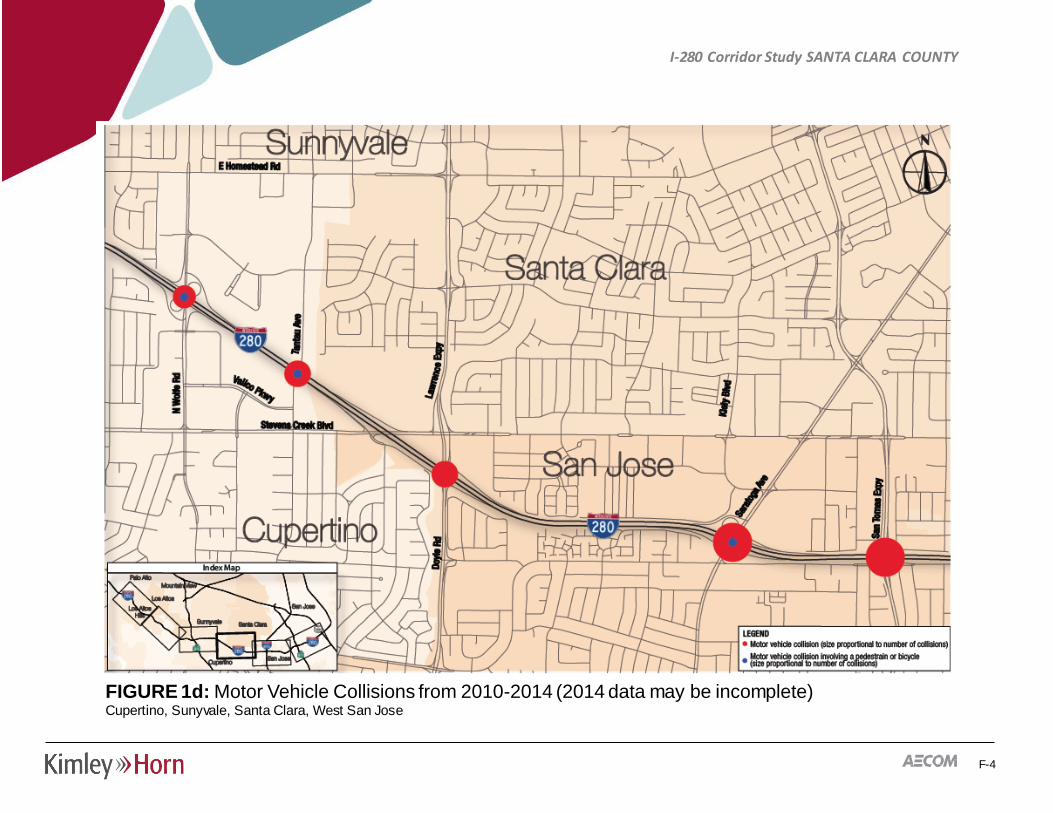
F-4
I-280 Corridor Study SANTA CLARA COUNTY
FIGURE 1d: Motor Vehicle Collisions from 2010-2014 (2014 data may be incomplete) Cupertino, Sunyvale, Santa Clara, West San Jose
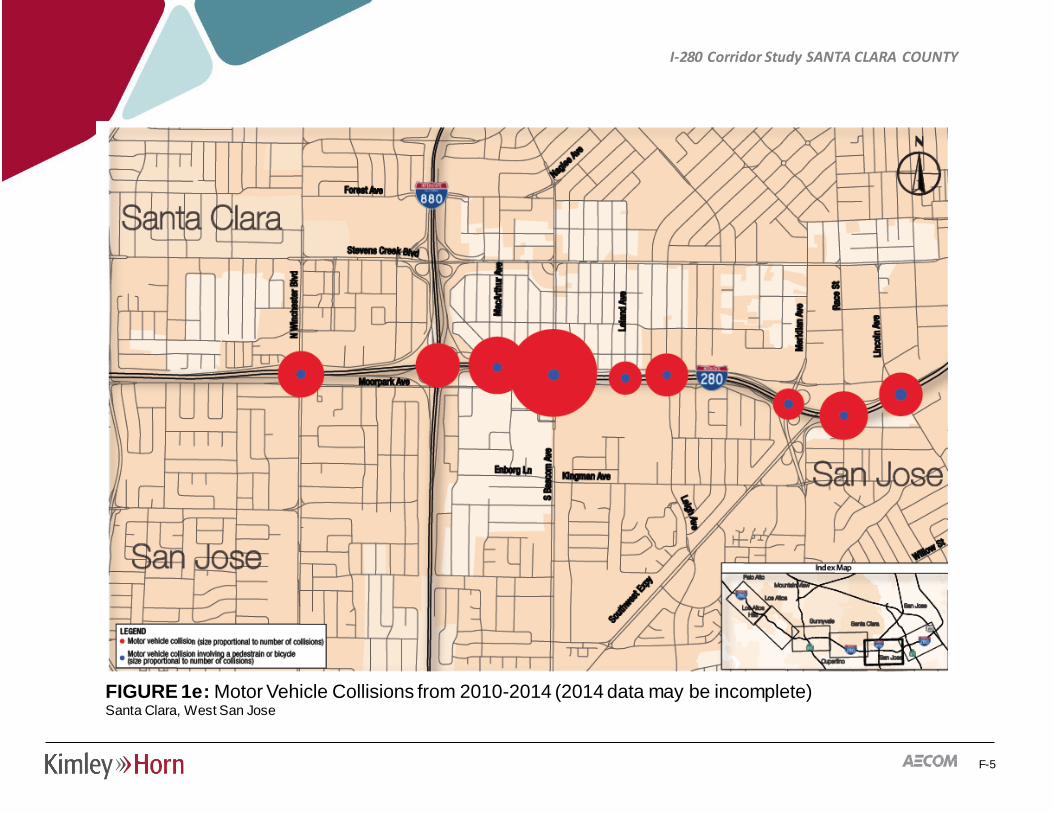
F-5
I-280 Corridor Study SANTA CLARA COUNTY
FIGURE 1e: Motor Vehicle Collisions from 2010-2014 (2014 data may be incomplete) Santa Clara, West San Jose
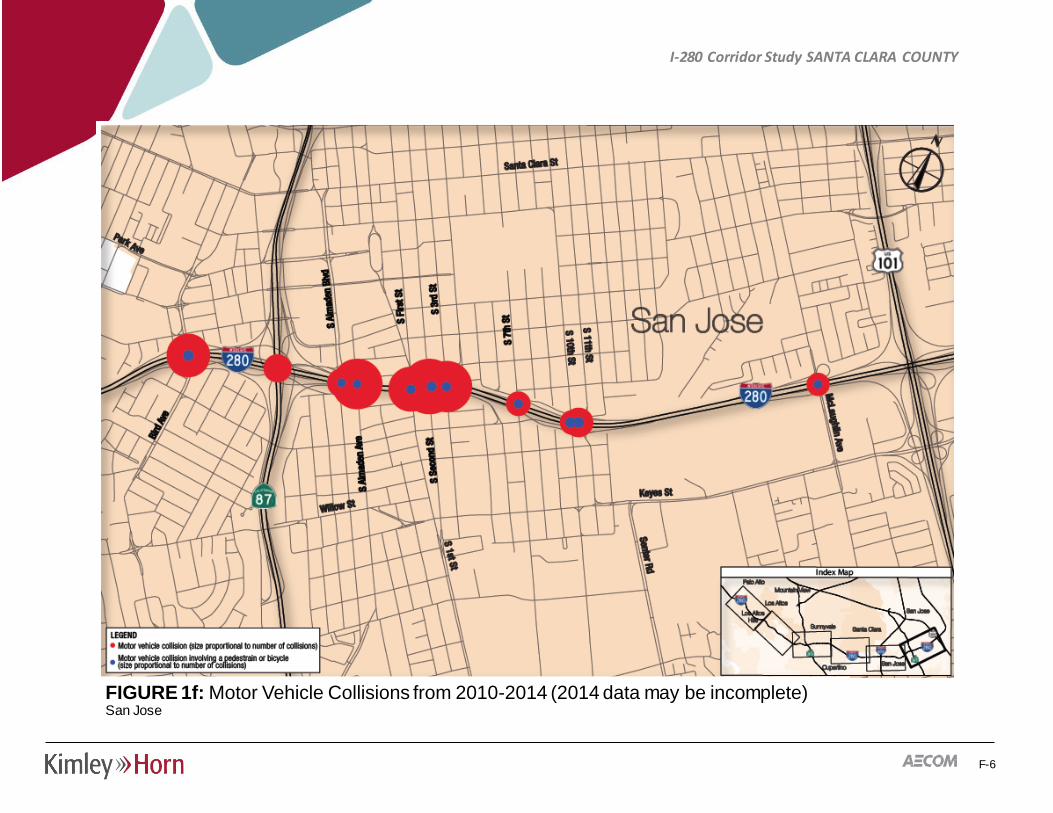
F-6
I-280 Corridor Study SANTA CLARA COUNTY
FIGURE 1f: Motor Vehicle Collisions from 2010-2014 (2014 data may be incomplete) San Jose