santa cruz county project connect
DESCRIPTION
Santa Cruz County Project Connect. Measuring Cross-System Outcomes for Enrolled Frequent Users - Methods and Findings to Date 9/28/2006. Outcomes Measured. Post-enrollment change in service utilization for the following settings/services: 2 Hospital Emergency Departments - PowerPoint PPT PresentationTRANSCRIPT

Santa Cruz CountyProject Connect
Measuring Cross-System Outcomes for Enrolled Frequent Users -
Methods and Findings to Date 9/28/2006

Outcomes Measured
Post-enrollment change in service utilization for the following settings/services: 2 Hospital Emergency Departments
Change in number of ED visits and related charges
2 Hospital Inpatient UnitsChange in number of admissions, and
number of inpatient days and related charges

Outcomes Measured
1 Hospital Inpatient Behavioral Health UnitChange in number of inpatient days and
related charges
Ambulance Services (County served by one ambulance company)Change in number of transports
County Detention ServicesChange in number of jail bookings and
number of days incarcerated

Outcomes Measured
Also measuring: Changes in housing status:
Counting number of enrolled individuals entering permanent housing
Changes in benefits status: Counting number of enrolled individuals
qualifying for Soc. Sec. Disability benefits with a new link to Medi-Cal
Methodology
Collect data on service utilization for each enrolled client from each setting/service for the 12-month period prior to enrollment
Collect post-enrollment service utilization data from each source at 3-month intervals

Methodology
Compare 12-month pre-enrollment service utilization (averages for cohort) to: Annualized post-enrollment service
utilization for cohort of all enrolled Post-enrollment 12-month service
utilization for 2 smaller cohorts: 1) those who have been enrolled at least 12-
months, and 2) those who have been enrolled at least 24-
months

Methodology
Data Collection Methods: Hospitals: We provide medical record
numbers for each enrolled client back to hospitals and they provide us an updated data base with post-enrollment visits and admissions
Ambulance: County EMS program supports ambulance service data base that we are able to access directly

Methodology
Jail Data: Health Services Agency is provided access to jail data base for relevant time periods
Annualizing: Example: Total potential days pre-enrollment year = 365 Total post enrollment days for cohort = 455 365/455=.80 Post-enrollment ambulance transports 466 x 365/455= 374 Compare 836 transports during 12 mo. Pre-enrollment to 374
transports (annualized) post-enrollment = 55% reduction

Methodology
Charges and Cost: An average charge-to-cost ratio across 2
hospitals was calculated Spring ‘06. Ratio is used to convert charges to estimated cost
An average cost per booking and jail day was provided by the Sheriff
Charges for ambulance services are based on cost and an average pt. Charge is calculated by AMR each month

Findings to Date
Last data analysis completed includes service utilization through June 30, 2006
N = 86 individuals enrolled

51% FEWER JAIL BOOKINGS/COST REDUCTION
J ail Booking Fees One Year Prior and Since Enrollment (annualized) N = 86
$29,273
$14,465
$-
$5,000
$10,000
$15,000
$20,000
$25,000
$30,000
$35,000
Prior Year Since Enrollment
J ail Bookings One Year Prior and Since Enrollment (annualized) N = 86
277
137
0
50
100
150
200
250
300
Prior Year Since Enrollment
12
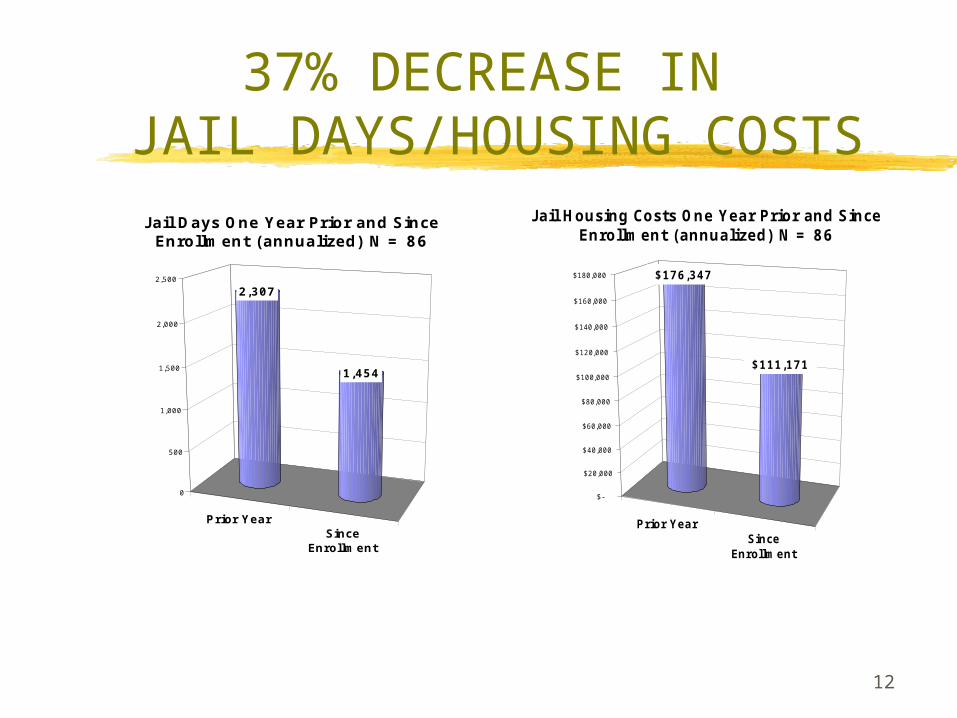
37% DECREASE IN JAIL DAYS/HOUSING COSTS
Prior YearSince
Enrollment
2,307
1,454
0
500
1,000
1,500
2,000
2,500
J ail Days One Year Prior and Since Enrollment (annualized) N = 86
Prior YearSince
Enrollment
$176,347
$111,171
$-
$20,000
$40,000
$60,000
$80,000
$100,000
$120,000
$140,000
$160,000
$180,000
J ail Housing Costs One Year Prior and Since Enrollment (annualized) N = 86

55% DECREASE IN AMBULANCE RUNS
Ambulance Runs in the Year Prior to and Since Enrollment
(annualized) N = 86
836
373
0
100
200
300
400
500
600
700
800
900
Prior Year Since Enrollment

DECREASES OF 56% AND 37% IN NUMBER OF ED VISITS AT RESPECTIVE HOSPITALS
ED Visits One Year Prior and Since Enrollment (annualized) N = 86
423395
184
248
0
50
100
150
200
250
300
350
400
450
Dominican Watsonville
Prior Year Since Enrollment

51% AND 47% DECREASE IN HOSPITAL INPATIENT DAYS
AT RESPECTIVE HOSPITALSI nPatient Days One Year Prior and Since Enrollment
(annualized) N = 86
395
184192
97
0
50
100
150
200
250
300
350
400
450
Dominican Watsonville
Prior Year Since Enrollment

TOTAL ANNUAL REDUCTION IN INPATIENT CHARGESDOMINICAN: $1,310,512 WATSONVILLE: $1,471,050
46% AND 52% REDUCTION IN INPATIENT CHARGES AT RESPECTIVE HOSPITALS
I nPatient Charges One Year Prior and Since Enrollment (annualized) N = 86
$2,876,893 $2,808,247
$1,566,381
$1,337,197
$-
$500,000
$1,000,000
$1,500,000
$2,000,000
$2,500,000
$3,000,000
$3,500,000
Dominican Watsonville
Prior Year Since Enrollment

Example of Different MethodologyPresenting ED Visit Data
Number of ED VisitsOne Year Pre and One Year Post
N = 64
635
326
0
100
200
300
400
500
600
700
PreEnrollment PostEnrollment
Number of ED VisitsOne Year Pre and Second Year Post
N = 39
344
147
0
50
100
150
200
250
300
350
400
PreEnrollment PostEnrollment
Clients enrolled at least 12 months
Compare 1 year pre to 1st year post
Clients enrolled at least 24 months
Compare 1 year pre to 2nd year post

Project ConnectEstimating Costs from Charges at 2 HospitalsTotal Cost Reduction as of March 2006
InpatientTotal Costs Prior and Since $1,561,238Total Days Prior and Since 753Cost/Day $2076
InpatientTotal Days Prior 469Total Days Since 283Reduction: 186
InpatientCost/Day $2076x 186 Days =
$386,136
EDTotal Costs Prior and Since$400,864Total Visits Prior and Since 946Cost/Visit $424
EDTotal Visits Prior 634Total Visits Since 312Reduction: 322
EDCost/Visit $424x 322 Visits =
$136,528
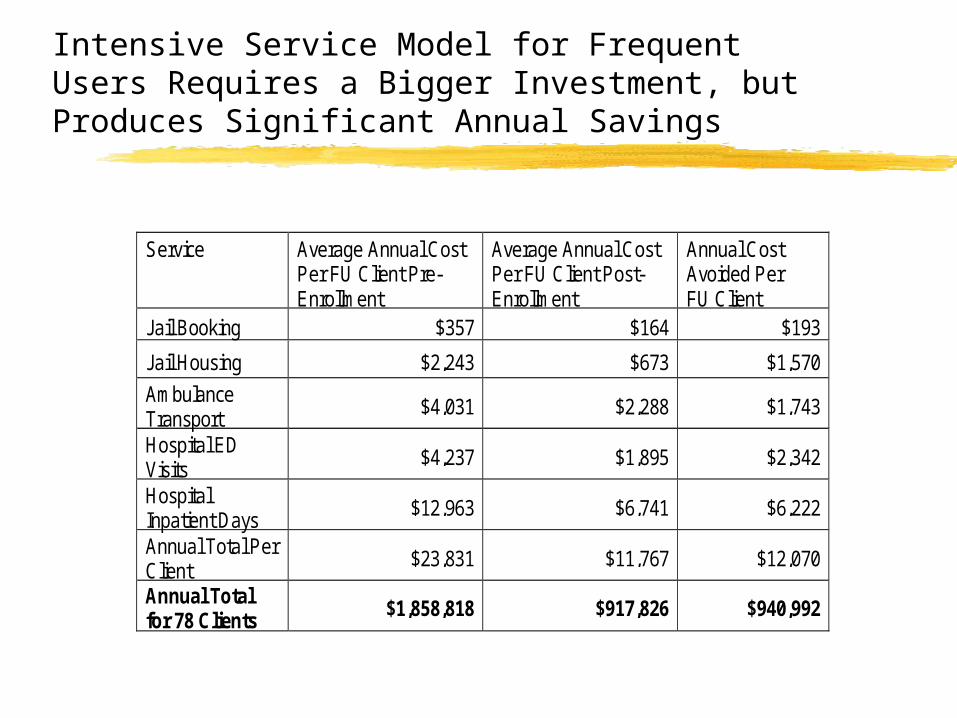
Intensive Service Model for Frequent Users Requires a Bigger Investment, but Produces Significant Annual Savings
Service Average Annual CostPer FU Client Pre-Enrollment
Average Annual CostPer FU Client Post-Enrollment
Annual CostAvoided PerFU Client
Jail Booking $357 $164 $193
Jail Housing $2,243 $673 $1,570
AmbulanceTransport
$4,031 $2,288 $1,743
Hospital EDVisits
$4,237 $1,895 $2,342
HospitalInpatient Days
$12,963 $6,741 $6,222
Annual Total PerClient
$23,831 $11,767 $12,070
Annual Totalfor 78 Clients
$1,858,818 $917,826 $940,992