santalum album l (sandalwood) from
TRANSCRIPT

SCIENTIFIC CORRESPONDENCE
CURRENT SCIENCE, VOL. 110, NO. 2, 25 JANUARY 2016 148
that the 3-regions of genes may have specialized chromatin structure more amenable to tagging. In conclusion, our finding holds prom-ise for efficient gene tagging even with shorter oligos, thus reducing the cost. This factor could be especially useful when planning large-scale gene tagging in S. pombe. After successful tagging, the ku80 mutation can be easily out-crossed. Further improvements can be attempted by combining ku80 with mu-tations in ku70 and other genes involved in the NHEJ pathway. Conflict of interest: The authors de-clare no conflict of interest.
1. Bähler, J. et al., Yeast, 1998, 14, 943–951.
2. Egel, R., The Molecular Biology of Schizosaccharomyces pombe: Genetics, Genomics and Beyond, Springer, Berlin, 2004.
3. Moreno, S., Klar, A. J. and Nurse, P., Methods Enzymol., 1991, 194, 795–823.
4. Nayak, T. et al., Genetics, 2006, 172, 1557–1566.
5. Ninomiya, Y., Suzuki, K., Ishii, C. and Inoue, H., Proc. Natl. Acad. Sci. USA, 2004, 101, 12248–12253.
6. Zhang, J. et al., Curr. Microbiol., 2011, 62, 1342–1346.
7. Kim, D. U., Nature Biotechnol., 2010, 28, 617–623.
8. Ranjan, R., Verma, S. K. and Ahmed, S., J. Yeast Fungal Res., 2010, 1, 165–169.
9. Hentges, P., Driessche, B. V., Tafforeau, L., Vandenhaute, J. and Carr, A. M., Yeast, 2005, 22, 1013–1019.
10. D’Adda di Fagagna, F., Hande, M. P., Tong, W. M., Roth, D., Lansdorp, P. M., Wang, Z. Q. and Jackson, S. P., Curr. Biol., 2011, 11, 1192–1196.
11. Manolis, K. G., Nimmo, E. R., Hartsui-kar, E., Carr, A. M., Jeggo, P. A. and Allshire, R., EMBO J., 2001, 20, 210–221.
12. Fennessy, D. et al., PLoS ONE, 2014, 9, e97683.
ACKNOWLEDGEMENTS. We thank Jurg Bahler, University College, London, UK; Tony Carr, University of Sussex, Brighton, UK; and Shakil Ahmed, Central Drug Re-search Institute, Lucknow, India for plasmids. This work was supported by Intramural fund-ing from Council of Scientific and Industrial
Research (CSIR), New Delhi. P.S., B.S., Jyotsna and A.S. were recipients of Senior Research Fellowship from CSIR. S.H. is a DST-WosA scientist. Received 8 August 2015; accepted 11 Sep-tember 2015
POONAM SHUKLA1,2
BALVEER SINGH1,3 ASHOK SAINI1,4
JYOTSNA1 SWATI HALDAR1
JAGMOHAN SINGH1,* 1Institute of Microbial Technology, Sector 39A, Chandigarh 160 036, India 2Department of Biotechnology, Indian Institute of Technology, Kanpur 208 016, India 3Institut Pasteur, Dynamic of the Genome Unit, 75724 Paris, France 4Delhi University, Delhi 110 007, India *For correspondence. e-mail: [email protected]
A new population of Santalum album L. (sandalwood) from Agali Forest Range, Kerala, India Santalum album (sandalwood) is indige-nous to peninsular India and is naturally distributed over 9600 sq. km (ref. 1) from Kerala in the south to Uttar Pradesh in the north, in regions with varying eco-climatic conditions and edaphic factors2. In Kerala, natural sandal populations have been reported from Marayur (Idukki district), Meppadi (Wayanad dis-trict), Wadakkanchery (Thrissur district), Ottapalam (Palakkad district), Kannavam (Kannur district) and some fragments of Kollam and Kasargod districts3,4. In India, most of the existing sandal popula-tions are not dense. They are devoid of large girth class trees due to illicit fell-ing, hacking, forest fire and encroach-ments5. The sandal area is declining drastically due to over-exploitation, poor seed germination, poor regeneration and failure of artificial regeneration6. Exten-sive extraction of heartwood has severely decimated the natural stands of the trees in forests and has rendered many popula-
tions fragmented7. Since much of sandal wealth and natural sandal-bearing areas have been lost, the remaining sandal
trees are to be effectively protected and their natural habitats to be preserved8. In addition to the conservation of the
Figure 1. Map showing sandal population in Marappalam, Agali Forest Range, Kerala, India.
SCIENTIFIC CORRESPONDENCE
CURRENT SCIENCE, VOL. 110, NO. 2, 25 JANUARY 2016 149
Table 1. Plant species and their relative contribution to the population dominated by sandalwood in Agali, Kerala, India
Basal area Density Percentage Species (m2/ha) (individuals/ha) frequency IVI Relative IVI
Albizia amara (Roxb.) Boivin 1.48 10 10 5.58 1.86 Bauhinia racemosa Lam. 0.23 12 10 3.42 1.14 Breynia retusa (Dennst.) Alston 2.3 20 10 7.98 2.66 Breynia vitis-idaea (Burm. f.) C.E.C. Fisch. 0.41 28 30 9.77 3.26 Carissa hirsuta Roth 1.96 26 30 12.47 4.16 Carissa spinarum L. var. spinarum Hook. f. 0.63 8 10 4.11 1.37 Carmona retusa (Vahl) Masamune 0.18 12 10 3.33 1.11 Cassine albens (Retz.) Kosterm. 1.69 10 10 5.95 1.98 Cipadessa baccifera (Roth) Miq. 0.75 40 40 13.38 4.46 Diospyros cordifolia Roxb. 0.28 8 10 3.52 1.17 Grewia hirsuta Vahl 0.39 14 10 3.69 1.23 Ixora pavetta Andr. 0.12 6 10 3.22 1.07 Mundulea sericea (Willd.) Cheval. 0.13 48 20 11.17 3.72 Naringi crenulata (Roxb.) Nicolson 16.15 258 70 66.75 22.25 Pongamia pinnata (L.) Pierre 0.5 8 10 3.89 1.3 Premna tomentosa Willd. 0.1 10 10 3.19 1.06 Psychotria macrocarpa Hook. f. 0.9 58 50 17.63 5.87 Santalum album L. 21.05 390 100 95.08 31.69 Strychnos potatorum L.f. 0.65 20 20 7.15 2.38 Tectona grandis L. f. 6.75 34 20 18.7 6.23 Total 56.65 1020
existing populations, an extensive survey
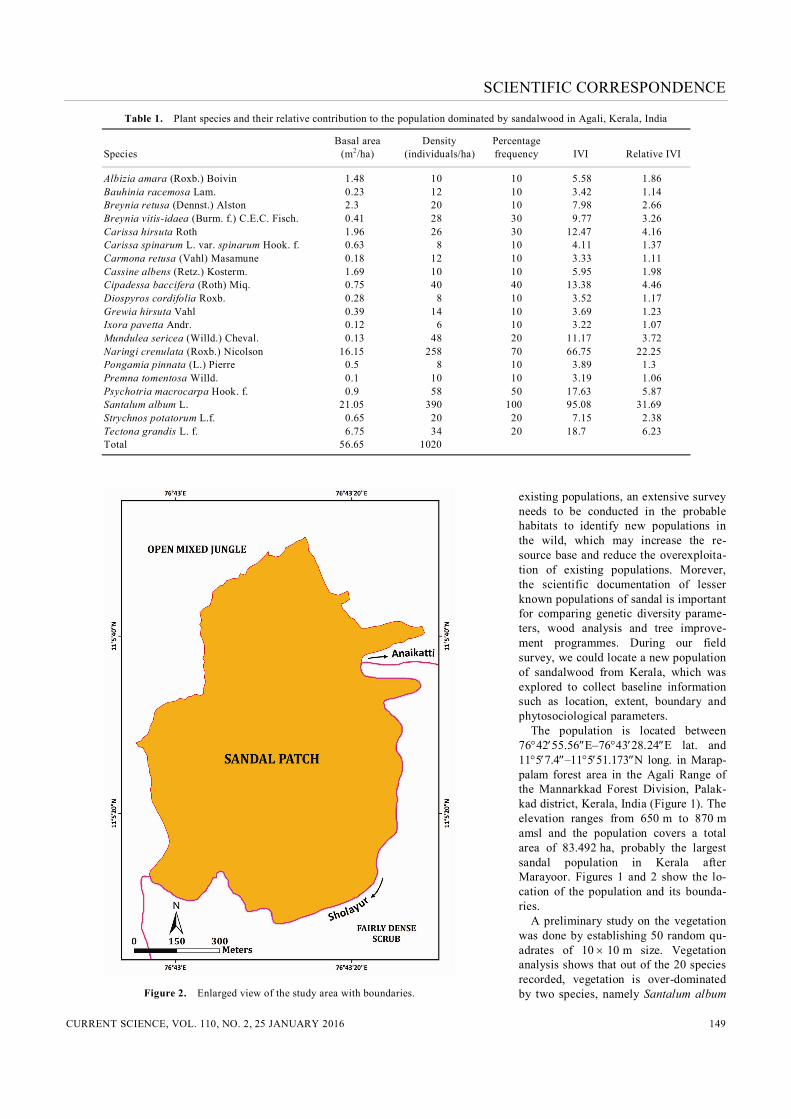
needs to be conducted in the probable habitats to identify new populations in the wild, which may increase the re-source base and reduce the overexploita-tion of existing populations. Morever, the scientific documentation of lesser known populations of sandal is important for comparing genetic diversity parame-ters, wood analysis and tree improve-ment programmes. During our field survey, we could locate a new population of sandalwood from Kerala, which was explored to collect baseline information such as location, extent, boundary and phytosociological parameters. The population is located between 764255.56E–764328.24E lat. and 1157.4–11551.173N long. in Marap-palam forest area in the Agali Range of the Mannarkkad Forest Division, Palak-kad district, Kerala, India (Figure 1). The elevation ranges from 650 m to 870 m amsl and the population covers a total area of 83.492 ha, probably the largest sandal population in Kerala after Marayoor. Figures 1 and 2 show the lo-cation of the population and its bounda-ries. A preliminary study on the vegetation was done by establishing 50 random qu-adrates of 10 10 m size. Vegetation analysis shows that out of the 20 species recorded, vegetation is over-dominated by two species, namely Santalum album
Figure 2. Enlarged view of the study area with boundaries.

SCIENTIFIC CORRESPONDENCE
CURRENT SCIENCE, VOL. 110, NO. 2, 25 JANUARY 2016 150
and Naringi crenulata, which represent 53.94% of the total importance value index (IVI) (Table 1). The third species based on IVI value was Tectona grandis, which contributes only 6% of total IVI. The population includes a total of 20 species in which 13 were poorly repre-sented with less than 2% in relative IVI. In addition, sandal excels all other spe-cies in phytosociological data with 31% of IVI, more than 36% of total basal area, more than 38% of total density (390 individuals/ha); it is the only species with 100% frequency of distribution in the study area (Table 1). This indicates that the edaphic and climatic factors in the study area are highly suitable for S. album and hence provides an opportunity for thorough exploration in adjacent areas for new sandal populations. De-tailed studies are also required to under-stand the regeneration pattern, population dynamics and total number of sandal trees in the entire population. Phenotypic characterization, genetic di-versity assessment and wood characteri-zation for comparing with other populations are also suggested for devel-oping tree improvement and ex situ con-servation programmes. Based on our observations, the existing staff pattern of the Forest Department is to be revised for ensuring proper protection of the de-scribed sandal population. Officials of the Forest Department are making efforts to conserve the population with their lim-ited human resource. A detailed study on this population with the following objec-tives is suggested to develop strategies for conservation and sustainable utiliza-
tion of sandalwood resources of this par-ticular population: Generate baseline information on to-
tal number of trees in different girth classes and up-to-date assessment of sandalwood volume.
Assess the quality of heartwood. Analyse the regeneration pattern and
population dynamics to understand and assess the threats to the popula-tion.
Determine genetic structure of the population, especially genetic vari-ability within and between popula-tions, and significant level of gene flow between and among popula-tions.
Assess current conservation and man-agement activities to develop im-proved strategies.
1. Srinivasan, V. V., Sivaramakrishnan, V. R., Rangaswamy, C. R., Ananthapadma-nabha, H. S. and Shankaranarayana, K. H., Sandal (Santalum album L.), ICFRE, Dehra Dun, 1992.
2. Jain, S. H., Angadi, V. G., Rajeevalochan, A. N., Shankaranarayana, K. H., Theagara-jan, K. S. and Rangaswamy, C. R., In San-dal and its Products (eds Radomiljac, A. M. et al.), Australian Centre for Interna-tional Agricultural Research (ACIAR) Pro-ceedings (84), Canberra, Australia, 1998, pp. 117–120.
3. Srimathi, R. A., Kulkarni, H. D. and Venkatesan, K. R., In Recent Advances in Research and Management of Santalum album L. in India (eds Srimathi, R. A. et al.), Associated Publishing Co, New Delhi, 1995, p. 416.
4. Suma, T. B. and Balasundaran, M., Indian J. Genet., 2004, 64(1), 13–16.
5. Parthiban, K. T., Surendran, C., Murugesh, M. and Bhuvaneswaran, C., In Sandal and its Products (eds Radomiljac, A. M.), ACIAR Proceedings. No. 84, ACIAR, Canberra, Australia, 1998, p. 7478.
6. Jeeva, V., Saravanan, S., Devaraj, P. and Lakshmidevi, R., In Sandal and its Prod-ucts (eds Radomiljac, A. M. et al.), ACIAR Proceedings, No. 84, ACIAR, Canberra, Australia, 1998, p. 16.
7. Rao, M. N., Ganeshaiah, K. N. and Uma Shaanker, R., Conserv. Genet., 2007, 8, 925–935; ISSN 1566-0621.
8. Swaminathan, M. H., Hosmath, B. J. and Mallesha, B. B., In Sandal and its Prod-ucts (eds Radomiljac, A. M. et al.), ACIAR Proceerdings (84), IWST & KSFD, Bengaluru, 1998, pp. 3–5.
ACKNOWLEDGEMENTS. We thank Di-rector, Kerala Forest Research Institute, Pee-chi for support and encouragement. We also thank the Divisional Forest Officer, Mannark-kad and Range Officer, Agali and other offi-cials of Kerala Forest Department for their support during field work. Received 16 March 2015; revised accepted 3 September 2015
K. A. SREEJITH* V. B. SREEKUMAR
T. K. NIRMESH R. SUGANTHASAKTHIVEL
Forest Ecology and Biodiversity Conservation Division, Kerala Forest Research Institute, Peechi 680 653, India *For correspondence e-mail: [email protected]
Thermal anomaly from NOAA data for the Nepal earthquake The Himalaya originated as a result of the collision of the northward-moving Indian continent with the Eurasian conti-nent. Due to the continued impingement of the Indian plate, sufficient strain got accumulated, and the recent earthquake of 25 April 2015 took place in near Kath-mandu, Nepal (epicenter 28.3N, 84.5E with magnitude 7.8 on the Richter scale and focal depth approximately 8 km)1,2 due to thrust faulting. The study area comprises a large part of central and far-western Nepal (Figure 1) for monitor-
ing the thermal anomalies associated with this earthquake. The tectonic fea-tures in Figure 1 have been taken from GSI3. Nepal is located in the central sector of the southwardly convex Himalayan moun-tain arc. Nepal Himalaya, occupying the central 800 km part, can be divided into five distinct geotectonic zones from south to north as follows: (1) Terai Plain, (2) Sub-Himalaya (Siwalik Range), (3) Lesser Himalaya, (4) Higher Himalaya and (5) Inner Himalaya (Tibetan Tethys).
Each of these zones can be identified by its distinct tectonic, morphologic and geologic features4. The main seismotec-tonic boundaries characterized as thrusts from south to north are the Main Frontal Thrust (MFT), Main Boundary Thrust (MBT) and Main Central Thrust (MCT), which are the boundary lines between the two consecutive units of Lesser Hima-laya and Higher Himalaya5. Figure 2 pre-sents a schematic representation of these features with respect to the Himalayan topography, basement slab and Himalayan