sap interim report - sap software solutions · in the third quarter, sap signed a global enterprise...
TRANSCRIPT
SAP INTERIM REPORT JANUARY to SEPTEMBER 2008
2 TABLE OF CONTENTS
INTRODUCTORY NOTES 3
INTERIM REVIEW OF SAP GROUP OPERATIONS (UNAUDITED) 4
CONSOLIDATED INTERIM FINANCIAL STATEMENTS (UNAUDITED) 15
ADDITIONAL FINANCIAL INFORMATION
NON-GAAP FINANCIAL DATA (UNAUDITED) 32
EXPLANATION OF NON-GAAP MEASURES 37
MULTI QUARTER SUMMARY (U.S. GAAP AND NON-GAAP) 39
ADDITIONAL INFORMATION
FINANCIAL CALENDAR, INVESTOR SERVICES AND IMPRINT 40

3
INTRODUCTORY NOTES
We prepared the financial data in the interim report of SAP AG and its subsidiaries in accordance with accounting principles generally accepted in the United States of America (U.S. GAAP).
The interim report is both our quarterly financial report pursuant to the Exchange Rules of the Frankfurt Stock Exchange, section 66, and our interim announcement pursuant to the German Securities Trading Act, section 37x.
All of the information in this interim report is unaudited. This means the information has been subject neither to any audit nor to any review by an independent auditor.

4 INTERIM REVIEW OF SAP GROUP OPERATIONS
INTERIM REVIEW OF SAP GROUP OPERATIONS (UNAUDITED) FORWARD-LOOKING STATEMENTS
This report contains forward-looking statements that are based on our beliefs and assumptions made using information currently available to us. Any statements contained in this report that are not historical facts are forward-looking statements as defined in the U.S. Private Securities Litigation Reform Act of 1995. We have based these forward-looking statements on our current expectations and related projections we make about future conditions and events, including, but not limited to, economic conditions in general and trends in our business; our ability to attract and retain personnel; competition in the software industry; our implementation of business strategy; the development and introduction of new services and products; freedom to use intellectual property; regulatory and political conditions; our adaptation to technological developments; the acceptance by the market of our services and products; terrorist attacks or other acts of violence or war; our integration of newly acquired businesses; our meeting customers’ requirements; and other risks and uncertainties, some of which we describe in the Risk section. The words “anticipate,” “believe,” “continue,” “counting on,” “is confident,” “estimate,” “expect,” “forecast,” “guidance,” “intend,” “may,” “outlook,” “plan,” “project,” “predict,” “seek to,” “should,” “strategy,” “want,” “will,” “would,” and similar expressions as they relate to us are intended to identify such forward-looking statements. Such statements reflect our current views and assumptions and all forward-looking statements are subject to various risks and uncertainties that could cause actual results to differ materially from those statements. The factors that could affect our future financial results are discussed more fully in our filings with the U.S. Securities and Exchange Commission (SEC), in particular our Annual Report on Form 20-F for fiscal year 2007. Readers are cautioned not to place undue reliance on these forward-looking statements, which speak only as of the date of this report. We undertake no obligation to publicly update or revise any forward-looking statements as a result of new information, future events, or otherwise.
NON-U.S. GAAP FINANCIAL MEASURES
We show and explain the reconciliation from U.S. GAAP measures to non-GAAP measures in Part Additional Financial Information.
BUSINESS IN THE THIRD QUARTER AND IN THE FIRST NINE MONTHS 2008
GLOBAL ECONOMY
In the third quarter of 2008, output growth struggled in the face of economic headwinds, inexorable inflationary pressure, and a collapse of confidence on the markets. The European Central Bank (ECB) reported in the autumn of 2008 that persistent tension on the financial markets, in association with high commodity prices and the housing market adjustments that are in process in several industrialized countries, continued to weigh heavily on economic activity. The Organisation for Economic Co-operation and Development (OECD) also still sees these factors as the significant brakes on global growth. The International Monetary Fund (IMF) is even more frank: It sees the present financial problems as the worst the global economy has suffered since the 1930s. It reports that the financial difficulties, which first became apparent with the U.S. subprime home loan collapse in August 2007, deepened further during the second and third quarters of 2008 and entered an even more serious phase in September. Massive state interventions failed to quell market panic in the third quarter. The IMF notes that the problems in the finance sector began to make themselves felt in the “real” economy during 2008, affecting investment demand and consumer demand alike.
In this context, the OECD estimates that in the United States, annualized quarter-over-quarter economic growth was 0.9% in the third quarter of 2008 (Q3 2007: 4.7%). The economic downturn that started in the United States is seriously affecting major economies worldwide, in the ECB’s analysis. Thus, the OECD reports a fall in annualized third-quarter economic growth to 0.4% in the euro area (Q3 2007: 2.5%) and to 0% in Germany (Q3 2007: 2.4%). Conversely, Japan’s economic growth for the same period rose to 2.4% (Q3 2007: 1.0%). According to the IMF’s numbers, the downturn in the advanced economies has deepened since the second quarter of 2008, and world trade growth has decelerated significantly. On the other hand, the ECB notes that robust domestic demand buoyed growth in the emerging economies.
IT MARKET
Until the summer of 2008, the global IT market fared comparatively well despite sustained turmoil on the financial markets and declining economic growth. While demand in some industries, such as financial services, retail, and construction, remained weak, IT sales growth was relatively constant into the third quarter of 2008. That is the assessment of IDC, a market research firm based in the United States. Such robust growth in IT sales is predicated on the increasing
5
complexity of the tasks that IT accomplishes for companies, and on the resultant efficiency gains.
However, as the credit crunch worsened, from mid-September companies showed for a short time much less willingness to invest in IT. Citigroup, a U.S. financial services
organization, believes companies will probably not fully flush their 2008 IT budgets. Investment bank Goldman Sachs’s IT spending indicator suggests IT capital expenditure growth will decelerate significantly over the full year.
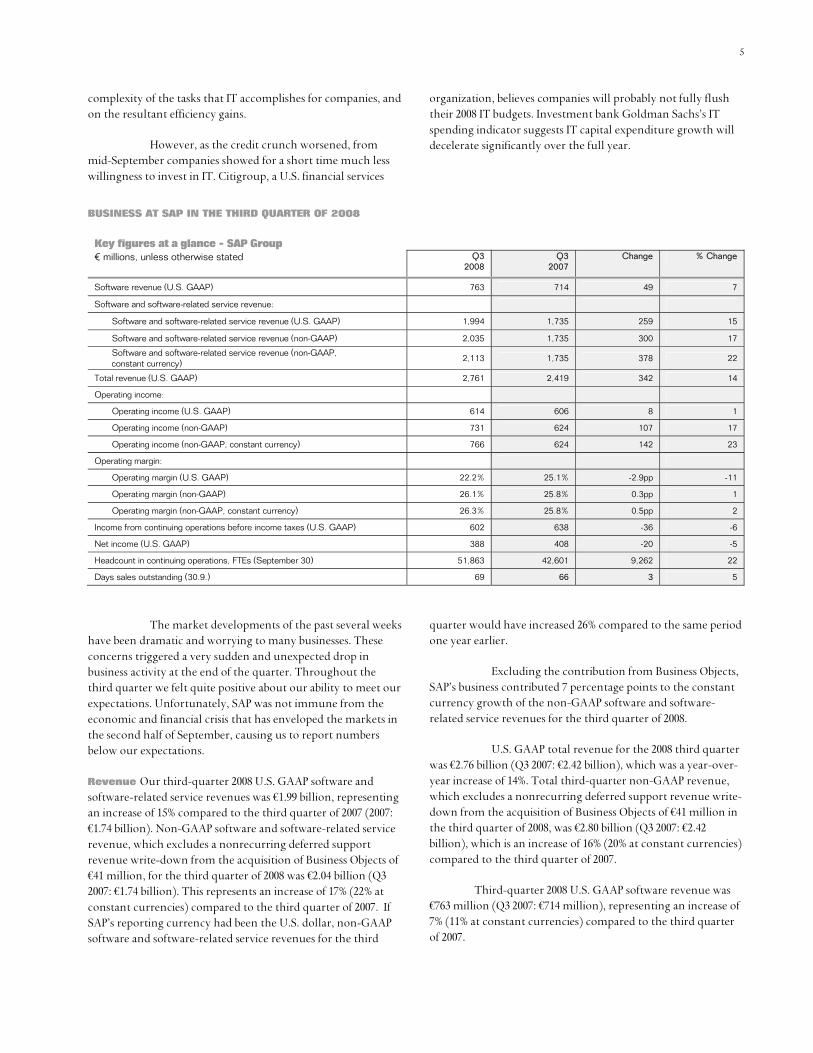
BUSINESS AT SAP IN THE THIRD QUARTER OF 2008
Key figures at a glance - SAP Group € millions, unless otherwise stated Q3
2008 Q3
2007 Change % Change
Software revenue (U.S. GAAP) 763 714 49 7
Software and software-related service revenue:
Software and software-related service revenue (U.S. GAAP) 1,994 1,735 259 15
Software and software-related service revenue (non-GAAP) 2,035 1,735 300 17
Software and software-related service revenue (non-GAAP, constant currency)
2,113 1,735 378 22
Total revenue (U.S. GAAP) 2,761 2,419 342 14
Operating income:
Operating income (U.S. GAAP) 614 606 8 1
Operating income (non-GAAP) 731 624 107 17
Operating income (non-GAAP, constant currency) 766 624 142 23
Operating margin:
Operating margin (U.S. GAAP) 22.2% 25.1% -2.9pp -11
Operating margin (non-GAAP) 26.1% 25.8% 0.3pp 1
Operating margin (non-GAAP, constant currency) 26.3% 25.8% 0.5pp 2
Income from continuing operations before income taxes (U.S. GAAP) 602 638 -36 -6
Net income (U.S. GAAP) 388 408 -20 -5
Headcount in continuing operations, FTEs (September 30) 51,863 42,601 9,262 22
Days sales outstanding (30.9.) 69 66 3 5
The market developments of the past several weeks have been dramatic and worrying to many businesses. These concerns triggered a very sudden and unexpected drop in business activity at the end of the quarter. Throughout the third quarter we felt quite positive about our ability to meet our expectations. Unfortunately, SAP was not immune from the economic and financial crisis that has enveloped the markets in the second half of September, causing us to report numbers below our expectations.
Revenue Our third-quarter 2008 U.S. GAAP software and software-related service revenues was €1.99 billion, representing an increase of 15% compared to the third quarter of 2007 (2007: €1.74 billion). Non-GAAP software and software-related service revenue, which excludes a nonrecurring deferred support revenue write-down from the acquisition of Business Objects of €41 million, for the third quarter of 2008 was €2.04 billion (Q3 2007: €1.74 billion). This represents an increase of 17% (22% at constant currencies) compared to the third quarter of 2007. If SAP’s reporting currency had been the U.S. dollar, non-GAAP software and software-related service revenues for the third
quarter would have increased 26% compared to the same period one year earlier.
Excluding the contribution from Business Objects, SAP’s business contributed 7 percentage points to the constant currency growth of the non-GAAP software and software-related service revenues for the third quarter of 2008.
U.S. GAAP total revenue for the 2008 third quarter was €2.76 billion (Q3 2007: €2.42 billion), which was a year-over-year increase of 14%. Total third-quarter non-GAAP revenue, which excludes a nonrecurring deferred support revenue write-down from the acquisition of Business Objects of €41 million in the third quarter of 2008, was €2.80 billion (Q3 2007: €2.42 billion), which is an increase of 16% (20% at constant currencies) compared to the third quarter of 2007.
Third-quarter 2008 U.S. GAAP software revenue was €763 million (Q3 2007: €714 million), representing an increase of 7% (11% at constant currencies) compared to the third quarter of 2007.

6 INTERIM REVIEW OF SAP GROUP OPERATIONS
On July 15, 2008, we announced the 20,000th customer for SAP Business One, our integrated business management application for small businesses, demonstrating a rapid market adoption rate for this application. We have doubled the SAP Business One customer base in less than two years.
In the third quarter of 2008, SAP closed major contracts in several key regions, including, among others, Bundesagentur für Arbeit, CENEXI, DTEK, Imperial Bank Limited, and TD Perekrestok in the Europe, Middle East, and Africa (EMEA) region; Callaway Golf Company, Loblaw Companies Limited, Municipio de Medellin, Servicios Liverpool, and Southern California Edison in the Americas region; and China Telecom System Integration Co., Ltd, Gansu Electric Power Corp., Tomen Electronics Corp., Universal Scientific Industrial Co., Ltd., and Wuthelam Holdings Pte Ltd in the Asia Pacific Japan region.
In the third quarter, SAP signed a Global Enterprise Agreement (GEA) with Procter & Gamble. The GEA with P&G extends our position as a leader in providing comprehensive enterprise software for the consumer products industry.
On September 16, 2008, SAP and The Hong Kong and Shanghai Banking Corporation announced that the HSBC Group (HSBC) will create a leading edge bank-client integration solution using the SAP NetWeaver technology platform to streamline and automate the bank’s communications for the delivery of banking services to its corporate banking clients.
Market position In the three-quarter period ended September 30, 2008, SAP’s worldwide share of U.S. GAAP software and software-related service revenue among core enterprise applications vendors, which account for approximately US$38.7 billion as defined by SAP based on industry analyst research, was 33.4%. This represents a 6.5 percentage point increase compared to the three-quarter period ended September 30, 2007, of which approximately 3.3 percentage points came from organic growth and 3.2 percentage points from the acquisition of Business Objects.
In July, Business Objects announced that research analyst firm IDC ranked Business Objects as the number one
vendor for business intelligence (BI) tools with over 14 percent market share.
Also in July, SAP announced that we had been named the worldwide market share leader based on total software revenue for business solutions in the customer relationship management (CRM), enterprise resource planning (ERP), and supply chain management (SCM) markets, according to 2007 market share reports published by independent research firm Gartner, Inc.
Income Our U.S. GAAP operating income for the third quarter was €614 million, which was an increase of 1% compared to the third quarter of 2007 (Q3 2007: €606 million). Third-quarter non-GAAP operating income, which excludes a nonrecurring deferred support revenue write-down from the acquisition of Business Objects and acquisition-related charges totaling €117 million, was €731 million (Q3 2007: €624 million), which was an increase of 17% (23% at constant currencies) compared to the third quarter of 2007.
The U.S. GAAP operating margin for the third quarter of 2008 was 22.2% (Q3 2007: 25.1%). The third quarter non-GAAP operating margin was 26.1% (Q3 2007: 25.8%), or 26.3% at constant currencies. Both the U.S. GAAP and the non-GAAP operating margins were affected by one-time expenses associated with the integration of Business Objects (which are not acquisition-related charges) of approximately €14 million.
U.S. GAAP income from continuing operations for the third quarter of 2008 was €409 million (Q3 2007: €414 million), representing a decrease of 1% compared to the third quarter of 2007. Non-GAAP income from continuing operations, which excludes a nonrecurring deferred support revenue write-down from the acquisition of Business Objects and acquisition-related charges totaling €87 million, was €496 million (Q3 2007: €425 million), representing an increase of 17% compared to the third quarter of 2007.
U.S. GAAP basic earnings per share from continuing operations for the third quarter of 2008 was €0.35 (Q3 2007: €0.35), which was flat compared to the corresponding period in 2007. Non-GAAP earnings per share from continuing operations for the third quarter of 2008 was €0.41 (Q3 2007: €0.36), which was an increase of 14% compared to the corresponding period in 2007.

7
BUSINESS AT SAP IN THE FIRST NINE MONTHS OF 2008
Key figures at a glance - SAP Group € millions, unless otherwise stated 1/1/-9/30/
2008 1/1/-9/30/
2007 Change % Change
Software revenue (U.S. GAAP) 2,283 1,992 291 15
Software and software-related service revenue:
Software and software-related service revenue (U.S. GAAP) 5,791 4,954 837 17
Software and software-related service revenue (non-GAAP) 5,931 4,954 977 20
Software and software-related service revenue (non-GAAP, constant currency)
6,241 4,954 1,287 26
Total revenue (U.S. GAAP) 8,079 7,002 1,077 15
Operating income:
Operating income (U.S. GAAP) 1,566 1,623 -57 -4
Operating income (non-GAAP) 1,931 1,665 266 16
Operating income (non-GAAP, constant currency) 2,075 1,665 410 25
Operating margin:
Operating margin (U.S. GAAP) 19.4% 23.2% -3.8pp -16
Operating margin (non-GAAP) 23.5% 23.8% -0.3pp -1
Operating margin (non-GAAP, constant currency) 24.0% 23.8% 0.2pp 1
Income from continuing operations before income taxes (U.S. GAAP) 1,557 1,718 -161 -9
Net income (U.S. GAAP) 1,038 1,167 -129 -11
Revenue Our U.S. GAAP software and software-related service revenue was €5.79 billion (2007: €4.95 billion) in the first nine months of 2008, representing an increase of 17% compared to the first nine months of 2007. Non-GAAP software and software-related service revenue for the first nine months of 2008 was €5.93 billion, which excludes a nonrecurring deferred support revenue write-down from the acquisition of Business Objects of €140 million (2007: €4.95 billion). This represents an increase of 20% (26% at constant currencies) compared to the first nine months of 2007. If SAP’s reporting currency had been the U.S. dollar, non-GAAP software and software-related service revenue for the first nine months would have increased 35% compared to the corresponding period one year earlier.
Excluding the contribution from Business Objects, SAP’s business contributed 12 percentage points to the constant currency growth of non-GAAP software and software-related service revenue for the first nine months of 2008.
U.S. GAAP total revenue for the first nine months of 2008 was €8.08 billion (2007: €7.00 billion), which was a year-over-year increase of 15%. Non-GAAP total revenue for the first nine months of 2008, which excludes a nonrecurring deferred support revenue write-down from the acquisition of Business Objects of €140 million was €8.22 billion (2007: €7.00 billion), an increase of 17% (24% at constant currencies) compared to the first nine months of 2007.
U.S. GAAP software revenue was €2.28 billion in the first nine months of 2008 (2007: €1.99 billion), representing an increase of 15% (21% at constant currencies) compared to the corresponding period in 2007.
Business Objects is included in our financial data from January 21, 2008, onwards.
Income Our U.S. GAAP operating income in the first nine months of 2008 was €1.57 billion (2007: €1.62 billion), which was a decrease of 4% compared to the corresponding period in 2007. Non-GAAP operating income in the first nine months, which excludes a nonrecurring deferred support revenue write-down from the acquisition of Business Objects and acquisition-related charges totaling €365 million, was €1.93 billion (2007: €1.67 billion), which was an increase of 16% (25% at constant currencies) compared to the first nine months of 2007.
The U.S. GAAP operating margin for the the first nine months of 2008 was 19.4% (2007: 23.2%). The non-GAAP operating margin for the the first nine months was 23.5% (2007: 23.8%), or 24.0% at constant currencies. Both the U.S. GAAP and the non-GAAP operating margins were negativly affected by €24 million expensed in the second quarter of 2008 for the settlement of a lawsuit and by nonrecurring expenses associated with the integration of Business Objects (which are not acquisition-related charges) of approximately €33 million.

8 INTERIM REVIEW OF SAP GROUP OPERATIONS
U.S. GAAP income from continuing operations for the first nine months of 2008 was €1.07 billion (2007: €1.18 billion), representing a decrease of 9% compared to the corresponding period in 2007. Non-GAAP income from continuing operations, which excludes a nonrecurring deferred support revenue write-down from the acquisition of Business Objects and acquisition-related charges totaling €271 million, was €1.34 billion (2007: €1.21 billion), representing an increase of 11% compared to the first nine months of 2007. In 2007, U.S. GAAP and non-GAAP income from continuing operations for the first nine months of the year were positively affected by effective tax rates of 25.5% and 25.8%, respectively, partly resulting from nonrecurring tax effects of the second quarter of 2007.
U.S. GAAP earnings per share from continuing operations for the first nine months of 2008 was €0.90 (2007: €0.98), which was a decrease of 8% compared to the corresponding period in 2007. Non-GAAP earnings per share from continuing operations for the same period was €1.12 (2007: €1.00), which was an increase of 12% compared to the corresponding period in 2007.
FINANCIAL POSITION
Operating cash flow for the first nine months of 2008 was €1,970 million (2007: €1,344 million).
On September 30, 2008, our Group liquidity, comprising cash and cash equivalents, restricted cash and short-term investments and certain investments that U.S. GAAP defines as short-term but IFRS defines as long-term, totaled €1,600 million (December 31, 2007: €2,756 million). This decrease in comparison to December 31, 2007, was primarily due to the dividend payment and large outflows for acquisitions and for stock repurchasing.
Total assets stood at €13,611 million on September 30, 2008, an increase of 31% from €10,366 million on December 31, 2007, mainly due to the acquisition of Business Objects.
RESEARCH AND DEVELOPMENT, PRODUCTS
Our success depends on delivering innovative solutions that truly improve customers’ business processes. That is why continued development of our solution offerings was again our focus in the first nine months of 2008.
R&D expenses increased by 18% to €1,236 million in the first nine months of 2008 (Q3 2008: €398 million) compared to €1,049 million of the first nine months of 2007 (Q3 2007: €357 million), driven mainly by the acquisition of Business Objects. Underscoring our commitment to development, the amount we spent on R&D as a percentage of total revenue in the first
nine months of 2008 was 15%, similar to the prior year level (2007: 15%). The number of full-time equivalent (FTE ) employees working in development teams in the continuing operations recorded for our U.S. GAAP financial data rose in the first nine months of 2008 to 15,458 (September 30, 2007: 12,532; December 31, 2007: 12,951). Increases of 1,697 employees working in development teams derive from the acquisition of Business Objects in January 2008.
Our research, development, and product efforts were rewarded with the following achievements:
In January 2008, SAP and Business Objects unveiled our first joint offerings. Nine combined product packages were chosen to address the most common challenges facing business users, which include: gaining better business insight, improving company performance and ensuring compliance with corporate governance policies.
Also in January 2008, we announced that by uniting two of the technology industry’s biggest brands, SAP and Business Objects now intend to embark on a road map to transform our wide lead in the market of software for business users into leadership in the emerging market for business performance optimization.
At the annual Lotusphere conference in January 2008, SAP and IBM announced plans to deliver our first joint software product, codenamed Atlantic, which will integrate IBM Lotus Notes software with SAP Business Suite. The combined efforts to create Atlantic will result in a new style of applications that present information and data in a context familiar to users of the Lotus Notes desktop. This will make it easier for users to do their jobs and greatly enhance the return on investment that companies have made in their SAP applications.
At the end of January 2008, we announced the launch of an Industry Value Network for public security. The Industry Value Network for public security will join 15 existing industry-focused networks hosted by SAP and brings together customers, partners and SAP to develop solutions that solve the unique challenges of the public security industry. The solutions are based on service-oriented architecture and open standards to fuel a new dimension of industry interoperability and collaboration.
In February 2008, we announced the industry’s first Intelligence Platform. A single, enterprise-scale platform, BusinessObjects XI 3.0 breaks the barriers of traditional business intelligence (BI), helping to ensure that all people connected with an organization can have access to the information they need.

9
Also in February 2008, we announced a new fast-start program for our proven SAP Business-All-in-One solutions. The program targets midsize companies in the manufacturing, services, and trade industries and provides them with the preconfigured industry-specific processes needed to streamline and gain visibility into their core business operations.
Building on our announced fast-start program for SAP Business All-in-One solutions, we revealed in the beginning of March plans for an expansion of our partnership with Intel. SAP and our long-term technology partner Intel intend to introduce a ground-breaking offering that will be offered on an Intel-based system via original equipment manufacturer (OEM) and hardware system providers based on SUSE Linux Enterprise from Novell and the database SAP MaxDB.
At the end of February 2008, we announced the third enhancement package for our market-leading enterprise resource planning (ERP) application, SAP ERP. Enhancement packages enable customers to access new software features via a simple download to switch on as needed, responding directly to customer requests for access to new features without touching mission-critical core systems.
SAP and IDS Scheer announced in March an expansion of our strategic partnership that will enable customers, for the first time, to take a model and process-centric approach to the implementation of service-enabled business applications from SAP.
In March 2008, we announced an extension of our relationship with Novell to enable customers of all sizes to run, manage and secure mission-critical operations on Linux. In a move that will help meet the growing demand for SUSE Linux Enterprise and provide support for the open source community, Novell and SAP are planning to offer enhanced options for customers who choose to run open source.
In May, we announced new CRM functionality in the SAP Business All-in-One solution that will considerably enhance SAP’s midsize customers’ ability to pursue new customer strategies and manage entire end-to-end business processes with preconfigured best practices.
SAP’s international customer conference, SAPPHIRE 2008, held in Orlando, Florida, May 4 to 7 and Berlin, Germany, May 19 to 21, focused on Business Beyond Boundaries. During SAPPHIRE 2008, customers from throughout the world showed how they utilize and benefit from SAP solutions to build “business beyond boundaries.”
In May, SAP and Satyam Computer Services Ltd. announced a new partnership to help businesses accelerate co-innovation and improve their return on investment. Under a
new agreement, Satyam has become an SAP global services partner to help companies worldwide to reliably and rapidly implement SAP solutions and transform business processes.
We also announced in May that SAP would further extend its partnership with IBM for SAP Business All-in-One solutions.
We announced in May that Infosys had signed up to the SAP Global Service Partner Program. This announcement marked an important milestone in the relationship between the two organizations which have been working together for more than five years to help companies realize IT and business results from their investments in SAP applications.
SAP and Research In Motion (RIM) announced in May a co-innovation partnership to usher in a new era in enterprise mobility. Both companies have joined forces to change the way people work by enabling anytime, anywhere mobile access to SAP enterprise applications through the widely adopted BlackBerry® platform.
In the middle of July, we announced additional information about our SAP Enterprise Support strategy. Enterprise support has been available since February 2008 and further demonstrats a dedication to providing solutions and support offerings that meet the evolving needs of customers.
In August, Business Objects announced the latest versions of its solutions for enterprise performance management (EPM), which will provide customers with improved control and agility, enabling them to enhance performance across both finance and operations. Additionally, Business Objects announced the availability of BusinessObjects Xcelsius Present. Xcelsius Present is a data-visualization tool that transforms ordinary, static Microsoft Office Excel spreadsheets into captivating visuals and allows business users to share them via Microsoft PowerPoint or Adobe PDF files.
This year’s SAP TechEd 2008 event season is driven by the theme Connect, Collaborate, Co-Innovate, bringing together the worldwide technical community to harness the collective knowledge and resources of the SAP ecosystem, helping them enhance their skills, get their jobs done with efficiency and provide added benefit to their companies. Now in its 12th year, SAP TechEd 2008 took place in Las Vegas in September and in Berlin in October, and will take place in Shanghai and Bangalore in November.
In September, Business Objects announced the availability of BusinessObjects Metadata Management XI 3.0, software that enables organizations to apply data governance by providing a central view of metadata assets and their relationships.

10 INTERIM REVIEW OF SAP GROUP OPERATIONS
Also in September, we announced an SAP NetWeaver Fund investment in InnoCentive, Inc., a global online open innovation marketplace. The addition of InnoCentive to the SAP ecosystem fosters co-innovation by providing a global platform in which solution-providers are financially rewarded for offering solutions to complex business challenges.
EMPLOYEES
Reflecting the development of our business, we hired additional highly qualified professionals in the third quarter of 2008 (Q3 2008: 368 FTEs; Q3 2007: 853 FTEs), thus creating a foundation for future success and continued growth. At the end of the third quarter of 2008 we had 51,970 employees worldwide (Q3 2007: 42,772), of whom 107 were allocated to discontinued operations and 51,863 to continuing operations. (These headcount figures are measured in FTEs.) Our headcount numbers in the remainder of this section refer to our continuing operations only. Of those 51,863 employees, 15,455 were based in Germany (Q3 2007: 14,531). Of the overall headcount increase, 6,224 resulted from the acquisition of Business Objects in January 2008.
For the fourth year in a row, the Great Place to Work Institute named us Germany’s Best Employer in the category for companies with more than 5,000 employees. The Great Place to Work Institute also ranked SAP among the top 20 employers in Japan for the second time. These awards are recognition of SAP’s commitment to providing global career opportunities and a positive working environment for its employees.
Further evidence that SAP continues to be one of the best employers came from FORTUNE magazine in March 2008: The business magazine again ranked us among America’s Most Admired Companies this year. SAP attained fifth place in the computer software category.
We also continued to be globally recognized as an Employer of Choice in the second quarter of 2008. SAP received four additional recognitions as an Employer of Choice, being named among the best companies to work for in China, India, and Mexico, and among the best workplaces in Europe.
In the third quarter of 2008, SAP Spain was honored as one of the Best Companies to Work for in Spain. SAP China entered the top 10 standings for Most Popular Employers Among Chinese University Students. At the Shared Services Week Excellence Awards Asia 2008, our shared services organization in Asia was named Best New Shared Services Organization.
In the third quarter, at the Inkom Grand Prix 2008 in Berlin, SAP World, our employee magazine, ranked second in
the class for corporate publications that have a circulation of at least 15,000 copies.
COMPANY ORGANIZATION
The Supervisory Board appointed John Schwarz the seventh member of our Executive Board with effect from March 1, 2008. John Schwarz is the managing director of Business Objects, which is now an independent business unit within the SAP Group.
The SAP deputy CEO Léo Apotheker was appointed co-CEO alongside SAP CEO Henning Kagermann on April 2, 2008. This is in preparation for another smooth management transition at the top of the company. Now, Henning Kagermann and Léo Apotheker jointly guide the future of the world’s leading provider of business software.
Effective July 1, 2008, new appointments to the Executive Board extended our top management to a team of ten. Erwin Gunst, Bill McDermott and Jim Hagemann Snabe bring their extensive software industry and customer-focused experience to the Executive Board. Joining the Executive Board in the newly created position of chief operating officer (COO), Erwin Gunst aims to further improve the company’s operations and process efficiency. He is a 20-year SAP veteran and has previously served as president of our EMEA region before. Bill McDermott joined SAP in 2002 to manage the Americas region. He successfully led our market growth in North America and Latin America over the past six years. His purview had recently been extended to also oversee operations in the Asia Pacific Japan region. He now has responsibility for all sales regions worldwide. Jim Hagemann Snabe portfolio is SAP Business Suite and SAP NetWeaver technology platform development. He has been with SAP for more than 15 years, holding various management positions in sales and development, including managing director of the SAP Nordic region and general manager for industry solutions development globally. The responsibilities of all other current Executive Board members and corporate officers remained unchanged.
On July 21, 2008, SAP announced the decision to wind down operations of TomorrowNow, a subsidiary it purchased in February 2005 that has provided third-party support for Oracle and other applications. SAP conluded the wind-down process in the end of October 2008.
Peter Zencke, whose special area of responsibility on the Executive Board is research and breakthrough innovation, will be leaving SAP on December 31, 2008, as planned.
On October 31, 2008, SAP announced that after over 21 years with the company and 13 years as a member of the
11
Executive Board, Claus Heinrich has taken the decision to retire from the corporation in May 2009.
ACQUISITIONS
In 2008, we continued our announced policy of organic growth complemented by acquisitions aimed at enriching our product portfolio in terms of both technology and functions. We acquired two companies by buying their equity and we acquired the material assets of two other businesses.
In January we took over Business Objects, and squeezed out the residual minority shareholders in February. Business Objects is a provider of solutions in the field of business intelligence. The acquisition cost, net of cash acquired, was € 4.2 billion. The combination of Business Objects solutions with our technologies puts us in a position to offer a unique portfolio of products that give business users – process owners and decision makers in business – a full view of the intelligence they need for effective decision processes. For more information about our acquisition of Business Objects, see the Notes to the Interim Financial Statements section, Note 4.
In June, we acquired the material assets of Analytics Inc., a privately held company headquartered in New Haven, Connecticut, in the United States. Analytics Inc. data services and technology helped Business Objects strengthen the spend analytics in its enterprise performance management solution.
In July, we acquired the stock of Visiprise Inc., a privately held company headquartered in Alpharetta, Georgia, in the United States. Our acquisition of Visiprise, which specializes in integrated manufacturing execution systems, is a further step toward delivering on our “Perfect Plant” strategy, which brings together core SAP solutions with the software, hardware, and services offerings of ecosystem partners to drive innovation for discrete manufacturers.
In August, we acquired the Israel SAP consulting and sales arm of Ness Technologies, a publicly held provider of IT services and solutions.
SAP SHARE AND MARKET CAPITALIZATION
SAP AG common shares are listed on the Frankfurt Stock Exchange as well as a number of other German exchanges. In the United States, SAP’s American Depositary Receipts (ADRs), each representing one common share, trade on the New York Stock Exchange under the symbol “SAP”. SAP is a component of the DAX, the index of 30 German blue chip companies.
Pursuant to resolutions of the SAP AG Annual General Meetings of Shareholders on May 9, 2006 and May 10, 2007, on September 3, 2008 the Executive Board of SAP AG took a resolution to decrease the SAP AG capital stock from €1,246,683,912 (represented by 1,246,683,912 no-par shares, each with an attributable value of €1 in relation to the capital stock) to €1,225,683,912 (represented by 1,225,683,912 no-par shares, each with an attributable value of €1 in relation to the capital stock). Following this resolution, on September 4, 2008, 21,000,000 treasury shares were canceled, which approximated 1.7% of the capital stock before this corporate action.
SAP stock closed on September 30, 2008, at €37.67 (XETRA). That meant our market capitalization was approximately €46.2 billion at the end of the first nine months of 2008, based on 1,226 million shares outstanding. The stock price had increased 6.0% since the close of 2007. The DAX declined 27.7% during the first nine months, the Dow Jones EURO STOXX 50 decreased 30.9%, and the S&P North Software-Software Index (formerly the GSTI Software Index) fell back 15.0% over the same period. At the beginning of October 2008, the price of SAP stock decreased markedly after we published our preliminary third-quarter revenue numbers. In market conditions that had been highly unfavorable since the beginning of October because of the crisis on the financial markets, SAP stock closed at €27.61 (XETRA) on October 31, 2008. By that date, the SAP stock price had decreased 22.3% since the close of 2007 and the DAX had fallen 38.2% over the same period.
In the third quarter of 2008 we bought back 2.8 million shares at an average price of €37.75 (€104.2 million). Of the total shares purchased in the third quarter, 983,153 shares were subsequently acquired by SAP by employees who exercised stock options under SAP's share-based compensation programs. The number of shares bought back in the third quarter of 2008 represented 0.23% of all shares outstanding. On September 30, 2008, SAP held treasury stock in the amount of 38.7 million shares (approximately 3.15% of total shares outstanding) at an average price of €35.43. Inthe first nine months of 2008, we invested €486.8 million in buying back approximately 14.6 million shares at an average price of €33.34.
For the 2007 fiscal year, SAP shareholders received a dividend of €0.50 per share (2006: €0.46). This was a 9% increase over the previous year’s dividend. With a dividend payout ratio of 31% (previous year: 30%), a total of €594 million was paid out to shareholders (previous year: €556 million).
Additional information about the SAP common stock is available on Bloomberg under the symbol “SAP GR”, on Reuters under “SAPG.F”, on Quotron under “SAGR.EU” and on SAP’s Website: www.sap.com.
12 INTERIM REVIEW OF SAP GROUP OPERATIONS
EVENTS AFTER THE END OF THE QUARTER
Recent developments on the financial markets caused a sharp, unanticipated contraction in our business just before the end of the third quarter. In view of the uncertain economic environment, we commenced a cost-reduction program for the remainder of 2008.
RISK FACTORS
SAP has a comprehensive risk management system that enables us to recognize and analyze risks early and to take the appropriate action.
The factors that could affect our future financial results are discussed in the Review of SAP Group Operations for 2007 and our Annual Report on Form 20-F for 2007.
For information about changes in our legal liability risks since our last annual report, see the Notes to the Interim Financial Statements section, Notes 10 in the notes to the Interim Financial Statements.
In April 2008, we announced that we were modifying the rollout strategy for the SAP Business ByDesign solution to ensure a more focused and controlled ramp-up process. In the light of this modification, we continue to reexamine the risk situation pertaining to our solution for midsize companies, and in particular we have analyzed the effects of a longer rollout and altered ramp-up program on our market risks, business strategy risks, and product risks. We cannot exclude the possibility that SAP Business ByDesign will fail to satisfy our high quality standards and achieve our goals for new customer numbers and revenue as planned.
The difficult situation on the global financial markets in the fourth quarter of the year, together with the threat of sustained recession, may lead our customers to reduce or delay investments, affect the solvency of our customers and business partners, or significantly constrain the freedom of action of companies with which we maintain close business relations. At SAP, we are making far-reaching efforts to reduce the likelihood of these risks affecting us and to mitigate the effects if they do. The Executive Board is constantly monitoring these efforts and following developments on the global markets. We have made amendments to our guidance for the full year in the light of the altered economic climate. However, we cannot exclude the possibility that, by the end of the year, the altered economic climate will have affected our assets, finances, or income more than we anticipated when making those amendments.
SAP’s other risk factors for the year 2007 have not changed materially from the situation as it was reported in
Review of SAP Group Operations for 2007 and our Annual Report on Form 20-F for 2007.
BUSINESS OUTLOOK
GLOBAL ECONOMY In its October 2008 edition of World Economic Outlook, the IMF reports that the current financial turmoil, notably the lending policy that banks are pursuing, has dramatically increased the uncertainty surrounding global economic prospects. The IMF believes further global deceleration is almost inevitable. A turnaround is not expected to start until the second half of 2009 at the earliest, and it will be gradual when it does come.
Against this backdrop, the ECB expects more sluggish progress in the economies of the United States and western Europe for the foreseeable future. There has already been a fall in production, reflecting tighter lending by European banks and declining demand for exports. Falling volumes of international trade impeded the economy of Japan, which, when the financial turmoil began, had appeared distinctly healthier than other advanced economies.
Looking forward, emerging and developing economies that had been relatively untouched by the problems on the financial markets must also come to terms with less economic growth. The OECD’s current composite leading indicator points to a relatively robust expansion in economic activity in China and Brazil, while the outlook for Russia and India shows signs of moderation.
Notwithstanding the current adverse economic conditions, the ECB expects global output to grow again in 2008 and 2009. However, there is considerable uncertainty surrounding this outlook. The IMF therefore states three key assumptions behind its projections: First, it assumes stabilization of commodity and oil prices will reduce inflationary pressures. Secondly, it assumes the U.S. real estate market will reach a bottom in 2009. Thirdly, it assumes that, although credit will remain tight, the elements of a systemic solution to the financial crisis are now being put in place and will prevent a further worsening of financial intermediation. The IMF expects the global economy to turn toward sustainable recovery in the second half of 2009 if those assumptions prove right. Tension on the financial markets, prolongation of the credit drought and of the crisis on the U.S. real estate market, and falling real estate prices in previously unaffected European countries remain the major threats to economic growth.
13
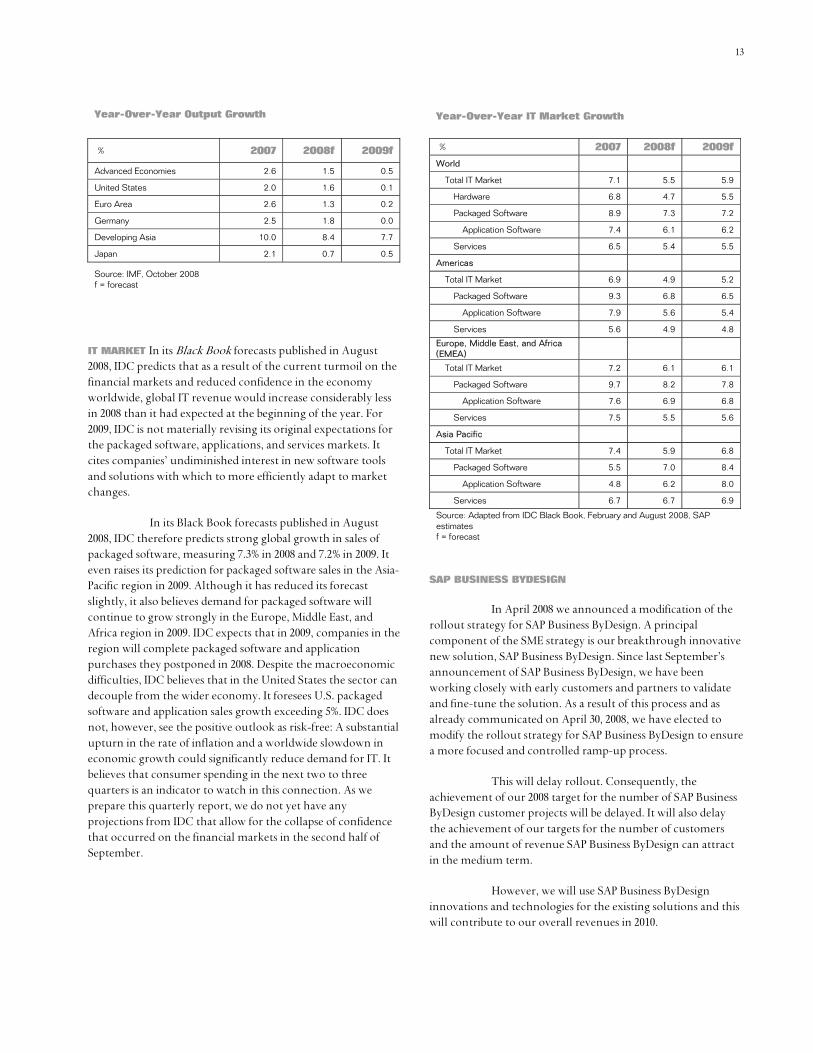
Year-Over-Year Output Growth % 2007 2008f 2009f
Advanced Economies 2.6 1.5 0.5
United States 2.0 1.6 0.1
Euro Area 2.6 1.3 0.2
Germany 2.5 1.8 0.0
Developing Asia 10.0 8.4 7.7
Japan 2.1 0.7 0.5
Source: IMF, October 2008 f = forecast
IT MARKET In its Black Book forecasts published in August 2008, IDC predicts that as a result of the current turmoil on the financial markets and reduced confidence in the economy worldwide, global IT revenue would increase considerably less in 2008 than it had expected at the beginning of the year. For 2009, IDC is not materially revising its original expectations for the packaged software, applications, and services markets. It cites companies’ undiminished interest in new software tools and solutions with which to more efficiently adapt to market changes.
In its Black Book forecasts published in August 2008, IDC therefore predicts strong global growth in sales of packaged software, measuring 7.3% in 2008 and 7.2% in 2009. It even raises its prediction for packaged software sales in the Asia-Pacific region in 2009. Although it has reduced its forecast slightly, it also believes demand for packaged software will continue to grow strongly in the Europe, Middle East, and Africa region in 2009. IDC expects that in 2009, companies in the region will complete packaged software and application purchases they postponed in 2008. Despite the macroeconomic difficulties, IDC believes that in the United States the sector can decouple from the wider economy. It foresees U.S. packaged software and application sales growth exceeding 5%. IDC does not, however, see the positive outlook as risk-free: A substantial upturn in the rate of inflation and a worldwide slowdown in economic growth could significantly reduce demand for IT. It believes that consumer spending in the next two to three quarters is an indicator to watch in this connection. As we prepare this quarterly report, we do not yet have any projections from IDC that allow for the collapse of confidence that occurred on the financial markets in the second half of September.
Year-Over-Year IT Market Growth % 2007 2008f 2009f
World
Total IT Market 7.1 5.5 5.9
Hardware 6.8 4.7 5.5
Packaged Software 8.9 7.3 7.2
Application Software 7.4 6.1 6.2
Services 6.5 5.4 5.5
Americas
Total IT Market 6.9 4.9 5.2
Packaged Software 9.3 6.8 6.5
Application Software 7.9 5.6 5.4
Services 5.6 4.9 4.8
Europe, Middle East, and Africa (EMEA)
Total IT Market 7.2 6.1 6.1
Packaged Software 9.7 8.2 7.8
Application Software 7.6 6.9 6.8
Services 7.5 5.5 5.6
Asia Pacific
Total IT Market 7.4 5.9 6.8
Packaged Software 5.5 7.0 8.4
Application Software 4.8 6.2 8.0
Services 6.7 6.7 6.9
Source: Adapted from IDC Black Book, February and August 2008, SAP estimates f = forecast
SAP BUSINESS BYDESIGN
In April 2008 we announced a modification of the rollout strategy for SAP Business ByDesign. A principal component of the SME strategy is our breakthrough innovative new solution, SAP Business ByDesign. Since last September’s announcement of SAP Business ByDesign, we have been working closely with early customers and partners to validate and fine-tune the solution. As a result of this process and as already communicated on April 30, 2008, we have elected to modify the rollout strategy for SAP Business ByDesign to ensure a more focused and controlled ramp-up process.
This will delay rollout. Consequently, the achievement of our 2008 target for the number of SAP Business ByDesign customer projects will be delayed. It will also delay the achievement of our targets for the number of customers and the amount of revenue SAP Business ByDesign can attract in the medium term.
However, we will use SAP Business ByDesign innovations and technologies for the existing solutions and this will contribute to our overall revenues in 2010.
14 INTERIM REVIEW OF SAP GROUP OPERATIONS
We maintain our full confidence in the product, the market opportunity and the associated business model of SAP Business ByDesign.
BUSINESS AT SAP
In our previous outlook provided on July 29, 2008, we had expected full-year 2008 non-GAAP software and software-related service revenues to increase at the upper end of the range of 24% to 27% at constant currencies and full-year 2008 non-GAAP operating margin to be at the upper end of the range of 28.5% to 29.0% at constant currencies.
In light of the uncertainties surrounding the current economic and business environment, we decided to no longer provide a specific outlook for non-GAAP software and software-related service revenues for the full-year 2008. However, with recent cost savings initiatives in place, SAP expects the full-year 2008 non-GAAP operating margin, which excludes a nonrecurring deferred support revenue write-down of €180 million from the acquisition of Business Objects and acquisition-related charges, to be around 28% at constant currencies if we can increase non-GAAP software and software-related service revenues, excluding a nonrecurring deferred support revenue write-down from the acquisition of Business Objects, in a range between 20% and 22% at constant currencies for the full year 2008. We believe that in the fourth quarter of 2008 we can save some €200 million budgeted costs. To this end we will stop all recruitment, considerably reduce spending on externally provided services, and make cuts in travel and other variable expenditure for the rest of 2008.
We continue to project an effective tax rate of 31.0% to 31.5% (based on U.S. GAAP income from continuing operations) for 2008.
In our previous outlook we expected to hire 3,500 employees in 2008 (excluding additions from acquisitions). To date we’ve hired 1,500 new employees (excluding new hires from acquisitions). Based on our revised outlook this amount shouldn’t significantly change through the end of the year.
We will continue in 2008 with our strategy of buying back shares in order to give back liquidity to our shareholders. We already bought back shares in 2008 totalling € 486.8 million.
The investments in fixed assets (excluding acquisitions) planned for 2008 mainly comprise the completion of office buildings at several locations which can be fully financed with the operating cash flow. Based on our cost saving programs we reduced the investments which were planned for the fourth quarter.
Our financial position shall be further strengthenend.
This outlook is based among others on the presented assumptions regarding the global financial crisis which resulted in the second half of September in a clear and until this time unexpected change of the buying behaviour of our customers. However, the outlook is also based on the assumption that the buying behaviour will follow our normal saisonality of revenues; we expect the fourth quarter contributing the highest revenues of the year 2008.

CONSOLIDATED INTERIM FINANCIAL STATEMENTS 15
CONSOLIDATED INTERIM FINANCIAL STATEMENTS (UNAUDITED)
CONSOLIDATED STATEMENTS OF INCOME FOR THE THIRD QUARTER ENDED SEPTEMBER 30 € millions, unless otherwise stated Notes 2008 2007 % Change
Software revenue 763 714 7
Support revenue 1,167 975 20
Subscription and other software-related service revenue 64 46 39
Software and software-related service revenue 1,994 1,735 15
Consulting revenue 617 544 13
Training revenue 105 102 3
Other service revenue 26 28 -7
Professional services and other service revenue 748 674 11
Other revenue 19 10 90
Total revenue 2,761 2,419 14
Cost of software and software-related services -381 -327 17
Cost of professional services and other services -583 -502 16
Research and development -398 -357 11
Sales and marketing -634 -510 24
General and administration -156 -121 29
Other income/expense, net 5 4 25
Total operating expenses -2,147 -1,813 18
Operating income 614 606 1
Other non-operating income/expense, net 7 -1 -800
Financial income, net -19 33 -158
Income from continuing operations before income taxes 602 638 -6
Income taxes (5) -192 -223 -14
Minority interests -1 -1 0
Income from continuing operations 409 414 -1
Loss from discontinued operations, net of tax -21 -6 250
Net income 388 408 -5
EPS from continuing operations – basic in € (6) 0.35 0.35 0
EPS from continuing operations – diluted in € (6) 0.34 0.34 0
EPS from net income – basic in € (6) 0.33 0.34 -3
EPS from net income – diluted in € (6) 0.33 0.33 0

16 CONSOLIDATED INTERIM FINANCIAL STATEMENTS
CONSOLIDATED STATEMENTS OF INCOME FOR THE NINE MONTHS ENDED SEPTEMBER 30 € millions, unless otherwise stated Notes 2008 2007 % Change
Software revenue 2,283 1,992 15
Support revenue 3,324 2,833 17
Subscription and other software related service revenue 184 129 43
Software and software related service revenue 5,791 4,954 17
Consulting revenue 1,832 1,618 13
Training revenue 323 300 8
Other service revenue 77 84 -8
Professional services and other service revenue 2,232 2,002 11
Other revenue 56 46 22
Total revenue 8,079 7,002 15
Cost of software and software related services -1,166 -919 27
Cost of professional services and other services -1,731 -1,531 13
Research and development -1,236 -1,049 18
Sales and marketing -1,912 -1,523 26
General and administration -477 -367 30
Other income/expense, net 9 10 -10
Total operating expenses -6,513 -5,379 21
Operating income 1,566 1,623 -4
Other non-operating income/expense, net 25 -8 -413
Financial income, net -34 103 -133
Income from continuing operations before income taxes 1,557 1,718 -9
Income taxes (5) -489 -536 -9
Minority interests -1 -3 -67
Income from continuing operations 1,067 1,179 -9
Loss from discontinued operations, net of tax -29 -12 142
Net income 1,038 1,167 -11
EPS from continuing operations - basic in € (6) 0.90 0.98 -8
EPS from continuing operations - diluted in € (6) 0.89 0.97 -8
EPS from net income – basic in € (6) 0.87 0.97 -10
EPS from net income – diluted in € (6) 0.87 0.96 -9

17
CONSOLIDATED BALANCE SHEETS SAP GROUP AS OF SEPTEMBER 30, 2008 AND DECEMBER 31, 2007 € millions Notes 9/30/08 12/31/07 % Change
Assets
Cash and cash equivalents 1,486 1,608 -8
Restricted cash 3 550 -99
Short-term investments 111 598 -81
Accounts receivable, net 2,644 2,895 -9
Other assets 441 541 -18
Deferred income taxes 193 125 54
Prepaid expenses/deferred charges 119 76 57
Assets classified as held for disposal 6 15 -60
Current assets 5,003 6,408 -22
Goodwill 5,077 1,423 257
Intangible assets, net 1,202 403 198
Property, plant, and equipment, net 1,388 1,316 5
Investments 105 89 18
Accounts receivable, net 3 3 0
Other assets 637 555 15 Deferred income taxes 171 146 17 Prepaid expenses/deferred charges 25 23 9
Noncurrent assets 8,608 3,958 117
Total assets 13,611 10,366 31
Liabilities, Minority interests and Shareholders' equity
Accounts payable 572 715 -20
Income tax obligations 486 341 43
Other liabilities 1,382 1,456 -5
Provisions (7) 264 154 71
Deferred income taxes 33 47 -30
Deferred income 1,041 477 118
Liabilities associated with assets classified as held for disposal 15 9 67
Current liabilities 3,793 3,199 19
Accounts payable 6 10 -40
Income tax obligations 97 90 8
Other liabilities 2,453 79 3,005
Provisions (7) 496 369 34
Deferred income taxes 173 73 137
Deferred income 36 42 -14
Noncurrent liabilities 3,261 663 392
Total liabilities 7,054 3,862 83
Minority interests 2 1 100
Common stock, no par value 1,226 1,246 -2
Treasury stock -1,370 -1,734 -21
Additional paid-in capital 351 347 1
Retained earnings 6,882 7,159 -4
Accumulated other comprehensive loss -534 -515 4
Shareholders' equity (8) 6,555 6,503 1
Total liabilities, Minority interests and Shareholders' equity 13,611 10,366 31
18 CONSOLIDATED INTERIM FINANCIAL STATEMENTS
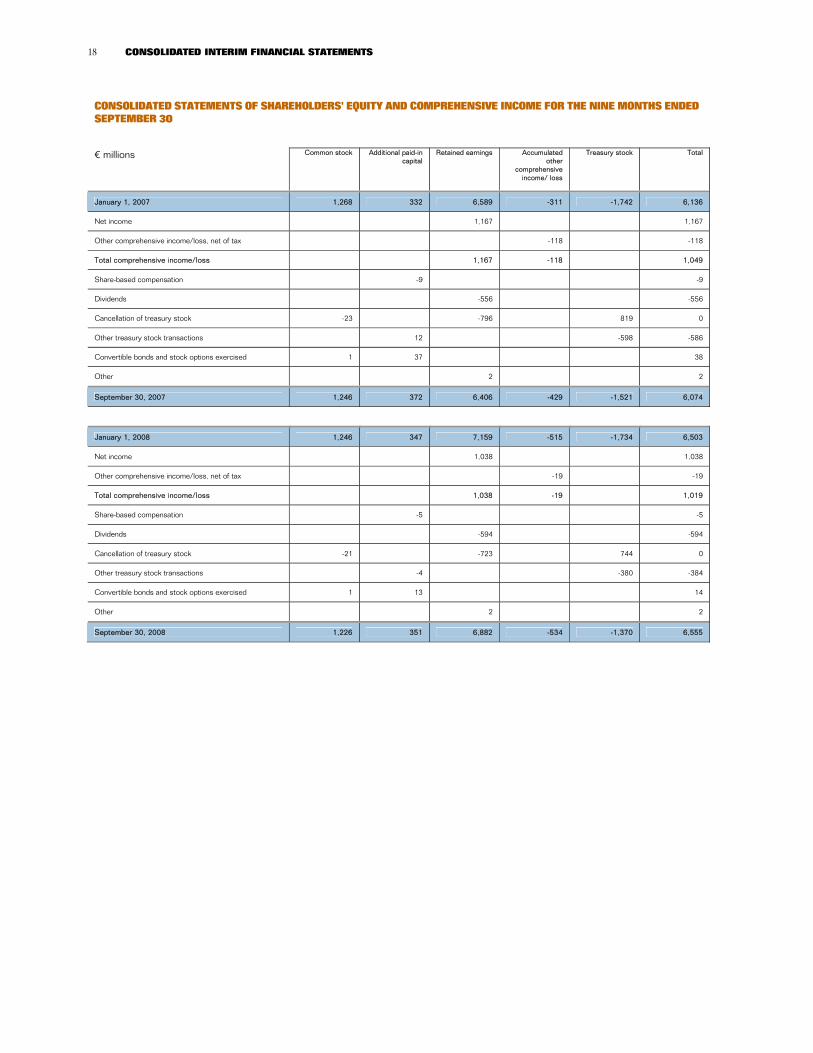
CONSOLIDATED STATEMENTS OF SHAREHOLDERS’ EQUITY AND COMPREHENSIVE INCOME FOR THE NINE MONTHS ENDED SEPTEMBER 30
€ millions Common stock Additional paid-in
capital Retained earnings Accumulated
other comprehensive
income/ loss
Treasury stock Total
January 1, 2007 1,268 332 6,589 -311 -1,742 6,136
Net income 1,167 1,167
Other comprehensive income/loss, net of tax -118 -118
Total comprehensive income/loss 1,167 -118 1,049
Share-based compensation -9 -9
Dividends -556 -556
Cancellation of treasury stock -23 -796 819 0
Other treasury stock transactions 12 -598 -586
Convertible bonds and stock options exercised 1 37 38
Other 2 2
September 30, 2007 1,246 372 6,406 -429 -1,521 6,074
January 1, 2008 1,246 347 7,159 -515 -1,734 6,503
Net income 1,038 1,038
Other comprehensive income/loss, net of tax -19 -19
Total comprehensive income/loss 1,038 -19 1,019
Share-based compensation -5 -5
Dividends -594 -594
Cancellation of treasury stock -21 -723 744 0
Other treasury stock transactions -4 -380 -384
Convertible bonds and stock options exercised 1 13 14
Other 2 2
September 30, 2008 1,226 351 6,882 -534 -1,370 6,555

19
CONSOLIDATED STATEMENTS OF CASH FLOWS FOR THE NINE MONTHS ENDED SEPTEMBER 30 € millions 2008 2007
Net income 1,038 1,168
Net income from discontinued operations 29 12
Minority interests 1 2
Income from continuing operations before minority interests 1,068 1,182
Adjustments to reconcile profit after taxes to net cash provided by operating activities:
Depreciation and amortization 412 187
Losses from at-equity investments 1 1
Gains/losses on disposal of intangible assets and property, plant, and equipment 2 0
Gains on disposal of investments -9 -2
Write-ups/downs of financial assets 4 2
Allowances for doubtful accounts 34 -5
Impacts of hedging for cash-settled share-based payment plans -10 13
Stock-based compensation including income tax benefits 22 31
Excess tax benefit from share-based compensation -14 -8
Deferred income taxes -72 2
Change in accounts receivable 528 251
Change in other assets 77 -234
Change in accrued and other liabilities -558 -448
Change in deferred income 485 372
Net cash provided by operating activities from continuing operations 1,970 1,344
Acquisition of minority interests in subsidiaries 0 -48
Business combinations, net of cash and cash equivalents acquired -3,767 -657
Repayment of acquirees' debt in business combinations -450 0
Purchase of intangible assets and property, plant, and equipment -244 -294
Proceeds from disposal of intangible assets and property, plant, and equipment 27 22
Cash transferred to restricted cash -451 0
Reduction of restricted cash 1,000 0
Purchase of investments -40 -720
Sales of investments 521 646
Purchase of other financial assets -11 -15
Sales of other financial assets 12 11
Net cash used in investing activities from continuing operations -3,403 -1,055
Dividends paid -594 -556
Purchase of treasury stock -487 -756
Proceeds from reissuance of treasury stock 79 131
Proceeds from issuance of common stock (share-based compensation) 13 39
Excess tax benefit from share-based compensation 14 8
Proceeds from short-term and long-term debt 3,859 32
Repayments of short-term and long-term debt -1,521 -32
Proceeds from the exercise of equity-based derivative instruments (STAR hedge) 33 74
Purchase of equity-based derivative instruments (hedge for cash-settled share-based payment plans) -55 0
Net cash provided by / used in financing activities 1,341 -1,060
Effect of foreign exchange rates on cash and cash equivalents -9 -7
Net cash used in operating activities from discontinued operations -21 -12
Net cash used in investing activities from discontinued operations 0 0
Net cash used in financing activities from discontinued operations 0 0
Net cash used in discontinued operations -21 -12
Net change in cash and cash equivalents -122 -790
Cash and cash equivalents at the beginning of the period 1,608 2,399
Cash and cash equivalents at the end of the period 1,486 1,609

20 CONSOLIDATED INTERIM FINANCIAL STATEMENTS
NOTES TO THE INTERIM FINANCIAL STATEMENTS A. BASIS OF PRESENTATION
(1) General
The condensed consolidated interim financial statements of SAP AG, together with its subsidiaries (collectively, “we”, “SAP”, the “Group”, or the “Company”), have been prepared in accordance with accounting principles generally accepted in the United States of America (“U.S. GAAP”). The quarterly financial statements include condensed balance sheets.
Certain information and footnote disclosures normally included in annual financial statements prepared in accordance with U.S. GAAP have been condensed or omitted. We believe that the disclosures made are adequate and that the information is not misleading.
Our business activities are influenced by certain seasonal effects. Historically, our overall revenue tends to be the highest in the fourth quarter. Therefore interim results are not necessarily indicative of results for a full year.
Amounts reported in previous years have been reclassified as appropriate to conform to the 2008 presentation.
These unaudited condensed consolidated interim financial statements should be read in conjunction with SAP’s audited consolidated U.S. GAAP financial statements and notes thereto as of December 31, 2007, which are included in SAP’s Annual Report 2007 as well as in SAP’s Annual Report 2007on Form 20-F. We also prepared for the year ending as of December 31, 2007 consolidated financial statements in accordance with the International Financial Reporting Standards (IFRS). These audited consolidated IFRS financial statements and notes are included in the IFRS Financial Reports 2007 SAP Group.
(2) Scope of Consolidation The following table summarizes the change in the
number of legal entities included in the consolidated financial statements:
Number of Legal Entities Consolidated in the Financial Statements
German Foreign Total
December 31, 2007 23 116 139
Additions 4 64 68
Disposals -3 -7 -10
June 30, 2008 24 173 197
Additions 0 6 6
Disposals -3 -11 -14
September 30, 2008 21 168 189
As of September 30, 2008, four companies, in which SAP has the ability to exercise significant influence over the operating and financial policies, are accounted for using the equity method.
The impact of changes in the scope of companies included in the consolidated financial statements has a significant impact on the comparability of the consolidated financial statements presented due to the acquisition of Business Objects in January 2008 (please refer to note 4 for further information).
(3) Summary of Significant Accounting Policies
The interim financial statements were prepared based on the same accounting policies as those applied in the U.S. GAAP consolidated financial statements as of December 31, 2007, with the exceptions described below. Our significant accounting policies are summarized in the notes to the annual financial statements. For further information, refer to SAP’s Annual Report 2007 and SAP’s Annual Report 2007 on Form 20-F filed with the SEC. New Accounting Standards Not Yet Adopted In September 2006, the FASB issued SFAS 157, Fair Value Measurements (“SFAS 157”), which provides a single definition of fair value, establishes a framework for measuring fair value, and requires expanded disclosures about fair value measurements. SFAS 157 is effective for financial statements issued for fiscal years beginning after November 15, 2007, and interim periods within those fiscal years. The provisions of SFAS 157 should be applied prospectively as of the beginning of the fiscal year in which it is initially applied. We are required to adopt SFAS 157 in fiscal year 2008. FASB Staff Position No. FAS 157-2, Effective Date of FASB Statement No. 157 (FSP FAS 157-2) defers the effective date of SFAS 157 for some nonfinancial assets and nonfinancial liabilities to fiscal years beginning after November 15, 2008 and periods within those fiscal years. We have adopted Statement 157 except for those items specifically deferred by FSP SFAS 157-2. Based on the analysis done so far, we do not expect the full adoption of SFAS 157 to have a material impact on our Consolidated Financial Statements.
In December 2007, the FASB issued SFAS 141 (revised 2007), Business Combinations (“SFAS 141R”), which requires acquirers of a business to recognize most identifiable assets acquired, including goodwill, the liabilities assumed, and any non-controlling interest in the acquiree, at their full fair value on the acquisition date. SFAS 141R is effective for fiscal years beginning after December 15, 2008 and is to be applied prospectively. Historically, we have rarely entered into business
21
combinations in which we did not fully acquire the target or in which we acquired a target of which we had previously owned a significant stake. Should this history continue, the main impact from applying SFAS 141R should be additional expenses resulting from the new guidance in SFAS 141R under which acquisition-related expenses and restructuring expenses can no longer be recorded as part of the purchase price in a business combination. The amount of these additional expenses mainly depends on the number and size of our future business combinations as well as the extent of use of third party resources in the acquisition process.
In December 2007, the FASB issued SFAS 160, Noncontrolling Interests in Consolidated Financial Statements, an amendment of ARB No. 51 (“SFAS 160”), which establishes accounting and reporting standards for the non-controlling (minority) interest in a subsidiary and for the deconsolidation of a subsidiary. It clarifies that a non-controlling interest in a subsidiary is an ownership interest in the consolidated entity that should be reported as equity in the Consolidated Financial Statements and establishes a single method of accounting for changes in a parent’s ownership interest in a subsidiary that do not result in deconsolidation. SFAS 160 is effective for fiscal years beginning after December 15, 2008 and is to be applied prospectively. Non-controlling interests in our consolidated financial statements are not material. Therefore we do not expect SFAS 161 to materially impact our consolidated financial statements.
In December 2007, the FASB ratified EITF 07-1, Accounting for Collaborative Arrangements (“EITF 07-1”), which defines collaborative arrangements and establishes reporting requirements for transactions between participants in the arrangement and third parties. EITF 07-1 also establishes the appropriate income statement presentation and classification for joint operating activities and payments between participants, as well as the sufficiency of the disclosure related to these arrangements. EITF 07-1 is effective for fiscal years beginning after December 15, 2008. We do not expect the adoption of EITF 07-1 to have a significant impact on our Consolidated Financial Statements.
In March 2008, the FASB issued SFAS 161, Disclosures about Derivative Instruments and Hedging Activities, an amendment of FAS 133 (“SFAS 161”), which establishes the disclosure requirements for derivative instruments and for hedging activities. This Statement amends and expands the disclosure requirements of SFAS 133 with the intent to provide users of financial statements with an enhanced understanding of: (1) how and why an entity uses derivative instruments, (2) how derivative instruments and related hedged items are accounted for under Statement 133 and its related interpretations and (3) how derivative instruments and related hedged items affect an entity’s financial position, financial performance, and cash flows. SFAS 160 is
effective for fiscal years beginning after November 15, 2008 and is to be applied prospectively. Except for certain additional disclosures we do not expect SFAS 161 to have a significant impact on our Consolidated Financial Statements.
In April 2008, the FASB issued FSP FAS 142-3, Determination of the Useful Life of Intangible Assets (“FSP 142-3”), which amends the factors that should be considered in developing renewal or extension assumptions used to determine the useful life of a recognized intangible asset under SFAS 142, Goodwill and Other Intangible Assets. This new guidance applies prospectively to intangible assets that are acquired individually or with a group of other assets in business combinations and asset acquisitions. FSP 142-3 is effective for fiscal years beginning after December 15, 2008. We don’t expect the adoption of FSP 142-3 to have a significant impact on our Consolidated Financial Statements.
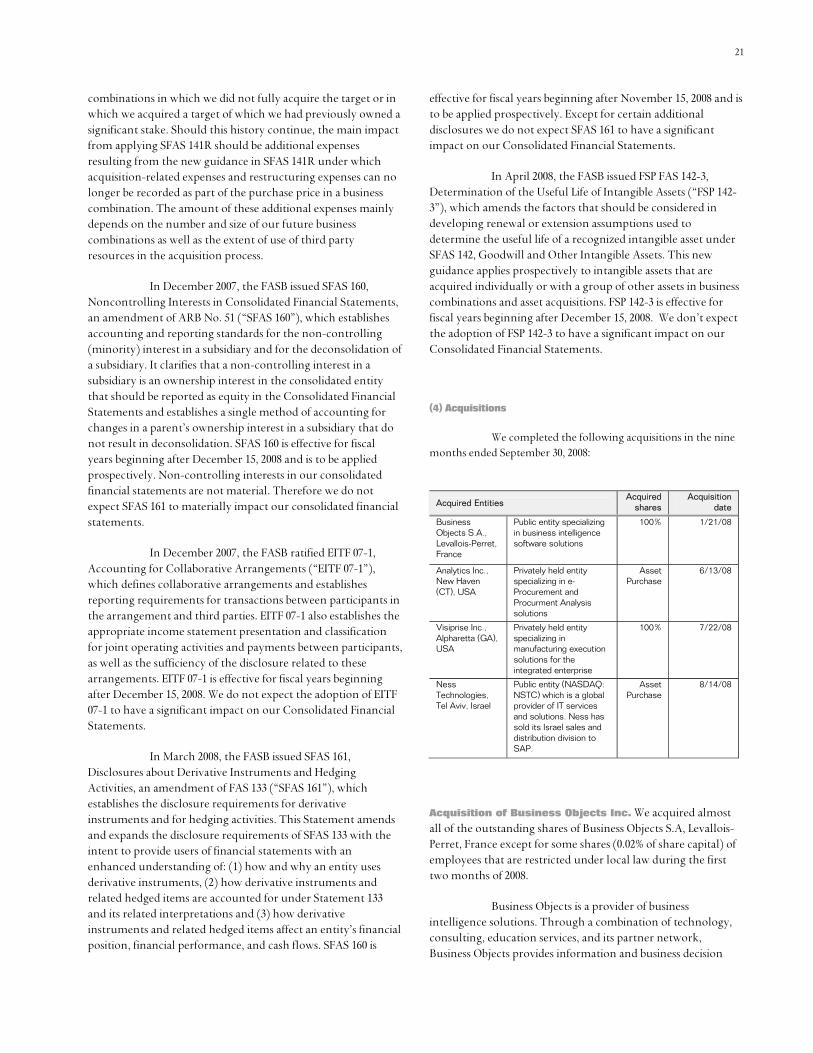
(4) Acquisitions
We completed the following acquisitions in the nine months ended September 30, 2008:
Acquired Entities Acquired
shares Acquisition
date
Business Objects S.A., Levallois-Perret, France
Public entity specializing in business intelligence software solutions
100% 1/21/08
Analytics Inc., New Haven (CT), USA
Privately held entity specializing in e-Procurement and Procurment Analysis solutions
Asset Purchase
6/13/08
Visiprise Inc., Alpharetta (GA), USA
Privately held entity specializing in manufacturing execution solutions for the integrated enterprise
100% 7/22/08
Ness Technologies, Tel Aviv, Israel
Public entity (NASDAQ: NSTC) which is a global provider of IT services and solutions. Ness has sold its Israel sales and distribution division to SAP.
Asset Purchase
8/14/08
Acquisition of Business Objects Inc. We acquired almost all of the outstanding shares of Business Objects S.A, Levallois-Perret, France except for some shares (0.02% of share capital) of employees that are restricted under local law during the first two months of 2008.
Business Objects is a provider of business intelligence solutions. Through a combination of technology, consulting, education services, and its partner network, Business Objects provides information and business decision
22 CONSOLIDATED INTERIM FINANCIAL STATEMENTS
making resources to small and large companies. Business Objects has dual headquarters in San Jose, California and Paris, France. Before the acquisition its stock was traded on both the NASDAQ and Euronext Paris stock exchanges. Our acquisition took the form of a tender offer under French and U.S. law for all Business Objects’ common stock, all American depositary shares representing Business Objects common stock, and all convertible bonds and warrants issued by Business Objects.
Under the terms and conditions of the tender offer agreement, we made a cash offer of €42.00 per common share and the U.S. dollar equivalent of €42.00 per American depositary receipts share determined using the euro to U.S. dollar exchange rate on settlement of the tender offers and of €50.65 per convertible bond, and a range of €12.01 to €24.96 per warrant, depending on the warrant grant date. After reaching the initial minimum tender condition of more than 50% as at January 21, 2008 the tender offer period was reopened under the same conditions until January 29 resulting in an ownership level of more than 95%. This allowed SAP to commence an immediate “squeeze-out” acquisition of the outstanding shares of the remaining shareholders. The acquisition cost in the amount of € 4.2 billion net of cash has been financed partially by a syndicated bank loan.
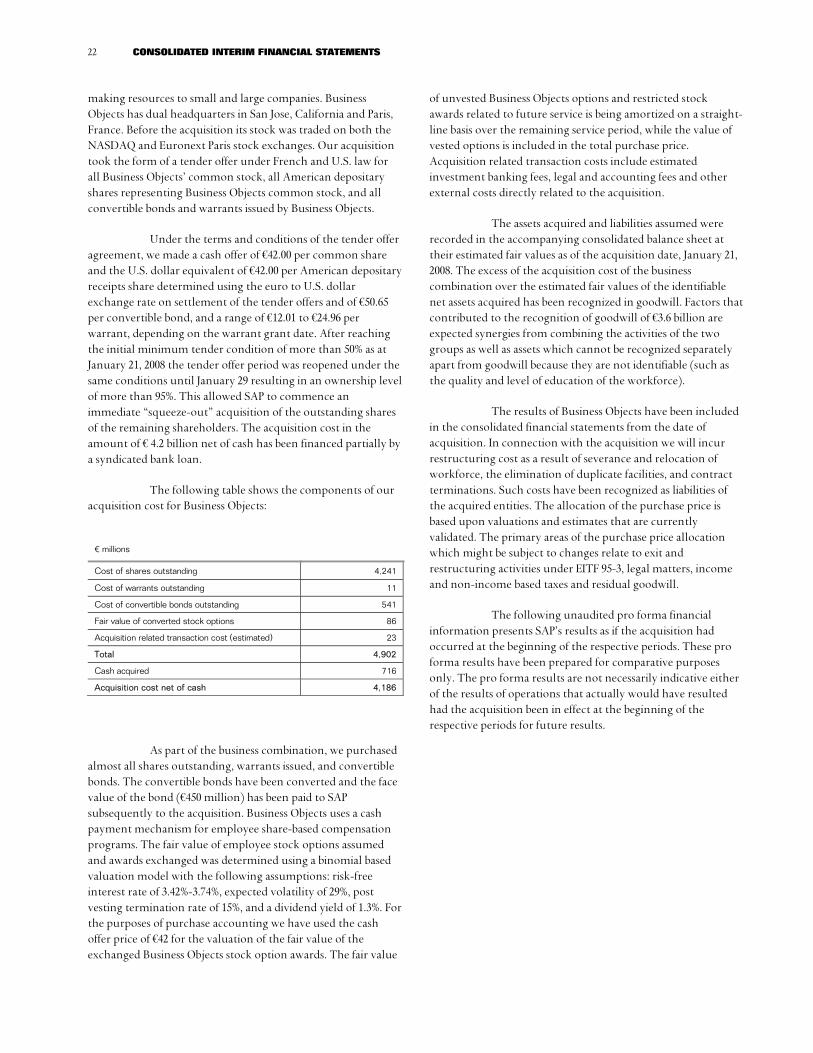
The following table shows the components of our acquisition cost for Business Objects:
€ millions Cost of shares outstanding 4,241
Cost of warrants outstanding 11
Cost of convertible bonds outstanding 541
Fair value of converted stock options 86
Acquisition related transaction cost (estimated) 23
Total 4,902
Cash acquired 716
Acquisition cost net of cash 4,186
As part of the business combination, we purchased almost all shares outstanding, warrants issued, and convertible bonds. The convertible bonds have been converted and the face value of the bond (€450 million) has been paid to SAP subsequently to the acquisition. Business Objects uses a cash payment mechanism for employee share-based compensation programs. The fair value of employee stock options assumed and awards exchanged was determined using a binomial based valuation model with the following assumptions: risk-free interest rate of 3.42%-3.74%, expected volatility of 29%, post vesting termination rate of 15%, and a dividend yield of 1.3%. For the purposes of purchase accounting we have used the cash offer price of €42 for the valuation of the fair value of the exchanged Business Objects stock option awards. The fair value
of unvested Business Objects options and restricted stock awards related to future service is being amortized on a straight-line basis over the remaining service period, while the value of vested options is included in the total purchase price. Acquisition related transaction costs include estimated investment banking fees, legal and accounting fees and other external costs directly related to the acquisition.
The assets acquired and liabilities assumed were recorded in the accompanying consolidated balance sheet at their estimated fair values as of the acquisition date, January 21, 2008. The excess of the acquisition cost of the business combination over the estimated fair values of the identifiable net assets acquired has been recognized in goodwill. Factors that contributed to the recognition of goodwill of €3.6 billion are expected synergies from combining the activities of the two groups as well as assets which cannot be recognized separately apart from goodwill because they are not identifiable (such as the quality and level of education of the workforce).
The results of Business Objects have been included in the consolidated financial statements from the date of acquisition. In connection with the acquisition we will incur restructuring cost as a result of severance and relocation of workforce, the elimination of duplicate facilities, and contract terminations. Such costs have been recognized as liabilities of the acquired entities. The allocation of the purchase price is based upon valuations and estimates that are currently validated. The primary areas of the purchase price allocation which might be subject to changes relate to exit and restructuring activities under EITF 95-3, legal matters, income and non-income based taxes and residual goodwill.
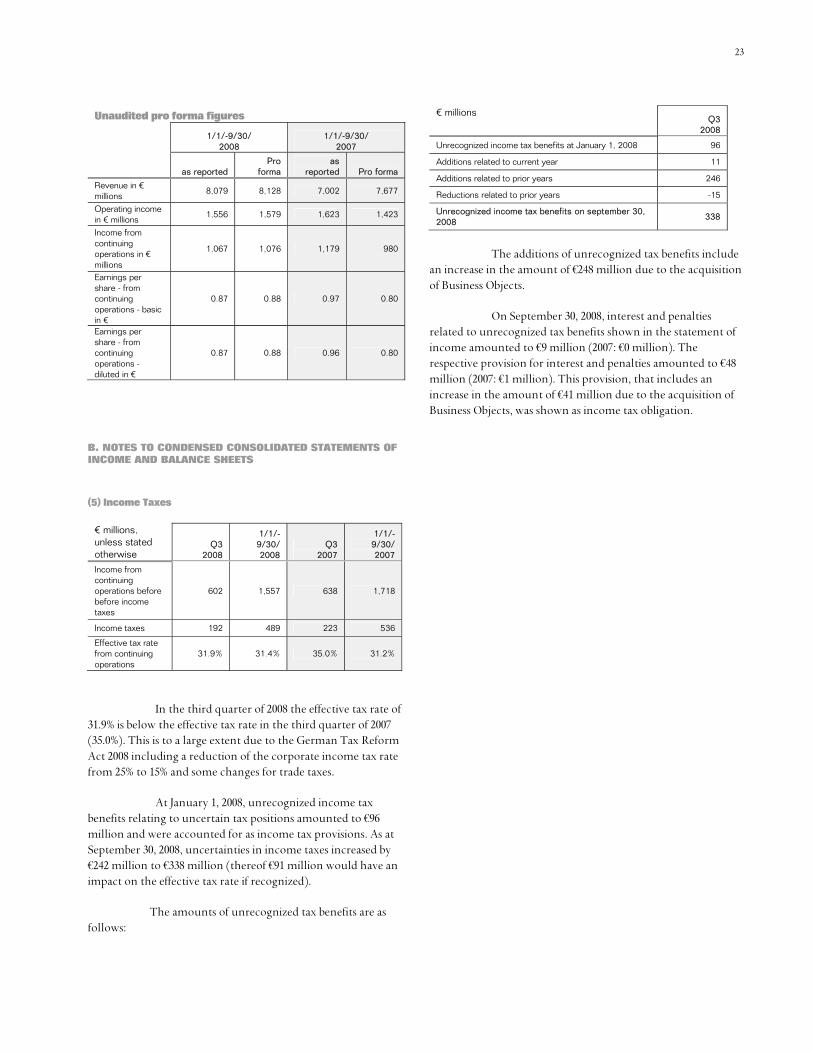
The following unaudited pro forma financial information presents SAP’s results as if the acquisition had occurred at the beginning of the respective periods. These pro forma results have been prepared for comparative purposes only. The pro forma results are not necessarily indicative either of the results of operations that actually would have resulted had the acquisition been in effect at the beginning of the respective periods for future results.
23
Unaudited pro forma figures
1/1/-9/30/
2008 1/1/-9/30/
2007
as reported Pro
forma as
reported Pro forma
Revenue in € millions 8,079 8,128 7,002 7,677
Operating income in € millions 1,556 1,579 1,623 1,423
Income from continuing operations in € millions
1,067 1,076 1,179 980
Earnings per share - from continuing operations - basic in €
0.87 0.88 0.97 0.80
Earnings per share - from continuing operations - diluted in €
0.87 0.88 0.96 0.80
B. NOTES TO CONDENSED CONSOLIDATED STATEMENTS OF INCOME AND BALANCE SHEETS
(5) Income Taxes
€ millions, unless stated otherwise
Q3 2008
1/1/-9/30/ 2008
Q32007
1/1/-9/30/2007
Income from continuing operations before before income taxes
602 1,557 638 1,718
Income taxes 192 489 223 536
Effective tax rate from continuing operations
31.9% 31.4% 35.0% 31.2%
In the third quarter of 2008 the effective tax rate of 31.9% is below the effective tax rate in the third quarter of 2007 (35.0%). This is to a large extent due to the German Tax Reform Act 2008 including a reduction of the corporate income tax rate from 25% to 15% and some changes for trade taxes.
At January 1, 2008, unrecognized income tax benefits relating to uncertain tax positions amounted to €96 million and were accounted for as income tax provisions. As at September 30, 2008, uncertainties in income taxes increased by €242 million to €338 million (thereof €91 million would have an impact on the effective tax rate if recognized).
The amounts of unrecognized tax benefits are as follows:
€ millions
Q3 2008
Unrecognized income tax benefits at January 1, 2008 96
Additions related to current year 11
Additions related to prior years 246
Reductions related to prior years -15
Unrecognized income tax benefits on september 30, 2008
338
The additions of unrecognized tax benefits include an increase in the amount of €248 million due to the acquisition of Business Objects.
On September 30, 2008, interest and penalties related to unrecognized tax benefits shown in the statement of income amounted to €9 million (2007: €0 million). The respective provision for interest and penalties amounted to €48 million (2007: €1 million). This provision, that includes an increase in the amount of €41 million due to the acquisition of Business Objects, was shown as income tax obligation.

24 CONSOLIDATED INTERIM FINANCIAL STATEMENTS
(6) Earnings per Share
Q3 2008
1/1/-9/30/ 2008
Q3 2007
1/1/-9/30/2007
Income from continuing operations in € millions
409 1,067 414 1,179
Weighted average number of shares in millions - basic
1,188 1,192 1,206 1,209
Dilutive effect of stock options/ convertible bonds in millions
2 1 4 3
Weighted average number of shares in millions - diluted
1,190 1,193 1,210 1,212
Earnings per share - from continuing operations - basic in €
0.35 0.90 0.34 0.98
Earnings per share - from continuing operations - diluted in €
0.34 0.89 0.34 0.97
Income from discontinued operations, net of tax in € millions
-21 -29 -6 -12
Earnings per share - from discontinued operations - basic in €
-0.02 -0.03 -0.00 -0.01
Earnings per share - from discontinued operations - diluted in €
-0.01 -0.02 -0.00 -0.01
Net income in million € 388 1,038 408 1,167
Earnings per share - from net income - basic in €
0.33 0.87 0.34 0.97
Earnings per share - from net income - diluted in €
0.33 0.87 0.34 0.96
The computation of diluted earnings per share does not include certain convertible bonds and stock options issued in connection with the LTI 2000 Plan and SAP SOP 2002 because their underlying exercise prices were higher than the average market prices of SAP shares in the periods presented. Such convertible bonds and stock options, if converted or exercised, represent 36.0 million SAP common shares in the first nine months of 2008 (Q3 2008: 36.0 million) and 37.6 million SAP common shares in the first nine months of 2007 (Q3 2007: 22.9 million).

25 CONSOLIDATED INTERIM FINANCIAL STATEMENTS
(7) Pension plans
The components of net periodic pension cost for our defined benefit plans including other post-employment benefit plans for the third quarter as well as for the first nine months of 2008 and 2007 were as follows:
€ millions Q3
2008 Q3
2007
German Foreign Total German Foreign Total
Service cost 0 10 10 0 9 9
Interest cost 0 4 4 1 3 4
Expected return on plan assets 0 -5 -5 0 -5 -5
Net periodic benefit cost 0 9 9 1 7 8
€ millions 1/1/-9/30/ 2008
1/1/-9/30/ 2007
German Foreign Total German Foreign Total
Service cost 0 30 30 0 28 28
Interest cost 2 11 13 2 9 11
Expected return on plan assets -1 -16 -17 -1 -16 -17
Amortization of net (gain) loss 0 0 0 1 0 1
Net periodic benefit cost 1 25 26 2 21 23
(8) Shareholders’ Equity Common Stock At September 30, 2008, SAP AG had 1,225,755,164 no-par common shares (December 31, 2007: 1,267,258,408) issued with a calculated nominal value of €1 per share.
In the first nine months of 2008, the number of common shares increased by 496,756, thereof in Q3 2008 163,024 shares (first nine months 2007: 1,502,864; Q3 2007: 1,009,512), which resulted from the exercise of awards granted under certain share-based compensation programs. Based on the resolutions of the SAP AG Annual General Meetings of Shareholders on May 9, 2006 and May 10, 2007, on September 3, 2008 the Executive Board of SAP AG took a resolution to decrease the Company’s capital stock from €1,246,683,912 to €1,225,683,912 (represented by 1,225,683,912 no-par shares, each with an attributable subscribed capital of €1) by cancelling 21,000,000 treasury shares, which approximated 1.7% of the capital stock before this corporate action. In 2007, 23,000,000 treasury shares were cancelled.
Treasury Stock On September 30, 2008, we had acquired 38.7 million of our own shares, representing €38.7 million or 3.2% of
capital stock. In the first nine months of 2008, 14.6 million (Q3: 2.8 million) shares were acquired under the buyback program at an average price of approximately €33.34 (Q3: €37.75) per share and 3.0 million (Q3: 1.0 million) shares were distributed at an average price of approximately €26.57 (Q3: €34.89) per share. The acquired shares represent €14.6 million (Q3: 2.8 million) or 1.19% (Q3: 0.23%) of capital stock. The distributed shares represent €3.0 million (Q3: € 1.0 million) or 0.25% (Q3: 0.08%) of capital stock. Although treasury stock is legally considered to be outstanding, there are no dividend or voting rights associated with our treasury stock. In the first nine months of the year no ADRs were purchased. The Company held no ADRs on September 30, 2008.
(9) Share-Based Compensation Plans
For a detailed description of our share-based compensation plans, please see Note (27) of our consolidated financial statements which are included in our Annual Report 2007 and our Annual Report 2007 on Form 20-F filed with the SEC.

26 CONSOLIDATED INTERIM FINANCIAL STATEMENTS
The number of equity-settled options and convertible bonds outstanding related to our equity-classified awards is as follows:
number in thousands Number of equity-settled
options and convertible bonds outstanding
9/30/2008 12/31/2007
Stock Option Plan 2002 5,012 5,813
Long Term Incentive 2000 Plan (convertible bonds) 5,889 6,149
Long Term Incentive 2000 Plan (stock options) 763 879
Each stock option and each convertible bond entitles the holder to subscribe to four shares of SAP AG.
The allocations of expenses for share-based compensation to the various expense items are as follows:
€ millions 1/1/-9/30/
2008 1/1/-9/30/
2007 % change
Cost of software and software-related services
7 8 -13
Cost of professional services and other services 23 19 21
Research and development 20 26 -23
Sales and marketing 31 18 72
General and administration 19 16 19
Other operating income/expense, net
0 0 0
Total Share-based Compensation
1001 87 15 1) Included in the amount of share-based payments of €100 million are €32 million from our subsidiary Business Objects.
(C) ADDITIONAL INFORMATION
(10) Litigation and Claims Intellectual Property Litigation In September 2006, U.S.-based i2 Technologies US, Inc. and i2 Technologies, Inc. (i2) instituted legal proceedings in the United States against SAP. i2 alleged that SAP's products and services infringe one or more of the claims in each of seven patents held by i2. In its complaint, i2 sought unspecified monetary damages and permanent injunctive relief. In August 2007, SAP instituted legal proceedings in the United States against i2. In April 2008, SAP amended the complaint to add a third patent. SAP alleged, per the amended complaint, that i2's products infringe one or more of the claims in each of three patents held by SAP. In its complaint, SAP sought unspecified monetary damages and permanent injunctive relief. In June 2008 SAP and i2 resolved this dispute. Among others the terms of the settlement agreement provide for a one-time cash payment from SAP to i2 of US$83.3 million and a license for SAP to all i2 patents.
In October 2006, U.S.-based Sky Technologies LLC (Sky) instituted legal proceedings in the United States against SAP and Oracle. Sky alleges that SAP's products and services infringe one or more of the claims in each of five patents held by Sky. In its complaint, Sky seeks unspecified monetary damages and permanent injunctive relief. The Markman hearing was held in June 2007. The legal proceedings have been stayed pending a decision from the Court of Appeals for the Federal Circuit with respect to an interlocutory appeal.
In January 2007, German-based CSB-Systems AG (CSB) instituted legal proceedings in Germany against SAP. CSB alleges that SAP's products and services infringe one or more of the claims of a German patent and a German utility model held by CSB. In its complaint, CSB has set the amount in dispute at €1 million and is seeking permanent injunctive relief. Within these proceedings CSB is not precluded from requesting damages in excess of the amount in dispute. In July 2007, SAP filed its response in the legal proceedings including a nullity action and cancellation proceeding against the patent and utility model, respectively. The infringement hearing has been re-scheduled for May 2009. The nullity hearing has been scheduled for January 2009.
In March 2007, U.S.-based Oracle Corporation and certain of its subsidiaries (‘‘Oracle’’) instituted legal proceedings in the United States against TomorrowNow, Inc. and its parent company, SAP America, Inc. and SAP America’s parent company SAP AG (“SAP”). Oracle filed an amended complaint in June 2007, a second amended complaint in July 2008 and a third amended complaint in October 2008. As amended, the lawsuit alleges copyright infringement, violations of the Federal Computer Fraud and Abuse Act and the California Computer Data Access and Fraud Act, unfair competition, intentional and negligent interference with prospective economic advantage, and civil conspiracy. The lawsuit alleges that SAP unlawfully copied and misappropriated proprietary, copyrighted software products and other confidential materials developed by Oracle to service its own customers. The lawsuit seeks injunctive relief and unspecified monetary damages including punitive damages. In July 2007, SAP and TomorrowNow filed their answer to the first amended complaint. In October 2008, SAP and TomorrowNow filed their response to the third amended complaint. The trial has been re-scheduled for February 2010. A second settlement hearing has been scheduled for February 23. 2009 Oracle must submit a settlement claim before that date, to which SAP must respond. Additionally, in June 2007, SAP became aware that the United States Department of Justice had opened an investigation concerning related issues and had issued subpoenas to SAP and TomorrowNow; SAP and TomorrowNow are cooperating with the investigation and are responding to the original subpoenas and additional subpoenas issued by the U.S. Department of Justice.
In April 2007, U.S.-based Versata Software, Inc. (formerly Trilogy Software, Inc.) (Versata) instituted legal
27
proceedings in the United States against SAP. Versata alleges that SAP's products and services infringe one or more of the claims in each of five patents held by Versata. In its complaint, Versata seeks unspecified monetary damages and permanent injunctive relief. A first Markman-hearing was held in June 2008. A second Markman-hearing is scheduled for March 2009. The trial has been scheduled for August 2009.
In August 2007, U.S.-based elcommerce.com, Inc. (elcommerce) instituted legal proceedings in the United States against SAP. elcommerce alleges that SAP's products and services infringe one or more of the claims in one patent held by elcommerce. In its complaint, elcommerce seeks unspecified monetary damages and permanent injunctive relief. The trial has been scheduled for January 2011.
In November 2007, U.S.-based Diagnostic Systems Corp. (DSC) instituted legal proceedings in the United States against SAP and several other defendants. Among the defendants is Business Objects which was sued by DSC prior to being acquired by SAP. DSC alleges that SAP's products and services infringe one or more of the claims in one patent held by DSC. In its complaint, DSC seeks unspecified monetary damages and permanent injunctive relief. The legal proceedings have been stayed pending a decision from the Court of Appeals for the Federal Circuit with respect to a Writ of Mandamus.
In May 2008, U.S.-based InfoMentis, Inc. (‘‘InfoMentis’’) instituted legal proceedings in the United States against SAP. InfoMentis alleges copyright infringement and unfair competition. The lawsuit seeks unspecified monetary damages and a permanent injunction. SAP filed its response in August 2008. No trial date has been set.
In August 2007, Canadian-based JuxtaComm, Inc. (JuxtaComm) instituted legal proceedings in the United States against Business Objects and several other defendants. JuxtaComm alleges that Business Objects’ products infringe one or more of the claims in one patent held by JuxtaComm. In its complaint, JuxtaComm seeks unspecified monetary damages and permanent injunctive relief. The trial has been scheduled for November 2009.
In July 2008, U.S.-based Implicit Networks (Implicit) instituted legal proceedings in the United States against SAP and several other defendants. Implicit alleges that SAP's products and services infringe one or more of the claims of two patents held by Implicit. In its complaint, Implicit seeks unspecified monetary damages and permanent injunctive relief. A trial date not yet been set.
In July 2008, U.S.-based Aloft Media (Aloft) instituted legal proceedings in the United States against SAP and several other defendants. Aloft alleges that SAP's products and services infringe one or more of the claims of two patents held by Aloft. In its complaint, Implicit seeks unspecified monetary
damages and permanent injunctive relief. A trial date not yet been set.
We will continue to vigorously defend against the claims. We make a provision for a liability for such matters when it is both probable that a liability has been incurred and the amount of the loss can be reasonably estimated. We currently believe that resolving these claims, individually or in aggregate, will not have a material adverse effect on SAP’s business, financial position, income, or cash flows. Consequently, the provisions currently recorded for these claims and suits are neither individually nor in aggregate material to SAP. Any litigation, however, involves potential risk and potentially significant litigation costs, and therefore there can be no assurance that these actions would not have a material adverse effect on SAP’s business, financial position, income, or cash flows. Due to the inherent uncertainties of the actions outlined above we currently cannot make an estimate of the possible loss in case of an unfavorable outcome.
Other Litigation In April 2008, South African-based Systems Applications Consultants (PTY) Limited (Securinfo) instituted legal proceedings in South Africa against SAP. Securinfo alleges that SAP has caused one of its subsidiaries to breach a software distribution agreement with Securinfo. The complaint was served with SAP in July 2008. In its complaint, Securinfo seeks damages of approximately €610 million plus interests. In September 2008 SAP filed a motion to dismiss. No trial date has been set.
In January 2008, U.S.-based Acorn Systems, Inc. (‘‘Acorn’’) instituted legal proceedings in the United States against SAP. Acorn filed an amended complaint in March 2008. As amended, the lawsuit alleges breach of contract, fraud and fraudulent inducement, negligent misrepresentation, misappropriation of trade secrets, violations of the Texas Free Enterprise and Antitrust Act of 1983, and unfair competition. The lawsuit seeks unspecified monetary damages, although Acorn alleges in the complaint that it has suffered at least US$116 million damages. In February 2008, SAP filed a response to the original complaint. No trial date has been set. In March 2008, SAP instituted legal proceedings against Acorn in the Commercial Court of Brussels asking the Court to declare, inter alia, that SAP had not breached the contract, SAP did not commit fraud and that SAP had not misappropriated Acorn trade secrets. No hearing date has been set. SAP and Acorn have resolved these disputes for an amount immaterial to SAP's business, financial position, results of operations, and cash flows.
In April 2008, U.S.-based Wellogix, Inc. (‘‘Wellogix’’) instituted legal proceedings in the United States against SAP as well as several other defendants. Wellogix alleges several causes of actions including, but not limited to, breach of joint venture/partnership agreement, breach of fiduciary duty, fraud, negligent misrepresentation, misappropriation of
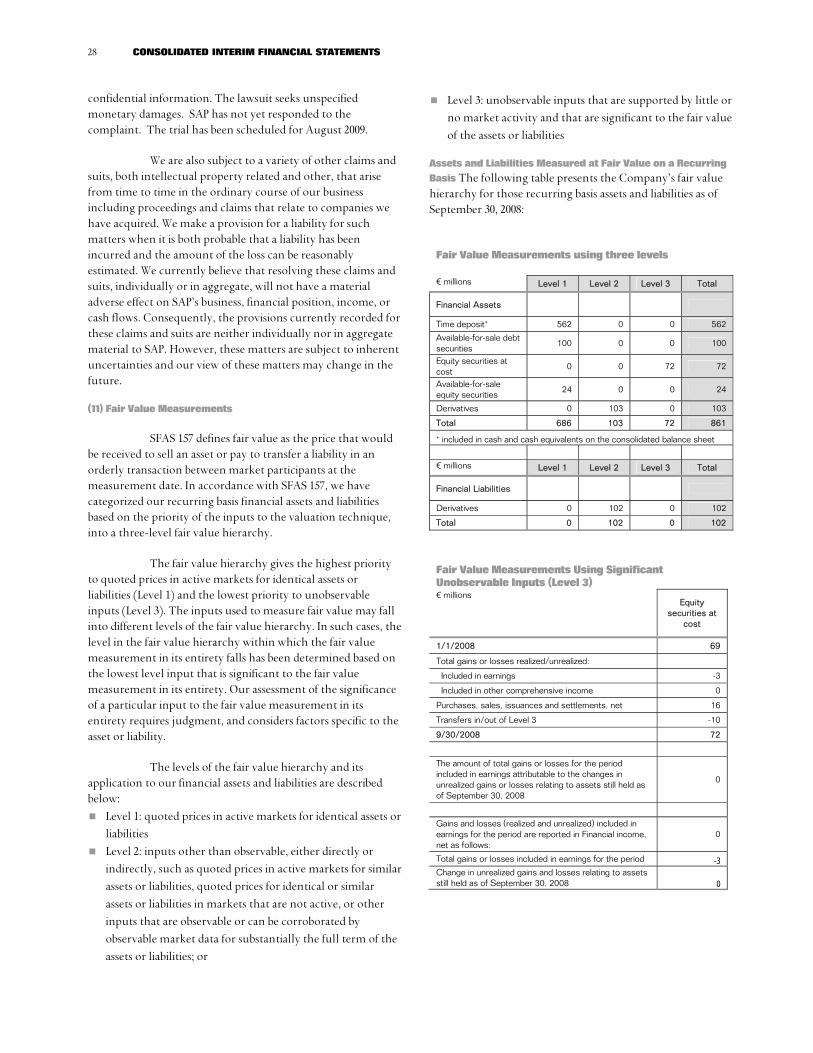
28 CONSOLIDATED INTERIM FINANCIAL STATEMENTS
confidential information. The lawsuit seeks unspecified monetary damages. SAP has not yet responded to the complaint. The trial has been scheduled for August 2009.
We are also subject to a variety of other claims and suits, both intellectual property related and other, that arise from time to time in the ordinary course of our business including proceedings and claims that relate to companies we have acquired. We make a provision for a liability for such matters when it is both probable that a liability has been incurred and the amount of the loss can be reasonably estimated. We currently believe that resolving these claims and suits, individually or in aggregate, will not have a material adverse effect on SAP’s business, financial position, income, or cash flows. Consequently, the provisions currently recorded for these claims and suits are neither individually nor in aggregate material to SAP. However, these matters are subject to inherent uncertainties and our view of these matters may change in the future.
(11) Fair Value Measurements
SFAS 157 defines fair value as the price that would be received to sell an asset or pay to transfer a liability in an orderly transaction between market participants at the measurement date. In accordance with SFAS 157, we have categorized our recurring basis financial assets and liabilities based on the priority of the inputs to the valuation technique, into a three-level fair value hierarchy.
The fair value hierarchy gives the highest priority to quoted prices in active markets for identical assets or liabilities (Level 1) and the lowest priority to unobservable inputs (Level 3). The inputs used to measure fair value may fall into different levels of the fair value hierarchy. In such cases, the level in the fair value hierarchy within which the fair value measurement in its entirety falls has been determined based on the lowest level input that is significant to the fair value measurement in its entirety. Our assessment of the significance of a particular input to the fair value measurement in its entirety requires judgment, and considers factors specific to the asset or liability.
The levels of the fair value hierarchy and its application to our financial assets and liabilities are described below:
Level 1: quoted prices in active markets for identical assets or liabilities
Level 2: inputs other than observable, either directly or indirectly, such as quoted prices in active markets for similar assets or liabilities, quoted prices for identical or similar
assets or liabilities in markets that are not active, or other inputs that are observable or can be corroborated by observable market data for substantially the full term of the assets or liabilities; or
Level 3: unobservable inputs that are supported by little or no market activity and that are significant to the fair value of the assets or liabilities
Assets and Liabilities Measured at Fair Value on a Recurring Basis The following table presents the Company’s fair value hierarchy for those recurring basis assets and liabilities as of September 30, 2008:
Fair Value Measurements using three levels € millions Level 1 Level 2 Level 3 Total
Financial Assets
Time deposit* 562 0 0 562
Available-for-sale debt securities 100 0 0 100
Equity securities at cost
0 0 72 72
Available-for-sale equity securities 24 0 0 24
Derivatives 0 103 0 103
Total 686 103 72 861
* included in cash and cash equivalents on the consolidated balance sheet
€ millions Level 1 Level 2 Level 3 Total
Financial Liabilities
Derivatives 0 102 0 102
Total 0 102 0 102
Fair Value Measurements Using Significant Unobservable Inputs (Level 3) € millions
Equity securities at
cost
1/1/2008 69
Total gains or losses realized/unrealized:
Included in earnings -3
Included in other comprehensive income 0
Purchases, sales, issuances and settlements, net 16
Transfers in/out of Level 3 -10
9/30/2008 72
The amount of total gains or losses for the period included in earnings attributable to the changes in unrealized gains or losses relating to assets still held as of September 30, 2008
0
Gains and losses (realized and unrealized) included in earnings for the period are reported in Financial income, net as follows:
0
Total gains or losses included in earnings for the period -3 Change in unrealized gains and losses relating to assets still held as of September 30, 2008 0
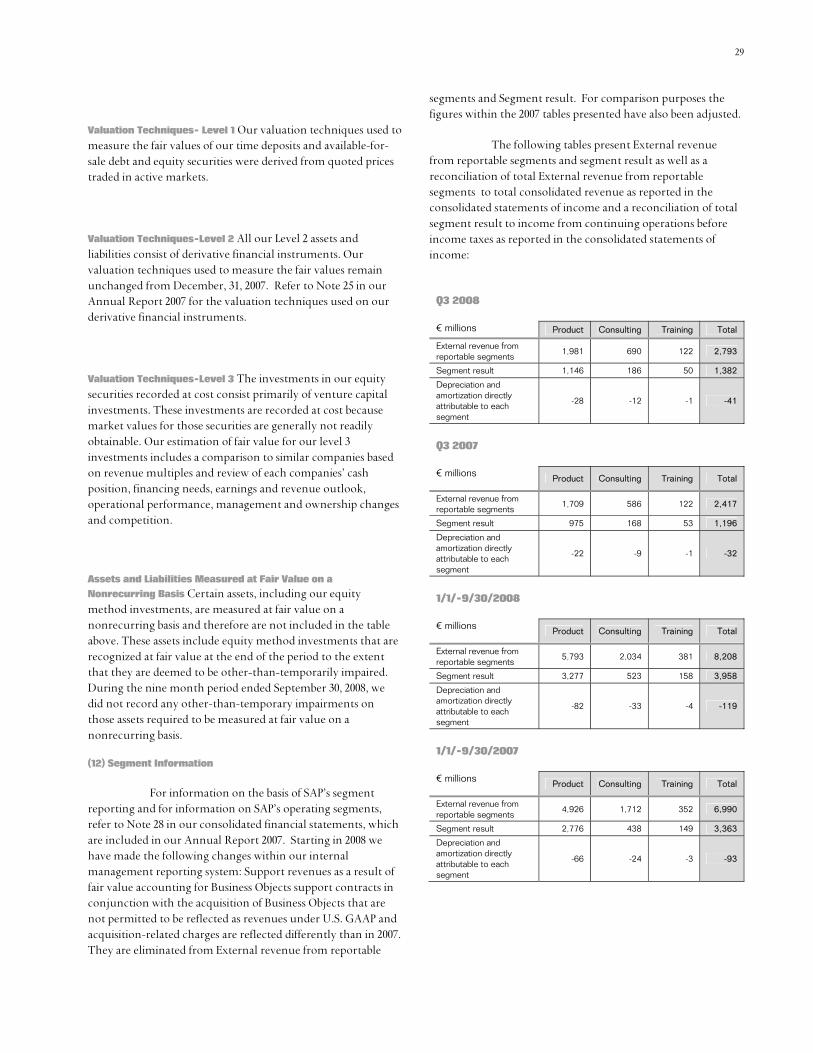
29
Valuation Techniques- Level 1 Our valuation techniques used to measure the fair values of our time deposits and available-for-sale debt and equity securities were derived from quoted prices traded in active markets.
Valuation Techniques-Level 2 All our Level 2 assets and liabilities consist of derivative financial instruments. Our valuation techniques used to measure the fair values remain unchanged from December, 31, 2007. Refer to Note 25 in our Annual Report 2007 for the valuation techniques used on our derivative financial instruments.
Valuation Techniques-Level 3 The investments in our equity securities recorded at cost consist primarily of venture capital investments. These investments are recorded at cost because market values for those securities are generally not readily obtainable. Our estimation of fair value for our level 3 investments includes a comparison to similar companies based on revenue multiples and review of each companies’ cash position, financing needs, earnings and revenue outlook, operational performance, management and ownership changes and competition.
Assets and Liabilities Measured at Fair Value on a Nonrecurring Basis Certain assets, including our equity method investments, are measured at fair value on a nonrecurring basis and therefore are not included in the table above. These assets include equity method investments that are recognized at fair value at the end of the period to the extent that they are deemed to be other-than-temporarily impaired. During the nine month period ended September 30, 2008, we did not record any other-than-temporary impairments on those assets required to be measured at fair value on a nonrecurring basis.
(12) Segment Information
For information on the basis of SAP’s segment reporting and for information on SAP’s operating segments, refer to Note 28 in our consolidated financial statements, which are included in our Annual Report 2007. Starting in 2008 we have made the following changes within our internal management reporting system: Support revenues as a result of fair value accounting for Business Objects support contracts in conjunction with the acquisition of Business Objects that are not permitted to be reflected as revenues under U.S. GAAP and acquisition-related charges are reflected differently than in 2007. They are eliminated from External revenue from reportable
segments and Segment result. For comparison purposes the figures within the 2007 tables presented have also been adjusted.
The following tables present External revenue from reportable segments and segment result as well as a reconciliation of total External revenue from reportable segments to total consolidated revenue as reported in the consolidated statements of income and a reconciliation of total segment result to income from continuing operations before income taxes as reported in the consolidated statements of income:
Q3 2008 € millions Product Consulting Training Total
External revenue from reportable segments 1,981 690 122 2,793
Segment result 1,146 186 50 1,382
Depreciation and amortization directly attributable to each segment
-28 -12 -1 -41
Q3 2007 € millions Product Consulting Training Total
External revenue from reportable segments 1,709 586 122 2,417
Segment result 975 168 53 1,196
Depreciation and amortization directly attributable to each segment
-22 -9 -1 -32
1/1/-9/30/2008 € millions Product Consulting Training Total
External revenue from reportable segments
5,793 2,034 381 8,208
Segment result 3,277 523 158 3,958
Depreciation and amortization directly attributable to each segment
-82 -33 -4 -119
1/1/-9/30/2007
€ millions Product Consulting Training Total
External revenue from reportable segments
4,926 1,712 352 6,990
Segment result 2,776 438 149 3,363
Depreciation and amortization directly attributable to each segment
-66 -24 -3 -93
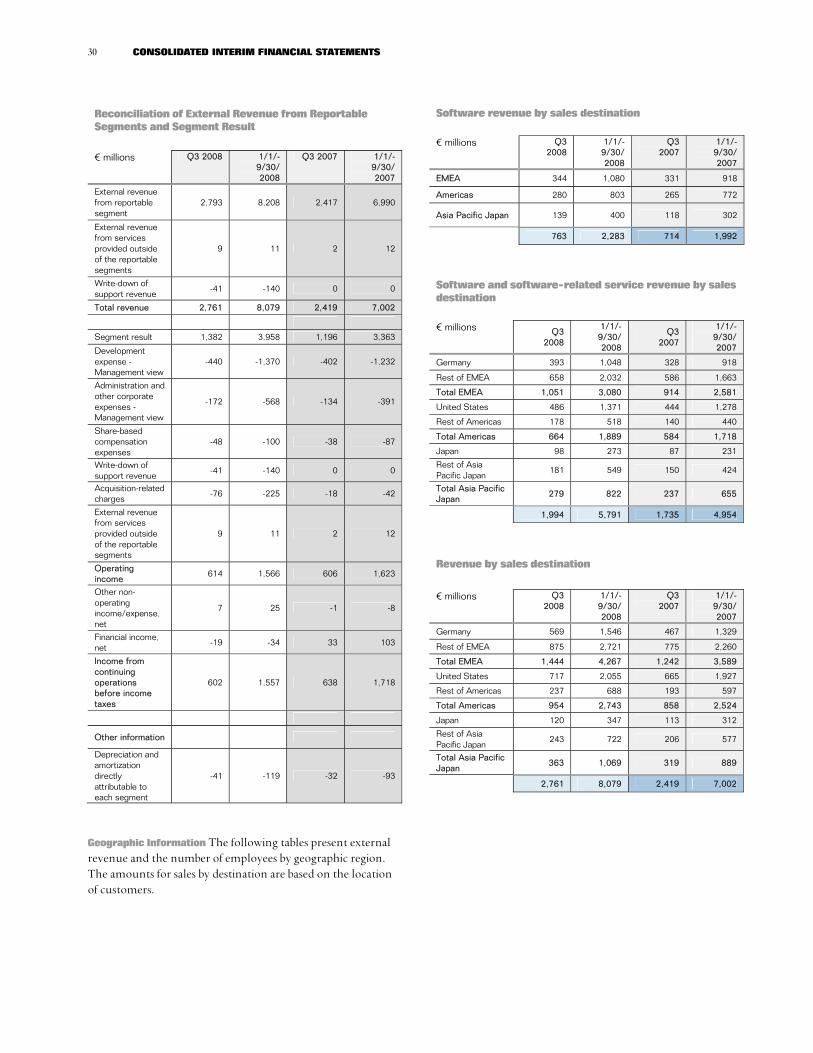
30 CONSOLIDATED INTERIM FINANCIAL STATEMENTS
Reconciliation of External Revenue from Reportable Segments and Segment Result
€ millions Q3 2008 1/1/-
9/30/ 2008
Q3 2007 1/1/-9/30/2007
External revenue from reportable segment
2,793 8,208 2,417 6,990
External revenue from services provided outside of the reportable segments
9 11 2 12
Write-down of support revenue
-41 -140 0 0
Total revenue 2,761 8,079 2,419 7,002
Segment result 1,382 3,958 1,196 3,363
Development expense - Management view
-440 -1,370 -402 -1,232
Administration and other corporate expenses - Management view
-172 -568 -134 -391
Share-based compensation expenses
-48 -100 -38 -87
Write-down of support revenue
-41 -140 0 0
Acquisition-related charges -76 -225 -18 -42
External revenue from services provided outside of the reportable segments
9 11 2 12
Operating income
614 1,566 606 1,623
Other non-operating income/expense, net
7 25 -1 -8
Financial income, net -19 -34 33 103
Income from continuing operations before income taxes
602 1,557 638 1,718
Other information
Depreciation and amortization directly attributable to each segment
-41 -119 -32 -93
Geographic Information The following tables present external revenue and the number of employees by geographic region. The amounts for sales by destination are based on the location of customers.
Software revenue by sales destination
€ millions Q3 2008
1/1/-9/30/ 2008
Q32007
1/1/-9/30/2007
EMEA 344 1,080 331 918
Americas 280 803 265 772
Asia Pacific Japan 139 400 118 302
763 2,283 714 1,992
Software and software-related service revenue by sales destination
€ millions Q3
2008
1/1/-9/30/ 2008
Q32007
1/1/-9/30/2007
Germany 393 1,048 328 918
Rest of EMEA 658 2,032 586 1,663
Total EMEA 1,051 3,080 914 2,581
United States 486 1,371 444 1,278
Rest of Americas 178 518 140 440
Total Americas 664 1,889 584 1,718
Japan 98 273 87 231
Rest of Asia Pacific Japan
181 549 150 424
Total Asia Pacific Japan 279 822 237 655
1,994 5,791 1,735 4,954
Revenue by sales destination
€ millions Q3 2008
1/1/-9/30/ 2008
Q32007
1/1/-9/30/2007
Germany 569 1,546 467 1,329
Rest of EMEA 875 2,721 775 2,260
Total EMEA 1,444 4,267 1,242 3,589
United States 717 2,055 665 1,927
Rest of Americas 237 688 193 597
Total Americas 954 2,743 858 2,524
Japan 120 347 113 312
Rest of Asia Pacific Japan
243 722 206 577
Total Asia Pacific Japan
363 1,069 319 889
2,761 8,079 2,419 7,002

31
Headcount by region
Full-Time Equivalents - from continuing operations
9/30/2008 12/31/2007
Germany 15,455 14,749
Rest of EMEA 11,309 8,905
Total EMEA 26,764 23,654
United States 9,424 7,832
Rest of Americas 4,369 2,797
Total Americas 13,793 10,629
Japan 1,446 1,344
Rest of Asia Pacific Japan 9,860 8,234
Total Asia Pacific Japan 11,306 9,578
Total 51,863 43,861
Headcount by functional area
Full-Time Equivalents - from continuing operations 9/30/2008 12/31/2007
Software and software-related services 6,457 5,831
Professional services and other services 14,193 12,785
Research and development 15,458 12,951
Sales and marketing 10,909 8,282
General and administration 3,303 2,797
Infrastructure 1,543 1,215
Total 51,863 43,861
(13) Related Party Transactions
Certain Executive Board and Supervisory Board members of SAP AG currently hold or held within the last year positions of significant responsibility with other entities as presented in our Annual Report 2007. We have relationships with certain of these entities in the ordinary course of business whereby we buy and sell a wide variety of services and products at prices believed to be consistent with those negotiated at arm's length between unrelated parties.
During the reporting period we had no material related party transactions likely to have a material effect on our business, financial position, or income.
We have issued loans to employees other than to members of SAP AG’s Executive Board and Supervisory Board amounting to a gross value of €62 million, and €63 million, at September 30, 2008, and December 31, 2007, respectively. Loans granted to employees primarily consist of interest-free or below-market-rate building loans which SAP discounts for financial reporting purposes based on prevailing market rates. SAP has not experienced significant default on loans to
employees. There have been no loans to employees or executives to assist them in exercising stock options.
For further information on related party transactions, refer to Note (30) in SAP’s consolidated financial statements, which are included in our Annual Report 2007.

32 ADDITIONAL FINANCIAL INFORMATION
ADDITIONAL FINANCIAL INFORMATION NON-GAAP FIANCIAL DATA (UNAUDITED)1
RECONCILIATIONS from Non-GAAP Numbers to U.S GAAP Numbers - THIRD QUARTER The following table presents a reconciliation from our ‘Non-GAAP’ numbers (including our ‘Non-GAAP at Constant Currency’ numbers) to the respective most comparable U.S. GAAP numbers. Note: Our Non-GAAP numbers are not prepared under a comprehensive set of accounting rules or principles. Please see section "Explanations of Non-GAAP measures" for more information on our Non-GAAP numbers.
€ millions, unless otherwise stated Three months ended September 30
2008 2007 % change
U.S. GAAP Adj.* Non-
GAAP* Currencyimpact**
Non-GAAP
constant currency**
U.S. GAAP Adj.* Non-
GAAP* U.S.
GAAP Non-
GAAP*
Non-GAAP
constant currency**
Software revenue 763 0 763 28 791 714 0 714 7 7 11
Support revenue 1,167 41 1,208 49 1,257 975 0 975 20 24 29
Subscription and other software-related service revenue
64 0 64 1 65 46 0 46 39 39 41
Software and software-related service revenue 1,994 41 2,035 78 2,113 1,735 0 1,735 15 17 22
Consulting revenue 617 0 617 28 645 544 0 544 13 13 19
Training revenue 105 0 105 4 109 102 0 102 3 3 7
Other service revenue 26 0 26 1 27 28 0 28 -7 -7 -4
Professional services and other service revenue 748 0 748 33 781 674 0 674 11 11 16
Other revenue 19 0 19 0 19 10 0 10 90 90 90
Total revenue 2,761 41 2,802 111 2,913 2,419 0 2,419 14 16 20
Cost of software and software-related services -381 49 -332 -327 16 -311 17 7
Cost of professional services and other services -583 0 -583 -502 1 -501 16 16
Research and development -398 3 -395 -357 0 -357 11 11
Sales and marketing -634 23 -611 -510 1 -509 24 20
General and administration -156 1 -155 -121 0 -121 29 28
Other operating income/expense, net 5 0 5 4 0 4 25 25
Total operating expenses -2,147 76 -2,071 -76 -2,147 -1,813 18 -1,795 18 15 20
Operating income 614 117 731 35 766 606 18 624 1 17 23
Other non-operating income/expense, net 7 0 7 -1 0 -1 -800 -800
Financial income/expense, net -19 0 -19 33 0 33 -158 -158
Income from continuing operations before income taxes 602 117 719 638 18 656 -6 10
Income taxes -192 -30 -222 -223 -7 -230 -14 -3
Minority interests -1 0 -1 -1 0 -1 0 0
Income from continuing operations 409 87 496 414 11 425 -1 17
Loss from discontinued operations, net of tax -21 0 -21 -6 0 -6 250 250
Net income 388 87 475 408 11 419 -5 13
Earnings per Share (EPS)
EPS from continuing operations – basic in € 0.35 0.41 0.35 0.36 0 14
EPS from continuing operations – diluted in € 0.34 0.41 0.34 0.35 0 17
EPS from net income – basic in € 0.33 0.40 0.34 0.35 -3 14
EPS from net income – diluted in € 0.33 0.40 0.33 0.34 0 18
Weighted average number of shares*** 1,188 1,188 1,206 1,206
Key Ratios
Operating margin 22.2% 26.1% 26.3% 25.1% 25.8% -2.9pp 0.3pp 0.5pp
Effective tax rate from continuing operations 31.9% 30.9% 35.0% 35.1%
* adjustments in the revenue line items are for the Business Objects support revenue that Business Objects would have recognized had it remained a stand-alone entity but that SAP is not permitted to recognize as revenue under U.S. GAAP as a result of business combination accounting rules. Adjustments in the operating expense line items are for acquisition-related charges.
** constant currency revenue and operating income figures are calculated by translating revenue and operating income of the current period using the average exchange rates from the previous year's respective period instead of the current period. Constant currency period-over-period changes are calculated by comparing the current year's Non-GAAP constant currency numbers with the Non-GAAP number of the previous year's respective period.
*** in millions, treasury stock excluded
1 See the explanatory note on page 3 of this Interim Report
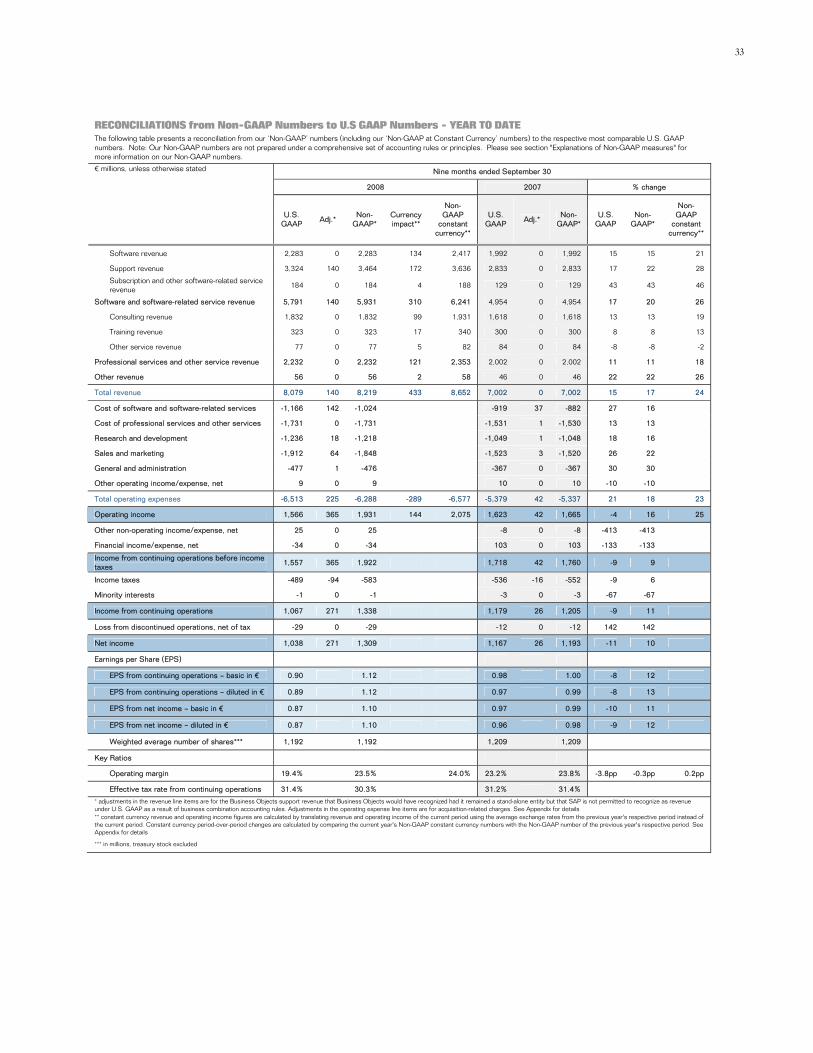
33
RECONCILIATIONS from Non-GAAP Numbers to U.S GAAP Numbers - YEAR TO DATE The following table presents a reconciliation from our ‘Non-GAAP’ numbers (including our ‘Non-GAAP at Constant Currency’ numbers) to the respective most comparable U.S. GAAP numbers. Note: Our Non-GAAP numbers are not prepared under a comprehensive set of accounting rules or principles. Please see section "Explanations of Non-GAAP measures" for more information on our Non-GAAP numbers.
€ millions, unless otherwise stated Nine months ended September 30
2008 2007 % change
U.S. GAAP Adj.*
Non-GAAP*
Currencyimpact**
Non-GAAP
constant currency**
U.S. GAAP Adj.*
Non-GAAP*
U.S. GAAP
Non-GAAP*
Non-GAAP
constant currency**
Software revenue 2,283 0 2,283 134 2,417 1,992 0 1,992 15 15 21
Support revenue 3,324 140 3,464 172 3,636 2,833 0 2,833 17 22 28
Subscription and other software-related service revenue 184 0 184 4 188 129 0 129 43 43 46
Software and software-related service revenue 5,791 140 5,931 310 6,241 4,954 0 4,954 17 20 26
Consulting revenue 1,832 0 1,832 99 1,931 1,618 0 1,618 13 13 19
Training revenue 323 0 323 17 340 300 0 300 8 8 13
Other service revenue 77 0 77 5 82 84 0 84 -8 -8 -2
Professional services and other service revenue 2,232 0 2,232 121 2,353 2,002 0 2,002 11 11 18
Other revenue 56 0 56 2 58 46 0 46 22 22 26
Total revenue 8,079 140 8,219 433 8,652 7,002 0 7,002 15 17 24
Cost of software and software-related services -1,166 142 -1,024 -919 37 -882 27 16
Cost of professional services and other services -1,731 0 -1,731 -1,531 1 -1,530 13 13
Research and development -1,236 18 -1,218 -1,049 1 -1,048 18 16
Sales and marketing -1,912 64 -1,848 -1,523 3 -1,520 26 22
General and administration -477 1 -476 -367 0 -367 30 30
Other operating income/expense, net 9 0 9 10 0 10 -10 -10
Total operating expenses -6,513 225 -6,288 -289 -6,577 -5,379 42 -5,337 21 18 23
Operating income 1,566 365 1,931 144 2,075 1,623 42 1,665 -4 16 25
Other non-operating income/expense, net 25 0 25 -8 0 -8 -413 -413
Financial income/expense, net -34 0 -34 103 0 103 -133 -133
Income from continuing operations before income taxes 1,557 365 1,922 1,718 42 1,760 -9 9
Income taxes -489 -94 -583 -536 -16 -552 -9 6
Minority interests -1 0 -1 -3 0 -3 -67 -67
Income from continuing operations 1,067 271 1,338 1,179 26 1,205 -9 11
Loss from discontinued operations, net of tax -29 0 -29 -12 0 -12 142 142
Net income 1,038 271 1,309 1,167 26 1,193 -11 10
Earnings per Share (EPS)
EPS from continuing operations – basic in € 0.90 1.12 0.98 1.00 -8 12
EPS from continuing operations – diluted in € 0.89 1.12 0.97 0.99 -8 13
EPS from net income – basic in € 0.87 1.10 0.97 0.99 -10 11
EPS from net income – diluted in € 0.87 1.10 0.96 0.98 -9 12
Weighted average number of shares*** 1,192 1,192 1,209 1,209
Key Ratios
Operating margin 19.4% 23.5% 24.0% 23.2% 23.8% -3.8pp -0.3pp 0.2pp
Effective tax rate from continuing operations 31.4% 30.3% 31.2% 31.4%
* adjustments in the revenue line items are for the Business Objects support revenue that Business Objects would have recognized had it remained a stand-alone entity but that SAP is not permitted to recognize as revenue under U.S. GAAP as a result of business combination accounting rules. Adjustments in the operating expense line items are for acquisition-related charges. See Appendix for details ** constant currency revenue and operating income figures are calculated by translating revenue and operating income of the current period using the average exchange rates from the previous year's respective period instead of the current period. Constant currency period-over-period changes are calculated by comparing the current year's Non-GAAP constant currency numbers with the Non-GAAP number of the previous year's respective period. See Appendix for details
*** in millions, treasury stock excluded

34 ADDITIONAL FINANCIAL INFORMATION
Reconciliation from Non-GAAP Revenue in U.S. Dollar to U.S. GAAP Revenue in Euro The following table presents a reconciliation from our Non-GAAP Revenue numbers in U.S. Dollar to the respective most comparable U.S. GAAP Revenue numbers in Euro. Note: Our Non-GAAP numbers in U.S. Dollar are company-specific and not prepared under a comprehensive set of accounting rules or principles. Please see section "Explanations of Non-GAAP measures" for more information on our Non-GAAP numbers. Three months ended September 30
Software Revenue Software and Software-Related Service Revenue
2008 2007 % change 2008 2007 % change
U.S. GAAP Revenue in € millions 763 714 7 1,994 1,735 15 Respective Measure in U.S. $ millions 1,115 991 13 2,960 2,394 24
Adjustment* in U.S. $ millions 0 0 0 60 0 0 Non-GAAP Revenue in U.S. $ millions 1,115 991 13 3,020 2,394 26 * adjustments in the revenue line items are for the Business Objects support revenue that Business Objects would have recognized had it remained a stand-alone entity but that SAP is not permitted to recognize as revenue under U.S. GAAP as a result of business combination rules.
Nine months ended September 30
Software Revenue Software and Software-Related Service Revenue
2008 2007 % change 2008 2007 % change
U.S. GAAP Revenue in € millions 2,283 1,992 15 5,791 4,954 17 Respective Measure in U.S. $ millions 3,470 2,695 29 8,804 6,680 32
Adjustment* in U.S. $ millions 0 0 0 214 0 0 Non-GAAP Revenue in U.S. $ millions 3,470 2,695 29 9,018 6,680 35 * adjustments in the revenue line items are for the Business Objects support revenue that Business Objects would have recognized had it remained a stand-alone entity but that SAP is not permitted to recognize as revenue under U.S. GAAP as a result of business combination rules.

35
REVENUE BY REGION - THIRD QUARTER The following table presents our U.S. GAAP and Non-GAAP revenue by region. The table also presents a reconciliation from our Non-GAAP Revenue (including our Non-GAAP Revenue at Constant Currency) to the respective most comparable U.S. GAAP Revenue. Note: Our Non-GAAP Revenue are not prepared under a comprehensive set of accounting rules or principles. Please see section "Explanations of Non-GAAP measures" for more information on our Non-GAAP numbers.
€ millions Three months ended September 30
2008 2007 % change
U.S. GAAP Adj.* Non-
GAAP* Currencyimpact**
Non-GAAP constant currency**
U.S. GAAP Adj.* Non-
GAAP* U.S. GAAP
Non-GAAP*
Non-GAAP constant currency**
Software revenue by region*** EMEA 344 0 344 6 350 331 0 331 4 4 6
Americas 280 0 280 15 295 265 0 265 6 6 11
Asia Pacific Japan 139 0 139 7 146 118 0 118 18 18 24
Total 763 0 763 28 791 714 0 714 7 7 11
Software and software-related service revenue by region***
Germany 393 0 393 1 394 328 0 328 20 20 20
Rest of EMEA 658 16 674 18 692 586 0 586 12 15 18
Total EMEA 1,051 16 1,067 19 1,086 914 0 914 15 17 19
United States 486 22 508 40 548 444 0 444 9 14 23
Rest of Americas 178 1 179 6 185 140 0 140 27 28 32
Total Americas 664 23 687 46 733 584 0 584 14 18 26
Japan 98 1 99 -2 97 87 0 87 13 14 11
Rest of Asia Pacific Japan 181 1 182 15 197 150 0 150 21 21 31
Total Asia Pacific Japan 279 2 281 13 294 237 0 237 18 19 24
Total 1,994 41 2,035 78 2,113 1,735 0 1,735 15 17 22
Total revenue by region*** Germany 569 0 569 1 570 467 0 467 22 22 22
Rest of EMEA 875 16 891 23 914 775 0 775 13 15 18
Total EMEA 1,444 16 1,460 24 1,484 1,242 0 1,242 16 18 19
United States 717 22 739 59 798 665 0 665 8 11 20
Rest of Americas 237 1 238 9 247 193 0 193 23 23 28
Total Americas 954 23 977 68 1,045 858 0 858 11 14 22
Japan 120 1 121 -2 119 113 0 113 6 7 5
Rest of Asia Pacific Japan 243 1 244 21 265 206 0 206 18 18 29
Total Asia Pacific Japan 363 2 365 19 384 319 0 319 14 14 20
Total 2,761 41 2,802 111 2,913 2,419 0 2,419 14 16 20
* adjustments in the revenue line items are for the Business Objects support revenue that Business Objects would have recognized had it remained a stand-alone entity but that SAP is not permitted to recognize as revenue under U.S. GAAP as a result of business combination accounting rules. Adjustments in the operating expense line items are for acquisition-related charges. See Appendix for details
** constant currency revenue and operating income figures are calculated by translating revenue and operating income of the current period using the average exchange rates from the previous year's respective period instead of the current period. Constant currency period-over-period changes are calculated by comparing the current year's Non-GAAP constant currency numbers with the Non-GAAP number of the previous year's respective period
*** based on customer location
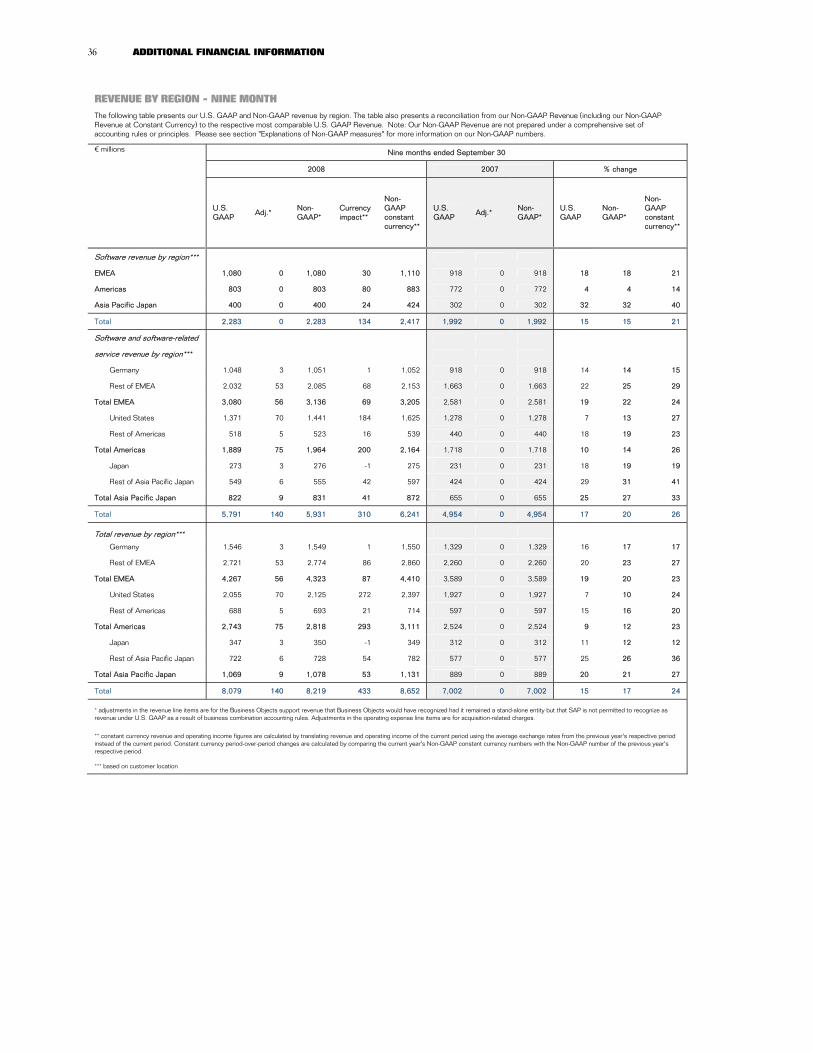
36 ADDITIONAL FINANCIAL INFORMATION
REVENUE BY REGION - NINE MONTH The following table presents our U.S. GAAP and Non-GAAP revenue by region. The table also presents a reconciliation from our Non-GAAP Revenue (including our Non-GAAP Revenue at Constant Currency) to the respective most comparable U.S. GAAP Revenue. Note: Our Non-GAAP Revenue are not prepared under a comprehensive set of accounting rules or principles. Please see section "Explanations of Non-GAAP measures" for more information on our Non-GAAP numbers.
€ millions Nine months ended September 30
2008 2007 % change
U.S. GAAP
Adj.* Non-GAAP*
Currencyimpact**
Non-GAAP constant currency**
U.S. GAAP
Adj.* Non-GAAP*
U.S. GAAP
Non-GAAP*
Non-GAAP constant currency**
Software revenue by region*** EMEA 1,080 0 1,080 30 1,110 918 0 918 18 18 21
Americas 803 0 803 80 883 772 0 772 4 4 14
Asia Pacific Japan 400 0 400 24 424 302 0 302 32 32 40
Total 2,283 0 2,283 134 2,417 1,992 0 1,992 15 15 21
Software and software-related service revenue by region***
Germany 1,048 3 1,051 1 1,052 918 0 918 14 14 15
Rest of EMEA 2,032 53 2,085 68 2,153 1,663 0 1,663 22 25 29
Total EMEA 3,080 56 3,136 69 3,205 2,581 0 2,581 19 22 24
United States 1,371 70 1,441 184 1,625 1,278 0 1,278 7 13 27
Rest of Americas 518 5 523 16 539 440 0 440 18 19 23
Total Americas 1,889 75 1,964 200 2,164 1,718 0 1,718 10 14 26
Japan 273 3 276 -1 275 231 0 231 18 19 19
Rest of Asia Pacific Japan 549 6 555 42 597 424 0 424 29 31 41
Total Asia Pacific Japan 822 9 831 41 872 655 0 655 25 27 33
Total 5,791 140 5,931 310 6,241 4,954 0 4,954 17 20 26
Total revenue by region*** Germany 1,546 3 1,549 1 1,550 1,329 0 1,329 16 17 17
Rest of EMEA 2,721 53 2,774 86 2,860 2,260 0 2,260 20 23 27
Total EMEA 4,267 56 4,323 87 4,410 3,589 0 3,589 19 20 23
United States 2,055 70 2,125 272 2,397 1,927 0 1,927 7 10 24
Rest of Americas 688 5 693 21 714 597 0 597 15 16 20
Total Americas 2,743 75 2,818 293 3,111 2,524 0 2,524 9 12 23
Japan 347 3 350 -1 349 312 0 312 11 12 12
Rest of Asia Pacific Japan 722 6 728 54 782 577 0 577 25 26 36
Total Asia Pacific Japan 1,069 9 1,078 53 1,131 889 0 889 20 21 27
Total 8,079 140 8,219 433 8,652 7,002 0 7,002 15 17 24
* adjustments in the revenue line items are for the Business Objects support revenue that Business Objects would have recognized had it remained a stand-alone entity but that SAP is not permitted to recognize as revenue under U.S. GAAP as a result of business combination accounting rules. Adjustments in the operating expense line items are for acquisition-related charges.
** constant currency revenue and operating income figures are calculated by translating revenue and operating income of the current period using the average exchange rates from the previous year's respective period instead of the current period. Constant currency period-over-period changes are calculated by comparing the current year's Non-GAAP constant currency numbers with the Non-GAAP number of the previous year's respective period.
*** based on customer location

37
EXPLANATIONS OF NON-GAAP MEASURES
This document discloses certain financial measures, such as non-GAAP revenues, non-GAAP operating income, non-GAAP operating margin, free cash flow, a constant currency revenue and operating income measures as well as U.S. dollar based revenue numbers, that are not prepared in accordance with U.S. GAAP and are therefore considered non-GAAP financial measures. Our non-GAAP financial measures may not correspond to non-GAAP financial measures that other companies report. The non-GAAP financial measures that we report should be considered as additional to, and not as substitutes for or superior to, revenue, operating income, cash flows, or other measures of financial performance prepared in accordance with U.S. GAAP. Our non-GAAP financial measures included in this document are reconciled to the nearest U.S. GAAP measure in the tables on the previous pages.
NON-GAAP REVENUES, NON-GAAP OPERATING INCOME AND NON-GAAP OPERATING MARGIN
We believe that it is of interest to investors to receive certain supplemental historical and prospective financial information used by our management in running our business – in addition to financial data prepared in accordance with U.S. GAAP. Beginning in 2008 we use both non-GAAP revenues and non-GAAP operating income / non-GAAP operating margin as defined below consistently in our planning, forecasting, reporting, compensation and external communication. Non-GAAP revenue: Revenues in this document identified as “non-GAAP revenue” have been adjusted from the respective U.S. GAAP numbers by including the full amount of Business Objects support revenues that would have been reflected by Business Objects had it remained a stand-alone entity but are not permitted to be reflected as revenues under U.S. GAAP as a result of fair value accounting for Business Objects support contracts in effect at the time of the Business Objects acquisition. Under U.S. GAAP we record at fair value the Business Objects support contracts in effect at the time of the acquisition of Business Objects. Consequently, our U.S. GAAP support revenues, our U.S. GAAP software and software-related service revenues and our U.S. GAAP total revenues for periods subsequent to the Business Objects acquisition do not reflect the full amount of support revenue that Business Objects would have recorded for these support contracts absent the acquisition by SAP.
Adjusting revenue numbers for this one-time revenue impact provides additional insight into our ongoing performance because the support contracts are typically one-year contracts and renewals of these contracts are expected to result in revenues that are not impacted by the business
combination-related fair value accounting. We believe that our non-GAAP revenue numbers have limitations, particularly as the eliminated amounts may be material to us. We therefore do not evaluate our growth and performance without considering both non-GAAP revenues and U.S. GAAP revenues. We caution the readers of this document to follow a similar approach by considering our non-GAAP revenues only in addition to, and not as a substitute for or superior to, revenues or other measures of our financial performance prepared in accordance with U.S. GAAP. Non-GAAP operating income / Non-GAAP operating margin: Operating income and operating margin in this document identified as “non-GAAP operating income” or “non-GAAP operating margin” have been adjusted from the respective operating income and operating margin numbers as recorded under U.S. GAAP by including the full amount of Business Objects support revenues to be included in non-GAAP revenue and by excluding acquisition-related charges. Acquisition related charges in this context comprise:
Amortization expense of intangibles acquired in business combinations and standalone acquisitions of intellectual property
Expense from purchased in-process research and development
Restructuring expenses as far as incurred in connection with a business combinations and accounted for under SFAS 146 in SAP’s U.S. GAAP financial statements
Although acquisition-related charges include recurring items from past acquisitions such as amortization of acquired intangible assets, they also include an unknown component relating to current-year acquisitions. We cannot accurately assess or plan for that unknown component until we have finalized our purchase price allocation. Furthermore acquisition-related charges may include one-time charges that are not reflective of our ongoing operating performance.
We believe that our non-GAAP financial measures described above have limitations, particularly as the eliminated amounts may be material to us. We therefore do not evaluate our growth and performance without considering both non-GAAP operating income / non-GAAP operating margin numbers and U.S. GAAP operating income and margin numbers. We caution the readers of this document to follow a similar approach by considering our non-GAAP operating income / non-GAAP operating margin numbers only in addition to, and not as a substitute for or superior to, revenues or other measures of our financial performance prepared in accordance with U.S. GAAP. FREE CASH FLOW
We believe that free cash flow is a widely accepted supplemental measure of liquidity. Free cash flow measures a company's cash flow remaining after all

38 ADDITIONAL FINANCIAL INFORMATION
expenditures required to maintain or expand the business have been paid off. We calculate free cash flow as operating cash flow from continuing operations minus additions to long-lived assets excluding additions from acquisitions. Free cash flow should be considered in addition to, and not as a substitute for or superior to, cash flow or other measures of liquidity and financial performance prepared in accordance with U.S. GAAP. CONSTANT CURRENCY PERIOD-OVER-PERIOD CHANGES
We believe it is important for investors to have information that provides insight into our sales. Revenue measures determined under U.S. GAAP provide information that is useful in this regard. However, both sales volume and currency effects impact period-over-period changes in sales revenue. We do not sell standardized units of products and services, so we cannot provide relevant information on sales volume by providing data on the changes in product and service units sold. To provide additional information that may be useful to investors in breaking down and evaluating changes in sales volume, we present information about our revenue and various values and components relating to operating income that are adjusted for foreign currency effects. We calculate constant currency year-over-year changes in revenue and operating income by translating foreign currencies using the average exchange rates from the previous (comparator) year instead of the report year.
We believe that data on constant currency period-over-period changes have limitations, particularly as the currency effects that are eliminated constitute a significant element of our revenues and expenses and may severely impact our performance. We therefore limit our use of constant currency period-over-period changes to the analysis of changes in volume as one element of the full change in a financial measure. We do not evaluate our results and performance without considering both constant currency period-over-period changes on the one hand and changes in revenues, expenses, income, or other measures of financial performance prepared in accordance with U.S. GAAP on the other. We caution the readers of this document to follow a similar approach by considering data on constant currency period-over-period changes only in addition to, and not as a substitute for or superior to, changes in revenues, expenses, income, or other measures of financial performance prepared in accordance with U.S. GAAP. U.S. DOLLAR-BASED NON-GAAP REVENUE MEASURES
Substantially all of our major competitors report their financial performance in U.S. dollars. Thus changes in exchange rates, particularly in the U.S. dollar to euro rates, affect the financial statements of our competitors differently than our euro-based financial statements. We therefore believe that U.S. dollar-based revenues for SAP provide investors with useful additional information that enables them to better compare SAP’s revenue growth with SAP’s competitors’ revenue growth irrespective of movements in exchange rates. Our U.S. dollar non-GAAP revenues are determined as if SAP’s reporting currency was the U.S. dollar. In fact, the reporting currency of our U.S. GAAP and IFRS consolidated financial statements as filed in Germany and in the U.S. with the U.S. Securities and Exchange Commission (SEC) is the euro. Additionally, our U.S. dollar non-GAAP revenue numbers have been adjusted from the respective U.S. GAAP revenues by the same support revenue fair value adjustment than our non-GAAP revenues explained above.
SAP’s management uses our U.S. dollar non-GAAP revenues to gain a better understanding of SAP’s operating results compared to SAP’s major competitors.
We believe that our U.S. dollar non-GAAP revenues have limitations, particularly because the impact of currency exchange rate fluctuations and the eliminated amounts may be material to us. We therefore do not evaluate our growth and performance without considering both non-GAAP revenues and euro-based U.S. GAAP revenues. We caution the readers of this document to follow a similar approach by considering our U.S. dollar non-GAAP revenues only in addition to, and not as a substitute for or superior to, revenues or other measures of our financial performance prepared in accordance with U.S. GAAP and reported in euro.

39
MULTI QUARTER SUMMARY (U.S. GAAP AND NON-GAAP)
MULTI QUARTER SUMMARY
(U.S. GAAP and Non-GAAP)
€ millions, unless stated otherwise Q3/2008 Q2/2008 Q1/2008 Q4/2007 Q3/2007 Q2/2007 Q1/2007
Software revenue (U.S. GAAP) 763 898 622 1,415 714 716 562
Revenue adjustment* 0 0 0 0 0 0 0
Software revenue (Non-GAAP) 763 898 622 1,415 714 716 562
Support revenue (U.S. GAAP) 1,167 1,099 1,058 1,005 975 944 914
Revenue adjustment* 41 52 47 0 0 0 0
Support revenue (Non-GAAP) 1,208 1,151 1,105 1,005 975 944 914
Subscription and other software-related
service revenue (U.S. GAAP) 64 64 56 53 46 44 39
Revenue adjustment* 0 0 0 0 0 0 0
Subscription and other software-related
service revenue (Non-GAAP) 64 64 56 53 46 44 39
Software and software-related
service revenue (U.S. GAAP) 1,994 2,061 1,736 2,473 1,735 1,704 1,515
Revenue adjustment* 41 52 47 0 0 0 0
Software and software-related
service revenue (Non-GAAP) 2,035 2,113 1,783 2,473 1,735 1,704 1,515
Total revenue (U.S. GAAP) 2,761 2,858 2,460 3,240 2,419 2,421 2,162
Revenue adjustment* 41 52 47 0 0 0 0
Total revenue (Non-GAAP) 2,802 2,910 2,507 3,240 2,419 2,421 2,162
Operating income (U.S. GAAP) 614 593 359 1,109 606 581 436
Revenue adjustment* 41 52 47 0 0 0 0
Expense adjustment* 76 66 83 19 18 13 11
Operating income (Non-GAAP) 731 711 489 1,128 624 594 447
Operating margin (U.S. GAAP) 22.2% 20.7% 14.6% 34.2% 25.1% 24.0% 20.2%
Operating margin (Non-GAAP) 26.1% 24.4% 19.5% 34.8% 25.8% 24.5% 20.7%
Effective tax rate from continuing operations (Non-GAAP) 30.9% 30.7% 29.0% 33.8% 35.1% 25.8% 33.5%
EPS from continuing operations - basic in € (U.S. GAAP) 0.35 0.34 0.21 0.63 0.35 0.37 0.26
EPS from continuing operations - diluted in € (U.S. GAAP) 0.34 0.34 0.21 0.63 0.34 0.37 0.26
EPS from continuing operations - basic in € (Non-GAAP) 0.41 0.42 0.29 0.64 0.36 0.38 0.26
EPS from continuing operations - diluted in € (Non-GAAP) 0.41 0.42 0.29 0.64 0.35 0.38 0.26
Headcount** 51,863 51,447 51,274 43,861 42,601 41,736 40,318
* adjustments in the revenue line items are for the Business Objects support revenue that Business Objects would have recognized had it remained a stand-alone entity but that SAP is not permitted to recognize as revenue under U.S. GAAP as a result of business combination accounting rules. Adjustments in the operating expense line items are for acquisition-related charges.
** in Full-Time-Equivalents - from continuing operations
40
ADDITIONAL INFORMATION
FINANCIAL CALENDAR
January 29, 2009 Full year 2008, Preliminary Earnings Release, analyst conference April 29, 2009 First quarter 2009, Preliminary Earnings Release, telephone conference May 19, 2009 Annual General Meeting of Shareholders, Mannheim, Germany July 29, 2009 Second quarter 2008, Preliminary Earnings Release, telephone conference INVESTOR SERVICES
SAP offers additional services and resources at our investor relations Web site, www.sap.com/investor, to help investors learn more about SAP stock including, for example, our e-mail newsletter and text message services. From our investor relations Web site you can also access SAP’s Annual Report for 2007, SAP’s Annual Report for 2007 on Form 20-F, and SAP’s IFRS Financial Reports for 2007 online or you can download the PDF version. If you would like to order a printed copy of the Annual Report or subscribe to SAP INVESTOR shareholder magazine, you can do so on our site or by e-mail to [email protected]. If you prefer to order by phone or fax, you can reach us at the following investor services numbers: Europe, Asia Pacific Japan, Africa Tel. +49 6227 7-67336 Fax +49 6227 7-40805 Americas Tel. +1 877 727 7862 Fax +1 212 653 9602
ADDRESSES
SAP AG Dietmar-Hopp-Allee 16 69190 Walldorf Germany Tel. +49 6227 7-47474 Fax +49 6227 7-57575 Internet www.sap.com E-mail [email protected]
All international subsidiaries are listed at www.sap.com at “Our Company/ SAP Subsidiaries”.
INFORMATION ABOUT CONTENT: Investor Relations: Tel. +49 6227 7-67336 Fax +49 6227 7-40805 E-mail [email protected] Press: Tel. +49 6227 7-46311 Fax +49 6227 7-46331 E-Mail [email protected] IMPRINT
OVERALL RESPONSIBILITY: SAP AG Investor Relations