sap performance management a trend study by …€¦ · speed/response time of the transactions....
TRANSCRIPT

© PAC, Month/YY
SAP Performance Management
A Trend Study by Compuware
and PAC
December 2010
SAP Performance Management | A Trend Study by Compuware and PAC 2
© PAC, December 2010
Management Summary
• Many companies run critical business processes on SAP. Therefore, the high
availability and acceptable performance of the business software environment
are essential requirements. Despite this, almost half (43%) of the
organizations surveyed in this study say they are not satisfied with the
performance of their SAP environment.
• In the event of any performance problems experienced by end users,
companies need to be able to quickly identify the causes to make efficient
recovery possible. However, approximately 1 in 2 businesses are not satisfied
with the key performance insights needed to understand an end userʼs
experience of SAP:
1. 40% of enterprises feel that they are not prepared to detect real-time
performance problems.
2. Only 51% believe they are capable of effectively performing rapid root
cause diagnoses of SAP-related issues.
3. 49% of IT directors say it is difficult for them to predict future performance
and capacity issues related to SAP.
• Almost every company using SAP recognizes that performance problems
result in financial risk exposure, with 96% of those questioned stating there is
a ʻfinancial risk or even high financial risk exposure due to SAP performance
problemsʼ.
• Professional solutions for SAP performance management can help to control
and deliver SAP application performance. 50% of the companies surveyed in
this study plan to invest into such solutions.
SAP Performance Management | A Trend Study by Compuware and PAC 3
© PAC, December 2010
Table of Contents
1. Preface................................................................................................ 5
2. SAP Performance Management ....................................................... 7
2.1. The SAP Environment..................................................................................7
2.2. Business-critical Processes and SAP Performance.....................................8
2.3. Definition of SAP Performance Management ..............................................9
3. Methodology..................................................................................... 11
3.1. SAP Performance Insights .........................................................................11
3.2. Financial Risk/Loss Due to SAP Performance Problems...........................17
3.3. IT Challenges of Organizations Using SAP ...............................................19
3.4. Deployment Plans for SAP Performance Management .............................21
3.5. Demographics of Companies Surveyed.....................................................24
4. Compuware Vantage ....................................................................... 27
4.1. Active Monitoring of SAP Transactions......................................................27
4.2. Passive Monitoring of Real Users ..............................................................27
4.3. SAP Solution Manager and Compuware Vantage .....................................28
4.4. Six-step Approach to SAP Performance Management ..............................29
4.5. Visualizing and Reporting SAP Performance.............................................30
5. Compuware and PAC Company Profiles....................................... 33
SAP Performance Management | A Trend Study by Compuware and PAC 4
© PAC, December 2010
Table of Figures
Figure 1: Global View: Companies Using SAP Rate Performance Satisfaction (n=588)............................................................................................12
Figure 2: Global View: Companies Using SAP Rate Performance Insights (n=588)............................................................................................13
Figure 3: Companies with Large SAP Deployments Rate Performance Satisfaction (SAP Environments with More than 2,000 Named Users, n=52) ...................................................................................14
Figure 4: Companies with Small SAP Deployments Rate Performance Satisfaction (SAP Environments with Up to 100 Named Users, n=323).............................................................................................15
Figure 5: Companies with Large SAP Deployments Rate Performance Insight (SAP Environments with More than 2,000 Named Users, n=52) ....16
Figure 6: Companies with Small SAP Deployments Rate Performance Insight (SAP Environments with Up to 100 Named Users, n=323).............16
Figure 7: Financial Risk Exposure Due to SAP Performance Problems (n=588)17 Figure 8: Ability to Measure the Financial Loss Caused by SAP Performance
Problems (n=588) ...........................................................................18 Figure 9: IT Challenges of Organizations Using SAP (n=588)..........................19 Figure 10: Top 2 IT Challenges of Organizations Using SAP in Different
Countries.........................................................................................20 Figure 11: Global View: Deployment Plans of Organizations Using SAP (n=588)21 Figure 12: Planned Deployments Over the Next 6-12 Months Correlated to
Financial Risk Exposure due to SAP Performance (n=588) ...........22 Figure 13: Planned Deployments Over the Next 6-12 Months by Country .......23 Figure 14: Demographics on the Companies Using SAP to Run Critical
Business Processes........................................................................24 Figure 15: Operation of SAP Environments per Country ..................................25 Figure 16: Company Size Demographics per Country......................................26 Figure 17: Compuware Vantage Combines Active and Passive Methods to
Monitor Transaction Performance...................................................28 Figure 18: This Dashboard Displays Service Quality and Service Availability
from a High-level Perspective .........................................................31 Figure 19: A Deeper Technical Dashboard Displays SAP Transactions by
Name, Usage Pattern and Performance Metrics ............................31
SAP Performance Management | A Trend Study by Compuware and PAC 5
© PAC, December 2010
1. PREFACE
Companies can only be successful if their business processes are efficient. A
disruption of a critical process can result in a financial loss due to, for example,
unproductive working hours, lost sales, or delays in production, order fulfillment or
logistics.
Many companies worldwide have been making major investments in SAP
software to improve their business-critical processes. These include financial
accounting, order management, warehouse operations, sales, distribution, and
logistics. Consequently, the SAP software is a vital asset for these companies.
Any problem with the application, such as unavailability or delayed completion of
tasks, poses a significant financial risk.
SAP software can only do the job it is designed for if the overall IT infrastructure
is stable and reliable. In order to ensure that SAP technology runs effectively,
everything from the computing platforms to database and network connections
must be running with maximum efficiency.
An SAP environment is made up of the IT infrastructure, SAP software and
integrated systems. Only if all these components work correctly, SAP-driven
business processes will be successful. A key requirement for companies running
SAP is to guarantee that the whole environment is stable, highly available and
able to quickly respond to usersʼ requests.
Unfortunately, SAP users generally do not always complain when performance is
poor but instead fall back on using traditional manual processes that existed
before the application was implemented. This can, in turn, impact any expected
return on investment (ROI) from implementing SAP. For this reason, it is vital that
SAP customers keep a close eye on their SAP environmentʼs performance.
ʻPerformanceʼ consists of two elements, the efficiency of processes and the
speed/response time of the transactions. Effective SAP performance
management offers an instant, in-depth insight into the performance of an SAP
environment. Without such a solution, it is very difficult to quickly detect the root
SAP Performance Management | A Trend Study by Compuware and PAC 6
© PAC, December 2010
cause of performance problems as they occur and to resolve the issues with
minimum disruption to SAP end users.
In an international trend study, Compuware and Pierre Audoin Consultants (PAC)
have analyzed the current state of SAP performance management across Europe
and the United States. The study sample included IT decision makers from a
range of industries and company sizes. It looked closely at issues around
business processes, the level of system complexity and the different delivery
models used by these business leaders, such as outsourced and in-house
operations or virtualization.
The study provides trends around four key areas of SAP performance
management:
1. An indicator of how satisfied SAP users are with the quality and
availability of SAP-driven business processes;
2. Analysis of how companies rate their ability to manage the performance of
SAP environments;
3. Insight into the financial risk exposure and the financial loss due to
performance problems;
4. Outline of the deployment plans for a dedicated SAP performance
management solution.
SAP Performance Management | A Trend Study by Compuware and PAC 7
© PAC, December 2010
2. SAP PERFORMANCE MANAGEMENT
Companies invest huge sums into their SAP environments. Therefore, it is
imperative that they see a return on that considerable investment. This requires
good SAP performance, which will then enable improved end user productivity on
the system, resulting in efficient business processes.
If a company relies on SAP software for business-critical applications, any
performance problems could have a disastrous effect on its overall business
performance. Such issues, particularly slow response times, can lead not just to
frustration among end users; the subsequent impact on employee productivity
can result in financial loss for a company.
2.1. The SAP Environment
Technical complexity
An SAP environment is not only a database server with an application on top. It
consists of hardware equipment, network connectivity, the software stack
(including application servers), databases, client PCs, terminal servers and
enterprise portals. With so many technologies playing a role in the running of an
SAP system, it makes management much more difficult. In larger enterprises, an
SAP system will be used by thousands of users globally. Whenever there is a
problem, such as a transaction running slowly, it is vital for the management team
to be able to identify the root cause of the problem. No matter how big the
business, and how complex the IT system, efficient performance management is
critical.
In addition, there is often more than one SAP instance and more than one
location where SAP solutions are deployed. Components of an SAP environment
can also be deployed in-house or in an outsourced environment. The technical
infrastructure can, for example, be outsourced to one IT services provider, while
another third party is responsible for the operation of the SAP base and/or the
customization of SAP business logic.
SAP Performance Management | A Trend Study by Compuware and PAC 8
© PAC, December 2010
Application complexity
Given the variety of technical components, there is a high degree of complexity
involved when ensuring a strong SAP performance. However, the technical
architecture is only one part; complexity can also be found on the application
level.
SAP transactions can be used for different processes, depending on the
combination of SAP modules. Transactions can also span different SAP
systems/instances. This means transaction performance can be affected by
many different third parties. To make things worse, not only SAP systems are
involved. Non-SAP business applications, databases or middleware can also
influence the transaction performance.
2.2. Business-critical Processes and SAP Performance
Since SAP systems typically run the most business-critical processes within a
company, high availability and short response times for transaction processing
are mandatory. However, due to the technical complexity described above, there
are a number of challenges that have to be addressed. These include:
• Understand how many users are experiencing performance problems;
• Ensure that all the teams responsible for identifying performance issues
have a complete picture of application performance;
• Detect performance problems early and proactively avoid future problems.
A comprehensive SAP application performance management solution provides
companies with a very powerful approach to meet the challenges outlined above.
In addition, they gain much better insight into their return on investment while
mitigating the risk of financial loss due to SAP performance issues.

SAP Performance Management | A Trend Study by Compuware and PAC 9
© PAC, December 2010
2.3. Definition of SAP Performance Management
In the SAP context, performance management includes the methods and
techniques that measure if business processes and associated transactions are
being executed effectively. With the right solution, companies can detect
performance problems within their SAP environments and drill down to the cause
of the problem.
Monitoring performance from the end user perspective
It is not enough to just monitor SAP performance at the technical level by
checking, for example, the CPU performance of the servers. To effectively
manage the performance of SAP transactions, a holistic view of the overall SAP
environment is required, starting with the end user experience. This end-to-end
view should consider runtime parameters of the infrastructure (network, servers,
storage systems, operating systems, web servers, application servers,
databases, etc.) and performance parameters of SAP transactions alongside end
user experience. The latter is important because network connections, web
servers, terminal servers etc. can lead to latency between end usersʼ PCs and
the SAP backend.
A holistic approach to SAP transaction performance management is needed to:
• Spot SAP transaction performance issues early and identify affected
services, users, SAP instances and locations;
• Determine the impact of incidents on SAP transactions to prioritize
troubleshooting;
• Correlate events with specific incidents;
• Track which components are responsible for poor SAP transaction
performance to allow efficient troubleshooting.
SAP Performance Management | A Trend Study by Compuware and PAC 10
© PAC, December 2010
Trends and performance predictions
In addition to ongoing performance monitoring, it is important to understand
changes in performance characteristics. Over time, a lot of SAP transaction
performance data is collected that can be used to explore performance trends
and to create baselines and correlations that help to predict the future
performance of SAP transactions.
Despite often very substantial investment in SAP, many businesses find that the
system is either not being used correctly or not even used at all. The reasons
are – among other things – the complexity of the system and the interface, as
well as insufficient training, but also performance problems. Often, the latter are
not spotted early enough, leading to end users ʻgiving upʼ on using the application
and reverting to older processes. This of course defeats the purpose of investing
in the new technology. In order to maximize ROI, businesses need to ensure that
their employees use the technology effectively.
SAP Performance Management | A Trend Study by Compuware and PAC 11
© PAC, December 2010
3. METHODOLOGY
In August 2010, Compuware and PAC conducted an international trend study
among 588 companies using SAP in Belgium, France, Germany, Italy, the
Netherlands, Spain, the United Kingdom, and the United States.
The three key areas of questioning covered by the survey included:
• How do companies rate SAP performance?;
• Financial risk related to SAP performance problems;
• Business demand for SAP performance management solutions.
All the companies surveyed run their business-critical processes on SAP
software in different industries and have at least 500 employees. The
respondents were from senior IT management, heads of SAP application
support, as well as IT team leaders. Demographics about the companies
surveyed can be found in the section “Demographics about companies
surveyed”.
3.1. SAP Performance Insights
In the survey, all the companies were asked how good their insights into SAP
performance were. They could select a rating between 1 and 5 (with 1 being
“very good” and 5 “very bad”). Also, people were allowed to choose “no answer”.
Since SAP solutions are critical for these organizations as they run the most
critical business processes, it is important for the performance insight to be at
least “good”. In the following graphs, “good” is the sum of the possible answers 1
and 2, while “bad” is the sum of the rest, excluding “no answer”.
The same applies to the graphs regarding satisfaction with SAP performance.
Here, respondents could select a rating between 1 (“very satisfied”) and 5 (“not at
SAP Performance Management | A Trend Study by Compuware and PAC 12
© PAC, December 2010
all satisfied”). In the graphs, “satisfied” is the sum of the possible answers 1 and
2, while “not satisfied” is the sum of the rest, excluding “no answer”.
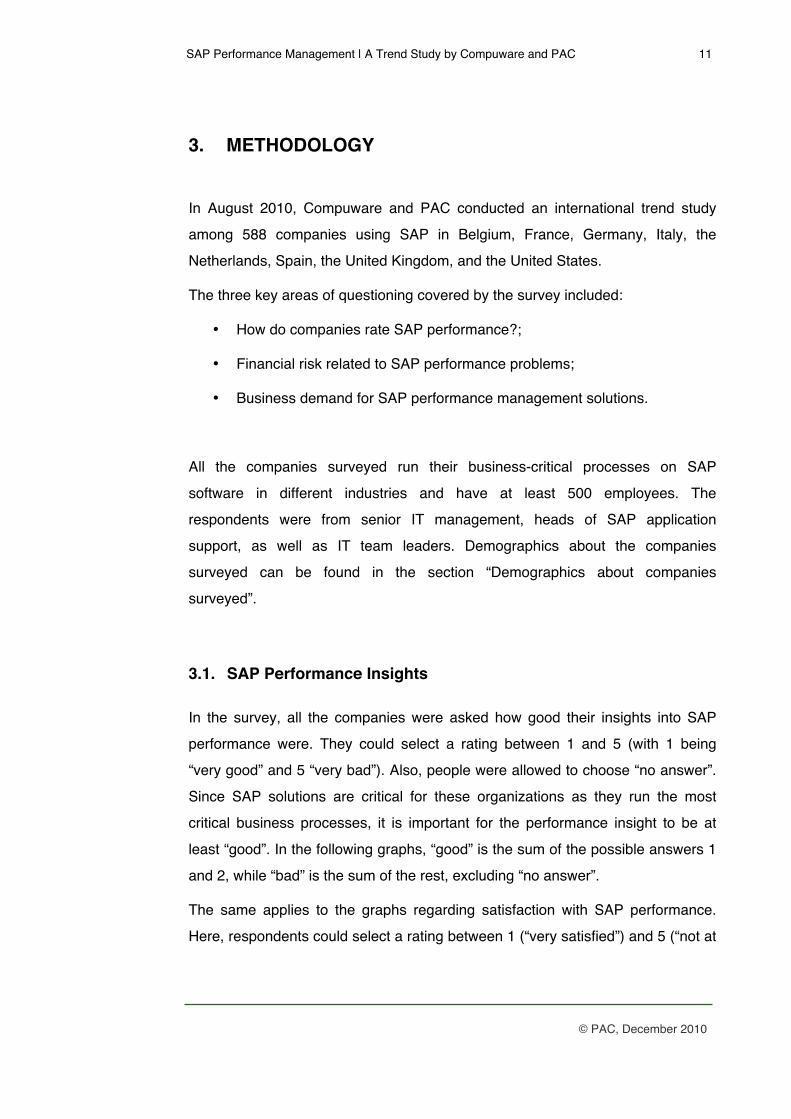
SAP Performance Satisfaction:
Global View
Figure 1: Global View: Companies Using SAP Rate Performance Satisfaction (n=588)
Comment: Among the positive answers concerning overall SAP service
availability, 28% said they were very satisfied and 43% said they were at least
satisfied. On the negative side, 2% were not satisfied at all.
Although the figures look positive, about 30% of the companies are not satisfied
with the performance. Unplanned outages and unacceptable availability and/or
performance issues are a common occurrence for companies using SAP.
Problems can be caused by any of the components within the SAP environment,
even if the business logic itself operates properly.
SAP Performance Management | A Trend Study by Compuware and PAC 13
© PAC, December 2010
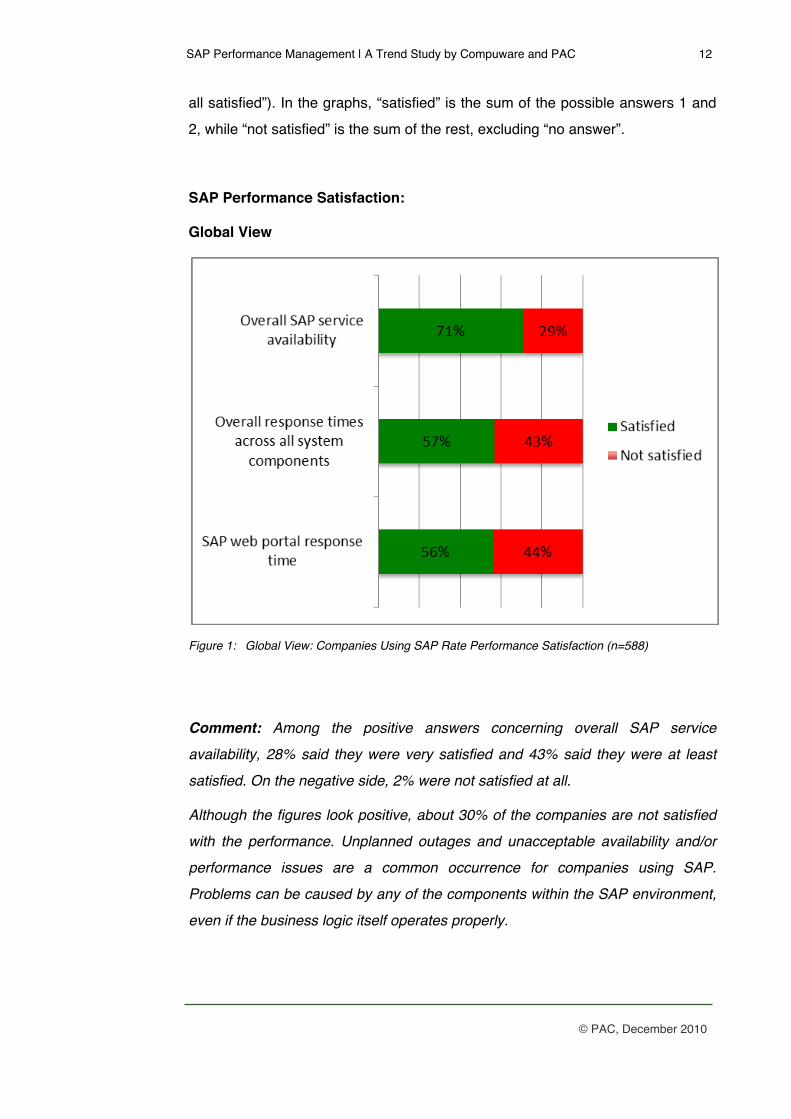
SAP Performance Insight:
Global View
Figure 2: Global View: Companies Using SAP Rate Performance Insights (n=588).
Comment: Only with proactive performance monitoring can problems be
detected early enough to provide companies with the chance to take action
before issues disrupt business processes.
Without effective and rapid root-cause-analysis approaches it is difficult and time-
consuming to pinpoint performance issues within the system landscape.
SAP Performance Management | A Trend Study by Compuware and PAC 14
© PAC, December 2010
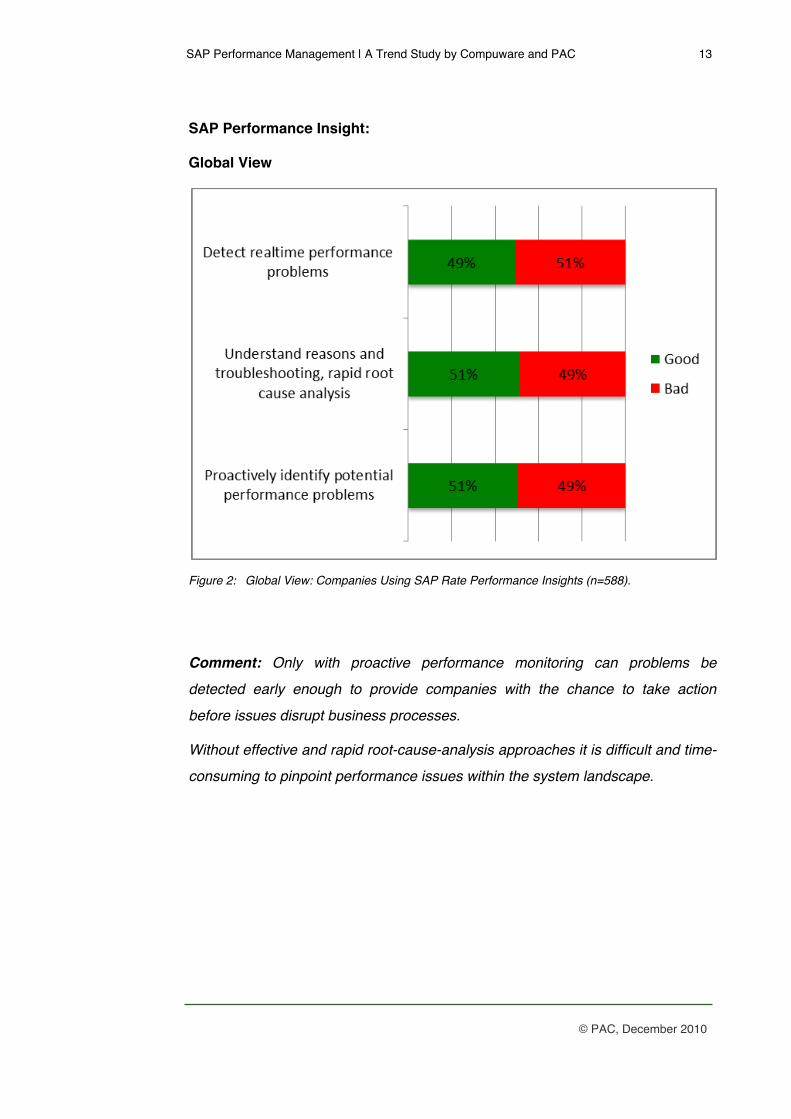
SAP Performance Satisfaction:
Correlation with SAP Deployment Size
Figure 3: Companies with Large SAP Deployments Rate Performance Satisfaction (SAP
Environments with More than 2,000 Named Users, n=52)
SAP Performance Management | A Trend Study by Compuware and PAC 15
© PAC, December 2010
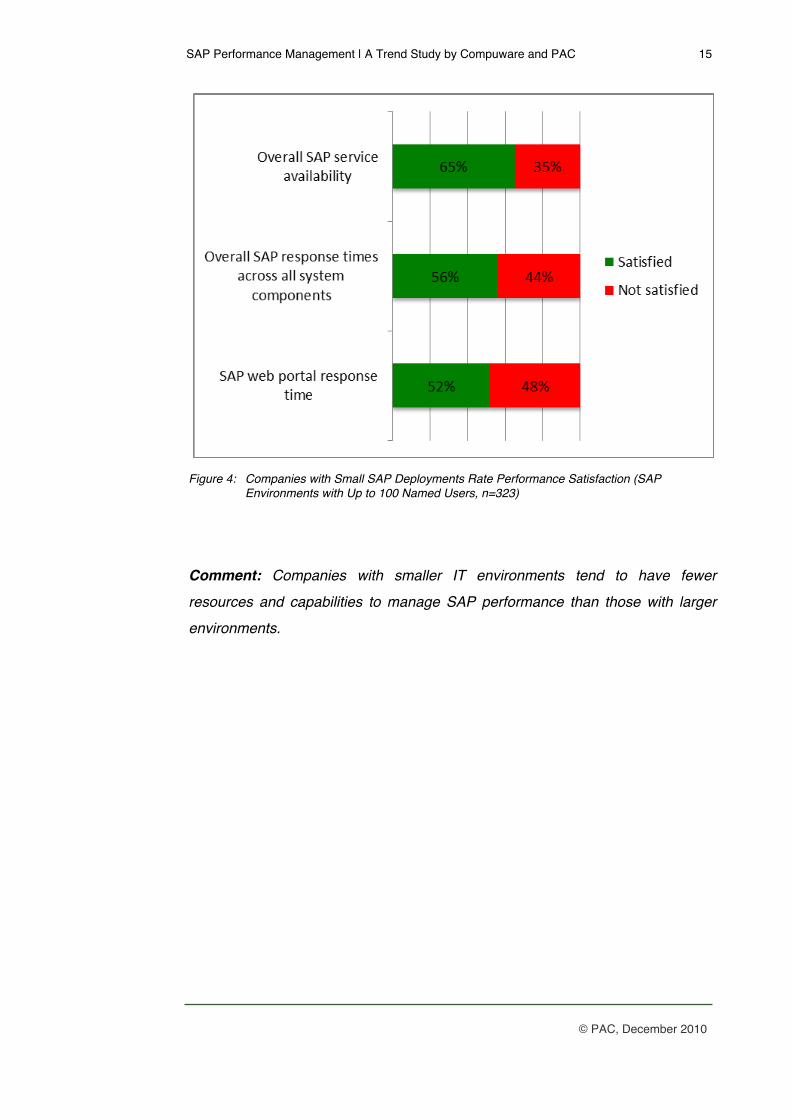
Figure 4: Companies with Small SAP Deployments Rate Performance Satisfaction (SAP
Environments with Up to 100 Named Users, n=323)
Comment: Companies with smaller IT environments tend to have fewer
resources and capabilities to manage SAP performance than those with larger
environments.
SAP Performance Management | A Trend Study by Compuware and PAC 16
© PAC, December 2010
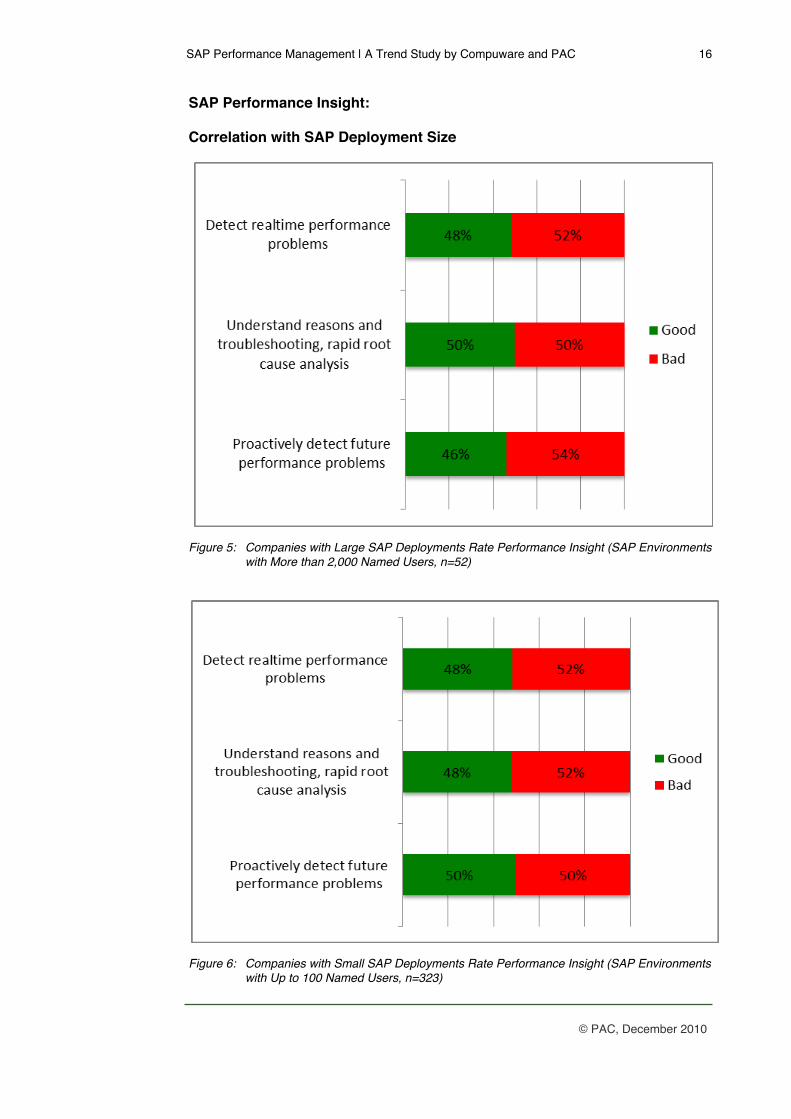
SAP Performance Insight:
Correlation with SAP Deployment Size
Figure 5: Companies with Large SAP Deployments Rate Performance Insight (SAP Environments
with More than 2,000 Named Users, n=52)
Figure 6: Companies with Small SAP Deployments Rate Performance Insight (SAP Environments
with Up to 100 Named Users, n=323)
SAP Performance Management | A Trend Study by Compuware and PAC 17
© PAC, December 2010
Comment: Irrespective of size, companies struggle to gain SAP performance
insights.
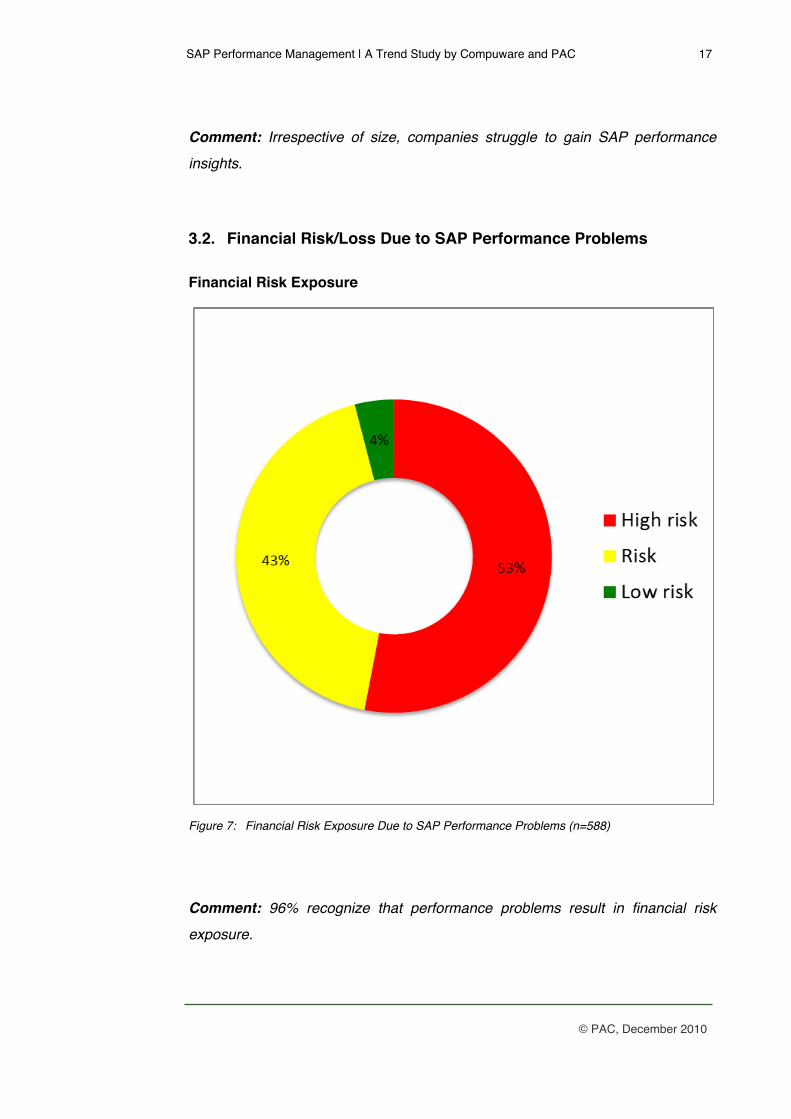
3.2. Financial Risk/Loss Due to SAP Performance Problems
Financial Risk Exposure
Figure 7: Financial Risk Exposure Due to SAP Performance Problems (n=588)
Comment: 96% recognize that performance problems result in financial risk
exposure.
SAP Performance Management | A Trend Study by Compuware and PAC 18
© PAC, December 2010
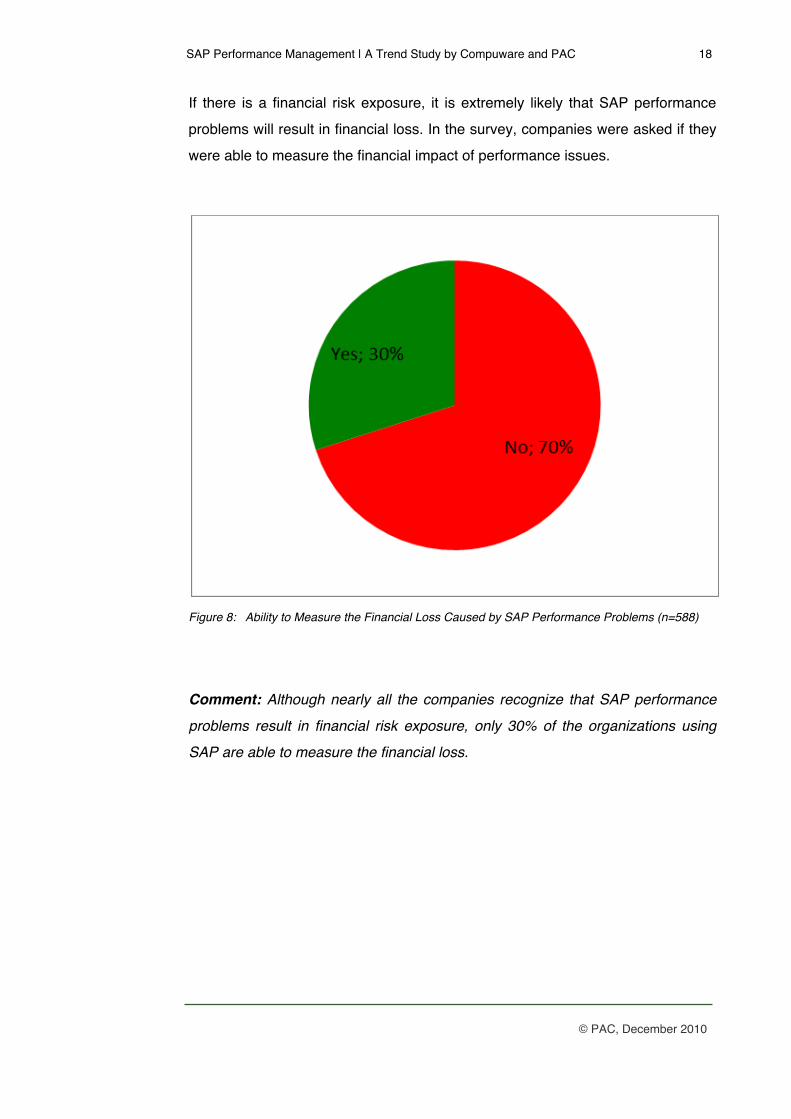
If there is a financial risk exposure, it is extremely likely that SAP performance
problems will result in financial loss. In the survey, companies were asked if they
were able to measure the financial impact of performance issues.
Figure 8: Ability to Measure the Financial Loss Caused by SAP Performance Problems (n=588)
Comment: Although nearly all the companies recognize that SAP performance
problems result in financial risk exposure, only 30% of the organizations using
SAP are able to measure the financial loss.
SAP Performance Management | A Trend Study by Compuware and PAC 19
© PAC, December 2010
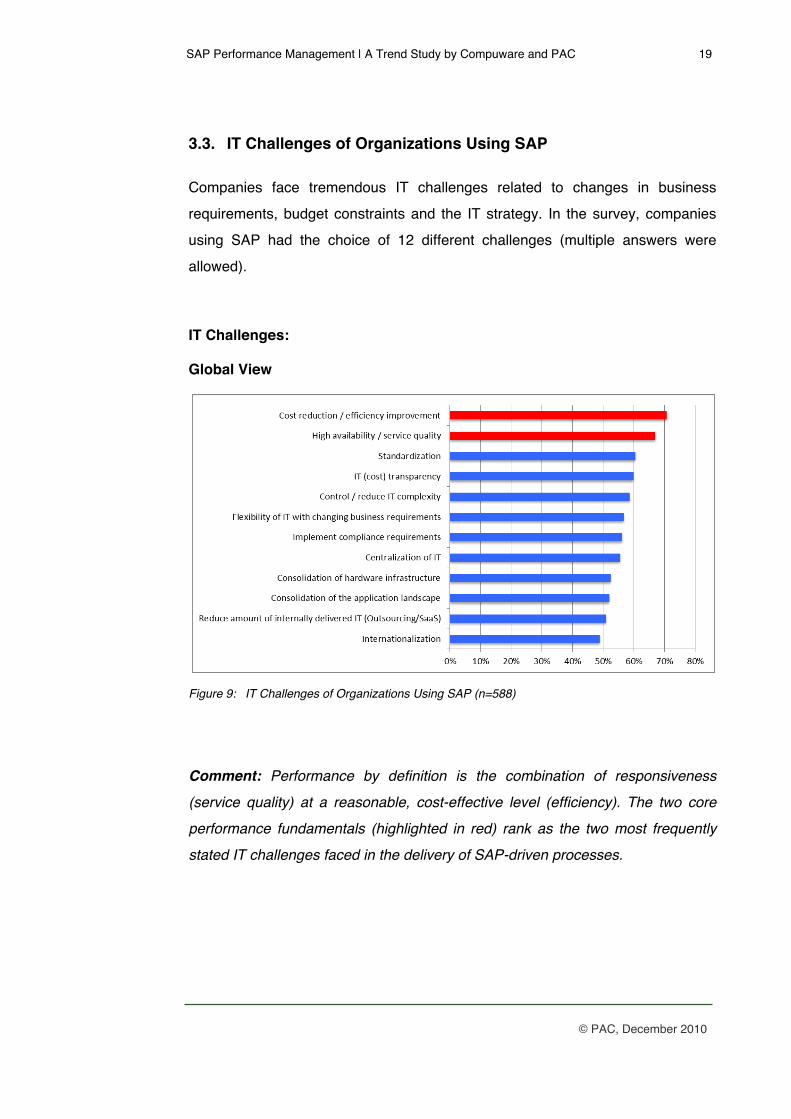
3.3. IT Challenges of Organizations Using SAP
Companies face tremendous IT challenges related to changes in business
requirements, budget constraints and the IT strategy. In the survey, companies
using SAP had the choice of 12 different challenges (multiple answers were
allowed).
IT Challenges:
Global View
Figure 9: IT Challenges of Organizations Using SAP (n=588)
Comment: Performance by definition is the combination of responsiveness
(service quality) at a reasonable, cost-effective level (efficiency). The two core
performance fundamentals (highlighted in red) rank as the two most frequently
stated IT challenges faced in the delivery of SAP-driven processes.
SAP Performance Management | A Trend Study by Compuware and PAC 20
© PAC, December 2010
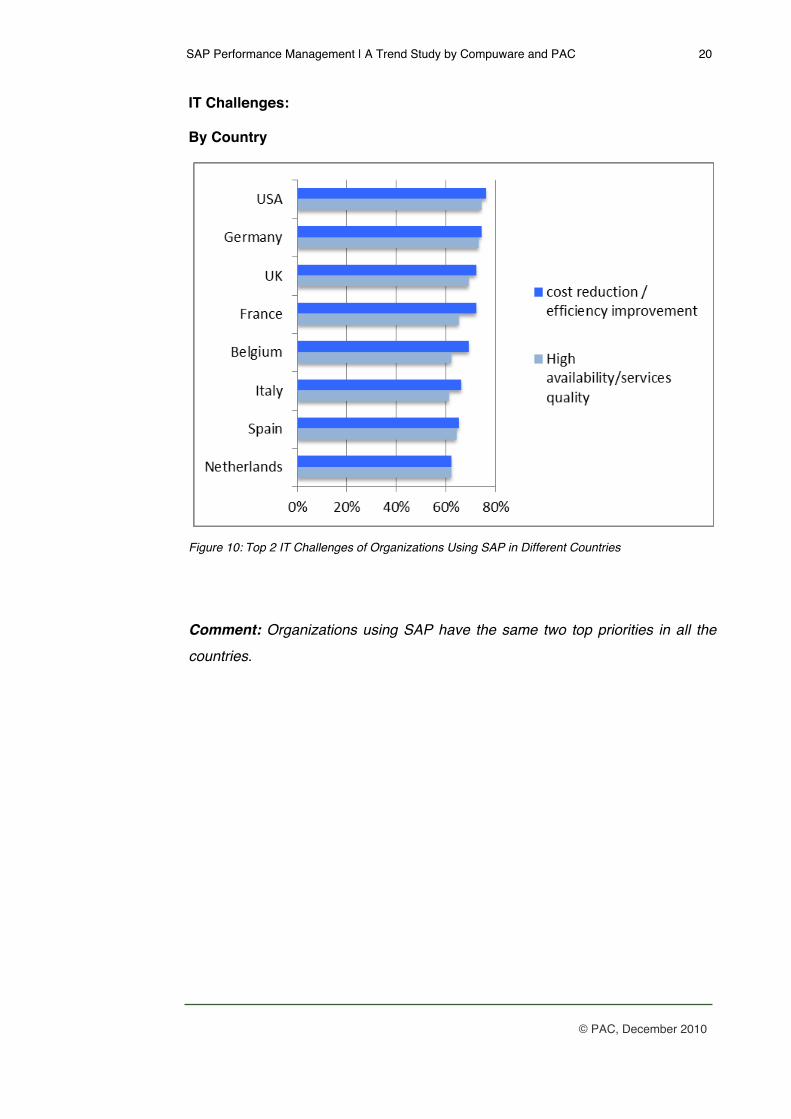
IT Challenges:
By Country
Figure 10: Top 2 IT Challenges of Organizations Using SAP in Different Countries
Comment: Organizations using SAP have the same two top priorities in all the
countries.
SAP Performance Management | A Trend Study by Compuware and PAC 21
© PAC, December 2010
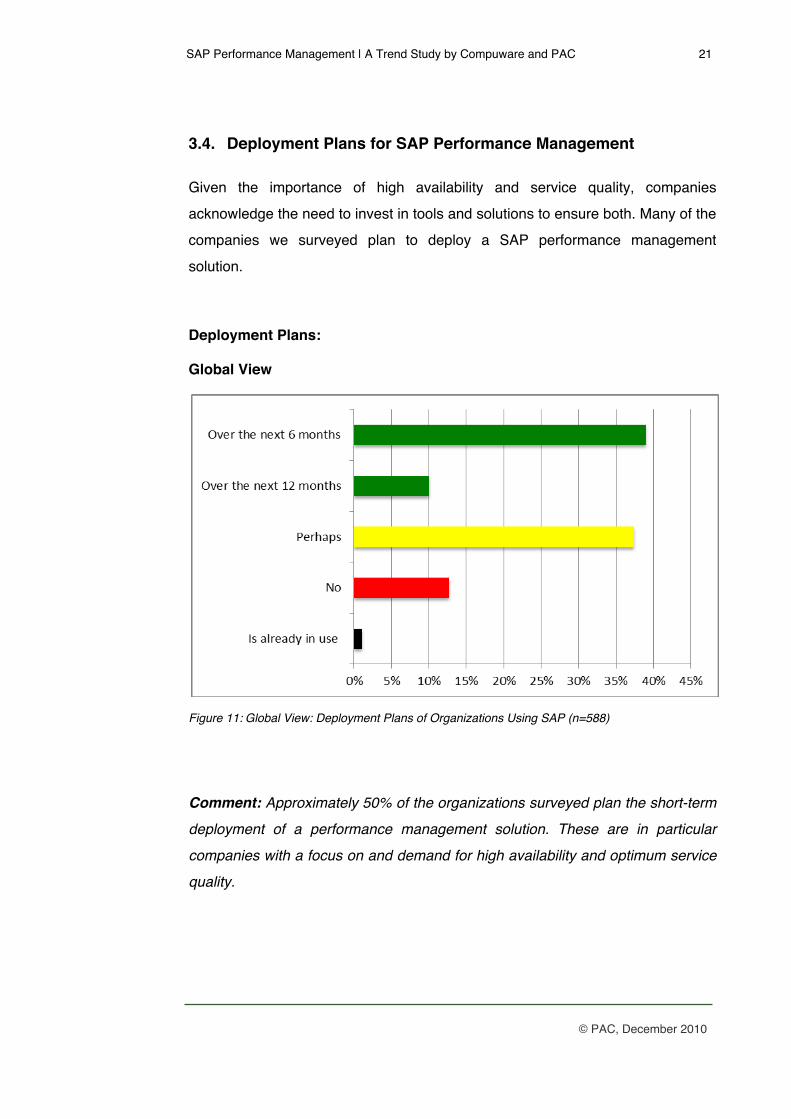
3.4. Deployment Plans for SAP Performance Management
Given the importance of high availability and service quality, companies
acknowledge the need to invest in tools and solutions to ensure both. Many of the
companies we surveyed plan to deploy a SAP performance management
solution.
Deployment Plans:
Global View
Figure 11: Global View: Deployment Plans of Organizations Using SAP (n=588)
Comment: Approximately 50% of the organizations surveyed plan the short-term
deployment of a performance management solution. These are in particular
companies with a focus on and demand for high availability and optimum service
quality.
SAP Performance Management | A Trend Study by Compuware and PAC 22
© PAC, December 2010
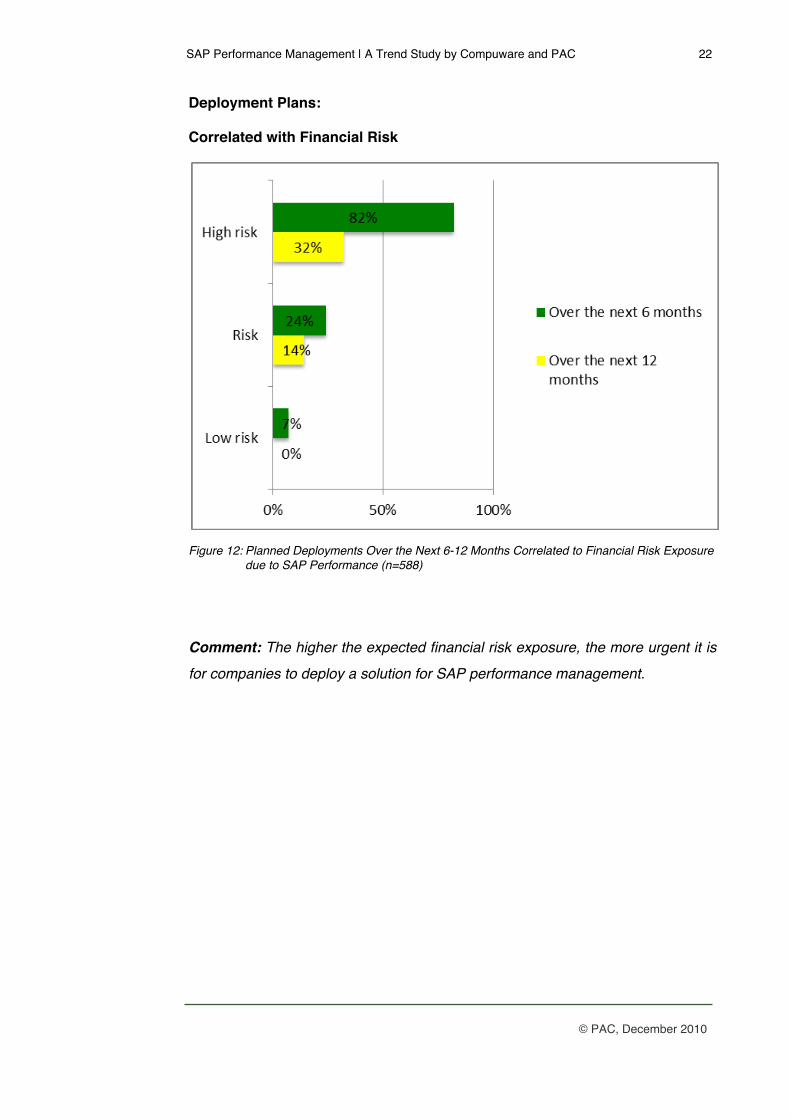
Deployment Plans:
Correlated with Financial Risk
Figure 12: Planned Deployments Over the Next 6-12 Months Correlated to Financial Risk Exposure
due to SAP Performance (n=588)
Comment: The higher the expected financial risk exposure, the more urgent it is
for companies to deploy a solution for SAP performance management.
SAP Performance Management | A Trend Study by Compuware and PAC 23
© PAC, December 2010
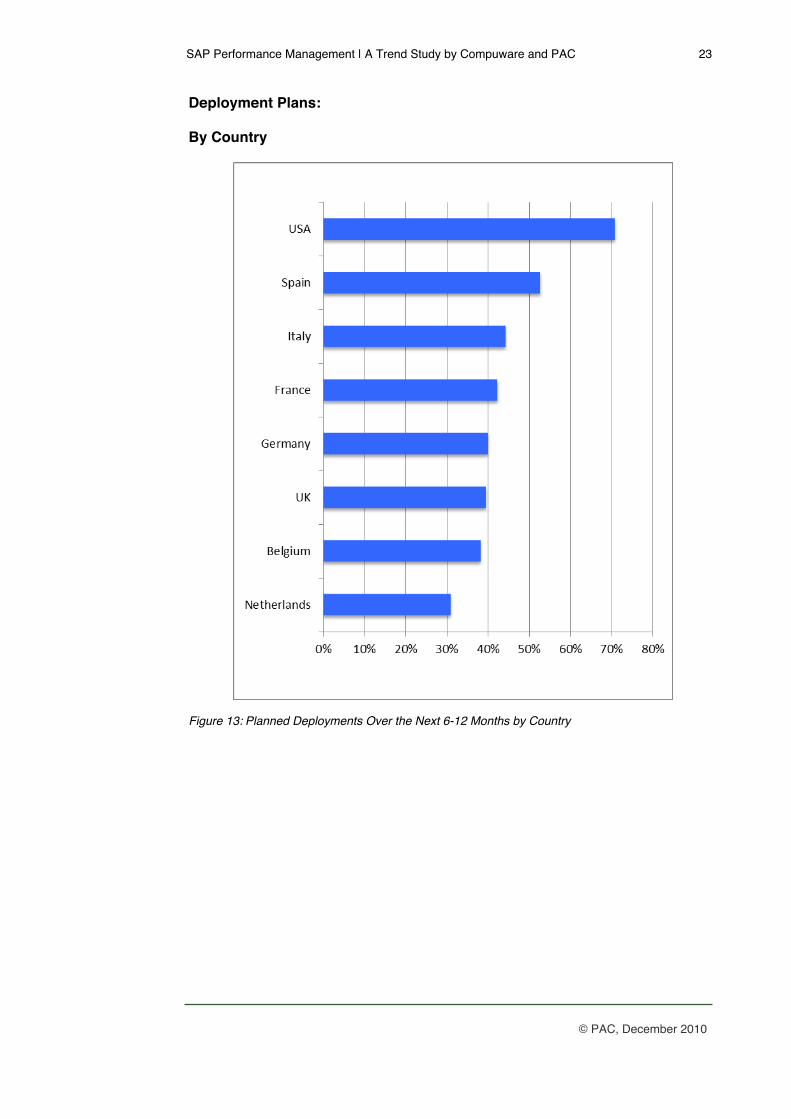
Deployment Plans:
By Country
Figure 13: Planned Deployments Over the Next 6-12 Months by Country
SAP Performance Management | A Trend Study by Compuware and PAC 24
© PAC, December 2010
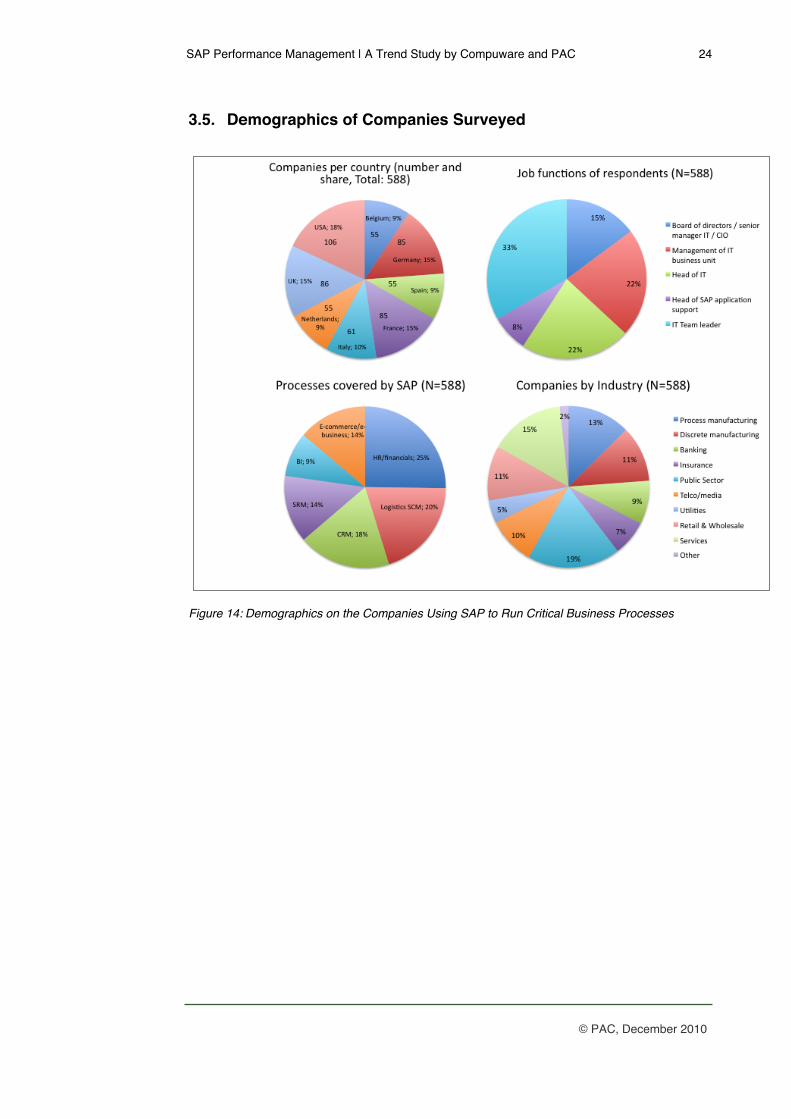
3.5. Demographics of Companies Surveyed
Figure 14: Demographics on the Companies Using SAP to Run Critical Business Processes
SAP Performance Management | A Trend Study by Compuware and PAC 25
© PAC, December 2010
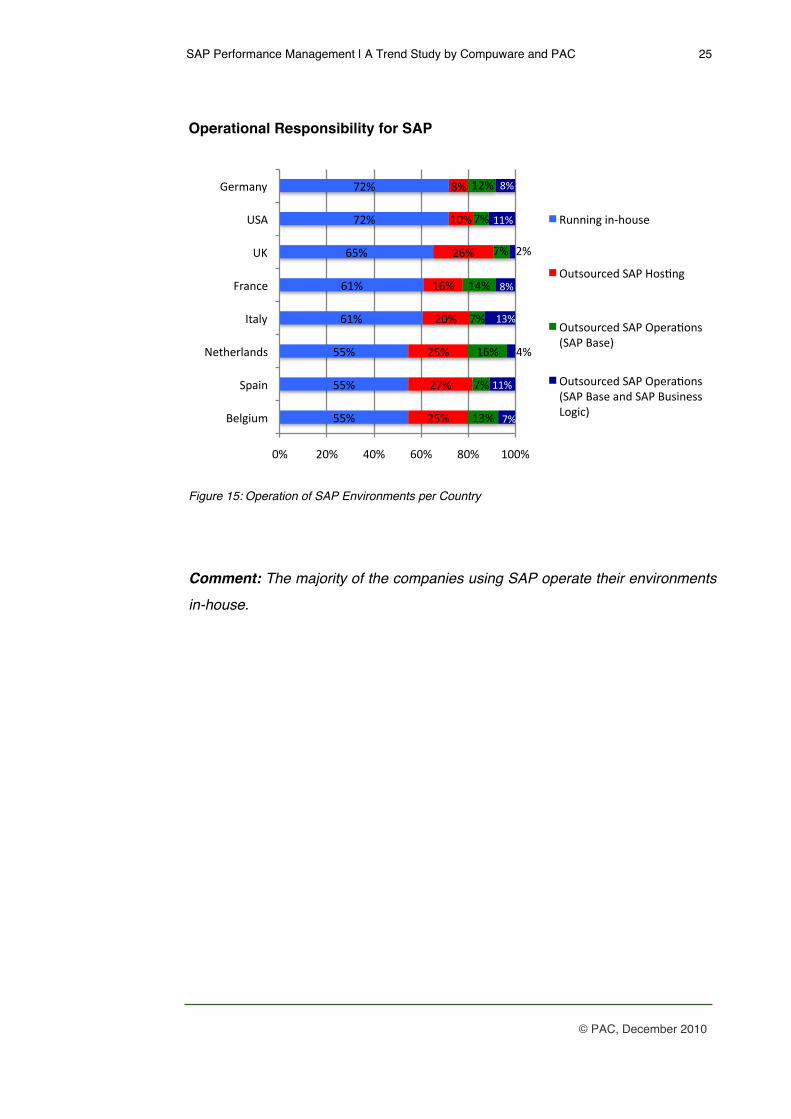
Operational Responsibility for SAP
Figure 15: Operation of SAP Environments per Country
Comment: The majority of the companies using SAP operate their environments
in-house.
!!"#
!!"#
!!"#
$%"#
$%"#
$!"#
&'"#
&'"#
'!"#
'&"#
'!"#
'("#
%$"#
'$"#
%("#
)"#
%*"#
&"#
%$"#
&"#
%+"#
&"#
&"#
%'"#
&"#
%%"#
+"#
%*"#
)"#
'"#
%%"#
)"#
("# '("# +("# $("# )("# %(("#
,-./012#
34506#
7-89-:.56;<#
=85.>#
?:56@-#
AB#
A3C#
D-:256>#
E16606/#06F9G1<-#
H18<G1:@-;#3CI#JG<K6/#
H18<G1:@-;#3CI#H4-:5KG6<#L3CI#,5<-M#
H18<G1:@-;#3CI#H4-:5KG6<#L3CI#,5<-#56;#3CI#,1<06-<<#NG/0@M#
SAP Performance Management | A Trend Study by Compuware and PAC 26
© PAC, December 2010
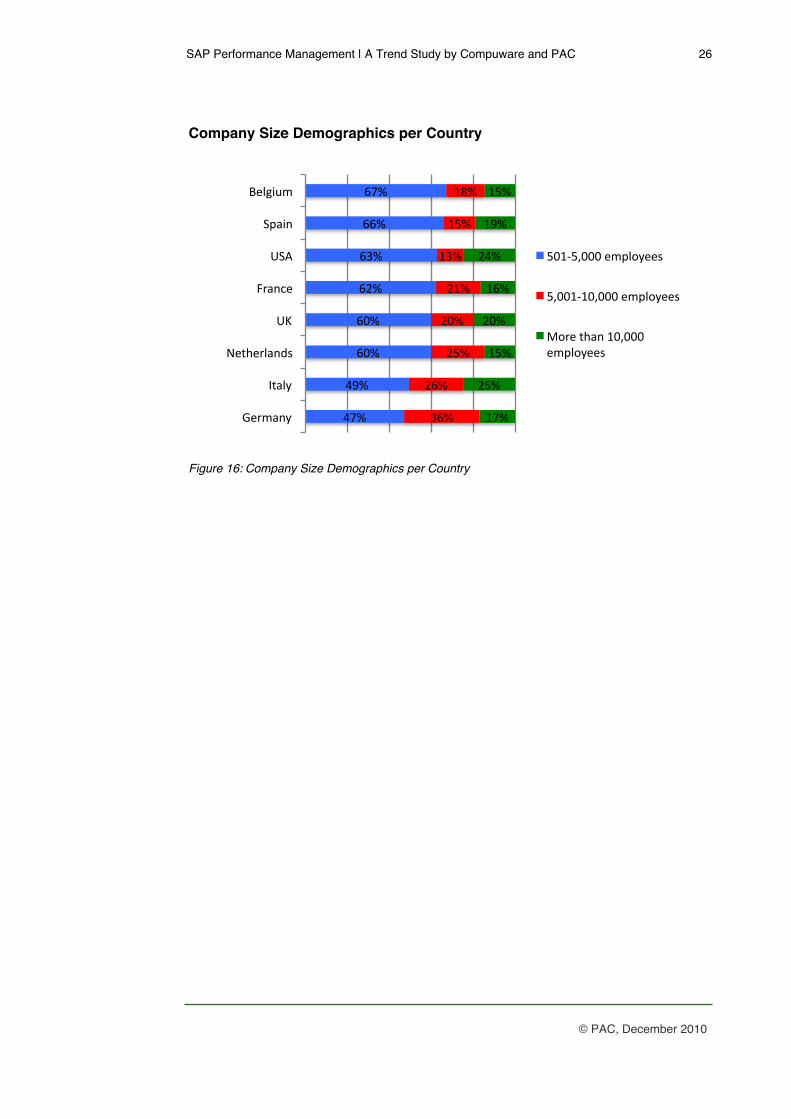
Company Size Demographics per Country
Figure 16: Company Size Demographics per Country
!"#$
!%#$
&'#$
&'#$
&(#$
&)#$
&&#$
&"#$
)&#$
(&#$
(*#$
('#$
(+#$
+)#$
+*#$
+,#$
+"#$
(*#$
+*#$
('#$
+&#$
(!#$
+%#$
+*#$
-./0123$
45163$
7.58./6129:$
;<$
=/12>.$
;?@$
?A1B2$
C.6DBE0$
*'+F*G'''$.0A6H3..:$
*G''+F+'G'''$.0A6H3..:$
IH/.$5812$+'G'''$.0A6H3..:$
SAP Performance Management | A Trend Study by Compuware and PAC 27
© PAC, December 2010
4. COMPUWARE VANTAGE
With Vantage, Compuware offers a solution that provides comprehensive
performance measurement ranging from the SAP front-end to the data center,
including SAP servers, portal servers and databases.
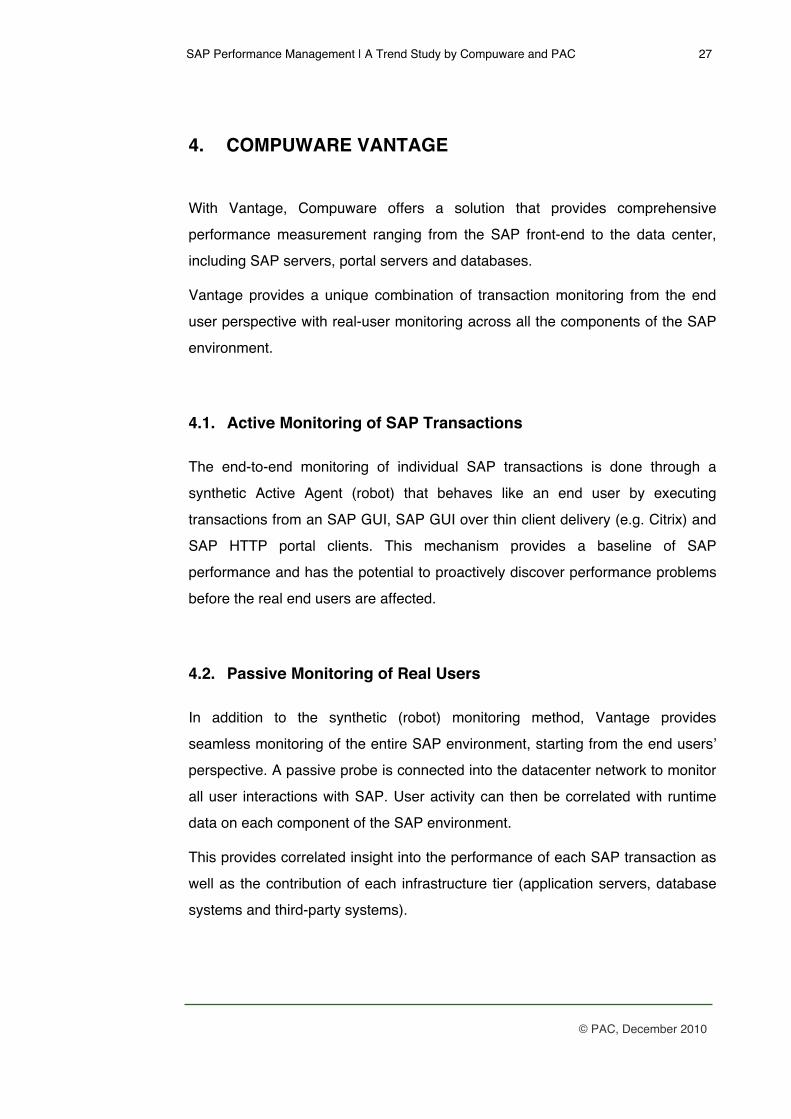
Vantage provides a unique combination of transaction monitoring from the end
user perspective with real-user monitoring across all the components of the SAP
environment.
4.1. Active Monitoring of SAP Transactions
The end-to-end monitoring of individual SAP transactions is done through a
synthetic Active Agent (robot) that behaves like an end user by executing
transactions from an SAP GUI, SAP GUI over thin client delivery (e.g. Citrix) and
SAP HTTP portal clients. This mechanism provides a baseline of SAP
performance and has the potential to proactively discover performance problems
before the real end users are affected.
4.2. Passive Monitoring of Real Users
In addition to the synthetic (robot) monitoring method, Vantage provides
seamless monitoring of the entire SAP environment, starting from the end usersʼ
perspective. A passive probe is connected into the datacenter network to monitor
all user interactions with SAP. User activity can then be correlated with runtime
data on each component of the SAP environment.
This provides correlated insight into the performance of each SAP transaction as
well as the contribution of each infrastructure tier (application servers, database
systems and third-party systems).
SAP Performance Management | A Trend Study by Compuware and PAC 28
© PAC, December 2010
Figure 17: Compuware Vantage Combines Active and Passive Methods to Monitor Transaction
Performance
4.3. SAP Solution Manager and Compuware Vantage
Compuware does not position Vantage as an alternative to SAPʼs Solution
Manager. Instead, it should be seen as a complementary solution, providing
performance management functionality that goes beyond the scope of SAP
Solution Manager.
SAPʼs Solution Manager can track system usage within an SAP environment,
whereas Vantageʼs monitoring approach described above non-intrusively
correlates SAP transaction performance to business services and users with the
added possibility to extend to non-SAP applications and integrated systems.
Therefore, SAP Solution Manager can coexist with Compuware Vantage.
SAP Performance Management | A Trend Study by Compuware and PAC 29
© PAC, December 2010
4.4. Six-step Approach to SAP Performance Management
The methodology recommended by Compuware to achieve efficient and holistic
performance management consists of the following six steps:
1. Visibility of the quality of services that is being delivered to the SAP end
users.
2. Prioritization of problems to determine which issues to tackle first, enabling
teams to fix and resolve problems faster.
3. Isolation of individual faults, which allows the team to quickly identify the
specific issue and determine where the problem resides: application server,
database, network or system resources.
4. Proactive prediction of problems by automatically correlating real-time
performance and usage demands to adaptive business baselines.
5. Communication at all levels of the organization by providing the right
information to the right people in a language they can understand.
6. Improvement and evolution of SAP business services through proactive
tuning and process optimization initiatives underpinned by built-in
methodology ( e.g. Six Sigma and ITIL).
SAP Performance Management | A Trend Study by Compuware and PAC 30
© PAC, December 2010
4.5. Visualizing and Reporting SAP Performance
Since an SAP solution runs core business processes within a company, IT
managers are not the only parties interested in SAP performance metrics relating
to process quality. Consequently, there is a need for line-of-business dashboards
for different stakeholders within a company.
Stakeholders are:
• Head of SAP application support
• Head of IT operations
• Business unit managers
• Service managers
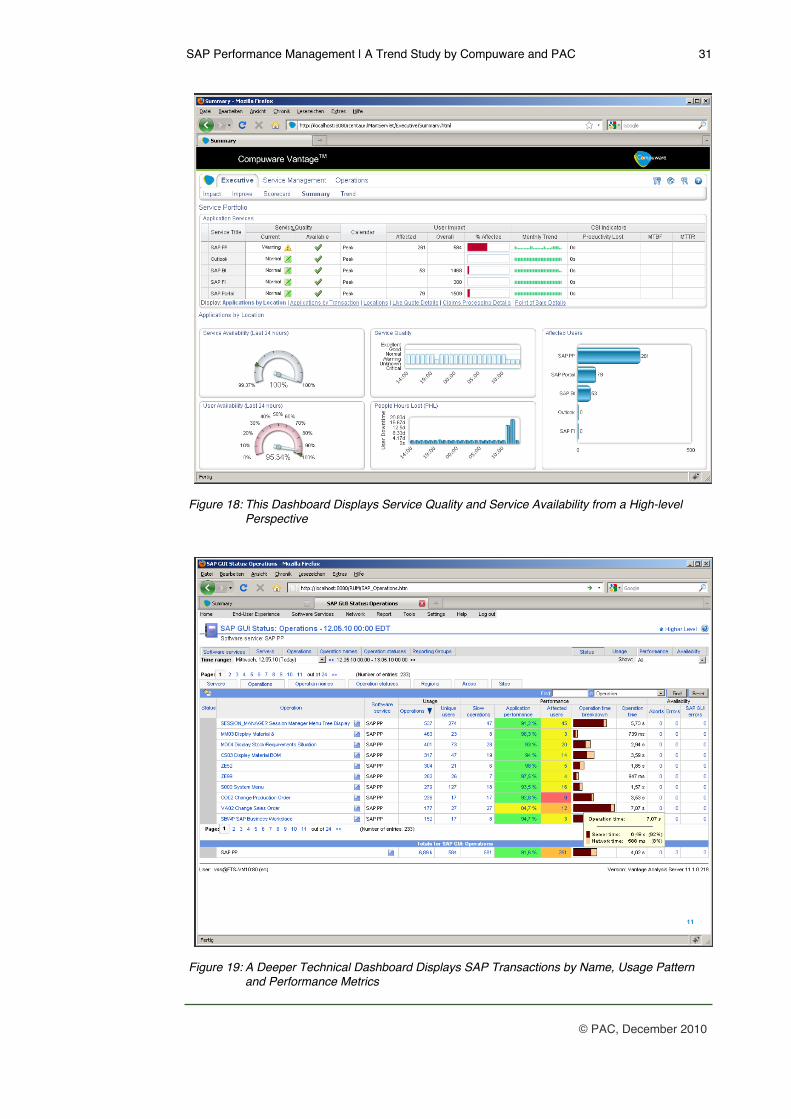
Compuware Vantage provides dashboards consisting of SAP performance and
availability metrics appropriate for key stakeholders. On the executive level,
service quality and service availability can be viewed with an abstraction from the
technical details. These dashboards also communicate business priority through
the reporting of the number of users affected by performance problems.
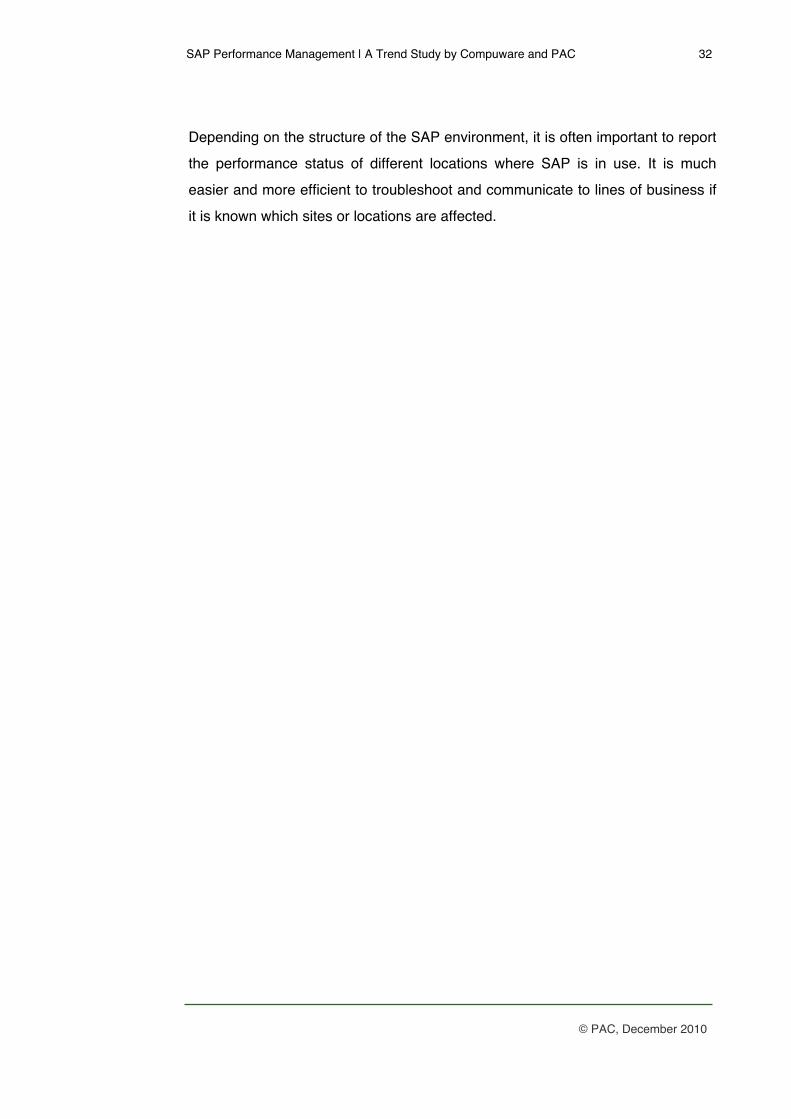
Experts responsible for SAP operations need to know in detail the root cause of a
performance problem. Vantage facilitates a further drill-down in order to isolate a
fault within the SAP infrastructure.
SAP Performance Management | A Trend Study by Compuware and PAC 31
© PAC, December 2010
Figure 18: This Dashboard Displays Service Quality and Service Availability from a High-level
Perspective
Figure 19: A Deeper Technical Dashboard Displays SAP Transactions by Name, Usage Pattern
and Performance Metrics
SAP Performance Management | A Trend Study by Compuware and PAC 32
© PAC, December 2010
Depending on the structure of the SAP environment, it is often important to report
the performance status of different locations where SAP is in use. It is much
easier and more efficient to troubleshoot and communicate to lines of business if
it is known which sites or locations are affected.
SAP Performance Management | A Trend Study by Compuware and PAC 33
© PAC, December 2010
5. COMPUWARE AND PAC COMPANY PROFILES
Compuware Corporation
Compuware Corporation, the technology performance company, provides
software, experts and best practices to ensure technology works well and
delivers value.
Compuware solutions make the worldʼs most important technologies perform at
their best for leading organizations worldwide, including 46 of the top 50 Fortune
500 companies and 12 of the top 20 most visited U.S. web sites.
Learn more at http://www.compuware.com.
About Pierre Audoin Consultants
PAC is a global market research and strategic consulting firm for the Software
and IT Services Industry (SITSI). PAC helps IT vendors, CIOs, consultancies and
investment firms by delivering analysis and advice to address a range of growth,
technology, financial and operational issues.
Our 30+-year heritage in Europe – combined with our US presence and
worldwide resources – forms the foundation of our ability to deliver in-depth
knowledge of local IT markets, anywhere. We employ structured methodologies –
undertaking thousands of annual face-to-face interviews on both the buy and sell
side of the market, as well as a bottom-up, top-down approach – to leverage our
research effectively.
PAC publishes a wide range of off-the-shelf and customized market reports –
including our best-selling SITSI® program – in addition to our suite of strategic
consulting and market planning services. 16 offices across all continents deliver
the insight that can make a difference to your business.
For more information, please visit our website at http://www.pac-online.com.