sars-cov regulates immune function-related gene ... · pathway network analysis ingenuity pathway...
TRANSCRIPT

SARS-CoV Regulates Immune Function-Related Gene Expressions in
Human Monocytic Cells
Wan-Chung(Wan-Jiung) Hu1, Yu-Ting Yen1, Sher Singh3 4, Chuan-Liang Kao2, Betty A.Wu-Hsieh1* * Corresponding author: [email protected] 1. Graduate Institute of Immunology, National Taiwan University College of Medicine 2. Department of Clinical Laboratory Sciences and Medical Biotechnology, National
Taiwan University College of Medicine
3. NTU Center for Genomic Medicine, National Taiwan University Hospital No.1 Jen-Ai Road, Section 1, Taipei 100, Taiwan ROC Fax 886-2-2321-7921 Phone 886-2-2321-7510
4. Present address: Department of Life Sciences, National Taiwan Normal University, No.162, He-Ping East Road, Section 1, Taipei 106, Taiwan ROC
Nat
ure
Pre
cedi
ngs
: hdl
:101
01/n
pre.
2011
.590
8.1
: Pos
ted
17 A
pr 2
011

2
Abstract Background: Severe Acute Respiratory Syndrome (SARS) is characterized by acute
respiratory distress (ARDS) and pulmonary fibrosis, and monocyte/macrophage is the
key player in the pathogenesis of SARS.
Methods: In this study, we compared the transcriptional profiles of SARS coronavirus
(SARS-CoV) infected monocytic cells against that infected by coronavirus 229E (CoV-
229E). Total RNA was extracted from infected DC-SIGN transfected monocytes (THP-1-
DC-SIGN) at 6 and 24 h after infection and the gene expression was profiled in
oligonucleotide-based microarray.
Results: Analysis of immune-related gene expression profiles showed that at 24 h after
SARS-CoV infection, (i) IFN-/-inducible and cathepsin/proteosome genes were down-
regulated; (ii) the hypoxia/hyperoxia-related genes were up-regulated; and (iii) the
TLR/TLR-signaling, cytokine/cytokine receptor-related, chemokine/chemokine receptor-
related, the lysosome-related, MHC/chaperon-related, and fibrosis-related genes were
differentially regulated.
Conclusion: These results elucidate that monocyte/macrophage dysfunction and
dysregulation of fibrosis-related genes are two important pathogenic events of SARS.
Nat
ure
Pre
cedi
ngs
: hdl
:101
01/n
pre.
2011
.590
8.1
: Pos
ted
17 A
pr 2
011
3
Background
During the months of November 2002 to July 2003, the outbreak of Severe Acute
Respiratory Syndrome (SARS) greatly impacted the public health around the world. A
total of 8096 cases and 774 deaths [1] were reported. About 20% of SARS patients
developed acute respiratory distress syndrome (ARDS) [2]. Chest X-rays revealed
bilateral diffuse consolidation in these patients [3]. Massive macrophage infiltration is a
prominent feature in the lung sections of patients who died of SARS [4]. SARS-CoV
infects human monocytes [5] and monocytic cells infected by SARS-CoV produce
chemokines that attract the migration of neutrophils, macrophages and activated T
lymphocytes [6]. Patients who recovered from SARS often suffered a sequel of
pulmonary fibrosis [7] and macrophages play a role in fibroblast accumulation [8]. Thus,
it is strongly indicated that immune response plays an important role in the pathogenesis
of SARS and that monocyte/macrophage is the key player in the immunopathogenesis of
SARS.
Microarray is a recently developed tool that is useful in revealing the host response to an
infectious agent at the genomic level. The microarray methodology has been used to
show immune cell gene expression profile after infections by Mycobacterium leprae,
CMV, HIV, E. coli, Chlamydia pneumoniae, and influenza virus H5N1 [9-14]. The gene
expression profile in the peripheral blood mononuclear cells of convalescent SARS
patients has been reported in a microarray study [15]. The molecular signature and
disease severity index thus identified are useful for the diagnosis and prognosis of SARS-
Nat
ure
Pre
cedi
ngs
: hdl
:101
01/n
pre.
2011
.590
8.1
: Pos
ted
17 A
pr 2
011

4
CoV infection if another SARS outbreak should occur [15]. However, the expression of
immune function-related genes in SARS-CoV-infected monocyte/macrophage has never
been revealed
In the present study, oligo-microarray was used to profile the expression of immune
function-related genes. We used DC-SIGN stably transfected monocytic THP-1 cells as
targets to model the alveolar environment, as it has been shown that interstitial alveolar
macrophages in the histologically normal adult lung tissue constitutively express DC-
SIGN [16]. The gene expression profile induced by SARS-CoV was compared to the
human coronavirus 229E (CoV-229E), a group I coronavirus that causes mild common
cold, of which the infectivity of DC-SIGN-transfected THP-1 cells is comparable to that
of SARS-CoV [6]. Since SARS-CoV induced chemokine gene expression in monocytic
cells peaks at as early as 24 h [6], we chose to study the gene expression profiles at both 6
and 24 h after infection. The results of the present study showed that after SARS-CoV
infection of monocytes, the expressions of (i) IFN--inducible and
cathepsin/proteosome genes were down-regulated; (ii) the hypoxia/hyperoxia-related
gene were up-regulated; and (iii) the TLR/TLR-signaling, cytokine/cytokine receptor-
related, chemokine/chemokine receptor-related, the lysosome-related, MHC/chaperon-
related, and fibrosis-related genes were differentially regulated.
Methods
Monocytic cell culture
Nat
ure
Pre
cedi
ngs
: hdl
:101
01/n
pre.
2011
.590
8.1
: Pos
ted
17 A
pr 2
011

5
The THP-1 cell line human monocytic cell line THP-1 stably transfected with DC-SIGN
(THP-1-DC-SIGN) was kindly provided by Dr. Vineet N. Kewal Ramani (Model
Development Section, HIV Drug Resistance Program, National Cancer Institute, National
Institute of Health). The cell line was maintained in RPMI1640 supplemented with 10%
heat-inactivated fetal bovine serum (FBS) in 5% CO2 at 37°C.
Virus infection
THP-1-DC-SIGN cells were seeded in 15ml culture tubes at a density of 1x10⁶ cells/ml.
Cells were left in medium or infected with SARS-CoV TW1 [17] or CoV-229E at 100-
fold 50% tissue culture infective doses (TCID50, titered in Vero E6 or MRC-5 cells,
respectively) and incubated for 6 or 24 h. At different time points after infection, cells
were harvested and culture supernatants were collected and stored at –70°C. For chip
hybridization assay, cell pellets were resuspended in TRIzol. Experiments that required
handling SARS-CoV were performed in the P3 facility in the National Taiwan University
College of Medicine. All procedures were performed according to the Centers for
Disease Control and Prevention P3 Biosafety Guidelines.
RNA extraction
Total RNA was extracted from un-infected, CoV-229E infected, and SARS-CoV infected
THP-1-DC-SIGN cells. After chloroform was added to each tube, samples were
centrifuged and RNA contents were isolated from the upper aqueous phase. Glycogen
and iso-propanol were added to precipitate the total RNA. After wash by 75% ethanol,
total RNA was spun down and stored in DEPC-water. The A260/A280 O.D. ratio of all
Nat
ure
Pre
cedi
ngs
: hdl
:101
01/n
pre.
2011
.590
8.1
: Pos
ted
17 A
pr 2
011

6
RNA samples were >1.800 as determined by nanodrop-spectrophotometer (NanoDrop
Technologies, Wilmington, DE, USA). Capillary RNA gel electrophoresis (Agilent Inc,
Palo Alto, CA) was performed to ensure that the total RNA samples had clear 18S and
28S ribosomal RNA bands.
Chip hybridization
Oligonucleotide-based microarrays, validated by the U.S. National Cancer Institute[18],
were provided by Compugen (Jamesburg, NJ) and printed by an OmniGrid arrayer (San
Carlos, CA). A total of 19,137 oligos was used in the microarrays. QIAgen (Valencia,
CA) RNA clean-up column containing DNase was used to further purify RNA samples.
Twenty μg of RNAs from SARS-CoV- and CoV-229E-infected DC-SIGN-THP-1 cells
and 40 μg of RNAs from uninfected controls were labeled with cyanine 3-dUTP(Cyt3)
and cyanine 5-dUTP(Cyt5), respectively. The Cyt3 and Cyt5 labeled samples were then
mixed with 1 μ1 of human Cot1-DNA(10μg/μl), polyA (8-10μg/μl) and yeast tRNA
(4μg/μl) each to block non-specific binding. The sample mixture was then denatured at
100C for 1 min. Twenty μl of 2X hybridization buffer (50% formamide, 10X SSC, and
0.2% SDS) was added onto each prehybridized slide. Hybridization was performed in a
humid chamber in a water bath at 42C overnight. Two arrays for both SARS-CoV and
CoV-229E for each time-point were obtained.
Image and Data analysis
After hybridization, the slides were scanned on a GenePix 4000A scanner (Axon
Instrument, Foster City, CA). The TIFF images were then analyzed by GenePix Pro
Nat
ure
Pre
cedi
ngs
: hdl
:101
01/n
pre.
2011
.590
8.1
: Pos
ted
17 A
pr 2
011

7
software and GPR files were generated. Signal dots were aligned with the grid first. The
signal dots that were too small were deleted. In the appearance of bubbles and severe
scratches in the slide image, the signal dots were considered invalid. A PMT gain of red
light (635nm) intensity and green light (532nm) intensity was adjusted according to the
following principles: First, a general normalization method was applied to ensure that the
ratio of total correct light intensity to green light intensity was equal to 1:1. Second, all
the housekeeping gene-glyceraldehyde-3-phosphate dehydrogenease (GAPDH) dots were
adjusted so they appear to be yellow, as GAPDH should not have been up- or down-
regulated. Microarray chip hybridization results for SARS-CoV and CoV-229E at 24h
time point are shown as Figure 1A and 1B, respectively. All the data were uploaded to
the US National Cancer Institute Microarray Website for data processing, transformation,
and annotation. The transformed numeral data, with gene annotations, were then
downloaded from the above website. Genes were highlighted when the average
expression ratios (Fold change) were >1.5 (>1.5-fold up-regulation (boldface) or <0.67
(>1.5-fold down-regulation ) (underlined boldface). When the intensity ratio was positive
from one replicate and negative from the other replicate, the images from the GPR files
were re-checked. If the dada were still inconsistent, they were excluded from further
analysis. Heatmap of microarray results is shown. (Figure 1)
Pathway network analysis
Ingenuity pathway analysis software was used to identify specific up-regulated or down-
regulated gene-to-gene network at 24h after SARS-CoV infection. Data including gene
name and fold change levels were input into the software. Genes which are immune
Nat
ure
Pre
cedi
ngs
: hdl
:101
01/n
pre.
2011
.590
8.1
: Pos
ted
17 A
pr 2
011

8
response related genes were selected in the pathway analysis. In this analysis, two major
immunological pathway networks were identified including IL-8 centered network and
proteasome-related gene network. (Figure 2)
Results
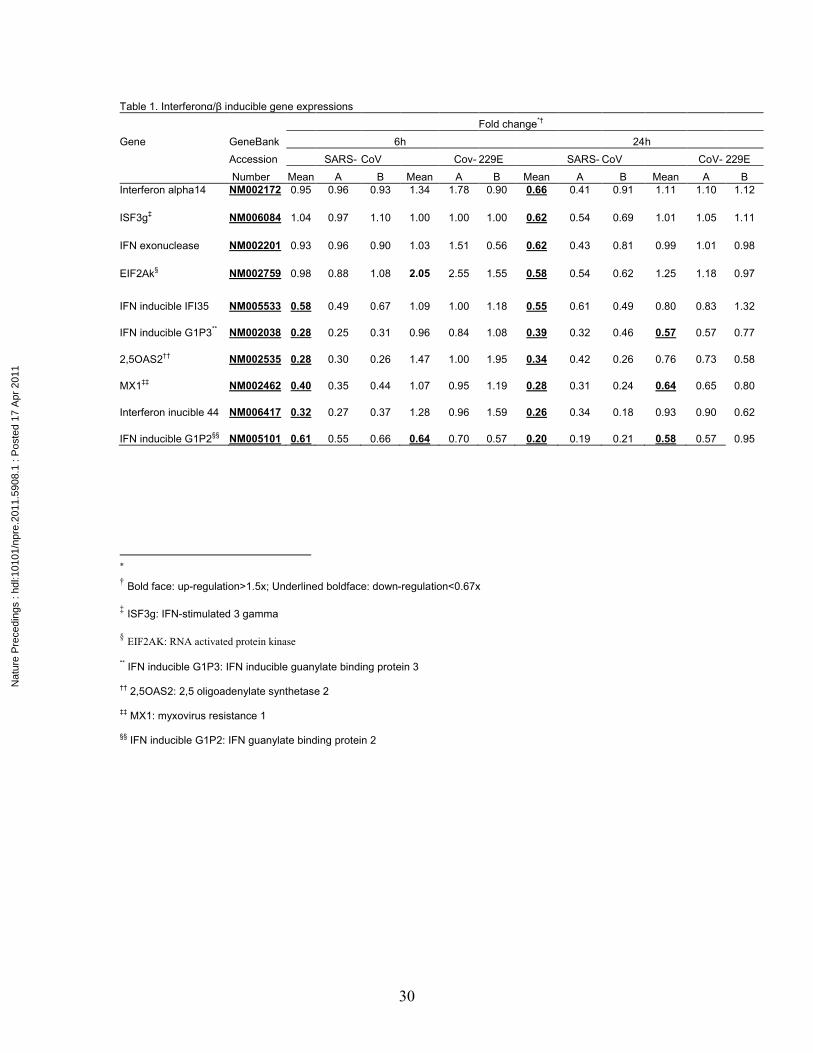
The expressions of IFN α/β inducible genes are down-regulated
IFN α/β is the first line of host defense against virus infection. The expressions of IFN
14, and RNA activated protein kinase, an enzyme that phosphorylates EIF2 to inhibit
cellular protein translation [19], were slightly up-regulated after CoV-229E infection at
both 6 h and remained up-regulated at 24 h, and IFN-inducible guanylate binding proteins
(GIP2 and GIP3) and IFN-inducible myxovirus resistance1 (MX1) were moderately
down-regulated at 24 h (Table 1) after infection. Interestingly, almost all interferon-
related genes were down-regulated by >1.5-fold in SARS-CoV infected monocytic cells
at 6 h (Table 1). These genes included IFN-induced protein 35 (IFI 35), IFN-inducible
G1Ps (GIP3 and GIP2), 2’, 5’ oligoadenylate synthetase 2 (2,5 OAS2), IFN-inducible
myxovirus resistance1 (MX1), and IFN-inducible protein 44. At 24 h after SARS-CoV
infection, more IFN-related genes were down-regulated and these IFN-related genes
included IFN-14, IFN-stimulated 3 gamma (ISGF3g), IFN-induced exonuclease, RNA
activated protein kinase (eukaryotic translation initiation factor 2 kinase, EIF2AK), in
addition to IFN-induced protein 35, G1Ps, 2,5 OAS2, MX1, and IFN--inducible protein
44. It is worth noting that IFN-inducible GIP3, 2,5 OAS2, MX1, and IFN--inducible
Nat
ure
Pre
cedi
ngs
: hdl
:101
01/n
pre.
2011
.590
8.1
: Pos
ted
17 A
pr 2
011

9
protein 44 were down-regulated by >2-fold at both 6 and 24h after SARS-CoV infection.
These results indicate that while CoV-229E induces IFN responses, SARS-CoV
infection of macrophages not only does not induce IFN response but also down
regulate IFN-related genes.
The expressions of Toll-like receptors and Toll-like receptor signaling molecules are
differentially regulated
Triggering Toll-like receptor-signaling pathway is important to the induction of innate
immune responses [20]. CoV-229E infection induced up-regulation of Toll-like receptor
adaptor molecule1 (TRIF 1) but most TLR-related genes remained unchanged (Table 2).
While only slight changes of most TLR-related genes were observed at 6 h after SARS-
CoV infection, both the negative regulator of Toll-like receptor signaling IRAK-M and
TLR7 were >2-fold up-regulated at 24 h. In the mean time, the downstream molecules of
Toll-like receptor pathway: MyD88, TRIF, and Toll pathway evolutional conservative
(SITPEC) were all down-regulated. The expressions of other Toll-like receptors,
including TLR5, TLR4, TLR2, and TLR9 remained unchanged. High expression of
IRAK-M and down-regulation of the downstream signal molecules suggest that although
TLR7 was up-regulated, the TLR downstream signals may not be transduced in SARS-
CoV infected monocytes.
The expressions of cytokines, receptors and signaling molecules are differentially
regulated
Nat
ure
Pre
cedi
ngs
: hdl
:101
01/n
pre.
2011
.590
8.1
: Pos
ted
17 A
pr 2
011

10
As cytokines are important immune mediators, we studied the cytokine, receptor and
signal molecule gene expressions in monocytes (Table 3). While the only change of gene
expression induced by CoV-229E infection was the down-regulation of IL-10R at 6 h
after infection, we observed that SARS-CoV induced the down-regulation of TNF
superfamily 14 (TNFSF14) and endoglin by >1.5-fold at 6 h after infection. At 24 h after
SARS-CoV infection, the genes that were up-regulated were TNF receptor 21 (TNFRSF
21), TNF-α inducible protein 1 (TNFAIP1), IL-10R and IFN- receptor 1 (IFN- R1).
Among them, the gene expression of TNF receptor 21 was up-regulated by >2-fold.
Nevertheless, other genes in the TNF superfamily including TNF receptor associated
factor 4 (TRAF4), TNF ligand family 10 (TRAIL), TNF receptor 1A (TNFRSF 1A), and
TNF family 14 (TNFSF14) and those in the TGF family, TGF-β 2 (TGFB2), TGF- β
induced 68KD (TGFB1 68 KD) and endoglin were >1.5-fold down-regulated by SARS-
CoV at 24 h after infection. Among them, endoglin was down-regulated by >2-fold.
Interestingly, even though IFN-γR1 was up-regulated, IFN-γ inducible adhesion
regulating molecule 1 (ADRM1) was down-regulated. Other cytokine-related genes such
as IL-6 receptor (IL-6R), cytokine-like factor1 (CLF1), IL-2 receptor-enhancing
thioredoxin, and IL-13 were all down-regulated.
The expressions of lysosome-related genes are differentially regulated
Lysosomal enzymes responsible for degrading foreign proteins are important to the
biological functions of macrophages [21]. While not much change was observed in the
Nat
ure
Pre
cedi
ngs
: hdl
:101
01/n
pre.
2011
.590
8.1
: Pos
ted
17 A
pr 2
011

11
expression of lysosome-related genes after 229E-CoV infection except ATPase 21KD
V0C and palmitoyl-protein thioesterase 1 (PPTE1), the expressions of GlcNAc
phosphotransferase (GlcNAcp) and lysosome-associated protein 4 alpha (LAMP4 alpha)
were down-regulated at 6 h after SARS-CoV infection (Table 4). At 24 h after SARS-
CoV infection, all but ATPaseV01 and glucosamine-6-sulfatase (G-6-S) lysosome-related
genes were down-regulated. These genes included GlcNAc phosphotransferase
(GlcNAcp), palmitoyl-protein thioesterase 2 (PPTE2), mannosidase, lysosome ATPase
subunits (14KDV1F, 16KDV0C, & 21KDV0C), lysosomal associated proteins (LAMP
4 and LAMP 5), adaptor-related protein complex 2, mu-1 subunit (AP2M1), and
prosaposin. It is worth noting that lysosome ATPase 21KDV0C and prosapsin were >2-
fold down-regulated at 24 h after SARS-CoV infection. These data demonstrated that
although the genes of lysosome-related enzymes were differentially regulated after
SARS-CoV infection, most of them were down-regulated. The results indicate that
SARS-CoV-infected monocytes lost the ability to degrade ingested proteins.
The expressions of genes of the cathepsin and proteasome family are down-
regulated
The cathepsins and proteosomes are directly involved in antigen processing in the MHC
class II and I pathways, respectively [22, 23]. While CoV-229E infection of monocytes
did not result in much change in the cathepsin and proteosome genes, SARS-CoV
infection induced down-regulation of all of them (Table 5). It was most apparent at 24 h
after infection, that cathepsins A, S, C, H, and D as well as proteosomes 4, 2, 26S
Nat
ure
Pre
cedi
ngs
: hdl
:101
01/n
pre.
2011
.590
8.1
: Pos
ted
17 A
pr 2
011

12
ATPase 4 (26s/A4), 9, activator 2, 3, activator 1, 26S non-ATPase8 (26s nA8), and 5
were all down-regulated >1.5-fold in which the changes of cathepsins H and D and
proteosomes activator 2, activator 1, 26s nA8 and 5 gene expressions were >2-fold.
These results show that the MHC class II and I antigen processing pathways are inhibited
in SARS-CoV infected monocytes.
The expressions of chaperon and MHC-related genes are differentially regulated
To further understand the regulation of genes that are directly involved in antigen
processing/presentation, chaperon and MHC-related genes were analyzed. Table 6 shows
that CoV-229E induced down-regulation of SEC61B and upregulation of X-box binding
protein 1, HSP70KD8, and calrecticulin genes at 6 h and upregulation of HSP70KD8 at
24 h after infection. The expressions of other chaperon and MHC-related genes remained
unchanged at either 6 or 24 h. SARS-CoV infection, however, induced upregulation of
cyclophilin G and chaperonin containing TCP1-7 and down-regulation of cyclphilin C,
X-box binding protein 1, and FK506 binding protein 10 at 6 h. By 24 h after SARS-CoV
infection, while cyclophilins D and G and heat shock factor 1 were up-regulated, most
chaperon and MHC-related genes were down-regulated. The down-regulated genes
included chaperonins (chaperoinin containing TCP16A, TCP1-7, valosin-containing
protein), HLA genes (HLA-B-associated transcript 2, HLA-HA1, HLA complex group 9,
X-box binding protein1), FK506 binding proteins (FK506 BP8, FK506 BP10), heat shock
proteins (activator of HSP90KD, HSP10KD1, HSP70KD8), cyclophilins (E, C, B), and
MHC transporters (BAP31, SEC61B, calreticulin). The expression profiles of cathepsins,
Nat
ure
Pre
cedi
ngs
: hdl
:101
01/n
pre.
2011
.590
8.1
: Pos
ted
17 A
pr 2
011

13
proteosomes, cheperons, and MHC-related molecules together strongly indicate that
antigen processing and presentation pathways are dysfunctional in SARS-CoV-infected
monocytes.
The expressions of chemokines, receptors and related genes are differentially
regulated
Given that recruitment of leukocytes to the site of inflammation is orchestrated by
chemokines [24], and ARDS is characterized by heavy infiltration of monocytes,
neutrophils, and fibroblasts to the lungs [25], we next examined the expression profile of
chemokine-related genes. While all chemokine-related genes except MIP-1/CCL3
(down-regulated at both 6 and 24 h) in the CoV-229E-infected cells remained unchanged,
many of them were up- or down-regulated in SARS-CoV-infected cells (Table 7). In fact,
at as early as 6 h after SARS-CoV infection, the down-regulation of MIP-1/CCL3,
prostaglandin D synthase (PGDS), RANTES/CCL5, and LTXC4 synthase genes were
already obvious. At 24 h after infection, those genes that were upregulated include major
basic protein homolog (MBPH), CXCL8/IL-8, hyaluronidase 3, PDGF receptor
(PDGFR, lelukotriene A4 (LTXA4) hydroxylase, and hyaluronan-mediated motility
receptor (RHMM). The expression of MBPH and CXCL8/IL-8 genes were >2-fold
higher than the control. Others like microsomal glutathione-S transferase (MGST2),
prostaglandin E synthase (PGEs), chemokine-like factor (CLF), GRO/CXCL3, MGST3,
MIP-1/CCL3, CCR9, RANTES/CCL5 and LTXC4 synthase were down-regulated.
Among them, the expressions of CCL3/MIP-1, CCR9, RANTES/CCL5 and LTXC4
Nat
ure
Pre
cedi
ngs
: hdl
:101
01/n
pre.
2011
.590
8.1
: Pos
ted
17 A
pr 2
011

14
synthase genes were >2-fold lower than the control. The upregulated genes (CXCL8/IL-8,
hyaluronidase 3, PDGF receptor alpha, LTXA hydroxylase) are known to recruit
monocytes, neutrophils, and fibroblasts which may explain the complication of ARDS in
SARS-CoV infection.
The expressions of fibrosis-related genes are differentially regulated
Pulmonary fibrosis resulting from lung injury is a serious complication of ARDS and
SARS. Thus, we examined whether fibrosis-related gene expression is changed after
SARS infection. Data in Table 8 show that while CoV-229E infection did not change the
gene expression profile except tissue inhibitor of metalloproteinase (TIMP1) and proline
2-oxoglutarate 4-dioxygenase (P4HA1) at 6 h. SARS-CoV infection induced up- and
down-regulation of fibrosis-related genes. The expression of proline 2-oxoglutarate 4-
dioxygenase (P4HA1), a key enzyme in collagen synthesis, was up-regulated at 6 h and
further increased at 24 h after SARS-CoV infection. The other genes that were
upregulated at 24 h include plasiminogen activator inhibitor type 2 (SERPINB2), matrix
metalloproteinase 28 (MMP28), A disintingrin and metalloproteinase domain 19 (ADAM
19). On the other hand, other fibrosis-related genes were down-regulated and these
include protein S, metalloproteinase 2 (MMP2), collagens XVIII1, and I2, spondin 2
(SPON2), procollagenlysin-2-oxoglutarate 5-dioxygenase 3 (PLOD3), metallopeptidase
with thrombospondin type 1 motif 4 (ADAMTS4), fibroblast growth factor 3 (FGF3),
tissue inhibitor of metalloproteinases 3 and 1 (TIMP3, TIMP1). The genes that were
down-regulated by >2-fold were FGF3, collagens XVIII1, and I2 and TMPs 1 and 3.
Nat
ure
Pre
cedi
ngs
: hdl
:101
01/n
pre.
2011
.590
8.1
: Pos
ted
17 A
pr 2
011

15
The regulation of fibrosis-related genes may help to explain the pathogenesis of ARDS
and pulmonary fibrosis in SARS-CoV infection.
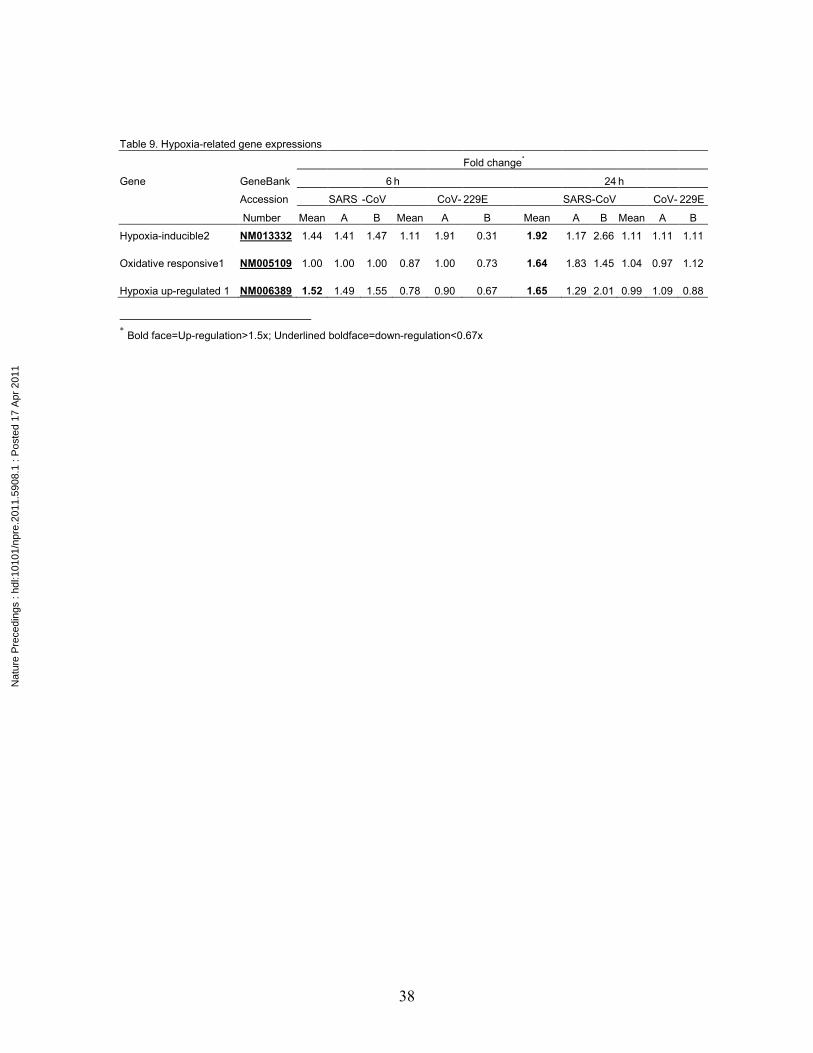
The expressions of oxygen stress-related genes are up-regulated
Change of oxygen tension is a source of stress. While CoV-229E infection did not
induce oxygen stress-related genes, SARS-CoV infection induced the up-regulation of
hypoxia-related genes at as early as 6 h and sustained until 24 h (Table 9). These were
hypoxia-inducible 2 and hypoxia up-regulated 1 genes. The oxidative responsive 1 gene
up-regulation was observed only at 24 but not at 6 h after infection. These results
demonstrate that SARS-CoV infection of monocytes creates a hypoxic environment,
which induces the expression of hypoxia-related genes.
Nat
ure
Pre
cedi
ngs
: hdl
:101
01/n
pre.
2011
.590
8.1
: Pos
ted
17 A
pr 2
011
16
Discussion
Monocytes play a key role in mediating inflammatory response in the lungs of SARS
patients [4]. Thus, the interaction between SARS-CoV and monocytes is important to the
outcome of the infection. How SARS-CoV regulates gene expression has been a subject
of interest. The peripheral blood mononuclear cells (PBMC) and monocyte gene
expression profiles were analyzed. A microarray analysis of PBMC of patients
recovering from SARS revealed that SARS-CoV infection causes a general suppression
of gene expression and induces the up-regulation of only several specific ESTs and
eosinophil-derived neurotoxins [15]. A different study showed that in contrast to CoV-
229E and influenza (H1N1) infections, interferon- signaling fails to occur in
macrophages after SARS-CoV infection [5]. The results of our study showed that most of
the IFN- inducible, lysosome-related, cathepsin/proteosome, and MHC/chaperon
genes are down-regulated, while the genes of which products play suppressive roles, i.e.
IRAK-M, and IL-10R are up-regulated. These results together indicate that SARS-CoV
infection causes macrophage dysfunction.
TLR-7 is amongst the few genes that are up-regulated by SARS-CoV (Table 2). TLR-7 is
recently shown to appear on the endosomal membrane and plays as an intracellular
receptor for single-stranded RNA(ssRNA) [20, 26]. It can distinguish cellular from viral
ssRNAs because the cellular RNAs contain a greater number of modified nucleotide
bases (m5C, m6A, m5U, and s2U) [27]. It has not been explored whether intracellular
TLR-7 binds the nucleic acid of SARS-CoV and triggers downstream signals. Our data
Nat
ure
Pre
cedi
ngs
: hdl
:101
01/n
pre.
2011
.590
8.1
: Pos
ted
17 A
pr 2
011

17
showing that SARS-CoV induces the up-regulation of TLR-7 and the negative signal
regulator IL-1 receptor associated kinase M (IRAK-M) and the down-regulation TLR
downstream signal molecules MyD88, Toll-like receptor adaptor molecule 1 (TRIF1),
and Toll pathway evolutional conservative (SITPEC) as well as most of the IFN-
inducible genes, demonstrate that even if TLR-7 binds to SARS-CoV nucleic acids its
downstream signaling is inhibited [28, 29]. It has been shown that Mycobacterium
tuberculosis binding to DC-SIGN on dendritic cells inhibits TLR signaling and thus
inhibits dendritic cell maturation [30]. It is, therefore, also possible that SARS-CoV
binding to DC-SIGN on THP-1-DC-SIGN monocytes inhibits the TLR signals as it has
been demonstrated in M. tuberculosis.
Cytokines are important immune mediators. SARS-CoV down-regulates most of the
TNF-related genes and up-regulates only TNF receptor 21 (TNFRSF 21) and TNF-α
inducible protein 1 (TNFAIP1) (Table 3). All the TGF-related genes are down-
regulated (Table 3). These findings are consistent with several previous studies
measuring cytokine response in SARS-CoV infected culture cells or SARS patients [31-
33]. In addition, while IL-10R and IFN- receptor 1 (IFN- R1) are up-regulated, IFN-γ
inducible adhesion-regulating molecule 1 (ADRM1) is down-regulated. Therefore,
although cytokine storm has been implicated as an important immune indicator for SARS,
our data show that macrophages are not a likely source
Lysosomal enzymes being responsible for digesting vesicular proteins in the lysosome
are important to the functions of monocytes and macrophages [34]. SARS-CoV infection
Nat
ure
Pre
cedi
ngs
: hdl
:101
01/n
pre.
2011
.590
8.1
: Pos
ted
17 A
pr 2
011

18
down-regulates most lysosomal enzymes including phosphotransferase (GlcNAcp),
thioesterase (PPTE2), mannosidase, and ATPase (14KDV1F, protein 1, 16KDV0C,
21KDV0C) (Table 4). Being professional antigen-presenting cells,
monocytes/macrophages process antigens through the activities of cathepsins and
proteasomes and present antigens via chaperon/MHC molecules [35]. It is interesting
that SARS-CoV infection down-regulates all the cathepsin and proteasome genes and
most of the chaperon/MHC genes (Tables 4, 5 and 6) and that most of these down-
regulated genes in the proteosome family are directly or indirectly interrelated (Figure 2)
seemingly rendering the monocyte/macrophage unable to process and present antigens.
Thus, it appears that by down-regulating the genes that are important to antigen
processing and presentation, SARS-CoV suppresses the primary functions of
monocyte/macrophage. Since interferon up-regulates MHC related genes, the down-
regulation of interferon genes could be partially responsible for the down-regulation
of MHC-related genes [19]. It is our speculation that by suppressing the antigen-
processing and presentation functions of monocyte/macrophage, SARS-CoV delays
specific T cell activation and thus delays its own clearance.
The clinical picture of SARS is characterized by pulmonary cellular infiltration and lung
consolidation [1]. We have demonstrated infiltration of neutrophils, macrophages and T
lymphocytes in the lungs of SARS-CoV-infected patient during early phase of infection
(Yen 2006 JVI) and CXCL8/IL-8 was produced by SARS-CoV-infected monocytes. The
results of microarray analysis in this study showed that in addition to CXCL8/IL-8 and
major basic protein homolog (MBPH), is up-regulated by >2–fold (Table 7). Pathway
Nat
ure
Pre
cedi
ngs
: hdl
:101
01/n
pre.
2011
.590
8.1
: Pos
ted
17 A
pr 2
011

19
network analysis showed many genes that up-regulate CXCL8/IL-8 were up-regulated
after SARS-CoV infection (Figure 2). These include C/EBP delta, CD14, complement
C3, and major basic protein homologue PRG3 [36-39]. A previous study demonstrated
that C/EBP delta can substitute for IL-17 to induce neutrophil activation and
accumulation [40]. Interestingly, alanyl aminopeptidase (ANPEP, Figure 2) which is
known to suppress IL-8 expression [41] was down regulated after SARS-CoV infection.
Taken together, SARS-CoV infection induces the up-regulation of the genes that up-
regulate and the down-regulation of the gene that suppresses CXCL8/IL-8, showing that
inducing neutrophil migration and activation is an important event in SARS-CoV-
infection.
The anti-inflammatory high-molecular mass-hyaluronan is known to be a protective
factor against acute lung injury [42]. Hyaluronidase degrades high-molecule-mass
hyaluronan to hyaluronan fragments [43]. In patients with acute lung injury the
hyaluronan fragments are increased [42]. Through the hyaluronan-mediated motility
receptor (RHMM), hyaluronan fragments mediate macrophage and neutrophil migration,
increase the phagocytic function of neutrophils [44] and macrophage CXCL8/IL-8
production [45]. Interestingly, SARS-CoV infection induces the up-regulation of
hyaluronidase 3, and the receptor for hyaluronan-mediated motility (RHMM) (Table 7).
We speculate that through the activity of hyaluonidase 3 and increased RHMM
expression, more hyaluronan fragments are produced which contribute to the increase of
neutrophil and monocyte infiltration and functions.
Nat
ure
Pre
cedi
ngs
: hdl
:101
01/n
pre.
2011
.590
8.1
: Pos
ted
17 A
pr 2
011

20
The relationship between leukotriene and lung fibrosis has been demonstrated in mice
deficient in 5-lipoxygenase knockout mice. The knockout mice which are deficient in
leukotriene are protected from lung fibrosis induced by bleomycin ([46]. No increase of
inflammatory cells in the lungs was noted in the knockout mice in contrast to wild-type
mice which have abundant leukocytes. Leukotriene A4 (LTXA4) hydroxylase catalyses
the production of leukotiene B4 from leukotriene A4 while leukotriene C4 (LTXC4)
synthases mediates the production of leukotriene C4 from leukotriene A4 [47, 48]. Our
results showing down-regulation of LTXC4 synthases (LTXC4 synthase, microsomal
glutathione-S-transferase2, microsomal glutathione-S-transferase3) and up-regulation of
LTXA4 hydroxylase (Table 7) indicate that there is increased leukotriene B4
accumulation after SARS-CoV infection. Therefore, leukontriene B4, a potent
chemoattractant for neutrophils [49], could also be accounted for the increase of
neutrophil migration in the lungs.
Prostaglandin E (PGE) is commonly used as a treatment for ARDS [50]. PGE2 inhibits
fibroblast proliferation, collagen synthesis and fibroblast chemotaxis [51]. In
cycloxygenase-2-deficient mice, the severity of intratracheal bleomycin-induced lung
fibrosis is increased due to PGE2 reduction [52]. It is worth noting that both
prostaglandin E and prostaglandin D synthetases (PGES and PGDS) are down-regulated
in SARS-CoV infected cells (Table 7) implying the PGE2 level is reduced in SARS
patients which may contribute to lung fibrosis. Platelet-derived growth factor (PDGF) is a
major fibroblast mitogen [53] . It also serves as a chemoattractant for neutrophils,
monocytes, and fibroblasts [54]. Therefore, up-regulation of PDGF receptor by SARS-
Nat
ure
Pre
cedi
ngs
: hdl
:101
01/n
pre.
2011
.590
8.1
: Pos
ted
17 A
pr 2
011
21
CoV (Table 7) through PDGF signaling would result in fibroblast proliferation,
neutrophil and monocyte infiltration and worsened lung fibrosis [55].
Lung fibrosis is a squeal of severe acute pulmonary disease [7]. It is thus of interest to
understand how SARS-CoV affects the expression of fibrosis-related genes. A previous
study revealed that collagen III is up-regulated in ARDS and its levels are related to poor
prognosis [56]. Proline 2-oxoglutarate 4-dioxygenase (P4HA1), a key enzyme in
collagen synthesis is up-regulated but collagen I2 and collagen XVIII1 are down-
regulated by SARS-CoV infection (Table 8). Studies have also shown that tissue
inhibitors of metalloproteinases (TIMP) deficiency or TIMP/MMP (Matrix
metalloproteinase) imbalance contributes to [57, 58] and plasminogen activator inhibitor
(SERPINB2) deficiency protects against pulmonary fibrosis [59]. Fibrinolytic proteins
are protective against lung fibrosis [60]. SARS-CoV infection up-regulates proteinases:
matrix metalloproteinase 28 (MMP28), A disintegrin and metalloproteinase domain 19
(ADM19), and plasminogen activator inhibitor (SERPINB2) and down-regulates tissue
inhibitors of metalloproteinases 1 and 3 (TIMP1 and TIMP3) and fibrinolytic protein
(protein S) (Table 8). Our data showing the up- and down-regulation of fibrosis-related
genes provide the molecular basis of the clinical presentation of pulmonary fibrosis in
SARS.
Conclusion
In summary, our study of the gene profiles in macrophages after SARS-CoV infection
show that the expressions of (i) IFN--inducible and cathepsin/proteosome genes are
Nat
ure
Pre
cedi
ngs
: hdl
:101
01/n
pre.
2011
.590
8.1
: Pos
ted
17 A
pr 2
011

22
down-regulated; (ii) the hypoxia/heperoxia-related gene are up-regulated; and (iii) the
TLR/TLR-signaling, cytokine/cytokine receptor-related, chemokine/chemokine receptor-
related, the lysosome-related, MHC/chaperon-related, and fibrosis-related genes are
differentially regulated. These results demonstrate that SARS-CoV infection causes
monocyte/macrophage dysfunction and induces pulmonary fibrosis both of which are
important in the pathogenesis of SARS.
List of Abbreviations:
ADAMTS4: metallopeptidase with thrombospondin type 1 motif 4; ADRM1: adhesion
regulating molecule 1; AP2M1: adaptor-related protein complex 2,mu-1 subunit; ARDS:
acute respiratory distress syndrome; CLF1: cytokine-like factor 1; CMV:
cytomegalovirus; CoV-229E: coronavirus 229E; E. coli: Escherichia coli; EIF2:
eukaryotic translation initiation factor 2; FGF3: fibroblast growth factor 3; FK506BP:
FK506 binding protein; GIP: interferon inducible guanylate binding protein; GlcNAcp:
GlcNAc phosphotransferase; G-6-S: glucosamine-6-sulfatase; HIV: human
immunodeficiency virus; HLA: human leukocyte antigen; HSP: heat shock protein; IFN:
interferon; IRAK: serine/threonine innate immunity kinase; ISGF3G: interferon
stimulated 3 gamma; LAMP: lysosomal associated protein; LTXA4: leukotriene A4;
LTXC4: leukotriene C4;MBPH: major basic protein homolog; MGST: microsomal
glutathione-S transferase; MHC: major histocompatibility complex; MMP:
metalloproteinase; MX1: interferon inducible myxovirus resistance 1; OAS:
oligoadenylate synthetase; PGDS: prostaglandin D synthase; PGES: prostaglandin E
synthase; PLOD3: procollagenlysin-2-oxoglutarate 5-dioxygenase 3; PPTE1: palmitoyl-
Nat
ure
Pre
cedi
ngs
: hdl
:101
01/n
pre.
2011
.590
8.1
: Pos
ted
17 A
pr 2
011

23
protein thioesterase 1; P4HA1: proline 2-oxoglutarate 4-dioxygenase; RHMM:
hyaluronan-mediated motility receptor; SARS: severe acute respiratory syndrome;
SARS-CoV: SARS coronavirus; SERPINB2: plasminogen activator inhibitor type2;
SITPEC: Toll pathway evolutional conservative; SPON2: spondin 2; TIMP: tissue
inhibitor of metalloproteinase; TLR: Toll-like receptor; TGFB1 68KD: TGF beta induced
68KD; TNFAIP1: TNF alpha inducible protein1; TNFRSF1A: TNF receptor 1A;
TNFRSF21: TNF receptor 21; TNFSF14: TNF family 14; TRAF4: TNF receptor
associated factor 4; TRAIL: TNF ligand family 10; TRIF1: Toll-like receptor adaptor
molecule 1
Competing interests
This study is funded by National Science Council of Taiwan government. There are no
financial competing interests or non-financial competing interests in this research.
Author’s contributions
WJ Hu carried out monocytic cell culture, total RNA extraction, chip hybridization
preparation, and data analysis with interpretation. He also helps in the study design and to
draft this manuscript. YT Yen performed the SARS-CoV infection on THP-1 monocytic
cell lines. S Singh participated in the data analysis and network graphing. CL Kao kindly
provided coronavirus 229E and SARS-CoV with estimated virus titer. BA Wu-Hsieh
designed this study and she is also the coordinator, sponsor, and corresponding author of
this research. All authors read and approved the final manuscript.
Nat
ure
Pre
cedi
ngs
: hdl
:101
01/n
pre.
2011
.590
8.1
: Pos
ted
17 A
pr 2
011

24
About the author
Wan-Jiung Hu is a MD from National Taiwan University and PhD from vaccine science
track of Department of International Health of Johns Hopkins University. His PhD thesis
is using microarray analysis to study the complicated host immune response against
malarial infection. This SARS-microarray paper was finished in Graduate Institute of
Immunology of National Taiwan University when Wan-Jiung was served as an exchange
student during 2005-2006. His first author paper is entitled “Common and divergent
immune response signaling pathways discovered in peripheral blood mononuclear cell
gene expression patterns in presymptomatic and clinically apparent malaria” published in
Infection and Immunity in October 2006. Now, Wan-Jiung Hu is doing a postdoc
research about cancer immunotherapy in Genomic Research Center of Academia Sinica
of Taiwan.
Acknowledgements
The authors are grateful to Mong-Hsien Tsai, Chang-Hsui Sun, Hang-Ni Lee, Hsang-Un
Hsiao, Hsin-Yi Chang, and Hui-Zhu Yang and personnel in the Biosafty Level 3
Laboratory in the National Taiwan University Hospital and National Taiwan University
College of Medicine for their technical assistance.
References 1. Skowronski DM, Astell C, Brunham RC, Low DE, Petric M, Roper RL, Talbot PJ,
Tam T, Babiuk L: Severe acute respiratory syndrome (SARS): a year in review. Annu Rev Med 2005, 56:357-381.
Nat
ure
Pre
cedi
ngs
: hdl
:101
01/n
pre.
2011
.590
8.1
: Pos
ted
17 A
pr 2
011
25
2. Peiris JS, Chu CM, Cheng VC, Chan KS, Hung IF, Poon LL, Law KI, Tang BS, Hon TY, Chan CS, et al: Clinical progression and viral load in a community outbreak of coronavirus-associated SARS pneumonia: a prospective study. Lancet 2003, 361:1767-1772.
3. Grinblat L, Shulman H, Glickman A, Matukas L, Paul N: Severe acute respiratory syndrome: radiographic review of 40 probable cases in Toronto, Canada. Radiology 2003, 228:802-809.
4. Nicholls JM, Poon LL, Lee KC, Ng WF, Lai ST, Leung CY, Chu CM, Hui PK, Mak KL, Lim W, et al: Lung pathology of fatal severe acute respiratory syndrome. Lancet 2003, 361:1773-1778.
5. Cheung CY, Poon LL, Ng IH, Luk W, Sia SF, Wu MH, Chan KH, Yuen KY, Gordon S, Guan Y, Peiris JS: Cytokine responses in severe acute respiratory syndrome coronavirus-infected macrophages in vitro: possible relevance to pathogenesis. J Virol 2005, 79:7819-7826.
6. Yen YT, Liao F, Hsiao CH, Kao CL, Chen YC, Wu-Hsieh BA: Modeling the early events of severe acute respiratory syndrome coronavirus infection in vitro. J Virol 2006, 80:2684-2693.
7. Antonio GE, Wong KT, Hui DS, Wu A, Lee N, Yuen EH, Leung CB, Rainer TH, Cameron P, Chung SS, et al: Thin-section CT in patients with severe acute respiratory syndrome following hospital discharge: preliminary experience. Radiology 2003, 228:810-815.
8. Lau YL, Peiris JS: Pathogenesis of severe acute respiratory syndrome. Curr Opin Immunol 2005, 17:404-410.
9. Zhu H, Cong JP, Mamtora G, Gingeras T, Shenk T: Cellular gene expression altered by human cytomegalovirus: global monitoring with oligonucleotide arrays. Proc Natl Acad Sci U S A 1998, 95:14470-14475.
10. Bleharski JR, Li H, Meinken C, Graeber TG, Ochoa MT, Yamamura M, Burdick A, Sarno EN, Wagner M, Rollinghoff M, et al: Use of genetic profiling in leprosy to discriminate clinical forms of the disease. Science 2003, 301:1527-1530.
11. van 't Wout AB, Lehrman GK, Mikheeva SA, O'Keeffe GC, Katze MG, Bumgarner RE, Geiss GK, Mullins JI: Cellular gene expression upon human immunodeficiency virus type 1 infection of CD4(+)-T-cell lines. J Virol 2003, 77:1392-1402.
12. Cheung CY, Poon LL, Lau AS, Luk W, Lau YL, Shortridge KF, Gordon S, Guan Y, Peiris JS: Induction of proinflammatory cytokines in human macrophages by influenza A (H5N1) viruses: a mechanism for the unusual severity of human disease? Lancet 2002, 360:1831-1837.
13. Eickhoff M, Thalmann J, Hess S, Martin M, Laue T, Kruppa J, Brandes G, Klos A: Host cell responses to Chlamydia pneumoniae in gamma interferon-induced persistence overlap those of productive infection and are linked to genes involved in apoptosis, cell cycle, and metabolism. Infect Immun 2007, 75:2853-2863.
14. Ramilo O, Allman W, Chung W, Mejias A, Ardura M, Glaser C, Wittkowski KM, Piqueras B, Banchereau J, Palucka AK, Chaussabel D: Gene expression patterns
Nat
ure
Pre
cedi
ngs
: hdl
:101
01/n
pre.
2011
.590
8.1
: Pos
ted
17 A
pr 2
011

26
in blood leukocytes discriminate patients with acute infections. Blood 2007, 109:2066-2077.
15. Lee Y, Chen C, Chao A, Chen E, Wei M: Molecular signature of clinical severity in recovering patients with severe acute respiratory syndrome coronavirus(SARS-CoV). BMC Genomics 2005, 6:1-10.
16. Soilleux EJ, Morris LS, Leslie G, Chehimi J, Luo Q, Levroney E, Trowsdale J, Montaner LJ, Doms RW, Weissman D, et al: Constitutive and induced expression of DC-SIGN on dendritic cell and macrophage subpopulations in situ and in vitro. J Leukoc Biol 2002, 71:445-457.
17. Hsueh PR, Hsiao CH, Yeh SH, Wang WK, Chen PJ, Wang JT, Chang SC, Kao CL, Yang PC: Microbiologic characteristics, serologic responses, and clinical manifestations in severe acute respiratory syndrome, Taiwan. Emerg Infect Dis 2003, 9:1163-1167.
18. Tsai MH, Yan H, Chen X, Chandramouli GV, Zhao S, Coffin D, Coleman CN, Mitchell JB, Chuang EY: Evaluation of hybridization conditions for spotted oligonucleotide-based DNA microarrays. Mol Biotechnol 2005, 29:221-224.
19. Samuel CE: Antiviral actions of interferons. Clin Microbiol Rev 2001, 14:778-809, table of contents.
20. Lund JM, Alexopoulou L, Sato A, Karow M, Adams NC, Gale NW, Iwasaki A, Flavell RA: Recognition of single-stranded RNA viruses by Toll-like receptor 7. Proc Natl Acad Sci U S A 2004, 101:5598-5603.
21. Amer AO, Swanson MS: A phagosome of one's own: a microbial guide to life in the macrophage. Curr Opin Microbiol 2002, 5:56-61.
22. Elliott T, Neefjes J: The complex route to MHC class I-peptide complexes. Cell 2006, 127:249-251.
23. Hsing LC, Rudensky AY: The lysosomal cysteine proteases in MHC class II antigen presentation. Immunol Rev 2005, 207:229-241.
24. Charo IF, Ransohoff RM: The many roles of chemokines and chemokine receptors in inflammation. N Engl J Med 2006, 354:610-621.
25. Ware LB, Matthay MA: The acute respiratory distress syndrome. N Engl J Med 2000, 342:1334-1349.
26. Heil F, Hemmi H, Hochrein H, Ampenberger F, Kirschning C, Akira S, Lipford G, Wagner H, Bauer S: Species-specific recognition of single-stranded RNA via toll-like receptor 7 and 8. Science 2004, 303:1526-1529.
27. Kariko K, Buckstein M, Ni H, Weissman D: Suppression of RNA recognition by Toll-like receptors: the impact of nucleoside modification and the evolutionary origin of RNA. Immunity 2005, 23:165-175.
28. Schoenemeyer A, Barnes BJ, Mancl ME, Latz E, Goutagny N, Pitha PM, Fitzgerald KA, Golenbock DT: The interferon regulatory factor, IRF5, is a central mediator of toll-like receptor 7 signaling. J Biol Chem 2005, 280:17005-17012.
29. Uematsu S, Sato S, Yamamoto M, Hirotani T, Kato H, Takeshita F, Matsuda M, Coban C, Ishii KJ, Kawai T, et al: Interleukin-1 receptor-associated kinase-1 plays an essential role for Toll-like receptor (TLR)7- and TLR9-mediated interferon-{alpha} induction. J Exp Med 2005, 201:915-923.
Nat
ure
Pre
cedi
ngs
: hdl
:101
01/n
pre.
2011
.590
8.1
: Pos
ted
17 A
pr 2
011

27
30. van Kooyk Y, Geijtenbeek TB: DC-SIGN: escape mechanism for pathogens. Nat Rev Immunol 2003, 3:697-709.
31. Reghunathan R, Jayapal M, Hsu LY, Chng HH, Tai D, Leung BP, Melendez AJ: Expression profile of immune response genes in patients with Severe Acute Respiratory Syndrome. BMC Immunol 2005, 6:2.
32. Spiegel M, Weber F: Inhibition of cytokine gene expression and induction of chemokine genes in non-lymphatic cells infected with SARS coronavirus. Virol J 2006, 3:17.
33. Ziegler T, Matikainen S, Ronkko E, Osterlund P, Sillanpaa M, Siren J, Fagerlund R, Immonen M, Melen K, Julkunen I: Severe acute respiratory syndrome coronavirus fails to activate cytokine-mediated innate immune responses in cultured human monocyte-derived dendritic cells. J Virol 2005, 79:13800-13805.
34. Unanue ER, Beller DI, Calderon J, Kiely JM, Stadecker MJ: Regulation of immunity and inflammation by mediators from macrophages. Am J Pathol 1976, 85:465-478.
35. Overath P, Aebischer T: Antigen presentation by macrophages harboring intravesicular pathogens. Parasitol Today 1999, 15:325-332.
36. Dentener MA, Bazil V, Von Asmuth EJ, Ceska M, Buurman WA: Involvement of CD14 in lipopolysaccharide-induced tumor necrosis factor-alpha, IL-6 and IL-8 release by human monocytes and alveolar macrophages. J Immunol 1993, 150:2885-2891.
37. Wu GD, Lai EJ, Huang N, Wen X: Oct-1 and CCAAT/enhancer-binding protein (C/EBP) bind to overlapping elements within the interleukin-8 promoter. The role of Oct-1 as a transcriptional repressor. J Biol Chem 1997, 272:2396-2403.
38. Vecchiarelli A, Retini C, Casadevall A, Monari C, Pietrella D, Kozel TR: Involvement of C3a and C5a in interleukin-8 secretion by human polymorphonuclear cells in response to capsular material of Cryptococcus neoformans. Infect Immun 1998, 66:4324-4330.
39. Plager DA, Loegering DA, Weiler DA, Checkel JL, Wagner JM, Clarke NJ, Naylor S, Page SM, Thomas LL, Akerblom I, et al: A novel and highly divergent homolog of human eosinophil granule major basic protein. J Biol Chem 1999, 274:14464-14473.
40. Ruddy MJ, Wong GC, Liu XK, Yamamoto H, Kasayama S, Kirkwood KL, Gaffen SL: Functional cooperation between interleukin-17 and tumor necrosis factor-alpha is mediated by CCAAT/enhancer-binding protein family members. J Biol Chem 2004, 279:2559-2567.
41. Kanayama N, Kajiwara Y, Goto J, el Maradny E, Maehara K, Andou K, Terao T: Inactivation of interleukin-8 by aminopeptidase N (CD13). J Leukoc Biol 1995, 57:129-134.
42. Jiang D, Liang J, Fan J, Yu S, Chen S, Luo Y, Prestwich GD, Mascarenhas MM, Garg HG, Quinn DA, et al: Regulation of lung injury and repair by Toll-like receptors and hyaluronan. Nat Med 2005, 11:1173-1179.
43. Stern R, Asari AA, Sugahara KN: Hyaluronan fragments: an information-rich system. Eur J Cell Biol 2006, 85:699-715.
Nat
ure
Pre
cedi
ngs
: hdl
:101
01/n
pre.
2011
.590
8.1
: Pos
ted
17 A
pr 2
011

28
44. Hakansson L, Venge P: The molecular basis of the hyaluronic acid-mediated stimulation of granulocyte function. J Immunol 1987, 138:4347-4352.
45. McKee CM, Penno MB, Cowman M, Burdick MD, Strieter RM, Bao C, Noble PW: Hyaluronan (HA) fragments induce chemokine gene expression in alveolar macrophages. The role of HA size and CD44. J Clin Invest 1996, 98:2403-2413.
46. Peters-Golden M, Bailie M, Marshall T, Wilke C, Phan SH, Toews GB, Moore BB: Protection from pulmonary fibrosis in leukotriene-deficient mice. Am J Respir Crit Care Med 2002, 165:229-235.
47. Minami M, Ohno S, Kawasaki H, Radmark O, Samuelsson B, Jornvall H, Shimizu T, Seyama Y, Suzuki K: Molecular cloning of a cDNA coding for human leukotriene A4 hydrolase. Complete primary structure of an enzyme involved in eicosanoid synthesis. J Biol Chem 1987, 262:13873-13876.
48. Lam BK, Penrose JF, Freeman GJ, Austen KF: Expression cloning of a cDNA for human leukotriene C4 synthase, an integral membrane protein conjugating reduced glutathione to leukotriene A4. Proc Natl Acad Sci U S A 1994, 91:7663-7667.
49. Palmblad J, Malmsten CL, Uden AM, Radmark O, Engstedt L, Samuelsson B: Leukotriene B4 is a potent and stereospecific stimulator of neutrophil chemotaxis and adherence. Blood 1981, 58:658-661.
50. van Heerden PV, Barden A, Michalopoulos N, Bulsara MK, Roberts BL: Dose-response to inhaled aerosolized prostacyclin for hypoxemia due to ARDS. Chest 2000, 117:819-827.
51. Bitterman PB, Wewers MD, Rennard SI, Adelberg S, Crystal RG: Modulation of alveolar macrophage-driven fibroblast proliferation by alternative macrophage mediators. J Clin Invest 1986, 77:700-708.
52. Hodges RJ, Jenkins RG, Wheeler-Jones CP, Copeman DM, Bottoms SE, Bellingan GJ, Nanthakumar CB, Laurent GJ, Hart SL, Foster ML, McAnulty RJ: Severity of lung injury in cyclooxygenase-2-deficient mice is dependent on reduced prostaglandin E(2) production. Am J Pathol 2004, 165:1663-1676.
53. Warshamana GS, Martinez S, Lasky JA, Corti M, Brody AR: Dexamethasone activates expression of the PDGF-alpha receptor and induces lung fibroblast proliferation. Am J Physiol 1998, 274:L499-507.
54. Siegbahn A, Hammacher A, Westermark B, Heldin CH: Differential effects of the various isoforms of platelet-derived growth factor on chemotaxis of fibroblasts, monocytes, and granulocytes. J Clin Invest 1990, 85:916-920.
55. Abdollahi A, Li M, Ping G, Plathow C, Domhan S, Kiessling F, Lee LB, McMahon G, Grone HJ, Lipson KE, Huber PE: Inhibition of platelet-derived growth factor signaling attenuates pulmonary fibrosis. J Exp Med 2005, 201:925-935.
56. Clark JG, Milberg JA, Steinberg KP, Hudson LD: Type III procollagen peptide in the adult respiratory distress syndrome. Association of increased peptide levels in bronchoalveolar lavage fluid with increased risk for death. Ann Intern Med 1995, 122:17-23.
57. Kim KH, Burkhart K, Chen P, Frevert CW, Randolph-Habecker J, Hackman RC, Soloway PD, Madtes DK: Tissue inhibitor of metalloproteinase-1 deficiency
Nat
ure
Pre
cedi
ngs
: hdl
:101
01/n
pre.
2011
.590
8.1
: Pos
ted
17 A
pr 2
011

29
amplifies acute lung injury in bleomycin-exposed mice. Am J Respir Cell Mol Biol 2005, 33:271-279.
58. Ruiz V, Ordonez RM, Berumen J, Ramirez R, Uhal B, Becerril C, Pardo A, Selman M: Unbalanced collagenases/TIMP-1 expression and epithelial apoptosis in experimental lung fibrosis. Am J Physiol Lung Cell Mol Physiol 2003, 285:L1026-1036.
59. Hattori N, Mizuno S, Yoshida Y, Chin K, Mishima M, Sisson TH, Simon RH, Nakamura T, Miyake M: The plasminogen activation system reduces fibrosis in the lung by a hepatocyte growth factor-dependent mechanism. Am J Pathol 2004, 164:1091-1098.
60. Kotani I, Sato A, Hayakawa H, Urano T, Takada Y, Takada A: Increased procoagulant and antifibrinolytic activities in the lungs with idiopathic pulmonary fibrosis. Thromb Res 1995, 77:493-504.
Figure legends
Figure 1.
Heatmap image of microarray analysis result of SARS-CoV and CoV-229E infected
THP1-DC-SIGN cells. S6M: SARS 6h mean, S6A: SARS 6h sample A, S6B: SARS 6h
sample B; E6M: CoV-229E 6h mean, E6A: Cov-229E 6h sample A, E6B: CoV-229E 6h
sample B; S24M: SARS 24h mean, S24A: SARS 24h sample A, S24B: SARS 24h
sample B; E24M: CoV-229E 24h mean, E24A: Cov-229E 24h sample A, E24B: CoV-
229E 24h sample B
Figure 2
Pathway analysis of specific gene-to-gene network of IL-8 and proteosome families.
Red and green colors denote up-regulation and down-regulation, respectively. Darker
color indicates greater up- or down-regulation and lighter color mild to moderate up- or
down-regulation. Solid and dotted lines lines indicate direct and indirect up-regulation
from upstream gene A to downstream gene B, respectively. Straight lines with blunt end
indicate down-regulation from upstream gene A to downstream gene B.
Nat
ure
Pre
cedi
ngs
: hdl
:101
01/n
pre.
2011
.590
8.1
: Pos
ted
17 A
pr 2
011
30
Table 1. Interferonα/β inducible gene expressions Fold change*† Gene GeneBank 6h 24h Accession SARS- CoV Cov- 229E SARS- CoV CoV- 229E Number Mean A B Mean A B Mean A B Mean A B Interferon alpha14 NM002172 0.95 0.96 0.93 1.34 1.78 0.90 0.66 0.41 0.91 1.11 1.10 1.12
ISF3g‡ NM006084 1.04 0.97 1.10 1.00 1.00 1.00 0.62 0.54 0.69 1.01 1.05 1.11
IFN exonuclease NM002201 0.93 0.96 0.90 1.03 1.51 0.56 0.62 0.43 0.81 0.99 1.01 0.98
EIF2Ak§ NM002759 0.98 0.88 1.08 2.05 2.55 1.55 0.58 0.54 0.62 1.25 1.18 0.97
IFN inducible IFI35 NM005533 0.58 0.49 0.67 1.09 1.00 1.18 0.55 0.61 0.49 0.80 0.83 1.32 IFN inducible G1P3** NM002038 0.28 0.25 0.31 0.96 0.84 1.08 0.39 0.32 0.46 0.57 0.57 0.77 2,5OAS2†† NM002535 0.28 0.30 0.26 1.47 1.00 1.95 0.34 0.42 0.26 0.76 0.73 0.58 MX1‡‡ NM002462 0.40 0.35 0.44 1.07 0.95 1.19 0.28 0.31 0.24 0.64 0.65 0.80 Interferon inucible 44 NM006417 0.32 0.27 0.37 1.28 0.96 1.59 0.26 0.34 0.18 0.93 0.90 0.62 IFN inducible G1P2§§ NM005101 0.61 0.55 0.66 0.64 0.70 0.57 0.20 0.19 0.21 0.58 0.57 0.95
* † Bold face: up-regulation>1.5x; Underlined boldface: down-regulation<0.67x ‡ ISF3g: IFN-stimulated 3 gamma
§ EIF2AK: RNA activated protein kinase ** IFN inducible G1P3: IFN inducible guanylate binding protein 3
†† 2,5OAS2: 2,5 oligoadenylate synthetase 2
‡‡ MX1: myxovirus resistance 1
§§ IFN inducible G1P2: IFN guanylate binding protein 2
Nat
ure
Pre
cedi
ngs
: hdl
:101
01/n
pre.
2011
.590
8.1
: Pos
ted
17 A
pr 2
011

31
Table 2. Toll-like signaling gene expressions Fold change* Group/Gene GeneBank 6h 24h Accession SARS-CoV CoV-229E SARS-CoV CoV- 229E Number Mean A B Mean A B Mean A B Mean A B Toll-like signaling: IRAK-M† NM007199 1.00 1.00 1.00 1.00 1.00 1.00 2.35 2.51 2.19 1.36 1.40 1.31 MyD88‡ NM002468 0.90 0.78 1.01 0.77 1.00 0.53 0.63 0.68 0.59 0.98 1.01 0.94 TRIF§ NM014261 0.73 0.66 0.81 1.57 1.73 1.40 0.60 0.40 0.80 1.12 1.07 1.16 SITPEC** NM016581 0.73 0.79 0.67 1.00 1.00 0.99 0.51 0.43 0.59 0.93 0.91 0.95 TLR molecules: TLR7 NM016562 1.17 1.35 1.00 1.00 1.00 1.00 2.10 1.84 2.36 1.03 1.01 1.04 TLR5 NM003268 0.78 0.72 0.83 0.97 1.10 0.83 1.32 1.16 1.48 1.01 1.05 0.97 TLR4 NM003266 1.19 1.39 1.00 1.00 1.00 1.00 1.27 1.54 1.00 0.98 0.96 1.00 TLR2 NM003264 1.06 1.13 1.00 1.00 1.00 1.00 1.12 1.22 1.01 1.03 1.02 1.04 TLR9 NM017442 0.88 0.95 0.82 1.11 1.00 1.22 0.71 0.81 0.61 1.00 1.03 0.98
* Bold face: up-regulation>1.5x; Underlined boldface: down-regulation<0.67x † IRAK-M: IL-1 receptor associated kinase-M
‡ MyD88: myeloid differentiation protein 88
§ TRIF: Toll-like receptor adaptor molecule 1
** SITPEC: Toll pathway evolutional conservative
Nat
ure
Pre
cedi
ngs
: hdl
:101
01/n
pre.
2011
.590
8.1
: Pos
ted
17 A
pr 2
011

32
Table 3. Cytokine-related gene expressions
Fold change* Group/Gene GeneBank 6 h 24h Accession SARS- CoV CoV- 229E SARS-CoV CoV- 229E Number Mean A B Mean A B Mean A B Mean A B TNFsuperfamily: TNFRSF21† NM614452 1.00 1.00 1.00 1.00 1.00 1.00 2.23 2.16 2.30 1.11 1.06 1.17 TNFAIP1‡ NM021137 1.05 1.10 1.00 1.00 1.00 1.00 1.93 2.55 1.32 0.85 0.81 0.88 TRAF4§ NM004295 0.72 0.68 0.77 1.11 1.80 0.41 0.67 0.49 0.86 0.96 0.99 0.92 TRAIL** NM003810 0.94 0.99 0.88 1.05 1.00 1.10 0.64 0.52 0.75 0.76 0.73 0.79 TNFRSF1A†† AK130807 1.11 0.88 1.35 1.69 2.85 0.52 0.61 0.50 0.73 0.95 0.97 0.94 TNFSF14 NM003807 0.64 0.59 0.69 1.34 1.87 0.81 0.55 0.46 0.63 0.93 0.94 0.91 TGFB-related: TGFB2 NM003242 1.06 1.00 1.12 0.87 1.13 0.61 0.65 0.48 0.82 0.93 1.01 0.85 TGFBI68KD‡‡ NM000358 0.81 0.73 0.90 1.11 1.68 0.54 0.64 0.37 0.91 0.95 0.95 0.95 Endoglin NM000118 0.65 0.63 0.66 1.09 1.25 0.94 0.27 0.26 0.29 0.72 0.76 0.68 Interleukin-related IL10Ra§§ NM001558 0.91 0.82 1.00 0.60 1.00 0.20 1.88 2.03 1.74 1.01 1.08 0.93 IL6R NM181359 0.83 0.79 0.88 1.17 1.00 1.34 0.66 0.46 0.86 1.12 1.16 1.08 CLF1*** NM001330 0.71 0.71 0.71 0.90 1.19 0.61 0.67 0.41 0.92 1.01 1.06 0.95 Thioredoxin NM003329 1.07 0.91 1.24 0.74 0.66 0.81 0.64 0.43 0.85 0.98 0.99 0.96 IL13 NM002188 0.76 0.84 0.69 1.33 1.52 1.14 0.55 0.36 0.74 1.01 0.95 1.08 IFN-g related: Interferon-g R1 NM006416 1.27 1.42 1.11 1.80 3.20 0.40 1.78 1.35 2.22 1.12 1.13 1.11 ADRM1††† NM007002 1.14 1.21 1.06 0.79 1.00 0.57 0.55 0.62 0.48 0.88 0.86 0.90
* Bold face=Up-regulation>1.5x; Underlined boldface=down-regulation<0.67x † TNFRSF21: TNF receptor superfamily 21 ‡ TNFAIP1: TNF-alpha inducible protein 1 § TRAF4: TNF receptor associated factor 4 ** TRAIL: TNF ligand family 10 †† TNFRSF1A: TNF receptor superfamily 1A ‡‡ TGFBI68KD: TGF-beta induced 68KD §§ IL10Ra: IL10 receptor alpha *** CLF1: cytokine-like factor 1 ††† ADRM1:Adhesion-regulating molecule1
Nat
ure
Pre
cedi
ngs
: hdl
:101
01/n
pre.
2011
.590
8.1
: Pos
ted
17 A
pr 2
011

33
Table 4. Lysosome-related gene expressions Fold change* Gene GeneBank 6h 24h Accession SARS-CoV CoV- 229E SARS-CoV CoV- 229E Number Mean A B Mean A B Mean A B Mean A B ATPaseV01 NM005177 1.21 1.41 1.00 1.00 1.00 1.00 2.45 1.78 3.12 1.23 1.45 1.00 G-6-S† NM002076 1.00 1.00 1.00 1.00 1.00 1.00 1.55 1.55 1.56 1.17 1.17 1.16 GlcNAcp‡ NM032520 0.60 0.54 0.66 1.23 1.00 1.45 0.66 0.62 0.69 0.86 0.87 0.85 PPTE2§ NM005155 0.75 0.69 0.81 1.00 1.00 1.00 0.66 0.57 0.75 1.02 1.02 1.03 Mannosidase NM022077 0.80 0.81 0.78 0.80 0.73 0.87 0.66 0.48 0.85 0.84 0.86 0.82 ATPase14KDV1F NM004231 0.87 0.86 0.88 0.72 0.81 0.63 0.67 0.40 0.97 0.93 0.96 0.90 ATPaseProtein1 NM001183 0.62 0.63 0.62 0.99 1.00 0.97 0.60 0.57 0.62 0.81 0.84 0.78 LAMP4 alpha** NM014713 0.56 0.50 0.62 0.89 1.33 0.46 0.59 0.59 0.59 1.03 1.09 0.97 PPTE1†† NM000310 1.10 1.07 1.13 1.76 0.47 3.05 0.65 0.32 0.99 1.09 1.06 1.11 ATPase16KDV0C NM001694 0.98 1.13 0.84 0.81 1.04 0.57 0.62 0.33 0.90 0.96 0.98 0.93 AP2M1‡‡ NM004068 0.93 0.91 0.95 1.00 0.83 1.16 0.53 0.34 0.73 0.91 0.96 0.86 LAMP5§§ NM006762 1.16 1.13 1.19 0.92 0.92 0.91 0.52 0.23 0.81 1.02 1.01 1.02 ATPase21KDV0C NM004047 1.01 1.02 0.99 0.67 0.85 0.49 0.46 0.29 0.64 0.76 0.79 0.73 Prosaposin NM002778 0.72 0.74 0.70 1.34 1.52 1.17 0.49 0.22 0.75 1.00 0.97 1.03
* Bold face=Up-regulation>1.5x; Underlined boldface=down-regulation<0.67x † G-6-S: glucosamine-6-sulfatase
‡ GlcNAcp:GlcNAc phosphotransferase
§ PPTE2: palmitoyl-protein thioesterase2
** LAMP4 alpha: lysosomal-associated protein 4 alpha
†† PPTE1: palmitoyl-protein thioesterase1 ‡‡ AP2M1: adaptor-related protein complex 2, mu-1 subunit §§ LAMP5: lysosomal-associated protein 5
Nat
ure
Pre
cedi
ngs
: hdl
:101
01/n
pre.
2011
.590
8.1
: Pos
ted
17 A
pr 2
011

34
Table 5. Cathepsin/proteasome gene expressions Fold change* Group/Gene GeneBank 6h 24h Accession SARS-CoV CoV- 229E SARS-CoV CoV- 229E Number Mean A B Mean A B Mean A B Mean A B Cathepsins: Cathepsin A NM000308 0.87 0.75 0.99 1.22 1.00 1.43 0.59 0.40 0.78 0.88 0.92 0.84 Cathepsin S NM004079 0.53 0.59 0.47 1.52 1.00 2.04 0.54 0.42 0.66 1.07 1.11 1.03 Cathepsin C NM001814 1.14 0.90 1.39 1.17 0.66 1.67 0.53 0.42 0.63 0.95 0.95 0.96 Cathepsin H NM004390 0.65 0.62 0.68 1.00 1.00 1.00 0.45 0.56 0.33 1.00 0.93 1.07 Cathepsin D NM001909 1.09 0.90 1.28 0.75 1.00 0.49 0.39 0.24 0.54 1.29 1.34 1.25 Proteasomes: Proteasome 4(PSMA4) NM002789 1.25 1.12 1.38 1.49 0.71 2.27 0.67 0.47 0.88 1.18 1.27 1.08 Proteasome 2(PSMB2) NM002794 1.07 1.15 1.00 0.96 1.00 0.92 0.63 0.57 0.69 1.05 0.96 1.14 Proteasome 26s,A4† NM006503 1.00 0.96 1.05 1.07 1.39 0.75 0.54 0.62 0.47 0.82 0.85 0.80 Proteasome 9(PSMB9) NM002800 0.51 0.46 0.55 1.00 0.50 1.49 0.54 0.48 0.59 0.83 0.83 0.82 PSME2‡ BC072025 0.78 0.71 0.85 1.10 0.43 1.78 0.50 0.45 0.56 0.84 0.86 0.82 Proteassome 3(PSMB3) NM002795 1.10 0.96 1.24 0.75 0.45 1.04 0.52 0.36 0.67 0.85 0.86 0.84 PSME1§ NM006263 0.78 0.77 0.80 1.22 0.46 1.97 0.49 0.32 0.66 0.90 0.92 0.88 Proteasome 26s nA8 NM002812 1.20 1.06 1.33 0.96 0.70 1.21 0.46 0.36 0.55 0.85 0.84 0.86 Proteasome 5(PSMA5) NM002790 0.80 0.73 0.87 1.12 0.47 1.77 0.34 0.24 0.43 0.98 1.02 0.94
* Bold face=Up-regulation>1.5x; Underlined boldface=down-regulation<0.67x † Proteasome 26s, A4: proteasome 26s ATPase 4,
‡ PSME2: proteasome activator 2 § PSME1: proteasome activator 1
Nat
ure
Pre
cedi
ngs
: hdl
:101
01/n
pre.
2011
.590
8.1
: Pos
ted
17 A
pr 2
011

35
Table 6. Chaperon/HLA gene expressions Fold change* Gene GeneBank 6h 24h Accession SARS-CoV CoV- 229E SARS-CoV CoV- 229E Number Mean A B Mean A B Mean A B Mean A B Cyclophilin D NM005038 1.00 1.00 1.00 1.00 1.00 1.00 1.95 2.04 1.85 1.11 1.10 1.12 Heat Shock Factor 1 NM005526 1.00 1.00 1.00 1.00 1.00 1.00 1.69 1.91 1.48 0.99 0.96 1.01 Cyclophilin G NM004792 2.44 2.20 2.68 1.00 1.00 1.00 1.66 1.59 1.73 1.39 1.45 1.32 Chaperonin TCP16A NM001762 1.36 1.78 0.95 1.28 1.93 0.63 0.63 0.64 0.62 1.15 1.04 1.27 HLA-B Associated 2 NM004638 0.98 0.99 0.97 0.78 1.00 0.55 0.63 0.71 0.56 1.46 1.52 1.41 FK506BindingProtein8 NM012181 0.69 0.58 0.81 0.85 0.65 1.05 0.64 0.51 0.76 0.87 0.91 0.84 Activator 0f HSP90KD NM012111 1.02 1.04 1.00 1.00 1.00 1.00 0.63 0.71 0.54 0.98 0.88 1.08 Cyclophilin E NM006112 0.92 0.89 0.95 1.30 0.49 2.11 0.67 0.40 0.95 0.89 0.92 0.86 HLA-HA1 NM012292 0.71 0.63 0.80 0.83 0.52 1.14 0.59 0.53 0.64 0.74 0.76 0.72 HLA complex group9 NM005844 1.12 1.03 1.21 1.02 1.00 1.04 0.58 0.49 0.66 0.84 0.90 0.78 BAP31† NM005745 0.74 0.71 0.77 0.98 0.59 1.37 0.60 0.41 0.78 0.93 0.95 0.92 SEC61 complex Beta NM006808 0.80 0.73 0.88 0.62 0.74 0.51 0.61 0.38 0.84 0.87 0.93 0.80 Cyclophilin C NM000943 0.58 0.57 0.59 1.07 0.57 1.57 0.62 0.32 0.92 0.91 0.91 0.91 Valosin-contain protein NM007126 1.18 1.25 1.11 1.06 1.09 1.02 0.53 0.36 0.71 0.93 0.90 0.95 HeatShockProtein10KD1NM002157 0.86 0.84 0.88 1.25 0.37 2.13 0.51 0.37 0.66 0.87 0.88 0.87 Chaperonin TCP1-7 NM006429 2.20 1.78 2.62 0.89 0.49 1.29 0.49 0.37 0.61 0.98 0.97 0.99 X-box binding protein1 NM005080 0.41 0.42 0.41 1.59 0.40 2.77 0.49 0.36 0.62 1.08 1.14 1.03 FK506BindingProtein10 NM021939 0.66 0.68 0.63 1.03 1.23 0.83 0.48 0.36 0.61 0.89 0.88 0.91 HeatShockProtein70KD8NM006597 1.02 1.09 0.95 1.80 0.54 3.05 0.46 0.27 0.65 1.52 1.56 1.48 Calreticulin NM004343 1.23 1.36 1.10 1.96 2.45 1.48 0.43 0.23 0.62 1.27 1.23 1.31 Cyclophilin B NM000942 0.69 0.71 0.67 1.12 0.54 1.71 0.36 0.12 0.59 1.03 1.04 1.01
* Bold face=Up-regulation>1.5x; Underlined boldface=down-regulation<0.67x † BAP31: B cell receptor associated protein 31
Nat
ure
Pre
cedi
ngs
: hdl
:101
01/n
pre.
2011
.590
8.1
: Pos
ted
17 A
pr 2
011

36
Table 7. Chemokine-related gene expressions Fold change* Gene GeneBank 6 h 24 h Accession SARS -CoV CoV- 229E SARS- CoV CoV- 229E
Number Mean A B Mean A B Mean A B Mean A B
MBPH(PRG3)† NM006093 1.74 1.74 1.74 1.09 1.84 0.33 2.57 2.83 2.31 1.05 1.15 0.96 Interleukin8 NM000584 0.80 0.60 1.00 8.50 16.91 0.08 2.55 2.28 2.83 0.91 0.90 0.92 C/EBP delta(CEBPD) NM005195 1.18 1.05 1.32 0.82 1.21 0.44 2.04 1.30 2.77 0.86 0.79 0.82 Hyaluronidase3 NM003549 1.29 1.27 1.30 1.00 1.00 1.00 1.80 1.35 2.25 0.79 0.77 0.81 Complement3 NM000064 1.09 1.18 1.00 1.00 1.00 1.00 1.66 1.75 1.57 0.99 0.93 1.05 PDGF receptor alpha NM006206 1.03 1.00 1.06 1.00 1.00 1.00 1.65 1.68 1.62 1.27 1.29 1.24 LTXA4 hydroxylase‡ NM000895 1.00 1.00 1.00 1.00 1.00 1.00 1.68 1.37 1.99 1.08 1.07 1.08 CD14 NM000591 1.00 1.00 1.00 1.00 1.00 1.00 1.58 1.62 1.54 1.14 1.24 1.04 RHMM§ NM012484 1.64 2.28 1.00 1.00 1.00 1.00 1.55 1.71 1.40 1.40 1.34 1.46 MGST2** NM002413 0.55 0.54 0.57 1.21 0.43 2.00 0.59 0.50 0.69 0.95 0.96 0.93 PGE Synthase NM004878 1.10 0.86 1.34 1.00 1.00 1.00 0.58 0.59 0.57 1.15 1.18 1.13 CLF†† NM016326 0.83 0.65 1.00 1.00 1.00 1.00 0.58 0.72 0.44 1.16 1.25 1.08 CXCL3 NM002090 0.77 0.74 0.81 0.97 1.39 0.55 0.56 0.41 0.70 0.82 0.85 0.78 ANPEP‡‡ NM001150 0.75 0.78 0.71 0.85 1 0.69 0.57 0.47 0.68 1.08 1.13 1.04 MGST3§§ NM004528 0.76 0.73 0.78 0.92 0.35 1.48 0.57 0.36 0.78 0.89 0.87 0.91 CCL3 NM002983 0.19 0.20 0.18 1.35 1.00 1.69 0.49 0.52 0.45 0.39 0.42 0.37 PGD Synthase NM014485 0.49 0.44 0.55 0.98 1.00 0.95 0.54 0.28 0.80 0.82 0.85 0.78 CCR9 NM006641 0.95 1.07 0.84 1.47 2.17 0.76 0.47 0.37 0.57 0.93 0.93 0.92 CCL5 NM002985 0.35 0.33 0.38 0.73 0.87 0.59 0.28 0.26 0.29 0.94 1.02 0.86 LeukotrieneC4synthase NM000897 0.32 0.28 0.37 1.30 1.00 1.59 0.28 0.25 0.30 0.69 0.74 0.64
* Bold face=Up-regulation>1.5x; Underlined boldface=down-regulation<0.67x † MBPH: Major basic protein homolog ‡ LTXA4 hydroxylase: leukotriene A4 hydroxylase § RHMM: hyaluronan-mediated motility receptor ** MGST2: microsomal glutathione-S-transfersae2 †† CLF: chemokine-like factor ‡‡ ANPEP:alanyl aminopeptidase §§ MGST3: microsomal glutathione-S-transfersae2
Nat
ure
Pre
cedi
ngs
: hdl
:101
01/n
pre.
2011
.590
8.1
: Pos
ted
17 A
pr 2
011

37
Table 8. Fibrosis-related gene expressions Fold change* Gene GeneBank 6 h 24 h Accession SARS -CoV CoV- 229E SARS-CoV CoV- 229E
Number Mean A B Mean A B Mean A B Mean A B
P4HA1† NM000917 2.12 3.25 1.00 2.07 3.81 0.33 2.93 1.69 4.17 1.17 1.13 1.21 SERPINB2‡ NM002575 1.12 1.25 1.00 1.00 1.00 1.00 2.69 1.29 4.08 1.08 1.02 1.13 MMP28§ NM024302 1.00 1.00 1.00 1.00 1.00 1.00 1.75 1.99 1.51 0.77 0.77 0.78 ADAM19** NM023038 1.00 1.00 1.00 1.00 1.00 1.00 1.65 1.62 1.67 1.07 1.13 1.01 Protein S NM000313 0.58 0.62 0.55 1.00 1.00 1.00 0.66 0.60 0.71 1.24 1.26 1.23 MMP2†† NM004530 0.94 0.88 1.00 1.00 1.00 1.00 0.64 0.55 0.74 0.91 0.88 0.94 Spondin2 NM012445 0.82 0.84 0.79 1.04 0.70 1.38 0.63 0.43 0.82 0.93 0.94 0.93 PLOD3‡‡ NM001084 0.73 0.64 0.81 1.07 0.68 1.46 0.61 0.78 0.44 0.71 0.74 0.67 ADAMTS4§§ NM005099 0.80 0.59 1.00 1.00 1.00 1.00 0.56 0.62 0.50 1.10 1.19 1.01 FGF3*** NM005247 0.92 0.83 1.01 0.97 0.69 1.24 0.50 0.29 0.73 1.01 1.01 1.02 CollagenXVIIIa1 NM030582 0.76 0.75 0.77 0.81 0.89 0.74 0.48 0.31 0.66 0.90 0.93 0.87 TIMP3††† NM000362 1.03 0.93 1.13 1.16 1.26 1.06 0.45 0.26 0.63 1.09 1.13 1.06 CollagenIa2 NM000089 0.57 0.57 0.57 0.98 0.91 1.04 0.40 0.25 0.55 0.97 0.93 1.01 TIMP1‡‡‡ NM003254 0.75 0.69 0.81 0.67 0.82 0.51 0.38 0.15 0.62 0.98 1.04 0.91
* Bold face=Up-regulation>1.5x; Underlined boldface=down-regulation<0.67x † P4HA1: proline 2-oxoglutarate 4-dioxygenase ‡ SERPINB2: plasminogen activator inhibitor type 2 § MMP28: matrix metalloproteinase 28 ** ADAM19: A disintegrin and metalloproteinase 19 †† MMP2: matrix metalloproteinase 2 ‡‡ PLOD3: procollagenlysine-2-oxoglutarate-5-dioxygenase 3 §§ ADAMTS4: ADAM metalloproteinase with thrombospondin type 1 motif 4 *** FGF3: fibroblast growth factor 3 ††† TIMP3: tissue inhibitor of metalloproteinase 3 ‡‡‡ TIMP1: tissue inhibitor of metalloproteinase 1
Nat
ure
Pre
cedi
ngs
: hdl
:101
01/n
pre.
2011
.590
8.1
: Pos
ted
17 A
pr 2
011
38
Table 9. Hypoxia-related gene expressions Fold change* Gene GeneBank 6 h 24 h Accession SARS -CoV CoV- 229E SARS-CoV CoV- 229E
Number Mean A B Mean A B Mean A B Mean A B
Hypoxia-inducible2 NM013332 1.44 1.41 1.47 1.11 1.91 0.31 1.92 1.17 2.66 1.11 1.11 1.11 Oxidative responsive1 NM005109 1.00 1.00 1.00 0.87 1.00 0.73 1.64 1.83 1.45 1.04 0.97 1.12 Hypoxia up-regulated 1 NM006389 1.52 1.49 1.55 0.78 0.90 0.67 1.65 1.29 2.01 0.99 1.09 0.88
* Bold face=Up-regulation>1.5x; Underlined boldface=down-regulation<0.67x
Nat
ure
Pre
cedi
ngs
: hdl
:101
01/n
pre.
2011
.590
8.1
: Pos
ted
17 A
pr 2
011

39
Figure 1
Nat
ure
Pre
cedi
ngs
: hdl
:101
01/n
pre.
2011
.590
8.1
: Pos
ted
17 A
pr 2
011

40
Figure 2
Nat
ure
Pre
cedi
ngs
: hdl
:101
01/n
pre.
2011
.590
8.1
: Pos
ted
17 A
pr 2
011