satellite power system: concept development and evaluation
TRANSCRIPT

https://ntrs.nasa.gov/search.jsp?R=19810019084 2018-02-09T15:09:08+00:00Z

NASA Reference Publication 1076
Satellite Power System: Concept Development and Evaluation Program Volume 111 - Power Transmission and Reception Technical Summary and Assessment
R. H. Dietz, G. D. Amdt, J. W. Seyl, L. Leopold, and J . S. Kelley Lyndon E. Johnson Space Center Houston, Texas
National Aeronautics and Space Administration
Scientific and Technical Information Branch
1981


CONTENTS
S e c t i o n Page
S U M M A R Y . . . . . 1
. . . . . . . . . . . . . . . . . . . . . . . . . 3
11. OVERVIEW 5
. . . . . . . . . . . . . . . . . . . . . . . . . . I. INTRODUCTION
. . . . . . . . . . . . . . . . . . . . . . . . . . . 5 A. SYSTEM ASSESSMENT ACTIVITIES . . . . . . . . . . . . . . .
. . . . . . . 1. SOLAR POWER SATELLITE CONTRACTED EFFORTS 6
6 2. IN-HOUSE NASA EFFORTS . . . . . . . . . . . . . . . . . . . . . . . . . . . . . . . . . . . . . 3 . SYSTEM WORRSHOP 6
. . . . . . . . . . . . . . . a. Workshop Organization 6
. . . . . . . . . . . b. R e v i e w Panel R e p o r t : Summary 7
. . . . . . . . . . . . . . . . . . . . . . 7 B. SYSTEM OPTIONS
9 C. SYSTEM DEFINITION DRIVERS . . . . . . . . . . . . . . . . . D. REFERENCE SYSTEM UPDATES AND STUDIES . . . . . . . . . . . 10
1. SYSTEM PERFORMANCE . . . . . . . . . . . . . . . . . . 10
2. PHASE CONTROL . . . . . . . . . . . . . . . . . . . . 13
3. POWER AMPLIFIERS . . . . . . . . . . . . . . . . . . . 13
4. RADIATING ELEMENTS . . . . . . . . . . . . . . . . . . 13
5. ECTENNA . . . . . . . . . . . . . . . . . . . . . . . 13
E. SOLID-STATE CONFIGURATIONS . . . . . . . . . . . . . . . . 13
F. CRITICAL SUPPORTING INVESTIGATIONS . . . . . . . . . . . . 14
G. CONCLUSIONS AND REMAINING ISSUES . . . . . . . . . . . . . 14
iii

Sect ion Page
111 . SYSTEM STUDIES . . . . . . . . . . . . . . . . . . . . . . . . 15
A . SYSTEM PERFORMANCE . . . . . . . . . . . . . . . . . . . . 15
1 . REFERENCE SYSTEM MODIFICATIONS . . . . . . . . . . . . 18
a . Phase Control t o the Power Module (Tube) Level . . . . . . . . . . . . . . . . . . . . . . . 18
b . Allowable Amplitude J i t t e r . . . . . . . . . . . . 18
c . Metal-Matrix Waveguides . . . . . . . . . . . . . . 20
d . Startup/Shutdown Procedure . . . . . . . . . . . . 20
2 . COST SENSITIVITIES FOR THE REFERENCE SYSTEM EFFICIENCY CHAIN . . . . . . . . . . . . . . . . . . . 20
a . Klystron dc-rf Conversion Eff ic iency (85 Percent) . . . . . . . . . . . . . . . . . . . 22
b . Transmit t ing Antenna Eff ic iency (96.5 Percent) . . . . . . . . . . . . . . . . . . 24
c . Rectenna Energy Co l l ec t ion Eff ic iency ( 8 8 P e r c e n t ) . . . . . . . . . . . . . . . . . . . 26
3 . ENVIRONMENT& CONSIDERATIONS . . . . . . . . . . . . . 30
a . Ionosphere . . . . . . . . . . . . . . . . . . . . 30
b . Atmosphere . . . . . . . . . . . . . . . . . . . . 31
c . Radiofrequency In t e r f e rence . . . . . . . . . . . . 31
4 . ALTERNATE SYSTEMS . . . . . . . . . . . . . . . . . . . 46
a . Smaller System Sizing Trade-offs . . . . . . . . . 47
b . Optimized Microwave Systems . 2450 and 5800 Megahertz . . . . . . . . . . . . . . . . . . 47
c . Magnetron. Laser. and So l id - s t a t e Configurations . . . . . . . . . . . . . . . . . . 59
i v

Section Page
B . PHASE CONTROL . . . . . . . . . . . . . . . . . . . . . . . 62
1 . SYSTEM REQUIREMENTS AND CONCEPTS . . . . . . . . . . . 62
a . System Requirements . . . . . . . . . . . . . . . . 62
b . System Concepts . . . . . . . . . . . . . . . . . . 63
c . Conclusions and Remaining Issues . . . . . . . . . 64
2 . REFERENCE PHASE CONTROL SYSTEM . . . . . . . . . . . . 67
a . Reference System Description . . . . . . . . . . . 67
b . Reference System Performance Evaluation . . . . . . 74
c . End-to-End System Performance Evaluation . . . . . 80
3 . ALTERNATE PHASE CONTROL CONCEPTS . . . . . . . . . . . 87
a . Interferometer-Based Phase Control System . . . . . 87
b . Coherent Multiple-Tone Ground-Based Phase Control System . . . . . . . . . . . . . . . . . . 90
4 . IONOSPHERfC/ATMOSPHERIC CONSIDERATIONS . . . . . . . . 94
a . Ionospheric Effects on Single-Tone Pilot Beam . . . 94
b . Three-Tone Pilot-Beam System for Mitigating Ionospheric Effects . . . . . . . . . . . . . . . . 97
C . POWER AMPLIFIERS . . . . . . . . . . . . . . . . . . . . . 102
1 . INTRODUCTION . . . . . . . . . . . . . . . . . . . . . 102
a . Conclusions . . . . . . . . . . . . . . . . . . . . 102
b . Power Amplifier Remaining Issues . . . . . . . . . 103
2 . KLYSTRONS . . . . . . . . . . . . . . . . . . . . . . . 104
a . Reference Description . . . . . . . . . . . . . . . 104
b . High-Efficiency Klystron Design Assessment . . . . 107
c . Life and Reliability Assessment . . . . . . . . . . 111
d . High-Power Klystron Trade Studies . . . . . . . . . 114
V

Sect ion Page
3 . MAGNETRONS . . . . . . . . . . . . . . . . . . . . . . 114
a . Desirable Features of the Crossed-Field Microwave Generator . . . . . . . . . . . . . . . . 117
b . In t eg ra t ion I n t o the Antenna Subarray . . . . . . . 119
c . Phase and Amplitude Tracking . . . . . . . . . . . 119
d . Noise Emission P rope r t i e s . . . . . . . . . . . . . 121
e . Cathode L i f e of 50 Years . . . . . . . . . . . . . 123
4 . SOLID-STATE POWER AMPLIFIERS . . . . . . . . . . . . . 125
a . Device Technology f o r SPS During 1978 and 1979 . . . . . . . . . . . . . . . . . . . . . . . 126
b . Amplifier Development Program . . . . . . . . . . . 131
c . Technology Forecast . . . . . . . . . . . . . . . . 132
D . RADIATING ELEMENTS . . . . . . . . . . . . . . . . . . . . 133
1 . CONCLUSIONS AND REMAINING ISSUES . . . . . . . . . . . 133
2 . REFERENCE DESIGN DESCRIPTION . . . . . . . . . . . . . 134
3 . WAVEGUIDE PARAMETERS AND PERFORMANCE . . . . . . . . . 136
a . Subarray Tolerances . . . . . . . . . . . . . . . . 136
b . Radiating-Element Tolerances . . . . . . . . . . . 138
c . Receiving-Technique Evaluat ion . . . . . . . . . . 139
4 . VARIATIONS ON WAVEGUIDE TECHNIQUES . . . . . . . . . . 141
a . Resonant Cavity Radiator . . . . . . . . . . . . . 141
b . Thin-Wall Slotted-Waveguide Array Fabr ica t ion . . . 143
5 . HIGH-ACCURACY MEASmMENT mCHNIQUES . . . . . . . . . 144
vi

Section Page
E . RECTENNA . . . . . . . . . . . . . . . . . . . . . . . . . 146
1 . REFERENCE CONFIGURATION AND PERFORMANCE . . . . . . . . 150
a . Scattering and Radiofrequency Interference . . . . 156
b . Rectenna System Optimization . . . . . . . . . . . 159
c . Rectenna Construction . . . . . . . . . . . . . . . 159
d . Direct-Current Power Combining . . . . . . . . . . 159
e . Measured Rectenna Array Performance . . . . . . . . 161 f . Lightning Protection . . . . . . . . . . . . . . . 162
2 . ALTERNATE CONCEPTS . . . . . . . . . . . . . . . . . . 162
a . Medium-Gain Elements . . . . . . : . . . . . . . . 163
b . High-Gain Elements . . . . . . . . . . . . . . . . 163
c . Hogline Elements . . . . . . . . . . . . . . . . . 163
d . Waveguide Techniques . . . . . . . . . . . . . . . 164
e . Offshore Rectenna . . . . . . . . . . . . . . . . . 164
F . SOLID-STATE CONFIGURATIONS . . . . . . . . . . . . . . . . 164
1 . CONCLUSIONS . . . . . . . . . . . . . . . . . . . . . . 165
2 . REMAINING ISSUES . . . . . . . . . . . . . . . . . . . 166
3 . NOISE GENERATION . . . . . . . . . . . . . . . . . . . 167
4 . SEPARATE ANTENNA SYSTEM . . . . . . . . . . . . . . . . 170 5 . SANDWICH SYSTEM . . . . . . . . . . . . . . . . . . . . 177
a . Sandwich Concept . . . . . . . . . . . . . . . . . 180
b . Design Considerations . . . . . . . . . . . . . . . 180
c . Reference Phase Distribution . . . . . . . . . . . 188
vii

S e c t i o n P a g e
I V . CRITICAL SUPPORTING INVESTIGATIONS . . . . . . . . . . . . . . 193
A . DESIGN AND BJlEADBOARD EVALUATION OF THE SPS REFERENCE PHASE CONTROL SYSTEM . . . . . . . . . . . . . . . . . . . 193
B . FIBER OPTICS LINK ASSESSMENT . . . . . . . . . . . . . . . 2 0 0
EVALUATION . . . . . . . . . . . . . . . . . . . . . . . . 2 0 4
1 . PROCEDURE . . . . . . . . . . . . . . . . . . . . . . . 204
C . S-BAND ACTIVE RETRODIRECTIVE ARRAY PHASE ERROR
2 . EXPERIMENTAL RESULTS . . . . . . . . . . . . . . . . . 2 0 4
D . ANTENNA ELEMENT EVALUATION . . . . . . . . . . . . . . . . 206
1 . THEORY AND PROCEDURE . . . . . . . . . . . . . . . . . 2 0 6
2 . EXPERIMENTAL RESULTS SUMMARY . . . . . . . . . . . . . 2 1 1
E . SOLID-STATE ANTENNA POWER COMBINER . . . . . . . . . . . . 2 1 1
1 . PROGRAMSUMMARY . . . . . . . . . . . . . . . . . . . . 212
2 . EXPERIMENTAL RESULTS . . . . . . . . . . . . . . . . . 217
F . SOLID-STATE AMPLIFIER DEVELOPMENT PROGRAM . . . . . . . . . 217
G . MAGNETRON TUBE ASSESSMENT . . . . . . . . . . . . . . . . . 218
H . MICROWAVE IONOSPHERIC INTERACTION EXPERIMENT . . . . . . . 2 2 3
V . SYSTEM CONCLUSIONS AND REMAINING ISSUES . . . . . . . . . . . . 2 3 1
A . CONCLUSIONS . . . . . . . . . . . . . . . . . . . . . . . . 231
1 . MICROWAVE POWER TRANSMISSION . . . . . . . . . . . . . 2 3 1
2 . SINGLE COMPARED TO MULTIPLE ANTENNAS . . . . . . . . . 2 3 1
3 . FREQUENCY . . . . . . . . . . . . . . . . . . . . . . . 2 3 1
4 . MICROWAVE SYSTEM SIZING . . . . . . . . . . . . . . . . 231
5 . TYPE OF TRANSMITTING ANTENNA . . . . . . . . . . . . . 2 3 1
v i i i

Section
6 . TYPE OF RECEIVING ANTENNA . . . . . . . . . 7 . ANTENNA CONSTRUCTION AND SUBARRAY AL'INEMENT
8 . POWER BEAM STABILITY . . . . . . . . . . . B . EMAINING ISSUES . . . . . . . . . . . . . . .
. .
. .
. .
. .
. .
. .
. .
. . APPENDIX . WORKSHOP ON MICROWAVE POWER TRANSMISSION SYSTEM FOR THE
SOLAR POWER SATELLITE. REVIEW PANEL FINAL REPORT . . . . . REFERENCES . . . . . . . . . . . . . . . . . . . . . . . . . . . . .
Page
232
232
232
232
235
247
i x

TABLES
T a b l e
111-1
111-2
111-3
111-4
111-5
111-6
111-7
111-8
111-9
111-10
111-11
111- 1 2
111-13
111-14
111-15
111-16
111- 17
Page
CHARACTERISTICS AND ERROR PARAMETERS OF MODIFIED MICROWAVE TRANSMISSION SYSTEM . . . . . . . . . . . . . . 21
COST AND MASS SUMMARY FOR REFERENCE SATELLITE SUBSYSTEMS DEPENDENT ON SOLAR ARRAY POWER . . . . . . . . . . . . . . 2 3
LOSSES DUE TO POWER MODULE TOLERANCES . . . . . . . . . . . 27
ATTENUATION LOSSES FOR 5-GIGAWATT SYSTEMS . . . . . . . . . 3 2
SPS INTERFERENCE LEVEL AT TDRSS WITH 1' ( 7 0 0 KILOMETERS) SEPARATION . . . . . . . . . . . . . . . . . . . . . . . . 4 2
SPS-TO-SPS RFI FOR FOUR SCENARIOS . . . . . . . . . . . . . 43
SPS SUMMARY COSTS FOR 2.45-GIGAHERTZ OPERATION
( a ) Phys ica l p a r a m e t e r s . . . . . . . . . . . . . . . . . . 51 (b) Cos ts . . . . . . . . . . . . . . . . . . . . . . . . . 51
SPS SUMMARY COSTS FOR 5.8-GIGAHERTZ OPERATION
(a) P h y s i c a l p a r a m e t e r s . . . . . . . . . . . . . . . . . . 5 2 ( b ) C o s t s . . . . . . . . . . . . . . . . . . . . . . . . . 5 2
SOLARSIM SUBROUTINE PACKAGE CAPABILITIES . . . . . . . . . . 81
REFERENCE 70.6-KILOWATT KLYSTRON DESIGN CRITERIA . . . . . . 106
ENERGY BALANCE I N REFERENCE FIVE-SEGMENT-COLLECTOR KLYSTRON DESIGN . . . . . . . . . . . . . . . . . . . . . 1 0 9
HARMONIC MEASUREMENTS ON REPRESENTATIVE TUBES . . . . . . . 1 2 4
CHARACTERISTICS OF FOUR SOLID-STATE DEVICES INVESTIGATED . . . . . . . . . . . . . . . . . . . . . . . 1 2 7
SPS SUBARRAY LOSSES AND DIMENSIONAL TOLERANCES . . . . . . 1 3 7
MEASUREMENT ERROR BUDGET . . . . . . . . . . . . . . . . . . 1 4 7
ANTENNA RANGE MEASUREMENT ERROR SUBBUDGET . . . . . . . . . 148
ERROR SUBBUDGET FOR RECEImR ELECTRONICS
( a ) A l l o w a b l e SPS errors . . . . . . . . . . . . . . . . . 1 4 9 ( b ) S t a t e - o f - t h e - a r t p e r f o r m a n c e . . . . . . . . . . . . . 149
X

Table
111- 18
111-19
111-20
111-21
111-22
IV- 1
IV-2
Page
APPROACHES FOR DECREASING RECTENNA HARMONIC RADIATION . . . . . . . . . . . . . . . . . . . . . . . . 158
COMPARISON OF WEIGHTS AND LOSSES FOR VARIOUS VOLTAGE-DISTRIBUTION SYSTEMS . . . . . . . . . . . . . . . 178
SOLID-STATE-SANDWICH CONCEPT COMPARISON OF 0- AND 10-DECIBEL ANTENNA POWER TAPER . . . . . . . . . . . . . . 183
CHARACTERISTICS . . . . . . . . . . . . . . . . . . . . . . 184
NOMINAL CHARACTERISTICS OF GaAs-SANDWICH CONCEPT . . . . . . 185
RECOMMENDED SOLID-STATE-SANDWICH CONCEPT
ITERATIVE DE SIGN PROCEDURE FOR RADIATING-STICK PARAMETERS.. . . . . . . . . . . . . . . . . . . . . . . 208
AMPLIFIER SPECIFICATIONS AND SMALL-SIGNAL MEASUREDVALUES . . . . . . . . . . . . . . . . . . . . . 215
xi

FIGURES
Page Figure
11- 1
11-2
11-3
11-4
111- 1
111-2
111-3
111-4
111-5
111-6
111-7
111-8
111-9
111- 10
111-11
Microwave system opt ions. ( f eb i s focused e l e c t r o n beam. . . . . . . . . . . . . . . . . . . . . . 8
Microwave power t ransmission design concept . . . . . . . . 11
Typical rectenna conf igura t ion . . . . . . . . . . . . . . 11
Reference SPS microwave system. (XPDR is transponder; PIA i s power ampl i f ie r . ) . . . . . . . . , . . . . . . . 12
Reduction i n microwave power due t o e l e c t r i c a l and mechan- i ca l e r r o r s (power-module-level phase con t ro l ) , . . . . . 17
Grating loca t ions f o r a s i n g l e beam . . . . . . . . . . . . 19
Grating-lobe peaks f o r 10-meter subarrays and phase con- t r o l t o power modules ( tubes) . Conditions: 10-decibel Gaussian t ape r , 10' phase e r r o r , 21-decibel amplitude j i t t e r , 2-percent f a i l u r e ra te , and no subarray tilt . . . 19
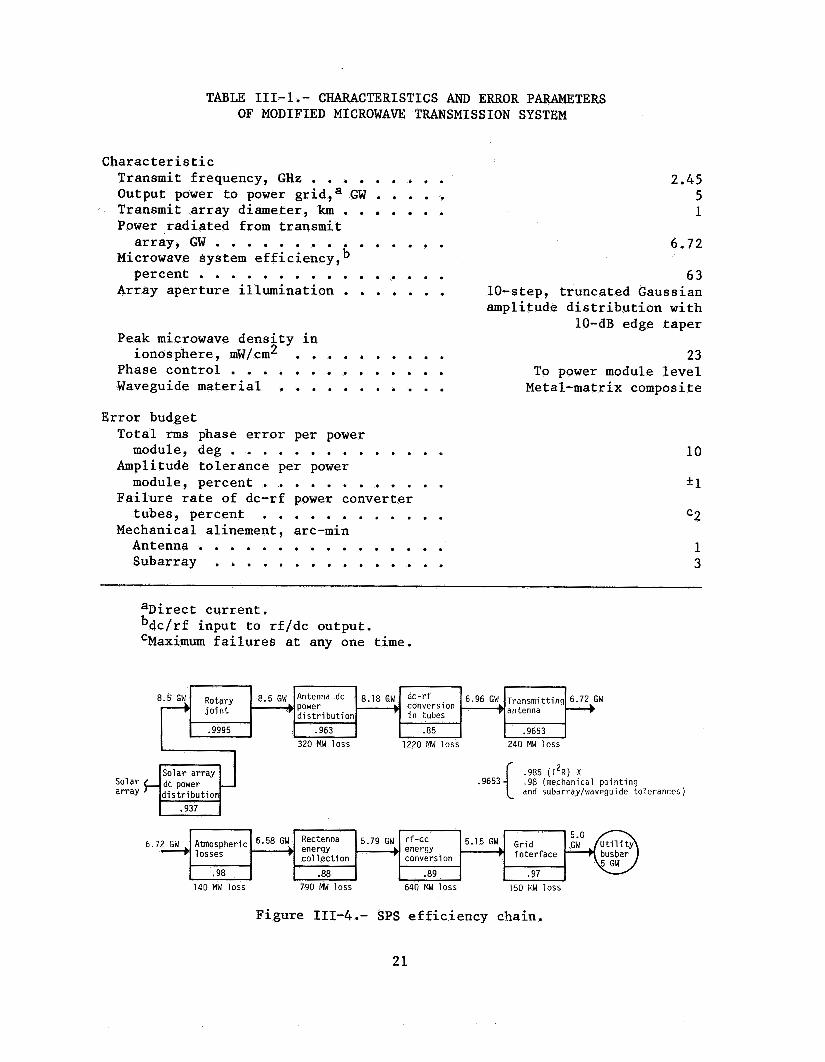
SPS e f f i c i e n c y chain . . . . . . . . . . . . . . . . . . . . 21
Sumary of c o s t s e n s i t i v i t i e s f o r a 10-percent change in subsystem losses . Antenna t i l t i s doubled from 1 t o 2 arc-minutes; a l l o ther subsystems have a 10-percent c h a n g e . . . . . . . . . . . . . . . . . . . . . . . . . . 25
Power dens i ty a t rectenna as a func t ion of d i s t ance f rombores igh t . . . . . . . . . . . . . . . . . . . . . . 34
Peak power dens i ty l e v e l s as a func t ion of range f romrec tenna . . . . . . . . . . . . . . . . . . . . . 35
Noise power dens i ty a t ground f o r a l-kilometer- diameter, 5-gigawatt SPS antenna. The absc issa i s a logari thmic scale, graduated from 1 t o 1000 megahertz and normalized t o 2450 megahertz . . . . . . . . 36
Harmonic noise power spectrum . . . . . . . . . . . . . . . 38
Microwave thermal noise l e v e l s f o r a s i n g l e 5-gigawatt SPS s i l i c o n s o l a r a r r ay . . . . . . . . . . . . . . . . 40
Input s tages and allowable power l e v e l s f o r t he TDRSS r e t u r n l i n k s . . . . . . . . . . . . . . . . . . . . . . . 42
xi i

Page Figure
III- 12
III- 13
111-14
III- 15
III- 16
III- 17
III- 18
III- 19
111-20
111-21
SPS pilot receiver functional diagram . (Receiver gains not shown.) . . . . . . . . . . . . . . . . . . . . . . . 45
Antenna/rectenna sizing summary . . . . . . . . . . . . . . 49
Electricity costs for 2.45-gigahertz systems . . . . . . . . 54
Electricity costs for 5.8-gigahertz systems . . . . . . . . 55
Antenna patterns for three SPS configurations . . . . . . . 57
Relative antenna/rectenna sizing configurations
(a) Single-antenna configurations . . . . . . . . . . . . . 58 (b) Multiple-antenna configurations . . . . . . . . . . . . 58
Solar power satellite phase control system . The master slave returnable timing system (MSRTS) provides cable delay compensation . . . . . . . . . . . . . . . . . . . . 68
Master slave returnable timing system . . . . . . . . . . . 70
MSRTS distribution network . . . . . . . . . . . . . . . . . 71
SPS transponder functional block diagram . . . . . . . . . . 72
111-22 One-sided pilot-signal power spectrum . . . . . . . . . . . 73
111-23 SPS transmission system (phase conjugation) . . . . . . . . 75
111-24 Signal and interference spectrum into SPS transponder
(a) SPS power transponder front end (conceptual) . . . . . 78 (b) Signal and noise spectrum . . . . . . . . . . . . . . . 78
111-25 Power pattern for 5O rms equivalent rf phase error in each level of the four-level phase distri- butiontree . . . . . . . . . . . . . . . . . . . . . . . 82
111-26 Geometry of the power pattern . . . . . . . . . . . . . . . 83
111-27 Location jitters of radiating and receiving elements . . . . 83
111-28 Curves of power-transfer efficiency as a function of total rms phase error for 10-kilometer-diameter rectenna with current taper of 10 decibels . . . . . . . . 84
111-29 Effect of amplitude jitter on SPS power-transfer efficiency (10-kilometer-diameter rectenna) . . . . . . . 85
. xiii

Figure Page
111-30 Effect of location jitters on the otherwise perfect SPS (10-kilometer-diameter rectenna) . . . . . . . . . . . 86
111-31 Power module phase control circuitry . . . . . . . . . . . . 89
111-32 Interferometric phase control . . . . . . . . . . . . . . . 89
111-33 Ground-based phase control system concept with major functional blocks . . . . . . . . . . . . . . . . . . . . 92
111-34 SPS ground-based phase control functional block diagram showing system timitig hierarchy . . . . . . . . . 93
111-35 Diagram showing effects of ionosphere on single-tone pilotbeam . . . . . . . . . . . . . . . . . . . . . . . . 96
111-36 Diagram of frequency-amplitude pattern . . . . . . . . . . . 99
III-37 Measurement of (320 . . . . . . . . . . . . . . . . . . . . 101
111-38 70-kilowatt klystron . . . . . . . . . . . . . . . . . . . . 105
111-39 Estimated effect of collector depression . . . . . . . . . . 108
111-40 Reference klystron depressed-collector design . . . . . . . 110 111-41 Methods of focusing klystron beam . . . . . . . . . . . . . 112 111-42 Weight comparison of high-power CW transmitters
operating at a frequency of 2.5 gigahertz
(a> Tube weight . . . . . . . . . . . . . . . . . . . . . . 115 (b) Tube specific weight . . . . . . . . . . . . . . . . . 116
111-43 Diagram illustrating the basic differences of construction and operation between the amplitron and the magnetron
(a) Amplitron . . . . . . . . . . . . . . . . . . . . . . . 118 (b) Magnetron . . . . . . . . . . . . . . . . . . . . . . . 118
111-44 Assembly architecture for the magnetron directional ampli- fier in the antenna subarray . Two subsections are shown . Microwave drive and all references and auxiliary power are inserted from the "backbone" of the subarray . The array has two distinct temperature zones . The top is used to radiate heat . The bottom is used for mounting solid-state components . . . . . . . . . . . . . . . . . . 120
xiv

Figure Page
111-45
111-46
111-47
111-48
111-49
111-50
111-51
111-52
111-53
Schematic diagram of phase and amplitude cont ro l of magnetron d i r e c t i o n a l ampl i f i e r output ( r e f . 25) . The proposed packaged u n i t is enclosed by dashed l i n e . Relat ionship t o SPS ove ra l l system i s in- d i ca t ed outs ide dashed l i n e . . . . . . . . . . . . . . . 122
T e s t bed f o r t h e phase and amplitude t racking inves t iga t ion , shown with s l o t ted-waveguide load as an opt ion . . . . . . . . . . . . . . . . . . . . 122
Spectrum of locked magnetron . . . . . . . . . . . . . . . . 124
Sol id-s ta te CW power s t a t u s f o r s i n g l e packaged devices i n 1978 . . . . . . . . . . . . . . . . . . . . . 127
Output power and power-added e f f i c i e n c y q as a func t ion of input power . . . . . . . . . . . . . . . . . 128
Patch resonator design . . . . . . . . . . . . . . . . . . . 130
Diagram of reference design subarray ( type 5) . . . . . . . 135
Typical T E l o slotted-waveguide a r r ay . . . . . . . . . . . 142
Thin-wall waveguide a r ray f a b r i c a t i o n concept . . . . . . . 145
111-54 Thin-wall waveguide a r r ay assembly concept . . . . . . . . . 145
111-55 Drawing of the two-plane rectenna cons t ruc t ion format cons is t ing of a r e f l e c t i n g screen or ground plane and the foreplane, which contains a d ipole antenna, wave f i l t e r s , diode r e c t i f i e r s , and busbars, a l l pro- tec ted from the environment by a m e t a l sh i e ld . . . . . . 152
111-56 Completed rectenna foreplane assembly cons is t ing of a metal l ic sh i e ld and the core assembly of f i v e rectenna elements. This s ec t ion has been subs t i - tu ted f o r a sec t ion of the three- level cons t ruc t ion i n a rectenna and found t o perform as w e l l . . . . . . . . 152
111-57 Geometrical layout of u n i t boundaries i n the rectenna. (Within each of the 10 r i n g s of u n i t s , d i f f e r e n t un i t power l e v e l s are used.) Symbols are as follows: NU = number of u n i t s , PT = t o t a l power, r B = bores ight r ad ius , and wr = r i n g width (117.18 meters) . . . . . . . . . . . . . . . . . . . . . 153
PU = u n i t power,
111-58 Wiring layout of t he four d i f f e r e n t panel designs used i n t h e rectenna . . . . . . . . . . . . . . . . . . . 154

Figure Page
111-59 Wiring layout of the seven different unit designs used in the rectenna for the low-voltage configuration . . . . . . 155
111-60 Block diagram of a typical group for the low- voltage configuration . Example shows a group within the inner ring (circle) of the rectenna aperture . . . . . 157
111-61 Rectenna rf baseline . . . . . . . . . . . . . . . . . . . . 160
111-62 Power-combining microstrip slotline antenna
(a) Breakaway view . . . . . . . . . . . . . . . . . . . . 168 (b) Electric-field profile . . . . . . . . . . . . . . . . 168
111-63 Solid-state dipole radiator module . . . . . . . . . . . . . 169 111-64 2.5-gigawatt solid-state SPS configuration . . . . . . . . . 171 111-65 SPS efficiency chain for solid-state separate
antenna system . . . . . . . . . . . . . . . . . . . . . . 172
111-66 Microwave power density as a function of distance from rectenna boresight for the 2.5-gigawatt, 1.42-kilometer antenna diameter. solid-state system . . . . . . . . . . . . . . . . . . . . . . . . . . 174
111-67 64-module panel layout . . . . . . . . . . . . . . . . . . . 175 111-68 Subarray assembly (324 panels. 20 736 modules) . . . . . . . 176 111-69 Alternative solid-state-sandwich concepts
(a> Concept 1: flat primarylfaceted secondary . . . . . . 179 (b) Concept 2: flat secondary/faceted primary . . . . . . 179 (c) Concept 3 : inclined antennalsingle faceted
reflector . . . . . . . . . . . . . . . . . . . . . . . 179 (d) Concept 4: rf reflector/single multifaceted
reflector . . . . . . . . . . . . . . . . . . . . . . . 179 (e) Concept 5: Multiple-antenna concept . . . . . . . . . 179
111-70 Solid-state-sandwich concepts
(a) Single . . . . . . . . . . . . . . . . . . . . . . . . 181 (b) Dual . . . . . . . . . . . . . . . . . . . . . . . . . 182
111-71 Efficiency chain for sandwich configuration . . . . . . . . 186 111-72 Effects of antenna tilt on power density at the
first three grating lobes . . . . . . . . . . . . . . . . 186
mi
Page Figure
III- 7 3
111-74
111-75
111-76
111-77
IV- 1
IV-2
IV- 3
IV-4
IV- 5
IV-6
IV- 7
IV- 8
IV- 9
IV- 10
IV- 11
IV- 12
IV- 13
IV- 14
Effects of subarray tilt on microwave scattered power . . . 187 Spacetenna total view
(a) Bottom . . . . . . . . . . . . . . . . . . . . . . . . 189 (b) Top . . . . . . . . . . . . . . . . . . . . . . . . . . 189
Satellite sandwich antenna/solar cell panel configuration (preliminary) . . . . . . . . . . . . . . . 190
Phase reference-signal distribution system for solid-state- sandwich concept . . . . . . . . . . . . . . . . . . . . . 191
Reference-signal control loop . . . . . . . . . . . . . . . 192 Simplified functional diagram of MSRTS . . . . . . . . . . . 194 Three-node test configuration . . . . . . . . . . . . . . . 196 Histogram of three-node test results . . . . . . . . . . . . 196 Pilot-transmitter block diagram . . . . . . . . . . . . . . 197 Central pilot receiver block diagram . . . . . . . . . . . . 198
199
Laboratory end-to-end system test concept . . . . . . . . . 201 Pilot/conjugation receiver block diagram . . . . . . . . . .
SPS reference phase control system . . . . . . . . . . . . . 201 SPS fiber optics dual-link system . . . . . . . . . . . . . 202 Initial SPS 980-megahertz fiber optics link test . . . . . . 202 Phase delay as a function of temperature for IVPO fiber . . . . . . . . . . . . . . . . . . . . . . . . . . 203
Beamed rf power technology: eight-element experimental active retrodirective array block diagram . . . . . . . . 205
Potential SPS pilot-link receiving-antenna con- figurations . The double-dipole configurations afford partial noise cancellation . . . . . . . . . . . . 210
Power-combining antenna. feed network. and power amplifier block diagram . . . . . . . . . . . . . . . . . 213
xvi i

Figure Page
IV-15 Antenna range gain pattern for the first power- combining microstrip antenna (feed network number 2) . . . . . . . . . . . . . . . . . . . . . . . . 216
IV-16 Test resultst maximum power and maximum efficiency tuning.. . . . . . . . . . . . . . . . . . . . . . . . . 219
IV-17 Theoretical and experimentally observed electronic efficiencies of conventional microwave oven magne- tron and 915-megahertz magnetron. Electronic effi- ciency is efficiency of conversion of dc power into microwave power. cuit inefficiencies that can be ascertained from cold-test data . . . . . . . . . . . . . . . . . . . . . . 222
Overall efficiency includes cir-
IV-18 Large-scale ionospheric irregularity deflecting and focusing pilot signal . . . . . . . . . . . . . . . . . . 227
IV-19 Small-scale ionospheric irregularities acting as volume scatterer of pilot signal . . . . . . . . . . . . . 229
xviii

ABBREVIATIONS AND ACRONYMS
A
ac
ACQ
AGC
AM0
AMP
ARA
ARL
BPF
BW
CC I R
CDEP
CFA
CMT
C ont
CR
C T E
cw
dBc
dBm
dBW
dc
DCA
DE C
D e t
amp 1 i f i e r
a l t e r n a t i n g cur ren t
ac qu i s it ion
automatic gain con t ro l
a i r mass zero
ampl i f i e r
ac t ive r e t r o d i r e c t i v e a r r ay
Applied Research Laboratory
band-pass f i l t e r
bandwidth
In t e rna t iona l Radio Consul ta t ive Committee
Concept Development and Evaluation Program
crossed-f ie ld ampl i f i e r
coherent mu l t ip l e tone
cont ro l1 er
concentrat ion r a t i o
c o e f f i c i e n t of thermal expansion
continuous wave
dec ibe ls below carr ier l e v e l
dec ibe ls referenced t o 1 m i l l i w a t t
dec ibe ls referenced t o 1 wat t
d i r e c t cur ren t
d i r e c t coupled ampl i f i e r
dec is ion
de tec to r
x i x

DIP
DOE
DWG
ECM
EDL
E IRP
EM
EM1
EOTV
ERP
E STL
E -W
feb
FEL
FET
G BED
GEN
GEO
HLLV
HPA
IC
i.f.
TMPATT
IPC
IRU
ISM
d i p 1 exer
Department of Energy
distribution waveguide
electronic countermeasures
electric discharge laser
effective isotropic radiated power
electromagnet; electromagnetic
electromagnetic interference
electric orbital transfer vehicle
effective radiated power
Electronic Systems Test Laboratory
east- wes t
focused electron beam
free electron laser
field-effect transistor
Ground-Based Exploratory Development
generator
geosynchronous orb it
heavy lift launch vehicle
hi gh-power amp1 i f ier
integrated circuit
intermediate frequency
impact avalanche transit time
interferometric phase control
interface return unit
industrial, scientific, and medical
xx
ITS
IVPO
JPL
JSC
KSA
LEMSCO
LEO
LJ
L.O.
LPF
MA
MBG
MESFET
MJ
ML I
mod
MO S
MPE
MPJ
MPTS
MSFC
MSRTS
MTBF
N.A.
NASA
Navsat
Institute for Telecommunication Sciences
inside vapor phase oxidation
Jet Propulsion Laboratory
Lyndon B. Johnson Space Center
K-band single access
Lockheed Engineering and Management Services Company
low Earth orbit
location jitter
local oscillator
low-pass filter
multiple access
mu 1 t i b and gap
metal Schottky barrier field-effect transistor
megajoule
multilayer insulation
modulation
metal-oxide semiconductor
mechanical pointing error
jitter on mechanical pointing
microwave power transmission system
George C. Marshall Space Flight Center
master slave returnable timing system
mean time between failures
numerical aperture
National Aeronautics and Space Administration
navigation satellite
xxi

NB S
NEC
N- S
osc PA
PIA
PCC
PCU
PD
PLV
PM
PMA
PN
PNSS
POTV
PPM
PTAR
PTU
RCA
RCR
RCVR
re c tenna
rf
RFI
rms
RPD S
National Bureau of Standards
Nippon Electric Company
nor th-sou th
oscillator
power amplifier
power amplifier
phase control center
power control unit
phase detector
personnel launch vehicle
permanent magnet
phase-measurement antenna
pseudonoise
PN synchronization system
personnel orbital transfer vehicle
periodic permanent magnet
power transmission and reception
phase tracking unit
Radio Corporation of America
resonant cavity radiator
re c e i ve r
rectifying antenna
radiofrequency
radiofrequency interference
root mean square
reference phase distribution system
xxi i

rss
RWG
SA
S /A
scu SMART
SJM
SOA
space t enna
SPS
ss
S SA
SYNC
TDRSS
TE
TECU
TRAPATT
TT&C
TWT
tYP.
vco
vsm XMTR
XPDR
root sum square
radiating waveguide
single access
Scientific Atlanta
signal-conditioning unit
solar microwave array technology
signal-to-noise ratio
state of the art
space-based transmission antenna
solar power satellite
spread spectrum
S-band single access
synchronization
Tracking and Data Relay Satellite System
transverse electric
total electron content unit
trapped plasma avalanche triggered transit
tracking, telemetry, and command
traveling-wave tube
typical
voltage-controlled oscillator
voltage standing-wave ratio
transmitter
trans ponder
xxiii

A
A1
B
C
co
co2
D
E
e
f
f P
f r
f r 1, fr2
f U
G
G a A s
SYMBOLS
amplitude of p i l o t s igna l ( f i g . 111-12); quan t i ty def ined i n equat ion (25)
a 1 uminum
sur f ace b r i gh t ne s s
r a t i o of magnetic f i e l d t o design value
quant i ty used i n equat ion ( 7 )
AGC b i a s cont ro l inputs
speed of l i g h t i n a vacuum
carbon monoxide
carbon dioxide
antenna d i r e c t i v i t y ; antenna diameter
e l e c t r i c f i e l d vec tor
e l e c t r o n charge
t i m e €unction i n f i g u r e I V - 1
frequency
center frequency
downlink frequency
carr ier frequency; cen te r frequency ( f i g . 111-76)
low-pass f i l t e r t r a n s f e r func t ion
p i l o t c a r r i e r frequency; plasma frequency
re ference frequency
generat ing frequencies
upl ink frequency
antenna ga in
gall ium arsenide
xxiv

m
N
NC
NU
signal gain
1-kilometer-diameter antenna gain at 2.45 gigahertz
1-kilometer-diameter antenna gain at n-th harmonic
antenna gain of average klystron power module
harmonic antenna gain relative to fundamental
antenna gain of average solid-state power module
slot conductance
magnetic field vector
loop filter function
current
power dissipated as heat
design current
coherent power beam signal power
total isolation
quantity representing ionospheric effects on downlink signal
quantity representing ionospheric effects on uplink signal
antenna gains
physical path length
inner scale length of variations
thickness of irregularity region
path length; slot length
PN code length
shift-register sequence; electron mass (eq. ( 7 ) )
electron density
electron columnar content
number of units
xxv

n
PD
PH
pH- gr
pL€I
Pr
PT
PT-K (N
PT-ss (N
PU
R
RC
r(t>
rB
re
r0
S(f
sP
S
s(t)
t
Umax
refractive index
power density
n-th harmonic power transmitted
harmonic power density at the ground
harmonic power relative to fundamental
received power
fundamental (2 .45 gigahertz) power transmitted; total power (fig. 111-57)
transmitted noise power from klystron antenna
transmitted noise power from solid-state antenna
unit power
resistance; range; radius of curvature (eq. ( 3 4 ) 1
PN chip rate
time function in figure IV-1
boresight radius
classical radius of the electron
Fresnel zone radius
power spectrum
pilot signal received power level
slope; path
time function in figure W-1
signals transmitted from reference transmitter
signal transmitted by power module being phase tuned
electromagnetic field propagation configuration, l < m < 1 0 - -
time
maximum radiation intensity
xxv i

'$1
rl
r lC
nCC T
rle
a
oi
OJ
X = 360°
average radiation intensity
voltage
design voltage
gate bias voltage
ring width
time function in figure IV-1
time function in figure I V - 1
change; phase change due to path distance (fig. IV-2)
rms density perturbation
quantity defined in equation (14)
quantity defined in equation (15)
quantity defined in equation (16)
free-space permittivity
efficiency
collector recovery efficiency
circuit efficiency
electronic efficiency
inclination angle; azimuth angle variable (Sec. IV)
beam width
phase jitter
reference-signal phase
reference-signal phase (fig. IV-6)
wave 1 eng th
parameter used for estimating antenna location jitter
waveguide wavelength
free-space wavelength
xxvii

GGJ
6
6 i
4%
60
6s
61
62
v Q
‘I)
(00
Su pe r s c r i p t s
R
T
Sub s e r i p t
down
c a r r i e r recovery loop phase j i t t e r
phase; e l eva t ion angle va r i ab le (Sec. IV)
received p i l o t s i g n a l phase ( f i g . IV-6)
ref erence-signal phase
i n i t i a l VCO phase
t r ans fe r r ed phase
channel-induced phase s h i f t a t
channel-induced phase s h i f t a t
conjugated phase
angular space
angular frequency
reference- s igna l radian frequency
fo + Af
f, - Af
rece iver
t r ansmi t t e r
downlink
x x v i i i

SUMMARY
The solar power satellite Concept Development and Evaluation Program was conducted jointly by the National Aeronautics and Space Administration and the Department of Energy. tion system, the purpose of the program was to refine concepts within the ini- tial constraints of providing electricity at minimum cost and maximum effi- ciency and of maintaining a transmitting antenna power density limit of 23
and a power transmission frequency of 2.45 gigahertz. On the basis of these constraints, the basic klystron reference configuration was optimized at 5 gigawatts power delivered to the utility grid, a 1-kilometer-diameter trans- mitting antenna, and a 10-kilometer-diameter ground rectifying antenna. Sys- tem sizing trade-off studies were performed, and alternative concepts such as solid-state power amplifiers were considered. Certain critical supporting investigations were performed to develop a better understanding of hardware implications in the areas of phase control, power amplifiers, and radiating elements. Finally, a workshop was held to evaluate the results of the program and to make recommendations for subsequent development efforts.
With respect to the power transmission and recep-
kW/m2, a maximum radiofrequency power density in the ionosphere of 23 mW/cm 2 ,
1


I. INTRODUCTION
This report is a summary of the technical assessment activities on the solar power satellite (SPS) power transmission and reception (PTAR) system which took place during the Department of Energy (DOE)/NASA Concept Develop- ment and Evaluation Program (CDEP). It is one of a series of SPS CDEP techni- cal summary and assessment reports. Three major topics are treated: PTAR system studies, experimental investigations, and conclusions. Within the PTAR system studies area (Section 111) is a section on each of the major subsystems (system performance, phase control, power amplifiers, radiating elements, and rectenna) plus a section on solid-state configurations.
One of the major outputs of the assessment activities was the SPS refer- ence configuration as documented in reference 1. Assessment activities performed after the issuance of the reference configuration report are documented herein. Changes to the reference configuration are discussed, al- ternative concepts for each subsystem are presented, the system workshop is discussed, conclusions are presented, and remaining issues are identified.
Section I1 contains an overview of all PTAR system assessment activ- ities during the SPS CDEP. Section I11 contains a section on each of the major subsystems. Each of those sections includes a discussion on alternate approaches, changes to the reference configuration as applicable, and the conclusions reached and issues identified. Section IV contains a discussion of the critical technology supporting investigations performed in the areas of phase control, power amplifiers, and radiating elements. The conclusions reached and the issues identified on the PTAR system level are presented in Section V.
In compliance with the NASA's publication policy, the original units of measure have been converted to the equivalent value in the Syst\eme Interna- tional d'Unite/s (SI). and the original units are written parenthetically thereafter,
As an aid to the reader, the SI units are written first
3


11. OVERVIEW
Def in i t i on and assessment of the SPS PTAR system has been an important p a r t of the DOE/NASA Concept Development and Evaluation Program ( r e f . 2). A de ta i l ed desc r ip t ion of t he microwave PTAR system is contained i n the SPS ref - erence system repor t ( r e f . 1) as w e l l as discussions of system and subsystem trade-offs which l ed t o the reference system. Since then, major system as- sessment a c t i v i t i e s have been i n support of (1) so l id - s t a t e PTAR system s tud ie s , (2) c r i t i c a l technology supporting inves t iga t ions , and ( 3 ) continued PTAR system and subsystem trade-offs. analyzed f o r ove ra l l SPS in t eg ra t ion f e a s i b i l i t y but not t o the depth of the microwave system ana lys is . references 3 and 4 .
Preliminary laser concepts have been
A discuss ion of laser concepts i s contained i n
System assessments have genera l ly r e su l t ed i n the conclusion tha t t r a n s f e r r i n g gigawatt power l e v e l s between two poin ts using microwaves i s t echn ica l ly f eas ib l e . Certain changes a re recommended t o the reference con- cept regarding phase cont ro l t o the power module l e v e l , al lowable amplitude j i t ter on the antenna, and startup/shutdown procedures. Al te rna t ive concepts have been s tudied i n each subsystem area as follows.
1. System performance - smaller sys t ems , mul t ip le beams
2. Phase control - r e t r o d i r e c t i v e , ground based
3. Power ampl i f ie rs - klys t ron , magnetron, and s o l i d s t a t e
4 . Radiat ing elements - s l o t t e d waveguide, resonant cavi ty , aluminum (All, metal-matrix composites
5. Rectenna - dipoleldiode, yagi-uda/diode, other higher gain rece ive e 1 anent s
Cer ta in c r i t i c a l supporting inves t iga t ions have developed a b e t t e r under- standing of the hardware implicat ions i n the phase cont ro l , power ampl i f ie r , and radiating-element areas . The subsystem s tud ie s are summarized i n subse- quent sec t ions . The microwave s y s t e m conclusions and remaining i ssues a r e documented i n the l a s t sect ion.
A. SYSTEM ASSESSMENT ACTIVITIES
A considerable body of information has been developed as pa r t of the j o i n t DOEINASA program; t h i s material W i l l serve as an exce l len t da ta base fo r f u t u r e a c t i v i t i e s i n t h i s area. Most a c t i v i t i e s have been contracted e f - f o r t s through the two NASA SPS cen te r s , the Lyndon 3. Johnson Space Center (JSC) and the George C. Marshall Space P l i g h t Center (MSFC). Also, a consid- e r a b l e amount of in-house e f f o r t has been devoted t o spec ia l p ro jec ts . All these e f f o r t s were t i ed together i n a major peer review and assessment proc- ess a t the SPS Workshop on Microwave Power Transmission and Reception ( r e f . 5) .
5

1. SOLAR POWER SATELLITE CONTRACTED EFFORTS
System evaluat ion a c t i v i t i e s f a l l i n t o three major areas, each of which received an approximately equal share of funding: system s tud ie s ( inc luding t h a t por t ion of the ove ra l l SPS system d e f i n i t i o n s tud ie s concentrated on the microwave system and subsystems) conducted pr i - mari ly by Boeing Aerospace Company and Rockwell In t e rna t iona l ; (b) independ- e n t subsystem s tud ie s ( including phase cont ro l , power ampl i f ie rs , antenna, rectenna, and ionospheric e f f e c t s ) conducted by a v a r i e t y of cont rac tors ; and ( c ) experimental c r i t i c a l supporting inves t iga t ions conducted by var ious con t r ac to r s i n the areas of phase cont ro l , s o l i d s t a t e , magnetron, waveguide, and ionospheric e f f e c t s .
( a ) microwave
2. IN-HOUSE NASA EFFORTS
The NASA in-house e f f o r t s have consis ted of both contracted
A sonic s imulator of the microwave system has s tud ie s and experiments funded with non-SPS funds and spec ia l s tud ie s con- ducted by NASg personnel. been evaluated f o r poss ib le use i n inves t iga t ing e f f e c t s of the d is turbed ionosphere on the phase cont ro l upl ink p i l o t s igna l . modeled to eva lua te l e v e l s and pa t t e rns r e s u l t i n g from harmonic and funda- mental r e rad ia t ion . System in t e r f e rence and environmental e f f e c t s due t o radiofrequency ( r f ) beat-frequency generat ion from mul t ip l e SPS's have been inves t iga ted . Also, metal-matrix composites (e.g., g raphi te aluminum) have been evaluated i n severa l areas: ( a ) c a p a b i l i t y to maintain the c lose to l e r - ances required by the SPS waveguides under thermal stress, (b) r f performance c h a r a c t e r i s t i c s , ( c ) f a b r i c a t i o n techniques, and (d) r ep roduc ib i l i t y .
The rectenna has been
Some of the s p e c i a l s tud ie s conducted by NASA personnel have in- cluded technica l and economic trade-offs of small SPS systems configured with l a r g e r antennas, smaller rectennas, and less power t o the gr id . Also, poten- t i a l a reas of i n t e r f e rence have been inves t iga t ed including SPS t o SPS, SPS t o Tracking and Data Relay Sa te l l i t e System (TDRSS), power beam t o upl ink p i l o t s igna l , and covert in te r fe rence . Resul t s i n d i c a t e the ex is tence of s u f f i c i e n t s igna l - to- in te r fe rence margins.
3. SYSTEM WORKSHOP
A s p a r t of the system assessment a c t i v i t i e s , the SPS Workshop on Microwave Power Transmission and Reception was held a t JSC on January 15 t o 18, 1980. This workshop evaluated a l l the e f f o r t s funded as pa r t of the DOE/ NASA SPS Concept Development and Evaluat ion Program as well as h i s t o r i c a l data i n some areas . Peer review was accommodated by having the workshop ma te r i a l assessed and c r i t i qued by a review panel cons i s t ing of prominent ind iv idua ls i n the f i e l d . Additional evaluat ions made following the workshop addressed some of the areas c r i t i qued by the review panel. These evaluat ions are con- ta ined i n t h i s repor t .
a. Workshop Organization
The objec t ives of the workshop w e r e (1) t o assess and c r i - t ique the assumptions, methodologies, and conclusions of the inves t iga t ions
6

and (2) t o assess and c r i t i q u e the c r i t i c a l i s sues i d e n t i f i e d and the rec- ommended follow-on work. The workshop addressed a l l aspects of microwave PTAR system a c t i v i t i e s including s tud ie s , analyses , and labora tory inves t i - gations. It was organized i n t o e igh t sessions as follows: General, System Performance, Phase Control, Power Amplifiers, Radiating Elements, Rectenna, Sol id-s ta te Configurations, and Planned Program Ac t iv i t i e s . As pa r t of t he documentation of the workshop, sumary papers were published and d i s t r i b u t e d ( r e f . 5).
b. Review Panel Report: Sumnary
The consensus of the workshop review panel was t h a t a 5- gigawatt microwave PTAR system would probably be t echn ica l ly f eas ib l e ; how- ever, a l a r g e amount of work was believed t o be necessary i n a number of areas t o e s t a b l i s h c e r t a i n t y and t o determine system e f f i c i ency , r e l i a b i l i t y , r f compat ibi l i ty , s ecu r i ty , sa fe ty , longevi ty , and cost . The panel bel ieved t h a t the f i n a l system may not resemble the cur ren t reference system and urged NASA t o recognize t h i s d i f f e rence i n a l l f u t u r e planning. The Ground-Based Exploratory Development (GBED) program appeared t o be excessively in tegra ted with the reference system.
The panel recommended more a t t e n t i o n t o system engineering, f a i l u r e ana lys i s , s e n s i t i v i t y s tud ie s t o optimize cost e f fec t iveness , system s e c u r i t y and antijamming f ea tu res , and per iodic ove ra l l design reviews t o update c r i t i c a l design parameters. I n view of the magnitude and p o t e n t i a l im- portance of the SPS, the panel recommended major program management s t a t u s and a s ing le program o f f i c e within NASA fo r g rea t e r coordinat ion of the con- t r a c t o r e f f o r t s .
F ina l ly , the panel recognized the outstanding e f f o r t t o da te by the SPS team and the very good progress made. repor t is included i n t h i s document as an appendix.
The complete review panel
B. SYSTEM OPTIONS
Inves t iga t ion of concepts f o r power transmission and recept ion has been concentrated on microwaves as a t ranspor t means, although preliminary l a s e r concepts have recent ly been analyzed f o r ove ra l l SPS in t eg ra t ion f eas i - b i l i t y . Although the use of l a s e r s o f f e r s s eve ra l p o t e n t i a l advantages (smaller blocks of power; not subjec t t o poss ib le long-term, low-level micro- wave e f f e c t s ) , these a r e o f f s e t by major d i f f i c u l t i e s (achieving high- e f f i c i ency power t r a n s f e r , laser system complexity, atmospheric propagation c h a r a c t e r i s t i c s , and general state of technology development). Only micro- wave system concepts are considered herein.
Microwave transmission can be accomplished i n a v a r i e t y of ways. Five opt ions a re i l l u s t r a t e d i n f igu re 11-1. The power ampl i f i e r s ( r f con- v e r t e r s ) can be located on an antenna which i s separa te from the photovol ta ic a r ray or they can be an i n t e g r a l p a r t of the photovol ta ic array. I n turn , the sepa ra t e antenna can be designed t o accommodate a l l t h ree types of power amplif iers : l i n e a r beam ampl i f ie rs , crossed-f ie ld ampl i f ie rs (CFA'S), and s o l i d - s t a t e devices. The primary advantage of the separa te antenna
7

RF Converter
SPS Design
Power output to grid
Space antenna diameter
ounted (concentration ratio= 3)
Optical reflector rf reflector
K lys t~n or CFA lid state Solid state
2.5 OW 11.2 GW 0.2 OW per km* solar cells
1 km 1.4 km I .77 km High-power waveguide
Rectenna diameter at 23mWlcm’ 10km 7.1 km 5.0 km Not determined
Antenna taper Un~orm horn feb paraboloid
Figure 11-1.- Microwave system opt ions . ( f e b is focused e l e c t r o n beam.)
8

i s that i t can accommodate maximum packing dens i ty of the power ampl i f ie rs up t o the thermal d i s s i p a t i o n l i m i t . Because of the power thermal l i m i t s (channel temperature) on so l id - s t a t e ampl i f ie rs , t ransmit ted power i s not as g rea t and the antenna is l a r g e r when compared t o a tube configurat ion. This disadvantage is even g rea t e r f o r t he in t eg ra t ed photovoltaic/solid-state power ampl i f ie r opt ion s ince t h i s configurat ion is l imited by area and prime power r a t h e r than by temperature. Overall s i z e per del ivered k i lowat t of t h i s configurat ion is a l s o l a rge r . so l id - s t a t e concept (both separa te and in tegra ted antenna) a r e higher relia- b i l i t y (and thus lower maintenance cos t s ) and g rea t e r amenabili ty t o mass manufacturing.
The major an t i c ipa t ed advantages of the
The in tegra ted so l id - s t a t e r f r e f l e c t o r opt ion r e s u l t s i n conversion of photovol ta ic d i r e c t cur ren t (dc) immediately t o r f and i n r f d i s t r i b u t i o n along the a r ray t o a r e f l e c t o r antenna. This opt ion was dropped from f u r t h e r cons idera t ion because of the d i f f i c u l t technology development requirements an t ic ipa ted i n the d i s c i p l i n e s of r f waveguides and r f r e f l e c t o r s .
Of the f i v e opt ions i l l u s t r a t e d , the antenna-mounted k lys t ron config- ura t ion has been thoroughly evaluated and developed i n t o the current SPS ref - erence system. Within the las t seve ra l years , projected e f f i c i ency , gain, and power output of so l id - s t a t e devices have made them a t t r a c t i v e f o r appl ica t ion t o the SPS concept. The separa te antenna conf igura t ion and the in t eg ra t ed photovoltaic /power amp1 i f i e r ( so-ca 11 ed " sandwich" ) configurat ion were evalua- ted f o r technica l and cos t e f fec t iveness . To the depth s tudied , i t appears t ha t cos t per k i lowat t may be somewhat higher than tha t of the reference sys- tem, although, as cost es t imates have been re f ined , the cos t s have trended toward convergence.
C. SYSTEM DEFINITION DRIVERS
Several basic assumptions and cons t r a in t s a f f e c t the t o t a l microwave PTAR system de f in i t i on . The cur ren t k lys t ron reference configurat ion w a s optimized a t 5 gigawatts del ivered t o the u t i l i t y g r id , a l-kilometer- diameter t ransmit antenna, and a 10-kilometer-diameter rectenna. This op t i - mization was based on two assumptions and three assumed cons t r a in t s (based on analyses 1 as follows.
1. Minimum cost of e l e c t r i c i t y
2. Project ions of system e f f i c i e n c i e s
3.
4.
Transmit antenna r f power dens i ty l i m i t of 23 kW/m2
Maximum r f power dens i ty i n the ionosphere of 23 mW/cm 2
5. Power transmission frequency of 2.45 gigaher tz
These assumptions are the same f o r the s o l i d - s t a t e configurat ions except t ha t (1) the operat ing temperature is i n the range 373 t o 398 K (100' t o 125O C) and (2) t he projected system e f f i c i e n c i e s are based on the use of so l id - s t a t e ampl i f ie rs . These assumptions and assumed cons t r a in t s a r e based on bes t
9

ava i l ab le analyses and experimental data; i f they are changed, d e f i n i t i o n of the system a l s o changes. For example, i f the ionospheric l i m i t i s changed t o 54 niW/cm2, the rectenna diameter can be reduced t o 6 . 8 kilometers , with an in- crease i n transmit antenna diameter t o 1.5 ki lometers and an increase i n cos t of e l e c t r i c i t y of 17 percent. This change i n the re ference s i z ing may be an acceptable a l t e r n a t i v e ; however, the c r i t i c a l requirement is a realis- t i c assessment of the ac tua l ionospheric power dens i ty l i m i t . Various trade- o f f s using d i f f e r e n t assumptions and cons t r a in t s have been made and are discussed i n Sect ion I I I . A . 4 and documented i n reference 6 .
D. REFERENCE SYSTEM UPDATES AND STUDIES
The microwave system i s defined i n re ference 1. The concept f o r power transmission i s shown i n f igu re 11-2. In t h i s concept, the l i n e a r beam k lys t ron i s used t o convert from dc t o r f energy. together with a cooling system, slotted-waveguide r a d i a t o r s , phase cont ro l re- ce ive r and conjugation e l ec t ron ic s , and o ther necessary hardware comprise the t ransmit antenna power module. There a re 4 t o 36 power modules i n an antenna subarray depending on t he subarray loca t ion with respec t t o the ove ra l l tapered antenna array. There are 7220 subarrays i n the 1-kilometer-diameter array.
The 70-kilowatt k lys t ron
The rece iv ing ar ray ( rec tenna) on the ground i s character ized by im- mediate r e c t i f i c a t i o n from r f t o dc. A t yp ica l configurat ion i s shown i n f ig- ure 11-3. Individual d ipole antennas are used as the receiving element, and, s ince r e c t i f i c a t i o n takes place immediately, dc power is co l lec ted from each element and fed i n t o p a r a l l e l and s e r i e s s t r i n g s t o bu i ld up the vol tage and cur ren t l eve l s . Figure 11-4 is an i l l u s t r a t i o n of the ove ra l l microwave PTAR concept and shows subsystem i n t e r r e l a t i o n s h i p s i n both the transmit and the receive arrays.
A s a r e s u l t of continuing NASA and cont rac tor system inves t iga t ions and trade-offs s ince 1978, the following changes are made t o the reference system: (1) phase conjugation is performed a t the power module l e v e l (101 552 po in t s ) r a the r than a t the subarray l e v e l (7220 poin ts ) ( f i g . 11-41, (2) allow- a b l e amplitude j i t t e r across the sur face of a subarray is changed from +1 dec- i b e l t o 21 percent, and (3) t o ensure tha t SPS startup/shutdown procedures produce side-lobe l eve l s lower than s teady-state l eve l s , the three allowable sequences a r e random, incoherent phasing, and center- to-edge concentr ic r ings . In add i t ion t o the inves t iga t ions t h a t r e su l t ed i n these changes, a considerable number of other s tud ie s have contr ibuted t o a b e t t e r understand- ing of the SPS concept and t o the microwave PTAR data base. These s tud ie s a re h ighl ighted i n the following paragraphs and discussed i n more d e t a i l i n subsequent sec t ions .
1. SYSTEM PERFORMANCE
System performance s tud ie s were concentrated on ( a ) parametric e f f e c t s f o r a l l elements i n the e f f i c i ency chain, (b) ionospheric analyses and tes t r e s u l t s from Arecibo, Puerto Rico, and P l a t t e v i l l e , Colorado, ( c ) radiofrequency in t e r f e rence (RFI)/electromagnetic i n t e r f e rence (EMI) f o r the t ransmit array and the rectenna, (d) reshaping of the power beam, and ( e ) mul- t i p l e beams from one transmit a r ray .
10

70-kW heat- p i pe-
coo led k I ystron
Figure 11-2.- Microwave power transmission design concept.
antenna D i p o l e J Figure 11-3 .- Typical rectenna configurat ion.
11

Reference S PS microwave system
inverter blocks
Rectenna arrays, Power- panels, units, combining and groups network s 1
Rectenna Radiating module
Antenna element
and conjugation
Figure 11-4.- Reference SPS microwave system. (XPDR i s transponder; PIA is power ampl i f ie r . )
12

2. PHASE CONTROL
Work i n the phase cont ro l area w a s concentrated on def in ing t h e re ference phase con t ro l system f o r SPS. Al te rna te concepts a l s o were s tudied including in te r fe rometer and coherent multiple-tone ground-based systems ( r e f s . 5, 7, and 8). A major concern f o r a l l the phase con t ro l system con- cepts was the l ack of a n a l y t i c a l or experimental da ta on the ionosphere us- a b l e f o r p red ic t ing phase e r r o r s i n the presence of ionospheric dis turbances.
3. POWER AMPLIFIERS
Besides the inves t iga t ions i n t o the k lys t ron and i t s i n t e g r a t i o n i n t o the system, power ampl i f i e r study e f f o r t s were concentrated on so l id- s t a t e ampl i f i e r s and the magnetron. Considerable advancement i n gal l ium arsenide (GaAs) f i e ld -e f f ec t t r a n s i s t o r s (FET's) over the pas t several years has ind ica ted t h a t pro jec ted parameters of e f f i c i e n c y , power output , and gain may be s u i t a b l e f o r use i n the SPS concept ( r e f s . 5 and 9). I n t e r e s t i n the magnetron w a s renewed when it w a s determined t h a t t h e inherent noise levels could be reduced considerably when the f i lament w a s turned of f a f t e r i n i t i a l s t a r tup .
4 . RADIATING ELEMENTS
The main t h r u s t s i n the radiating-element area were t o inves t i - ga te c h a r a c t e r i s t i c s of a slotted-waveguide a r ray , need f o r and cha rac t e r i s - t i c s of a separa te rece ive aper ture , and i n i t i a l i nves t iga t ions i n t o high- accuracy measurement techniques.
5. RECTENNA
The reference rectenna concept provides an extremely e f f i c i e n t means of rece iv ing r f and convert ing it i n t o dc f o r use by the u t i l i t y gr id . One of the disadvantages i s the tremendous number of receive antennas/ r e c t i f i e r s required. Several s tud ie s were conducted t o reduce the number of elements and t o reduce the manufacturing cos t s of the l a r g e number of ele- ments required ( r e f s . 5 and 10)- Problems of r e r a d i a t i o n (both fundamental and harmonic) w e r e a l s o inves t iga ted ( r e f s . 5 and 10).
E. SOLID-STATE CONFIGURATIONS
Because of the continued advancement of s o l i d - s t a t e technology, ap- p l i c a t i o n of t h i s technology t o SPS appears promising. As i l l u s t r a t e d i n f ig- ure 11-1, the re are two bas i c conf igura t ions f o r the so l id - s t a t e appl ica t ion : a sepa ra t e antenna s imi l a r t o the re ference concept and an in t eg ra t ed pho tovol ta ic / antenna or sandwich approach.
Both of these concepts are charac te r ized by l a r g e r antennas (due to device cool ing requirements), g r e a t e r sa te l l i t e mass per k i lowat t of de l ivered power, lower output t o the u t i l i t y g r i d , and smaller rectennas. They have the advantage of increased r e l i a b i l i t y and thus lower maintenance cos t s . Disadvantages include increased phase con t ro l system complexity,
13

lower vol tage (higher loss) dc power d i s t r i b u t i o n ( f o r the separa te antenna), l a r g e r p a r t s count, and poss ib le increased noise generat ion and EM1 suscept i - b i l i t y .
3'. CRITICAL SUPPORTING INVESTIGATIONS
C r i t i c a l supporting inves t iga t ions are spec ia l , genera l ly experi- mental, i nves t iga t ions funded as p a r t of the DOE/NASA SPS Concept Development and Evaluation Program. i n the following areas was obtained through these s tud ies .
A b e t t e r understanding of the hardware implicat ions
1. Design and breadboard eva lua t ion of the SPS reference phase con- t r o l system
2. SPS f i b e r o p t i c s l i n k assessment
3. Six-element S-band a c t i v e r e t r o d i r e c t i v e a r ray (ARA) phase e r r o r eva 1 ua t i o n
4 . SPS antenna element evaluat ion
5. SPS so l id - s t a t e antenna power combiner
6 . SPS so l id - s t a t e ampl i f ie r development
7. SPS magnetron tube assessment
8. Microwave ionospheric i n t e r a c t i o n experiment
Details of these e ight a c t i v i t i e s a r e discussed i n Sect ion I V of t h i s repor t .
G. CONCLUSIONS AND REMAINING ISSUES
A s a r e s u l t of the a c t i v i t i e s performed during the DOE/NASA Concept Development and Evaluation Program, c e r t a i n conclusions have been reached and c e r t a i n remaining i ssues have been i d e n t i f i e d . discussed as pa r t of the system workshop held a t JSC i n January 1980. a l l conclusions r e s u l t i n g from both experimental and a n a l y t i c a l evaluat ions are (1) t ha t t r a n s f e r r i n g of gigawatt power l e v e l s between two poin ts using microwaves i s f e a s i b l e and (2) t h a t a 5-gigawatt SPS microwave PTAR system is probably technica l ly f eas ib l e . Detai led conclusions and remaining i s sues f o r each subsystem area are discussed i n Sect ion 111. The conclusions and remaining i ssues fo r the ove ra l l PTAR system a re presented i n Sect ion V.
These were presented and Over-
14

111. SYSTEM STUDIES
In this section, the activities accomplished in the area of microwave PTAR system studies are summarized. assessment activities for each subsystem (system performance, phase control, power amplifiers, radiating elements, and rectenna) plus a subsection on solid-state configurations. A technical summary and assessment is presented in each subsection together with conclusions reached and remaining issues identified. Also, each subsection contains a discussion of alternate ap- proaches and changes to the reference configuration as applicable.
It contains a discussion of the major
A. SYSTEM PERFORMANCE
The SPS microwave system, as defined in reference 1, has a 1-kilometer-diameter phased array antenna with a 10-decibel Gaussian taper illumination which focuses the beam at the center of the ground antenna/ rectifying system (rectenna) energy is contained within a 5-kilometer radius from the rectenna boresight, with a resultant beam width of 1.2 arc-minutes. Mechanical alinement of the 1-kilometer antenna is maintained within 1 arc-minute, whereas electronic alinement has an accuracy of 1.8 arc-seconds. The dc-rf power converters within the antenna are 70-kilowatt klystrons fed by 40-kilovolt powerlines from a series/parallel solar array configuration. The antenna is divided into 7220 mechanical subarrays, 10.4 by 10.4 meters on a side, having slot- ted waveguides as the radiating surface. Slotted waveguides were selected because of their high-power handling capabilities and low I2R losses.
Approximately 88 percent of the power beam
The klystrons are phase controlled at the individual tube level through the use of a retrodirective pilot-beam signal transmitted from the center of the rectenna and phase conjugated in receivers in each power mod- ule. An onboard phase reference signal is distributed through the antenna to provide the same reference in each conjugating receiver. The reference phase distribution system is implemented in the form of a four-level tree structure with electronic compensation for minimizing phase shifts due to unequal path lengths from the center of the transmit antenna to each phase control re- ceiver. The uplink pilot-beam signal has a double-sideband, suppressed car- rier with code modulation to provide link security and antijamming protec- tion from radiofrequency interference.
The ground rectenna converts the rf energy to dc electricity using half-wave dipoles feeding Schottky barrier diodes. Coherence of the incoming phase front needs to be maintained only over the small area associated with those dipoles phased together. Physically, the current rectenna configura- tion is a series of serrated panels perpendicular to the incoming beam and covers approximately 75 square kilometers. A 75- to 80-percent optical trans- parency of the panels enables other use of the area beneath the rectenna if desired.
The SPS sizing of the 1-kilometer transmit antenna and 5 gigawatts of dc output power from the rectenna is based on a 23-kW/m2 rf power density in the antenna (thermal dissipation limit) and a hypothetical 23-mW/cm2 peak power density limit in the ionosphere to prevent nonlinear heating. System
15

sizing trade-offs given in Section III.A.4 indicate that the ionospheric limit is a critical design and costing parameter. This limit may be revised upward pending the completion of the Department of Energy environmental as- sessment studies on ionospheric heating.
The conclusions regarding SPS system performance are as follows.
1 . System sizing
a. Reduced power levels (<5 gigawatts) are feasible with a mod- est electricity cost increase.
b. Antenna diameters for systems operating at 2.45 gigahertz should not be less than 1 kilometer.
2. Antenna illumination - A 10-decibel Gaussian taper maximizes rectenna collection efficiency and minimizes side-lobe levels while operating within antenna thermal requirements and iono- spheric power density limitations.
3 . Antenna/subarray mechanical requirements
a. Alinement requirements are determined by grating-lobe peaks and scattered power levels.
b. Antenna alinement requirement is 1 arc-minute or 3 arc- minutes depending on the phase control configuration.
c. Subarray alinement requirement is 3 arc-minutes as deter- mined by scattered power levels.
4. Startup/shutdown operations - Three possible startup/shutdown sequences provide satisfactory performance: random; incoherent phasing; and concentric rings, center to edge.
5. Scattered microwave power - System error parameters have been defined to minimize scattered power as shown in figure 111-1.
6 . Faraday rotation by the ionosphere is small.
7. Antenna construction techniques are projected to be within the state of the art to meet the stringent flatness/alinement toler- ances if low coefficient of thermal expansion (CTE) materials are used.
16

300
3 H
+ m 5 c aJ V U
2! K 200 0
D O
0
268 I
188 -
2-percent 10" 3-arc-rnin . 25 " fa i Iirres 1111a s e ra ndorii spaci r i q ampl i tudc antenna
t i l t sir l iarrays
1 - 11 er cent 1 -arc- rn in
error s u h r r a y t)etweeri error t i l t
Figure 111-1.- Reduction i n microwave power mechanical e r r o r s (power-module-level
due to e l e c t r i c a l and phase cont ro l 1.
17

1. REFERENCE SYSTEM MODIFICATIONS
Several changes i n t h e microwave system are recommended as a r e s u l t of recent NASA and cont rac tor s tud ie s . These modif icat ions t o the re ference system documented i n re ference 1 include the following.
a. Phase Control t o the Power Module (Tube) Level
I t i s recommended tha t phase conjugation be performed a t each of the 101 552 power modules r a the r than a t the 7220 subarrays. The advantages of phase cont ro l a t the tube l e v e l a r e a reduct ion i n the antenna and subarray mechanical tilt requirements (or a reduct ion i n s c a t t e r e d micro- wave power i f the same tilt requirements are maintained) and a reduct ion i n the e f f e c t s of d i s t r i b u t e d phase e r r o r s wi th in the subarrays. The disadvan- tage is increased cos t due t o the 94 000 addi t iona l phase cont ro l r ece ive r s . A t the DOE/NASA SPS Program Review held i n Washington, D.C. , i n June 1979, it was reported t h a t an ove ra l l cos t savings could be achieved ( i . e . , the cos t bene f i t s of l e s s s c a t t e r e d power were g rea t e r than the addi t iona l re- ceiver c o s t s ) i f the phase cont ro l rece ivers were less than $600 each. A l a t e r Boeing Aerospace Company study ind ica t e s t h a t these rece ivers can be b u i l t f o r approximately $600 i n high-volume quan t i t i e s . There i s a l s o an environmental advantage i n phase con t ro l l i ng a t the power module l e v e l i n t h a t the g ra t ing lobes inc ident on the Ear th a r e reduced i n amplitude and i n quant i ty . The loca t ions and amplitudes of the g ra t ing lobes from a s i n g l e 5-gigawatt SPS system with phase control t o the power module l e v e l are shown i n f igu res 111-2 and 111-3. Recent s imulat ion r e s u l t s i nd ica t e t h a t the off- ax i s g ra t ing lobes w i l l be reduced by 2 x d a t a shown i n the f igures . Therefore, only the g ra t ing lobes on the pr inci- pal axes (X and Y) are s i g n i f i c a n t .
(37 dec ibe ls down) from the
The loca t ion j i t t e r , or the e r r o r i n path length from the p i l o t beam t r ansmi t t e r t o each r ad ia t ing s l o t i n the antenna, i s reduced by going t o the smaller antenna a rea assoc ia ted with an ind iv idua l tube r a the r than t o the l a r g e r subarray. This l oca t ion j i t t e r , which appears as a phase e r r o r , s c a t t e r s 6 megawatts of power a t the tube l e v e l as compared t o 87 mega- wat ts a t the subarray l e v e l . Another advantage of phase con t ro l l i ng t o the tube l e v e l i s t h a t i f a t o t a l f a i l u r e of the phase cont ro l system occurs, the power dens i ty a t the ground reduces t o 0.0002 mW/cm2, which i s one-fourteenth the 0.003-mW/crn2 value assoc ia ted with phase con t ro l l i ng t o the subarray l eve l .
b. Allowable Amplitude J i t t e r
The reference SPS system has a +l-decibel amplitude j i t t e r across the su r face of each subarray or power module. Analysis r e s u l t s indi- c a t e t h a t power-transfer e f f i c i ency (88 percent f o r the reference system) i s r e l a t i v e l y i n s e n s i t i v e t o amplitude j i t t e r . However, the vol tage and ampli- tude regula t ions f o r the high-eff ic iency, high-gain k lys t ron tubes have t o be maintained t o approximately 1 percent f o r s a t i s f a c t o r y operat ion. Therefore, a +l-percent amplitude to le rance i s recommended f o r the antenna e r r o r parame- ter. This change w i l l not a f f e c t the microwave transmission e f f i c i ency budget.
18
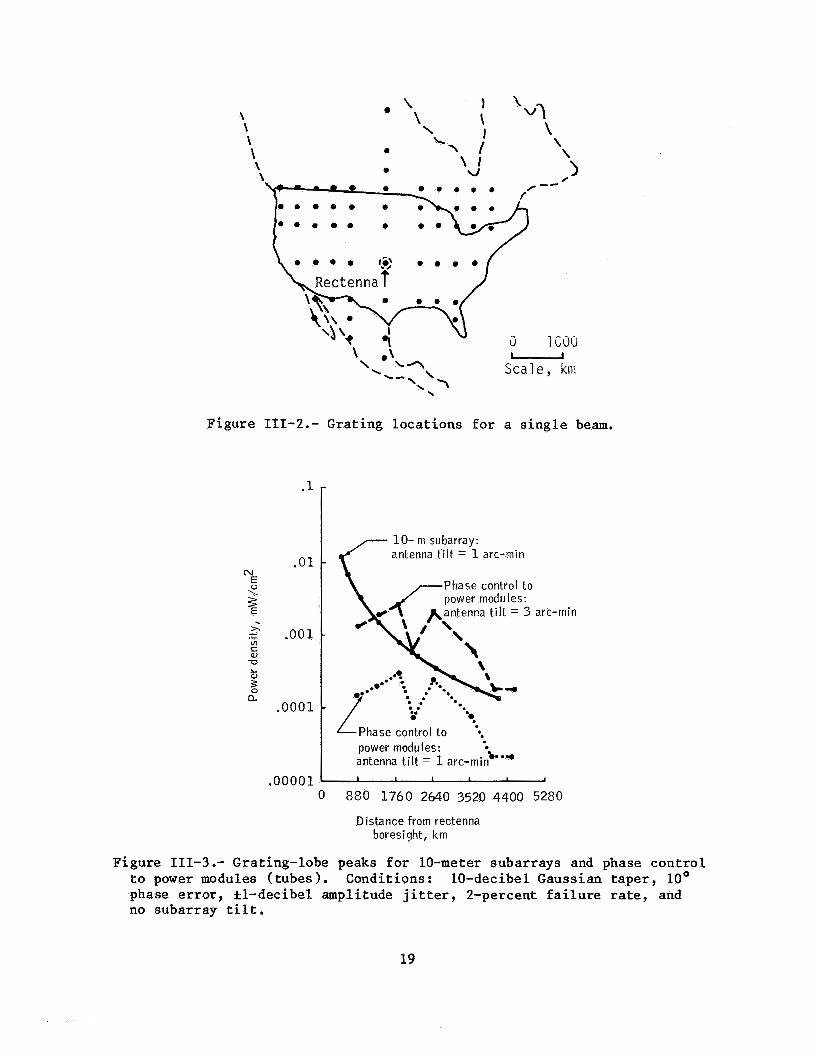
Figure III-2.- Grating loca t ions f o r a s i n g l e beam.
. 0 1 N
5 \
%
L aJ z a
. 0 0 0 1
. 0 0 0 0 1
.1 *
antenna tilt = 1 arc-min
tenna tilt = 3 arc-min
Phase control to L. power modules: . antenna tilt = 1 arc-min’*** I I I I 1
0 880 1 7 6 0 2640 3520 4400 5280
Distance From rectenna boresight, km
t o power modules ( tubes) , Conditions: 10-decibel Gaussian taper, 10’ phase e r ro r , kl-decibel amplitude j i t t e r , 2-percent f a i l u r e r a t e , and no subarray tilt .
Figure 111-3 .- Grating-lobe peaks f o r 10-meter subarrays and phase con t ro l
19

c. Metal-Matrix Waveguides
The SPS reference system has aluminum for the subarray dis- tribution and radiating waveguides. Because of thermal distortion problems, a graphitelaluminum metal-matrix composite is now being developed as a possi- ble replacement for the aluminum.
The antenna structural members are composed of a high- temperature graphite plastic material for rigidity. The antenna primary structure has a 1040- by 1040- by 100-meter pentahedral truss configuration which supports a secondary structure, This secondary structure provides a base for mounting and alining the transmitter subarrays. Both primary and secondary structures must maintain a high degree of stability over wide operating-temperature fluctuations to preserve the 3-arc-minute flatness requirements; therefore, low-CTE materials are needed.
d. Startup/Shutdown Procedure
The satellite will have to be shut down 87 times per year because of solar eclipses by the Earth. In addition, there will be eclipses by the Moon and other SPS's as well as scheduled shutdowns for maintenance. A number of possible sequences for energizingldeenergizing the microwave sys- tem were investigated (ref. 11). Three sequences provided satisfactory per- formance in that the resultant side-lobe levels during startuplshutdown were lower than the steady-state levels present during normal operations. These three sequences were random; incoherent phasing; and concentric rings, center to edge. Thus, no microwave radiation problems are anticipated during start- up or shutdown operations, either scheduled or unscheduled.
The characteristics and error parameters of the updated mi- crowave transmission system are summarized in table 111-1. The relative im- portance of these electrical and mechanical tolerances on scattered microwave power (power not incident on the rectenna) is summarized in figure 111-1.
2. COST SENSITIVITIES FOR THE REFERENCE SYSTEM EFFICIENCY CHAIN
Changes in system efficiencies will have economic as well as environmental impacts on overall SPS performance. From a systems viewpoint, it is important to ascertain the benefits (or losses) derived from a small improvement (or degradation) in the performance of each subsystem. For exam- ple, is it economical to spend $50 million to improve the dc-rf conversion ef- ficiency of the klystrons by 1 percent? The answer is yes, as will be shown.
The SPS efficiency chain from the solar array output in the satellite antenna to the utility grid busbar at the ground is shown in fig- ure 111-4 (ref. 1). In terms of economics, there are two types of degrada- tions inherent in the system design.
a. Type A - degradations leading to losses that can be com- pensated for by simply increasing the amount of power generated by the solar array
20
TABm 111-1.- CHARACTERISTICS AND ERROR PARAMETERS OF MODIFIED MICROWAVE TRANSMISSION SYSTEM
8 - 5 GW +
Characteristic
Transmit frequency, GHz . . . . . . . . . 2.45 5 Output power to power grid,a GW 1 Transmit array diameter, km . . . . .
Power radiated from transmit
. . . . .
array, GW . . . . . . . . . . . . . . 6.72 Microwave system efficiency, i,
6 3 10-step, truncated Gaussian amplitude distribution with
10-dB edge taper Peak microwave density in
23 Phase control . . . . . . . . . . . . . . To power module level Waveguide material . . . . . . . . . . . Metal-matrix composite
percent . . . . . . . . . . . . . . . . Array aperture illumination . . . . . . .
. . . . . . . . . . ionosphere, mW/cm2
Rotary
j o i n t ' d i s t r i b u t i o n ' in tubes +antenna
8 - 5 GW Antenna dc 8.18 GW ~ ~ ~ ~ e f r s i o n 6.96 GW Transmitt ing 6.72 GW power
.963 .85 .9653 .9995
Error budget Total nus phase error per power
Amplitude tolerance per power
Failure rate of dc-rf power converter
Mechanical alinement, arc-min
module, deg . . . . . . . . . . . . . . module, percent . . . . . . . . . . . . tubes, percent . . . . . . . . . . . . Antenna . . . . . . . . . . . . . . . . Subarray . . . . . . . . . . . . . . .
6.72 GW +
10
+1
Atmospheric 6-58 GW Rectenna 5.79 GW rf-dc 5.15 GW id energy + i n t e r f a c e ' energy
c o l l e c t i o n conversion losses
.98 .88 .89 .97
c2
1 3
aDirect current. bdc/rf input to rf/dc output. CMaximum failures at any one time.
.985 (I'R) X
and subarray/waveguide to le rances) .98 (mechanical pointing
S o l a r a r r a y
Figure 111-4.- SPS efficiency chain.
21

b. Type B - degradations leading to losses that cannot be recovered by increasing the solar array size because of sys- tem limitations - An example is the dipole/diode rf-dc con- version loss in the rectenna when the system is operating at the maximum power density limit in the ionosphere.
The economic impact of a type A degradation is less than that of a type B loss as shown subsequently. The cost and mass statements for the reference satellite subsystems that are dependent on solar array power are shown in table 111-2 (ref. 12). These costs may differ slightly from those given in reference 4; however, the relative impacts of changes in the various subsystem losses will remain essentially constant. These costs may be summarized into an overall SPS system cost. The overall cost per 5- gigawatt satellite is $12 432 million with a resulting electricity cost of 1.31~/MJ (47 mills/kWh) (ref. 12). The differential cost per 1-percent in- crease in solar array power to compensate for losses in the microwave system is, to a first-order approximation, $56.4 million as obtained by summing the last column. This is the economic impact of a type A degradation. The cor- responding increase in cost of electricity for a 1-percent increase in solar array power is O.O06c/MJ (0.2 mill/kWh).
The type B degradations which result in a loss of electri- cal power to the utility grid are obtained by multiplying the electricity rate times the power delivered over the 30-year lifetime of the satellite.
Revenue l o s s = $0.047/kWh x 8760 hr/yr x 30 yr
x 50 000 kW ( 1 percent of 5 GW)
= $617 million
or an effective loss of O.O6c/MJ (2.3 mills/kWh). In summarizing, the eco- nomic costs of a 1-percent reduction in power are: type A (compensated for by an increase in solar array output) - $56 million; type B (no compensa- tion) - $617 million.
The relative importance of the microwave subsystem losses depends on the location in the efficiency chain at which they occur. is, a 1-watt type A loss at the rectenna has a greater economic impact than a similar loss in the klystron tube. The microwave subsystem performance im- pact based on a 10-percent variation in each l o s s is as follows.
That
a. Klystron dc-rf Conversion Efficiency (85 Percent)
Although the antenna is operated at a peak power density of 23 kW/m2, the thermal rejection system design can be improved to accommodate greater tube power and/or increased thermal losses (ref. 6). Therefore, the klystron dc-rf conversion efficiency (85 percent) is a type A loss (compensa- ble). A 10-percent change in tube loss corresponds to an increase of 1.5 percent in conversion loss.
22

TABLE III-2.- COST AND MASS SUMMARY FOR REFERENCE SATELLITE SUBSYSTEMS DEPENDENT ON SOLAR ARRAY POWER
Subsystem Reference system Differential impact for a l-percent increase in
solar array power Mass, t cost, $
Mass, t Capital cost, $
Solar array Structure Solar cell blankets dc power distribution Maintenance
Total
Power transmission - klystrons and thermal control
satellite totala
Transportation EOTV~ PLVC
HLLV~ POTVd
Total
Construction operations G E O ~ LEO^
Total
4 654 21 145 1 246 621
27 666
7 007
50 984
-- -- -- -- --
-- --
--
448~10~ 1988 150 2 74
2860
477
4946
652 286 14
2167
3119
648 313
96 1
47 4.5X10⁶
12 1.5 6 2.7
276 28.7
211 20
-
70 4.8
346 33.5
3.0 --
aIncludes rotary joint, antenna structure, waveguides, subarray struc- ture, phase distribution, mechanical pointing, information management, altitude control, communications, and 22 percent mass growth not directly related to solar array output power.
bEOTV = electric orbital transfer vehicle. ‘PLV = personnel launch vehicle. dPOTV = personnel orbital transfer vehicle eHLLV = heavy lift launch vehicle. fGEO geosynchronous orbit. gLEO = low Earth orbit.
23

Klystron loss = $56 million per l-percent increase in solar array output
x l/(dc power distribution efficiencies in solar array and antenn
x increase in klystron loss )
= ($56 million/O.Ol) x 1/(0.937 x 0.963) x (0.85 - 0.835) = $93 million
This $93-million cost figure should be independent of the size of the klystron. That is, if the klystron output were changed from 70 to 50 kilowatts, as has been suggested, the $93-million impact is still valid. The resultant cost impacts for the various subsystem losses are summarized in figure 111-5.
b. Transmitting Antenna Efficiency (96.5 Percent)
(1) Losses from I2R (0.985) - The 12R losses of 1.5 percent were calculated assuming an aluminum-plated composite waveguide (ref. 13). A 10-percent change in I2R losses (type A losses) gives:
I2R losses = ($56 million/O.Ol) x 1/(0.937 x 0.963 x 0.85)
x (0.985 - 0.9835)
= $11 million
(2) Power module tolerances (0.98) - Each power module con- sists of one klystron tube feeding a section of slotted-waveguide radiator. The waveguides or sticks and the feedguide have a standing-wave configuration. The sticks in the various sections of the antenna radiate at different power density levels because of the 10-decibel illumination taper. The power mod- ule tolerances (0.98) may be subdivided into the following type A losses.
(a) Subarray surface: Antenna surface variations producing independent random errors with correlation intervals small in re- spect to the antenna diameter produce a 0.5-percent power loss. This loss corresponds to a 20.127-centimeter (50 mil) root-mean-square (rms) surface error.
(b) Power module tilt: Computer simulations indicate that a 23-arc-minute random power module tilt scatters 28 megawatts of power, or a 0.4-percent power loss.
(c) Mechanical gap between subarrays: The mechanical gap between the 10.4- by 10.4-meter subarrays is limited by the level of the allowable grating lobes rather than by a power loss in the main beam. A 0.64-centimeter (250 mil) gap is compatible with maintaining grating-lobe peaks below 0.01 mW/cm2 while providing only a 0.13-percent power loss.
24
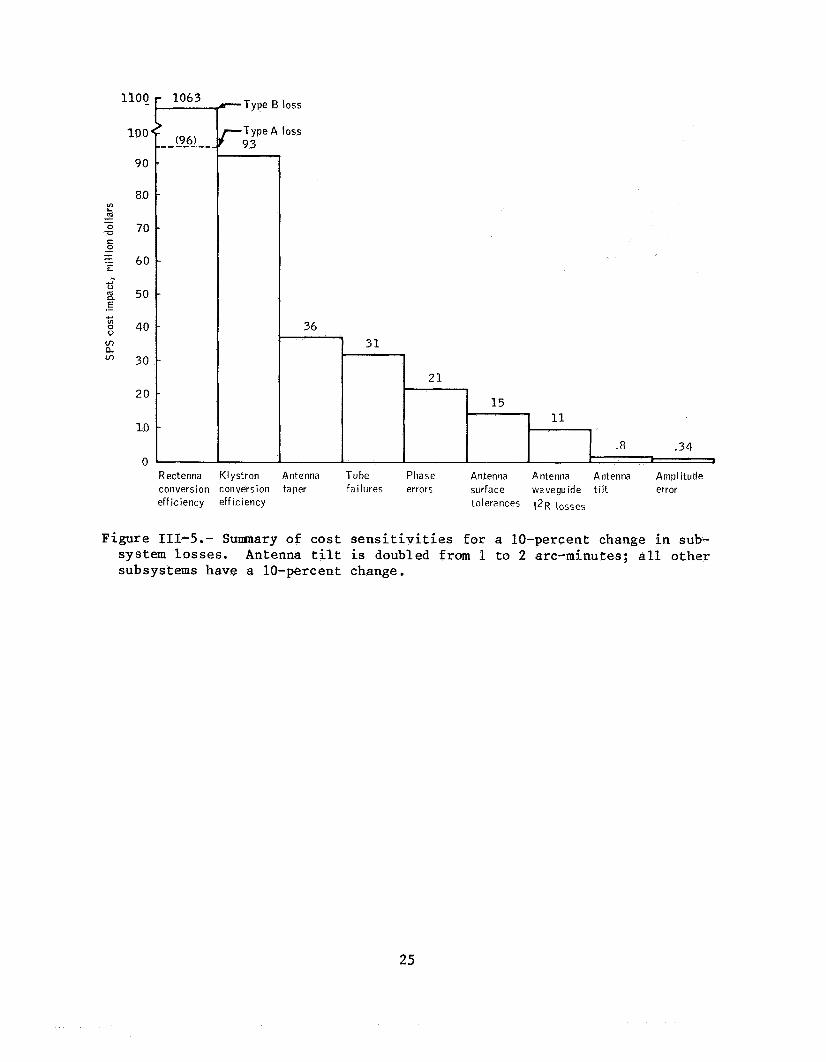
-Type B loss
-Type A loss 93
36
Rectenna Klystron conversion conversion efficiency efficiency
Antenna taper
31
~ Tube Phase
failures errors
15
- I L L Antenrla Antenna Antenna Amplitude surface waveguide t i l t error tolerances 12R losses
Figure 111-5.- Sumnary of cost s e n s i t i v i t i e s fo r a 10-percent change i n sub- system losses. Antenna tilt is doubled from 1 t o 2 arc-minutes; a l l o ther subsystems have a 10-percent change.
25

(d) Radiating-stick tolerances: An analysis of the losses due to waveguide and feedguide dimensional variations has been made (ref. 14). The results are summarized in table 111-3.
(e) Phase location errors: The uplink pilot-beam ref- erence signal is received in each power module, and a single phase angle is conjugated in each receiver. For a 3-arc-minute power module tilt, the aver- age phase error at the radiating slots due to the slight differences in range to the ground pilot-beam transmitter has been calculated to be 1.8'. corresponding power loss for the entire antenna is 6 megawatts, or approxi- mately 0.1 percent.
The
An additional 0.48-percent power loss should be added to the detailed losses in table 111-3 to adjust the total upward to 2 percent as given in figure 111-4. The economic impact for a 10-percent change in the transmitting antenna losses is
Antenna losses = ($56 million/O.Ol) x 1/(0.937 x 0.963 x 0.85 x 0.985)
X (0.98 - 0.978)
= $15 million
c . Rectenna Energy Collection Efficiency (88 Percent)
The rectenna energy collection efficiency (88 percent) is the percentage of energy transmitted by the antenna that is incident on a 10- kilometer-diameter rectenna. The amount of energy is dependent on the antenna illumination function and antenna error parameters such as phase error, ampli- tude error, failure rate, and antenna attitude control.
(1) Illumination taper effects - The reference configura- tion has a 10-decibel Gaussian illumination taper to maximize the rectenna collection efficiency and to minimize side-lobe peaks. kilometer-diameter antenna with no system errors, the collection efficiency for a 10-kilometer rectenna is 95.3 percent. Based on initial results, a 10-percent improvement (0.5 percent) in collection efficiency is a reasonable goal when using a better optimized antenna taper. Currently, there is no phase taper across the antenna surface; a relatively simple discrete-step phase taper might be used to modify the beam pattern, for a 10-percent improvement in collection efficiency (0.47 percent) is
For a perfect 1-
The economic factor
Taper improvement = ($56 million/O.Ol) x 1/(0.937 x 0.963 x 0.85
X 0.9653 X 0.98) X (0.9577 - 0.953)
= $36 million
26

TABLE 111-3.- LOSSES DUE TO POWER MODULE TOLERANCES
Dimension Tolerance Effect Main beam power degrada- tion, percent
Linear, Angular, mm (mil) arc-min
Power module surf ace
Random tilt of power module
Gap between mechanical subarrays
Radiating stick Length Width
Cross guide Length Width Coupling
Slot offset
Phase location jitter
Total
6.35 (250)
k.16 (k6)
Scattering from 0.50 phase variance
3 Power module pat- .40 tern gain reduction
Grating-lobe en- .13 hancement
Mismatch loss Mismatch loss
.02
.12
Mismatch loss .02 Mismatch loss .03 Scattering from am- . 1 plitude variance
Scattering from am- .1 plitude variance
3 Gain reduction due .1 - to range errors
1.52
27

(2 ) Phase error - The existing error budget allows a 10' overall phase error for the phase control system in pointing and focusing the beam. loss is due to beam-pointing error and 90 percent is due to beam broadening and random scatter. The total power loss is 188 megawatts, or 2.8 percent of the radiated power. impact .
For a given phase error, approximately 10 percent of the power
A 10-percent change in phase error has the following
Phase error = ($56 million/O.Ol) x 1/(0.937 x 0.963 x 0.85
x 0.9653 x 0.98) x (0.972 - 0.9692) = $21 million
(3) Amplitude error - The beam pattern is relatively insensitive tq amplitude errors in the output of each power module. The scattered power is only about 3 megawatts for a l-percent amplitude error. The economic factor for a 10-percent change in amplitude error is
Amplitude error = ($56 million/O.Ol) x 1/(0.937 x 0.963 x 0.85
x 0.9653 x 0.98) x (0.999 55 - 0.999 505)
= $0.34 million
(4) Tube failures - Tube failures have a significant in- fluence on the power received by the rectenna. A single failure has a dou- ble effect: the amount of transmitted power is decreased and the antenna area is reduced and, thereby, the overall antenna gain is lowered. The ref- erence error parameter budget has a 2-percent failure rate, which reduces the power received by 268 megawatts, or 4 percent of the power. A 10-percent change in failure rate produces a 0.4-percent change in received rectenna power, with an economic factor of
Tube failures = ($56 million/O.Ol) x 1/(0.937 x 0.963 x 0.85
x 0.9653 x 0.98) x (0.96 - 0.956) = $31 million
(5) Antenna tilt - The amount of allowable antenna tilt The effect of antenna tilt on the beam pattern and scattered power
is determined by the 0.01-mW/cmZ power density constraint on grating-lobe peaks.
28

is minimal. For a l-arc-minute antenna tilt, the scattered power is 0.67 megawatt, or 0.01 percent of the total power. bling the antenna tilt is
The economic impact of dou-
Antenna tilt = ($56 million/O.Ol) X 1/(0.937 X 0.963 X 0.85
x 0.9653 x 0.98) x (0.0001)
= $0.8 million
The only type B degradation, other than aging and radia- tion damage to the satellite electronic components, is the rf-dc rectenna conversion efficiency. The current SPS system is sized to operate at the maximum ionospheric power density of 23 mW/cm2. tions this density limit will be raised, future resizing of the SPS system will probably result in operation at the new ionospheric level because of increased transmitted power and/or larger satellite antennas. The ll-per- cent loss in conversion efficiency is due to impedance mismatch between the dipole/diode circuitry and the incident energy, losses in the half-wave recti- fier, filter losses, etc. A 10-percent change in conversion efficiency has the following effect.
Although there are indica-
Rectenna conversion efficiency = ($617 million/O.Ol) x 1/(0.937 x 0.963
x 0.85 x 0.9653 x 0.98 x 0.88)
x (0.89 - 0.879)
= $1063 million
The economic impacts due to subsystem losses are summarized in figure 111-5. The rectenna conversion efficiency has the dominant impact because of the premise that the system is operating at the ionospheric limit. If the rectenna losses could be compensated for by increasing the transmit power, the economic impact would decrease by an order or magnitude as shown. Also, the importance of being able to predict the losses over the 30-year lifetime of the satellite is shown.
29
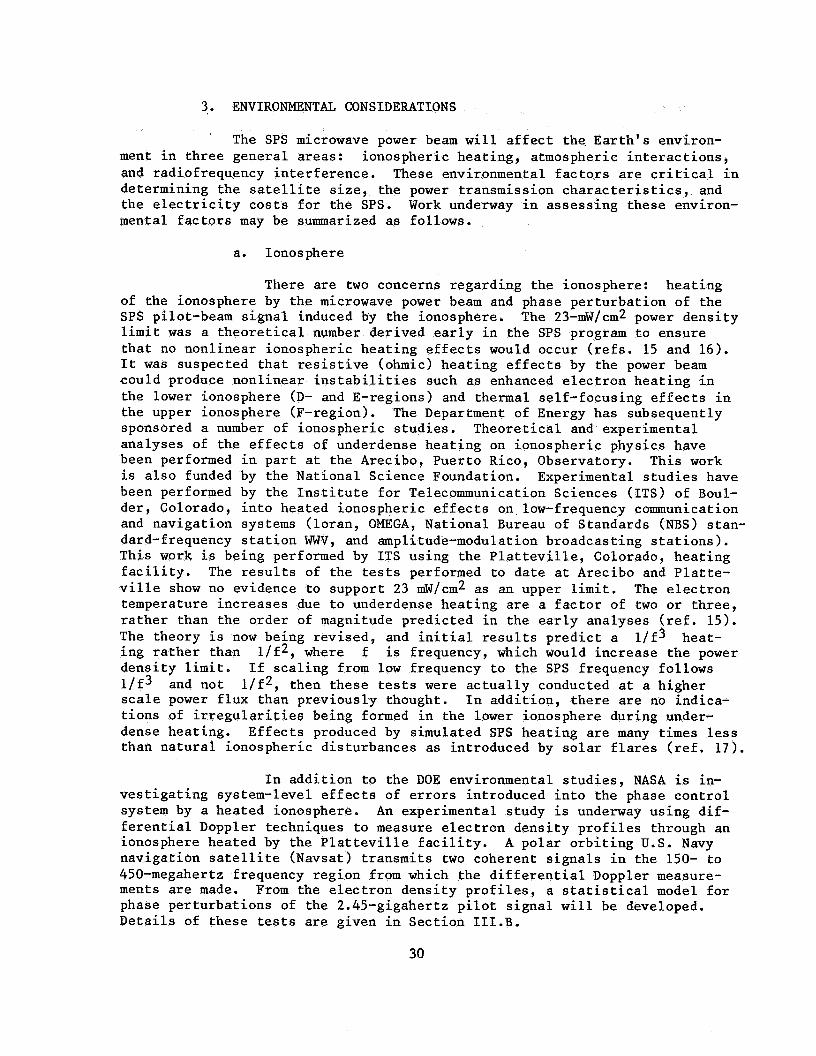
3. ENVIRONMENTAL CONSIDERATIONS
The SPS microwave power beam will affect the Earth's environ- ment in three general areas: ionospheric heating, atmospheric interactions, and radiofrequency interference. These environmental factors are critical in determining the satellite size, the power transmission characteristics, and the electricity costs for the SPS. Work underway in assessing these environ- mental factors may be summarized as follows.
a. Ionosphere
There are two concerns regarding the ionosphere : heating of the ionosphere by the microwave power beam and phase perturbation of the SPS pilot-beam signal induced by the ionosphere. limit was a theoretical number derived early in the SPS program to ensure that no nonlinear ionospheric heating effects would occur (refs. 15 and 16). It was suspected that resistive (ohmic) heating effects by the power beam could produce nonlinear instabilities such as enhanced electron heating in the lower ionosphere (D- and E-regions) and thermal self-focusing effects in the upper ionosphere (F-region). The Department of Energy has subsequently sponsored a number of ionospheric studies. Theoretical and experimental analyses of the effects of underdense heating on ionospheric physics have been performed in part at the Arecibo, Puerto Rico, Observatory. This work is also funded by the National Science Foundation. Experimental studies have been performed by the Institute for Telecommunication Sciences (ITS) of Boul- der, Colorado, into heated ionospheric effects on low-frequency communication and navigation systems (loran, OMEGA, National Bureau of Standards (NBS) stan- dard-frequency station WWV, and amplitude-modulation broadcasting stations). This work is being performed by ITS using the Platteville, Colorado, heating facility. The results of the tests performed to date at Arecibo and Platte- ville show no evidence to support 23 mW/cm2 as an upper limit. The electron temperature increases due to underdense heating are a factor of two or three, rather than the order of magnitude predicted in the early analyses (ref. 15). The theory is now being revised, and initial results predict a l/f3 heat- ing rather than l/f2, where f is frequency, which would increase the power density limit. l/f3 and not scale power flux than previously thought. tions of irregularities being formed in the lower ionosphere during under- dense heating. than natural ionospheric disturbances as introduced by solar flares (ref. 17).
The 23-mW/cm2 power density
If scaling from low frequency to the SPS frequency follows l/f2, then these tests were actually conducted at a higher
In addition, there are no indica-
Effects produced by simulated SPS heating are many times less
In addition to the DOE environmental studies, NASA is in- vestigating system-level effects of errors introduced into the phase control system by a heated ionosphere. An experimental study is underway using dif- ferential Doppler techniques to measure electron density profiles through an ionosphere heated by the Platteville facility. navigation satellite (Navsat) transmits two coherent signals in the 150- to 450-megahertz frequency region from which the differential Doppler measure- ments are made. From the electron density profiles, a statistical model for phase perturbations of the 2.45-gigahertz pilot signal will be developed. Details of these tests are given in Section 1II.B.
A polar orbiting U.S. Navy
30

Two of the most important issues in the entire SPS micro- wave system are determining an upper limit for the permissible power density
d as shown by the heating tests at Platteville and Arecibo and also by new ana- lytical work. This parameter for all practical purposes determines the size of the 2.45-gigahertz SPS system and has billions of dollars' impact on the electricity costs. From a system viewpoint, an ionospheric power density level of 55 to 60 mW/cm2 might be reasonable and would accommodate the larger antenna/smaller rectenna systems proposed in Section III.A.4. However, more ionospheric experiments are needed with upgraded facilities at Platteville and Arecibo to produce the higher heating levels.
b. Atmosphere
The 2.45-gigahertz downlink power beam frequency is in the center of a 100-megahertz industrial, scientific, and medical (ISM) band. Ac- cording to International Radio Regulations, "Radiocommunication services op- erating within these limits must accept any harmful interference that may be experienced from the operation of industrial, scientific, and medical equip- ment." This 2400- to 2500-megahertz band is not particularly affected by weather conditions; therefore, an SPS system should not encounter weather outages. The efficiency budget for the 2.45-gigahertz reference configura- tion has 98 percent transmission (2 percent loss ) through the atmosphere. This signal attenuation is primarily due to rain and atmospheric absorption. The 2-percent attenuation, or 130-megawatt l o s s , represents a worst case con- dition (but not the worst possible, which occurs during wet hailstorms) for the 2.45-gigahertz frequency. Another ISM band (5800 2 75 megahertz) is also available for possible SPS usage. However, an SPS operating in this fre- quency region may have to be shut down because of poor weather conditions. The 5.8-gigahertz frequency has approximately the same transmission effi- ciency as the 2.45-gigahertz frequency through a nonrainy atmosphere but is severely degraded under rainy conditions. The losses for two systems provid- ing 5 gigawatts of ground grid power are summarized in table 111-4 (ref. 18). The 2.45-gigahertz frequency has very minimal losses due to nonideal weather conditions; the 5.8-gigahertz frequency operates satisfactorily in the dry climates of the southwestern United States, but outages would occur in wetter regions.
The impact on a commercial utility grid of a 5.8-gigahertz microwave system which may have to be shut down on an unscheduled basis be- cause of weather effects is not known. If a 5.8-gigahertz microwave system is to be seriously considered as an alternate to a 2.45-gigahertz system, an in-depth study of this area is required.
c. Radiofrequency Interference
Microwave interference with communication and navigation systems and radio astronomy will come primarily from four satellite sources: sideband radiation from the 2450-megahertz power beam, harmonics of 2450 mega- hertz generated by the klystrons, broadband noise outside the ISM frequency band (2450 rf: 50 megahertz), and microwave noise generated by black-body
31

TABLE III-4.- ATTENUATION LOSSES FOR 5-GIGAWATT SYSTEMS
Medium Power loss, W, at transmission frequency of -
2.45 GHz 5.8 GHz
Iono s pher e 0.25~10~ 1x 10³
Neutral atmosphere at mid-U.S. latitude (water vapor and oxygen absorption 1
9ox 106 100x106
Rain Heavy (15 m/hr over 15-km path)a 148
34 Moderate (5 mm/hr over 10-km pathlb 1800 405
Wet hail 2600 4990
aOccurrence: Central/Eastern United States, 9 hr/yr; Southern United
bOccurrence: States, 3 hr/yr; Western United States, 3 hr/yr.
States, 85 hr/yr; Western United States, 10 hr/yr. Central/Eastern United States, 45 hr/yr; Southern United
32

radiation from the solar arrays. There will also be reradiations and re- flections from the rectenna. In addition, the cases of mutual interference between adjacent SPS satellites and an SPS satellite interfering with a TDRSS (Tracking and Data Relay Satellite System) located in geosynchronous orbit have been investigated. 1
(1) Side-lobe radiation levels - The expected power levels at the Earth's surface at the rectenna as a function of distance from bore- sight for one SPS satellite under normal operating conditions are shown in fig- ure 111-6 for near side lobes and figure 111-7 for far side lobes. The data include the effects of random phase errors, amplitude errors, tube failures, mechanical spacings between subarrays, antenna tilt, and random subarray tilt . These antenna patterns have improved slightly since the reference system was defined in October 1978 because of phase controlling to the power module level (ref. 1). beam is small, rejection filters may be needed in the front-end electronics of sensitive receivers such as in radio astronomy systems to prevent overloading. (This problem would be somewhat alleviated if 5.8 gigahertz was used as the transmission frequency.) Grating-lobe peaks appear on the ground at intervals of 848, 1272, 1696, 2120, and 2544 kilometers from the rectenna as determined by the spacing of individual power modules (tubes) on the microwave array.
Although the energy in the side lobes of the 2450-megahertz main
(2) Klystron (tube) noise - The probable level of noise from the 101 552 klystron tubes in a single 5-gigawatt satellite is shown in figure 111-8 (ref. 19). This noise density curve was calculated using meas- urement data from a Varian V-58 klystron, an "old" tube, combined with the theoretical frequency response of a slotted-waveguide radiator. The perti- nent radio astronomy requirements as given in the latest International Radio Consultative Committee (CCIR) documentation, report 224-4, are as follows.
Frequency, Power flux spectral density, MHZ dBW/mz-Hz
1400 to 1427 2690 to 2700 4990 to 5000
10 640 to 10 740
-255 -247 -241 -240
The noise data given in figure 111-8 indicate that the CCIR requirements can readily be achieved with regard to out-of-band tube noise, provided the tube and waveguide characteristics are as assumed. Noise data for modern klystron tubes are expected by Varian personnel to be better (lower) by about 40 deci- bels from the -160-dBc/Hz noise level at frequencies greater than 100 megahertz
lG. D. Arndt and J. W. Seyl: RF Interference/Orbital Spacings for Solar Power Satellites. Lyndon B. Johnson Space Center (Houston, Tex.), to be pub- lished.
33
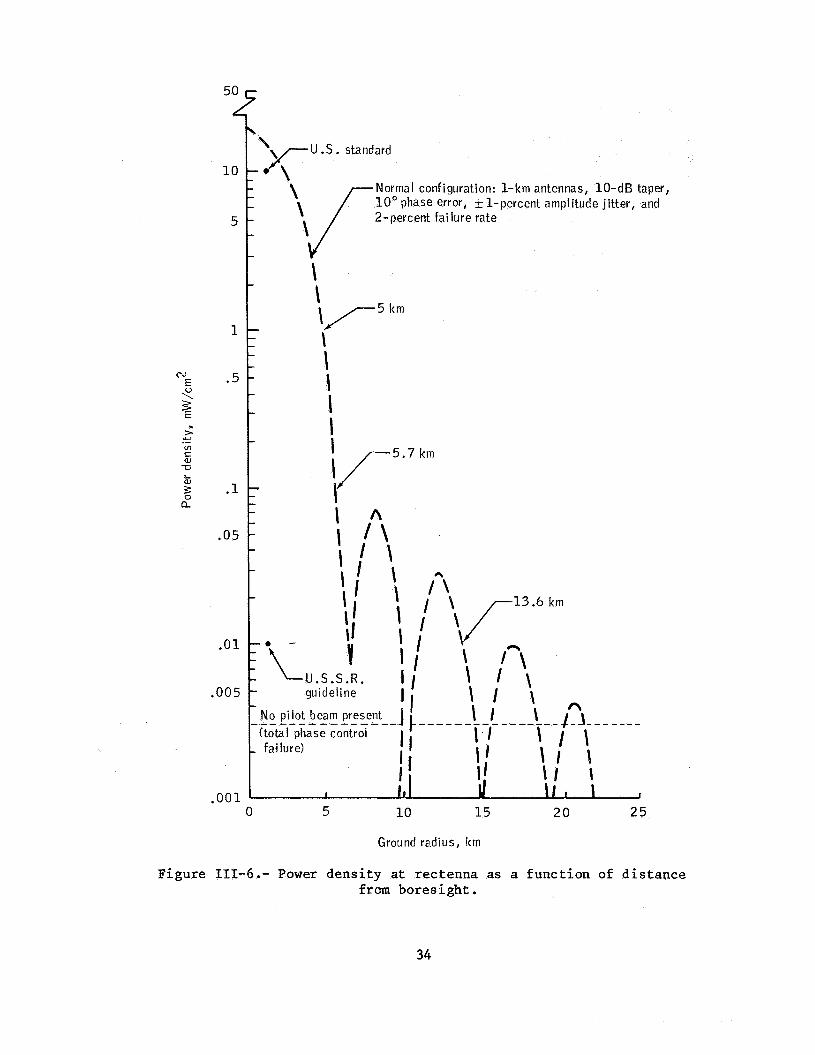
.01
.005
,001
Normal configuration: 1-km antennas, 10 -dB taper, 10” phase error, k l - p e r c e n t amplitude j i t ter, and 2-percent fai lure rate
\
I
km I
0 5 10 15 20 2 5
Ground rzdius, krn
Figure 111-6.- Power density at rectenna as a function of distance from boresight.
34

N E -Y 2
l o1
l o o
10-1
E - - - - -
- Conditions: 10-dB Gaussian taper antenna, 10" pfiase error, + l -percent amplitude jitter, and 2-percent fai lure rate
- - - -
- - - - - - r U . S . S . R . gu ide l i ne F* - - - - -
10-3
10-5
0 .* Average peak level for one 5-GW SPS
Calculated side-lobe peaks 0 0 0. 0 0. .c
0 0 0 0 0 0 0 0 0
* .. 0 .
0 0
0 0 0 0: 0.. * 0 0 0
0 0
0 . 0 0 . 0
0 0
I 10- I I I I I I 1 0 1000 2000 3000 4000 5000 6000 7000 8000 9000
Radius from boresight, km
I I I I I I I I I I I 1 0 500 1000 1500 2000 2500 3000 3500 4000 4500 5000 5500
Radius from boresight, s . mi . Figure 111-7.- Peak power dens i ty l e v e l s as a func t ion of range from
rectenna.
35
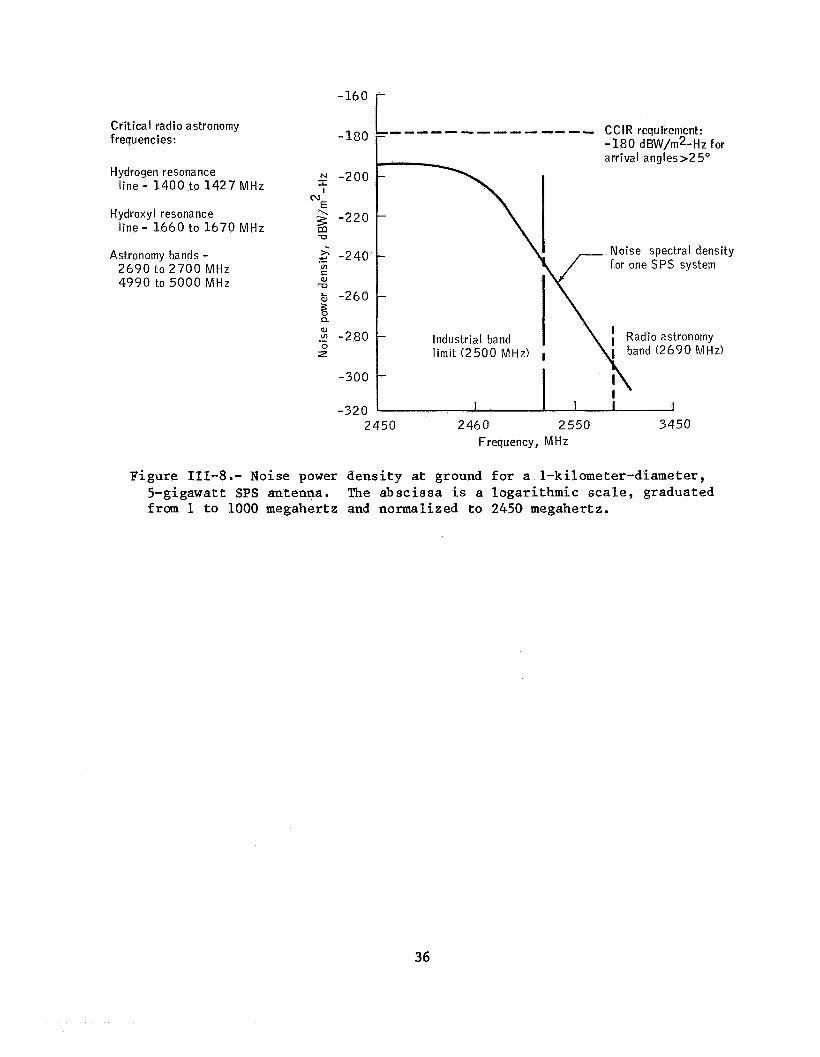
- 180 - - - - - - - .- - -- - - CC IR requirement: -180 dBW/mZ-Hz for arrival angles>25"
i Crit ical radio astronomy Frequencies:
Hydrogen resonance -200 - line - 1400 to 1427 MHz I
E I
(v
Hydroxyl resonance 2 -220 - U
l ine - 1660 to 1670 MHz . Noise spectral density
for one SPS system Astronomy bands - .- S -240 -
rn S W
2690 to 2700 MHz 4990 to 5000 MHz -5
$ & -260 - n a,
0 .E -280 Industrial band z l imit (2500 MHz) I
-
-300 -
-320 I I I 2450 2460 2550 3450
Frequency, MHz
Figure 111-8 .- Noise power dens i ty at ground f o r a 1-kilometer-diameter, 5-gigawatt SPS antenna. The absc issa is a logari thmic sca l e , graduated from 1 t o 1000 megahertz and normalized t o 2450 megahertz.
36

from the carrier frequency used in the calculations. istics for a small section of the slotted-waveguide radiators are being meas- ured; however, the overall noise performance of a klystron-driven antenna is still speculative and is an area for future work.
The filtering character-
(3) Harmonic noise from the transmit antenna - The harmon- ic powers generated by the klystron tubes are taken to be 53, 94, and 113 dec- ibels down from the fundamental for the second, third, and fourth harmonics, respectively (ref. 20). The harmonic antenna patterns have been measured for an eight- by eight-slot slotted-waveguide subarray (ref. 21). The relative gains with respect to the fundamental at small angles near boresight are -53 decibels for the third and fourth harmonics and -75 decibels for the second and fifth harmonics. With these antenna and tube characteristics, the har- monic noise spectral density at the ground is given by
where P H - ~ ~ = harmonic power density at the ground
= n-th harmonic power transmitted
= fundamental (2.45 gigahertz) power transmitted
= harmonic power relative to fundamental
= 1-kilometer-diameter antenna gain at 2.45 gigahertz
= 1-kilometer-diameter antenna gain at n-th harmonic
= harmonic antenna gain relative to fundamental
= range from satellite to ground
The power density at the ground for the second harmonic (4.9 gigahertz), the third harmonic (7.35 gigahertz), and the fourth harmonic (9.8 gigahertz) is calculated to be -104.4, -123.4, and -142.4 dBW/m2, respec- tively. If it is assumed that the broadband noise characteristics around the harmonics are similar to those levels around the fundamental, then the overall noise levels from a single 5-gigawatt satellite are as shown in figure 111-9.
37
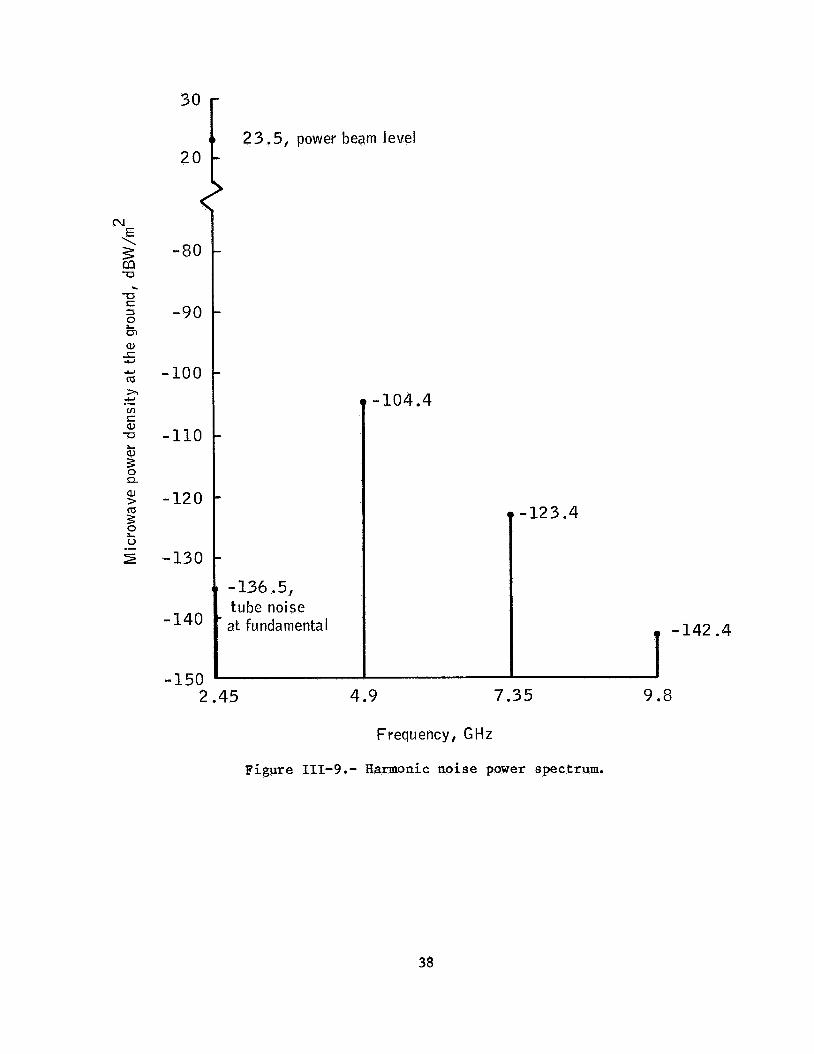
-80
-90
-100
-110
-120
-130
- 140
-150
-136.5, tube noise at fundamental
-104.4
1-123.4
2.45 4.9 7.35 9.8
Frequency, GHz
Figure III-9.- Harmonic noise power spectrum.
38

(4) Thermal noise radiation from SPS solar arrays - The solar array will act as a broadband noise radiator because of thermal emis- sion from the hot solar cell blankets. reference silicon cells with a microwave emissivity of 0.95, the surface brightness for the solar blanket acting as an isotropic radiator will be
Using a 310-K temperature for the
8 = 8.13 X W/rnZ/Hz/rad2 (2 1
Viewed from the Earth, the 5.2- by 10.4-kilometer silicon array subtends a solid angle of 4.16 x 10⁻⁸ radian squared, and the resulting microwave power density as a function of wavelength at the ground is
3.38 x W/m2/Hz PD = 1 2
- - -274.7 dBW/m2/Hz A2
where 1 is the microwave wavelength in meters. The resulting microwave noise power density as a function of frequency is shown in figure 111-10, together with the CCIR requirements for the four astronomy bands of interest.
The data indicate that the SPS thermal noise radiation levels from a single satellite will approach but not exceed the radio astron- omy emission requirements as defined in CCIR report 224-4. As more satellites are put into operation, these emission levels will eventually be exceeded. However, the SPS noise levels given in figure 111-10 are for worst case condi- tions occurring at the observer's local midnight; as the position of the solar array changes while tracking the Sun, the thermal radiation cycles through two daily minimum levels when the array is oriented with the edge toward the ob- server. There will also be reductions in the noise levels as the declination of the satellite changes throughout the year.
(5) Radiofrequency interference with adjacent satellites - In addition to the rf interference with ground systems, the microwave beam from one solar satellite may interfere with nearby satellites. To investi- gate this problem, two possible interference conditions have been analyzed: (a) an SPS interfering with an adjacent SPS and (b) an SPS interfering with a TDRSS (Tracking and Data Relay Satellite System) located in geosynchronous orbit. These two particular systems were chosen for study because their mi- crowave characteristics are well defined and the TDRSS is considered represen- tative of existing communication satellites. Communication satellites in the year 2000 time frame of the SPS systems should have improved performance.
39
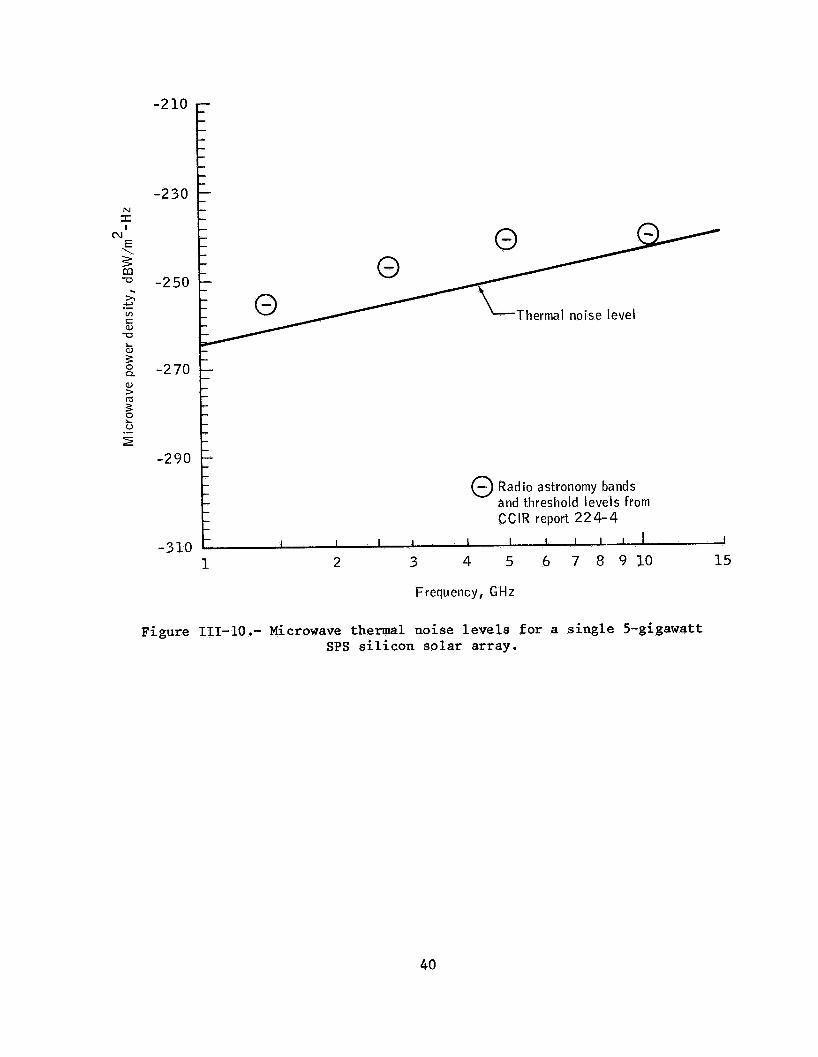
-210 -230 E N
E /\Thermal noise level U
v) r
.-
I-
i -270
a, > m 5 ti z .-
-290
0 Radio astronomy bands and threshold levels from CClR report 224-4
-310 I I I I I I I I I l l I 1 2 3 4 5 6 7 8 9 1 0 15
Frequency, GHz
Figure 111-10 .- Microwave thermal noise levels for a single 5-gigawatt SPS silicon solar array.
40

The results of this study may be summarized as follows.
(a) SPS/TDRSS interference: The geosynchronous TDRSS acts as a repeater relay between low-Earth-orbit users (satellites, Space Shuttle, etc.) and the ground terminal at White Sands, New Mexico. There are three general relay classes: the single access (SA) relay, which has both S-band (SSA) and K-band (KSA) services on a high-gain antenna; the multiple access (MA) relay with 20 S-band links over an Earth-coverage phased array; and the satellite/ground links at S-band or K-band with tracking, telemetry, and command (TT&C) data. Although TDRSS's may be operated simultaneously, there are no communication links between the satellites. In addition, the communication antennas are constrained in their movements such that other geosynchronous satellites cannot be within their fields of view.
It is assumed that the TDRSS antenna gain with re- spect to an SPS will be 0 decibel. The TDRSS diplexer has a measured attenua- tion response of -80 decibels at 2450 megahertz (ref. 22). The block diagram of the input stages and associated signal levels for the TDRSS return links (user to satellite) is shown in figure 111-11. The SPS interference level at a TDRSS with a lo (700 kilometer) separation is shown in table 111-5. Thus, it can be concluded that an SPS will not interfere with the TDRSS communication links. The degree of isolation provided by the TDRSS diplexer to out-of-band interference and the low gains of the communication link antennas relative to an adjacent SPS will reduce the SPS interference levels to 25 decibels below the TDRSS receiver noise level in a 100-megahertz bandwidth. Additional intermediate-frequency (i.f.1 filtering is encountered as the channel band- width reduces, thereby maintaining acceptable signal-to-interference ratios.
-
(b) SPS/SPS interference: In considering the potential RFI problems of one SPS interfering with another SPS in adjacent geosynchronous orbital slots, it is apparent that a greater probability of interference occurs if one assumes a single SPS with multiple transmit antennas interfering with one another. In the limit, the worst case is that of a power module (70-kil- owatt transmitter) interfering with its individual pilot receiver (self-inter- ference). Four antenna spacings were considered in the analysis.
(1) lo (700 kilometers) separation between sate 11 i tes
(2) 20 kilometers separation between two antennas, one at each end of the satellite
( 3 ) 5 kilometers separation between two antennas at opposite ends of the satellite
( 4 ) Self-interference within a single power mod- ule by the klystron feeding energy back into its pilot signal receiver
The self-interference case (4) has by far the worst RFI conditions as detailed in table 111-6. The pilot signal is to be received using a separate linearly polarized slot with opposite polarization to that of the transmitter waveguide
41
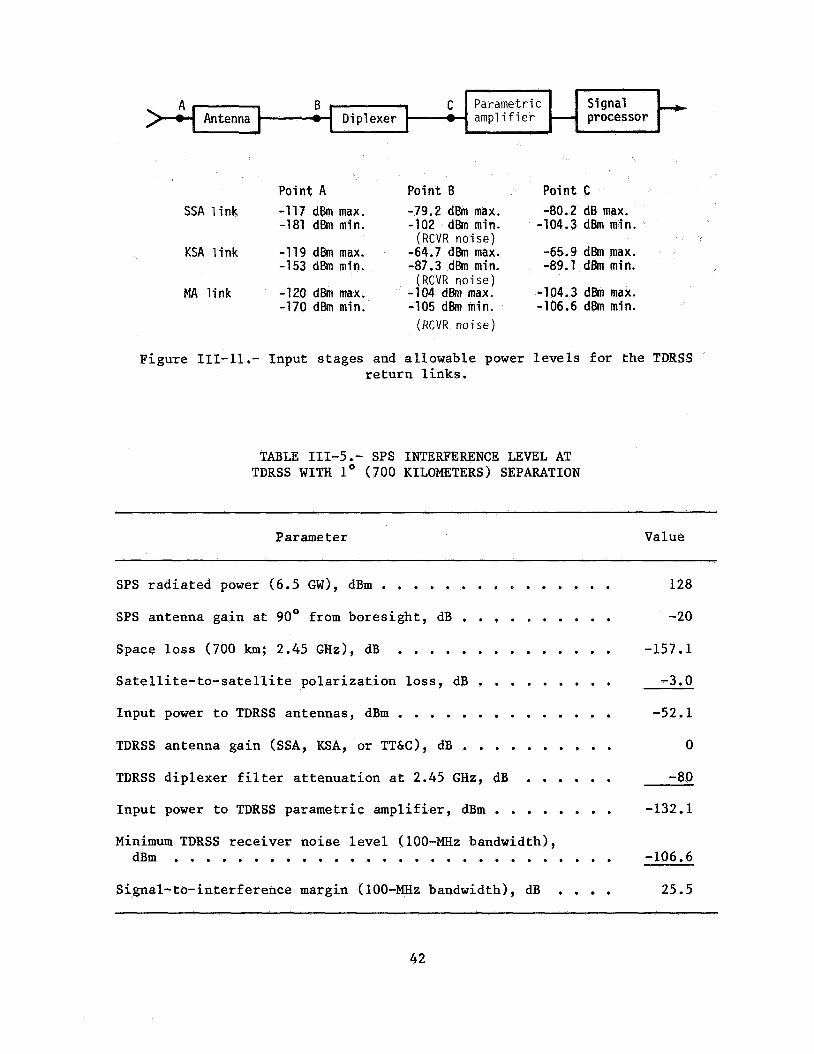
I c Parametric Signal
-e- amplifier processor - Antenna t -
Point A Point B Point C SSA link -117 dBm max. -79.2 d h max. -80.2 dB max.
-181 dBm min. -102 dBm min. -104.3 dBm min. (RCVR noise)
KSA link -119 dBm max. -64.7 dh max. -65.9 d h max. -153 dBm min. -87.3 dBm min, -89.1 dBm min.
(RCVR noise) MA l i n k -120 dBm max. -104 d8m max. -104.3 dBm max.
-170 dBm min. -105 d h min. -106.6 d h min. (RCVR noise)
-.)
Figure 111-11.- Input stages and allowable power levels for the TDRSS return links.
TABLE 111-5.- SPS INTERFERENCE LEVEL AT TDRSS WITH io (700 KILOMETERS) SEPARATION
Par ame t e r Value
SPS radiated power (6.5 GW), dBm . . . . . . . . . . . . . . . 128
SPS antenna gain at 90° from boresight, dB . . . . . . . . . . -20
Space loss (700 km; 2.45 G H z ) , dB -157.1 . . . . . . . . . . . . . . Satellite-to-satellite polarization loss, dB . . . . . . . . . -3.0
Input power to TDRSS antennas, dBm . . . . . . . . . . . . . . -52.1
TDRSS antenna gain (SSA, KSA, or TT&C), dB . . . . . . . . . . 0
TDRSS diplexer filter attenuation at 2.45 GHz, dB . . . . . . -80
Input power to TDRSS parametric amplifier, dBm . . . . . . . . -132.1
Minimum TDRSS receiver noise level (100-MHz bandwidth), dBm . . . . . . . . . . . . . . . . . . . . . . . . . . . . -106.6
Signal-to-interference margin (100-MHz bandwidth), dB . . . 25.5
42

cr: 0 E
v) pc v) I 0
I a I H H H
w
I
I v , 0 0 4. o p m o o o m m 4 m I * N * - a b I I I r -
0 3 1 \o 4 r n l I I r - P N m 4
4 4 1 I
I
I v , 0 0 4. o p m o o o m m 4 m I * N * - a b I I I r -
0 3 1 \o 4 r n l I I r - P N m 4
I 4 4 1 I
. . . . . . . . . . . . . . . . . . * . . . . . . . . . . . . . . - . . . . . . . . . . . . . . . . . . . . . . . . . . . . . . . . .
r r n
m a n
C .rl (d M
. . . . . . & I . . . a . . . m A I . . . . . . 5 cr: .H - . . .
cr: a: Hcn 'CI
. . m * a *
. . . 'E9 a . . .. H
43

slots. The sum of the coupling coefficients for each transmitted waveguide slot to the receiver antenna is assumed to be -20 decibels total. The trans- mitted rf power component at 2450 megahertz, which represents the coherent interference term, contains essentially all of the 70-kilowatt klystron out- put power. The power is then coupled into the pilot receiver with the 20- decibel coupling loss. The resulting rf interference must be filtered and processed to effectively reduce the interference to an acceptable level. Figure 111-12 is an SPS receiver functional block diagram with associated in- terference and pilot signal levels to illustrate the signal-to-interference ratio expected for this worst case self-interference condition.
The pilot signal received power level is based on a 65-kilowatt transmitter using a ground antenna with 48.3 els gain. The total effective isotropic radiated power (EIRP) is then approximately +126.4 dBm (decibels referenced to 1 milliwatt). Assuming a geosynchronous range of 36 000 kilometers and a pilot-receiver vertically polarized slot of 0 decibel gain,
Sp = 126.4 dBm - 191.4 dB - 3 dB EIRP Space Polari-
loss zation loss
= -68 dBm (4 1
The coherent power beam signal power coupled into the pilot receiver antenna from all adjacent slots in the power module is
IR = 78.5 dBm - 20 dB - 13.5 dB
70-kW Total Polari- klystron cou- zation output pling isola- power coef- tion
ficient (near field)
= +45 dBm (5)
Tracing the pilot signal power levels interference levels IR through the pilot receiver filtering and processing, the signal-to-interference ratio at the carrier synchronization loop input is
Sp and the continuous-wave (CW)
Sp/I~ = +73 dB
44
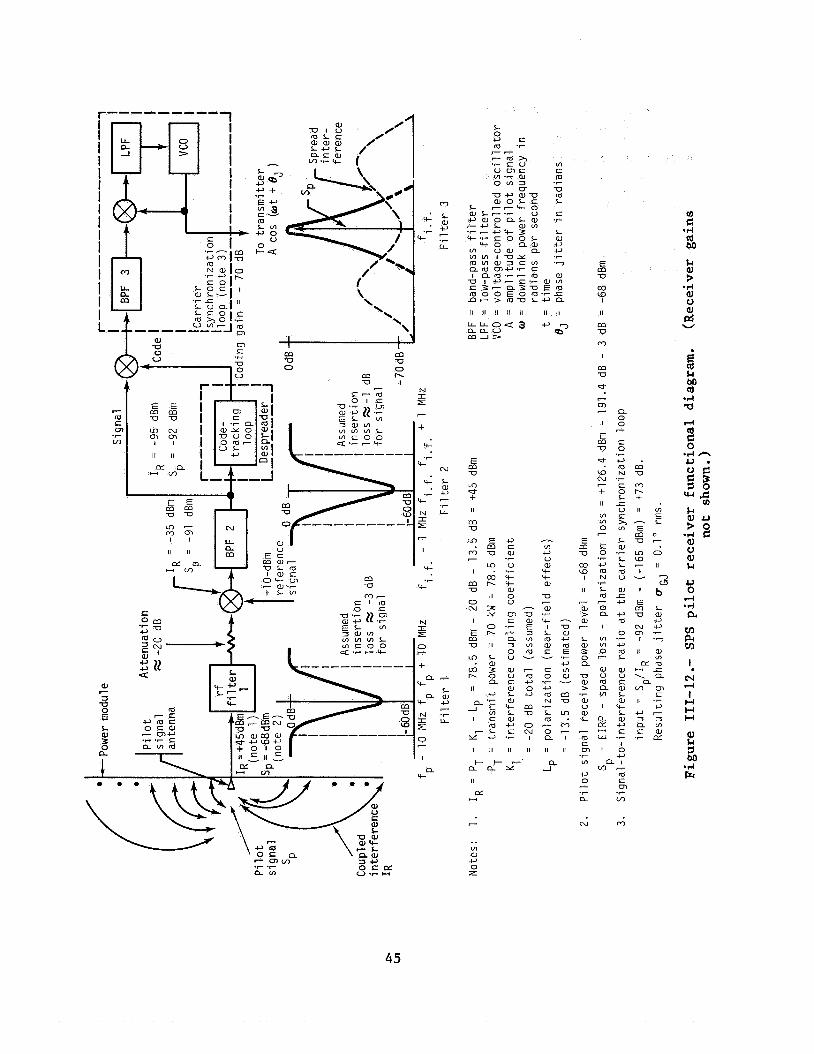
m L W c, 2
*I4 a M
E m -0
$4 : co W I
11 11 I1 I1 II I1 11 II
.rl a, c)
2 v
I ti m a U $4
M a .rl
d m a - a 7
r( v
1 0
E M C - 0 0
7 2 .-I h ...-
E M -0
L n d + I1
M -0
L n E . M m u
m 7
* m 7J
m r. + .
N W N L
a, c,
7 + I1
S 0 L .s V C
m h
7
.r U I1 m
E m o - 0 7
- E 84J 3 0
.I4 E aJ 0 a, &I
m m 0 7
c, S W V .r-
L a,
L L 5 V
.C
S 0
c, m N
L
0 a
.r
.r
m c
m o W 7 11 I - 7 a ' b
I . co
11
r n b -0
0 N 3
Y
0 E b m -0 I1
I
.- + l+ W 0 V
u 0 rl .d a
a, r c,
c, 5
0
c, 5 L
a, V S a, L W IC
.C
m S .r c a 3 0 V
I
m m 0 c
I. N F.4
W V 4
m n
W V S W L a, rc L a, c, S
c
L W c,
I H W W
I r-- .r LL
L a, c, r.
a CL
W Y a,
%.I .-
.. m a, c, 0 z
45

This signal-to-interference ratio is more than sufficient to maintain the . recovered carrier phase jitter to values well within the allocated phase error tolerance for the pilot receiver. In general, the simulation perform- ance results indicated that for pilot signal effective radiated power levels equivalent to that used here (i.e., +126.4 dBm) and with similar receiver fil- ter characteristics, the carrier recovery loop phase jitter UGJ will be less than 0.lo rms for carrier loop bandwidths 10 hertz or less (ref. 23.).
One area of concern is eving the needed isolation at the power signal frequency with an rf filter. To achieve sufficient level reduction before the first mixer, some additional attenuation may be needed between the rf filter and the first mixer. The amount of attenuation re- quired will depend on the amount of isolation achievable with the rf filter. In the figure 111-12 example, an attenuation of -20 decibels was assumed. Higher pseudonoise (PN) spreading code rates and longer code lengths may be- come necessary if the desired rf filtering characteristics are unattainable. These trades are being studied, and a final design configuration will be de- termined as part of the LinCom Phase IV task (ref. 24). In any event, it ap- pears reasonable that the rf and i.f. filtering characteristics, code rates, code lengths, and loop bandwidth can be varied to achieve an acceptable level of jitter on the recovered pilot signal phase for the levels of interference postulated. Since the self-interference case has the worst RFI conditions, no problems are envisioned for adjacent geosynchronous orbit spacings of SPS's as far as mutual interference is concerned.
4. ALTERNATE SYSTEMS
The current SPS reference configuration has a 1-kilometer trans- mit antenna delivering 5 gigawatts of dc power out of a rectenna approximately 10 kilometers in diameter. The system uses high-power klystrons operating at 2.45 gigahertz. Several alternates to this reference system being studied in- clude the f ol lowing.
a. Smaller systems configured with larger antennas, reduced output powers, and smaller rectennas
b. Systems operating at 5.8 gigahertz
c. Other power conversion devices including magnetrons, lasers, and solid state
The antenna sizing (1 kilometer) and maximum power transmission ( 5 gigawatts) were determined by two constraints: in the transmit antenna and a 23-mW/cm2 maximum power density limit in the ionosphere. The differential costs in electricity for seven antenna/rectenna
a 23-kW/m2 rf power density limitation
46

configurations operating at 2.45 gigahertz and five satellite systems oper- ating at 5.8 gigahertz have been determined and are described in detail" in reference 6 . The study results are summarized as follows.
a. Smaller System Sizing Trade-offs
The advantages of smaller systems are twofold: ( 1 ) commer- cial utility companies may prefer to integrate lower power levels (less than 5 gigawatts) into their grids and (2) rectennas smaller than the 10-kilometer- diameter reference configuration may be preferred from the standpoint of land utilization and site location. In addition, smaller power blocks are desir- able if the use of SPS systems were to be extended to foreign countries. The thermal limitation of 23 kW/m2 at the center of the transmit antenna is due to the heat radiated by the dc-rf power converters (i.e., klystrons). The current configuration has 70-kilowatt klystron tubes operating at 85-percent conversion efficiency and cooled by passive heat-pipe radiators. This ther- mal limitation is a severe constraint on higher frequency (5.8 gigahertz) systems, which have lower efficiency klystrons (80 percent). An improved thermal design using graphite composite materials with high-emissivity coat- ings which provide a 33-percent increase in heat rejection is proposed in ref- erence 6 and used in these calculations.
b. Optimized Microwave Systems - 2450 and 5800 Megahertz To provide a smaller rectenna, the antenna size must be
increased and the transmit power decreased if the 23-mW/cm2 ionospheric limit is to be maintained. The microwave system was reoptimized with higher gain antennas and with various ionospheric and thermal power density limitations. One of the ground rules for the study was that the rectenna is sized for all configurations to receive 88 percent of the transmit power. Various Gaussian illumination tapers were investigated; however, as was true for the reference system, a 10-decibel taper provides maximum rectenna collection efficiency while minimizing side-lobe levels. The only constraint on side lobes is that the first side-lobe peak should have a power density of less than approxi- mately 0.1 mW/cm2. It is assumed that the antenna performance parameters are the same as those in the reference system. These include loo rms phase error, fl percent amplitude error, 2 percent tube failure rate, 0.63 centimeter (0.25 inch) mechanical spacing between subarrays, 21 arc-minute antenna tilt, and f3 arc-minutes subarray tilt.
For the 2.45-gigahertz operating frequency, two constraints are considered: transmitter power as the size of the satellite antenna increases and (2) al- lowing the ionospheric power density limit to increase by retaining the same transmit power as antenna size increases. The ionospheric limit is the crit- ical parameter in system sizing for 2.45 gigahertz. The thermal limit on the antenna is not a constraint for the larger antenna/smaller rectenna systems operating at 2.45 gigahertz.
( 1 ) retaining the 23-mW/cm2 ionospheric limit by reducing
47

For operation in the 5.8-gigahertz ISM frequency band, a Since the gain of an an- different set of constraints must be considered.
tenna is proportional to the frequency squared, antennas smaller than 1 kilo- meter diameter will result in smaller rectennas compared to 2.45 gigahertz. The antenna thermal limitation is the critical parameter for system sizing at 5.8 gigahertz. The ionospheric limit of 23 mW/cm2 is no longer a factor because this threshold is also proportional t o frequency squared. That is, the adjusted ionospheric limit for 5.8 gigahertz is
- - 5.802 pD5. 8GHz pD2. 45GHz (2.45)
= 23 mW/cm2 X 5.6
= 129 mW/cm2 ( 6
Since the 5.8-gigahertz antenna will be smaller, or at least no larger, than 1 kilometer in diameter, the adjusted ionospheric limit of 129 mW/cm2 will not be exceeded. Other factors influencing system sizing include lower effi- ciencies in several of the microwave subsystems operating at the higher 5.8- gigahertz frequency. The operating constraints at 5.8 gigahertz are
(1) Retaining the 23-kW/m2 antenna power density limit by reducing transmit power as the size of the satellite antenna decreases
(2) Allowing the antenna thermal limit to increase as the antenna size decreases
(3) Reductions in subsystem efficiency including
(a) 80 percent rather than 85 percent dc-rf klystron conversion efficiency
(b) 97 percent rather than 98 percent for the normal atmospheric transmission
(c) 87 percent instead of 89 percent for the average rf-dc conversion efficiency in the ground rec tenna
The relative antenna/rectenna sizes for 2.45- and 5.8- gigahertz operation are shown in figure 111-13. attitude control requirements for the antennas, the antenna diameters should probably be limited to 1 to 1.5 kilometers for 2.45-gigahertz operation and 0.75 to 1.0 kilometer for 5.8-gigahertz operation.
Because of phase control and
(1) System cost trade-offs - A detailed analysis of sub- system costs and masses for the reference 5-gigawatt SPS with silicon solar
48

E Y - z z 3 2
u a, 4 U .- E m S m L U
cc 0
S Q,
Q) a 60 co a, > a, 0 a,
0
U
2
.- L
4
& U W
m -22 m S S a, 0 a, CL
E .-
U
10
8
6
4
2
0 .5 1.0 1.5 2 .o
Transmit antenna diameter, kni
Figure III-13.- Antenna/rectenna sizing summary.
49

cells is given in reference 12. These values are used as a baseline for com- puting costs for the different antenna/rectenna configurations. pal elements in the SPS recurring costs are satellite hardware, transporta- tion (space and ground), space construction and support, rectenna, program management and integration, and cost allowance for mass growth. Some general costing assumptions include 30-year operating lifetime, 0.92 plant factor for 2.45-gigahertz operation, 0.90 plant factor for 5.8-gigahertz operation, 15 percent rate of return on investment capital, 22 percent mass growth factor to cover potential risks in solar array, and the following microwave system performance estimates: 17 percent of net SPS hardware cost factor to account for mass growth and 10 gigawatts per year additional power generation capacity.
The princi-
The total mass and cost for the SPS system are taken to be 59 984 metric tons and $12 432 million, respectively. The cost and mass statements for the individual satellite subsystem are divided into the following categories.
(a)
(b)
(C)
(d)
Power collection: structure, solar cell blankets, power distribution, and maintenance
Rotary joint
Microwave antenna: structure, klystrons and thermal control, waveguides, subarray struc- ture and control, power distribution (conduc- tors, switchgears, dc/dc converters, and energy storage), phase control, maintenance systems, and antenna mechanical pointing
Information management and attitude control: hardware and propellant
C Ommun i ca t ions
Transportation: electric orbital transfer vehi- cle, personnel launch vehicle, and heavy lift launch vehicle
Construction operations: low Earth orbit and geosynchronous orbit
The cost and mass from each of these subsystems will vary according to total power, antenna size, frequency, etc., of the candidate antenna/rectenna sys- tems. Since the calculations are quite lengthy, only the end results for 2.45- and 5.8-gigahertz operation are shown in tables 111-7 and 111-8, re- spectively. The details are given in reference 6 , together with a complete sample calculation for one configuration. In table 111-7 (2.45 gigahertz), the microwave system has been sized to conform with the 23-mW/cm2 ionospheric limit for the first four antenna/rectenna configurations. ionospheric constraint for the last three configurations results in a maxi- mum of 91 mW/cm2 for the 5-gigawatt, 2-kilometer-diameter antenna system.
Removal of this
50

N H o$
4 01 r3
I & ln a, u
a, N
m &
r3.I a
s
e ?
B m
m Pl m.
I. r- I H H H
3 d !a
m L) .d
.d d
0 .d $4 a,
E!
-5. E! m 0
.r(
-0 a, m m a, & 0 C H
u .d
.d d
V -4 & a,
0
-5. g
e
m 0
-r(
N
0 \
7 m N
& a, U a, m & m Pl
e
4 l n m o m . N - l
\O
. . . . . . . . . . . . . . . . . . . . . . . . . . . . . . . . . . . . . . . . . . e 4 . . . - 0 . . e \
* ' % " . . . .
I : e .A
.d d
a a, m m a, & u C H
u .d
.r( rl
e
N e 0 \
7 m N
u 9 e a, d W
4
4 I
I 4
. . . . . . . . . . . . . . . . . . . . . . . . . . . . . . . . . . . . . . . a, . . . . . . . . . . . . u . . . . . . . . . . . . 9 .
51
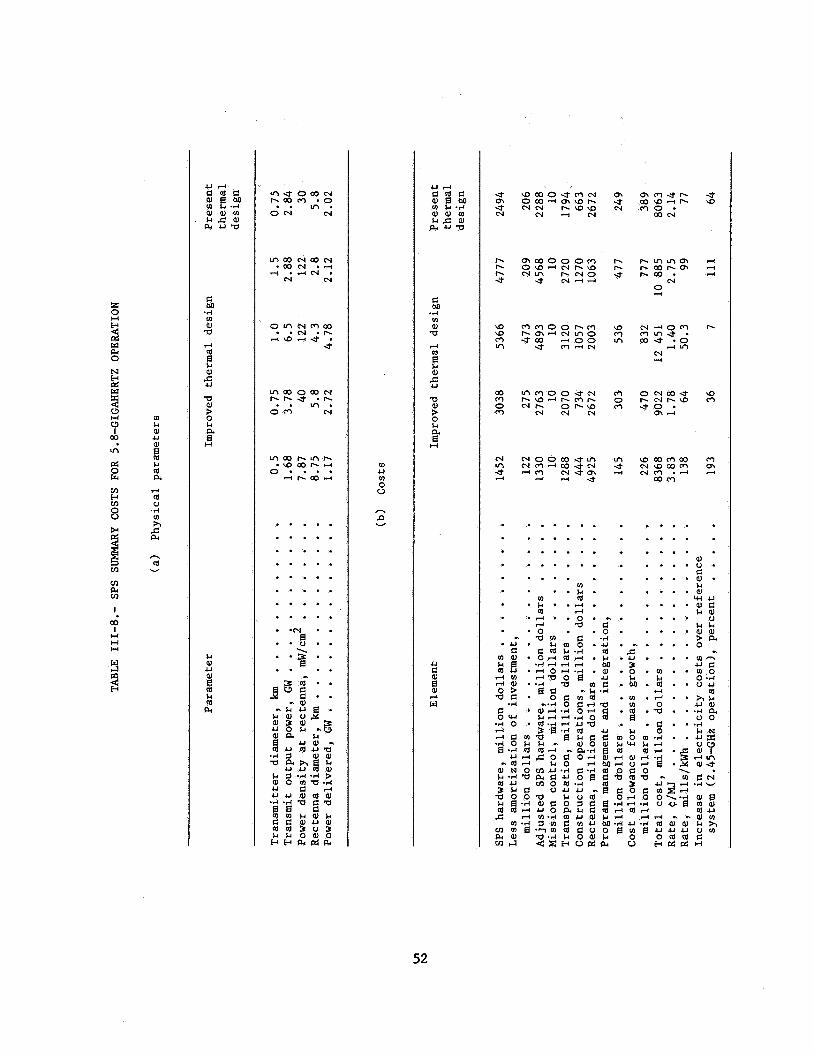
z 2 3 w P4 0
VI P4 v)
I. W
I H H H
u d c m c
m a l o U . c a, P4ua
: $ 3
eM .4 rn a, -0
d m
a, e
5 V a,
3 H
M a, u
m m P4
B
. . . . . . . . . . . . . . . . . . . . . . . . . . . . . . . . . . . . . . . .
o U 10 0 U
c\
V .o . . . . . . . . . . . . . . . . . . . . . . . . . . . . . . . . . . . . . . .
aJ . . . . . . . . . . . . 0 . . . . . . . . . . . . g . o . . . . M . . . . . . a
o a w u . . M . . d . . . . . . a , c m d Ld) . . d . . O . . . . . . . . 0
a c
3 .o . M
m h M
52

The electricity costs and the differential cost in- crease as compared to the 5-gigawatt, 1-kilometer antenna reference system are shown in figure 111-14 for 2.45-gigahertz operation. The upper curve, constrained to an ionospheric limit of 23 mW/cm2, shows a significant in- crease in electricity costs as the antenna size increases. Microwave power density in the ionosphere is directly proportional to transmit antenna area and total transmit power; therefore, if the antenna area is doubled, the power must be reduced by one-half to maintain the same power density. electricity cost rates are determined by the total satellite costs divided by the delivered power. As seen from the cost summary in table 111-7, the total satellite costs decrease at a much slower rate than does the delivered power as the antenna size increases. This cost disadvantage with larger antennas is removed if the total transmit power remains constant as the antenna size changes. However, the ionospheric power density increases accordingly.
The
The 5.8-gigahertz systems (table 111-8) have thermal limitations in the transmit antenna rather than ionospheric limitations as the dominant constraint. The 5.8-gigahertz systems are inherently smaller (antenna sizing, transmit power, and rectenna sizing) as compared to the 2.45-gigahertz configurations because of the increased antenna gain at higher frequencies.
The electricity costs for the 5.8-gigahertz systems are compared to the reference 2.45-gigahertz system in figure 111-15. The data indicate that a significant reduction in costs can be achieved with a modest improvement in thermal radiator design. ential cost is reduced from 64 to 36 percent for the 0.75-kilometer-diameter antenna by using a new thermal radiator configuration, improvements in ther- mal design are considered mandatory. are given in reference 6.
Since the increase in differ-
Details of the thermal design estimates
In summarizing the costing results and the microwave system trade-offs, several options should be considered further.
2.45 GHz
2.45 GHz
5.8 GHz
Increase ionospheric limit to 54 mW/cm2
Retain 23 mW/cm2 as ionospheric limit
Increase antenna thermal limit by 33 percent
1.53-km antenna; 6.8-km rectenna with 5 GW grid power; differential cost increase is 17 percent (to 1.53C/MJ (55 mills/kWh) )
1.36-km antenna; 7.6-km rectenna with 2.7 GW grid power; differential cost increase is 50.2 percent (to 1.96~/MJ (70.6 mills/kWh))
0.75-km antenna; 5.8-km rectenna with 2.72 GW grid power; differential cost increase is 36 percent (to 1.78c/MJ (64 mills/kWh))
53
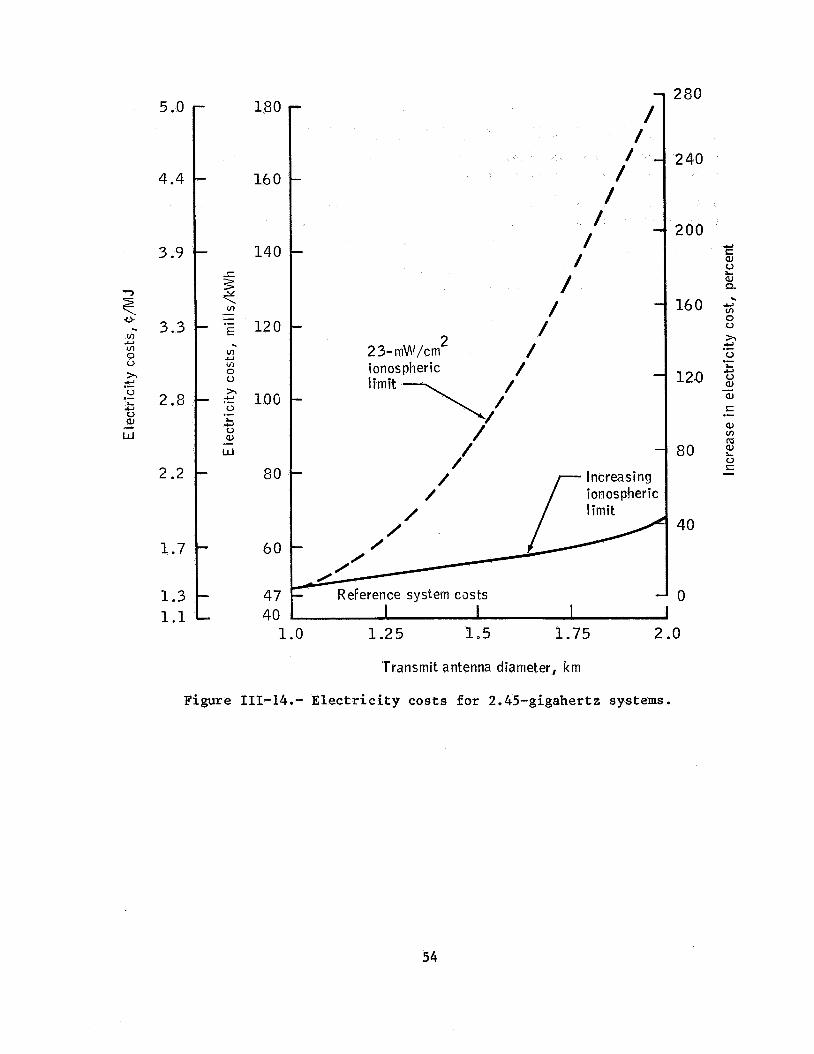
5 .O
4.4
3.9
z! 0
4 3.3 v) U vr 0 V
h U
V
u aJ
.- *z 2.8 U
- W
2.2
1.7
1 .3 1.1
180
16 0
140
5 < v, -
- 2 120 . vr U "*i 0 V
- $ 100 0
V a, w
.- L U
-
80
60
- 47 - 40
i 280
2 2 3- m\l\//cm ionospheric
240
200 & 8 aJ 0
Q 8
160 2 0 V
h
0 L 4
2i .- 120 g
aJ 8
a, v, m 0 8
.- 80 E
-
40
0
1 .o 1.25 1.5 1.75 2 .o
'Transmit antenna diameter, km
Figure 111-14.- Electr ic i ty costs for 2.45-gigahertz systems.
54

- In U
In 0 0
3.9
3 . 3
2.8
2.2
1.7
1.3
1.1
-
- c
3 e In - - .- - E . In U In 0 0
U .- u
u aJ w
.- - L U
-
-
- -
140
12 0
100
80
60
4 7
40 I I 1 1 I
200
U 8 150
In U m 0 0 ;h
100 5 .- L U
u aJ aJ - 8 .- 0 m
50 m 2 V S
0
.5 .75 1.0 1.25 1.5
Transmit antenna diameter, km
Figure 111-15 .- Elec tr i c i ty costs for 5.8-gigahertz systems.
55

The microwave radiation patterns for the 1.53-kilometer antenna op 2.45 gigahertz and the 0.75-kilometer antenna at 5.8 gigahertz are with the 1-kilometer, 5-gigawatt reference SPS system in figure I1 5.8-gigahertz system has lower side lobes than the reference 2.45-gigahertz system near the rectenna.
(2) Multiple antennas - The current SPS scenario has 60 satellites separated 1' (700 kilometers) in geosynchronous orbit, each de- livering 5 gigawatts of rectenna dc grid power. -Because of increased de- mands for geosynchronous slots by other users, it may become necessary to reduce the number of SPS's. It has been shown that SPS antennas can operate in close promixity with negligible mutual interference. An example of a multiple-antenna system would be a 5- by 20-kilometer solar array (twice the size of the current solar array for one antenna) feeding two 5-gigawatt antennas, one at each end. It may be advantageous to have four or more antennas on a single sat- ellite especially if a larger antenna/smaller rectenna configuration or a higher frequen,cy (5.8 gigahertz) system is chosen. The relative sizes for a number of antenna/rectenna configurations are shown in figure 111-17.
Multiple antennas on one SPS are recommended.
(3) Summary - The satellite and associated microwave sys- tem have been reoptimized with larger antennas (at 2.45 gigahertz), reduced output powers,, and smaller rectennas. Four constraints were considered: (a) the 23-mW/cm2 ionospheric limit, (b) a higher (54 mW/cm2) ionospheric limit, ( c ) the 23-kW/m2 antenna power density limit (thermal), and (d) an improved thermal design allowing 33 percent additional waste heat. The differential costs in electricity for seven antenna/rectenna configurations operating at 2.45 gigahertz and five satellite systems operating at 5.8 gigahertz have been calculated. The conclusions are as follows.
Larger antenna/smaller rectenna configurations are economically feasible under certain conditions.
Transmit antenna diameters should be limited to 1 to 1.5 kilometers for 2.45-gigahertz operation and 0.75 to 1.0 kilometer for 5.8- gigahertz operation.
Two 2.45-gigahertz configurations (table 111-7) are selected, dependent on the ionospheric power dens i ty 1 imi t .
56

100
10
tu E, \
E s .
U
m S W -a
.-
1 &I
5
5
Q
W > m
1 0 .- z
.1
.01 0 5 I. 0 15
Radius from rectenna boresight, km
Figure 111-16.- Antenna pa t t e rns fo r th ree SPS configurat ions.
57
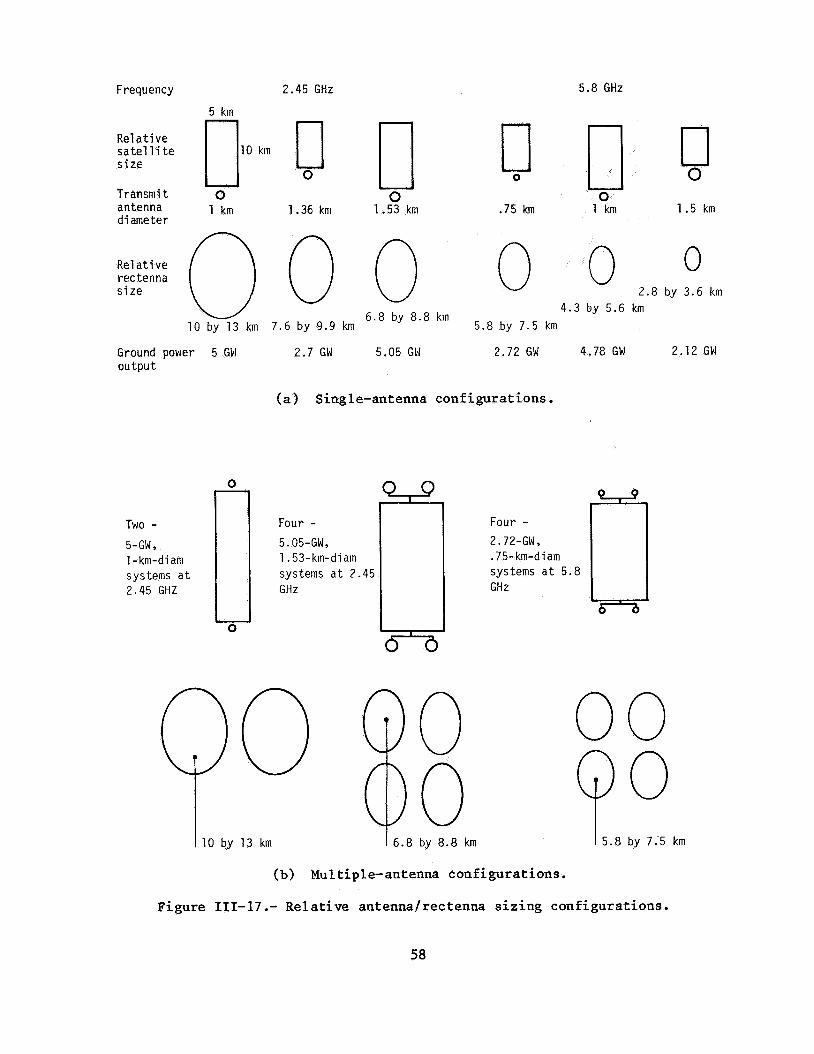
Frequency 2.45 GHz
U l O km
0
5.8 GHz
Re1 a t i ve sate1 1 i t e s i zf
Transmi t antenna diameter
1 km 1.36 km 0
1.53 km
0 0
.75 km 0
1 km 1.5 km
Ground power 5 Girl 2.7 GW 5.05 GI4 2.72 GW 4.78 GW 2.12 GW ou tpu t
(a) Single-antenna configurations.
TWO - 5-GW, 1 - km-di am systems a t 2.45 GHZ
Four -
1.53-km-diam systems a t 2.45 GHz
5. 05-GWy
Four -
.75-km-diam systems a t 5.8 GHz
2.72-GW
00 0 O 0 13 km ~8 o k m ~8 by 7.5 km
(b) Multiple-antenna configurations.
Figure 111-17 .- Relative antenna/rectenna sizing configurations. 58

23-mw/cm2 54-m~/ cm2 limit limit
Antenna diameter, km . . . . . . . Rectenna dc grid power, GW . . . . . . Rectenna diameter, km . . . . . . . . Relative rectenna area, percent . . . Electricity cost increase, percent . Electricity cost, c/MJ (mills/kWh) . . 1.96
Note: The rectenna areas and electricity costs are for the reference SPS system.
1.36 1.53 2.76 5.05 7.6 6.8 56 46 50 17
(70.6) 1.53 (55)
in comparison to those
(d) The existing ionospheric limit of 23 mW/cm2 is too low and should be raised after the ionospheric heating tests and studies are completed. For SPS cost considerations, it is very important to ascertain the true upper limit.
(e) The 5.8-gigahertz configurations (table 111-8) are constrained by antenna thermal limitations rather than ionospheric limits. A reasonable configuration based on a 33-percent improvement in waste heat rejection is
Antenna diameter, km . . . . . . . . 0.75 Rectenna dc grid power, GW . . . . . . 2.72 Rectenna diameter, km . . . . . . . . 5.8
Electricity cost increase, percent . . 36 Electricity cost, c/MJ (mills/kWh) . . 1.78 (64)
Relative rectenna area, percent . . . 33
(f) The impact on commercial utility grids of a 5.8- gigahertz system which has to be shut down on an unscheduled basis due to localized weather condi- tions is not known.
(g) Multiple (two to four) antennas on a single SPS are definitely recommended regardless of the par- ticular antenna/rectenna configuration chosen. This is a means for maintaining the same amount of power supplied to the ground while reducing the geosynchronous slots (spacings) required for the satellites.
c. Magnetron, Laser, and Solid-state Configurations
Several alternate microwave systems are being studied in which the klystron tubes are replaced with mediwn-power magnetrons or low- power solid-state amplifiers. Laser transmission offers the possibility of
59

replacing the entire microwave system. Results of preliminary studies into these alternatives may be summarized as follows.
(1) Magnetrons - The use of an injection-locked magnetron is being studied by W. C. Brown of the Raytheon Company. Two configurations have been proposed: (a) a magnetron connected with a three-port ferrite cir- culator and (b) two matched magnetrons connected to a four-port "magic T." Although the magnetron and the amplitron are both crossed-field amplifiers, the magnetron has a higher gain (20 to 30 decibels as compared to 10 decibels for the amplitron) and superior noise performance characteristics. The pos- sible use of magnetrons gained impetus from the discovery that these tubes have an extremely high signal-to-noise ratio (S/N) when the filament power is turned off. Subsequent studies indicate that random noise from the tube is not an inherent property of the basic energy conversion process but is associated with one or more extraneous mechanisms not currently understood (ref. 25). Not all tubes exhibited the large reduction in noise when the filament was turned off, although the reason was not known.
A microwave antenna implemented with magnetrons would be considerably different from a klystron antenna. A single magnetron would be used to provide the rf drive into the circulators or the magic T's for 50 to 100 magnetron tubes. The output of each tube would be sampled, and an error signal would operate an rf phase shifter at the tube input to maintain proper phasing. Since this phase shifter operates between the output of the driver magnetron and the input to the second magnetron, the device has rela- tively high power in comparison to the phase controller for the klystron tube system. The reason for the difference in the phase control systems for the magnetrons and the klystrons is the difference in the gains of the tubes (50 decibels for klystrons and 20 to 30 decibels for magnetrons). The phase shifter for the magnetrons may be a mechanical device.
In summary, the magnetron shows promise of achieving high efficiency with long operating lifetimes. The noise performance when operating these tubes at high-strength magnetic fields to obtain the desired efficiency and at high voltage-to-current ratios to achieve long lifetimes is being investigated.
(2) Lasers - An SPS system using lasers would employ many smaller power transmission links to ground receivers with diameters on the order of 100 meters; therefore, the use of lasers would greatly reduce any rectenna siting problems. However, lasers do incur a number of problems that must be solved. These include low conversion efficiencies (i.e., existing systems typically have 10-percent efficiencies), technology status, beam point- ing, thermal limitations, reliability, and weather effects. Since several government agencies have substantial basic research programs in the area of high-power, high-efficiency laser systems, these problems are being studied.
System studies by the Boeing Aerospace Company indi- cate that a laser power transmission satellite would probably employ a number
60

of lasers in the 1- to 10-megawatt power range (ref. 3 ) . The most promising laser options include the following.
(a) Gas electric discharge laser - The gas electric discharge laser (EDL) has potential for high power and fair efficiency. The carbon monoxide (CO) and carbon dioxide (COS) lasers were inves- tigated in some detail. terms of mass in space per unit ground grid power (kg/kW) indicate that the subsonic C02 system is approximately six times as heavy as the reference microwave system. The supersonic CO laser system is seven times heavier than the microwave system.
Mass comparisons in
Indirect optically pumped gas laser - In this sys- tem, the solar array is eliminated since the solar energy is concentrated on a cavity for heating a lasant gas such as CO or C02. bine power system processes the heated gas through a laser cavity, where the energy is extracted via a laser beam. This system has potential for marked improvement with technology advances and is less massive than the EDL sys tems .
A Brayton cycle tur-
Free electron laser - The free electron laser (FEL) has potential for high power and good effi- ciency, but technology is still in the embryonic stage. In this system, coherent light is emitted by interaction of an electron beam with an alter- nating magnetic field. tor configurations were studied, with the single- pass storage ring system chosen as the most promising. An overall accelerator efficiency of 40 percent from the electricity input from the solar arrays to laser power output is considered a reasonable goal. The total system efficiency from sunlight onto the solar array to electric- ity at the ground is 4 percent as compared to 7 percent for the microwave reference system. FEL system is also the least massive of the laser options if the efficiency estimates are valid.
Three types of accelera-
The
An optical rectenna for converting the laser energy at This ground system uses simple the ground into electricity was also studied.
parabolic concentrators and pulsed laser operation for generating high power intensities for efficient light-to-electricity conversion. A conversion effi- ciency of 80 percent is projected.
In summary, lasers with sufficient technology ad- vancement can provide small (less than 100 megawatts) blocks of power with modest increases in electricity costs as compared to the reference 5-gigawatt microwave system. Operational availability is better than ground solar but
61

not as good as the microwave system. The most promising areas for research include the free electron laser and the optical rectenna.
( 3 ) Solid state - The major advantage of solid-state de- vices is the increased reliability compared to tubes. Solid-state microwave transmission concepts would have a major impact on the reference SPS design. The solid-state transmitter W i l l have a lower power density of microwave energy in the center of the antenna because of temperature limitations. The transmitting antenna will be larger than 1 kilometer in diameter in order to transmit several gigawatts of power and, consequently, the rectenna will be smaller.
Two configurations are being studied: (a) a dedi- cated antenna with solid-state devices replacing the klystron tubes and (b) a "sandwich" concept, in which solid-state amplifiers and solar cells are combined. Details of these configurations and trade-off considerations are given in Section 1II.F.
B. PHASE CONTROL
1. SYSTEM REQUIREMENTS AND CONCEPTS
The forming, steering, and control of the SPS microwave beam are of major concern not only because of power-transfer efficiency considera- tions but also from a safety and environmental viewpoint. At the heart of the microwave power beam is the phase control system. This system, in es- sence, must adjust the phase of each radiating element, automatically account- ing for element location, antenna-pointing error, surface roughness (mechan- ical alinement of subarrays), and phase distribution system delays.
Significant efforts have been underway to define the phase con- trol system functional requirements and to establish acceptable performance limits. Major system studies conducted by Boeing Aerospace Company and Rock- well International have helped to define the functional requirements of the phase control system. Early work accomplished by the Raytheon Company, the NASA Jet Propulsion Laboratory (JPL), and the LinCom Corporation resulted in the retrodirective beam-steering system concept presently employed as the basis of the SPS phase control system. Other sources have offered several alternate approaches and some with refinements to the retrodirective approach. For example, Novar Electronics Corporation has outlined a ground-based phase control technique using interferometry techniques; others (e.g., Raytheon) suggested pattern-synthesis techniques for phase control. LinCom Corporation has recently conducted an initial analytical evaluation of a potential ground- based phase control concept resulting from the Novar initiative with modifi- cations and refinements suggested by JSC.
a. System Requirements
As pointed out in the introduction, the phase control syo- tem must accomplish three major functions: pointing, and power beam safing (control). quirements in each of these major areas are fairly obvious. First, a highly
power beam forming, power beam The generic or functional re-
62

directional microwave signal must be generated. In the SPS, the signal is generated by properly phasing each spacetenna radiating power module (or subarray) to produce a broadside radiation pattern equivalent to the array beam shape.
Once a properly formed beam is achieved, the center of the beam must be precisely pointed at the Earth-based rectenna to transfer power efficiently. Since the mechanical pointing accuracy of the spacetenna and of the individual subarxays within the spacetenna is expected to be on the order of 1 and 3 arc-minutes, respectively (ref. 26), the potential miss distance on the Earth's surface from geosynchronous altitude would be on the order of 10 to 30 kilometers, which would result in completely missing the 10-kilo- meter-diameter rectenna site. To compensate for this pointing inaccuracy, the SPS phase control system must be capable of properly adjusting the phase of each radiating-element power module to shift the power beam center with- out degrading the beam shape. The accuracy that must be achieved dictates development of new and highly sophisticated phase control techniques, which are discussed later.
The final function which must be provided by the phase con- trol system is that of power beam safing. This aspect is inherent in the phase control process since the power beam intensity is greatly diffused if loss of phasing occurs, because of the excessive element-to-element phase errors. For example, if the phase error across the spacetenna exceeds 90° rms at the rf beam frequency, the array pattern has diffused to that of a sin- gle transmitting element (power module) and the total energy is spread over an extremely large area. removed from the rectenna site may increase when dephasing occurs, it will re- main well below the U.S. and U.S.S.R. standards for S-band radiation exposure (10 and 0.01 mW/cm2, respectively), as shown previously in figure 111-7. Thus, complete loss of phasing results in automatic safing as far as power density requirements are concerned. The other aspect of phasing loss which must be considered is that of partial dephasing or covert (jamming) dephasing. To protect against an intentional dephasing attempt or an attempt to redirect (rob) power, a method of coding each SPS pilot signal is included in the existing baseline system. To protect against the possibility of beam wander due to excessive phase errors during system startup or shutdown, some type of ground sensor network may be required in the vicinity of the rectenna sites. Thus, by using the concept of a retrodirective phase array system incorpo- rating a coded (secure) pilot signal and ground sensors for additional safing considerations, the baseline SPS phase control system meets the general func- tional requirements discussed previously.
Although the power density at a given location far
b. System Concepts
Achieving the phase accuracy necessary to meet the design goal power-transfer efficiency (~90 percent) will require advanced concepts and implementation techniques for the SPS phase control system. Two broad categories of phase control concepts have been investigated. First, tech- niques which employ phase corrections introduced at the transmitting array by way of ground system command links were considered. Several approaches to
63

obtaining the phase estimate required for control of each transmit element's phase have been investigated. These include the following.
(1) Element phase estimation based on power beam pattern synthesis in the vicinity of the rectenna site (refs. 16 and 27)
(2) Multiple transmit frequencies for each radiating ele- ment to achieve phase estimation from traveling-wave interferometer measurements (ref. 8 )
Direct phase measurement of signals transmitted from individual elements by sequential comparison of a coded (modulated) element's signal with the averaged phase of all other element signals at the rectenna cen- ter (ref. 1612
( 3 )
None of the ground-based phase control techniques have been thoroughly eval- uated. However, NASA is actively investigating techniques involving sequential comparison of element signal phases using multiple tones to isolate the phase of the wanted signal from that of the power signal and the interferometer- based technique for phase estimation.
c. Conclusions and Remaining Issues
A s a result of the analytical, simulation, and test ac- tivities conducted to date, the following conclusions have been drawn with respect to the SPS phase control system.
(1) Performance conclusions - The following conclusions can be stated with respect to performance.
(a> Beam misalinement (pointing error) is not crit- ical when 10' rms phase error is achieved pro- viding antenna/subarray mechanical alinement re- quirements are maintained.
(b) Upward bound on phase error is determined by ac- ceptable economic losses in scattered power rather than beam-pointing errors or environmental f ac tors .
(c) Based on the reference system configuration, for 10' rms phase error, the power lost from the main beam is less than 3 percent and the beam-pointing error is less than f250 meters with 99 percent probability.
25. C. Vanelli: Scheme for Phase Control of Spacetenna Elements. Lockheed Electronics Company interdepartmental communication LEC-79-17-769-01.
64
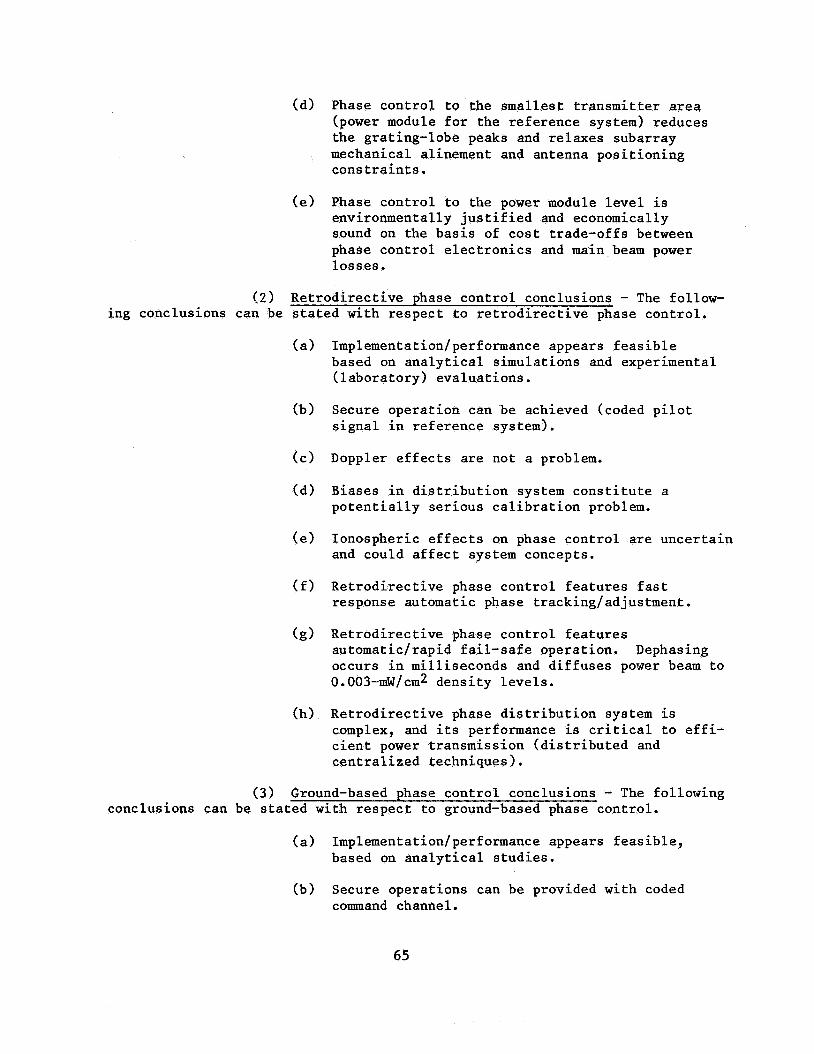
(d) Phase control to the smallest transmitter area (power module for the reference system) reduces the grating-lobe peaks and relaxes subarray mechanical alinement and antenna positioning constraints.
(e) Phase control to the power module level is environmentally justified and economically sound on the basis of cost trade-offs between phase control electronics and main beam power losses.
(2) Retrodirective phase control conclusions - The follow- ing conclusions can be stated with respect to retrodirective phase control.
Implementation/performance appears feasible based on analytical simulations and experimental (laboratory) evaluations.
Secure operation can be achieved (coded pilot signal in reference system).
Doppler effects are not a problem.
Biases in distribution system constitute a potentially serious calibration problem.
Ionospheric effects on phase control are uncertain and could affect system concepts.
Retrodirective phase control features fast response automatic phase tracking/adjustment.
Retrodirective phase control features automatic/rapid fail-safe operation. Dephasing occurs in milliseconds and diffuses power beam to 0.003-mW/cm2 density levels.
Retrodirective phase distribution system is complex, and its performance is critical to effi- cient power transmission (distributed and centralized techniques).
(3) Ground-based phase control conclusions - The following conclusions can be stated with respect to ground-based phase control.
(a) Implementation/performance appears feasible, based on analytical studies.
(b) Secure operations can be provided with coded command channel.
65
Ionospheric effects on phase control performance are uncertain and could affect system concepts.
Biases in distribution system can be adjusted out during normal operations (part of the phase con- trol loop).
Ground-based phase control features closed-loop phasing (measures phase at ground and commands phase adjustments by way of communication link).
Ground-based phase control has slower responses than retrodirective (0.25-second delay due to geosynchronous transmit time).
Dephasing process of ground-based phase control is slower than retrodirective and may require ad- ditional beam-safing measures.
( 4 ) Hybrid phase control conclusions - The following con- clusions can be stated with respect to hybrid (retrodirective and ground based) phase control.
(a) Hybrid phase control combines the best features of each concept.
(b) System implementation concepts/feasibility have not been studied in sufficient detail for compar- ison with individual concepts (i.e., retrodirective and ground based).
(5) Remaining issues - The remaining issues relating to the phase control system which must be addressed before selection of an SPS phase control system design concept are as follows.
(a) Phase error buildup in distribution system
(b) Array topology for distribution system (phase error buildup compared to reliability)
(c) Cable compared to fiber optics distribution techniques
(d) Power signal interference on pilot signal receiver
(e) Phase conjugation accuracy
(f) Effects of ionospheric/atmospheric disturbances
(g) Alternate concepts to retrodirective approach
66

(h)
(i)
(j)
Accuracy of beam formation and pointing
Failure effects on beam forming and pointing
RFI of power module due to phase-lock loop around power amplifier (PA)
2. REFERENCE PHASE CONTROL SYSTEM
At the present time, none of the ground-based phase control techniques have been thoroughly analyzed; however, NASA is actively investi- gating two ground-based techniques referred to in subsection lb. Since the performance criteria using ground-based phase control concepts have not been fully developed, the baseline SPS phase control system incorporates onboard phase reference distribution and retrodirective phasing for beam forming and steering (pointing). ever, application of these concepts to such large arrays as required for the SPS system has presented many new and unique problems, such as the distribu- tion of highly accurate reference phase information over 500-meter distances. Several investigations of the applicability of retrodirective techniques to the SPS phasing problems have been conducted. The JSC, MSFC, and JPL have conducted in-depth in-house studies as well as awarding study contracts to in- dustry. As a result of these study activities, a baseline phase control sys- tem has been established using the results of the LinCom study (refs. 1, 28, and 29) as a basis for system analysis and performance evaluation. The base- line phase control system incorporates the basic concepts of reference phase distribution and retrodirective beam steering.
The concepts of retrodirective arrays are not new; how-
a. Reference System Description
The phase control system has been divided into two major levels. erence phase distribution network or tree which electronically compensates for path-length variations to maintain a constant-phase reference at each of 101 552 radiating elements. The second level is the beam-steering and micro- wave amplifier control system consisting of the phase conjugating and pilot receiving equipment which receives a uniquely designed pilot signal and al- lows carrier reconstruction and phase conjugation at the power beam frequency. This concept avoids the problems of beam deflection due to frequency offsets between pilot and power beam signals. The second level also provides the phase control necessary to maintain an equal and constant phase independent- ly through each of the microwave power amplifiers. A generic block diagram of the overall phase control system, incorporating the master slave return- able timing system (MSRTS), is shown in figure 111-18.
The first level is the phase distribution system consisting of a ref-
The phase distribution portion of the system includes the distribution "cables" and phase control electronics, which transfer a con- stant phase throughout the network. curacy required over the l-kilometer aperture of the SPS, some method of ac- tive phase control is necessary within the phase distribution system. baseline system, this control is accomplished using a technique referred to as
To maintain the precise phase/timing ac-
In the
67

r- I I I I I I 1 I I I I I
0
m 3 E 0 0 L Y ““l
‘E 3
I 2 I - L C
I I I I I I I I I I I I I I I I I I
5 3 Y ffl
al m m r a
I I I
0
0
Y
I.
a
I I I I I I I I
I
1 c 0
- -
.c I I I I I I I. I I I I I I I I I I I I I I I I I I I I I
68

r e tu rnab le timing ( r e f . 28) i l l u s t r a t e d i n f i g u r e 111-19. A por t ion of the reference s i g n a l a t the received loca t ion i s amplified and coupled back i n t o the d i s t r i b u t i o n cable by way of a c i r c u l a t o r . This re turned s i g n a l sample i s then used f o r phase locking t o the o r i g i n a l re ference input of the phase cont ro l cen te r (PCC). Since the s a m e frequency i s t ransmit ted i n both direc- t i ons over t he d i s t r i b u t i o n cable , phase e r r o r s due t o frequency d ispers ion of the cable are eliminated. When phase lock occurs, the r e s u l t a n t s i g n a l a t point B i n f i g u r e 111-19 i s dr iven to , and maintained a t , t he same phase as the re ference signal a t poin t A, even i f the path length va r i e s . Providing the d i s t r i b u t i o n signal frequency i s an even submultiple of the re ference sig- nal frequency required f o r conjugation, the phase can be d i s t r i b u t e d accu- r a t e l y over var ious lengths of cable without ambiguity.
The method f o r d i s t r i b u t i n g the phase reference s i g n a l over the l a rge a rea of the SPS ar ray i s i l l u s t r a t e d i n f i g u r e 111-20. The system i s r e fe r r ed t o as the master s lave technique ( r e f . 28) and cons i s t s of a mas- t e r o r re ference s igna l source derived from the p i l o t s igna l rece iver located a t the center of the SPS array. The phase of t h i s s igna l is then d i s t r i b u t e d (using the r e tu rnab le timing delay compensation technique described previously) t o a group of secondary or s lave o s c i l l a t o r s and serves as the phase re ference s igna l f o r the phase con t ro l cen ters a t the next l e v e l of the d i s t r i b u t i o n network. These secondary or s lave o s c i l l a t o r s then serve as the master osc i l - l a t o r s f o r the second group of o s c i l l a t o r s ( s l aves ) by providing the same reference phase as the o r i g i n a l re ference (master o s c i l l a t o r ) . The phase of the master i s thus promulgated throughout the d i s t r i b u t i o n network o r tree t o each of the 101 552 r a d i a t i n g power modules of the SPS system. The exact conf igura t ion f o r the d i s t r i b u t i o n tree i s not completely defined; however, the conf igura t ion recommended in the Boeing Aerospace Company SPS d e f i n i t i o n study ( r e f . 29) has been incorporated as the e x i s t i n g base l ine t o e s t a b l i s h performance c h a r a c t e r i s t i c s f o r var ious amounts of phase e r r o r buildup i n each branch of the tree. This d i s t r i b u t i o n tree incorporates a 20-way power divi- s ion a t the f i r s t l e v e l and a 19-way power d iv i s ion a t l e v e l s 2 and 3, with a v a r i a b l e degree of power d iv i s ion a t the four th o r f i n a l l e v e l t o match the network t o the number of power modules i n each subarray.
Once a constant reference phase i s d i s t r i b u t e d t o each ra- d i a t i n g power module, a method f o r recovery and conjugation of the received p i l o t s i g n a l ' s phase must be employed. Figure 111-21 i s a block diagram of the power transponder, which includes the p i l o t s i g n a l rece iver , the phase conjugation e l e c t r o n i c s , and the power ampl i f ie r with i t s phase cont ro l loop. A s mentioned previously, a uniquely coded p i l o t s i g n a l has been developed. The s i g n a l design cons i s t s of nonreturn-to-zero command da ta (op t iona l ) , modulo two added with a sp l i t -phase , direct-sequence pseudonoise code, which then biphase modulates the r f p i l o t c a r r i e r s i g n a l of 2450 megahertz.
The one-sided power s p e c t r a l dens i ty of the modulated p i l o t s igna l i s shown i n f i g u r e 111-22. r e s u l t s i n a s p e c t r a l d i s t r i b u t i o n of energy which peaks e i t h e r s i d e of the c a r r i e r a t approximately 3R/4, where R i s the PN code chip rate. Proper s e l e c t i o n of R w i l l thus enable r f f i l t e r i n g a t the power transponder re- ce iver t o provide i s o l a t i o n between the des i red p i l o t s i g n a l and the unwanted power s i g n a l present at the p i l o t c a r r i e r frequency f p of 2450 megahertz.
The spl i t -phase format of the PN sequence
69
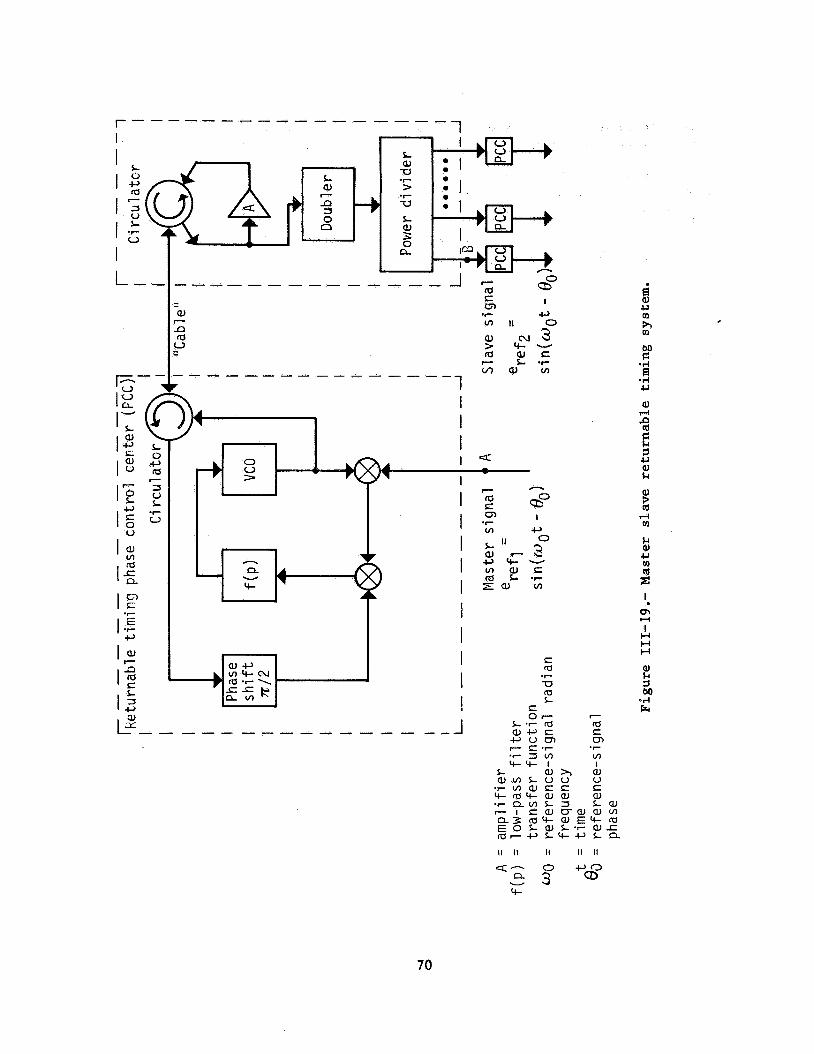
I I 1 I I I
I I 1 !
- - _I
I I
L a x
!i a, w v)
h v1
F .rl
*rl u a, I4
B
% E 1 w a, k
a, 3 rd I4 v)
k a, .U
3 I.
c
a\ 4 I H H H
a, k 1 M .rl k
F
a S tT,
v, I aJ
*7
70

Y (LI I-
W Z U-C
O t U
L l n L f f l r w 3 m 3 O L C - ,
L O .e.
ac, a-
...... T
W L? f f l z u u L O O E !i
LUIL W S W 3 n 3 O L O a w CLU
E N L X a J
-I-'
ffl > m
-=2t In\ \e W O a
t
I I I I I I I I I I I I I I I I
I
f
a, W > > m m 7-
\N (I)\ f....... Lz m 7
O W N O O a a
Y
L-
Y
f
R \\ O d -
I I I I I I I I I I I I I I I I I I I
I .- I I I
a 0 3 ffl L u*r >.rv aJ L
4
V ln 0
II
V ul 0
J ; 2
k
u
E: 0 .rl u 7 P .A $4 u rn .d a m E-l
c !2 '. 0 e4 I H H H
al k 7 bo .rl Frr
71

I -1 I I I I
I I I I I I I I I I I
I ?i td k M (d
I
I. d e4
I H H H
P) k 3 M
.rl Bi
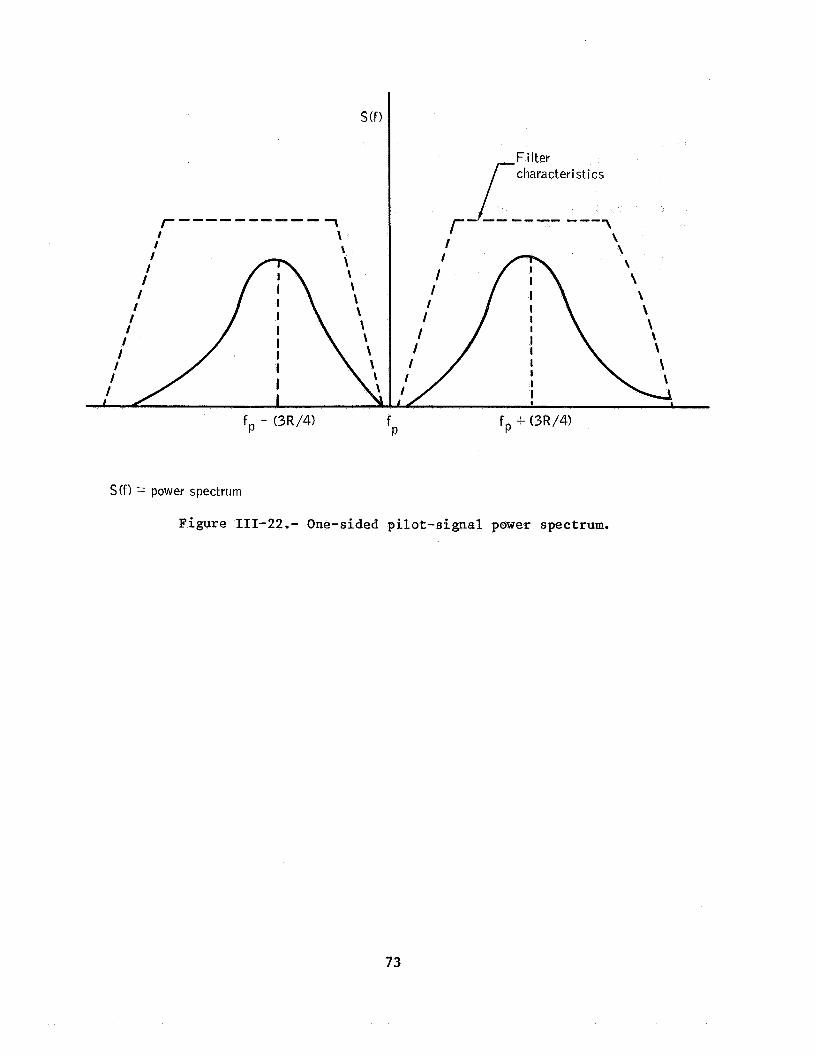
r ---- ----- - 7 I \ I I
I
\ \
I I
I
I I I I I I I
fp + (3R/4) P
fp - (3R/4) f
S(f) = power spectrum
Figure 111-22.- One-sided p i lo t - s igna l power spectrum.
73

Within the power transponder, the PN spread signal is con- verted to an intermediate frequency, and the PN code is acquired and tracked (noncoherently) by the PN synchronization system (PNSS) using a tau-dither code-tracking loop with a microprocessor-controlled acquisition algorithm. Once the PN code is acquired, the local code generator in the PNSS begins ac- curately tracking the pilot signal's code phase. This local code is then used to multiply the incoming modulated i.f. pilot signal, effectively re- moving the PN code modulation or despreading the pilot signal. After de- spreading occurs, the pilot signal is coupled to the carrier synchronization system. The carrier synchronization is achieved by reconstruction of the phantom carrier (assuming command data are phase-shift keying the pilot car- rier signal) using a Costas loop. The carrier loop voltage-controlled oscil- lator (VCO) is multiplied and serves as the first local oscillator signal re- sulting in a long-loop phase-modulation receiver configuration. The carrier loop acquisition will be automatic, and the potential phase ambiguity associ- ated with the Costas loop detection process will be resolved by establishing a required polarity for the command data format. uous phase has been established, the carrier loop VCO signal is mixed with the reference signal provided by the phase distribution system. mixing process, the lower sideband term is used to convert the sign of the reconstructed pilot signal's phase. This process is referred to as conju- gation of the pilot phase and, after multiplication by the appropriate fac- tor, serves as the input signal phase reference to the power amplifier phase control subsystem.
Once the correct unambig-
In the
The power amplifier phase control loop is used to compen- sate for phase-delay variations between power tubes and to ensure that the signal at the farthest monitorable output point is kept in phase with the conjugated pilot signal. This control is accomplished by using a sample of the PA rf output for phase locking of the power amplifier source oscillator to the pilot signal conjugated phase reference provided by the carrier syn- chronization system. The PA output is then coupled through the rf filter into the slotted-waveguide antenna feed sticks. From this point on within the waveguide sticks of the slotted array power module, there is no active phase control. power module radiating elements must be maintained mechanically by ensuring a rigid structure which will not deform appreciably with environmental variables.
The spacing of each slot and the surface accuracy of the
The required and projected performance of this baseline phase control system, relating to effects of phase errors resulting from the various subsystem elements, is discussed in the following subsection.
b. Reference System Performance Evaluation
From the system engineering viewpoint, the SPS transmission system which incorporates retrodirectivity is depicted in figure 111-23. As seen from the figure, the system consists of three major subsystem elements.
(1) The reference phase distribution system (MSRTS)
74

Solar power
I power conversion sys tern
Phase con j uya ti on reference signal dc power
1 ---
Reference phase Beam-forming and distribution microwave power-
generating sys tern
I @ Phase control sys tern
I L ------------
spacetenna
J
Mi crotrjave
signal
Figure 111-23 .- SPS transmission system (phase conjugation).
75

( 2 )
( 3 )
The beam-forming and microwave power-generating system
The solar power to electrical power conversion system
In the performance evaluation task, the phase distribution system is modeled in terms of its phase error buildup and randomness due to both electrical im- perfections in the system and mechanical misalinement and jitter of the power module/subarray configurations. The beam-forming and power-generating system is modeled in terms of interference and ionospheric effects on the received pilot signal, transponder phase errors (jitter), and PA phase variations and phase noise characteristics. The solar power to electrical power conversion system only enters into the microwave performance evaluation in terms of the dc power provided to the PA'S and the random error introduced by the power distribution system across the 1-kilometer spacetenna array.
(1) Reference phase distribution system - The reference phase distribution system has been implemented on a four-level tree structure using the MSRTS technique to electronically compensate for phase shifts due to path-length variations from the spacetenna center to each power module. The detailed mathematical model and analysis is provided in reference 23.
( 2 ) Power transponder and pilot signal design assessment - In addition to distributing the constant-phase reference simal over the - spacetenna, a method for recovering the piase of the received pilot signal is required. The functional diagram of the SPS power transponder was shown previously in figure 111-21. receiver, phase conjugation electronics, and the high-power amplifier phase control system.
The power transponder includes the pilot signal
In the mechanization of the SPS power transponders, two receiver "types" will be required; however, most of the hardware will be common between two receivers. One receiver, the pilot spread-spectrum (SS) receiver, is located at the center of the spacetenna or the reference sub- array. It serves two major functions.
(a) Acquires the SS code and the rf carrier and demodulates the command signal
(b) Provides the main input signal to the reference phase distribution system
The second receiver type is located at each power mod- ule. transpond power by way of the j-th spacetenna element, where j = 1, 2, ..., 101 552. for the pilot signal, the Costas loop can be replaced by a CW loop to avoid the need for provisions to resolve the associated Costas-loop-induced phase ambiguity .
Its main purpose is to phase conjugate the received pilot signal and
In the case that data transmitting capability is not implemented
One of the key technical problem areas concerning the design and specification for the SPS power transponder is RFI. ferences are generated by different mechanisms.
The inter-
76
( a ) Self-jamming due t o pre-power-beam package from the d i p l e x e r / c i r c u l a t o r
(b) Mutual coupling from adjacent transponders
( c ) Thermal noise
( d ) In t e r f e rence from adjacent SPS's
The s igna l and in t e r f e rence spectrum a t t h e input t o the SPS transponder i s depicted i n f i g u r e 111-24. I n general , the combined phase noise in t e r f e rence from the power beams cons i s t s of a coherent and a noncoherent term. Depending on the mechanization of the antenna s t r u c t u r e and p i l o t antenna c h a r a c t e r i s t i c s , t hese terms are assoc ia ted with gains K 1 and K2. Note t h a t the phase no i se in t e r f e rences are concentrated around the carrier frequency f o (2450 megahertz). Conversely, the upl ink p i l o t s igna l has l i t t l e o r no power around t h i s frequency. I ts power spectrum peaks a t f o 5 0.75Rc, with a value d i r e c t l y proport ional t o the product of the received power Pr and the PN ch ip ra te Rc and inve r se ly propor t iona l t o the PN code length M. The parameters Rc and M are r e l a t e d t o the processing gain of the PN spread s i g n a l and determine i t s interference-suppression capab i l i t y . The r f f i l t e r c h a r a c t e r i s t i c i s est imated on the bas i s of t h e o r e t i c a l wave- guide antenna bandwidths ranging from 15 t o 45 megahertz. The goal i s t o opt imal ly s e l e c t (a) the p i l o t s igna l so t h a t i t passes the r f f i l t e r with neg l ig ib l e d i s t o r t i o n s and (b) a p r a c t i c a l notch f i l t e r t h a t r e j e c t s most of the phase noise in t e r f e rence . When t h i s procedure i s followed, one can be assured t h a t the recons t ruc ted p i l o t s i g n a l phase a f t e r the synchronizat ion loops is wi th in a t o l e r a b l e e r r o r f o r t h e r e t r o d i r e c t i v e scheme.
Analy t ica l models developed f o r the SPS transponder t racking loop system inc lude t h e following.
( a ) The PN despreader loop
(b) The p i l o t phase t racking (Costas) loop
( c ) The PA phase cont ro l loop
The model a l s o includes the noise processes introduced by the phase re ference rece iver t h a t feeds the phase d i s t r i b u t i o n system and var ious o ther sources of p o t e n t i a l phase no i se in t e r f e rence which a f f e c t the performance of the ind iv idua l loops. I n p a r t i c u l a r , a model of the phase noise p r o f i l e of t he k lys t ron ampl i f i e r i s introduced t o eva lua te important impl ica t ions on t h e PA noise con t ro l loop design.
Using the a n a l y t i c a l model f o r eva lua t ing the o v e r a l l performance of the SPS transponder, the phase f luc tua t ions a t t he output of t he transponder have been shown t o be d i r e c t l y r e l a t e d t o the var ious no i se processes through the closed-loop t r a n s f e r funct ions of the t racking loops. These noise processes are e i t h e r generated e x t e r n a l l y t o the transponder cir- c u i t r y , such as ionospheric d i s turbances and t ransmi t frequency i n s t a b i l i t y ,
77
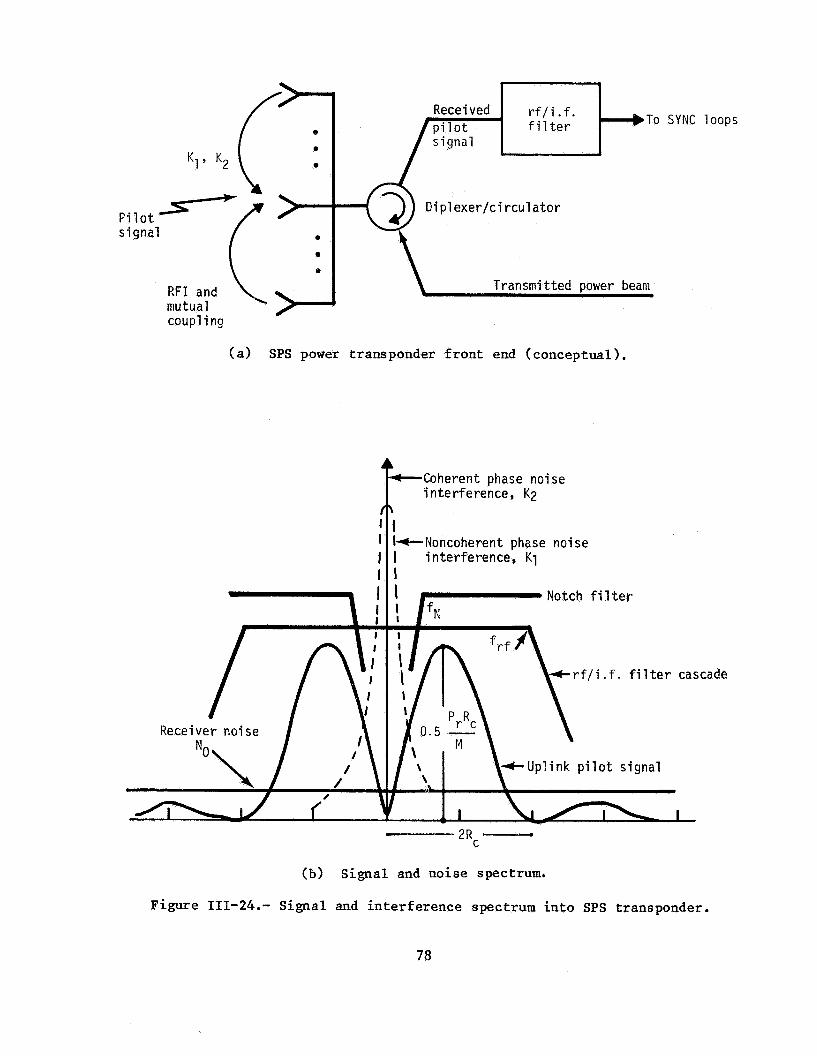
D i pl exer/ci rcul a tor Filot signal
( a ) SPS power transponder f r o n t end (conceptual) .
1 I I I I
Receiver noise
SYNC loops
*Coherent phase noise interference, K2
I WNoncoherent phase noise I interference, K1 I
I
Notch f i l t e r
rf/i.f. f i l t e r cascade
Uplink pilot signal
2Rc - (b) Signal and noise spectrum.
Figure 111-24.- Signal and in t e r f e rence spectrum i n t o SPS transponder.
78

or generated internally, such as receiver thermal noise, power beam inter- ference, data distortions, VCO/mixer phase noise, and phase variations introduced by the reference distribution tree.
The preliminary specifications for the pilot signal and transponder design parameters can be summarized as follows.
EIRP - 93.3 decibels referenced to 1 watt PN chip rate - 10 megahertz rf filter 3-decibel cutoff frequency - 20 megahertz
Notch filter 3-decibel cutoff frequency - 1 megahertz
Notch filter dc attenuation - 60 decibels
PN code period - 1 millisecond
Costas loop phase jitter - 0.lo for 10-hertz loop bandwidth
Channel Doppler - negligible Klystron phase control loop bandwidth - 10 ki 1 oher tz
preliminary results are generated using a tenta- tive model of RFI with coupling coefficients itly, it was assumed that the transponder input encounters a CW interference with power equal to 0.65 kilowatt and a phase noise (l/f type) interference at about 20 watts. Of course, when these values are changed significantly, the predictions have to be modified. For this reason, the development and verification of an acceptable model for the effects of mutual coupling on the phased-array antenna based on the "near field" theory is extremely im- portant and essential in the near future.
K1 = K2 = 20 decibels. Explic-
A maximum-length linear-feedback shift-register se- quence (i.e., m sequences generated by a 12-stage shift register with a period equal to 4095) is recommended as the spread-spectrum code. In the code-division multiple-access situation, the theoretical optimal solution is to use the set of 64 bent-function sequences of period 4095, enabling as many as 4095 simultaneous satellite operations of the SPS network. The bent se- quences are guaranteed to be balanced, have long linear span, and are easy to initialize. However, depending on the code partial correlation requirement and the number of satellites in the network, the set of maximum-length se- quences of period 4095, although suboptimal, may suffice.
Currently, results indicate that it is feasible to hold the antenna array phase error to less than 1' per power module for the
79

type of disturbances modeled. However, some irreducible error sources are not considered herein and their effects remain to be seen. erence phase distribution errors and differential delays in the rf path.
They include ref-
c. End-to-End System Performance Evaluation
Because of the complicated nature of the problem of evalu- ating performance of the SPS phase control system and because of the multi- plicity and interaction of the parameters as they relate to subsystem inter- faces, the methods of analysis and computer simulation (analytical simulation) have been combined to yield a performance evaluation of the SPS system. The result is "SOLARSIM," a computer simulation program package developed by LinCom Corporation that enables a parametric evaluation of critical perform- ance issues. 111-9. The SOLARSIM program and its various subroutines have been exercised in great detail to provide system engineering trade-offs and design data for the reference system. For example, a typical power pattern is depicted in figure 111-25. The following discussion is focused on the key results obtained thus far.
The current capabilities of SOLARSIM are highlighted in table
(1) Definition of power-transfer efficiency - Power- transfer efficiency is defined as power received by the 10-kilometer-diameter rectenna divided by total power radiated by the spacetenna. clarified in figure 111-26. The power-transfer efficiency can be redefined as power output at terminals A and B divided by power output at terminals C and D. This definition is convenient because the multiplying constants due to the propagation through the medium cancel out from the numerator and denom- inator. The total radiated power term (denominator) needs special attention since the average power pattern includes an "isotropic" term which is compu- tationally difficult to account for if the individual (transponder) radiation phasors are not perfectly alined in phase as a result of system jitters and imperfections. The current analytical approach alleviates this problem and is superior to the widely used Monte Carlo technique in this respect.
The idea is
(2) transfer efficiency - into two main classes
Effects of system jitters and imperfections on power-
(a) jitters due to spacetenna electrical components (which include such effects as the amplitude jitter of the feed currents to the radiating elements of the spacetenna and the phase jitters of the feed currents originated from the phase control system) and (b) jitters due to the mechanical imperfections of the spacetenna (which include subarray tilt (me- chanical pointing error), tilt jitters, and location jitters). The location jitters include the transmitting and receiving elements and arise from the displacement of the radiating elements. chanical imperfections is illustrated in figure 111-27.
The system jitters and imperfections can be grouped :
The basis for modeling these me-
( 3 ) Effects of system imperfections on SPS efficiency - The effects of the various system imperfections on the SPS power-transfer ef- ficiency obtained through SOLARSIM are summarized in figures 111-28 to III- 3 0 . In figure 111-28, the power-transfer efficiency is plotted against the total phase error produced by the SPS phase control system. For a mechan- ically perfect system with no location jitters and no mechanical pointing
80

TABLE 111-9.- SOLARSIM SUBROUTINE PACKAGE CAPABILITIES
Subroutine name Purpose
Pointing error
VARSUM
Power pattern
Power- trans fer efficiency
S IDR
Evaluation of the effect of phase error introduced by the phase distribution tree on pointing error
Evaluation of the effects of subarray tilts, location jitters, and phase distribution sys- tem error on spacetenna gain
Evaluation of the power pattern as a function of subarray tilts, current-amplitude jitter, phase jitters, and location jitters
Evaluation of power-transfer efficiency or power pattern as a function of subarray tilts, current-amplitude jitter, phase jitters, and location jitters
Evaluation of the reconstructed pilot phase error (rms) as a function of pilot signal design parameters, link budget, rf/notch filter characteristics, and Costas loop band- width
81

10
0
-10
-2 0
-30
-40
-50
-6 0
-70
I I
I I I I I I I I I
I
/--Rectenna edge I
0 .4 .8 1.2 1.6 2 .o 2.4
Jit ter on mechanical pointing, min
Figure 111-25.- Power p a t t e r n f o r 5 O rms equivalent r f phase e r r o r i n each l e v e l of the four- level phase d i s t r i b u t i o n tree.
82

SPS spaceten
Figure 111-26.- Geometry of the power pa t te rn .
Toward rec tenna
Actual location o f a radiating element
Section of actual subarray surface
Location j i t t e r of radi a t i ng el emen t
x
Actual location o f a radiating element
ierage plane through the subar ray
+ Y
Section of actual subarray surface
Original o f the radiatiny location L; I Location .jitter
Figure 111-27 .- Location j i t ters of r a d i a t i n g and receiving elements.
83
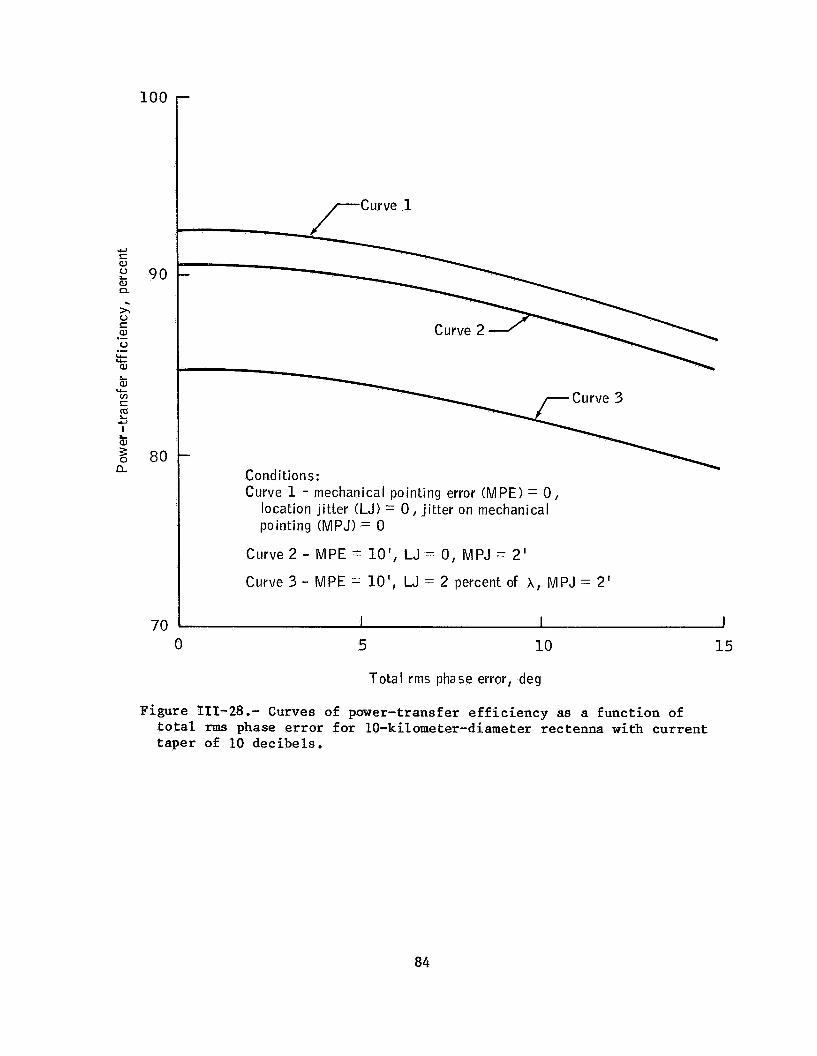
100
U S a,
a, Q
> 0 S W 0
W
2 90
. .- .- k
ij q_ v) S m L U
I
tj $ 80 a
70
rCurve J
Conditions : Curve 1 - mechanical pointing error (MPE) = 0,
location j i t ter (LJ) = 0 , j i t ter on mechanical pointing (MPJ) = 0
Curve 2 - MPE = l o ' , LJ = 0, MPJ = 2 '
Curve 3 - MPE = l o ' , LJ = 2 percent of A , MPJ = 2 '
0 5 10 15
Total rms phase error, deg
Figure 111-28.- Curves of power-transfer efficiency as a function of total m s phase error for 10-kilometer-diameter rectenna with current taper of 10 decibels.
84

95
92.5
90
85
Current taper = 10 dB MPE = 0 MPJ = 0 LJ = 0
Total rms
I I I I 1 2 4 6 8 10
Amplitude jitter, percent
Figure 111-29.- Effect of amplitude jitter on SPS power-transfer efficiency (10-kilometer-diameter rectenna).
85

100
90
U S a,
; Q - 5 80 S aJ u
a,
.- .- La- u-
5 E 70 2
u-
4
+J
iz a 60
50 0
Location jitter on receiving elements only
\ Location jitter on \ transmitting elements only
Current taper = 10 d B MPE = 0 MPJ= 0 Phase jitter = 0
I I I I i I 1 2 3
Location jitter, percent of A
4 5 6
Figure 111-30.- Effect of location jitters on the otherwise perfect SPS (10-kilometer-diameter rectenna).
86

errors or jitters (curve 11, the total nus phase error is restricted to less than 10' at rf to yield greater than 90 percent efficiency. Curve 2 depicts the influence of the mechanical pointing error (assumed to be 10' with a jit- ter of 2') when the location jitters are absent. ure, for a total phase error of lo', the power-transfer efficiency of the spacetenna decreases to 87.3 percent. When the location jitter of 2 percent of A, where A = 360°, is added for the transmitting and receiving elements, the power-transfer efficiency decreases to 82.0 percent. (See curve 3.) In order to achieve the efficiency required for economical operation (while main- taining hardware within reasonable state-of-the-art technology), it is ex- pected that the SPS system will operate in the region between curves 1 and 2. In this case, the power-transfer efficiency will be less than 90 percent for a typical rms phase error of 10'.
As can be seen from the fig-
The effect of the current-amplitude jitter is shown in figure 111-29 for a mechanically perfect system. ure, for an amplitude jitter of 5 percent, the power-transfer efficiency of the mechanically perfect spacetenna with the current-phase jitter of 0' is 92.3 percent. This value drops to 91.63 percent for the total phase error of 5' and to 89.57 percent for a total phase error of 10'. the power-transfer efficiency is relatively insensitive to amplitude jitters.
As can be seen from the fig-
One can conclude that
The effects of location jitters on the power-transfer efficiency of an otherwise perfect SPS are illustrated in figure 111-30. As can be seen from the figure, the degradation of efficiency is severe; for a location jitter on each radiating element of 2 percent of transfer efficiency drops to 88.3 percent. As a comparison, curve 1 in fig- ure 111-28 reveals that for an rms phase error of 7' (2 percent of the efficiency decreases to 91.2 percent. Thus, the effect produced by loca- tion jitters on the receiving (conjugating) elements is comparable to the effect produced by the phase error because both these effects enter into the transmission system at the same physical point; i.e., the center of the sub- array. On the other hand, power-transfer efficiency is rather sensitive to the location jitter on the radiating elements.
A, the power-
X = 7.2'1,
3. ALTERNATE PHASE CONTROL CONCEPTS
As noted, several alternate concepts have been briefly eval- uated. Two approaches for ground-based phase control systems are still under active investigation. These systems are the Novar interferometer-based phase control technique and the LinCom coherent multiple-tone (CMT) technique. Each of these approaches is briefly reviewed in this section. Detailed information concerning the system characteristics and expected performance can be found in references 7 and 8.
a. Interferometer-Based Phase Control System
Novar Electronics Corporation has evaluated an interferom- eter-based phase control system (ref. 8). interferometric phase control (IPC), has three significant characteristics that differentiate it from the reference system retrodirective approach.
This approach, which is called
87

Interferometric phase control is a ground-based closed-loop system - Unlike the retrodirective approach, the phase correction information is ob- tained on Earth by measuring the transmission of the spacetenna power modules and comparing them against a reference.
The spacetenna's power modules are calibrated sequen- tially - A signal from a reference transmitter near the center of the spacetenna is phase compared with a sequential calibration transmission from each of the power modules.
During normal power transmission, the frequency of each power module is shifted slightly for phase Cali- bration - Maintenance of a properly focused and pointed power beam can be accomplished concurrently with the normal transmission of power from the SPS by using frequencies for calibration that are differ- ent from the power beam frequency. the system and its operating features follows.
A description of
On or near the rectenna site, a phase-measurement antenna receives the transmission from the spacetenna reference transmitter and the particular power module being phase tuned (calibrated). Analysis of these signals provides sufficient information to generate a phase error correction term, which is transmitted to the onboard phase control circuitry (shown in fig. 111-31) of the power module undergoing calibration.
Simultaneously with the transmission of the power beam, co- herent signals at three different frequencies are transmitted from the space- tenna. Two of these signals are transmitted from the reference transmitter, which is located near the center of the spacetenna, and one is transmitted from the power module being phase tuned, as shown in figure 111-32. The two signals transmitted from the reference transmitter are s1 and sr., and the signal transmitted by the power module being phase tuned is 52. The frequency of s1 is midway between that of sr1 and s2 so that the beat frequency of si and 52 is the same as that of si and Srl.
At the rectenna, simple mixing and filtering circuitry de- tects two different frequency signals. One signal is due to si and 52. The other, which is a phase reference signal, is due to s1 and sr1. These two beat-frequency signals are then phase compared to determine the phase difference that results from z-axis deformations (deformations in a direction toward or away from the rectenna) in the power module being phase tuned plus biases in the SPS phase feed network. Certain components of the phase differ- ence change with a change in frequency; others do not. Since the power mod- ule being phase tuned is transmitting at a frequency different from the power beam frequency, it is necessary to distinguish between these frequency- dependent and frequency-independent components to determine the phase adjust- ment that will be correct at the power beam frequency. This distinction is made by shifting sr1 and 52 to a different set of frequencies, according
88
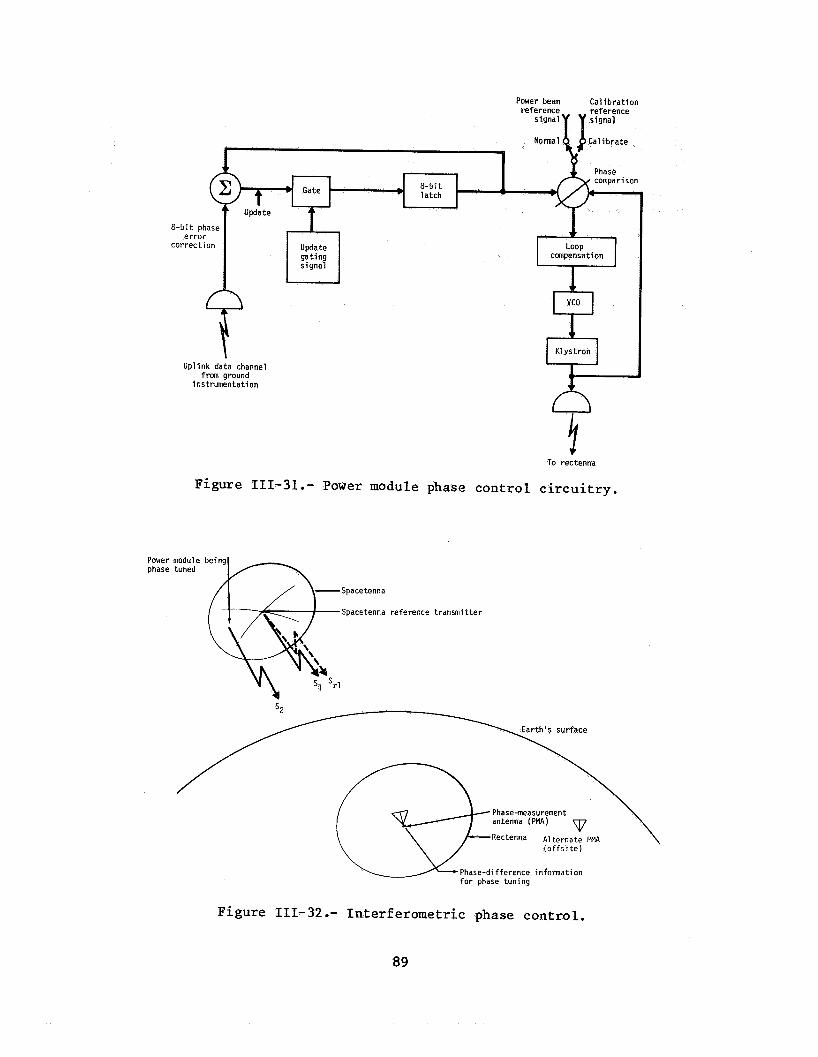
Power beam C a l i b r a t i o n reference reference
Power phase
Upl ink data channel from ground
instrumentation
'I To rectenna
Figure 111-31 .- Power module phase con t ro l c i r c u i t r y .
module tuned
A s p a c e t e n n a reference transmitter
52
Phase-measurement antenna (PMA) m Rectenna A1 ternate PMA \
( o f f s r t e ) \/- \
Phase-di fference infonnation for phase tuning
Figure 111-32 .- In te r fe rometr ic phase cont ro l .
89

to a phase-ambiguity error-avoidance criterion, and making a second phase- difference measurement. cally adjusted by -2n, 0, or +2n according to a second phase-ambiguity error-avoidance criterion. provide sufficient information to calculate the phase error correction trans- mitted back to the SPS power module being phase tuned. This phase error cor- rection can be made with an 8-bit binary word sent to the SPS by wa channel. An 8-bit accuracy produces a phase resolution of 360' 5 25 = 1.4O, which is sufficient to give a power-beam-pointing resolution better than 140 meters at the rectenna.
These two phase-difference measurements are numeri-
These two numerically adjusted phase differences
of a data
A trade-off exists between satellite bandwidth requirements and the power module updating rate, which is limited by filter settling times. It is anticipated that the frequency separation among SI, s2 , srl, and the power beam will be on the order of 1 megahertz. At these frequency separations, the update interval for an entire spacetenna could be on the order of a few seconds, which may be fast enough to correct for any changes that will occur at the spacetenna because of deformations, thermal effects, etc.
With the ground-based closed-loop interferometer phase con- trol approach, ionospheric effects are limited to phase errors introduced into the space-to-Earth transmission path only. Although the phase-measurement an- tenna is shown to be at the center of the rectenna, it is not necessary that it be located there or even within the rectenna site. Offsite measurement has the advantage that the signals being phase tuned do not have to pass through an ionosphere that may be subjected to undetermined heating effects by the power beam.
An important advantage of interferometric phase control is its inherent capability to make use of statistical error reduction techniques to minimize any ionospheric effects. This capability includes time averaging and/or spatial averaging using several onsite and offsite phase-measurement antennas.
Although interferometric phase control was originally de- veloped as a closed-loop, ground control approach for focusing and steering the power beam because of Novar's concern over possible ionospheric effects on the retrodirective pilot beam, it could provide a useful adjunct to the retrodirective system in mitigating phase biasing problems and in providing a backup system for use if atmospheric/ionospheric conditions preclude use of a retrodirective system. atmospheric/ionospheric effects on the retrodirective system, the simultane- ous development of power beam control techniques using both the retrodirective approach and interferometric phase control should be pursued.
Pending completion of definitive studies of
b. Coherent Multiple-Tone Ground-Based Phase Control System
The CMT ground-based phase control concept has been under study at LinCom as an alternative approach to the reference SPS phase control system. documented in reference 7.
The details of the ground-based phase control system study are
90

The ground-based phase control system achieves beam form- ing by adjusting the phases of the individual transmitters onboard the SPS. The phase adjustments are controlled by ground commands. rect adjustment, the phases of the power beams from each individual trans- mitter arriving at the rectenna center must be measured and the appropriate corrections must be determined (to ensure that all power beams arrive at the same phase) and relayed to the SPS. The proposed scheme to be considered is sequential; i.e., the phase measurement is performed one at a time for each individual transmitter at approximately l-second intervals. (Measurement time allocated is 10 microseconds for each transmitter.) The phase correc- tions are updated once every second. A 10-bit phase quantization for the corrections giving 0.35' resolution is envisioned. The uplink command data rate is on the order of 10 megabits/sec. The functional operation of the ground-based phase control concept is summarized in figure 111-33. A s evi- dent from the figure, the key issues that need to be addressed are
To specify the cor-
(1) Measurement waveform design and selection
(2) Phase-measurement pilot reference design and selection
(3) Uplink-phase-correction command link format and design
(4) System synchronization techniques
In the basic two-tone measurement scheme, two side tones at fo k A f are transmitted from the satellite to the ground receiver. A phantom carrier can be reconstructed from the side tones by passing the signal through a squaring circuit. The output will then have a CW component with frequency 2f0 and a phase component equal to ($1 + $21, where $1 and $2 are the channel-induced phase shifts at fo + Af and fo - Af, respectively. This phase shift is very close to double the one that would have occurred if the downlink signal were a single sinusoid at frequency fo. If the 2f0 compo- nent is divided by 2, the average phase ($1 + $2)/2 is obtained. Unfortu- nately, the divide-by-2 circuit results in a 0'-180° phase ambiguity.
A four-tone measurement scheme, which is a simple modifica- tion of the two-tone scheme, has been developed. Basically, frequencies at fo k 2Af are used for phase error measurement, which introduces ambiguity. Then, frequencies at fo.k Af are used for ambiguity resolution. A detailed discussion of the ambiguity-resolving process is given in reference 7.
The implementation of the ground-based phase control con- Based on cept is determined by the phase control waveform design employed.
the four-tone waveform selection, functional subsystems to implement the ground-based phase control concept have been identified and are shown in block diagram form in figure 111-34.
The ground-based system envisioned employs satellite-based frequency/timing reference with an i.f. of 490 megahertz. A four-tone meas- urement scheme using frequencies at 2450 f 9.57 and 2450 k 19.14 megahertz is
91

Comunicati on
Interface bus
Phase o f i - t h
Figure III-33.- Ground-based phase control system concept with major functional blocks.
92

Spacetenna ~
Master
490-Wtlz r e f e rence
4
g waveformlfrequency r e f erencelda t a
D i s t r i b u t i o n
p i l o t
c"
Figure III-34.- SPS ground-based phase control functional block diagram showing system timing hierarchy.
93

selected. Each power module devotes 10 microseconds to phase correction meas- urement, representing a minimal loss in total power transmitted. Two fre- quencies are chosen for the downlink and one frequency for the uplink; the downlink pilot signal center frequency is set at 4.9 gigahertz.
Preliminary investigation indicates that the effects of power beam interference and thermal noise on the phase-measurement error can be controlled to a tolerable level. tion if the ionosphere is nonturbulent and the satellite's tilt rate is lim- ited to 0.5'/sec.
The ground-based system can also func-
The feasibility of the ground-based phase control concept becomes unclear if the conditions for the ionosphere and the satellite motion are not met. The ground-based system can only correct for random phase fluc- tuations having a correlation time that is large compared with 1.25 seconds. The noise components that are faster than 1.25 seconds are uncorrected and result in degradation of transmission efficiency. Unfortunately, measured ionospheric data suitable for the SPS system are not readily available. data are concerned with spatial correlations rather than temporal correla- tions. Also, most data are measured from low-orbit satellites rather than geostationary satellites which significantly alters the geometric effects.) The other limiting factor is the statistical behavior of the random pointing error exhibited by the spacetenna. Again, the fast component of this error is not corrected and contributes to efficiency degradation. Currently, the development and specification of models for ionospheric phase disturbance and satellite motion is considered to be essential.
(Most
4 . IONOSPHERIC/ATMOSPHERIC CONSIDERATIONS
As noted in the discussions of the two ground-based phase con- trol system concepts, a major concern is the potential effect of the iono- sphere on microwave signal phases. No ionospheric model is available to quantitatively predict the phase errors resulting from ionospheric disturb- ances. When the SPS heats the ionosphere, an additional unknown factor is encountered. Early efforts have been made to determine the effects on the ionosphere of SPS heating; however, data taken did not allow modeling of the ionosphere's spatial and temporal phase perturbation functions. The first in a series of experiments recommended by JSC to obtain the needed data for ionospheric modeling was conducted in April 1980, and a preliminary model was developed for initial SPS phase control system performance assessments. Future experiments are also planned to enable updating and refinement of the ionospheric model developed. Some early consideration has been given to the possible effects of an unstable ionosphere on the baseline retrodirective control system. On the assumption that these effects are intolerable, a potential method for mitigation of these effects has been proposed by Rock- well International (refs. 30 and 31) and is discussed in this section.
a. Ionospheric Effects on Single-Tone Pilot Beam
An important feature of the retrodirective array is that the downcoming beam is phase coherent when it arrives at the ground pilot source. This statement is rigorously correct only if the propagation medium

is nondispersive, spatially homogeneous, and temporally stable. In the iono- spheric case, one or more of the preceding conditions are violated. Under certain conditions, beam-pointing error can occur and phase coherence at the source can be lost.
Consider the situation shown in figure 111-35. Assume the uplink and downlink frequencies are given by f, and fD, respectively (f, # fD>. The phase shift (path dependent) at f, on one particular radio link can be written as
jL N d R 2nfuL
@(fu) = - - - C 2nfuC 0 ( 7 )
where tron mass, c0 = free-space permittivity, L is the physical path length in- volved, C is the speed of light in a vacuum, and the integral term is the integrated electron density along the path under consideration Note that the second quantity on the right-hand side of equation ( 7 ) accounts for ionospheric effects on a CW tone. On using appropriate constants, one can write
b = e2/(2~om) = 1 . 6 x lo3 C2/(F/m-kg), e = electron charge, m = elec-
to 1019).
where K, represents ionospheric effects on the uplink signal. Since one is interested in knowing the phase shift at phase can be obtained by multiplying @(fu) by fD/fu. (This estimate be- comes increasingly accurate as f, + fg.) Thus,
fD, a reasonable estimate of the
95
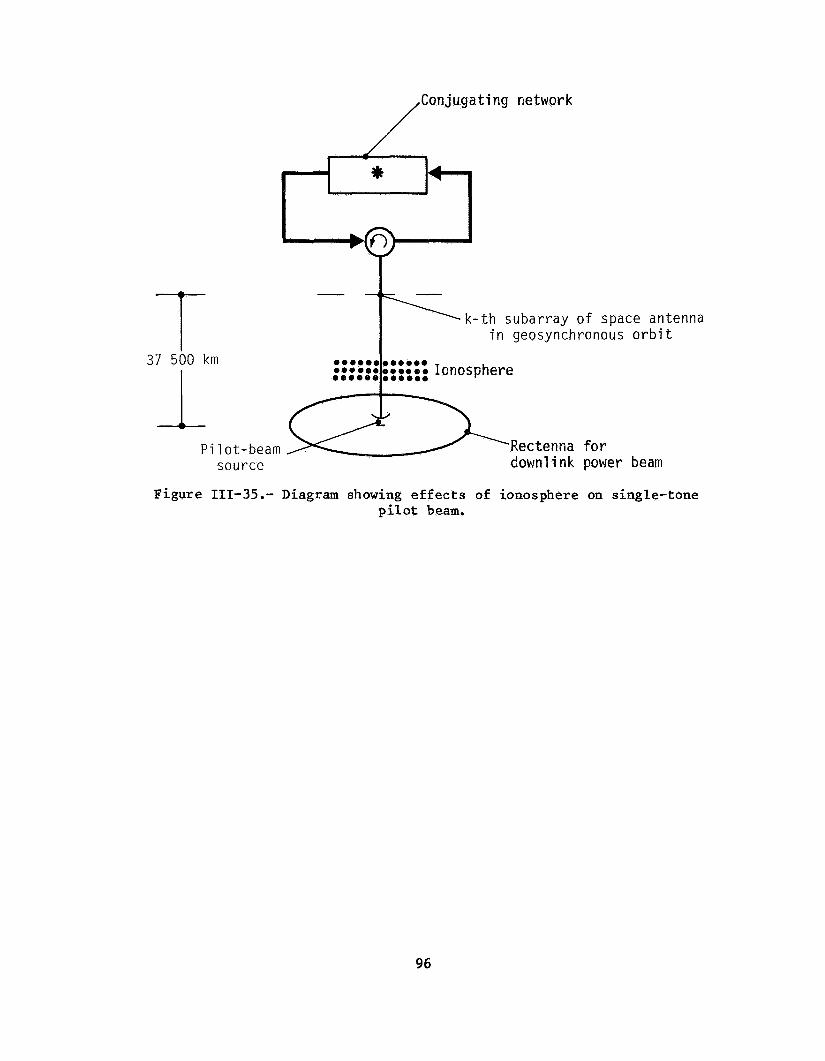
k - t h subarray o f space antenna i n geosynchronous o r b i t
37 ?- 500 km
1 P i 1 ot-beam Rectentia for
source downlink power beam
Figure III-35.- Diagram showing e f f e c t s of ionosphere on single-tone p i l o t beam.
96

On conjugating this phase, one obtains
The downlink signal at the transmitting end can be written as
where t is time and w is angular frequency. The downlink signal at the receiving end is given by
stOW13 (t) = cos [... - (& $ - :)I For a temporally stable ionosphere and ignoring second-order effects, one can set Ku = KD in equation (12) and obtain
stown (t) = COS [... - Ku (3 - ~ ) ] If, in addition, the propagation medium is assumed to be nondispersive, then the second term on the right-hand side of equation ( 1 3 ) involving could be equated to zero. In the current situation, this kind of assumption is highly unrealistic. Note that in equation (131 , Ku applies to a particular radio path and will, in general, be different on different paths because of ionospheric inhomogeneity. A consequence of this fact is that the phase co- herence (at source) property of the downlink signal mentioned earlier is no longer valid. Furthermore, if a coherent phase perturbation occurs because of some ionospheric large-scale feature (such as a wedge), then even a beam- pointing error is possible. evaluated for worst case ionospheric conditions.
The magnitude of these effects needs to be
b. Three-Tone Pilot-Beam System for Mitigating Ionospheric Effects
In the following discussion, a three-tone approach is used to resolve the ambiguity problem commonly associated with the two-tone aver- aging schemes. It is based on a direct measurement of N dR along the paths
97

of interest and subsequent use of this information to estimate the path- related phase shift at the downlink frequency fD.
Consider a frequency-amplitude pattern as shown in figure
Indeed, the three tones can be generated by a low-deviation phase- 111-36, where the three uplink tones fly f2, and f3 are coherent at ground. modulated transmitter. For three frequencies fl, f2, and f3, one can write
64A = 42 - 41
21T = c (f2 - f l ) L - 40.5 x JN dQ, x
and
= c 2?r (fl - f3) L - 40.5 x I N dk x ( k - &)
The second difference of phase shift is given by
624 = & A - SOB
= 2 x 40.5 x IN dQ, x - - - - - C (:1 f3 f2
For suitably chosen Af, one obtains
x 40.5 x IN dR x - 2 Af2 f13 C 624 = -
(14)
( 1 5 )
(16)
(17)
Suppose one needs to avoid a 360' ambiguity in 624 for values of N dk less than From equation (171, one easily finds
Af2 ̂ . -624 x fl3/[(28/C) x 40.5 x 2 x JN dk] (18)
98

Figure III-36.- Diagram of frequency-amplitude pattern.
99

Let
fl = 2.45 + 0.153 125
= 2.603 125 GHz (19)
Then
3 Af2 r: (21~1 x (2.6 x 109) x C/(~IT x 81 x 1019)
= 0.651 x 1OI6 (20)
or Af = 80.6 megahertz. Thus, with Af < 80.6 megahertz and assuming that 62$1 can be measured, then N dR can be calculated rather easily from equa- tion (17). An implementation that is capable of measuring 6241 with rela- tive ease is shown in figure 111-37. obtains
Reordering equation (171, one easily
N = computed value of IN dR
x (-624)) - f13 c - - x - x - 2 Af2 ~ I T 40.5
where (-624)) is measured. For fl = 2.603 gigahertz and Af = 80.0 mega- hertz, one can compute Based on signal-to-noise ratio considerations, the accuracy of the N computation in equation (21) is determined by the accuracy of
a = 1.6 x 10l8.
624) measurement and is given by
On the basis of limited available data and geometry con- siderations (the proximity of the ionosphere to the rectenna), it appears unlikely that any compensation for ionospheric effects would be necessary. However, to make a definite conclusion, more data on wedge structure are desirable. ionospheric heating effects due to the downlink power beam.
In addition, this problem needs examination in the light of
100
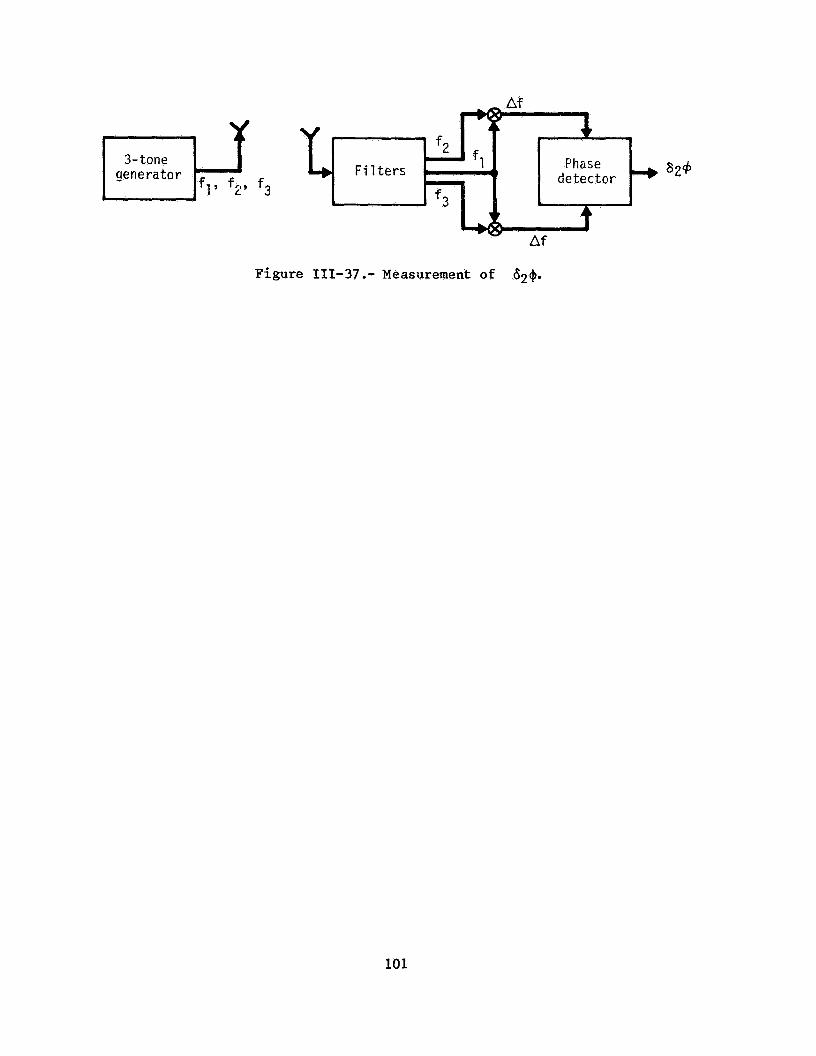
3- tone genera t o r Phase 4 I detector
LA1
Figure 111-37 .- Measurement of 6~+.
101

C. POWER AMPLIFIERS
1. INTRODUCTION
In-depth studies performed on vestigation of the amplitron (crossed-field (linear beam amplifier). The amplitron was
the microwave system include in- amplifier) and the klystron characterized by high efficiency
and low gain, whereas the klystron was characterized by high gain, low noise levels, and high efficiency. The amplitron study was accomplished before the joint DOE/NASA SPS Concept Development and Evaluation Program. were performed on amplitron compared to klystron tube parameters as well as on integration into the microwave system. The study resulted in the conclu- sion that either 5-kilowatt amplitrons in series or 50-kilowatt klystrons in parallel could be used. In the MSFC study, concluded in November 1976, the amplitron was selected for initial study because of the possible efficiency and lifetime advantage.
Trade-offs
,In the JSC studies, concluded in August 1976, both the ampli- tron and the klystron were investigated. Traveling-wave tubes (TWT'S) and solid-state amplifiers were also investigated. It was concluded that both the amplitron and the klystron had the best potential for use on the SPS, with the edge being given to the klystron because of system implementation considerations. The major advantages of the klystron were (a) much higher tube power, which simplified initial assembly and installation operations and ameliorated maintainability requirements; (b) higher operating voltage, which reduced power distribution system weights; (c) much lower phase control drive power; and (d) lower rf noise characteristics.
In the Boeing studies, the klystron was chosen as the amplifier to investigate further, and an in-depth, comprehensive study of klystron con- figurations, integration into the microwave system, maintenance scenarios, manufacturability, cost, weight, etc., was performed. The results of the study demonstrated that a klystron can be integrated into an overall SPS and that it does have certain advantages.
a. Conclusions
(1) Power amplifier/microwave system trade-offs - Based on current assumptions of microwave system requirements and projected perform- ance of various microwave power amplifiers, the klystron offers a feasible approach for SPS microwave power generation, the amplitron appears to be less suitable, and investigation of the magnetron should be continued to better un- derstand its performance characteristics relative to SPS applications. Based on SPS microwave system applications, it is desirable to have maximum power output and gain consistent with other microwave system parameters.
(2 ) Klystron - The klystron power amplifier has the attrac- tive features of high gain (40 to 50 decibels), low drive power required from the phase control system, high power (50 to 70 kilowatts), low noise character- istics, and fewer tubes per antenna requiring phase control. Cathode lifetime and its maintenance implications are major coccerns for the SPS. Efficiencies of 75 percent at S-band and a power output of 50 kilowatts have already been
102

recorded. ciencies. A heat-pipe cooling system is required for heat rejection.
The application of depressed collectors has increased tube effi- It appears likely that an efficiency of 85 percent can be achieved.
( 3 ) Amplitron - Projected performance of amplitrons is less attractive for SPS applications because of low power (5 kilowatts), low gain (7 decibels), higher noise levels, higher drive power required from the phase control system, and more tubes per antenna requiring phase control. amplitron is less complex, and passive cooling techniques appear to be within the state of the art.
The
( 4 ) Magnetron - Because of recent projections in perform- ance characteristics (low noise, high efficiency, and moderate gain), mag- netrons warrant continued investigation. The magnetron is also less complex and hence the maintenance implications appear to make it more attractive.
b. Power Amplifier Remaining Issues
Power amplifier remaining issues are as follows.
High rf-dc conversion efficiency (>85 - percent)
Re 1 i ab il i ty
Amplifier RFI (noise, harmonics, filtering require- ments)
Other operating parameters (temperature, gain)
Proof of thermal cooling concept
Specific weight
High-volume manufacturing techniques
Precision manufacturing
Design for ease of maintenance
Design of power supply/power amplifier for stable ope rat ion
Depressed collectors (klystrons)
Investigation of circuit protection devices
Launch/transportation packaging considerations
Metals/materials research (magnets, cathodes)
103

2. KLYSTRONS
a. Reference Description
An rf transmitter configuration of 101 552 70-kilowatt CW klystron amplifiers operating at 42 kilovolts with 45 to 50 decibels gain using a compact, efficient (82 to 85 percent) solenoid wound-on-body design approach with conservative design parameters (0.15 A/cm2 cathode loading) to achieve long life is currently used in the reference system. Proposed multiple-tube development programs and assessment of high-voltage operation in space will provide the final answer to the transmitter selection. The layout of the basic klystron building-block module, including the various elements, is shown in figure 111-38. The six-cavity design, with a second- harmonic-bunching cavity for short length and high efficiency, features a dual-output waveguide with 35 kilowatts in each arm. The thermal control system used to cool the output gap, the depressed collector, and the solenoid consists of heat pipes with passive radiators and has design temperatures of 573 K (300O C),maximum on the body and 773 K (500' C) on the collector. The driver for the klystron power amplifier will require an output of about 3 watts CW for a 45-decibel output amplifier saturated gain. This power level is compatible with several off-the-shelf, reliable, low-noise amplifiers which can be driven directly from phase-regeneration circuitry. could be either a low-noise, high-gain TWT or a multistage transistor ampli- fier with as much as 10 decibels gain per stage. cuitry will be operated at power levels below 1 milliwatt. In arriving at the reference configuration, high-power klystrons and crossed-field ampli- fiers were considered to the same depth in the rf transmitter approach. This statement does not imply that the reference klystron design is the preferred solution, merely that such a transmitter can be integrated into the overall antenna array design and that it does have certain desirable features. The ultimate choice will have to be made on the basis of demonstrated performance assessment of both types of devices, particularly in terms of life, efficiency, spurious radiation, ease of integration and replacement, and specific weight.
The driver
The phase-regeneration cir-
The reference design approach for the klystron had as its objective high efficiency (85 percent) at a reasonable voltage (>40 kilo- volts); discussions with various tube manufacturers have led to a design with the parameters given in table 111-10. These parameters do not result in a klystron with the lowest specific weight and cost but provide a baseline on which to establish a reference design.
(1) Element mass - The klystron mass per tube is estimated to be 0.8 kg/kW at 70 kilowatts, decreasing to less than 0.4 kg/kW at 500 kil- owatts CW (ref. 32).
(2) Element cost - The mature industry mass production cost per 70-kilowatt CW klystron has been estimated at $2800 (ref. 32) (depending on mass production rate).
104
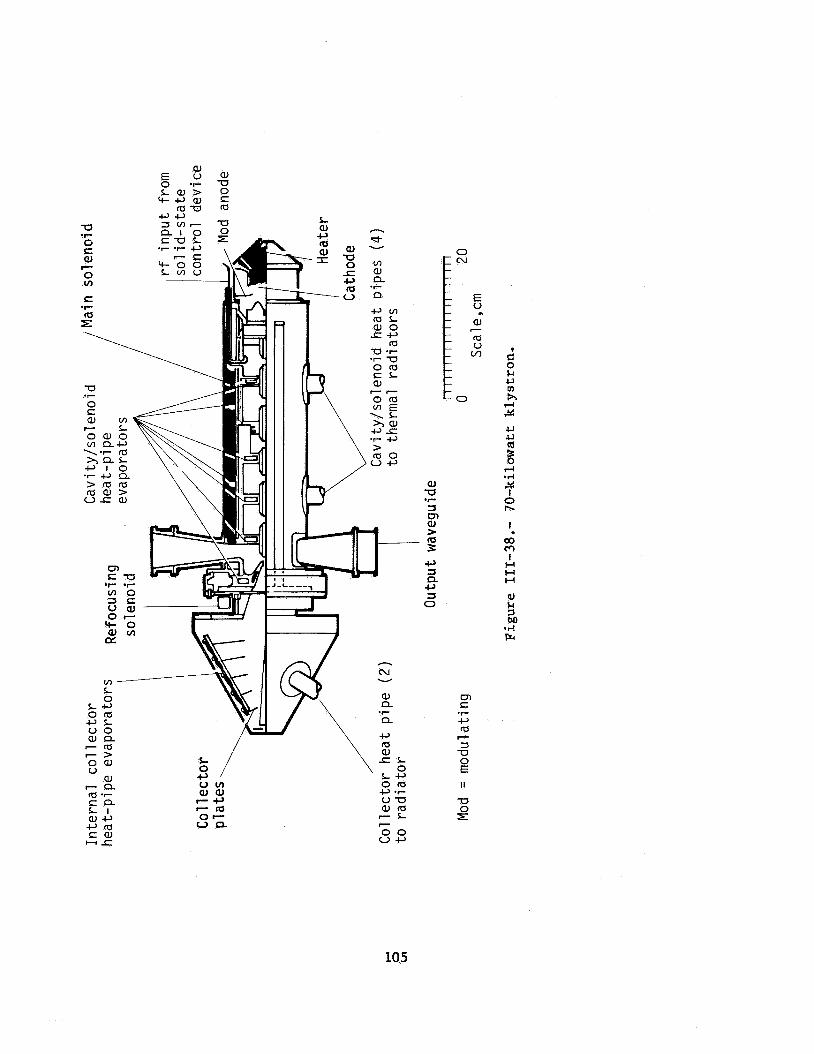
105
0 c\1
E W
aJ (d 0 . ' " e
0 k u v)
h T-l
c
0
~m Y
c, S a c, 3 0
00 m I H H H
Q) k 3 bn .d ErC

TABLE 111-10.- REFERENCE 70.6-KILOWATTa KLYSTRON DESIGN CRITERIA
Component TY Pe Remarks
Col1 ec tor 5-segment depressed
rf design Single second- harmonic-bunching, 6 -cavity
Focusing
Thermal design
Solenoid (ref. PM/PPM~ (future
Heat pipe with pas- sive radiators
Auxi 1 i ary Modulating anode protection
Cathode Coated powder or metal-matrix me- dium convergence
Power 2-port output extraction
Based on experimental results on collector recovery of M I percent, obtained by using a small refocus- ing coil in collector section
Results in high basic efficiency in
to obtain a gain of a compact drift-tube configuration. Purpose: about 40 dB, resulting in solid- state driver feasibility and low- power phase-shift requirements (<lo w>
Purpose: to obtain high efficiency with low-risk approach. If in the process of SPS development, a high-power samarium-cobalt PM/ PPM design can be proven with good efficiency, it should be considered.
Purpose: to obtain the desired CW level with conservative heat dissipation ratings
Purpose: to provide rapid protec- tion shutoff capability at the individual tube level and thereby to eliminate the need for resis- tive load shifting
Purpose: to obtain a cathode emission of ~200 mA/cm2 for longer life (30 yr to emission wearout)
Results in rating of 35 kW CW per each waveguide output; capable of operating in vacuum with radiative cooling only at a temperature below 473 K (200° C)
aBased on a perveance of S = 0.25 x = Io/Vo3/2 as determined to maintain high efficiency at maximum potential of 42.1 kilovolts.
bPM/PPM = permanent magnet/periodic permanent magnet.
106

b. High-Efficiency Klystron Design Assessment
Considerable data have been accumulated on the feasibility of an 80- to 85-percent-efficient high-power klystron design from previous studies and discussions with General Electric Power Tube Department, Sche- nectady; Thomson-CSF Electron Tubes; and NASA Lewis Research Center. The most likely configuration to realize both high efficiency and high gain ( A 0 decibels) is a six-cavity design with one second-harmonic-bunching cavity fo- cused by an electromagnet as described by E. Lien of Varian Associates. refocusing section will probably be required for efficient depressed- collector operation. figure 111-38. The preliminary power output is dictated by the desire to keep the operating voltage low. The 70-kilowatt CW output level resulted from a maximum selected voltage of ~ 4 0 kilovolts. If this voltage limitation can be relaxed, even higher power options become of interest. The basic kly- stron efficiency will probably not exceed 70 to 75 percent without collector depression. Although impressive gains have been achieved in raising the basic efficiency from 54 to approximately 70 percent with a 10-stage de- pressed collector, the estimated efficiency gain resulting from 5-stage col- lector depression indicated in figure 111-39 at the 75-percent level is only about 8 percent, resulting in an overall efficiency of about 83 percent. These are best estimates only and will have to be verified by experiment, since the velocity distribution of the spent electron beam entering the col- lector is not precisely known. An alternate way to determine the efficiency estimate is to trace the energy flow through the klystron, as is done in table 111-11 on the basis of best design values obtained from Varian Asso- ciates. In this case, slightly different values of collector recovery po- tentials were used (40 percent for three-segment and 60 percent for five- segment collector) to assess the differential benefit between the designs.
A
An outline of the klystron configuration is given in
(1) Depressed-collector design - One of the uncertainties in the design is the velocity distribution of electrons in the output gap, - _ . particularly for a tube having high basic efficiency. lines short of experimental verification that will enable the selection of proper depressed voltages at each collecting electrode. Varian has reported that about 10 percent of the electrons develop twice the dc beam voltage in a 50-percent-efficient tube. It is estimated that this value will be reduced to perhaps 2 percent for an 80- to 85-percent-efficient tube. To obtain ini- tial specifications for the collector supply, an estimate was made of the possible voltage ratios required, as indicated in figure 111-40. The postu- lated collector currents associated with these ratios are also indicated, the criteria being a reasonable distribution based on extrapolated experi- ence and an energy balance resulting in the expected efficiencies. These ratios were used in establishing the supply requirements; the supplies them- selves need not be regulated since a 10-percent fluctuation in them is not expected to affect the operation of the klystron bunching region.
There are few guide-
(2) Voltage regulation - The klystron drift-tube interac- tion depends entirely on the modulation anode electron velocity, which is de- pendent on the cathode-to-anode voltage and the anode-to-body voltage; these voltages are in series with each other. The amount of current intercepted at
107
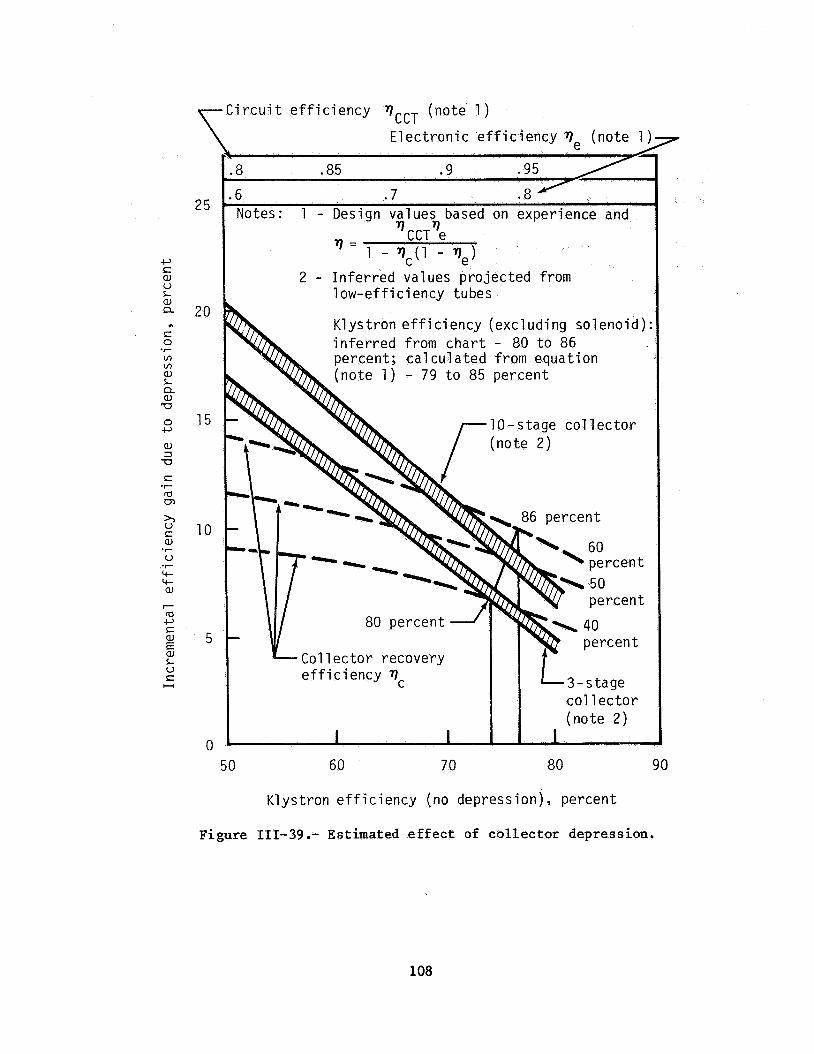
Circui t eff ic iency qccT (note 1 ) \ Electronic eff ic iency (note 1)7
j
25
c, S W V L W a 20 n
S 0
m v, W L Q W -0
c,
W 3 U
S
rn m
*C
0 15
*C
2 10 W
u IC IC a,
a c, S
E W L V S
*r
*C
7
W 5
H
0
8 .85 .9 .95
6 .7 .8 Notes: 1 - Desi d on experience and
2 - Inferred values projected from 1 ow-ef f i c i ency tubes
K1 ys t ron e f f i ciency (excl udi ng solenoid) : inferred from char t -
$' i:rcent t 3 - stage col 1 ec tor (note 2 )
Col 1 ec tor recovery eff ic iency 77,
I I I I 1 50 60 70 80 90
Klystron e f f ic iency (no depression), percent
Figure III-39.- Estimated e f f e c t of c o l l e c t o r depression.
108

TABLE 111-11.- ENERGY BALANCE IN REFERENCE FIVE-SEGMENT-COLLECTOR KLYSTRON DESIGN
Var iab 1 e Value
Beam power, kW . . . . . . . . . . . . . . . . . . . 92.62
rf loss in driver cavities, kW . . . . . . . . . . . 0.40
rf power output,a kW . . . . . . . . . . . . . . . . 70.67
Output cavity rf loss, kW . . . . . . . . . . . . . . 2.19
Output interception loss, kW . . . . . . . . . . . . 1.62
Power entering collector, kW . . . . . . . . . . . . 17.75
Collector recovery at 60 percent, kW . . . . . . . . 10.65
Thermal loss in collector, kW . . . . . . . . . . . . 7.1
Net beam power, kW . . . . . . . . . . . . . . . . . 81.97
Efficiency excluding solenoid, percent . . . . . . . 86.2
Net efficiency,c percent . . . . . . . . . . . . . . 84.6
aElectronic efficiency (0.79) times output circuit efficiency (0.97) times remaining power (92.22 kilowatts).
bBased on 4-percent interception at Vo13 (67 percent); i.e., 0.0178VoIo.
cIncludes 1.5 kilowatts for solenoid and heater power.
2vo/3 (33 percent) and
109

m S 0
w 3 a L c, v,
U
a, 0) fa c,
0 > U S fa
w S a, L L 3 V
U a, w fa E w m w
*r
-I-
*I-
?
.r
LD LD 0 Low h a', 01 . . . . . . L D / . I
ui 0)
L w o .I--
0 > I1
aJ x
U E a , -0'
0
.I4 rn a, a k 0 U V a, rl I4 0 V I a a, rn rn a, k a a, a 0 0 k U rn h rl 24 a, V
k a, lu a, vi
i!
'. 0 d
I H H H
a, k 5 M
*I4 Er
110

these electrodes is roughly 4 percent, which, at the full cathode-anode volt- age, corresponds to 4 percent of the beam power. The remaining beam current is collected in the collector and does not require regulation; it is adequate if it rises and falls with the beam voltage. The only requirement on the col- lector voltages is to avoid returning some of the electrons into the interac- tion regions; this requirement is aided by the presence of the refocusing coil. It is estimated that if the collector voltages are within +5 percent of their nominal values, efficiency will not be degraded.
Electron beam focusing design - The focusing options for the klystron indicated in figure 111-41 include (a) straightforward sole- noid electromagnetic (EM) focusing based on confined-flow experience, (b) multiple-pole EM focusing with periodic field reversals, introducing the possibility of permanent magnet (PM) implementation, (c) periodic permanent magnet (PPM) focusing used successfully in low- and medium-power tubes (mostly TWT's), and (d) combined PM/PPM focusing wherein the PM section at the output is used to retain good efficiency as well as best collimation in the high-power rf region. The low-risk EM solenoid approach was adopted to achieve highest efficiency, but research and development efforts in a com- bined PM/PPM approach should be investigated for possible later incorporation.
( 3 )
It is anticipated that the solenoid will consist of a copper sheet with glasslike insulation between layers, wound directly on the tube body. With factory-adjusted cavity tuning, there will be no protruding tuners. It is possible that the solenoid may be used for baking out the tube in space.
c. Life and Reliability Assessment
A stated ground rule for the SPS is an operational life of Major transmitter elements which contribute to length of life are 30 years.
sumarized as follows.
(1) Beam formation
(a) Cathode manufacturing material processing
(b) Emission suppression from surfaces
(c) Cathode base material purity-poisoning mechanism
(d) Evaporation rails from impregnated cathodes
(e) Heater warmup
(f) Burn-in period - avoidance of premature failure
(2 ) Beam focusing
(a) Solenoid design/materials - space bakeout feasi- bility and control
111
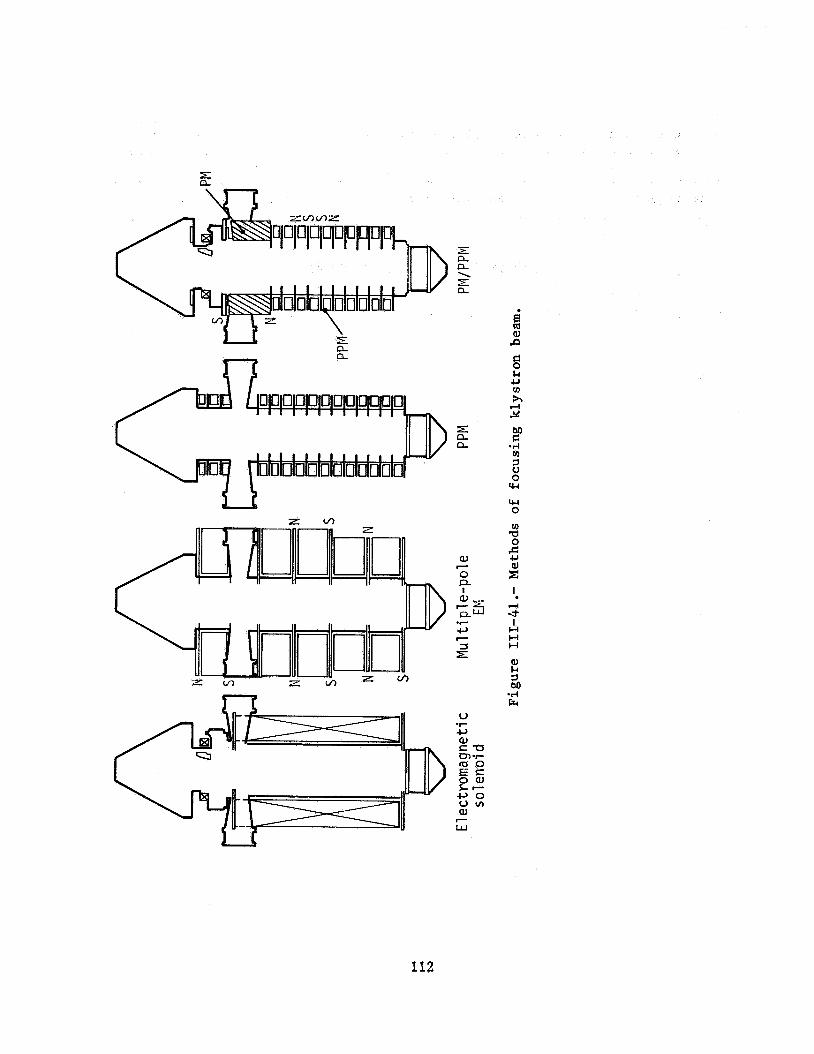
h
i a, P
W 0
fn a 0 - a,
a
aJ 5 0 c
112

(b) Magnetic c i r c u i t material s e l e c t i o n - samarium- cobal t (Sm-Co), Alnico, f l ux conductors
(3) r f c i r c u i t
( a ) Copper a l t e r n a t i v e s f o r c a v i t i e s
(b) Proper t ies of lossy i n t e r n a l ceramics
( c ) Output window power l i m i t s - beryll ium oxide, aluminum pentoxide
( 4 ) Body and c o l l e c t o r
( a ) Leakage of i n s u l a t o r s due t o high vol tages
(b) Suppression of secondary emission
( 5 ) External - lead and connector compat ib i l i ty
Leakage of i n s u l a t o r s due t o high vol tages and high cathode cur ren t p e r u n i t area a r e two of the more c r i t i c a l f a c t o r s a f f e c t i n g transmit- ter tube l i f e . Experience with opera t iona l k lys t rons lends c r e d i b i l i t y t o the projected 30-year l i f e . For example, the bes t 10 high-power k lys t rons in- s t a l l e d i n the b a l l i s t i c m i s s i l e e a r ly warning system have seen approxi- mately 10 years of s e rv i ce and a r e s t i l l opera t iona l . Current space-based TWT’s a r e being q u a l i f i e d f o r 7 years of l i f e , with proper burn-in proce- dures. More than 100 such tubes cu r ren t ly i n space have been opera t iona l f o r well over 3 years.
It i s an t i c ipa t ed t h a t with the re ference design tube, par- t i a l or f u l l bakeout i n space w i l l be f e a s i b l e and the need t o perform cos t ly burn-in on the ground can be avoided. Also, with mass production, automated manufacture, good q u a l i t y con t ro l , and maintenance, premature f a i l u r e can be minimized.
With roughly N = 100 000 tubes, i f a maximum of 2 percent of a l l k lys t rons are allowed t o f a i l a t scheduled SPS shutdown (every 6 months), the required tube mean t i m e between f a i l u r e s (MTBF) would be approximately
MTBF = ( 5 0 ) (0.5 year)
= 25 years
This value i s compatible with the re ference k lys t ron design; however, devel- opment of a more r e f ined r e l i a b i l i t y model, of which the exponential f a i l u r e
113

mode is but one case corresponding to a constant failure rate, is needed. With proper burn-in procedures, and as better understanding of failure modes is developed, the SPS klystron may require a much lower MTBF to meet the pre- ceding criteria.
d. High-Power Klystron Trade Studies
The following trade studies were made on the klystron.
(1) Specific weight comparison - To arrive at some re- liable estimates of specific weights, an investigation of various manufac- turer's catalogs was made, augmented by verbal discussions of projected advances, primarily for airborne transmitter applications. The projected advances rely primarily on advanced solenoid designs or usage of lightweight permanent magnets, neither of which has been reduced to practice in quanti- ty production. The total tube weights at 2.5 gigahertz as a function of CW power level are estimated in figure III-42(a); the advantage of CFA's at lower power levels is indicated. When the tube weights are replotted on a normal- ized basis (fig. 111-42(b)), the specific weights of klystrons and CFA's be- come roughly equal at power levels on the order of 200 kilowatts or above.
(2) Thermal and X-ray comparison - The klystron may have a slight thermal advantage over a CFA since it will not be limited by the bperating temperature of samarium-cobalt magnets (z520 K (S250' C)) and its collector may operate at much higher temperatures (773 to 973 K (500' to 700° C)). However, the X-ray level will be several orders of magnitude greater. In any case, the results were of sufficient interest to consider further a higher power klystron design, particularly from the tube MTBF point of view. There are no compelling reasons to expect a high-power tube to have a signif- icantly lower MTBF than a low-power tube. Thus, a significant advantage may accrue in the overall transmitter comparison.
3. MAGNETRONS
The source of all data on magnetrons discussed herein is William C. Brown, Raytheon Company, New Products Center, Waltham, Massa- chusetts. In 1975, R. M. Dickinson of JPL proposed that because of its high production volume and low cost, the microwave oven magnetron be incorpo- rated into a directional amplifier package and considered for SPS ground tests. These tests were planned to evaluate the phase control. While sub- sequently investigating this approach, two important discoveries were made: (a> the microwave oven magnetron, when operated with a ripple-free dc power source and with no externally applied filament power, has a much higher signal-to-noise ratio than the conventionally operated magnetron, and (b) under these conditions, the carburized thoriated-tungsten cathode can be operated at such low temperatures that a potential life of more than 50 years is indicated under the high-vacuum and highly controlled operating conditions in space.
The magnetron directional amplifier has been further evaluated under an NASA (MSFC) contract. This investigation involved an extension of
114
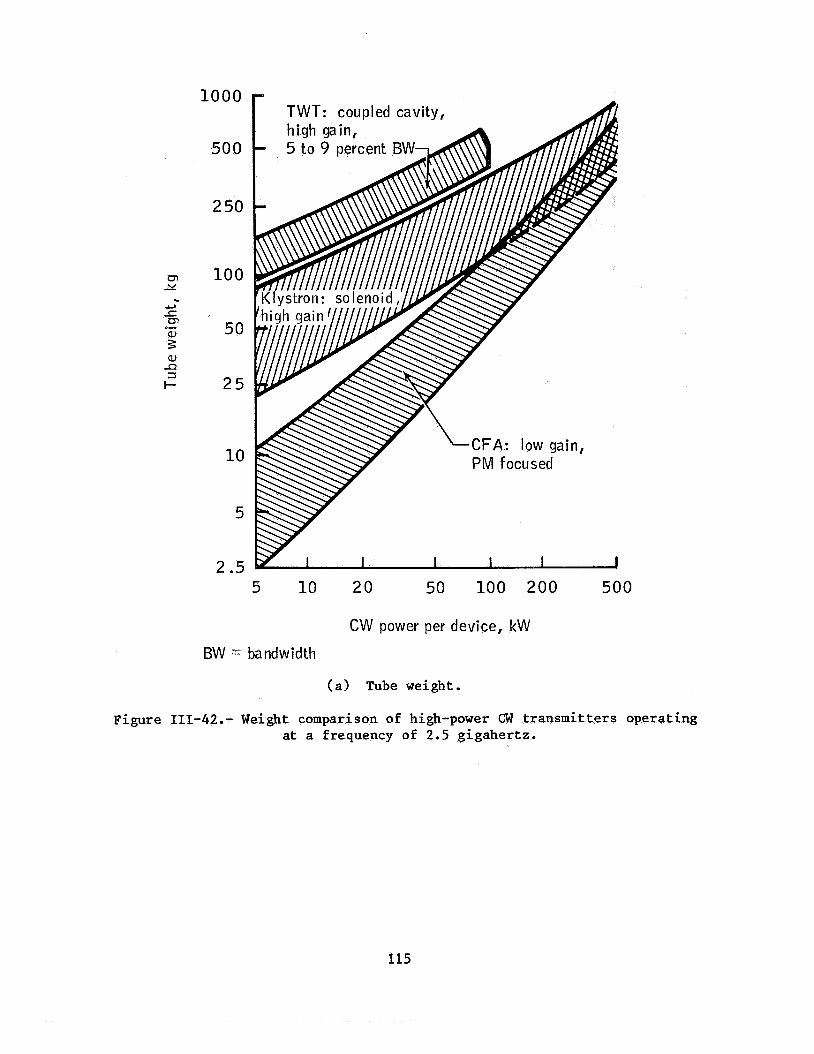
a, II 3 I-
1000
500
2 50
100
50
2 5
10
5
2.5
c
5 10 20 50 100 200 500
CW power per device, kW
BW = bandwidth
(a> Tube weight.
Figure 111-42.- Weight comparison of high-power CW transmitters operating at a frequency of 2 . 5 gigahertz.
115
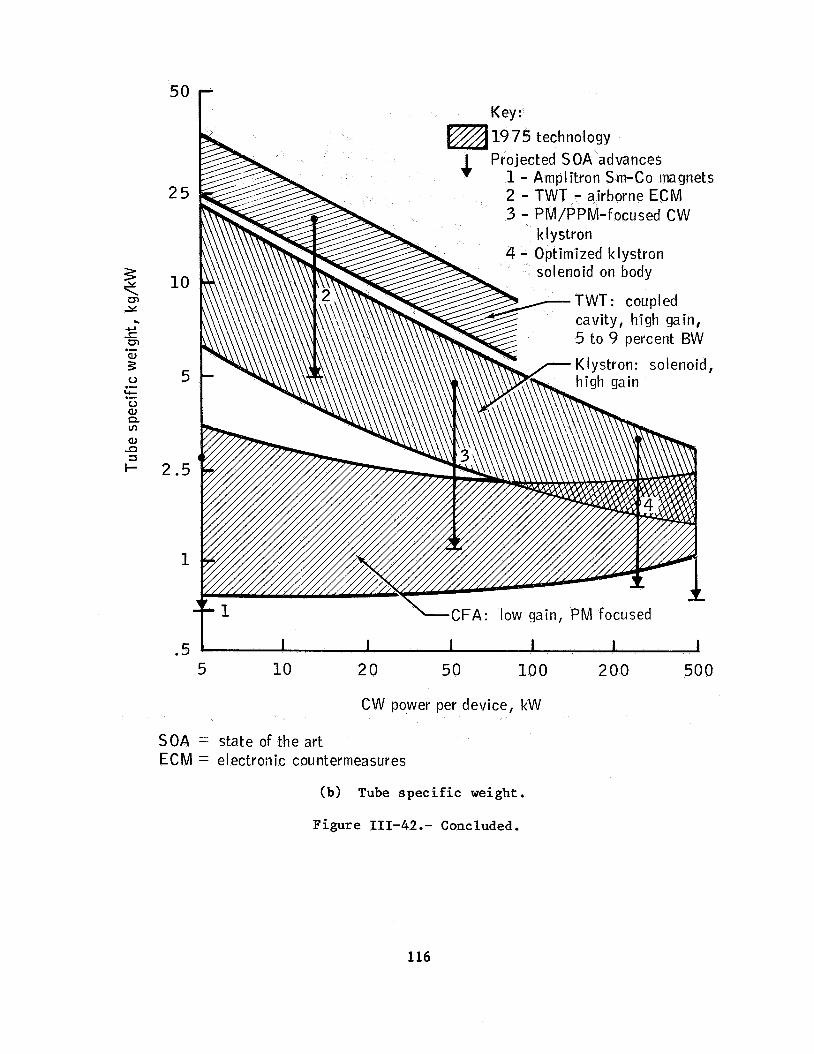
50 Key:
Projected SOA advances vA 19 75 technology
1 - Amplitron Sm-Co magnets 2 - TWT - airborne ECM 3 - PM/PPM-focused CW
5 to 9 percent BW
5 10 20 50 100 200 500
CW power per device, kW
= state of the art = e I ectr oil ic cou nt er mea sur es
(b) Tube spec i f i c weight.
Figure 111-42.- Concluded.
2 5
2 10 rn 24 . 2
3
*
rn a,
0
0 a, Q vf
.- 5 .-
a, 12 3 I- 2.5
1
.5
S OA ECM
116

the laboratory data base on the magnetron directional amplifier using the mi- crowave oven magnetron. These data, when ined with information obtained from other sources, will make it possible ccurately define the projected characteristics of a higher powered version of the magnetron directional am- plifier for SPS use and to define a program of technology development that would result in the development of such an amplifier.
a. Desirable Features of the Crossed-Field Microwave Generator
Desirable features of the crossed-field microwave generator are high efficiency, high signal-to-noise ratio, life of 50 years or more, fa- vorable ratio of mass to microwave power output, advantageous system power- conditioning requirements, and simplicity of construction.
(1) High efficiency - Overall efficiencies in excess of 85 percent have been demonstrated in an off-the-shelf magnetron used for industrial microwave heating. An efficiency in excess of 80 percent at power levels of 3 kilowatts (low enough to use passive cooling) has also been obtained.
( 2 ) High signal-to-noise ratio - In experiments conducted by Raytheon, measurements have been made of random noise levels in a 1- megahertz band which are down 0.100 decibel or more at frequencies above and below carrier frequency by more than 10 megahertz.
(3) Life of 50 years or more - Long life is made possible by operating at low emission-current densities and thereby at low tempera- tures. At these low temperatures, carburized thoriated-tungsten cathodes have been operated for extremely long periods (ref. 25).
(4) Ratio of mass to microwave power output - The current mass-to-power ratio estimate by Raytheon is 0.4 kilogram per kilowatt of mi- crowave power at the tube output. This ratio includes the weight of the pas- sive radiator but excludes the buck-boost coils, which are considered a power-conditioning function.
(5 ) System power-conditioning requirements - The buck- boost coils necessary for output amplitude control of the magnetron can take on the added function of adjusting the input of the microwave system to oper- ate at the optimum output voltage for the solar array.
( 6 ) Simplicity of construction - Construction of the crossed-field device, particularly in its magnetron form, is very simple. More than two million magnetrons that closely resemble the tube required for the SPS are manufactured annually for microwave ovens. This simplicity of construction and experience in mass production should lead to l o w cost. (See fig. 111-43.)
117

( a ) h p l i t r o n .
(b) Magnetron.
Figure III-43.- Diagram i l l u s t r a t i n g the bas ic d i f f e rences of cons t ruc t ion and operat ion between the amplitron and the magnetron.
118

b. Integration Into the Antenna Subarray
The problems.
concept shown in figure 111-44 involves the following
The microwave generators must dispose of their heat di- rectly to space by operating at temperatures in the 473- to 5734 (200' to 300' C) range. solved by designing the generators to radiate heat in only one direction.
Phase and amplitude sensors, phase and amplitude references, and electronic components associated with the control loops for phase and amplitude control must be incorporated. In the subarray concept, the phase and amplitude references are fed from the backbone of the subarray through flat ducts welded to the surface of the slotted-waveguide arrays.
This problem is
Interface with the microwave drive source - In figure 111-44, the microwave drive source is not shown, but it is derived from another magnetron directional ampli- fier identical to the ones directly attached to the waveguide radiators. 1 magnetron directional amplifier can drive between 50 and 100 other magnetron directional amplifiers. The microwave drive for any one subsection is delivered to the intended tube through a waveguide, which runs the length of the subsection and serves all the tubes. The energy may be tapped by a number of different techniques including directional couplers and the standing-wave techniques used in the design of the slotted-waveguide radiators.
At a gain level of 20 decibels,
Sources of auxiliary power - Auxiliary power may be obtained by tapping off a portion of the microwave power from the magnetron directional amplifier that drives the subsection array, then performing the desired impedance transformations at microwave fre- quency and rectifying the output with the highly effi- cient type of rectifier used in the rectenna. The auxiliary power is then distributed to the individual magnetron directional amplifiers in the subsection array through the flat conduits located on the slotted-waveguide array surface.
c. Phase and Amplitude Tracking
The outgut phcse of any microwave generator in the SPS must be maintained to within 1 to 2 accuracy. Open-ended control is not feasi- ble. The control must use a low-level phase reference at the output, a compar- ator circuit to compare the phase of the generator output with the reference
119
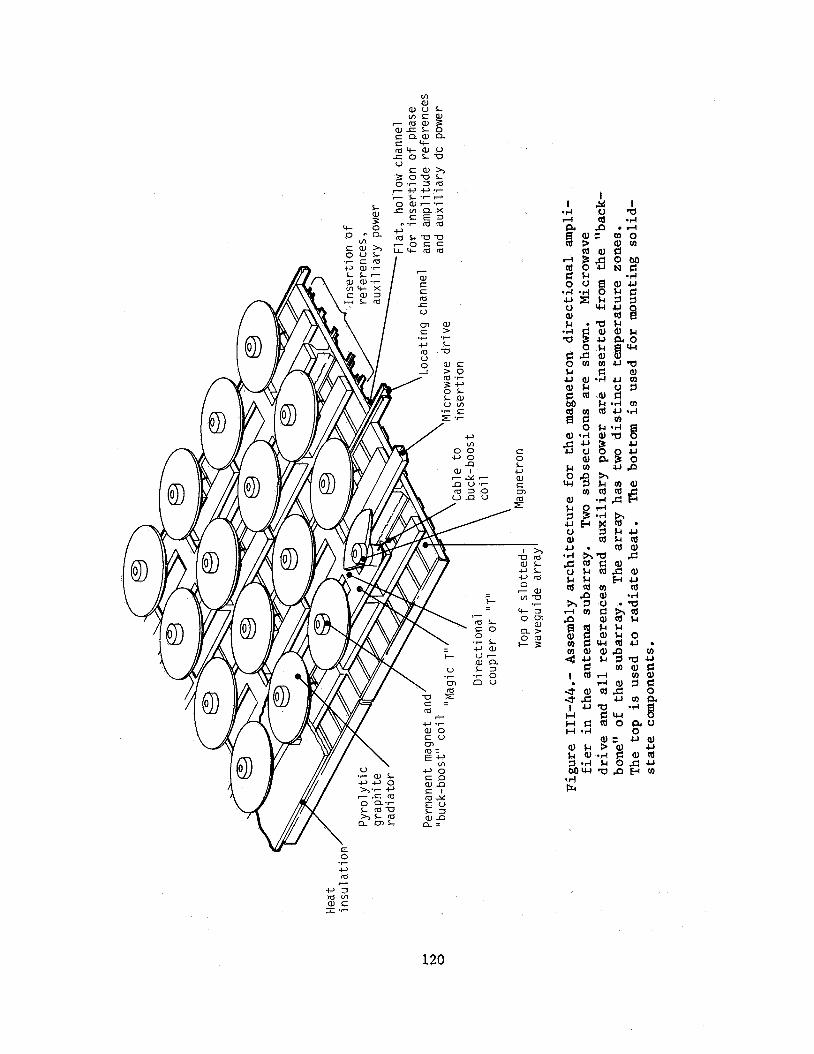
c 0 L U
H 0
120

phase and to generate an error signal, and a feedback sating phase adjustment at the input.
The control of the output amplitude in tors that tend to change that amplitude is also essential for generating an efficient microwave beam. The output amplitude can be controlled to a pre- determined value by another control loop which makes use of small electro- magnets to boost or buck the residual field provided by permanent magnets.
The overall schematic for the combined phase and amplitude control of the magnetron directional amplifier is shown in figure 111-45. Also shown is the manner in which this control can be related to the overall power absorption by the solar cell array. A central computer establishes the most efficient operating point (maximum power output) of the solar cell array and then adjusts the reference power output of the banks of magnetron direc- tional amplifiers.
The phase and amplitude tracking system requires a set of references and a set of sensors. These references and sensors are located at the front face of the slotted-waveguide array, where the most accurate sensing of the phase and amplitude can be made and where the solid-state sensing and control devices are exposed to a tolerable temperature environ- ment.
The amplitude reference is a dc voltage the value of which can be remotely controlled from a central source. The amplitude sensor is a crystal detector coupled to the slotted-waveguide array that provides a dc voltage for comparison with the reference dc voltage. The error voltage, after suitable gain, establishes a current in the buck-boost coils that changes the magnetic field; the magnetic field, in turn, changes the mag- netron current and thereby the power output of the magnetron in a direction that minimizes the error voltage.
The phase control system makes use of a phase-controlled signal from a central source, a sample of the output power, and a balanced de- tector which compares their phases. The error signal can be used to operate a number of different types of phase shifters positioned in the input side of the magnetron directional amplifier.
A test bed (fig. 111-46) has been constructed to check out the proposed control system. For most laboratory measurements, a resistive microwave load is substituted for the slotted waveguide. The sensors are located in the waveguide approach to the load. Although evaluation of the control system is not complete, the initial information indicates predicted behavior.
d. Noise Emission Properties
The lack of historic data on the noise performance of CW crossed-field devices and the consequent inability to predict CFA behavior in the SPS application, where the noise level of the transmitter is a highly
121
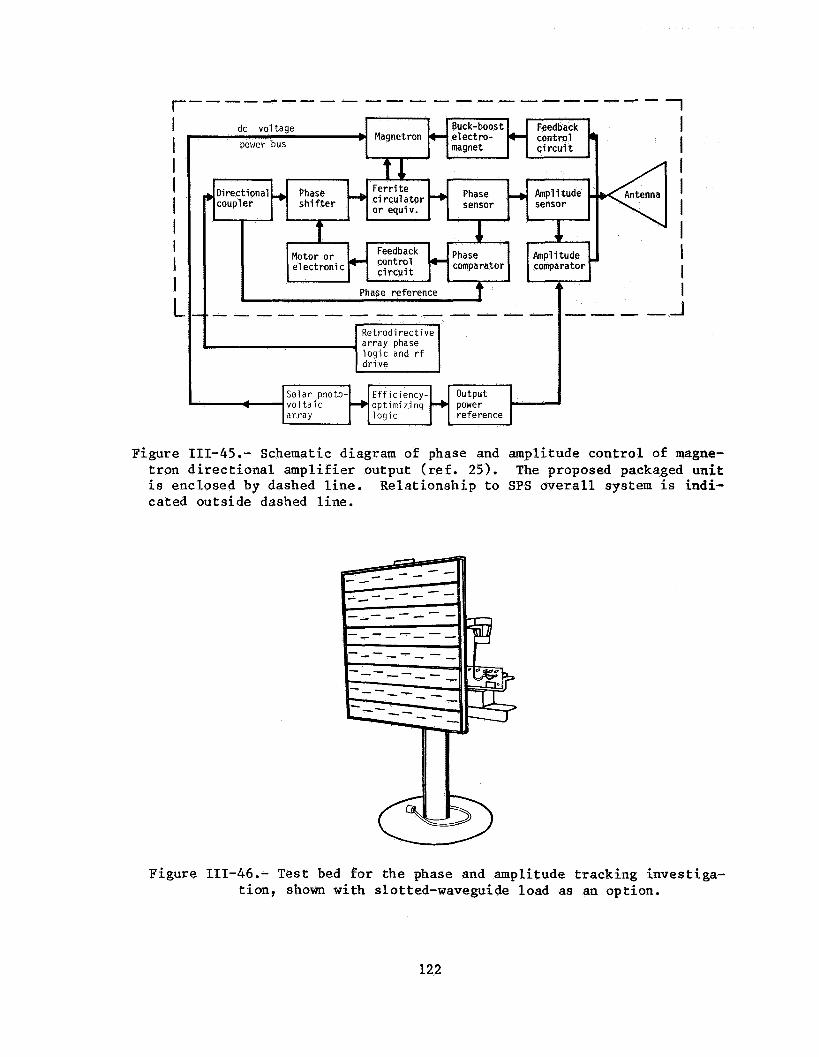
I I ' I I I I I I I L I Phase reference T
--------------
Antenna U Re trodi rec t ive array phase logic and rf
I -
Solar photo- Efficiency- Output
array logic reference A - vol t a ic + optimizing -+ power
a i
Figure 111-45.- Schematic diagram of phase and amplitude con t ro l of magne- t ron d i r e c t i o n a l ampl i f ie r output ( r e f . 25). The proposed packaged unit i s enclosed by dashed l i n e . Relat ionship t o SPS o v e r a l l system is indi- cated outs ide dashed l ine .
Figure 111-46.- T e s t bed f o r the phase and amplitude t racking invest iga- t ion , shown with slotted-waveguide load as an option.
122

critical issue, became a major factor in the pr selection of a gener- ator approach in the refere signal-to-noise ratio over frequency ranges ther side of the carrier have been made on magnetron di fig. 111-47). The data were obtained both with nor ed to the fila- ment and with no external power appli ratio that is obtained over a frequen tz with no exter- nal power applied. The signal-to-no s for a l-mega- hertz band of noise. This value cor o-noise ratio of 130 decibels per 1 kilohertz noise, which is comparable with a klystron.
signal-to-noise
Because measurements are still limited by equipment sensitivity, it is possibl hat the signal-to-noise level is substantially better than 100 dB/MHz. The sensitivity is being increased by 20 decibels so that signal-to-noise ratios of as great as 120 dB/MHz can be measured.
Although these noise measurements were made with a device gain of approximately 20 decibels, the noise behavior remains independent of gain at high gain levels. At high gain levels, the drive source appears as a small reflection factor (0.1 for a gain of 20 decibels), which has a negli- gible impact on the behavior of the tube.
These low-noise measurements have been observed on magne- trons made by different manufacturers and in different time periods, but not on all magnetrons that have been randomly selected. However, no statisti- cal studies have been made and none probably should be made until more sensi- tive measuring equipment is available. In addition, it may be more effective to devote any limited future effort to better understanding the sources of noise in the magnetron.
Measurements of near-field phase-modulation noise added by the magnetron directional amplifier were also made when it was operating with a gain of approximately 20 decibels. These measurements indicated a carrier- to-noise level that was typically 115 decibels for a 1-kilohertz band of noise in the range of 10 to 100 kilohertz removed from the carrier frequency.
A method of making harmonic measurements in a small coaxial line and water load attached adjacent to the magnetron output, with normal loaded impedance matching, was employed. By this means, the problem of multiple-mode propagation is avoided. tive tubes, designated as numbers 11 and 12, are given in table 111-12. The findings are somewhat better than had been anticipated. The unexpected pres- ence of significant energy at the fifth harmonic is an indication of the dif- ficulty in predicting the more complicated characteristics of any microwave generator.
Measurements made on two representa-
e. Cathode Life of 50 Years
It is well known from the theory and experience associated with properly carburized thoriated-tungsten cathodes that such cathodes can have extremely long life if they are operated at low temperatures in an effec- tive vacuum. Investigations not only have indicated that very long life can
123

Heater on Heater off
I 200 MHz .
Figure 111-47.- Spectrum of locked magnetron.
TABLE 111-12.- HARMONIC MEASUREMENTS ON REPRESENTATIVE TUBES
Frequency Harmonic level, dBcYa for tube no. -
11 12
f0 0 0
2fO -7 1 -69
3f0 <-9 7 -85
4f0 -86 -93
5 f0 -6 2 -64
adBc = decibels below carrier level.
124

be achieved but also have led to the discovery of an apparently overlooked feedback mechanism in the magnetron by which the emitting surface of the cath- ode is maintained at a temperature just sufficient to supply the needed cur- rent that flows from the cathode to the anode. This mechanism ensures that the lifetime of the tube is independent of external circumstances with the ex- ception of compromised high vacuum and demand for increased anode current be- yond the design value.
It has been established from life test evaluations that the
The difference between lifetimes at 2000 and 1900 K is a life of a carburized tungsten cathode is a very steep function of the opera- ting temperature. factor of 10.
The conclusion is that a good argument can be made for ex- tremely long cathode life in the proposed SPS magnetron. based on observations of low operating cathode temperatures in operating magnetrons, an internal mechanism that will automatically keep the cathode temperature as low as possible over closely controlled operating conditions in the SPS, a body of experience and information on the carburized thoriated- tungsten cathode that is documented in published papers and books, and the correlation of the long life of the Machlett tubes with predicted life. A lot of 12 tubes was manufactured by Machlett Labs Inc. for use in the WWV transmitter. The filament wire was 0.089 centimeter (0.035 inch) in diame- ter and 20 percent carburized, and the tubes were operated at 1950 K. The 12 tubes had a total running time of 850 000 hours, and no failures had oc- curred when the equipment was retired from service. These tubes were also high-power and high-voltage tubes, similar to the projected SPS magnetron.
The argument is
4. SOLID-STATE POWER AMPLIFIERS
System studies on the solid-state concept (Section 1II.F) in- dicate that efficiencies, power handling capabilities, and the 373- to 398-K (100' to 125' C) operating temperatures required for long life will limit power densities at the center of the SPS antenna to levels significantly lower than those of existing tube designs. However, the study results are encouraging and additional work is underway in the solid-state area.
During an applied science workshop held at JSC, it was recog- nized that the high voltages associated with the operation of the SPS power tubes in the reference configuration may lead to large plasma leakage cur- rents and/or arcing. Solid-state devices, operating at much lower voltages, represent a potential solution to this arcing problem. state devices would be more compact than the tubes and would possibly permit economies in delivery of antenna systems to orbit through higher density launch payloads. Finally, as solid-state devices have supplanted tubes in a wide variety of commercial and military applications, their high reliability and long-life operation have become well known; these characteristics are of prime importance in SPS design considerations. Thus, high-power solid-state devices appear to be an attractive alternative to the high-voltage power tubes.
In addition, solid-
125

In reviewing candidate solid-state devices for SPS applica- tions, attention was limited to those devices capable of generating or ampli- fying appreciable amounts of microwave power: outputs in excess of 1 watt with efficiencies greater than 25 percent. category were impact avalanche transit time (IMPATT) and trapped plasma ava- lanche triggered transit (TRAPATT) diodes and bipolar and field-effect tran- sistors. can be seen in table 111-13 and figure 111-48. appeared to be the best choice in terms of their relative high gain and high efficiency. In addition, the manufacturing process associated with FET's make them easier and cheaper to manufacture in large quantities. lowing characteristics of microwave field-effect transistors appeared feasi- ble as reasonable goals for future solid-state work.
The devices falling into this
A summary of the characteristics of the four devices investigated It was concluded that FET's
The fol-
Characteristic Value
Efficiency, percent . . . . . . . 80 to 85 Power output, W . . . . . . . . . 1 to 3 Frequency, GHz . . . . . . . . . 2.45 Temperature, K ("C) . . . . . . . 398 to 423 (125 to 150) Noise temperature, K . . . . . . 60 Weight, g/amplifier . . . . . . . 0.1
to failure . . . . . . . . . . 100 Reliability, yr mean time
a. Device Technology for SPS During 1978 and 1979
The JSC sponsored a study, "Analysis of S-Band Solid-state Transmitters for the Solar Power Satellite" (ref. 91, based on the assumption that a high-efficiency, solid-state SPS transmitter may be feasible. The study was performed by RCA Laboratories.
During the first phase of the study, the feasibility of replacing the microwave transmitting tubes with clusters of solid-state ele- ments was assessed. This assessment was followed by an alternate approach in which a solar cell "blanket" is used to provide dc power to a distributed array of solid-state amplifiers having output power combined in space, still maintaining constraints of the reference system. The RCA conclusions were that the direct replacement entails an unacceptable weight penalty due to (1) the thermal control system required for the solid-state device substrate; (2 ) the low-voltage/high-current power distribution and conditioning system; and (3) the degradation of efficiency due to microwave power combiners required for high-power modules.
In addition, an experimental amplifier was built by RCA A maximum power-added efficiency of 58.5 percent using a commercial FET.
with an output power of 3.05 watts and a gain of 6.8 decibels was achieved, as shown in figure 111-49. voltage optimized for maximum efficiency. Some improvement in power-added efficiency may be achieved by increasing the gain of the device. Further testing of this amplifier is planned as an in-house JSC activity.
The device was operated in class AB with the bias
126
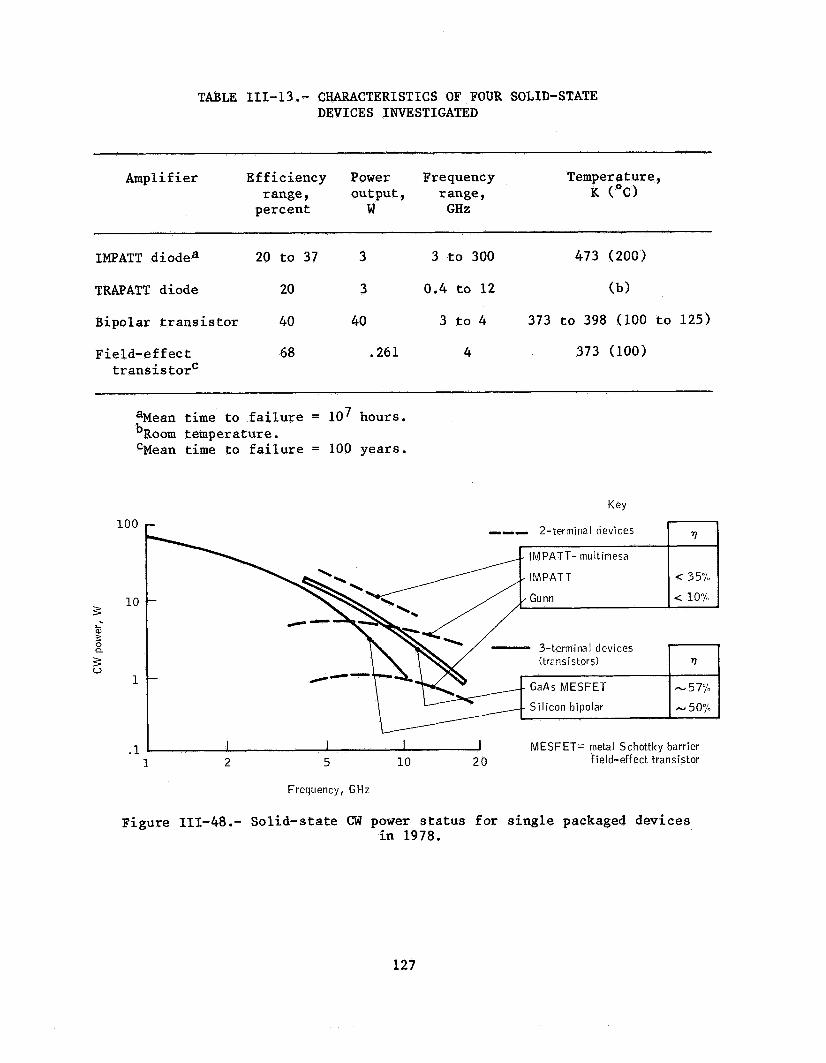
TABLE 111-13.- CHARACTERISTICS OF FOUR SOLID-STATE DEVICES INVESTIGATED
Amplifier Ef f ic iency Power Frequency Temperature, range , output , range, K ("C)
percent W GHz
IMPATT diodea 20 t o 37 3 3 t o 300 473 (200)
T W A T T diode 20 3 0 .4 to 12 (b)
Bipolar t r a n s i s t o r 40 40 3 t o 4 373 t o 398 (100 t o 125)
Fie ld-ef fec t 68 .261 4 t r a n s is t orc
373 (100)
aMean t i m e t o f a i l u r e = lo7 hours. ' R O W temperature, CMean t i m e t o f a i l u r e = 100 years .
100
10
1
C K eY
7 --- 2-terminal devices
I M P A T T - multimesa \<-. / A i M P A T T
7" , , &- 3-terminal (transistors) devices ~1 GaAs M E S F E T
S i l i con bipolar
I I I 1 MESFET= metal Schottky barrier 1 2 5 10 20 field- eff ect transistor
Frequency, GHz
Figure 111-48.- Sol id-s ta te CW power s t a t u s f o r s i n g l e packaged devices i n 1978.
127
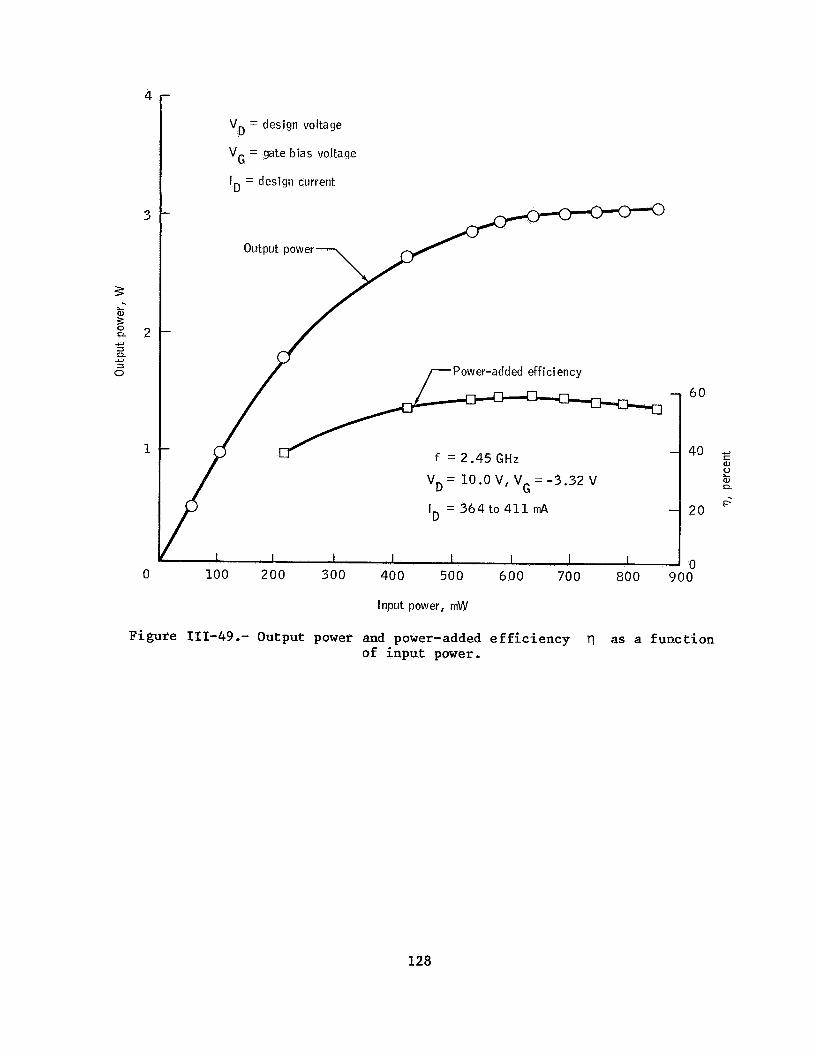
4
3
3
E 2
. L a, 3
u 3 Q
3 .y
0
1
0
VD = design voltage
VG = gate bias voltage
I = design current D
Pow er-add ed eff i ci enc y
60
40
20
f = 2.45 GHz
ID = 364 to 4 1 1 mA
Pow er-add ed eff i ci enc y
60
40
20
f = 2.45 GHz
ID = 364 to 4 1 1 mA
I I 1 I I I 1 I
100 200 300 40 0 500 600 70 0 800 900
Input power, mW
Figure III-49.- Output power and power-added efficiency rl as a function of input power.
128

One of the important recommendations of this part of the study was the undertaking of a follow-on experimental and theoretical program to ascertain the factors contributing ation of micro- wave FET's. Previous experience with 1 computerized equipment pointed to the benefits of using this equipment for the recommended follow-on program.
(1) Antenna system investigations - The reference system served as a basis for the first phase of the antenna system investigation. If an attempt is made simply to replace the thermionic devices contemplated in the reference system by clusters of solid-state devices the power of which is combined to form equivalent transmitting elements, penalties in voltage- distribution losses, power-combining losses, and thermal problems must be seriously considered. From detailed analyses performed during the study, it soon became apparent that a solid-state replacement program of this nature, although possibly contributory toward the overall reliability of the system, would fall short in terms of the operational parameters, particularly in terms of a factor of merit measured in watts per kilogram.
Emphasis was placed on a concept that incorporated di- rect conversion of sunlight into microwave power-generating modules and there- by obviated the need for voltage distribution altogether and essentially solved the potential thermal problem. Some specific problem areas peculiar to this approach were addressed in the study; e.g., the relative orientations of the solar array and the microwave antenna, the spacing of the antenna ele- ments, and, most importantly, the near-field properties of such an antenna.
It was concluded that this type of system may be light- er than the reference system and that a tubular beam can indeed be created. Computer simulations of this type of antenna beam were performed at the con- clusion of the study. Recommendations for adapting this approach, after fur- ther study, were made.
(2) Module investigations - The module study yielded the notion that the efficiency of the power module is the most important design parameter, since it directly affects the overall SPS cost in terms of dollars per watt of output power. Here again, power-combining losses and primary power-distribution problems pointed toward the concept of a system design in which low-power amplifier modules are directly powered by elements of the solar cell array. In such a system, the efficiency and weight penalties of a dc distribution system are not incurred. An analysis of the practical power limits placed the module power output somewhere between 0.5 and 30 watts, with the power-efficiency trade-off indicating an optimum value of 1.5 to 3 watts and an efficiency of 80 percent.
Two design concepts were developed in which modules were placed on a 1.3x by 1.3x grid, with 16-module clusters controlled by a single receiver module and providing 50 watts of transmitter power per cluster. As was the case with the device designs, both module designs (a
the approach rather than to be specific. (See fig. 111-50.) high Q" version and a "patch resonator" approach) were meant to represent I 1
129

Sun1 i g h t
L . 1 8 mm
mm
1 Solar blanket -1 T ( 7 m i l s )
Antenna m i l s ) metal i z a t i o n Kapton (only where necessary
for support of antenna, a m p l i f i e r , Microwave and distribution network) power
Patch resonator antenna
Chip i s bump-moun tea t o metal i z a t i o n
tage I amp1 i
30-dB, f i e r c h i p
Figure 111-50 .- Patch resonator design.
130

( 3 ) Conclusions and recommendations - The RCA study (ref. 9) yielded the following conclusions.
(a) It does not appear prudent to simply replace the klystrons in the reference system with equivalent clusters of solid-state devices.
(b) Real benefits can be obtained if the system archi- tecture is designed for maximum compatibility with the operating parameters of solid-state mi- crowave devices. This objective leads to a con- cept of direct use of the solar-panel-generated power by low-power microwave amplifiers, known as the sandwich concept.
(c) The postulated 80-percent power-added efficiency of the microwave amplifiers appears ultimately achievable. Gallium arsenide FET's are the logi- cal device candidates for this service.
(d) Devices providing 4 watts at greater than 80 per- cent power-added efficiencies were considered f eas ibl e.
(e> The undertaking of a follow-on experimental and theoretical program to ascertain the factors contributing to high-efficiency operation of mi- crowave FET's was recommended.
b. Amplifier Development Program
The NASA MSFC, through Rockwell International, sponsored the "SPS Solid-state Amplifier Development Program" (ref. 331, which was an extension of the effort performed as part of the JSC study; its main purpose was to gain a better understanding of the factors contributing to the high- efficiency performance of GaAs PET'S. Large-signal waveform analysis tech- niques were a major investigative tool in the program.
The program consisted of the demonstration of an amplifier having an output power of 10 watts, a gain of 10 decibels, and a power-added efficiency of 65 percent. To date, a survey of available devices from a total of six domestic and foreign manufacturers of GaAs FET's has been made, and circuits using various devices are being built and analyzed as the transis- tors are received. Although "class E" operation is of interest for the SPS application because of its potential for very high efficiency, it is by no means certain that such a mode of operation can be obtained at microwave frequencies and the work under the program is not restricted to multipole op- eration of the FET's.
As previously mentioned, computer-aided analysis techniques are used extensively in the program, not only in the normal small-signal de- vice characterization mode but also to define the available trade-offs under
131

large-signal operating conditions. Examples of such techniques are the auto- matic plotting of circles of constant efficiency, constant gain, constant power output, and constant intermodulation distortion on special instrumenta- tion at RCA Laboratories. In addition, a technique has been demonstrated for synthesizing current and voltage waveforms under FET amplifier full operating power. This approach is also a powerful analytic tool in the investigation.
Although the effort is still in progress and any attempts at projections of final results are considered premature, some very signifi- cant findings have already been made. When optimized for maximum efficiency at the SPS frequency, a power amplifier stage using a transistor designed for 12-gigahertz operation yielded 71 percent power-added efficiency. This re- sult was obtained at a power output of approximately 1 watt and a gain in excess of 11 decibels. The mode of operation can be described as an inver- ted class AB, since the drain current is highest at low rf drive and lowest at full rf drive: the rf voltage deactivates the device during a substan- tial fraction of the rf cycle; hence, the high efficiency. However, when the same type of operation was attempted with a transistor from the same manufacturer (but rated at somewhat lower power output at 12 gigahertz), low efficiency was observed at 2.45 gigahertz but power output was much closer to the rated value. These results are under investigation. The current and voltage waveform analyses are expected to clarify the hitherto unexplained aspects of this type of FET performance.
Power-combining circuits will be used in the final ampli- fier configuration. A study of such circuits is included in the program.
c. Technology Forecast
Solid-state technology is in a period of rapid growth in both the microwave and the signal-processing areas. Specific applications of this technology in a variety of spaceborne systems occur with increasing fre- quency and effectiveness. Interest in solid-state devices, components, and integrated circuits has been demonstrated, on the one hand, by the commercial computer industry for integrated-circuit logic components and, on the other, by the military systems for microwave solid-state devices. This trend is quite independent of the SPS concept. Thus, the solid-state SPS concept will derive benefits from the very large investments made in this technology.
The directions of technology research pertinent to the SPS concept span all fields familiar to the solid-state industry: materials, devices, circuits, processing methods, and automated test procedures. In the semiconductor materials area, gallium arsenide currently is the most impor- tant compound for microwave applications. The silicon-on-sapphire technology probably will provide an excellent base for selecting the SPS solid-state an- tenna substrate materials.
New device concepts in addition to the FET, which appears to be the best candidate for amplifiers at the SPS frequency, are the verti- cal FET and the power metal-oxide semiconductor (MOS) transistor, both of which are in advanced stages of exploration. circuit development is the return to the concept of microwave lumped-circuit
The most important area in
132

design. extreme miniaturization of the amplifiers and make large distributed antenna arrays feasible.
Lumped circuits designed for operation at 2.45 gigahertz permit
Finally, modern processing methods (e.g., ion-beam milling and plasma etching) should extend the techniques of the integrated-circuit chips to microwave circuits. Furthermore, the selective implantation of impurities by means of ion-implantation and laser-annealing techniques may enable the fabrication of monolithic components directly on semi-insulating gallium arsenide.
D. RADIATING ELEMENTS
The function of the radiating element is to couple rf energy from the power amplifier into a radiation field in space with a minimum of loss. Although the radiated power density across the total antenna is tapered to obtain appropriate beam forming, the individual radiating elements are re- quired to launch a radiation field of uniform power density and phase. antenna elements have been investigated only to the depth necessary to esti- mate weight and performance in support of system studies. ments have been made, and various calculations and estimates have been per- formed. However, serious "design optimizations" have not been attempted.
The
Judicious judg-
1. CONCLUSIONS AND REMAINING ISSUES
The following conclusions have been reached.
a. Low-CTE materials are required to hold mechanical toler- ances to the levels required for an efficiency of 96 per- cent. An aluminum-graphite metal matrix is a leading candidate.
b. A phased array using slotted-waveguide techniques is the most efficient radiator for large power blocks.
c. High-voltage breakdown in radiating slots and distribution waveguides is not expected to be a problem at geosynchro- nous altitude. However, study should be continued to de- termine the extent to which the SPS produces an atmosphere.
d. Linear polarization is preferred for simplicity, and anal- yses show that Faraday rotation does not produce a signifi- cant 10s s .
e. Improved techniques (for measuring absolute radiated power), equipment, and analysis will be required to verify system performance.
133

The significant issues remaining to be resolved for the radia- ting element are as follows.
a. Determining a practical design goal for efficiency consid- ering mass production techniques and their inherent to1 er ance s
b. Developing suitable low-CTE material capable of maintaining the required tolerances in an operational environment
c. Developing receiving techniques for the pilot signal to pro- vide adequate isolation and acceptable transmit loss
d. Developing rf measurement technology capable of evaluating ultra-high-efficiency components economically
2. REFERENCE DESIGN DESCRIPTION
The subarrays are the basic power-radiating elements of the transmitter (ref. 34). There are 10 types of subarrays corresponding to the 10 power intensity levels of the illumination taper. These 10 types use the same equipment, but the arrangement and numbers of equipment elements vary with the number of klystrons. (See fig. 111-51.)
The radiating waveguide, at the subarray level, is composed of 120 waveguide sticks that are 10.43 meters (60 guide wavelengths The method of attaining various numbers of module units per subarray is to in- stall internal short circuits (conducting walls) within the sticks and to dis- tribute rf power, from each klystron, with the distribution waveguides to the desired number of waveguide sticks. In this manner, it is possible to obtain 10 types of subarrays, ranging from 36 to 4 klystrons per subarray to achieve the desired power taper. unit 10.43 meters square, which remains unchanged throughout the array and is based on realizable mechanical tolerances and acceptable error plateau levels.
Xg) long.
The integral radiating waveguide forms a subarray
The distribution waveguides feed power from the klystron output waveguide to the radiating waveguide. The distribution-waveguide sticks are arranged in pairs, each one distributing half of the rf power from a given klystron module. The arrangement of klystrons and rf power-distribution waveguides was selected to minimize continuous stick length subject to the constraint that the length of each stick must be an integral number of wave- lengths. diating element. Minimizing stick length provides three advantages: re- duced sensitivity to temperature; greater slot offset, which reduces scat- tering-loss sensitivity to tolerances in slot offset; and reduced rf I2R losses. The geometries of the subarray types are illustrated in figure 111-51. All subarray types except type 6 employ a split klystron output to minimize active stick length. The active stick length must be an even multiple of guide wavelengths. The total stick length for a subarray is 60 guide wave- lengths, which is not evenly divisible by 8. Therefore, the type 6 subarray, which contains four klystrons along the stick runs, may not use power split- ting at the klystron output port. This type subarray will contain single
Short circuits within the sticks establish the length of each ra-
134
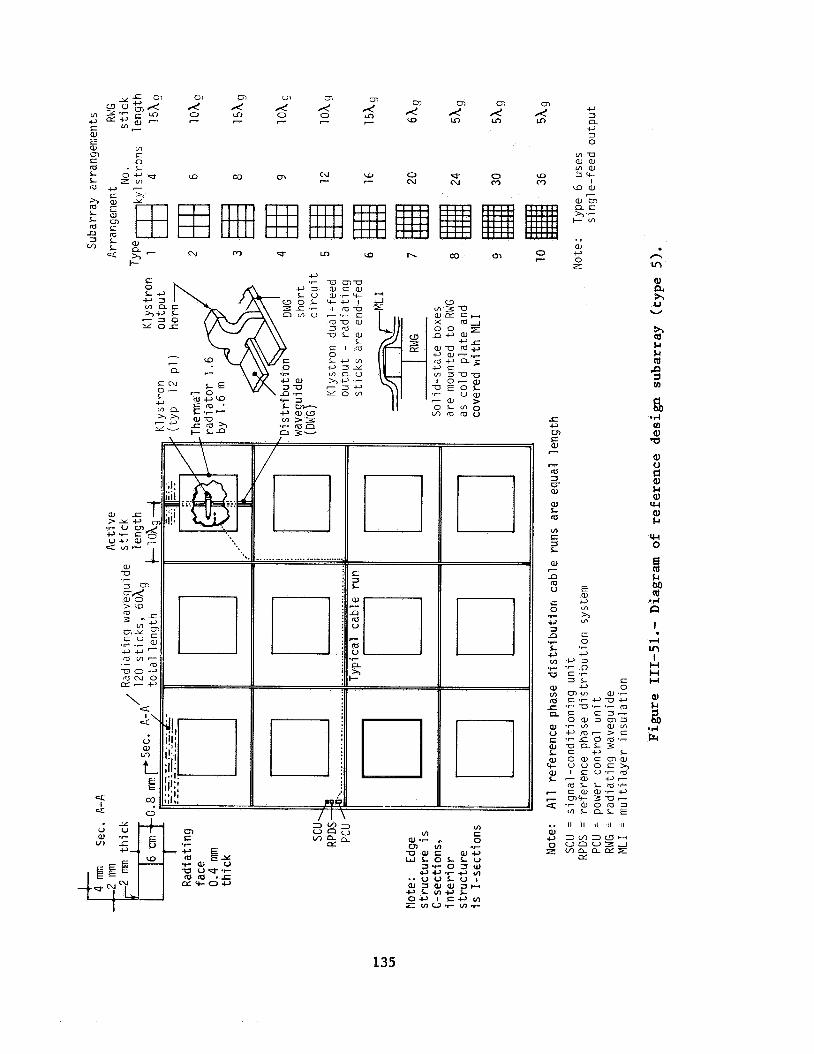
m m m
5 5 6
G) > c, U cc
.r
Y <
w .r
m S
TI m u a s w a 'r- 4- 4-e I I m u c .r s m u a 3 5
T I L W L
s ' l m 0 L e V I w 3 x v) Q V h w '7
- 3 w Y o w l
/
U. 17
Q m e 0 N m
0 P
W ol
il c 3 L
CL
1,
17
U 3 Q e 3 0
.. I1 I1 I 1 I1 II
135

klystron outputs feeding 15 guide wavelength sticks, each containing 30 slots. The radiating-waveguide faces are 0.4 millimeter thick, the stick dividers are 0.6 millimeter thick, and the distribution waveguide is 0.8 mil 1 ime t er thick.
The subarray distribution and radiating waveguides are as- sumed to be fabricated from graphite/aluminum metal-matrix composites. The structure members are a high-temperature graphite plastic-matrix composite. Solid-state components are mounted on the radiating-waveguide assembly under multilayer insulation so that the radiating waveguide serves as a cold plate. In addition, thermal insulation is used to force the klystron heat-rejection system to radiate only out the backface of the antenna; by this means, the thermal environment for the solid-state components is also improved.
3. WAVEGUIDE PARAMETERS AND PERFORMANCE
An analysis of efficiency factors as a function of mechanical tolerances was conducted for a reference system configuration which consisted of radiating-waveguide lengths between loxg (1.65 meters) and 30xg (4.96 meters), for which the weighted average length was (ref. 14). Thus, the guide length used for the analysis was the (2.76 meter) unit. For most cases, this was an iterative process in which a reasonable mechanical tolerance was selected and the resultant loss calcu- lated. Tolerance and loss were then adjusted as considered appropriate. The efficiency factors thus developed are listed in table 111-14 and dis- cussed briefly in the following paragraphs. This tolerance budget includes both manufacturing and operating errors and has led to the conclusion that low-CTE materials will be required to meet SPS design goals.
16.7Xg (2.76 meters) 16.7Xg
a. Subarray Tolerances
The mechanical tolerances for each subarray which contrib- ute to systems losses are surface flatness, subarray average tilt, and gaps between subarrays. Errors in surface flatness and gaps between subarrays pro- duce scattering into the side-lobe area. Subarray tilt produces a decrease in gain for the subarray in the direction of the target.
(1) budgeted for subarray surface flatness. requires an rms surface error of 0.127 centimeter.
Subarray surface - A power loss of 0.5 percent was Using the theory of Ruze, this loss
(2 ) Subarray tilt - A power loss of 0.4 percent was budgeted for subarray tilt. This loss translates into an edge-to-edge off- set of 0.254 centimeter.
(3) Gap between subarrays - The vast size of the SPS anten- na and the overall flatness requirement, together with thermal and steering stresses, require some form of stress relief (i.e., gaps) between the sub- arrays. The gaps represent "unfilled" aperture and thus contribute to gain loss in the main beam and scattering of the lost energy into the side-lobe areas. This gap produces an efficiency loss of 0.13 percent.
A gap of 0.64 centimeter between the subarrays was budgeted.
136

TABLE 111-14.- SPS SUBARRAY LOSSES AND DIMENSIONAL TOLERANCES
Dimension Tolerance, Efficiency loss , a mm percent
Subarray surface f l . 27 0.50
Subarray t i lt 2.54 .40
Gap between subarrays
Radiating guide Length Width
Slot o f f s e t
Feedguide Length Width Coup l ing
6 .35
k. 76 f.08
k. 16
2.76 k.08
(b)
.13
.02
.12
.10
.02
.03
.10
aTotal loss = 1.42 percent. bNot available.
137

b. Radiating-Element Tolerances
The losses in the radiating element consist of I2R losses An attempt has been made to minimize the
Scattering and mismatch losses result
and mismatch and scattering losses. primary variable associated with I2R losses: the path length between the power tube and the radiating slots. from mechanical errors in waveguide length and width and errors in slot p 1 ac ement .
(1) Waveguide length and slot spacing - Errors in slot po- sition relative to the standing wave in the radiating "stick" produce an im- - - pedance mismatch at the slot and hence contribute to voltage standing-wave ratio (VSWR) loss at the feedpoint. Errors in slot placement within an ideal radiator would tend to vary slightly about the desired location and thus con- tribute an insignificant amount to system losses. However, an error in the length of the radiating guide would tend to produce the effect of offsetting all slots in the same direction. Thus, the slot mismatch would be accumula- tive at the feedpoint. calculated to produce a loss of 0.02 percent.
A 0.76-millimeter tolerance for the guide length is
(2) Waveguide width - A change in waveguide width produces a change in the propagation factor within the waveguide. Thus, an error in waveguide width produces an apparent error in waveguide length; the loss con- sists of reflected power at the feedpoint. An allowable tolerance of 0.08 millimeter contributes a l o s s of 0.12 percent.
( 3 ) Slot coupling - The reference design consists of longi- tudinal slots for which the coupling is controlled by the offset of the slot from the guide centerline. Errors in the slot offset will produce a varia- tion in the power radiated by the slot. over the antenna produces a scattering loss. projected to produce a 0.1-percent efficiency loss for the antenna.
The resultant amplitude variation A 0.16-millimeter tolerance is
(4) Feedguide tolerances - The loss due to coupling varia- tion in the feedguide slots was not estimated. This effect would be similar to the variation in radiating-slot coupling which produces scattering due to amplitude variation. A loss factor for this effect equal to that of the radiating-slot coupling error is included in table 111-14. The correspond- ing tolerance for feedguide slot configuration is not available.
(5) Thermal distortions - Thermal environment varies radi- ally over the antenna because of the radiated power taper and also because of the 24-hour antenna rotation, seasonal variations, and eclipses. Thermal ex- pansion will produce changes in both guide length and guide width. These distortions then produce losses in the same manner as that allowed for me- chanical tolerance. An aluminum waveguide with no tolerance errors would have an efficiency loss of 1.4 percent when elevated in temperature by 55 K (55O C). A similar waveguide with a low-CTE material would drop only 0.2 percent in efficiency for the same conditions.
138

( 6 ) Losses from 12R - Boeing has measured the 12R losses for a ing the reflected power at the input terminal. The implied 12R loss was 1.2 percent (ref. 35). Raytheon also evaluated 12R losses for a 4x radiator by means of measuring the actual thermal losses (ref. 3 6 ) . Tieir result was 1 t 0.1 percent for this unit.
10Ag radiating element by closing off the slots and evaluat-
Methods available for calculating the 128 losses in a resonant waveguide radiator should be implemented when possible. These losses are obviously larger than the standard waveguide transmission losses and would tend to increase with larger antenna element size. However, a 2- percent loss budget is considered to be a reasonable estimate for this effi- ciency factor. Refinements in the antenna design are probably required to attain this performance level.
c. Receiving-Technique Evaluation
The receiving antenna receives a pilot signal from Earth with phase information to keep all modules in phase (ref. 37). For symmetry, the pilot signal should originate from the center of the SPS Earth rectenna. Because of ionospheric phase shift and Faraday rotation, the pilot signal should be centered on the SPS power frequency with the phase information in symmetrically disposed sidebands. The purposes of the receiving-technique evaluation by Boeing were as follows.
(1) To compare shared antennas with separate receiving an- tennas to determine feasible pilot-beam budget and receiving-antenna constraints due to power module effi- ciency, bandwidth, and isolation consideration
(2) To design and select a pilot-beam receiving-antenna technique compatible with a power beam array con- figured for simultaneous transmission of the S-band power beam and reception of the pilot-beam spread- spectrum signal
The pilot-beam link analysis established that very small, low-gain pilot receiving-antenna elements embedded in the transmitting array are significantly superior to any scheme of diplexing, because (1) the total system power losses are two orders of magnitude lower with a separate antenna than with any state-of-the-art diplexing device; (2) the small antenna, be- cause of its inherent broad bandwidth, is fully compatible with a spread- spectrum signal, whereas the transmit array is not; and ( 3 ) the small, low- gain antenna represents a much lower development risk compared to a diplexing device.
Also from the pilot-beam link analysis, formulations were developed from which to determine values of pilot-transmitter power and an- tenna aperture as well as pilot receiving-antenna aperture. The transmitter power and aperture depend primarily on the requisite pilot-link effective radiated power (ERP). The ERP, in turn, depends on the signal-to-noise re- quirement of the pilot-link receiver and, hence, the noise environment in
139

which the receiving system must operate. Consequently, the ERP requirements were found to be extremely sensitive to the cutoff frequency of a required re- ceiver i.f. notch filter.
The relationship between pilot-transmitting-antenna diame- ter and system power loss (efficiency) is not monotonic, because an increase in the antenna diameter produces two opposing effects: the amount of pilot- transmitter power required to produce the requisite ERP is reduced while, si- multaneously, the degree of rectenna blockage is increased. At low diameters, the transmitter-power effect dominates and the loss decreases with increasing diameter, whereas at larger diameters, rectenna blockage becomes most impor- tant and the system loss increases with increasing diameter. Thus, for a particular ERP, there is a rather limited set of pilot-transmitter power/ aperture combinations that give minimum system loss.
For small apertures, an increase in aperture reduces sys- tem losses due to a decrease in the required ERP. At large apertures, the system losses hicrease with increasing aperture, because of receiving- antenna blockage of the spacetenna. The specific nature of this relation- ship depends on the required signal-to-noise ratio in the pilot receiver and also on the bandwidth of the intermediate-frequency notch filter. is increased, the pilot ERP must increase and so also must the system losses. As bandwidth is increased, more of the power transmitter noise spectrum is passed by the receiver i.f. This increase in noise must be overcome by an increase in pilot-link transmitter power.
As S/N
The optimum receiving aperture, under any foreseeable con- ditions, is quite small. Consequently, the pilot-link receiving-antenna requirement can be satisfied by a simple dipole or slot antenna. tennas may be dimensioned to be either resonant or nonresonant. The aperture of the resonant structure is larger but so also is the effect on the impedance of the neighboring transmitting-antenna radiating slots. To the extent that the lower aperture can be tolerated, the nonresonant structure is preferred.
These an-
An important consideration in the pilot-link design is the isolation of the pilot receiver from noise inherent to the high-power down- link beam. ceiving antenna so that it is cross polarized with respect to the power transmitting antenna. These are separated by Ao/4, where Xo is free-space wavelength, and can therefore be connected to pass, as would a directional coupler, radiation coming from the Earth While rejecting local radiation.
With the dipole, isolation can be improved by rotating the re-
One of the candidate receiving antennas, the slot, or "credit card" receiving antenna, has been built and sweep-tested. It con- sists of a 4.44- by 0.16-centimeter Teflon-glass microcircuit board short- circuited around three edges to form a low-impedance waveguide cavity. Ra- diation patterns were measured for this configuration mounted in a laboratory model of a 10- by 20-slot waveguide antenna (10 waveguide radiators, 20 slots per guide). able mutual coupling between that antenna element and the waveguide slots. Isolation measurements are not available. The evaluation of a cross-polar- ized receiving antenna should be implemented in any program continuation.
Scalloping of the receiving-antenna pattern indicated consider-
140

4 . VARIATIONS ON WAVEGUIDE TECHNIQUES
The reference design described is rather conservative in 11 assumed" construction techniques and possibly also in materials weight. Certainly, this "design" can be improved by judicious iterations of wave- guide cross section, feedguide cross section, slot placement, and possibly a higher degree of aperture sectioning.
The resonant cavity radiator (RCR) concept developed by Rock-
These two subjects are well is a potential technique for reducing losses, and Raytheon has devel- oped a promising waveguide fabrication concept. discussed in more detail in the following paragraphs.
a. Resonant Cavity Radiator
The RCR has been investigated by Rockwell as a potential radiating element for the SPS (ref. 38) . This concept has the potential for improving antenna efficiency and reducing antenna weight. However, the reali- zation of this potential remains to be demonstrated.
(1) Basic principle - Conventional waveguide designs such as the transverse electric TElO mode waveguide slotted array make tube installation fairly complex. To solve the resultant temperature interface problem and possibly increase the rf efficiency of the radiator, Rockwell developed the resonant cavity box excited with the TEmo mode, where m can be varied between 1 and approximately 10. tional standing waveguide radiator with the common walls removed. The RCR has three significant potentials: improvement in efficiency; lighter weight; and simpler structure, which enables integration of the RCR with the rf tube to alleviate the thermal interface problem.
Physically, the RCR is a conven-
(2) Theoretical attenuation estimates - The loss mecha- nisms of the RCR can be best explained by comparison to conventional arrays. The typical flat-plate antenna array is formed by side-by-side placement of several rectangular waveguide sections, as shown in figure 111-52.
The mode that propagates down each waveguide is the dominant TE10. the opposite direction, and, because the system is symmetrical, they are of equal magnitude. If the sidewalls are removed as in the RCR, these two equal and opposite currents cancel. Since conduction losses are simply I2R losses, any reduction in surface currents will make the antenna array more efficient.
The currents that flow in adjacent sidewalls are flowing in
14 1

I_ b
Figure 111-52.- Typical TI310 slotted-waveguide array.
142
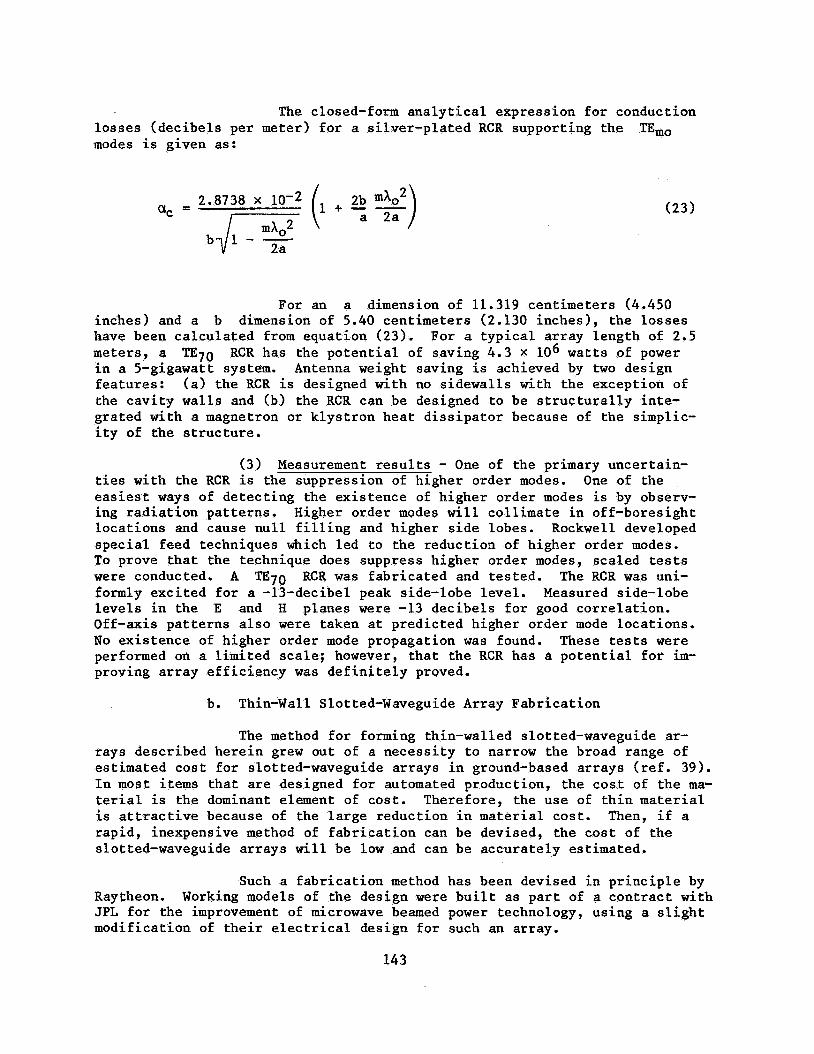
The closed-form analytical expression for conduction losses (decibels per meter) for a silver-plated RCR supporting the modes is given as:
TEmo
2.8738 x 10'2 ac =
For an inches) and a b dimension o
a dimension of 11.319 5.40 centimeters (2.13
(23)
centimeters (4.450 inches 1, the losses
have been calculated from equation (23). meters, a TE70 RCR has the potential of saving 4.3 X lo6 watts of power in a 5-gigawatt system. Antenna weight saving is achieved by two design features: (a) the RCR is designed with no sidewalls with the exception of the cavity walls and (b) the RCR can be designed to be structurally inte- grated with a magnetron or klystron heat dissipator because of the simplic- ity of the structure.
For a typical array length of 2.5
(3) Measurement results - One of the primary uncertain- ties with the RCR is the suppression of higher order modes. One of the easiest ways of detecting the existence of higher order modes is by observ- ing radiation patterns. Higher order modes will collimate in off-boresight locations and cause null filling and higher side lobes. Rockwell developed special feed techniques which led to the reduction of higher order modes. To prove that the technique does suppress higher order modes, scaled tests were conducted. A TE70 RCR was fabricated and tested. The RCR was uni- formly excited for a -13-decibel peak side-lobe level. Measured side-lobe levels in the E and H planes were -13 decibels for good correlation. Off-axis patterns also were taken at predicted higher order mode locations. No existence of higher order mode propagation was found. These tests were performed on a limited scale; however, that the RCR has a potential for im- proving array efficiency was definitely proved.
b . Thin-W a1 1 S lot t ed-W avegu ide Array Fabrication The method for forming thin-walled slotted-waveguide ar-
rays described herein grew out of a necessity to narrow the broad range of estimated cost for slotted-waveguide arrays in ground-based arrays (ref. 39). In most items that are designed for automated production, the cost of the ma- terial is the dominant element of cost. Therefore, the use of thin material is attractive because of the large reduction in material cost. Then, if a rapid, inexpensive method of fabrication can be devised, the cost of the slotted-waveguide arrays will be low and can be accurately estimated.
Such a fabrication method has been devised in principle by Raytheon. JPL for the improvement of microwave beamed power technology, using a slight modification of their electrical design for such an array.
Working models of the design were built as part of a contract with
143

The working models that were made from 0.51-millimeter
The potential for a slotted- (0.020 inch) material were mechanically strong and the fabrication technique was well adapted to even thinner material. waveguide array made from 0.13-millimeter (0.005 inch) or even thinner ma- terial for the SPS applications is very good.
The slotted-waveguide array consists basically of a folded top plate the corrugations of which contribute the three sides of the wave- guide and a bottom plate into which the radiating slots are punched (fig. 111-53). resistance spotwelding or by laser-beam welding to form the finished assem- bly (fig. 111-54).
The two sections then flow together and are joined either by
The holes punched into the material are spaced accurately and serve to accurately locate the material in the bending fixture, which is also accurately machined and ground. The holes also are used to aline the top and bottom halves for accurate assembly.
It is possible that the broad faces of the waveguide mem- bers, both top and bottom, may need some stiffening to avoid bending and "oil canning." The thin, flat channels that are proposed to house the phase and amplitude references and auxiliary powerlines stiffen the slotted surface. The unslotted surfaces could be embossed for stiffening.
The individual slotted waveguides in the array are fed from a feed waveguide. the feed waveguide and radiating waveguides. to the array by means of pop rivets.
Transfer of energy is made through diagonal slots between The feed waveguide is attached
Pattern measurements conducted by JPL indicate little scat-
Raytheon tering of power into the side-lobe areas, although the measured gain was some- what low and indicated an efficiency in the 80- to 90-percent area. subsequently measured the thermal dissipation within a similarly constructed four-slot array quite accurately. This test implied an I2R loss of 1 f 0.1 percent, which is consistent with budgeted losses for this area.
The JPL/Raytheon data are in the same general area as those The raw data for obtained by Boeing for a larger (10 by 20 slot) test model.
the Boeing test indicated an efficiency of slightly less than 90 percent for measured gain compared to physical area. cept is considered a promising technique.
The Raytheon/JPL fabrication con-
5. HIGH-ACCURACY MEASUREMENT TECHNIQUES
An excellent example of state-of-the-art antenna measurement techniques is the improved calibration of the NASA/JPL Deep Space Network S-band antennas (ref. 4 0 ) . This calibration was performed by JPL and the National Bureau of Standards. standard-gain horns using a "modified three-horn technique." tion was accomplished to an accuracy uncertainty of k0.036 decibel. Then, JPL was able to perform a "gain comparison" measurement between the NBS- calibrated horn and a similar "working horn" with an uncertainty of k0.025
In the course of the program, NBS calibrated This calibra-
144

/
Figure 111-53.- Thin-wall waveguide a r r ay f a b r i c a t i o n concept.
\\ \
Figure 111-54.- Thin-wall
A Poi ntwel ds
waveguide a r ray assembly concept.
145

decibel. The end accuracy was taken conservatively as the simple sum of these uncertainties, 0.061 decibel. In terms of percentages, these numbers are direct gain measurement by NBS, 20.7 percent; and gain transfer measure- ment by JPL, 20.5 percent. These are by no means routine tests and cannot be performed on the average antenna range. However, it appears reasonable to assume that selected samples of SPS radiating elements can be evaluated to an accuracy of 0.5 percent.
Georgia Institute of Technology has studied the problem of measuring the performance of a 10- by 10-meter SPS subarray to an accuracy of 1 percent (ref. 41). sidered. The error budgets used are given in tables 111-15 to 111-17.
Both far-field and near-field techniques were con-
This set of error budgets implies development of improved pre- cision attenuators, gain standards, stable oscillators, and computer nor- malization for a far-field measurement. Near-field measurements require development of precision scanner mechanisms, calibrated field probes, and computational techniques.
Because of the large electrical size of the SPS subarray and the requirement for high-accuracy measurements, specialized measurement fa- cilities are required. Most critical measurement error sources have been identified for both conventional far-field and near-field techniques. Al- though the adopted error budget requires state-of-the-art advances in micro- wave instrumentation, the requirements appear feasible based on extrapolation from current technology. Additional performance and cost trade-offs need to be completed before the choice of 'the preferred measurement technique is finalized.
E. RECTENNA
The function of the rectenna in the SPS system is to convert the downcoming microwave power beam to electrical grid power. large physical size (i.e., a typical rectenna site is a 10- by 14-kilometer ellipse) and element composition (many repetitive components), the projected cost savings of automatic mass production are of prime importance. The funda- mental processes at the rectenna consist of rectifying the incident rf field into dc using Schottky barrier diodes, filtering the rectified output, and combining and processing the output to higher voltages for distribution, Hierarchical combination and processing of currents is done several times to integrate the relatively low power per diode to electrical grid power magni- tudes. Provisions for power control for equipment protection and load man- agement exist at each step in the hierarchy (ref. 42).
Because of its
The reference configuration described in Section III.E.l is based on the rectenna element design developed by Raytheon and NASA over the past several years. This concept has been proved capable of achieving the high efficiency required for an SPS. However, the projected rectenna cost is an important factor in the SPS economics, and investigation of alternate con- cepts should be continued in the interest of reducing cost.
146

I. m 4 I H H H
m U C
3 0 u
v) U
C 0
0 V
$
4
a, 0 & 1 0 m
& 0 & & w
\o Fr) 0
0
a, M
& 9 (d C C a, U
4
4
9
rl (d & 7 U 0 7 Ll U m
4
9
h U -4 d -4 D (d U m
a, a 1 U
& a, U U 4 e m e (d & L-
h U .d rl .d P (d
m U
h 0
1 ff a, & k
5
4
9
P a 0 if a a, aJ o X a, U
2 0 .d U m &
z \ m
h U .VI
d a,
0 a, a if
0
II
$4 0 & & a,
a, & (d 1 CT m I
5
9
m I U 0 0 &
d a U 0
i?
147

TABLE 111-16.- ANTENNA RANGE MEASUREMENT ERROR SUBBUDGET
Error component A1 1 owable Comments value,a dB
Field uniformity 0.015
Quadratic phase error .010
Standard-gain antenna uncertainty
Atmospheric effects
VSWR
.020
Maximum amplitude taper at edge of SPS subarray %0.04 dB
Re uires range gb6D2/h
Deve 1 opment of needed
greater than
gain standard
.005 Atmospheric effects canceled by reference
.005 VSWR loss canceled by calibration
Extraneous reflections .025 Extraneous reflections below -57 dB
aRoot-sum-square error subtotal = 0,037 decibel. bD = antenna diameter.
148

I. P- 4 I H H H
m M a 0
0 0
m & P .4 .--) 4 CJ
.4 U
h P
5 a, .--) a,
m 0
& 0
z
\ a C 41
19 a
8 rl a, P
a
.4 a U c
2
- Lo E- .--) z
). a , u 00000 000 I m i % I 9 9 9 9 9 9 9 9 8 I g - c j I o I F ClJ 1
D
u
Lo
a,
4
& 0 w
x B
M a, P4
a, 0 & 1 0, l4 0 & M w
? ? d d d ? ? d ? 00 00 +IO
. . . . . . . . . . . . . . . . . . . . . . . . . . . . . . . . . . . . . . . . . . . . . . . . . . . . . . . . . . . . . . . . . . . . . . . . . . . . . . . . . . . . . . . . . . . . . . . . . . . . . . . . . . . . . . . . . . . . . . . . . . . . . a, a
. . . . . . M . . . . . . . . u . . . . . . . . o . . rl
. . . . . . * . . a, . . . . . . e . .
.r(
m &
-4 a, 0 a, &
d
0 b P- 4
149

The following conclusions have been reached regarding the SPS rec tenna.
1. The rectenna concept (individual antenna elements feeding di- rectly into a rectifying circuit) has been shown by analysis and research to be the most technically effective and economi- cally feasible rf-to-dc power converter for providing electri- cal power.
2. Analysis of rectenna collection techniques indicates that paral- lel and series combining inefficiencies are nearly identical.
3. It is preferable, from the standpoint of combining in- efficiencies , to combine rectenna power in concentric rings rather than in continuous rows.
High power output at a long range with high combined collection/ conversion efficiency has been demonstrated with a rectenna design that is tolerant to angle of incidence, temperature, polarization, flux density levels, and load resistance magni- tude changes.
4.
Remaining issues which must be resolved in the SPS rectenna develop- men t are
1.
2.
3.
4 .
5.
1.
Maintaining an acceptable level of reradiation at fundamental and harmonic frequencies during normal operation and failure modes
Developing a mass production technique which maintains the required efficiency at an acceptable cost
Developing required environmental protection designs which do not degrade performance beyond acceptable limits
Developing appropriate rectenna topology with acceptable losses
Developing rf measurement techniques and equipment with re- quired accuracies
REFERENCE CONFIGURATION AND PERFORMANCE
The reference configuration consists of half-wave dipoles with
Dipole arrays that a capture area of 70 square centimeters (typical) providing between 1 and 2 watts per diode at the center of the rectenna (ref. 42) . are more directional must be used toward the rectenna edge to limit power den- sity to “1 mW/cm2; for instance, a four- by four-dipole array would again pro- vide 1 watt per diode. sively large array, which would pose problems of directional reception and increased losses in the rf collection lines. In the reference design, the dipoles and their associated power and microwave circuitry are integrated
Care must be exercised to avoid selecting an exces-
150

inside an aluminum environmental shield and support structure, which is ame- nable to mass production methods (figs. 111-55 and 111-56).
A representative rectenna design at 35O latitude is described, characterized by a Gaussian tapered beam with a peak incident microwave power density of 23 mW/cm2. Power is collected out to the point at which the inter- ception efficiency is 95 percent. above a ground plane. The dipole assembly also contains a filtering and matching circuit to match the dipoles to the incoming wave with a reflection coefficient of better than -20 decibels. It is assumed that all dipoles are identical throughout the rectenna. The number of dipoles in the rectenna is approximately 1.3 x 10¹⁰. (0.641) triangular array format.
The basic receiving element is a dipole
These dipoles are mounted in a 7.9-centimeter
Component designs for the rectenna are varied to most effec- tively match the incident power flux in 10 rings. Basically, all microwave system components of a given type are similar within a ring. However, power busing and control segmentation at the 5- to lo-megawatt power level and above extends across ring boundaries. Local dc voltages on the panels are designed to not exceed k3.25 kilovolts. The geometry of the ring layout is illustrated in figure 111-57.
Because of the power density variation over the rectenna aper- ture, a single type of radiating element or a single type of rectifier will not provide optimum conversion efficiency. element types or a number of diode types must be provided. Currently, one type of diode operated with four different types of antenna elements is assumed. Besides the dipole element just described, antenna elements are formed by using the basic dipoles in arrays containing two, four, or eight dipoles. The corresponding assemblies are called types 1, 2, 3, and 4 re- ceiving arrays. assemblies) in the overall rectenna.
Either a number of radiating-
There are approximately 7.654 X 10⁹ receiving arrays (diode
The receiving arrays are combined into panels, which are the smallest assembly units from the fabrication point of view. The panel area selected was 10 square meters, with a north-south (N-S) plane dimension of 3 meters and an east-west (E-W) plane dimension of 3.33 meters. It is assumed that all panel sizes are identical; therefore, 7 060 224 panels are required in the rectenna. There are four different types of panels, corresponding to the four different types of receiving arrays. Although the dipoles and the diodes are identical for all panels, the combining-matching-filtering cir- cuits and the diode wiring are of four types. These panel types are illus- trated schematically in figure 111-58.
Units are combined from panels in such a manner that nominally 1000 panels are in one unit and the N-S dimension of a unit is always 32 x 3.662 = 117.18 meters. The number of panel rows in the N-S plane is always 32, which allows a standardization of the unit layouts to a minimum of 7 types. The N-S dimension of the units is standardized to 117.18 meters every- where within the rectenna, and only the E-W dimension of the units varies from ring to ring (ref. 42). The wiring layout for the seven unit types is shown in figure 111-59.
15 1
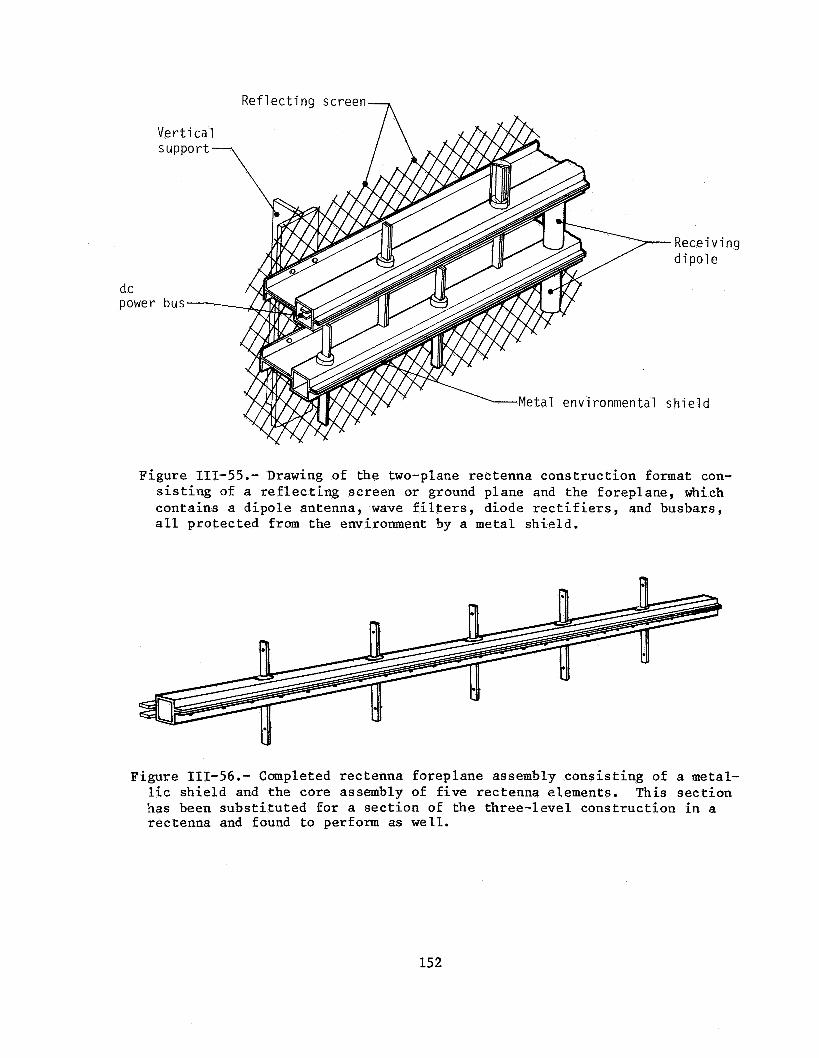
Ref 1 ec t i ng screen -
dc power
- Rece i v dipole
shield
i ng
Figure 111-55 .- Drawing of the two-plane rectenna cons t ruc t ion format con- s i s t i n g of a r e f l e c t i n g screen or ground plane and the foreplane, which contains a d ipo le antenna, wave f i l t e r s , diode r e c t i f i e r s , and busbars, all protec ted from the environment by a metal sh ie ld .
Figure 111-56.- Completed rectenna foreplane assembly cons i s t ing of a metal- l i c sh i e ld and the core assembly of f i v e rectenna elements. This s ec t ion has been s u b s t i t u t e d f o r a sec t ion of t he three- leve l cons t ruc t ion i n a rectenna and found t o p e r f o m as w e l l .
152

50
45
40
35
30
S? 2 5 2 L
20
15
10
5
0
r B = 5859 m
I N u l o = 7 5 2 r 1
R inq N , , U 1 518 2 7 16 3 9 0 8 4 588 5 776
- N U 9 = 704 6 82 0 7 800 8 6 8 8 9 704
752 7 2 7 0
_I
5 10 15
Put kW 2016 2010 149 7
9 9 8 9 76
1001 49 7 50 5 502 348
py, MW 1 0 4 4 1439 1359
5 8 7 757 82 1 3 9 2 3 4 7 3 53 262
7 3 6 7
20
d w r
25 30 35 40
= 4687.2 m Y B
Figure 111-57.- Geometrical layout of unit boundaries i n the rectenna. (Within each of the 10 r ings of u n i t s , d i f f e r e n t un i t power l e v e l s are used.) Symbols are as follows: ?+, = number of u n i t s , Pu = un i t power, PT = t o t a l power, rg = boresight rad ius , and wr = r i n g width (117 .18 meters).
153

N- S t
43 . ... 1 2 0
P- - Type 1 (For rings 1 t o 3)
**.:.-.I 2 1
?- 22&
-Type 3 (for rings 8 atid 9 )
3 l L - Type 2 (for rings 4 to 7)
I Type 4 (for r ing 10) 1 5
Figure 111-58.- Wiring layout of the four d i f f e r e n t panel designs used i n the rectenna.
154

Ring 1
1 , Z . . . 2 7
Type 1 2 Type 2 ( f o r r i n g 1) . ( f o r r i n g
4 -
32
1 , 2 . . . 3 2 1, 2 . . . 30 Type 3 2
( f o r r i n g 3) . 4 - 4 -
32 32
1 , Z . . . 2 5 1 , 2 . . . 31 1 , 2 . . . 4 0 Type 4 2
( f o r r i n g 4) , Type 5 2
( f o r r i n g 5) . Type 6 2 ( f o r r i n g 6 ) .
4 -
32
4 -
32
4 -
32
1 , 2 . . . 25 1 , 2 . . . 3 2 1 , 2 . . . 4 0 Type 4 2 Type 2 2 Type 6 2
( f o r r i n g 7 ) . ( f o r r i n g 8) . ( f o r r i n g 9) .
32 32 32
1 , 2 . . . 3 5 Type 7 2
( f o r r i n g 10)
32
Figure III-59.- Wiring layout of t h e seven d i f f e r e n t u n i t designs used i n t h e rectenna f o r t h e low-voltage conf igura t ion .
155

The last assembly formed at dc is called a "group" as illus- trated in figure 111-60. This assembly brings the power output into the 5- to 10-megawatt range. To keep the voltage levels relatively low, groups are formed from the units by parallel connections only. brought to the group centers, where the dc-to-ac inverters are located, by relatively long transmission lines that are connected in parallel at the group centers. Alternating-current (ac) processing begins with 40-megawatt dc-to-ac inverter blocks. These blocks receive their inputs from several dc groups.
Unit outputs are
Layout for the rectenna ac system depends on the location and the power levels of the dc/ac converters as well as on the needs of the bulk power transmission system. The 40-megawatt converter station output is trans- mitted by underground cable to a 200-megawatt transformer station, where the voltage is increased to 230 kilovolts, then collected in 1000-megawatt groups and transformed to 500 kilovolts for interface with the bulk transmission sys- tem. The selection of the voltage level for the ultimate bulk power transmis- sion interface with the utility grid, as well as the possibility of intercon- necting two or more of the 1000-megawatt switching stations, should be optimized on the basis of detailed information about the connecting utility system.
Availability calculations for the reference rectenna design show that 80 percent of the rated satellite power is available 96.8 percent of the time and that scheduled no-power periods total only 208 hours per year. To define the requirements for a given specific situation, load flow and system stability studies are required. It is likely, however, that the SPS power system would be far more stable than a conventional powerplant of the same rating and, consequently, that the transmission distances could be increased for a given line loading without need for as much series compensa- tion as in conventional powerplants.
a. Scattering and Radiofrequency Interference
The microwave transmission link must meet a stringent stan- dard of electromagnetic cleanliness which states that out-of-band power must be more than 150 decibels down from the link power. There are enough scatter- ing mechanisms for producing diode rectifier harmonics to make achievement of this requirement questionable. Some of the approaches to reducing reradia- tion are summarized in the Raytheon data of table 111-18.
In the reference design, two low-pass filter sections which attenuate the second and higher order harmonics by more than 25 decibels iso- late the rectifier. More filter sections add approximately 14 decibels more suppression, each at a cost of approximately 1 percent efficiency loss. Other alternatives, also with an efficiency penalty, are to use stubline filters or full-wave rectification. All these approaches have mechanical configuration problems that, although solvable, will increase rectenna diode array assembly cost. Given these difficulties, it may become necessary to seek SPS-assigned bands at the first few harmonic frequencies.
156
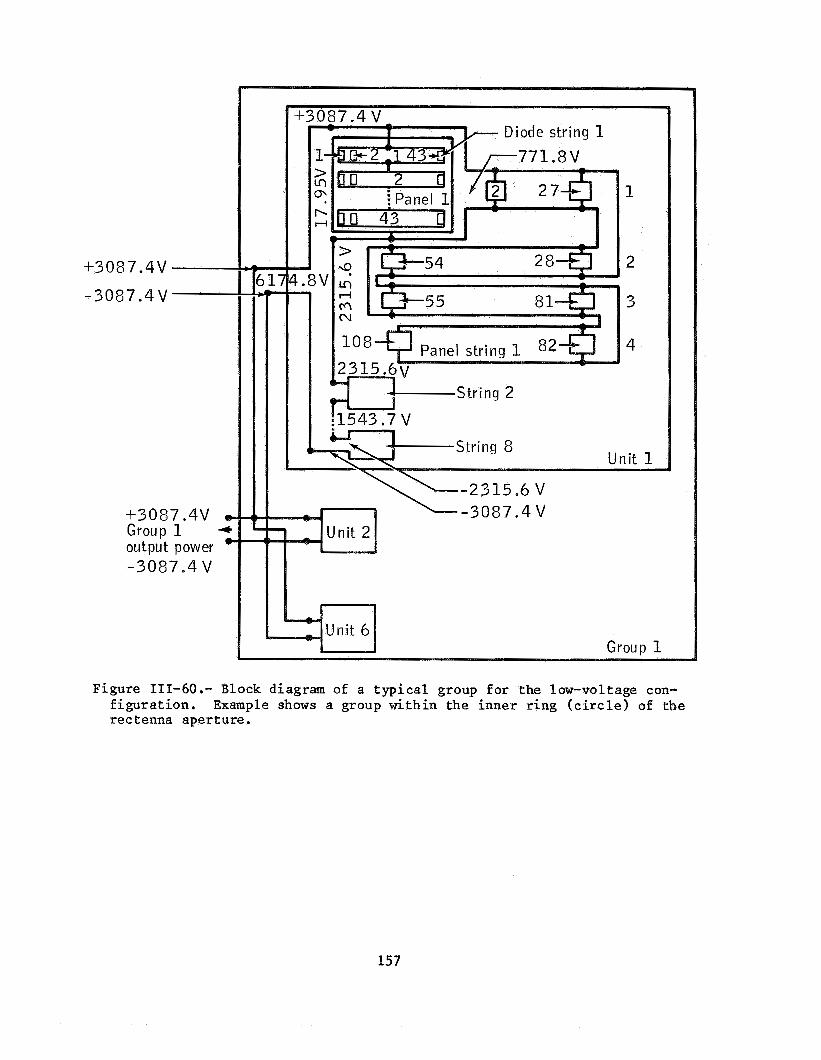
+308 7.4V
-3087.4V
+3087.4V e Group 1 * o u t p u t power 0
-3087.4 V
087.4 V w h D i o d e s t r i n g 1
1
> Q
S t r i n g 2
\--2315.6 V l - 3 0 8 7 . 4 V
Groux, 1
Figure 111-60.- Block diagram of a t y p i c a l group f o r the low-voltage con- f igu ra t ion . rec tenna aperture .
Example shows a group within the inner r ing ( c i r c l e ) of the
157
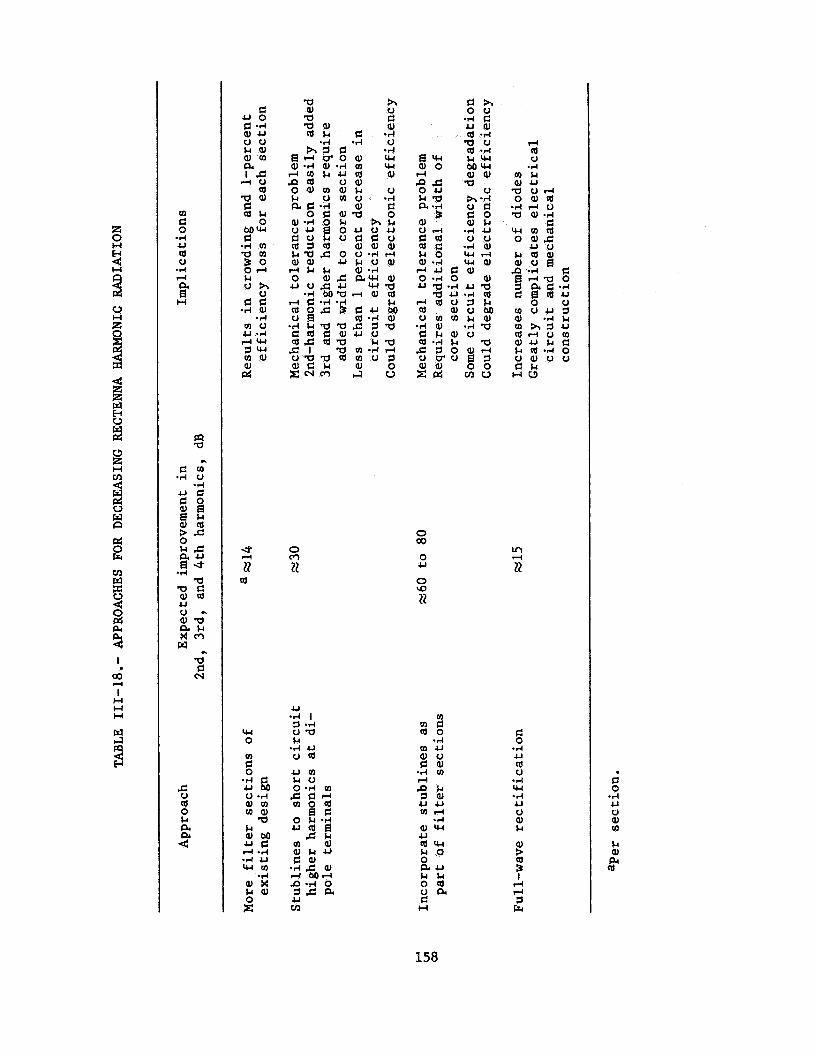
m
g *rl U a 0
.rl l-l a H a
a G e4
%
4
a 0 k a
0 m 72
U .rl I 1 .rl o a $4 .d u o a u m k o 0.4 m F C l - l m o a 0 e.2 u a a m C ?J a J k U 6 8 *d s a, l-l Mr l 0 . d 0 3C a U rn
0 cx)
0 U
0 \o 22
m m a cdo .rl
m u Q I o
l-l .2 : n h 1a, u u m r l
.rl a , w U a w $40 0 aU k k o a o a c H
l-l a U
.rl
m 4
22
.d U a 0
.rl W .rl U o a, k
rl 1 F
d 0
.rl U 0 a, m h a, pc a
158

Another type of scattering which affects system design is Fresnel edge diffraction from the rectenna panel edges. of panels can reduce these losses but will increase total panel area and cost. The expected capture loss and resultant efficiency loss is estimated at be- tween l and 2 percent.
A slight overlapping
b. Rectenna System Optimization
Optimization of a rectenna system design to minimize costs can be performed at several levels (ref. 42) . It is desirable from the cost per unit power standpoint to transmit as much power through the transmission link as the ionospheric medium and beam pattern constraints will allow. The rectenna should be sized so that the incremental rate of return from sales of the intercepted power is marginal.
Much of the cost of the rectenna is in the material re- quired to support the structure against wind and snow loads. Different types of rectenna panels have been considered. The reference design is in- termediate between the inexpensive but high-load flat panels and the more expensive, low-load panels, which have circuit topology problems. The cur- rent rectenna panel support structure evolved from stiff edge-supported panels to a more centrally supported frame as illustrated in figures 111-55 and 111-61.
c. Rectenna Construction
Construction of the rectenna is, by necessity, highly au- tomated. Starting with prefabricated dipole assembly components, a dipole machine manufactures completed dipole/diode assemblies at a high rate. These assemblies are combined with other prefabricated parts to manufac- ture receiving-element sticks. The sticks, the metal frame, and the ground plane are then tackwelded together to form panels.
The completed panels are taken to the rectenna site, where specialized equipment prepares the site through the emplacement of panel sup- port arches. The panels are then lowered on the support arches, fastened, and connected electrically. There must, of necessity, be some rather conven- tional construction operations at the rectenna for the grid power system and the pilot-beam transmitters, but these constitute only a small fraction of the construction cost.
d. Direct-Current Power Combining
In the rectenna, numerous rectifier circuits share a com- mon dc load to achieve useful power levels (ref. 4 3 ) . The rectifier outputs can be combined in series and/or parallel to enhance the voltage and/or current level, respectively.
A fundamental question in this receiving, rectification,
The incident power density can vary by 10 decibels over the and power-combining process is caused by the power taper of the incident mi- crowave beam. rectenna area, since a high percentage of the transmitted microwave power
159

H o r i z o n t a l
\ /
B Figure III-61.- Rectenna rf baseline.
160

needs to be collected. Since the output (dc terminal) characteristics of the rectifier are power dependent, rectifiers at different power levels that share a common dc load cannot be operated at optimum conditions. vidual rectifiers operating near 90 percent maximum efficiency, the resultant efficiency degradation could be significant. The efficiency degradation that results when an array of microwave power rectifiers shares a common dc load has been assessed as described in the following paragraphs.
With indi-
To evaluate the power-combining inefficiency , an accurate output-equivalent circuit model of the conversion circuitry is needed. This model was obtained using two independent approaches. First, an approximate closed-form circuit model of the rectifier was developed assuming an ideal diode and lossless circuit elements. Then, the output loadline was obtained analytically. Second, a more precise computer simulation model was used, and the output-equivalent circuit was obtained by varying the dc load resistance and plotting the resultant output loadline.
When using these models and various assumed power density variations, it was found that parallel combining is marginally better than series combining and that the closed-form analytical model results in only slight underestimation of the power-combining inefficiency compared to the computer simulation results. Assuming a uniform power density distribution, the power-combining inefficiency is 1.0 percent when the ratio of maximum to minimum power density is 2.0 to 1.0. The inefficiency is reduced to 0.3 per- cent if the ratio is 1.4 to 1.0. This result has an important effect on the design of the rectenna dc power-combining network; ring combining rather than row combining is favored, particularly near the rectenna edge.
e. Measured Rectenna Array Performance
High-efficiency (greater than 50 percent) rectenna array characteristics were demonstrated by Raytheon and JPL for the condition of highest collection-conversion efficiency performance associated with a labora- tory demonstration of overall system end-to-end dc transfer efficiency (ref. 21). The array consisted of 199 half-wave gallium arsenide Schottky barrier diodes connected to half-wave dipoles through a two-section low-pass filter projecting through a flat solid ground plane. The elements were arranged in a triangular lattice the outline configuration of which was a hexagon. The collecting area per element was about 52 square centimeters. flux density ranged downward from 203 mW/cm2 in a Gaussian distribution over the aperture of the array (a 19-decibel taper); dc load collection consisted of 21 separate concentric rings of adjustable resistances tailored to the ring radius. ured an on-axis VSWR of about 1.11 to 1 under matched conditions.
The incident
A one-tenth-wavelength dipole probe in front of the array meas-
The peak collection-conversion efficiency of an individual element was measured as 87 k 1.5 percent, whereas the average efficiency of the entire array at approximately 0.5 kilowatt output dc power was 82.7 per- cent of the available rf power incident on the array (not counting the esti- mated 4 percent spillover energy). less than 2 percent for a 16.7-percent decrease in rf input power level.
The array transfer efficiency decreased
16 1

A larger rectenna array tested at Goldstone, California, consisted of 4590 elements arranged in 17 subarrays of 270 elements each arranged in a triangular grid pattern. The subarrays were grouped in a three-column arrangement with the top-center subarray absent. The measured performance was, in general, accurately predicted from general transmission- line ref lection-coeff icient theory with regard to the load variations, and the polarization and angle-of-incidence performance followed array theory. Computer models for the diode and associated rf circuitry produced predic- tions of the element performance as a function of the input rf amplitude; however, the array performance was poorer than predicted, in most cases by a few percent. This difference may be due to the effect of array mutual coupling, which is not modeled in a single-element analysis. Nevertheless, over a 10-decibel range of input power density, the rectenna array perform- ance may be adequately predicted within a few percent, on the basis of measured diode assembly characteristics.
f. Lightning Protection
The large size of the SPS rectenna and the very high light- ning flash density in many parts of the United States will require the incor- poration of a lightning protection system within the rectenna design (ref. 4 4 ) . Individually, the microwave diodes are self-protecting with respect to average" lightning and those near the center of the rectenna are safe from extreme lightning. However, the series connection of the diodes to form high-voltage strings creates a protection requirement for the string. Stan- dard surge-protection practices will satisfy this requirement.
I t
A distributed lightning protection system concept studied by Rice University will protect the rectenna components from direct light- ning strike damage and will, in addition, provide reduced induced-lightning effects in the power and control circuits. This system could be incorporated as a structural member of the rectenna support system. Such a concept would add little, if any, additional materials to the rectenna and thus would mini- mize cost for lightning protection. Electric power industries usually at- tribute 10 percent of the cost of power transmission equipment to lightning protection requirements.
It is felt that the efficiency reduction in the rectenna due to the lightning protection system could be quite small. opinion has not been quantified and demonstrated.
However, this
2. ALTERNATE CONCEPTS
The reference system described previously is based on a de- sign concept that has been proved capable of the high conversion efficiency required for SPS application. nable to mass production techniques, but the projected costs are quite high and environmental protection requirements have not been completely evaluated in terms of cost or efficiency degradation. cepts have been considered to some degree and their evaluation should be continued.
Some concepts advanced appear to be quite ame-
Therefore, several other con-
162

a. Medium-Gain Elements
Medium-gain antenna elements with a gain on the order of 10 decibels could reduce the parts count of rectenna elements significantly. The pointing loss would not be drastically reduced nor would installation difficulty be increased severely. Consideration of this type of antenna as a competitor against the reference configuration should be continued.
( 1 ) Dipole arrays - The reference system includes dipole arrays for the rectenna outer areas, where the power density is low. This measure is required to produce a power level at the rectifier which can be converted efficiently to dc. If this technique can be shown to be cost ef- fective (i. e. , maintaining an acceptable efficiency while reducing the fab- rication cost), it should be extended to the higher power regions of the rec tenna.
(2 ) Yagi elements - Since the transmitted rf power is linearly polarized, a yagi antenna is a good candidate for a medium-gain ele- ment. Compared to individual dipoles, yagis would lower the parts count of both antenna elements and rectifiers. Conceptually, yagi fabrication could be accomplished rather simply. However, it remains to be shown that a yagi rectenna can maintain the required efficiency and, if so, the extent of reduc- tion in parts count and cost. An attractive possibility for the yagi imple- mentation is the elimination of the "ground plane screen," which contributes considerable design problems because of wind loading, icing, and snow accumu- lation. Experimental verification would be required to determine the parts- count reduction, efficiency level, and leakage for a yagi system with no ground screen.
( 3 ) to assess the possibility of implementing the reference concept in stripline. Stripline is usually a good candidate for high-volume, low-cost fabrication. The required harmonic filter, however, reduces the potential efficiency by 2 to 4 percent when implemented in stripline. The potential cost savings were estimated to be very small, if any, and not nearly enough to offset the effi- ciency loss.
Stripline implementation - An analysis was performed
b. High-Gain Elements
High-gain antenna elements have two distinct disadvantages: active cooling of the rectifier and pointing of the element. (This is not to say that the reference system and others do not have their own shortcomings.) Considerable research is in order to establish the crossover point in life- time cost between high-count, simple low-gain elements and lower count, more complex high-gain elements,
c. Hogline Elements
The hogline concept (an infinitely wide variation of the familiar "hog horn" antenna) has been given only preliminary evaluation to date. This design consists of a parabolic cylinder reflector which concen- trates the incident rf energy into a relatively narrow receiving area. In
163

its ideal form, the rf energy could be received by a linear "feed" but would probably use a line of high-power dipole-diode rectennas. situation would, in effect, produce a receiving antenna with a very broad pattern in the horizontal plane (essentially equal to a dipole over a ground plane) and a relatively narrow pattern in.the vertical plane. In actuality, an array of dipoles (or equivalent elements) would be used in the vertical plane to match the incident waves. This concept requires a singularly curved reflecting surface as opposed to the flat reflecting surface of the refer- ence configuration. This configuration also requires very accurate pointing of the large reflector during initial installation and possibly "pointing correction" during the lifetime of the rectenna.
This ideal
The large reflector-type rectenna has unique requirements relative to the reference design. However, the lifetime cost of this type of antenna has not been adequately investigated to the point at which an intelligent trade-off can be made against the reference system. Effort should be expended to determine whether there is an advantage to this con- cept; i.e. , smaller "parts count" with its implied increase in installation complexity and possibly operational complexity.
d. Waveguide Techniques
Waveguide techniques are included in the SPS transmitting system, and the projected efficiency is 96 percent. This value is somewhat lower than the efficiency represented by the estimated 1- to 2-percent l o s s in the dipole itself. compatible with environmental protection. Some degree of harmonic suppres- sion is also inherent in the waveguide antenna tecnnique. Wind-loading and support requirements appear to be substantial. The basic concept is worthy of consideration; however, material requirements and their cost impact can be expected to be very substantial.
However, waveguide techniques are quite versatile and
e. Offshore Rectenna
An offshore rectenna evaluation has been conducted. It has been established that such a rectenna is technically feasible; however, the economic feasibility has not been confirmed. patible with an offshore rectenna for several reasons. Thus, a rectenna de- sign concept must be developed in conjunction with economic evaluation of an offshore rectenna. .
The reference design is not com-
F. SOLID-STATE CONFIGURATIONS
The current SPS configuration has high-power klystron tubes for the dc to rf power converters in the antenna. A possible alternative is to re- place the klystrons with low-power solid-state devices. The major advantage of solid-state devices is the increased reliability over tubes; a disadvan- tage is lower conversion efficiency.
Solid-state microwave transmission concepts are considerably dif- ferent from the current NASA/DOE reference system. mitter will have a lower power density of microwave energy in the center of
The solid-state trans-
164

the space antenna because of temperature l i m i t a t i o n s . The t ransmi t t ing an- tenna w i l l be l a r g e r than 1 ki lometer i n diameter i n order t o t ransmit sev- e r a l gigawatts of power; consequently, the rectenna w i l l be smaller i n area. I f the l i m i t a t i o n of 23 mW/cm2 f o r power dens i ty through the ionosphere must be maintained, improved techniques f o r beam shaping may be considered t o poss ib ly y i e l d a f l a t t e r peak of microwave energy received a t the rectenna.
Two so l id - s t a t e designs have been proposed and have been s tudied i n some d e t a i l . The f i r s t system is a simple replacement of the re ference k lys t ron antenna w i t h a so l id - s t a t e antenna. The second conf igura t ion i s a "sandwich" concept i n which the so l id - s t a t e ampl i f i e r s and s o l a r cells are combined; t h a t i s , t he back su r face i s covered with GaAs s o l a r c e l l s opera- t i ng under a high concentrat ion r a t i o , whereas the f r o n t s i d e (toward the Earth) i s a conventional microwave antenna. ro r s is used to maintain sun l igh t on t h e back of t he microwave elements ( i . e . , the s o l a r c e l l s ) while t he microwave a r r ay i s cont inua l ly pointed toward the Earth. The proposed advantage of the sandwich concept is e l i m - i n a t i o n of the low-voltage dc processing; the s o l a r c e l l outputs are fed d i r e c t l y i n t o the s o l i d - s t a t e r f devices.
A complex arrangement of m i r -
Both of these concepts are charac te r ized by l a rge r antennas (be- cause of thermal l i m i t a t i o n s ) , smaller rectennas (because of the l a r g e r , higher ga in antennas) , and g r e a t e r s a t e l l i t e mass per k i lowat t of de l ivered power. They have the advantage of increased r e l i a b i l i t y and thus lower sat- e l l i t e maintenance problems and c o s t s . Disadvantages include increased phase cont ro l system complexity compared t o the conventional k lys t ron anten- na, low-voltage (higher l o s s ) dc power d i s t r i b u t i o n f o r the separa te antenna configurat ion, and increased noise generat ion.
1. CONCLUSIONS
A s a r e s u l t of the program s tud ie s and experiments on so l id- s ta te devices , s eve ra l conclusions have been reached.
a. Sol id-s ta te SPS concepts have not had the same depth of sys- t e m s d e f i n i t i o n as t h e re ference concept; however, p r e l i m i - nary r e s u l t s i n d i c a t e the following.
The system s i z i n g parameters are optimized such t h a t lower power i s del ivered t o the u t i l i t y g r id .
The t ransmi t antenna is l a r g e r pr imar i ly because of the thermal l imi t a t ions .
The rectenna land requirement i s smaller.
Weight per de l ivered k i lowa t t i s projected t o be more.
Maintenance c o s t p ro j ec t ions are less because of the h igher r e l i a b i l i t y .
165

b. Type of power amplifier - Based on studies to date, the GaAs FET is the preferred solid-state power amplifier.
c. Antenna unit costs - Solid-state antennas will have high parts count similar to the solar array; therefore, unit costs are critical.
d. Mitigating designs - Conceptual designs have to some degree mitigated the issues of thermal and low-voltage power dis- tr ibu t ion.
e. Items of concern - Techniques of phase distribution (possibly to more points on the array) and power distribu- tion (i. e. , on the end-mounted configuration, more dc-to- dc converters are required) are major items of concern in the solid-state concept.
f. Technology - Associated technology development is more likely for solid state because of the advancing technology base.
2. REMAINING ISSUES
Based on current findings, continued investigation of solid- Remaining issues include the fol- state concepts and issues is warranted.
lowing.
a. Efficiency (>80 - percent)
b. Operating temperature
c. Low-voltage distribution
d. Harmonic noise suppression
e. Power combining
f. Subarray size
g. Monolithic technology
h. Lifetime
i. Mutual coupling
j. Amplifier gain and power output
k. Input-to-output isolation
1. Charged-particle and ultraviolet radiation effects
m. Reliability/ temperature trade-offs
166
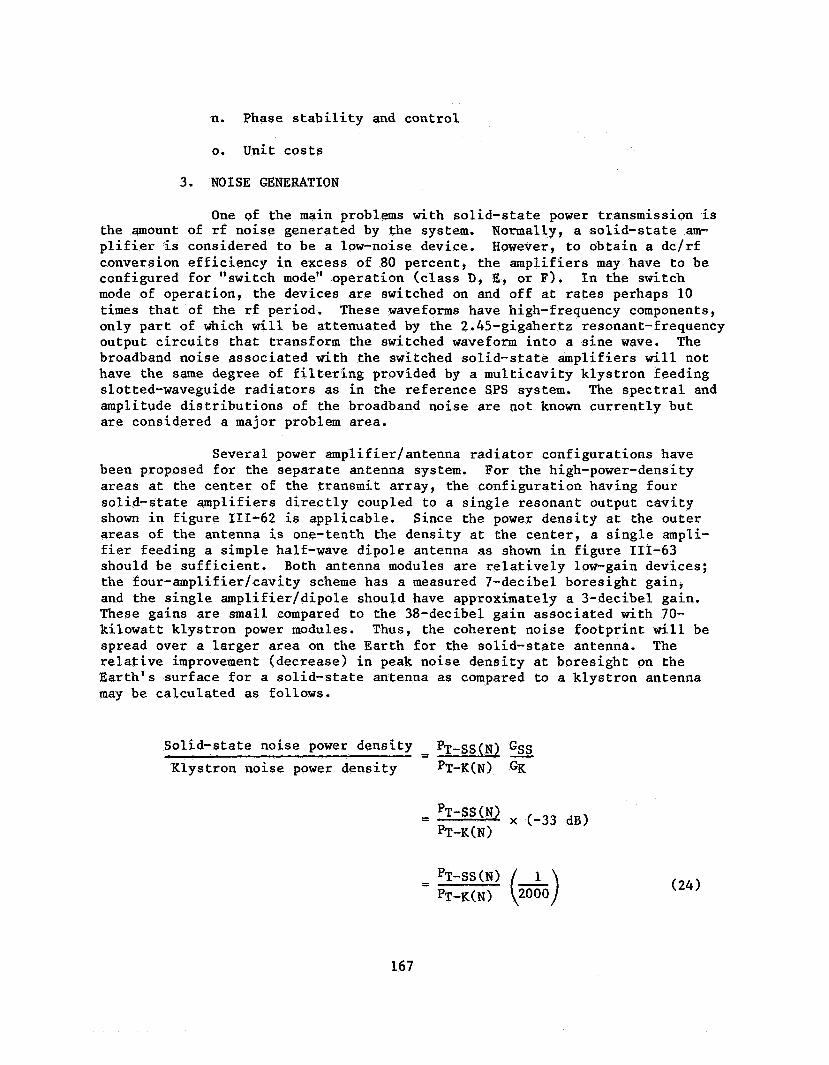
n. Phase stability and control
0. Unit costs
3. NOISE GENERATION
One of the main problems with solid-state power transmission is the amount of rf noise generated by the system. Normally, a solid-state am- plifier is considered to be a low-noise device. However, to obtain a dc/rf conversion efficiency in excess of 80 percent, the amplifiers may have to be configured for "switch mode" operation (class D, E, or F). mode of operation, the devices are switched on and off at rates perhaps 10 times that of the rf period. only part of which will be attenuated by the 2.45-gigahertz resonant-frequency output circuits that transform the switched waveform into a sine wave. The broadband noise associated with the switched solid-state amplifiers will not have the same degree of filtering provided by a multicavity klystron feeding slotted-waveguide radiators as in the reference SPS system. The spectral and amplitude distributions of the broadband noise are not known currently but are considered a major problem area.
In the switch
These waveforms have high-frequency components,
Several power amplifier/antenna radiator configurations have been proposed for the separate antenna system. For the high-power-density areas at the center of the transmit array, the configuration having four solid-state amplifiers directly coupled to a single resonant output cavity shown in figure 111-62 is applicable. Since the power density at the outer areas of the antenna is one-tenth the density at the center, a single ampli- fier feeding a simple half-wave dipole antenna as shown in figure 111-63 should be sufficient. Both antenna modules are relatively low-gain devices; the four-amplifierlcavity scheme has a measured 7-decibel boresight gain, and the single amplifier/dipole should have approximately a 3-decibel gain. These gains are small compared to the 38-decibel gain associated with 70- kilowatt klystron power modules. Thus, the coherent noise footprint will be spread over a larger area on the Earth for the solid-state antenna. The relative improvement (decrease) in peak noise density at boresight on the Earth's surface for a solid-state antenna as compared to a klystron antenna may be calculated as follows.
Solid-state noise power density PT+s(N) G s = Klystron noise power density PT-K(N) GK
167

/Metalized ground plane
/ Mi crostri p an tennalpower combiner (outside view) , /
I I I
Metalized radiating
Metalized border
Metalized antenna exci ti ng el emen t
1 substrate
Cutouts for feed- l ine entries
I I / /
( a ) Breakaway view.
Antenna ground plane \ /Slotline field- Substrate dielectr ic
0 - Radi a t i ng element Antenna exciter
(cavity side)
Radiating s l o t -Antenna ground pl
(b) E l e c t r i c - f i e l d p r o f i l e .
ane
Figure 111-62.- Power-combining mic ros t r ip s l o t l i n e antenna.
168
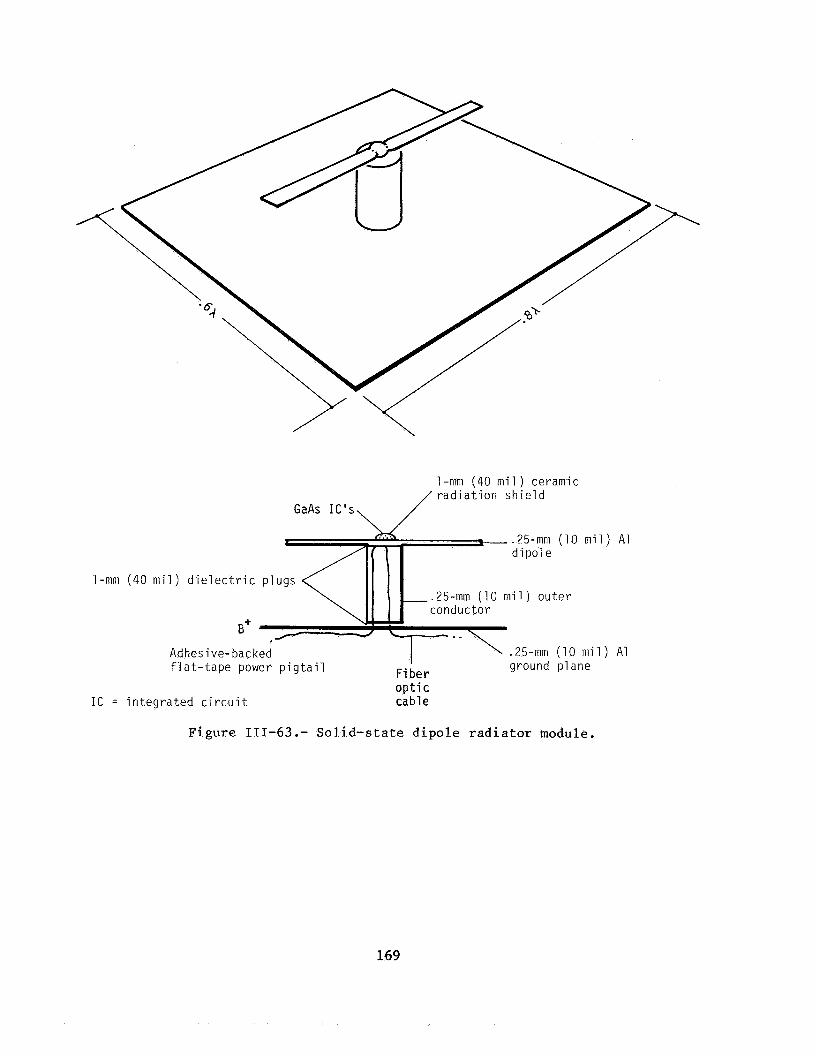
l - m m (40 mil ) ceramic rad ia t ion sh ie ld
.25-mm (10 mil) A1 d ipole
l-mm (40 mi l ) d i e l e c t r i c plugs .25-mm (10 mi l ) ou ter
B+ Adhesive-backed .25-mm (10 mi l ) A1 f l a t - t a p e power p i g t a i l ground plane
F i b e r o p t i c
IC = in tegra ted c i r c u i t cable
Figure III-63.- Solid-state dipole radiator module.
169

where PT-ss(~) = transmitted noise power from a solid-state antenna
PT-K(N) = transmitted noise power from a klystron antenna
GS s = antenna gain of an average solid-state power module (5 decibels)
= antenna gain of an average klystron power module (38 decibels)
GK
Thus, for equal transmitted noise power from the two antennas, the solid-state system will have one two-thousandth (-33 decibels) the peak noise density of the klystron system at the ground rectenna but the total noise power will be spread over a much larger area. As a reference for com- parison, the expected noise spectral density at the ground from a 5-gigawatt, l-kilometer klystron antenna system is shown in figure 111-8. state antenna system must have similar characteristics to meet the CCIR (In- ternational Radio Consultative Committee) and radio astronomy requirements. Filtering of the noise and signal harmonics will be required in each of the solid-state power devices, both for the separate antenna system and the sand- wich configuration.
The solid-
4. SEPARATE ANTENNA SYSTEM
The current configuration for the separate solid-state antenna system is an end-mounted array having a diameter of 1.42 kilometers as shown in figure 111-64 (ref. 45). in the antenna is approximately 4.3 gigawatts and results in 2.5 gigawatts at the output of the ground rectenna. This larger antenna, lower power (1.42 kilometers, 2.5 gigawatts) system is sized differently from the reference klystron system (1 kilometer, 5 gigawatts) because of thermal considerations in the solid-state antenna.
The dc power delivered to the solid-state devices
The overall efficiency for the separate antenna system from the dc power output of the solar array to the collected dc power output of the rectenna is given in figure 111-65. The chain includes a 0.975 efficiency for operating the solar cell strings at reduced power levels compared to the maximum point on the voltage/current ( V / I ) curve. This solar array mismatch must be considered when operating at lower voltages compatible with the solid-state amplifiers.
The 10-step 10-decibel baseline SPS Gaussian taper has been
4 adapted to the solid-state transmitting antenna. The peak rf power densit in the center of the array is limited to 5.5 kW/m2 (as compared to 23 kW/m for the reference klystron antenna) because of thermal limitations. Assum- ing a single device power output of 7.5 watts, 11 devices per needed to provide the 5.5 kW/m2. vices is needed to achieve this peak power density.
X2 are Low-loss rf combining of individual de-
The Boeing Aerospace Company has developed a low-loss four- amplifier power combiner which feeds two half-wavelength slotline antennas coupled together by way of an aluminum cavity structure. The efficiency of
170

7- 5340 m
_L
T 1.42 km
1 t 7342.5 m --j
Figure 111-64.- 2.5-gigawatt solid-state SPS configuration.
17 1
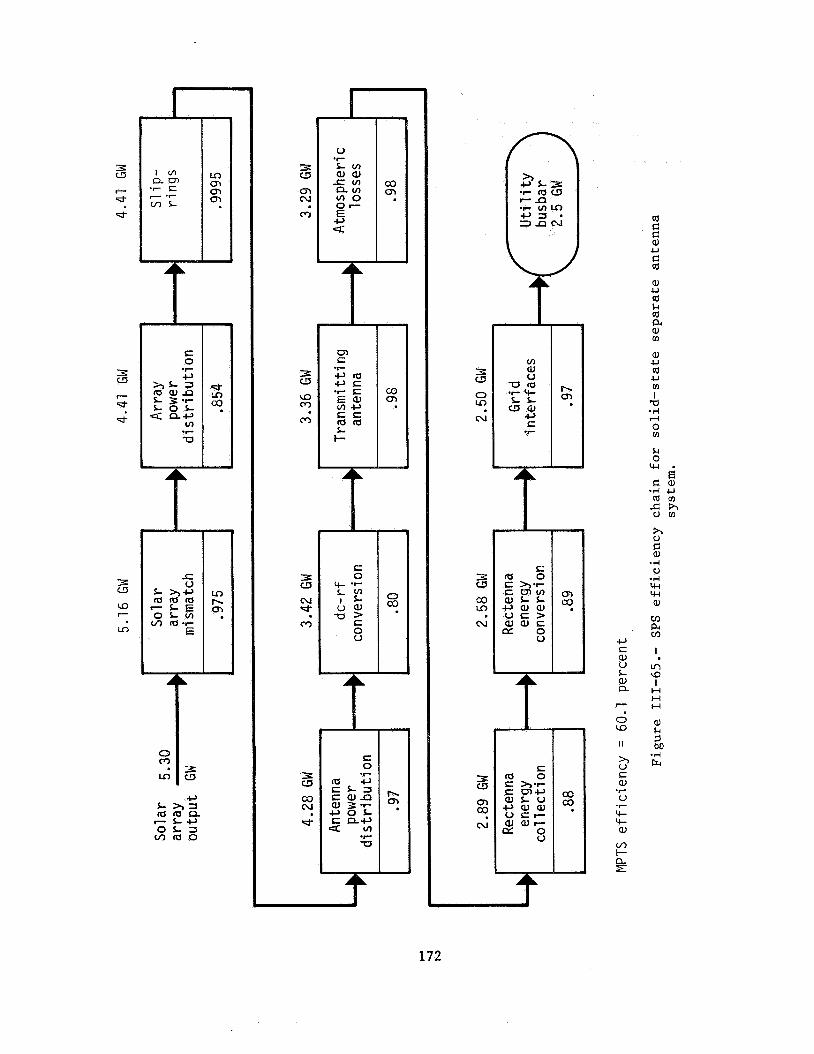
U
172

the power-combining antenna as fed with four silicon bipolar transistor am- plifiers yielding 0.5 watt output has recently been measured by Boeing to be approximately 100 percent; i.e., no discernible loss as limited by their measurement capability. However, the efficiency chain in figure 111-65 pro- vides a 2-percent loss for rf power combining. Additional measurements in- dicate a 7.0-decibel antenna gain with close-in side lobes 22 decibels down. The four power,amplifiers yield a gain of 8.2 decibels each and a relative insertion phase error of +lo at an output power level of 132 milliwatts each. Figure 111-62 contains several views of the power-combining microstrip antenna.
Within the 10-step antenna taper, there are 5 different types of rf power modules (high-power, 4-FET cavity radiator; reduced-power, 4-FET cavity radiator; 2-FET cavity radiator; 2-FET dipole; and 1-FET dipole). At the center is the previously discussed high-power, four-FET cavity radiator, which provides 5.5 kW/m2 power density. Near the periphery of the antenna, the lower power per unit area allows the use of simple, less massive dipole radiator modules as shown in figure 111-63. The mass per unit area of these devices is approximately 30 percent of that of the cavity radiators in the center of the antenna.
The radiation pattern for the 10-decibel Gaussian taper, 1.42- kilometer array with specified error parameters of (5 = loo rms phase error, 21 percent amplitude error, and 2 percent random failures is shown in figure 111-66. The peak power densities are 22.5 mW/cm2 at the rectenna boresight, 1.0 mW/cm2 at the edge of the rectenna, and 0.08 mW/cm2 for the first side lobe. A 6.8-kilometer-diameter rectenna is needed to receive 88 percent of the transmitted energy from the satellite. Thus, the larger solid-state antenna enables reduction of the rectenna area to 46 percent of the reference 10-ki 1 ometer-di amet er rec tenna area.
Mechanically, the antenna consists of 10.4- by 10.4-meter subarrays made up of solid-state rf amplifier modules. These subarrays are supported by a pentahedral truss structure, Which is relatively simple to con- struct and provides good access for maintenance equipment. The current con- cept has 64 solid-state combiner modules as the basic layout panel as shown in figure 111-67. 20 736 modules as shown in figure 111-68.
The 10.4- by 10.4-meter subarray has 324 panels containing
The phase control system is the same as for the reference klystron SPS antenna in that the active, retrodirective array has a pilot- beam reference for forming a single coherent beam at the ground rectenna. Each subarray has four phasing receivers which process the uplink pilot-beam reference to provide phase conjugation. There are 58 112 phase control re- ceivers, one for each 5- by 5-meter subsection of the subarray (ref. 12). The phase conjugated signal is distributed from each receiver by way of a closed-loop distribution system to the panel level. The phase information is then distributed amplifier. Details the amplifiers have for the solid-state reference antenna.
over a microstrip feedline to each solid-state combiner/ of the phase distribution system from the receiver to not been studied. In general, the phase control system antenna is more complex than for the high-power klystron This complexity results from the need for distributing
173

10
1
.1
.01
.001
4
0 2 4 6
Distance from rectenna center, k m
8 10
Figure 111-66.- Microwave power density as a function of distance from rectenna boresight for the 2.5-gigawatt, 1.42-kilometer antenna diameter. solid-state system.
174

Figure 111-67 .- 64-module panel layout .
175

F i g u r e III-68.- S u b a r r a y a s s e m b l y ( 3 2 4 p a n e l s , 20 736 m o d u l e s ) .
176

phase information to many thousands of solid-state devices rather than to a single tube.
One of the fundamental problems with solid-state devices is the low operating voltage that must be distributed throughout the antenna. methods of delivering this voltage have been investigated as part of the over- all system studies (refs. 46 and 47).
Four
a. High dc voltage ( 4 4 kilovolts) with dc/dc converters within the antenna
b. High ac voltage (100 kilovolts) with dc/ac converters in the solar array and ac/dc converters in the antenna
c. Low dc voltage (5.5 kilovolts) with no converters
d. Moderate dc voltage (8.6 kilovolts) with no converters
Two parameters, mass and I2R losses, determine the relative merits of the four voltage-distribution techniques. A comparison of the performances of these techniques with that of the reference klystron SPS configuration is shown in table 111-19. watts of dc power out of the rectenna.
Each system has been normalized to provide 2.5 giga-
The results indicate that the moderate dc voltage (8.6 kilo-
The reference klystron configura- volts) system with no dc/dc processing has the best performance of the four solid-state power-distribution schemes. tion has the best overall performance, as would be expected.
The total satellite weight with the solid-state microwave an- tenna and the 8.6-kilovolt dc voltage-distribution system is 3505 tonnes heavier (12.5 percent) than the klystron system normalized to provide 2.5 gigawatts output power. However, the klystron system is being penalized by operating at one-half its power capability, particularly with regard to electricity costs (mills per kilowatthour). An interesting point from a preliminary costing analysis is that the "sandwich" concept was developed to eliminate the dc power-distribution system and thus reduce satellite weight. The "sandwich" system optimizes to an output power of approximately 1.15 gigawatts. In comparing the two solid-state approaches, the cost pen- alty incurred by reducing the output power to 1.15 gigawatts for the sand- wich concept may have a greater economic impact than accepting the power- distribution weight penalty (and associated cost increase) in the separate solid-state antenna system.
5. SANDWICH SYSTEM
A number of "sandwich" concepts have been investigated (refs. 48 and 491, with the major alternative configurations summarized in figure 111-69. The one currently favored, because of less overall volume and best control features, is similar to concept 5 (fig. 111-69(e)), although with only two transmitting antennas. This approach is based on rigid coupling of two
177
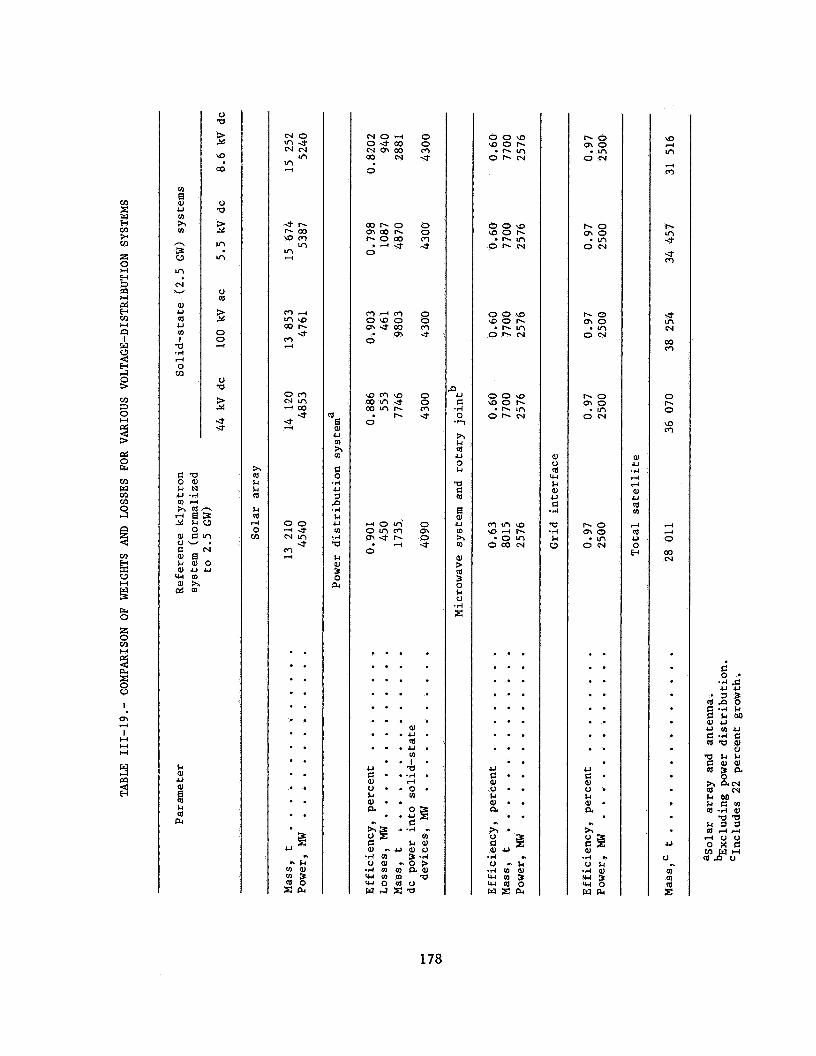
0 a 3 Y
W
W
0 a
%, !n
!n
u m
%, 0 0 4
0 a 3 a * 4
h m I,
m I, m 4 0 v)
m.4 ! n W W b * m 4
00
* :;; m 4
. . . . . . . . . . - . . . . . . . . . . . . . . .
a d aJ U m 4 g
.rl u 7
-rl I, u v)
.rl a I, a,
P4
n
b
0 3 w N m w W N
0
W m W w ! n * w ! n P I . b 0
4 0 !n’ o l n m
0 ? * P I
4
. . . . . . . . . . . . . . . . . .
0 0 m *
0 0 m *
0 0 m *
0 0 m *
0 m 0 *
01 . . .u . m . . . u . v) . * I .
c1 a c . . . A . aJ d 0 . - 0 . I, rn 0 . . - *
2B v, n C
C I,aJ w - u a J v
*rl v) 3 .rl 0 a J ..o> .rl m v) a @ w n v ) a w o m 0 w l - l x a
00- W O P I .b!n
O P I N
O O W
O W N ?Xs;
00-
O P I N ‘92%
m l n m d . 4 G . o m
O W N
. . . . . . . . . . . . . . . . . . . . . . . . . .
.rl n 0 -Ll
aJ 0 m W I, 0) u C
.I4
a .rl I, CY
b o m o .!n
O N
PI0 m o .!n
O N
. . . . . . . . . . . . . . . . u
0 . I, a . a
$ -
..
a, u .rl 4 l-4 0, u m v)
d m u 0 w
W 4 m
m 4
PI m -j.
23;
* !n N
W m
0 PI 0
W m
w .4 0
W N
u 0 .. m m
2
178

I a, rl a .I4 u . 4 u 3 a E : .. g
: t !
m u u r d a c c u o c u r d
n a,
W
\ h k
\ . b k 0 0 u u
n P v
\ h $4
n rd
W
.I4 3 a
v) 1 a, u m L) m I a
.rl 4
%
a, 3
.rl U m
a, u E
I. o\ a
I H H H
aJ k 5 M
n v
W
179

concept 2 antennas to enable sharing a common location in geosynchronous orbit (fig. 111-70).
The baseline single-antenna concept is also an important con- sideration when designing the overall sandwich concepts in the determination of the amplitude taper across the array. Unlike the reference concept, in which very high power klystron sources (870 kilowatts) a ing taper is a natural feature, the main objectives in state sandwich are to have as large a number of identical components as pos- sible and to minimize the size of the satellite. A comparison of a 10- decibel (Gaussian) and 0-decibel (uniform) taper is thus in order. For the latter, all amplifiers carry the same power level, and the spacetenna diam- eter is a minimum for a given beam width. As a first-order comparison, the salient features of a typical 0-decibel sandwich and a 10-decibel tapered sandwich are shown in table 111-20. in this study summary, but the chart is for comparison purposes only.) The 10-decibel taper system has a smaller rectenna but higher electricity costs because of higher satellite costs. In conclusion, the sandwich configura- tion is not compatible with a tapered antenna. In table 111-21, the char- acteristics of a standard GaAs-based sandwich are compared with those of a multibandgap cell alternative.
used and a slop- case of a solid-
(Multibandgap solar cells are assumed
a. Sandwich Concept
The GaAs sandwich concept has the nominal characteristics described in table 111-22 with an effective concentration ratio of 5.2. The preliminary efficiency chain of the sandwich is summarized in figure 111-71. Several factors such as summer solstice, seasonal variation, and reflector reflectivity degradation are not included; these factors may reduce the available power from 1.15 gigawatts to 0.92 gigawatt at the grid interface. Analyses into these effects are underway. It should be noted that higher amplifier base temperatures (398 K (125O C)) are required in the sandwich concept because the amplifiers in the sandwich are relatively small (5 to 6 watts) and are cooled by their own beryllium oxide radiator disks, which radiate heat in only one direction.
b. Design Considerations
The solid-state arrays are subdivided into square subar- rays of 5 by 5 meters each. This subarray size is sufficiently small to keep the grating-lobe peaks to less than 0.01 mW/cm2 under worst case anten- na tilts as shown in figure 111-72. This limitation implies a mechanical antenna-attitude-control accuracy of 22' of arc, or a total swing of 4' of arc. It is expected that the major-axis fluctuations can be controlled to this accuracy using conventional star sensor and Earth-edge sensor plus iner- tial attitude control systems, with ion thrusters providing the required im- pulses. The associated microwave scattered power loss is 10 megawatts as shown in figure 111-73 for an antenna tilt of 2 arc-minutes and a random subarray tilt of 3 arc-minutes.
All amplifiers within the 5- by 5-meter subarray are con- trolled together; i.e., they are fed in phase. A diagrammatic view from the
180
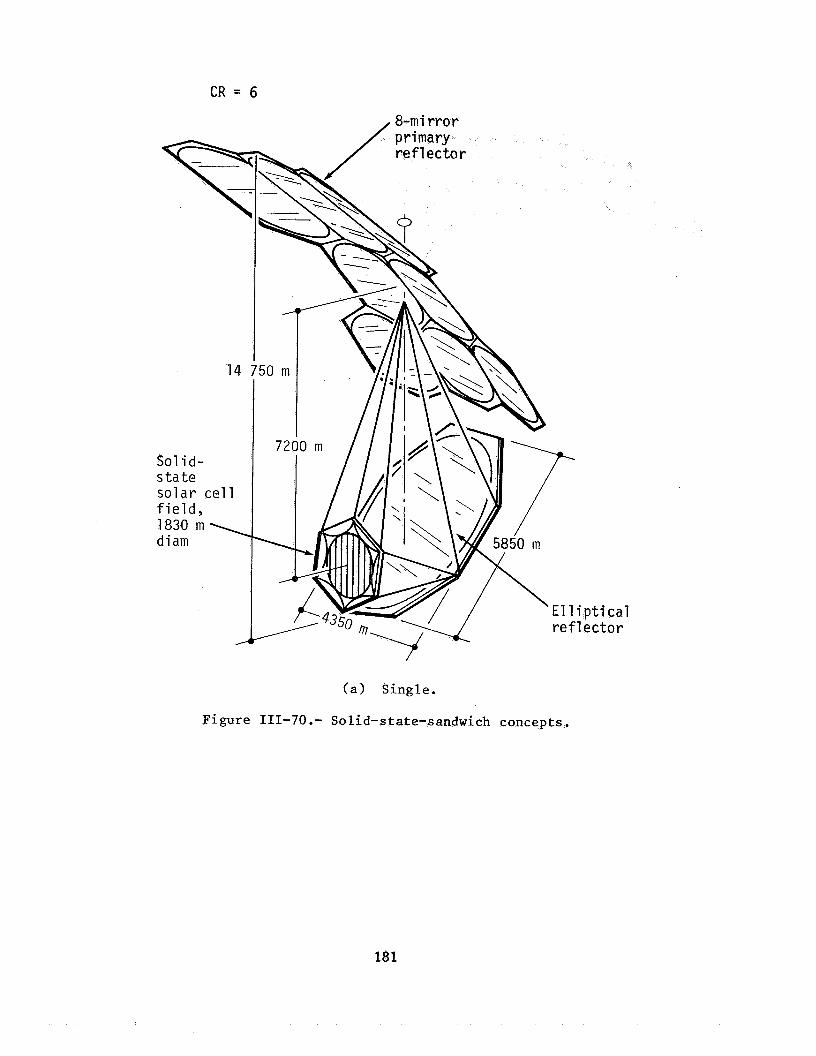
CR = 6
14
Sol id- s t a t e solar cell f i e ld , 1830 m \ diam
(a> Single.
p t i cal ector
Figure 111-70.- Solid-state-sandwich concepts.
181
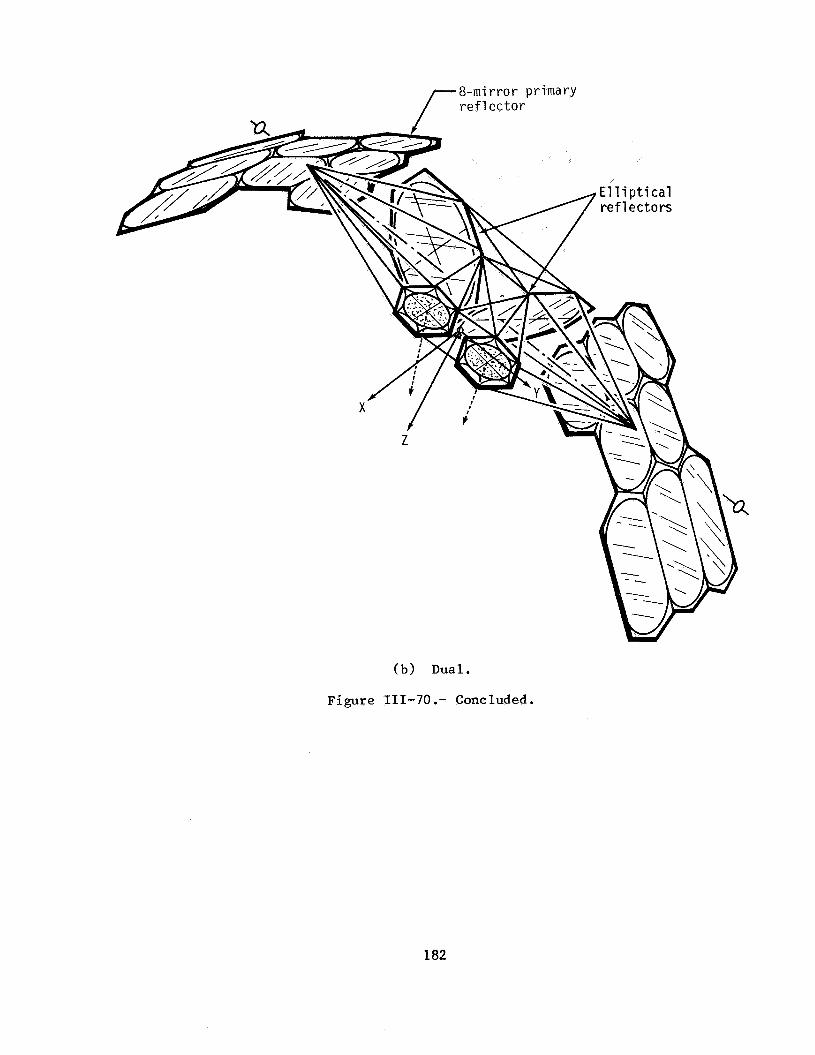
(b) Dual.
Figure 111-70 .- Concluded.
182
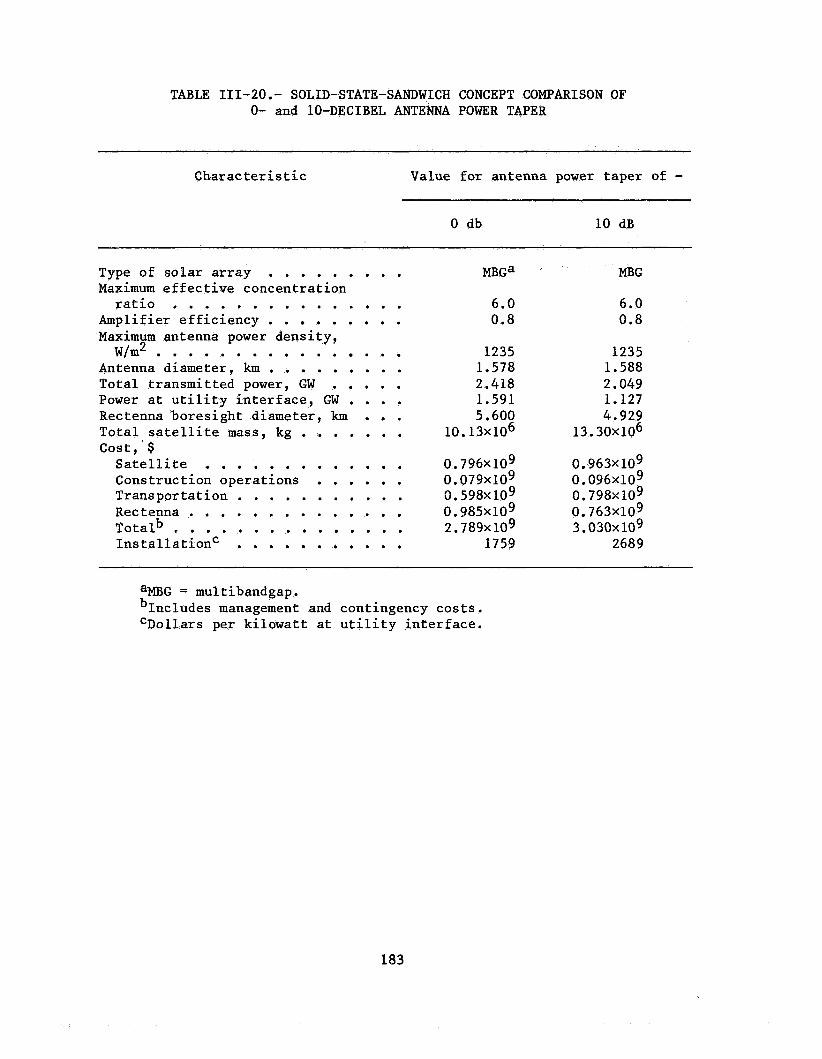
TABLE II1-20.- SOLID-STATE-SANDWICH CONCEPT COMPARISON OF 0- and 10-DECIBEL ANTENNA POWER TAPER
Character is tic Value for antenna power taper of -
0 db 10 dB
Type of solar array . . . . . . . . . Maximum effective concentration ratio . . . . . . . . . . . . . . .
Amplifier efficiency . . . . . . . . Maximum antenna power density,
Antenna diameter, km . . . . . . . . . Total transmitted power, GW . , . . . Power at utility interface, GW . . . . Rectenna boresight diameter, km . . . Total satellite mass, kg . . . , . . . Satellite . . . . . , . . . . . . . Construction operations . . . . . . Transportation . . . . . . . . . . . Rectenna . . . . . . . . . . . . . . Totalb.. . . . . . . . . . . . . InstallationC . . . . . . . . . . .
W/m2 . . . . . . . . . . . . . . .
cost, $
6.0 0.8
1235 1.578 2,418 1.591 5.600
10.13~ lo6
0.796~10~ 0.079~10~ 0.598~ 109 0.985~10~ 2.789~ lo9
1759
MJ3G
6.0 0.8
1235 1.588 2.049 1.127 4.929
13.30~10~
0.963~10~ 0.096~10~ 0.798~10~ 0.763~109 3.030~ 109
2689
aMEG = multibandgap. bIncludes management and contingency costs. CDollars per kilowatt at utility interface.
183
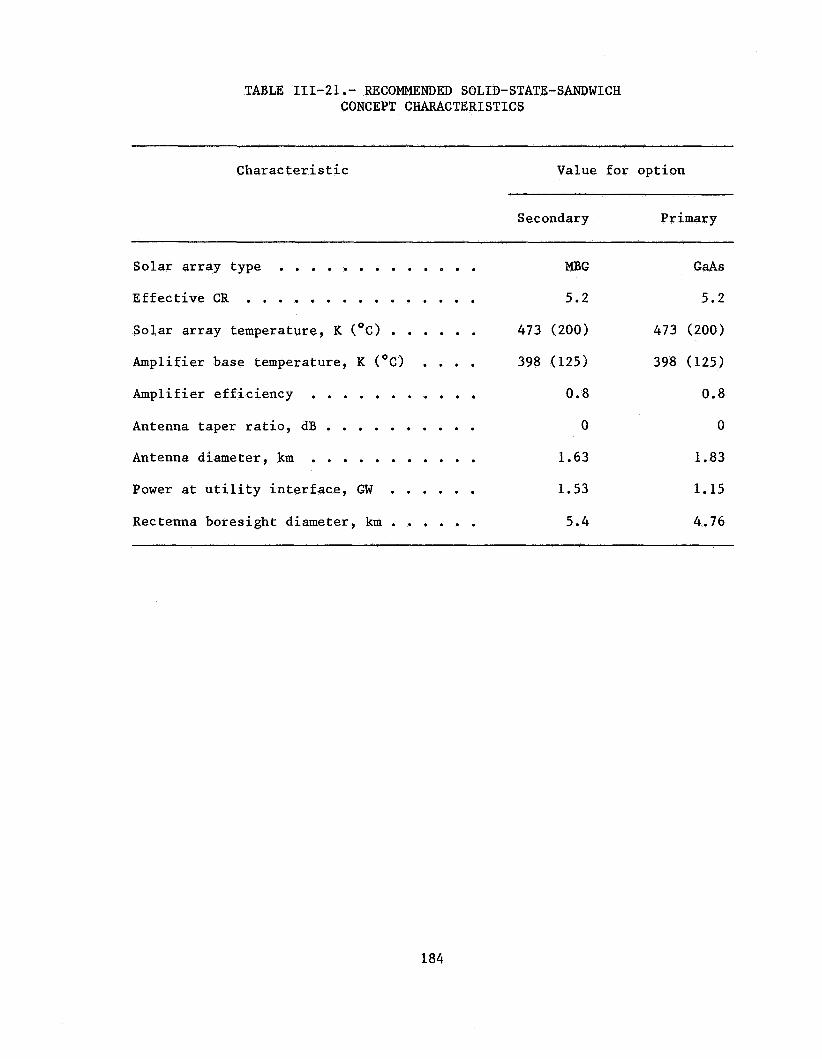
TABLE 111-2 1. - RECOMMENDED SOLID-STATE-SANDWICH CONCEPT CHARACTERISTICS
Characteristic Value for option
S ec ondar y Primary
Solar array type . . . . . . . . . . . . . MBG GaAs
Effective CR . . . . . . . . . . . . . . . 5.2 5.2
Solar array temperature, K ("c) . . . . . . 473 (200) 473 (200)
Amplifier base temperature, K ("C) . . . . 398 (125) 398 (125)
Amplifier efficiency . . . . . . . . . . . 0.8 0.8
Antenna taper ratio, dB . . . . . . . . . . 0 0
Antenna diameter, km . . . . . . . . . . . 1.63
Power at utility interface, GW . . . . . . 1.53
1.83
1.15
Rectenna boresight diameter, km . . . . . . 5.4 4.76
184
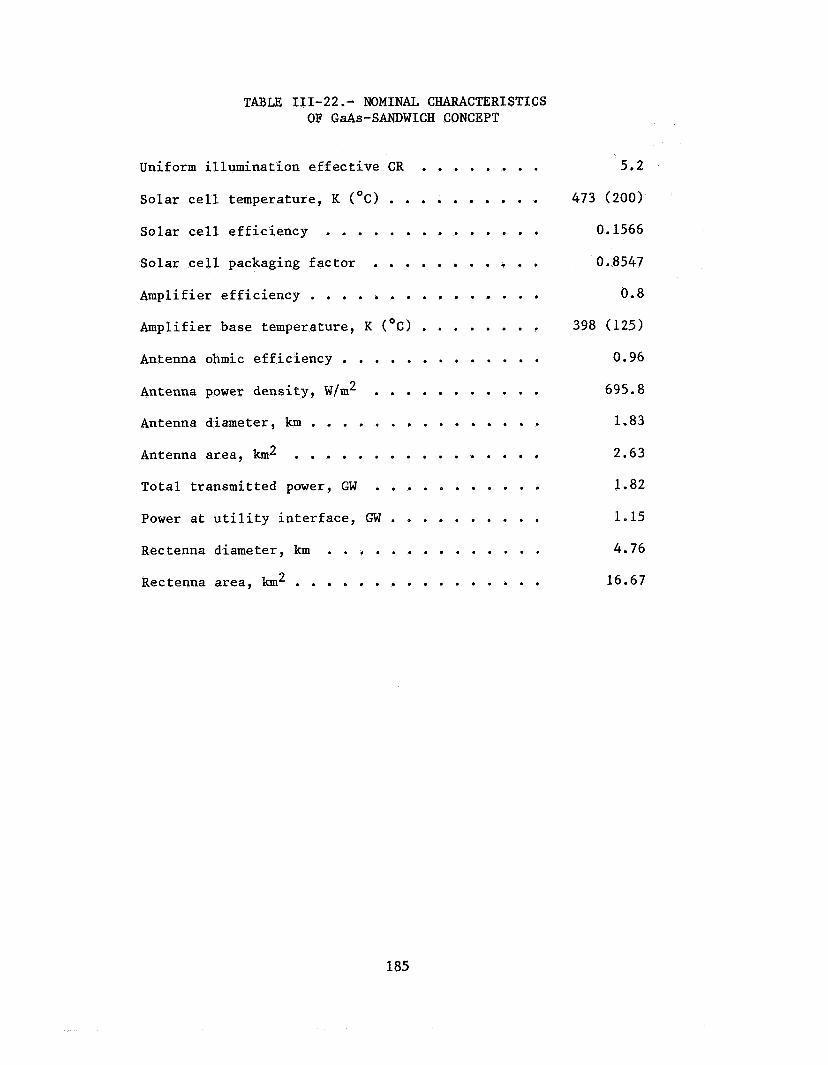
TABLE 111-22 .. NOMINAL CHARACTERISTICS OF Gas-SANDWICH CONCEPT
Uniform illumination effective CR . . . . . . . . Solar cell temperature. K ("c) . . . . . . . . . . Solar cell efficiency . . . . . . . . . . . . . . Solar cell packaging factor . . . . . . . . . . . Amplifier efficiency . . . . . . . . . . . . . . . Amplifier base temperature. K ("C)
Antenna ohmic efficiency . . . . . . . . . . . . . Antenna power density. W/m2 . . . . . . . . . . .
Antenna area. km2 . . . . . . . . . . . . . . . .
. . . . . . . .
Antenna diameter. km . . . . . . . . . . . . . . .
Total transmitted power. GW . . . . . . . . . . . Power at utility interface. GW . . . . . . . . . . Rectenna diameter. km . . . . . . . . . . . . . . Rectenna area. km2 . . . . . . . . . . . . . . . .
5.2
473 (200)
0.1566
0.8547
0.8
398 (125)
0.96
695.8
1.83
2.63
1.82
1.15
4.76
16.67
185

AM0 = a i r mass zero
Equivalent so la r energy inc ident upon so la r c e l l s (excludes surnner so l s t i ce and seasonal var iat ions)
Solar c e l l e f f i c i ency
473 K (ZOOo C)
E f f e c t i ve concentration
r a t i o a t AM0
5.2 ,1566
dc - r f Array Photovoltaic Antenna package array power power fac to r ’ d i s t r i b u t i o n b d i s t r i b u t i o n ’
.8547 .99 .99 .8
b conversion
- +
100
Noise Transmitting Atmospheric rf-dc Grid Rectenna energy in te r faces f i l t e r i n g _+ antenna + losses - c o l l e c t i o n 4 conversion .-+
- .96 .98 .98 .75 .89 * 97
10-1
+
E N
Q 2 a 5 10-3 E a U
10-
r Grating lobe 1 (878 km)
Grating lobe 2 (1766 kni) Gratiiiq lobe 3 ( 2 6 5 3 kin)
Londitions: 1.77-knl-diam antenna 5-ni subarray 1.6 GW traiismit power U nifor 111 i I Itiniina t i on
loo phase error 2 1- per cent a 1111) I i tci d e j i t t er 2-percent failure rate N o subarray t i l t
I I I I I I I I I I I I I I I I 0 1 2 3 4 5 6 7 8
Antenna tilt, arc-niin
Figure 111-72.- E f fec t s of antenna tilt on power dens i ty at the f i r s t t h ree g ra t ing lobes.
186

30 - Conditions: 1.77-ktn-diam antenna 10" phase error
1.6 GW t ransmi t power 5-m subarray 2-percent failure rate - Power scattered with
21-percent amplitude j i t ter
Uniform i l l u m i n a t i o n 2 arc-min antenna tilt 25 - Scattered power = (1-6 GW) x (collection efFiciency at 10 250 m i=
I with 0 arc-min tilt minus the efficiency with subarray tilt included) 6 20
5 -
a (u
m 15 -
L 0 .- E u E =: 10 - m 0
v,
- Power scattered with 0 arc-min antenna tilt
1 0 1 2 3 4 5 6 7 8
Subarray tilt, arc-min
Figure III-73.- Effec t s of subarray tilt on microwave sca t t e red power.
187
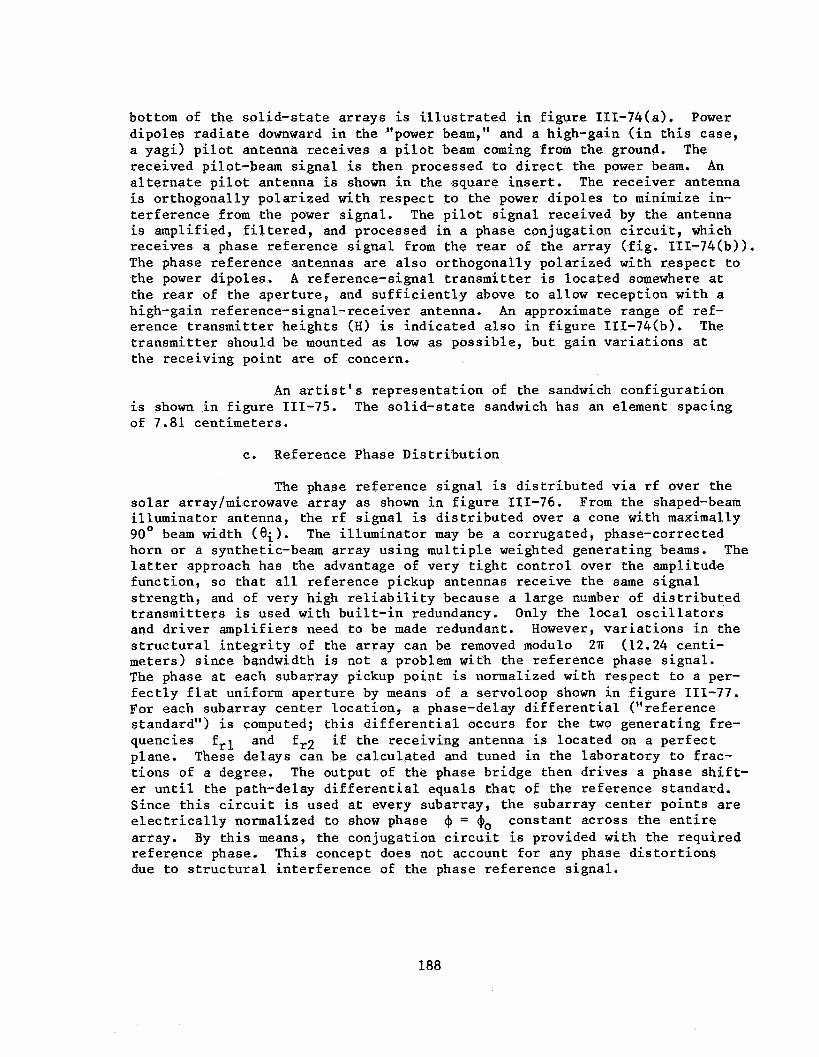
bottom of the so l id - s t a t e a r r ays i s i l l u s t r a t e d i n f i g u r e I I I -74(a) . Power dipoles r a d i a t e downward i n the "power beam," and a high-gain ( i n t h i s case, a yagi ) p i l o t antenna receives a p i l o t beam coming from the ground. received pilot-beam s igna l i s then processed t o d i r e c t the power beam. An a l t e r n a t e p i l o t antenna i s shown i n the square i n s e r t . The rece iver antenna is or thogonal ly polar ized with respec t t o the power d ipoles t o minimize in- t e r f e rence from the power s igna l . The p i l o t s i g n a l received by the antenna is amplif ied, f i l t e r e d , and processed i n a phase conjugation c i r c u i t , which rece ives a phase reference s i g n a l from the rear of the a r ray ( f i g . 111-74(b)). The phase re ference antennas are a l s o or thogonal ly polar ized with respec t to the power dipoles. A reference-signal t r ansmi t t e r i s located somewhere a t the rear of the aper ture , and s u f f i c i e n t l y above t o allow recept ion with a high-gain reference-signal-receiver antenna. An approximate range of ref- erence t r ansmi t t e r he ights (H) i s ind ica ted a l s o i n f i g u r e I I I -74(b) . The t r ansmi t t e r should be mounted as low as poss ib le , bu t ga in v a r i a t i o n s a t the receiving poin t are of concern.
The
An a r t i s t ' s r ep resen ta t ion of the sandwich conf igura t ion is shown i n f igu re 111-75. of 7.81 cent imeters .
The so l id - s t a t e sandwich has an element spacing
c. Reference Phase Di s t r ibu t ion
The phase re ference s igna l is d i s t r i b u t e d v i a r f over the s o l a r array/microwave ar ray as shown i n f i g u r e 111-76. From the shaped-beam i l luminator antenna, the r f s igna l i s d i s t r i b u t e d over a cone with maximally 90° beam width (e;). The i l lumina tor may be a corrugated, phase-corrected horn or a synthetic-beam ar ray using mul t ip l e weighted generat ing beams. l a t t e r approach has the advantage of very t i g h t cont ro l over the amplitude funct ion, so t h a t a l l re fe rence pickup antennas rece ive the same s i g n a l s t rength , and of very high r e l i a b i l i t y because a l a rge number of d i s t r i b u t e d t r ansmi t t e r s is used with b u i l t - i n redundancy. Only the l o c a l o s c i l l a t o r s and d r ive r ampl i f ie rs need t o be made redundant. However, v a r i a t i o n s i n the s t r u c t u r a l i n t e g r i t y of the a r ray can be removed modulo 2?T (12.24 cent i - meters) s ince bandwidth i s not a problem with the reference phase s ignal . The phase a t each subarray pickup point is normalized with respec t t o a per- f e c t l y f l a t uniform aper ture by means of a servoloop shown i n f i g u r e 111-77. For each subarray cen te r l oca t ion , a phase-delay d i f f e r e n t i a l ("reference standard") is computed; t h i s d i f f e r e n t i a l occurs fo r the two generat ing f re - quencies f r l and f r2 i f the receiving antenna i s located on a pe r fec t plane. These delays can be ca l cu la t ed and tuned i n the labora tory t o f rac- t i ons of a degree. The output of the phase br idge then dr ives a phase s h i f t - er u n t i l the path-delay d i f f e r e n t i a l equals t h a t of the reference standard. Since t h i s c i r c u i t is used a t every subarray, the subarray center po in ts are e l e c t r i c a l l y normalized t o show phase constant across the e n t i r e array. By t h i s means, the conjugation c i r c u i t is provided with the required re ference phase. This concept does not account f o r any phase d i s t o r t i o n s due t o s t r u c t u r a l i n t e r f e rence of the phase reference s igna l .
The
4 = $o
188

p i l o t antennas IIIII I I I I I
Pilot antenna
(a) Bottom.
f =
f = P
(b ) Top.
Figure III-74,- Spacetenna total view.
189

190
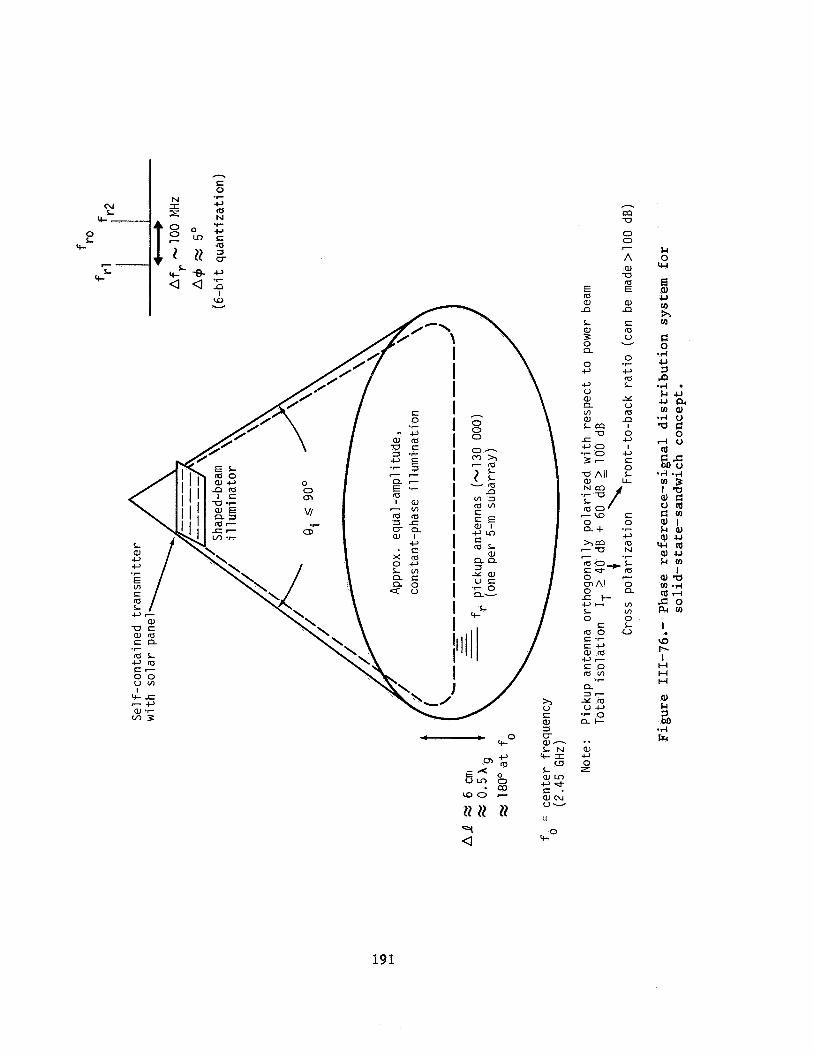
0 0 - A a, U
E 2 ro W W n n
Fc 0 w
8 u v)
m h
C 0
.I4 u 7 P .I4 . Fcu u a v)a
.I4 0 a c 0
4 0
I H H H
al
*. a, c, 0 z
191

v) I aJ
h
0 L aJ N
0 c,
c, 3
c, 2 0
a, m U L .7
L a, c, ce *I- C v)
L % o
o n
h
7
-e- -
0 c, V aJ c, aJ -0
aJ v) fci r n
'F
L
aJ v) ru r
n
n
a 0 0 d
rl 0 $4 U
0
d
8 M
.I4 m I al u
$4 al w
G
4 I. I- - I H H H
E 7 M
.I4 cr
7 ru V 0 7
I I
0
--I
192

I V . CRITICAL SUPPORTING INVESTIGATIONS
I n t h i s s ec t ion , t he a c t i v i t i e s accomplished i n seve ra l technology areas are summarized. velopment and Evaluat ion Program and involves ind iv idua l cont rac tua l e f f o r t s , genera l ly of less than $100 000 i n s i ze .
The work has been sponsored by the DOE/NASA SPS Concept De-
A.
has been and tes t
DESIGN AND BREADBOARD EVALUATION OF THE SPS REFERENCE PHASE CONTROL SYSTEM
Lockheed Engineering and Management Serv ices Company (LEMSCO), Inc. , under con t r ac t with JSC s ince February 1979 t o design, breadboard, elements of t he cu r ren t base l ine phase con t ro l system. The o v e r a l l
con t r ac tua l e f f o r t includes the following tasks .
1. Design, f a b r i c a t e , and t e s t breadboard elements of the master slave re tu rnab le timing system. This system i s basel ined as the reference phase d i s t r i b u t i o n technique f o r t h e SPS.
2. Design, f a b r i c a t e , and test breadboard power transponder u n i t s (without the k lys t ron power ampl i f i e r ) and the p i l o t s i g n a l t r ansmi t t e r (ground s t a t i o n u n i t ) .
3. I n t e g r a t e the MSRTS d i s t r i b u t i o n system with a t least two power transponder u n i t s and conduct end-to-end system performance evaluat ions.
4 . Evaluate high-power k lys t ron noise-reduction phase-lock-loop performance and e s t a b l i s h output phase noise c h a r a c t e r i s t i c s (us ing l -ki lowatt L-band k lys t ron obtained on surp lus from the NASA Goddard Space F l i g h t Center).
I n the following d iscuss ion , the accomplishments and cur ren t s t a t u s of t he LEMSCO e f f o r t are described. The MSRTS technique as descr ibed by Lindsey ( r e f . 28) i s proposed as a p o t e n t i a l method of accura te ly t rans- f e r r i n g phase from the re ference p i l o t rece iver a t the center of t he SPS microwave ar ray antenna t o each conjugation poin t (power tube) i n the SPS array. A small-scale breadboard of t h i s type of d i s t r i b u t i o n technique has been b u i l t and t e s t ed i n the JSC E lec t ron ic Systems T e s t Laboratory (ESTL). The r e s u l t s are summarized here . A s impl i f i ed func t iona l diagram of the MSRTS i s shown i n f i g u r e IV-1; i t s opera t ion i s described i n Sect ion III.B.2. I n the SPS appl ica t ion , t he choice of d i s t r i b u t i o n frequencies i s l imi t ed by the modulo ZIT phase ambiguity a t the slave node. This ambiguity i s mani- f e s t e d a t frequency 2w and corresponds t o a modulo phase ambiguity a t the a c t u a l d i s t r i b u t i o n frequency. Thus, the d i s t r i b u t i o n frequency must be an even submultiple of t he frequency des i red f o r phase conjugation t o e l i m - i n a t e the IT ambiguity ( i . e . , any even mul t ip l e of IT i s modulo 2IT; thus, no ambiguity e x i s t s ) . The cu r ren t SPS base l ine concept embodies a four- level phase d i s t r i b u t i o n tree using the MSRTS f o r phase t r a n s f e r accuracy. The reference-signal phase i s maintained throughout the system by us ing the s l ave s i g n a l a t each node of the tree as the master re ference f o r t ransmission t o the next node. Current ly , n ine MSRTS e l e c t r o n i c u n i t s have been f ab r i ca t ed .
193

a N
aJ 0 S 5 c, m
-0
r c, 5 Q
0 c,
aJ 3 -0
aJ (5, S 5 II U
aJ ln 5 c Q
II
*C
a
m S 0
w u S 3 rc aJ E c,
II
*r
.r
c, V
b n
h
c,
X v
n
A
c,
ln V
h /.-. c,
L V
a h
c,
aJ V
+J 3
+
w 0
a a,
.rl w .rl l-l sa *rl rn
I
1 4
?I
a, &I 7 M
.rl Fr,
194

Initial testing was accomplished on three units, and tests are in progress using a four-level (node) network involving five MSRTS units.
The MSRTS detailed circuitry at each node of the SPS, the system test configurations, and the test results are provided in reference 50. A typical test-configuration block diagram is shown in figure IV-2. Data were obtained by interchanging several cables of different (arbitrary) lengths for cables A and B shown in the figure. sulting phase errors between the final nodal point (third level) and the reference (source) are shown in figure IV-3. Because of the relatively small samples of cable combinations (30 possible combinations), a firm conclusion of phase error distribution is not possible. However, for the large numbers involved in the SPS (101 552 points), the error distribution is assumed to be Gaussian with little or no reservation. for this particular test. Several similar types of tests were conducted us- ing the MSRTS units in different tree configurations.
The statistical properties of the re-
The observed rms phase error was 4.2O
On the basis of these initial tests, it can be concluded that satis- factory MSRTS performance can be achieved using readily available components under these closely controlled laboratory-type conditions. However, it must be pointed out that this performance was achieved only after numerous circuit modifications were made to account for the nonideal behavior of these compo- nents. For example, port-to-port isolation specifications for the mixers and circulators used in the breadboard MSRTS units are on the order of 20 to 30 decibels. External balancing and leakage-cancellation circuits were re- quired (as discussed in ref. 50) to increase the effective isolation to ap- proximately 40 to 50 decibels to obtain the performance measured.
Further testing is required to determine feasibility of the MSRTS concept for practical applications such as the solar power satellite. For example, additional tests must be performed to determine sensitivity of var- ious MSRTS components to temperature variations and other environmental fac- tors. System tests integrating the MSRTS distribution system and power transponder units may uncover other potential problem areas.
The power transponder breadboard design is completed, and all parts have been procured. The completion of all testing is scheduled for the end of 1980. A functional block diagram of the pilot signal transmitter is shown in figure IV-4, and block diagrams of the pilot receivers (central and conjuga- ting) are shown in figures IV-5 and IV-6. It should be noted that the cen- tral pilot receiver is somewhat different in design since it must establish the initial reference signal for distribution by the MSRTS to the other pilot receiver/conjugation units. local reference is provided for the first and second local oscillators in the PN code-tracking branch of the central pilot receiver. In the pilot/ conjugation receivers, these local oscillator signals are derived from the phase reference distribution signal provided by the MSRTS distribution sys- tem. One further point of interest involves the phase-lock loop around the "simulated" power amplifier. uated using the l-kilowatt L-band klystron as the power amplifier shown in
This difference is seen mainly in that a stable
One of these units will be integrated and eval-
195
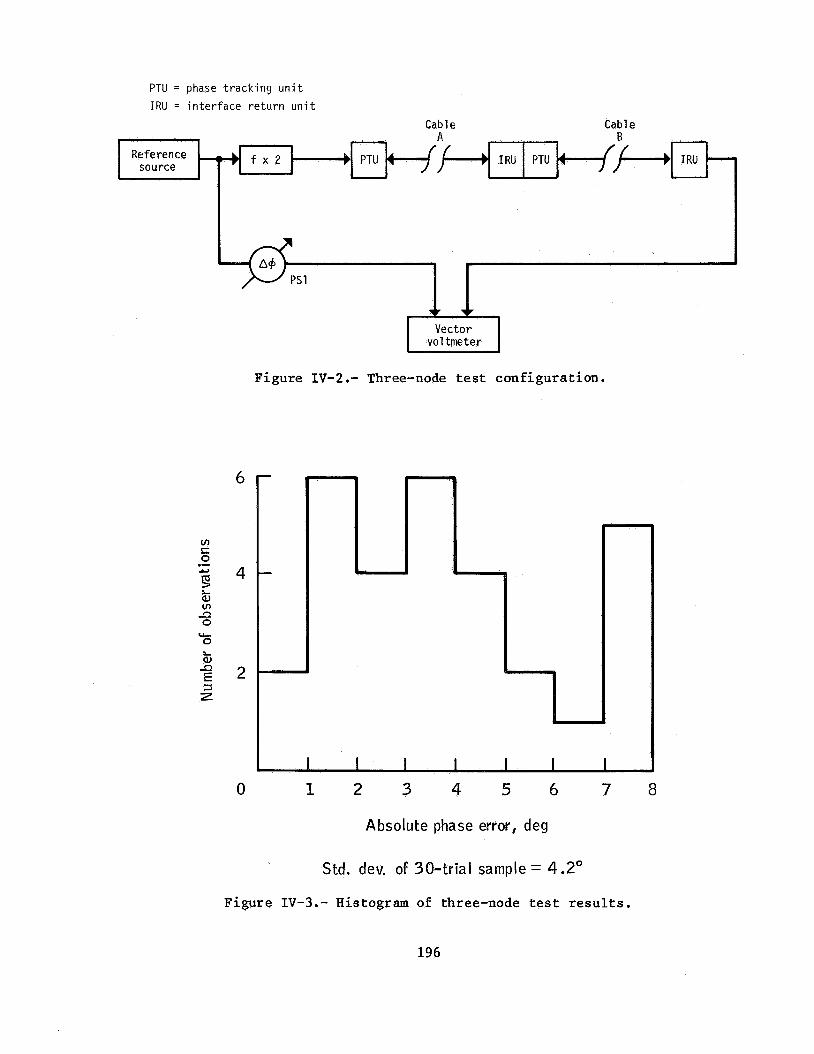
PTU = phase tracking unit IRU = interface return unit
Cable Cab1 e
Figure IV-2 .- Three-node t e s t configurat ion.
cn S 0 .- 3 L a, cn 0
0 CL-
?il 12 E 3 z
0 1 2 3 4 5 6 7 8
Absolute phase error, deg
Std. dev. of 30-trial sample = 4.2"
Figure IV-3 . - Histogram of three-node test r e s u l t s .
196

r - I I I I I I I I I I I 1
I I I I I I 1 I I I I I I I I I I I I I I I 1
rrJ
S d gl -4 0
" I 1 I 1 I I I I I I I I I I I I I 1
6 a k M a
.rl a
3 0 rl P k a, U u *A : 2 k u I u 0 rl .rl F4
I.
z ZJ
4 I
a, k
.rl F
197

--1 I I
d k bo (d .d a
d P k a, > .d a, 0 Q) k u 0 d .rl a d (d k u
V
I In I
8
z
198

I I I I I I
I-- I I I I I I I I I I
L-
I I I I I
I
I - 81 01 f l U I 61 & I 01 U I
I I
I I I I
Ql
0
I I
I I I I 1 I r-
I I
--1
"- a a
m N + - 4-
N - W F1 X
0 In P
lsl
5
B a
m 3 E
e' a t.r bo a .d a
3
d
0 rl P
k
.d 0) u 0) k
.d u a bo 3 c 0 u \ u 0 r( .d
.r)
I. \o
I R Q) k 3 40 .d k
199

the block diagram. Phase noise c h a r a c t e r i s t i c s with and without the phase- lock loop ac t iva t ed w i l l be obtained t o determine e f f ec t iveness of reducing low-frequency phase noise with phase-lock-loop techniques.
F ina l ly , a series of ove ra l l end-to-end system performance tests i s planned. These tests w i l l use the in t eg ra t ed MSRTS and p i l o t rece iver / conjugator u n i t s , together with the p i l o t t ransmi t te r . The tests are de- signed t o eva lua te the accuracy of the conjugated phases, e f f e c t s of random v a r i a t i o n s i n p i l o t t r ansmi t t e r t o p i l o t r ece ive r path lengths , system no i se e f f e c t s , e f f e c t s of power s i g n a l i n t e r f e rence , and simulated ionospheric d i s - turbance e f f e c t s . A t yp ica l system test conf igura t ion i s shown i n f i g u r e IV-7. I n t h i s conf igura t ion , ind iv idua l path lengths , s i g n a l l e v e l s , and/or o the r e f f e c t s can be i n j e c t e d i n t o the system under cont ro l led labora tory con- d i t i o n s and thus d e t a i l e d engineering eva lua t ion of system response can be performed. I f performance i s se r ious ly degraded i n c e r t a i n ins tances , poten- t i a l mi t iga t ing s t r a t e g i e s can be evaluated. The system-level tests are scheduled t o begin i n September 1980.
B. FIBER OPTICS L I N K ASSESSMENT
The Boeing Aerospace Company has been under con t r ac t t o JSC s ince December 1979 t o demonstrate the f e a s i b i l i t y of a f i b e r o p t i c l i n k f o r t rans- mission of a 980-megahertz analog s igna l . o p t i c transmission l i n k s t o the SPS phase con t ro l d i s t r i b u t i o n system i s at- t r a c t i v e s ince f i b e r o p t i c s provide advantages over r f cabl ing i n areas of weight, volume, f l e x i b i l i t y , and, i n p a r t i c u l a r , EM1 s u s c e p t i b i l i t y . How- ever, incorpora t ion of a f i b e r o p t i c d i s t r i b u t i o n system would introduce op t i - c a l components of ques t ionable r e l i a b i l i t y . An o v e r a l l SPS reference phase cont ro l concept using f i b e r o p t i c techniques i s shown i n f i g u r e I V - 8 ( r e f . 51). The t a sks accomplished w e r e (1) analyses of e x i s t i n g o p t i c a l f i b e r s and components f o r p o t e n t i a l use i n the SPS phase d i s t r i b u t i o n system concept, ( 2 ) design and cons t ruc t ion of a breadboard o p t i c a l l i n k f o r labora tory evalu- a t ion , and (3) assembly and test of a two-way o p t i c a l l i n k a t 980 megahertz of approximately 200 meters length. Figure IV-9 i s a block diagram of the op- t i c a l two-way l i n k as i t w i l l be u l t ima te ly configured f o r system t e s t i n g a t the ESTL.
P o t e n t i a l app l i ca t ion of f i b e r
Several types of o p t i c a l components and f i b e r s were inves t iga ted . These are addressed i n d e t a i l i n re ference 51. The se l ec t ed l i n k configura- t i o n incorpora tes an i n j e c t i o n laser diode suppl ied by Nippon E l e c t r i c Com- pany (NEC) (NDL-3205P) f o r the e m i t t e r device. An avalanche photodiode w a s s e l ec t ed as the de t ec to r component, and an RCA device (C30908F) w a s chosen. Four f i b e r s were evaluated during the f i b e r test phase of the program, and the Corning i n s i d e vapor phase oxida t ion (IVPO) f i b e r (product 5101) w a s se- l e c t e d f o r use i n the dual-l ink configurat ion. Measurements of phase delay and a t t enua t ion of t he 980-megahertz s igna l through each type of f i b e r were evaluated a t a f ixed temperature and fo r v a r i a b l e temperatures of the opt i - cal f i b e r . The bas i c test se tup shown i n f i g u r e IV-10 ind ica t e s t he o p t i c a l and e lec t r ica l s igna l l e v e l s used i n the tests. The r e s u l t s of s igna l phase changes as a func t ion of temperatures f o r t he Corning IVPO f i b e r a t 60 mega- h e r t z . f o r a 1-kilometer length are shown i n f i g u r e I V - 1 1 . Data were ob- ta ined a t s igna l f requencies of 60 and 980 megahertz.
200

Laboratory c o n f i g u r a t i o n a1 lows h i g h l y accurate phase e r r o r measurements
a Radiofrequency path a l l ows p r e c i s e l y c o n t r o l l e d parameters
* P i l o t s iqna l t o power s lgna l i n te r fe rence r a t i o s
*F i xed path- length d i f f e r e n c e s
*Path- length v a r i a t i o n s (s low and r a p i d ) - s i m u l a t i n g ionospher ic/atmospher ic e f f e c t s
Figure IV-7.- Laboratory end-to-end system test concept.
ubarray Phase c o n t r o l
Phase c o n t r o l
P i l o t Power beam
B . Phase c o n t r o l center
C. F i b e r o p t i c t ransce ive r
D. K l ys t ron phase compensation loop
l i n e l eng th compensation
two-way l i n k
I I P i l o t
Figure IV-8 . - SPS reference phase cont ro l system.
20 1
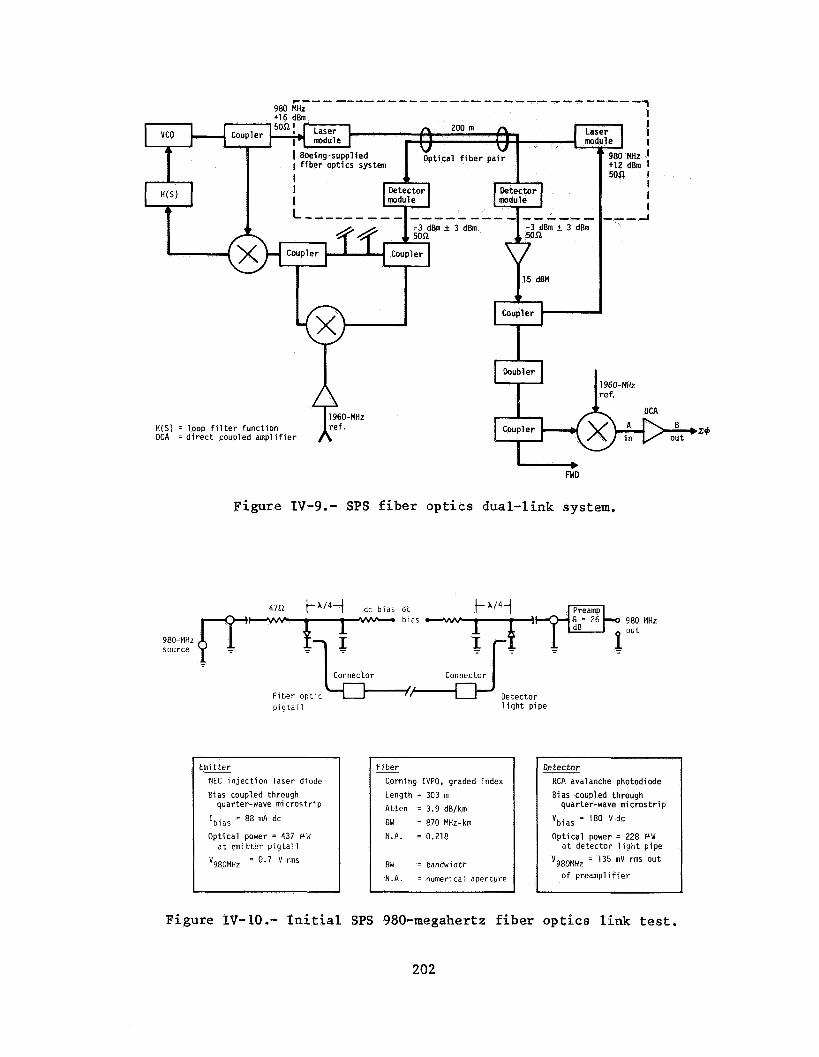
Figure IV-9.- SPS f iber optics dual-link system.
47a tx/4--t dc bias dc
980-MHz source
F ibe r o p t i c Detector p i g t a i l l i g h t p ipe
Emi t te r
NEC i n j e c t i o n l a s e r diode
Bias coupled through quarter-wave r r i c r o s t r i p
Ibias = 88 mA dc
Op t i ca l power = 437 PM a t e m i t t e r p i g t a i l
Vg8mHz = 0.7 V rms
F ibe r - Corning IVPO, graded index
Length = 303 m
A t ten = 3.9 dB/km
8W = 870 MHz-km
N.A. = 0.218
BW = bandwidth
N.A. = numerical aperture
De tec to r
RCA avalanche photodiode
Bias coupled through
Vbias = 180 V dc
O p t i c a l power = 228 PW a t de tec to r l i g h t p ipe
V98mHz = 135 mV rms o u t
quarter-wave m i c r o s t r i p
o f p reamp l i f i e r
Figure IV-10.- I n i t i a l SPS 980-megahertz f iber opt ics l ink test.
202

180
16 0
140
12 0
100
80
6 0
40
20
O (
Curve 1 - exper imental r e s u l t -
Curve 2 - predicted resu l t
Curve 3 - predicted resu l t due t o index chanye only
Curve 4 - predicted resu l t due t o the rma l expans ion only
r P
A Curve 3 ATc : I I I 1
- 50 - 10 30 70 110 150
Temperature, OC
223 263 303 3 43 383 42 3
Temperature , K
I I I I I 1
3.0
2.5
2 .o
1 .5
1 .o
.5
0
E -k T: cn W -a c a,
m r u
E
a, v)
m z a
Figure IV-11.- Phase delay as a funct ion of temperature f o r IVPO f i b e r .
203

The two-way l i n k w a s f ab r i ca t ed and t e s t ed t o v e r i f y s a t i s f a c t o r y t r a n s f e r of the 980-megahertz s igna l . The received s igna l was observed, and i t s amplitude and phase appeared extremely s t a b l e and e s s e n t i a l l y noise f ree . These f i b e r o p t i c l i nks should be s u i t a b l e f o r use i n the closed- loop phase d i s t r i b u t i o n system t e s t i n g planned f o r the summer of 1980 a t the ESTL.
C. S-BAND ACTIVE RETRODIRECTIVE ARRAY PHASE ERROR EVALUATION
The Je t Propuls ion Laboratory is scheduled t o perform a s e r i e s of
The tests (scheduled f o r e a r l y March 1980) have had t o be re- tests using the a c t i v e r e t r o d i r e c t i v e a r ray system which they have been developing. scheduled because of unavoidable delays i n obtaining c e r t a i n components f o r the a r ray f ab r i ca t ion . Much of the system hardware has been f ab r i ca t ed , and ind iv idua l u n i t s have been checked out i n a bench test configurat ion. bas i c system configurat ion t o be evaluated is shown i n f i g u r e I V - 1 2 . The sys- t e m w i l l be e rec ted i n an anechoic chamber and tests conducted t o e s t a b l i s h accuracy of the r e t r o d i r e c t i v e beam-forming and poin t ing funct ions.
The
1. PROCEDURE
The p i l o t source assembly, cons i s t ing of the p i l o t source and a r ece ive r diplexed t o the same antenna, w i l l be moved i n an a rc about the ARA midpoint t o v e r i f y r e t r o d i r e c t i v e scanning of the ARA. Since the 3-decibel beam width of the ind iv idua l ARA elements i s about 8O, the p i l o t source assem- bly w i l l be moved through an a rc of about 2 meters between half-power poin ts . Since a pos i t ioner and i t s automatic p a t t e r n recorder cannot be used, i t w i l l be necessary t o measure rece iver output as a funct ion of scan angle a t many poin ts on the a rc . The measurement w i l l be repeated with the ARA elements displaced from t h e i r nominal pos i t ions i n both a regular and random manner.
The pa t t e rn produced by the ARA w i l l be measured by moving a small antenna i n an a rc about the ARA midpoint while the p i l o t source remains f ixed along the ARA boresight . This i s a q u a l i t a t i v e measurement only; the pa t t e rn produced by an eight-element ARA is not a r e l i a b l e ind ica t ion of t he p a t t e r n of an a r ray composed of many thousands of elements.
2. EXPERIMENTAL RESULTS
Plans t o cons t ruc t and evaluate an eight-element a c t i v e re t ro- d i r e c t i v e a r ray could not r ea l i zed because of lack of resources. A s a re- s u l t , experimental da t a a r e ava i l ab le only from the bench t e s t s of the phase cont ro l system e l e c t r o n i c modules. Resul t s of these tests ind ica ted t h a t proper phase conjugation w a s achieved; however, phase ambiguities w e r e present as a r e s u l t of the frequency d i v i d e r s , . Although the ambiguity prob- lem must be cor rec ted f o r "cen t r a l phasing" t o be a workable concept, the t e s t s were b e n e f i c i a l i n i den t i fy ing sources of phase e r r o r such as mixer imbalance, mismatch, e tc . A f i n a l repor t covering the bench test r e s u l t s w i l l be prepared by JPL.
204

5: m 03
L a, X QJ
a 7
L 0 w 4 L W E: W In W L
L o w c , u 03c O W 3 L w S Q - 0 u a, m cl a
W L W v) 4 r a.
1
W VI co r: Q
w V S a, L al v- al a
II I1 II I1 I1
205

D. ANTENNA ELEMl3NT EVALUATION
The Boeing Aerospace Company has been under contract to JSC since July 1979 to better define the electronic aspects of the SPS waveguide slot array. The specific objectives of the program and the status of results were presented at the SPS microwave workshop held at JSC in January 1980 (ref. 5 2 ) . The following material is a summary of the objectives and status of this task. The objectives are
1. To build a full-scale, half-module, 10-stick array, the design parameters for which are to be determined by analytical consider- ations tempered by experimental data on a single slotted radia- ing stick
2 . To experimentally evaluate the completed array with respect to antenna pattern, impedance, and return loss
3 . To measure swept transmission amplitude and phase to provide a data base for design of a pilot receiving antenna
1. THEORY AND PROCEDURE
The first step in module design is to fix the gross dimensions, including the module length and width, and the dimensions of the radiating sticks and the feed waveguide. Because the feedguide is a standing-wave de- vice in which the coupling slots must be spaced by Xg/2, where X is the guide wavelength, and because Xg is a function of waveguide wid&, the radiating-stick and feedguide dimensions are not independent.
The SPS baseline design consists of a half module of ten 1.6- meter-long sticks of 6- by 9-centimeter cross section. For these dimensions, at the SPS frequency, the feedguide dimensions are also 6 by 9 centimeters. To assess the desirability of the baseline configuration, it was decided to configure the experimental module according to the baseline design. The com- mercially manufactured waveguide which most nearly approximates the baseline guide is WR-340, with dimensions of 4 . 3 2 by 8 . 6 4 centimeters. Because this waveguide was not available in sufficient quantity, the WR-284 waveguide was used instead for the developmental module. Because this waveguide is narrower than the baseline, and because it would be used for both the radiating sticks and the feedguide, the design frequency of the developmental module was in- creased from 2.45 to 2.86 gigahertz.
The design of the waveguide stick entails the assignment of values to both the slot offset from the waveguide centerline and the slot length. The slot length J?, is chosen so that the slot is resonant at the design frequency. The slot offset is chosen to give the desired slot con- ductance, which is determined by impedance matching considerations. Thus, for a waveguide stick containing N identical shunt slots, the desired value of normalized slot conductance g is just g = 1/N.
For a single isolated stick, the choice of slot length and slot offset is relatively straightforward. The slot length is given to good
206

approximation by J?, = Ao/2, where Xo is the free-space wavelength. The conductance and the slot offset are related to sufficient accuracy by a well-known equation. Tentative radiator stick dimensions in the WR-284 waveguide are (ref. 52): slot spacing, 7.62 centimeters; slot length, 5.03 centimeters; slot width, 0.317 centimeter; slot offset, 0.475 centimeter; and number of slots, 18 or 20. Where several sticks are placed in close proximity, however, as they are in the SPS module, the design problem is ex- aggerated by mutual coupling between the sticks; that is, the slots in any particular stick are loaded by the slots in the neighboring stick and Will necessarily exhibit resonant frequencies and conductances which differ sig- nificantly from those predicted by single-stick equations.
Because of the mutual-coupling problem, the choice of slot length and offset has been pursued in an iterative manner beginning from the single-stick analytical values. Data for several iterations with two wave- guide sticks are shown in table IV-1. Because the slot offsets, once machined, are fixed, stick impedance in these data are varied by changing the number of slots by means of a sliding short circuit in the waveguide.
The radiating waveguide sticks are fed in phase by a feed wave- guide the axis of which is perpendicular to those of the radiating sticks. Like the radiating sticks, the feedguide supports a standing wave. power is coupled from the feedguide to each radiating stick through a res- onant (length, Ao/2) coupling slot, which is inclined to the feedguide axis. The transformed radiating-stick impedance encountered by the feedguide is proportional to sin2 20, where 8 is the inclination angle. The phase of the power coupled to the stick is inverted as the coupling slot is reflected in the feedguide axis. each stick must present an impedance to the feedguide of one-tenth the feed- guide characteristic impedance. slot inclination of about 7'. sticks, the coupling slots are alternately reflected in the feedguide axis.
The
For maximum power transfer to the 10 radiating sticks,
This value dictates a rather small coupling- To maintain proper phasing of the radiating
The receiving antenna receives a pilot signal from Earth with phase information to keep all modules in phase. For symmetry, the pilot signal should originate from the center of the SPS Earth receiving array. Ionospheric phase shift and Faraday rotation indicate that the pilot signal should be centered on the SPS power frequency with the phase information in symmetrically disposed sidebands. The purposes of the receiving-techniques evaluation were as follows.
a. To conduct a shared receiving antenna compared to separate receiving antenna study to determine feasible pilot-beam budget and receiving-antenna constraints due to power module
b. To design and select a pilot-beam receiving-antenna tech- nique compatible with a power beam array which must allow si- multaneous transmission of an S-band carrier and reception of the anticipated pilot-beam spread-spectrum signal
207

TABLE IV-1.- ITERATIVE DESIGN PROCEDURE FOR RADIATING-STICK PARAMETERS
Stick No. of slotsa Slot Slot Comments no. for best match offset,c length,
CIU cm
Single Dual stick stickb
1 22 20 0.457 5.18 Resonance at 2800 MHz; slot excessively long
2 16 14 .508 4.927 Resonance at 2880 MHz; slot excessively short; excessive conductance per slot
3 18 16 .475 5.029 Resonance at 2875 MHz
4 18 18 .457 5.08 Resonance at 2860 MHzd expected
aSliding short-circuit measurement: bNonduplicate sticks are used to approximate mutual-coupling effect. CAffects slot conductance primarily. dDesired frequency for matching of feedguide and radiating-stick
VSWR at resonance = 1.1.
guide (WR-240 1.
208

The pilot-beam analys is e s t ab l i shed t h a t very s m a l l , low-gain p i l o t receiv- ing-antenna elements embedded i n the t ransmi t t ing a r ray are s i g n i f i c a n t l y su- pe r io r t o any scheme of diplexing, because ( a ) the t o t a l system power losses are two orders of magnitude lower using a separa te antenna than with any s ta te-of- the-ar t d ip lex ing device; (b) the s m a l l antenna, because of i t s in- herent broad bandwidth, is f u l l y compatible with a spread-spectrum s igna l , whereas the t ransmit array is not; and ( c ) the s m a l l , low-gain antenna repre- sen t s a much lower development r i s k than a dip lex ing device.
An important cons idera t ion i n the p i lo t - l i nk design i s the iso- l a t i o n of the p i l o t rece iver from noise inherent t o the high-power downlink s igna l . With the dipole , i s o l a t i o n can be improved by r o t a t i n g the antenna so t h a t it is cross-polarized t o the power t r ansmi t t i ng antenna. An alter- na te noise-canceling scheme uses two dipoles per receiving antenna, as shown i n f igu re IV-13. These are separated by x0/4 and can, therefore , be connected t o pass, as would a d i r e c t i o n a l coupler , r a d i a t i o n coming from the Ear th while r e j e c t i n g t h a t which is earthbound. One of the candidate receiving antennas i n f igu re IV-13, the s l o t , o r "credit-card' ' rece iv ing antenna, has been b u i l t and sweep-tested. It cons i s t s of a 4.44- by 0.157- centimeter Teflon-glass microc i rcu i t board shor t -c i rcu i ted around three edges t o form a low- impedance waveguide cavi ty .
The antenna p a t t e r n of the breadboard s lo t ted-ar ray module w a s measured on one of the s i x antenna ranges a t Boeing. Besides observing the f a r - f i e l d r u l e R > 2D2/h > 55 meters, where R i s range and D i s antenna diameter, high paths and sKarp-beam range i l lumina tors were employed t o mini- mize mult ipath e r r o r s . For the ranges a t the Boeing Developmental Center, mult ipath e r r o r s a t beam center are estimated t o be well under kO.1 decibel . Gain is measured using a S c i e n t i f i c At lan ta SA-1740 prec is ion amplif ier- rece iver and SA-12-1/ 70 s tandard-gain horn. mated on the bas i s of t o t a l root-sum-square ( r s s ) e r r o r s t o be k0.4 dec ibe l or k9 percent i n power.
Measurement accuracies are es ti-
The antenna e f f i c i ency is obtained from the experimental meas- urement of gain G, with respec t t o a reference horn, and of d i r e c t i v i t y D. Since the d i r e c t i v i t y is the gain of a l o s s l e s s antenna, the r a t i o of these values represents the e f f i c i ency of the antenna. The gain i s obtained from the measured value of incremental gain above a ca l ib ra t ed standard horn. The d i r e c t i v i t y i s expressed as the r a t i o of the maximum rad ia t ion i n t e n s i t y U,, t o the average r ad ia t ion i n t e n s i t y fi = 1/4T 1.f U(e,4)da, where 8 i s azimuth angle va r i ab le , 4 i s e l eva t ion angle va r i ab le , and 52 i s angular space.
The d i r e c t i v i t y measurement i s performed separa te ly by r o t a t i n g the antenna continuously through se lec ted azimuth and e leva t ion angles and in t eg ra t ing the f a r - f i e l d cont r ibu t ions over a s o l i d sphere t o obta in the d i r e c t i v i t y with re ference t o an i s o t r o p i c r a d i a t o r as e f f i c i ency is obtained from the r a t i o of these two separa te ly measured experi- mental values , t h i s measurement i s t y p i c a l l y determined t o k0. 4-decibel accuracy. The re- s u l t i n g e f f i c i ency value w i l l g ive an ind ica t ion of ohmic lo s ses i n the wave- guide feed system and i n the r ad ia t ing s t i cks . Since i n the SPS base l ine
D = Umax/U. The
11 = G/D. With cu r ren t ly ava i l ab le antenna range accuracy,
209

Double
Resonant
transmit a r r ay )
Nonresonant cross-pol a r (uncoupled)
Double
Resonant
transmit a r r ay )
Nonresonant cross-pol a r (uncoupled)
Figure IV-13.- Potential SPS pilot-link receiving-antenna configurations. The double-dipole configurations afford partial noise cancellation.
2 10

design, t h i s loss is estimated t o be less than 0.1 dec ibe l , the antenna range measurement can only provide a crude v e r i f i c a t i o n .
2. EXPERIMENTAL RESULTS SUMMARY
State-of-the-art antenna gain measurements (30.56 * 0.35-decibel accuracy) w e r e adequate t o bracket the aper ture e f f i c i ency t o 85.7 2 7 per- cent, i nd ica t ing good agreement f o r a 200-slot module based on the theore t i - c a l d i r e c t i v i t y of 31.23 decibels . Predicted e f f i c i ency values f o r a f u l l - s c a l e SPS ar ray , based on ex t r apo la t ion of the preceding r e s u l t s , would y i e l d an e f f i c i ency i n excess of 95 percent when accounting f o r recoverable scat- t e r ing losses .
The ohmic e f f i c i ency based on a measured value of ga in and di- r e c t i v i t y w a s 87.9 percent , with a to le rance of +20.9 and -14.7 percent. The expected ohmic e f f i c i ency i s 96.6 percent based on rough measurements of loss and mismatch. Improved methods f o r d i r e c t i v i t y and ca lo r ime t r i c measurement of loss a r e ind ica ted f o r the next phase of t h i s program.
A s m a l l p r in t ed -c i r cu i t receiving antenna w a s i n se r t ed i n t o the a r ray through s l o t s cu t from the common w a l l s of adjacent s t i c k s . The i n i - t i a l performance of t h i s co-polarized "credit-card" antenna revealed s ign i f - i c a n t mutual coupling with the adjacent a r ray s l o t s , an ind ica t ion t h a t a cross-polarized subresonant s l o t or d ipole antenna may be required.
Addit ional tests were conducted a t the JSC anechoic chamber t o evaluate the transmission bandwidth and harmonic a t t enua t ion of the s lo t t ed - waveguide t ransmi t t ing antenna. The 3-decibel bandwidth w a s found t o be 140 megahertz ( L e . , 2860 * 70 megahertz), which agrees with the test r e s u l t s obtained a t Boeing but i s considerably broader than expected (approximately 2860 * 20 megahertz). t h a t many lobes ex i s t ed a t each harmonic frequency from the second through the f i f t h harmonic. The peak l e v e l of these lobes r e l a t i v e t o the fundamen- t a l frequency peak gain ranged from -14 t o -24 dec ibe ls . These r e s u l t s indi- ca t e t h a t the harmonic frequencies w i l l be r ad ia t ed i n many d i r e c t i o n s with r e l a t i v e l y high gain.
Resul t s of the harmonic p a t t e r n measurements ind ica ted
E. SOLID-STATE ANTENNA POWER COMBINER
The Boeing Aerospace Company has been under con t r ac t t o JSC s ince Ju ly 1979 t o inves t iga t e concepts appl icable t o the so l id - s t a t e SPS config- u ra t ion which may be required t o sum the outputs of many r e l a t i v e l y low power devices with extremely low loss i n the combining process. To avoid the power-combining lo s ses assoc ia ted with c i r c u i t hybrids , it w a s proposed t h a t the power from mul t ip le s o l i d - s t a t e ampl i f i e r s be combined by d i r e c t coupling of each a m p l i f i e r ' s output t o the r ad ia t ing antenna s t ruc tu re . r e s u l t i n g savings i n t r ansmi t t e r e f f i c i ency ranges from 4 t o 10 percent de- pending on the conf igura t ions being compared. The se l ec t ed power-combining antenna cons i s t s of a unique p r in t ed (metal ized) mic ros t r ip c i r c u i t on a ceramic-type d i e l e c t r i c subs t r a t e , which i s backed by a shallow, l ightweight aluminum cav i ty t h a t sums the power of four microwave sources. The antenna behaves l i k e two one-half-wavelength s l o t l i n e antennas coupled together by
The
211

way of their common cavity structure. configuration selected is that the radiated energy is summed to yield a single radiated output phase, which represents the average insertion phase of the four power amplifiers. This energy may be sampled, and, by compar- ison with the input signal, one can correct for phase error to maintain the insertion phase of all solid-state power-combining modules at exactly the same value. This procedure ensures that the insertion phase of each SPS power-combining antenna module is identical even though the power amplifiers are fabricated to relatively loose (low cost) insertion phase requirements.
A significant feature of the antenna
1. PROGRAM SUMMARY
A detailed review of the solid-state antenna power combiner pro- gram was presented at the SPS microwave workshop held at JSC in January 1980 (ref. 53). The following material is a summary of this program and was ex- tracted from reference 53.
The program entailed the design and fabrication of a four-feed microstrip antenna and a stripline antenna-phasing network which was inte- grated with four transistor amplifiers to demonstrate that the total solid- state module (amplifiers plus antenna) operates as an efficient power- combining-radiating system. The antenna developed was evaluated for gain, pattern, and efficiency on the antenna range with and without the amplifiers. The amplifiers are connected directly to the antenna without benefit of iso- lators so that their interaction with the antenna is unimpeded. The com- bined output power of the amplifiers is approximately 0.5 watt.
Figure 111-62 contains a sketch of the power-combining micro- strip antenna which was evaluated. The dielectric substrate is metalized on both sides. The underside, within the cavity, contains the four microstrip feedlines, which are coupled to the two radiating slots on the top side by way of two narrow slotlines. To feed the antenna, two of the rf inputs are required to be 180' out of phase with the remaining two. An antenna feed network is thus required to provide the four Oo-180° equal-amplitude outputs.
The antenna feed network, the power amplifiers, and the micro- strip antenna are connected as indicated in figure IV-14. The four cables connecting the amplifiers and the antenna are required to have equal elec- trical lengths as are the cables connecting the antenna feed network and the amplifiers. This requirement is necessary to retain proper phasing of the antenna .
Three solid-state antenna module feed networks were assembled, and measurements were made on all units. Two of the feed networks were used to accomplish the antenna range tests. The stripline feed network consists of two 0'-180' hybrid ring junctions fed by a single in-phase two-way power divider. cover plate as a label for the finished feed.
The circuit metalization pattern is etched into the top circuit
The insertion loss and insertion phase measurements over a 500- megahertz bandwidth indicate that at the design frequency, the insertion loss
212

Antenna feed network
I n p u t a t 2.45 GHz
Figure IV-14.- Power-combining antenna, feed network, and power amplifier block diagram.
213

of a l l po r t s i s near ly equal. g igaher tz i s 1 . 5 O wide, o r k0.75O.
The i n s e r t i o n phase e r r o r window a t 2.45
The four 2.45-gigahertz power ampl i f ie rs w e r e suppl ied by Tron- Tech, Inc. , of Eatontown, New Jersey. A s can be seen from t a b l e IV-2, t h e ampl i f i e r s m e e t many of the small-signal s p e c i f i c a t i o n s but are out of spec- i f i c a t i o n on others . More tests are scheduled t o determine ampl i f i e r per- formance under the required d r i v e condi t ion needed t o y i e l d 0.5 w a t t of output power. Un t i l these add i t iona l tests are completed, i t i s premature t o specula te on the degree of s u i t a b i l i t y of the four ampl i f ie rs .
A four-feed mic ros t r ip antenna w a s developed which appeared s u i t - a b l e f o r the t a s k a t hand. It evolved through a series of s t e p s which began with a mic ros t r ip t o s l o t l i n e coupler and graduated from a single-feed s l o t - l i n e antenna t o a dual-fed s l o t l i n e antenna and, f i n a l l y , the four-feed design. The antenna s u b s t r a t e i s 16.77 square cent imeters and i s backed by a 6.35- by 6.35- by 0.762-centimeter cav i ty , which couples the r a d i a t i n g s l o t s together .
The antenna, when fed by the feed network described earlier, e x h i b i t s a bandwidth a t the 15-decibel loss poin ts of approximately 100 mega- he r t z . A prel iminary p a t t e r n taken with the antenna on the range i s shown i n f i g u r e IV-15. accounting f o r 0.43 dec ibe l of feed network and cabl ing lo s ses . The pat- t e r n i s order ly , with the f i r s t s i d e lobes approximately 23 dec ibe l s down. A second, "cleaned-up" model w a s f ab r i ca t ed t o i n i t i a t e f u l l range t e s t i n g with and without the power ampl i f ie rs .
The peak ga in as measured is approximately 8 dec ibe l s no t
The primary purpose of the antenna range t e s t i n g w a s t o deter- mine the e f f i c i e n c y of t he four-feed antenna with and without t he ampl i f i e r s . The e f f i c i ency is derived by d iv id ing the antenna ga in G by the antenna d i r e c t i v i t y D. The antenna ga in w i l l be determined by a three-antenna meth- od i n which antenna spacing is measured t o b e t t e r than 0.5 percent. This method i s expected t o y i e l d gain accurac ies of k0.3 dec ibe l .
The antenna d i r e c t i v i t y D i s def ined as the r a t i o of the peak rad ia ted power to the average i s o t r o p i c r ad ia t ed power (average power radia- ted over the u n i t sphere). To determine the average i s o t r o p i c r ad ia t ed power, one must measure and t o t a l the rad ia ted power over t he sphe r i ca l su r f ace wi th the unknown antenna a t i t s cen te r , and average t h a t value by d iv id ing by the number of measurements. 16 200 measurements. The e r r o r assoc ia ted with the d i r e c t i v i t y measurement i s approximately k0.25 decibel .
Typical ly , a 2' by 2O c e l l is employed which r equ i r e s
The antenna feed system i n s e r t i o n loss i s measured on the auto- matic network analyzer (HP 8542B), which i s pe r iod ica l ly c e r t i f i e d by Hewlett-Packard using s tandards t r aceab le t o NBS t o an accuracy of +O. 15 deci- b e l (k3.51 percent) f o r devices of low i n s e r t i o n loss. Thus, when the feed system i n s e r t i o n l o s s is subt rac ted from the measured gain, the feed system measurement uncer ta in ty w i l l be added t o the previously s t a t e d unce r t a in t i e s .
214

TABLE IV-2.- AMPLIFIER SPECIFICATIONS AND SMALL-SIGNAL MEASURED VALUES
Specification Small signala P arame t er
Frequency, GHz . . . . . . . . . . 2.45 2.45 Power output at 1-dB gain compression, dBm . . . . . . . . 21 (b)
Gain, dB . . . . . . . . . . . . . c6 7.76 to 8.18
VSWR Gain match, dB . . . . . . . . . . d-O. 5 50.21
Input . . . . . . . . . . . . . . output . . . . . . . . . . . . .
Phase match, deg . . . . . . . . . Phase control, deg . . . . . . . . Gain control . . . . . . . . . . . Infinite VSWR save at full power . . . . . . . . . . .
d2.5:1 d1.5:1
d55 c+ 10 (h)
e3.65:1 f1.66:1
52.4 g+2 (i)
aMeasured by Boeing Aerospace Company. bNot measured. CMinimum, dMaximum. eone unit. f ~ w o units. &By varying B+ voltage according to Tron-Tech. h ~ y varying B+ voltage. iInstalled separate loss control, which yields k1.5 decibels according
JVerified by Tron-Tech. to Trqn-Tech.
215

m U
0 co rl
0 In rl
0 (u rl
0 0'
0 9
0 m
0
0 m
0 9
0
0 cv rl
0 In rl
0 03
0 m 0 m 0 m 0 m 0 4 d- rl rl (v cv m m
g p 'naMod ay le laa
216

The rss value of the combined efficiency is 2(0.30)2 + (0.25)2 + (0.1512 = 20.42 decibel = 210 percent. Cross-polarized radiation for the SPS applica- tion is considered wasted power; therefore, it is also measured and included when determining the antenna efficiency.
With the basic antenna characterized for gain, pattern, and ef- f iciency, antenna range measurements were made with the solid-state power amplifiers inserted and operating with a combined output power of approxi- mately 0.5 watt. The measurement of interest is the difference between the range received power with and without the inclusion of the solid-state power amplifiers. The difference should be equal to the gain of the ampli- fiers. This difference w i l l verify the degree to which the antenna sums the available power of the four amplifiers. Pattern measurements will also be taken to compare with those taken without the power amplifiers. As a final test to verify the entire procedure, the integrated amplifier-antenna system will be tested for directivity and gain, and the overall efficiency will be calculated.
2. EXPERIMENTAL RESULTS
The antenna efficiency was measured as the ratio of the meas- ured gain and the antenna directivity, both of which have inherent errors associated with their measurements. Part of the losses are attributed to the developmental nature of the antenna; a section of microstrip line, a nonoptimum dielectric substrate, and silver conducting epoxy were used in fabrication of the antenna. Accounting for these losses, which would not exist in an optimized combiner design, and for the measured cross-polarized component of radiation ($1 percent), the combining loss , to within the meas- urement accuracy of 20.33 decibel, is negligible.
Significant additional information on the performance of the combiner-radiator module was obtained by the incorporation of four carefully matched, low-cost silicon bipolar transistor amplifiers. When the four solid- state power amplifiers yielding a combined output power of 0.5 watt were added to the antenna, the output power was summed perfectly in the antenna beam without any measurable added loss over that obtained without the amplifiers. This result confirms the principal contention that all losses associated with the power-combining process are insignificant to within current measurement errors. The regularity of the measured E and H antenna patterns with and without the amplifiers also indicate that all the amplifiers are combin- ing properly, with the added gain on the antenna range corresponding to the bench-measured amplifier gain to within 0.1 decibel.
F. SOLID-STATE AMPLIFIER DEVELOPMENT PROGRAM
The Radio Corporation of America performed early studies of a poten- tial solid-state transmitter for SPS applications under the auspices of JSC. Later, RCA initiated a solid-state amplifier development program under con- tract to Rockwell International through MSFC.
In their early studies, RCA suggested that, in practice, solid-state device power output must be traded off against efficiency. Considering this
217

and other factors, RCA concluded that gallium arsenide rather than silicon appears to be the most favorable material and that some type of field- effect device would be best suited for combining high efficiency and ease of fabrication (ref. 9). Thermal and electrical designs for both Schottky barrier and junction-type field-effect transistors were generated to high- light considerations likely to influence the course of future work. De- vices providing 4 watts of rf power at greater than 80 percent efficiency were considered feasible. cially available devices with very good results; the amplifier provided 3 watts of rf power at an efficiency of 58 percent (ref. 33) . The ensuing system definition study to make effective use of the solid-state devices resulted in a system concept that considered the direct conversion of sun- light into microwave power-generating modules. This general concept, re- ferred to as the "SMART" concept by RCA, is later referred to by Rockwefl and others as the "sandwich" concept. It was concluded that this type of system has a factor of merit (i.e., power in watts per weight in kilograms) advantage over the klystron reference system. Recommendations were made for further study of the sandwich concept and to continue studies of the factors affecting high-efficiency operation of microwave FET's and their associated circuitry .
An actual amplifier was constructed using commer-
The MSFC/Rockwell contract effort calls for demonstration of an am- plifier having an output power of 5 watts, a gain of 8 decibels, and a power- added efficiency of 50 percent. Once this is accomplished, an effort will be conducted to increase the rf output power to 10 watts, the gain to 10 dec- ibels, and the power-added efficiency to 65 percent (ref. 33) . Commercially available GaAs FET's will be used.
Computer-aided analysis techniques are in use both for small-signal device characterization and to define the available trade-offs under large- signal operating conditions. Results, thus far, have been very impressive. When optimized for maximum efficiency at the SPS frequency (2.45 gigahertz), a power amplifier stage using a device designed for 12-gigahertz operation yielded a 71-percent power-added efficiency, an rf power output of approxi- mately 1 watt, and a gain of about 11 decibels. Test results of power out- put and efficiency for conditions of maximum power and efficiency tuning are shown in figure IV-16 (ref. 3 3 ) . Solid-state technology is in a state of rapid growth in both the microwave and the signal-processing areas. This growth has been stimulated on the one hand by the commercial computer indus- try and on the other by military interest in microwave solid-state devices. The SPS will reap tremendous benefits from the very large investments made in this techno 1 ogy .
G. MAGNETRON TUBE ASSESSMENT
The Raytheon Company has been conducting analytical and experimen- tal assessments of crossed-field devices for application as the SPS micro- wave power amplifier. The first proposed use of the crossed-field direc- tional amplifier in the solar power satellite dates back to 1970 (ref. 54). In recent years, JPL has suggested potential application of the microwave
2 18
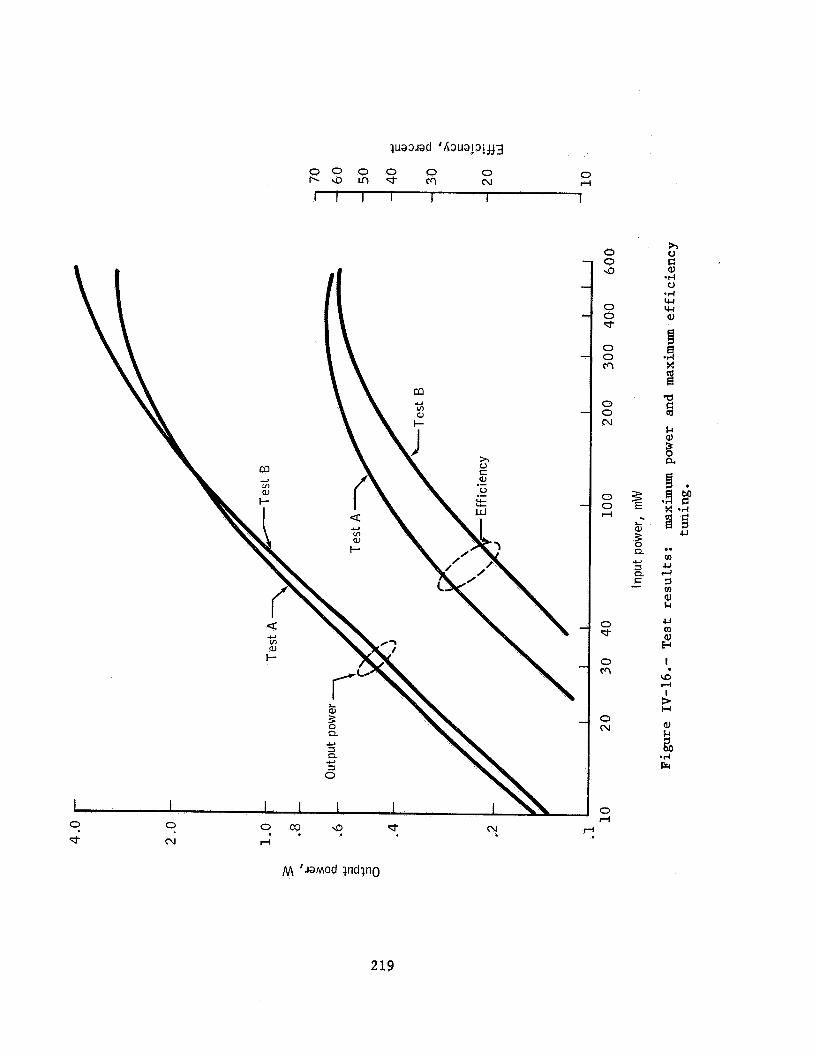
0 0 0 0 0 0 b a l l - d m N
I \
0
N
M .d ul W
I \ \ 5 \i- a
Q
3 Q
3
U
U
0
909 9 rl
d
\
0 rl
0 0 9
0 0 d
0 0 m
0 0 N
0 0 rl
0 d-
0 m
0 N
0 rl
rl
219
oven magnetron as the SPS power amplifier, because of its inherent high effi- ciency, simplicity, relatively low mass, and high production volume and re- sulting low costs. Raytheon is currently under contract to MSFC to perform analytical and experimental evaluation of the characteristics of a microwave- oven-type magnetron that are pertinent to the SPS application (i.e., effi- ciency, output noise level, phase stability, and tube life (reliability)). A detailed summary of the work accomplished was presented at the SPS micro- wave system workshop held at JSC in January 1980 (ref. 25). Much of the information provided here is extracted from reference 25.
The current study involves a penetrating look at all interfaces associated with the magnetron directional amplifier. One of the most impor- tant developments of the current activity is the precise control of both the amplitude and the phase of the microwave power output from the amplifier by feedback control systems using phase and amplitude references. The output phase of any microwave generator in the SPS, regardless of kind, must be care- fully controlled to prevent appreciable impact on the overall subarray phase budget, which must include many other factors.
The control of the output amplitude in the face of many factors that tend to change that amplitude is also essential for generating an efficient microwave beam. In the case of a crossed-field device, the output amplitude can be controlled to a predetermined value by another control loop which makes use of small electromagnets to boost or buck the residual field pro- vided by permanent magnets. The overall schematic for the combined phase and amplitude control of the magnetron directional amplifier is shown in figure 111-45.
The lack of historic data on the noise performance of CW crossed- field devices and the consequent inability to predict their behavior in the SPS application, where the noise level of the transmitter is a highly criti- cal issue, understandably became a major factor in the selection of a genera- tor for the SPS reference system. Even after the importance of this noise was realized, it was necessary to make special noise-measuring setups to ob- tain more sensitive measurements. Many measurements of signal-to-noise ratio over frequency ranges of as much as +lo00 megahertz either side of the car- rier have been made on magnetron directional amplifiers with this equipment. Data were taken both with normal external power applied to the filament and with no filament external power applied. For the condition of no external filament power applied, a signal-to-noise ratio of 130 decibels in a 1- kilohertz noise bandwidth has been obtained.
It should also be noted that these low noise measurements have been observed on magnetrons made by different manufacturers and in different time periods, but not on all magnetrons that have been randomly selected. How- ever, no statistical studies have been made nor probably should be made until more sensitive measuring equipment is available. In fact, it may be more ef- fective to devote any limited future effort to better understanding the sources of noise in the magnetron.
Measurements of close-in phase-modulation noise added by the magne- tron directional amplifier were also made when it was operating with a gain
220

of approximately 20 decibels. These measurements indicated a carrier-to- noise level that was typically 115 decibels in a l-kilohertz bandwidth of noise in the range of 10 to 100 kilohertz removed from the carrier fre- quency. This value represents excellent performance.
In the harmonic generation area, there was no particular issue be- tween the crossed-field and klystron device approach since it is known that both of these devices as well as all other classes of microwave generators produce harmonics. Measurements made on two representative tubes, desig- nated as numbers 11 and 12, are given in table 111-12 (ref. 25). These find- ings are somewhat better than had been anticipated. The unexpected anomaly of the significant energy at the fifth harmonic is an indication of the difficulty of the a priori assessment of the more complicated characteris- tics of any microwave generator.
An investigation of the application of carburized thoriated-tungsten cathodes to the design of a long-life SPS magnetron has been accomplished. It has been established from life test evaluations that the life of a car- burized tungsten cathode is a very steep function of the operating tempera- ture. The difference between life at 2000 K and 1900 K is a factor of 10. From the great body of design data based on many laboratory investigations as well as life test data, an operating temperature of 1900 K is associated with a potential life of 500 000 hours, or more than 50 years, if the cathode is made from 0.1-centimeter (0.040 inch) diameter wire that is 50-percent car- burized. This is a reasonable design and a reasonable operating tempera- ture for a cathode that could be used in a magnetron designed for SPS use.
Crossed-field electron tubes of the magnetron and amplitron type are properly recognized as the most efficient of microwave generator devices. The highest electronic efficiency, defined as the efficiency with which dc power is converted into microwave power, is associated with a high ratio of the magnetic field B to a design parameter Bo, which is proportional to frequency. However, the theoretical electronic efficiency is always degraded to some degree by the circuit efficiency and can be degraded by improper de- sign of the interaction area and other design parameters as well. When the B/Bo electronic efficiency has exceeded 90 percent as exhibited by the commer- cially available 8684 magnetron. For reasons largely related to the physi- cal size and cost of the permanent magnet, crossed-field devices are almost always designed in the range of microwave oven magnetron, the operating characteristics of which have re- cently been intensively evaluated.
ratio is high and the tube otherwise properly designed, the measured
B/BQ = 4 to 6. This ratio applies to the
When the permanent magnet is removed from a microwave oven magnetron and the device is operated in an electromagnet, the measured overall effi- ciency can be considerably increased as shown in figure IV-17. The value of 82 2 1 percent efficiency was carefully measured after extensive preparation and precaution; then, a balance was made between the dc power input and the sum of the microwave power output and the power dissipated in the anode as an additional precaution. After taking a carefully measured circuit efficiency of 95 percent into account, the electronic efficiency was computed to be 85 percent. To this value may be added at least 1 and perhaps 2 percentage
221

0
S O W L S -Pa v u a J L - w w n
'F
Figure IV-17 .-
robable electronic efficiency of 100 icrowave oven magnetron
90
80
70
60
50 of microwave oven magnetrons
40 30 Theoretical efficiency =
20
10
0
(probable error indicated)
C(ZB/Bo) - 2I/[(2B/Bo)- 11
1 2 3 4 5 6 7 8 9 1 0 1 1
B/B, r a t io
Theoretical and experimentally observed electronic efficien- cies of conventional microwave oven magnetron and 915-megahertz magnetron. Electronic efficiency is efficiency of conversion of dc power into micro- wave power. Overall efficiency includes circuit inefficiencies that can be ascertained from cold-test data.
222

poin ts t o account f o r the amount of backbombardment power t h a t w a s needed t o heat the cathode t o a temperature s u f f i c i e n t t o provide the emission ( i . e . , no ex terna l f i lament power w a s used).
Although t h i s e f f i c i ency may seem high, i t i s a c t u a l l y from 6 t o 8 percent lower than i t should be and considerably below t h a t of the 8684 mag- netron previously mentioned. The reason f o r the degraded e f f i c i e n c i e s t h a t seem t o occur f o r a l l B/Bo r a t i o s is not f u l l y understood. A contaminated f i e l d p a t t e r n does e x i s t i n the tube i n the cathode-anode i n t e r a c t i o n area, and the re may be some leakage cur ren t , although small, around the end sh ie lds ; but there are probably o ther f a c t o r s as w e l l .
With one exception, there has never been a dedicated e f f o r t t o max- imize the e f f i c i ency of the crossed-f ie ld device. The one exception was an e f f o r t made on an amplitron device and r e su l t ed i n an ove ra l l e f f i c i ency of 90 st: 3 percent . It , therefore , seems probable t h a t i f a dedicated e f f o r t was made t o optimize the design of an SPS tube f o r e f f i c i ency , an e f f i c i ency of 90 percent could be achieved. r a t i o s , t o make c e r t a i n t h a t design of the end s h i e l d and the polepiece w a s proper, t o make c e r t a i n t h a t the cathode po ten t i a l always remained a t a neu- t r a l p o t e n t i a l with respec t t o the vanes, t o contour the vane t i p s , and t o design f o r high c i r c u i t e f f i c i ency .
The procedure would be t o use high B/Bo
H. MICROWAVE IONOSPHERIC INTERACTION EWERIMENT
A s a r e s u l t of the work being conducted on the SPS phase cont ro l sys- tem evaluat ion and various other concerns assoc ia ted with the microwave s ig- nal propagation, it has become c l e a r t h a t the e x i s t i n g data base r e l a t i n g t o ionospheric e f f e c t s on microwave s igna l propagation i s not adequate. During the microwave system workshop held a t JSC i n January 1980, t h i s def ic iency was c l e a r l y obvious. Since t h a t time, JSC entered i n t o a cont rac t with the Universi ty of Texas Applied Research Laboratory (ARL) t o conduct a f i e l d ex- periment obtaining da ta t h a t can be used f o r i n i t i a l modeling of the iono- sphere, f o r both the na tu ra l and SPS-heated (s imulated) states. A discus- s ion of the p o t e n t i a l e f f e c t s of the ionosphere (both na tu ra l and heated) on microwave s igna l propagation and a review of the test a c t i v i t y and schedule f 01 1 ow.
The propagation of electromagnetic waves through the ionosphere i s a f f ec t ed by the f r e e charges there. The e f f e c t s are frequency dependent, f a l l i n g off as l / f 2 a t very high frequency and above. The proposed SPS w i l l have t o t ransmit i t s energy and cont ro l information through the iono- sphere. Although the proposed SPS frequencies w i l l be very high (S-band), there may be some nonnegl igible e f f e c t s i n c e r t a i n areas.
One of the areas f o r which a p o t e n t i a l problem e x i s t s i s the " p i l o t signal." This i s a s igna l between ground and s a t e l l i t e which a c t s as the phase re ference f o r t he SPS power s igna l . The p i l o t s igna l w i l l be a t a f re - quency (2.45 g igaher tz ) w e l l above any l o c a l plasma frequency i n the iono- sphere. This frequency ensures t h a t the l o c a l r e f r a c t i v e index w i l l d i f f e r only s l i g h t l y from unity. However, t h i s s igna l w i l l have t o go through the same s p a t i a l region as the power s igna l . The p rec i se e f f e c t s of t h i s power
223

s i g n a l on the ionosphere and the manner i n which the per turbated region w i l l a f f e c t the p i l o t s igna l are unknown.
The major e f f e c t of the power s i g n a l on the ionosphere w i l l be ther- m a l . w i l l r epresent a s i g n i f i c a n t increase i n the temperature. Although it i s not poss ib le t o f u l l y test these e f f e c t s before an SPS launch, a very good approxi- mation can be obtained by hea t ing the ionosphere with r f energy from a ground s i te , such as the experimental f a c i l i t y a t P l a t t e v i l l e , Colorado. Measure- ments of the e f f e c t s created by t h i s hea te r can be used t o determine the ef- f e c t s of the given amount of heat ing on the p i l o t s igna l .
The depos i t ion of only a very small f r a c t i o n of t h e SPS power s igna l
The r e f r a c t i v e index of the ionosphere a t a frequency f of 2.45 g igaher tz can be approximated as
= 1 - 6.7 x cm3/electron x N (25 1
where f p = plasma frequency
A = 8.06 x lo7 Hz2-cm3/electron
N = e l e c t r o n dens i ty
The phase change of the p i l o t s i g n a l caused by the normal ambient ionosphere w i l l be
where the i n t e g r a l i s taken along the path s from the s a t e l l i t e t o the ground. Subs t i t u t ing the value of n from equation (25) and the wavelength f o r the p i l o t s igna l frequency (2450 megahertz), 12.245 cent imeters , fo r A, the following i s obtained.
224

4 = - J[(1 - 6.7 x 10'l2N) - l]ds
The quant i ty N = j' N ds i s ca l l ed the e l ec t ron columnar content and i s usu- a l l y expressed i n t o t a l e l ec t ron content un i t s (TECU's), which are 1OI2 electrons/cm2. ionosphere along a v e r t i c a l path v a r i e s from about 5 TECU'S a t n ight t o 50 t o 100 TECU'S during the day.
c - This in t eg ra t ion i s done because the columnar content of t h e
In TECU's,
4 = -27r x 0.55Nc (28)
The ambient ionosphere w i l l therefore cause the p i l o t s igna l t o be changed by about 3 cycles a t night and 25 t o 50 cycles i n daytime. This e f f e c t should be slowly varying and not pose any ser ious d i f f i c u l t i e s .
The p i l o t s igna l W i l l go through a region of the ionosphere which is perturbed by the power beam. This perturbed region may d i f f e r from the ambi- en t ionosphere i n two important respec ts . F i r s t , there may be a large-scale change i n the e l ec t ron densi ty . This change would cause the region t o a c t as a lens i n e i t h e r focusing or defocusing the beam depending on whether a ne t decrease o r increase i n e l e c t r o n dens i ty , respec t ive ly , occurred. Second, there would be an increase i n the small-scale turbulence which would increase the sca t t e r ing .
Since the daytime phase s h i f t w i l l be many cyc les , i t w i l l r equ i r e only a s m a l l percentage change i n the columnar content t o c r e a t e a cyc le change. I f t h i s change occurs gradual ly over a l a rge a rea , the energy w i l l be def lec ted and focused. The v a r i a t i o n can be thought of a s imposing an ex t r a length i n the path proport ional t o the v a r i a t i o n i n columnar e l ec t ron content.
= (6.7 cm/TECU)ANc (29)
225

As can be seen i n f igu re I V - 1 8 , a l i n e a r s lope w i l l amount t o a de f l ec t ion of the energy. I f the s lope i n N c change is
s = m,/h (30)
then the de f l ec t ion angle w i l l be
AR/h = (6.7 cm/TECU) x s (31)
A 1-TECU change over 1 ki lometer would give a de f l ec t ion of 6.7 x 10⁻⁵ radian, o r 3.8 x 10⁻³ degree. A quadra t ic charge dependence of AN, with d is tance from the cen te r w i l l generate a focusing. I f
ANc = ah2 (32)
then
= (6.7 cm/TECU)ah2 (33)
and the phase a c t s l i k e t h a t coming from a parabol ic r e f l e c t o r with foca l d i s - tance approximately equal t o the rad ius of curvature
1 2a x 6.7 cm/TECU
R = ( 3 4 )
I f a i s 1 TECU/km2, then R w i l l be approximately 7500 kilometers.
These changes w i l l probably have l i t t l e e f f e c t on the p i l o t s igna l . However, it i s unclear whether small-scale grad ien ts i n Nc may not be l a r g e r than those used i n the preceding discussion. I f the s p a t i a l ex ten t of the gradien t i s very s m a l l , the previously described treatment becomes in- va l id . The wave na ture of the r ad ia t ion w i l l then be of major importance, and the e f f e c t s can be most e a s i l y thought of as r e s u l t i n g from a s c a t t e r i n g proc- ess. A rough s c a l e length which w i l l d iv ide the two regions w i l l be the f i n a l Fresne l zone rad ius
ro -,rE
226
(35)
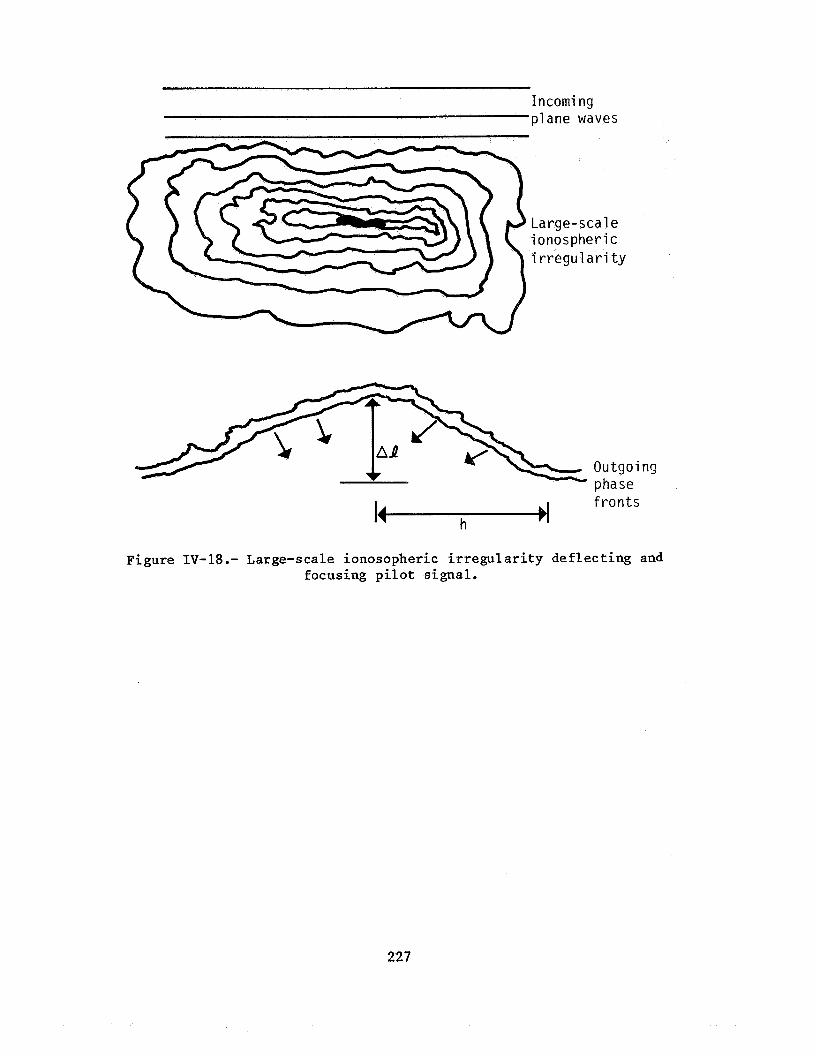
Incoming plane waves
Large-scal e ionospheric i rregul a r i t y
f ronts It h
Figure IV-18.- Large-scale ionosopheric i r r e g u l a r i t y de f l ec t ing and focusing p i l o t s igna l .
227

where is the wavelength and A is the distance from the scattering re- gion to the receiver. For scattering at a 300-kilometer altitude, ro is about 200 meters. This relationship means that varia * smaller than 2r0, or about 0.5 kilometer, will act as a large volume wi sity per unit volume.
e scattering den-
The received wave will be th rposition of the direct-path wave and the sum of all the waves scattered the volume (fig. IV-19). This problem has been extensively studied. Briggs and Parkin (ref. 55) found that the rms phase variation from isotropic irregularities scattering in the ionosphere was
where re = the classical radius of the electron (2.8 x centimeter)
x = the wave length
= the inner scale length of variations L,
L2
ANrns = the rms density perturbation
= the thickness of the irregularity region
If one assumes a 1-percent variation in daytime, an ambient density of l o 7 electrons/cm3, a 30-meter inner scale length, and a 30-kilometer thickness , then
@ = 4.2 X 10⁻² radian
Of course, the variation in an extremely turbulent region might be larger than 1 percent, which is typical of scintillation regions. In addition, a better estimate of effects on a particular signal may be made if the full spatial spectrum of the turbulence is given.
The experiment conducted by ARL was designed to measure the in- tensity of the electron density turbulence structure in both the natural ionosphere and the heated region. Heating was accomplished by using the ITS heater facility at Platteville, Colorado, to deposit rf energy into the F-region of the ionosphere.
The tests were conducted in the second week in April 1980, and the final report including a mathematical model of the ionospheric perturbation will be completed by December 1980. Both disturbed and unheated regions of the ionosphere were probed with signals from the U.S. Navy Navsats.
228

/
Incorri fig p1 a n e waves
Effective area
/ Y
Direct-path waves
A
A n t e n n a Y Figure IV-19.- Small-scale ionospheric i r r e g u l a r i t i e s ac t ing as volume
s c a t t e r e r of p i l o t s igna l .
229

The Navsats carry radio beacons at 150 and 400 megahertz. The 400- megahertz signal is used to navigate from observations of the Doppler curve. This measurement is significantly contaminated by propagation effects as the signal passes through the ionosphere. A 150-megahertz signal is also trans- mitted to measure and remove the dispersive effect of the ionosphere. the current problem, the priorities were reversed and the measurement of the ionospheric propagation effects were of primary interest.
For
The standard two-frequency navigation receiver for Navsats (geoceiver) generates a signal with frequency proportional to the rate of change of the columnar content (N,) along the line of sight as the satellite sweeps by in the sky. The ARL geoceiver was modified to generate several analog signals including the refraction phase and the automatic gain control (AGC) voltages for the 150- and 400-megahertz signals. The refraction data were converted to the audiofrequency range by an external circuit, and this signal along with the AGC voltages were then recorded on magnetic tape.
An advantage to this procedure is that the signal generated by the ARL geoceiver has eight times the phase change per charge as the signal later counted by the internal circuit. Thus, both time and Nc resolutions are improved by this modification.
Nc
After the preliminary evaluation was completed, the data were digi- These data then formed the tized at a high rate in the AFiL computer center.
basis of a detailed characterization of the electron density perturbations in the heated and unheated regions. JSC in October 1980.
The initial results were reviewed at
Tentative conclusions based on the initial data evaluation follow.
(1) The electron density across the heated region will consist of both large-scale and small-scale variations.
(2) The phase variation across the heated region will be less than l o o peak for large-scale disturbances and less than lo rms for small-scale disturbances.
( 3 ) Amplitude scintillations observed near the heated region cannot be attributed solely to multipath conditions.
A statistical characteristic of the turbulence as a function of elec- tron field intensity and other variables will be developed and the effects on the SPS power signal and pilot signal will be evaluated: be included in the final report scheduled for distribution in January 1981.
These results will
230

V. SYSTEM CONCLUSIONS AND REMAINING ISSUES
A. CONCLUSIONS
As a result of the numerous analytical and experimental evaluations which took place during the DOE/NASA Concept Development and Evaluation Pro- gram, certain conclusions can be reached on the microwave PTAR system. These conclusions were presented and discussed as part of the system workshop held at JSC in January 1980. The conclusions listed here apply to the overall mi- crowave PTAR system. More detailed conclusions are presented for each subsys- tem in Section 111.
1. MICROWAVE POWER TRANSMISSION
Transferring gigawatt power levels between two points using micro- waves is feasible.
2. SINGLE COMPARED TO MULTIPLE ANTENNAS
Each SPS microwave power transmission system should use one trans- mit antenna with contiguous radiating subarrays rather than multiple separate antennas.
3. FREQUENCY
The power transmission frequency of 2.45 gigahertz has been deter- mined to have advantages for power transmission and reception based on system trade-offs including (a) transmit antenna and rectenna sizing, (b) propaga- tion effects through the atmosphere, (c) hardware technology projections, and (d) ISM band utilization.
4 . MICROWAVE SYSTEM SIZING
Transmit antenna size (1 kilometer), rectenna size (10 kilometers minor axis), and power delivered to the utility grid (5 gigawatts) have been determined on the basis of minimum cost of electricity per kilowatthour. The trade-offs were based on a maximum rf power density limit on the transmit an- tenna of 23 kW/m2 (tube configuration), a maximum power density through the ionosphere of 23 mW/cm2, and the current projections of microwave system efficiencies. have a different thermal limit and different system efficiencies, resulting in different system sizes.
A microwave system using solid-state power amplifiers will
5. TYPE OF TRANSMITTING ANTENNA
The transmitting antenna should be a phased array using slotted- waveguide feed techniques to meet the requirement of maximum power-transfer efficiency .
231

6 . TYPE OF RECEIVING ANTENNA
An SPS rectenna concept theoretically capable of recovering all rf energy impinging on its surface with direct rf-to-dc conversion provides the required maximum conversion efficiency.
7. ANTENNA CONSTRUCTION AND SUBARMY ALINEMENT
Construction of a 1-kilometer-diameter antenna array with a *1- arc-minute flatness tolerance appears to be within the state of the art if low-CTE materials are used. Antenna subarray alinements, both initially and operationally, can be maintained to *3 arc-minutes by the use of azimuth- elevation mounts and laser measurement techniques.
8. POWER BEAM STABILITY
On the basis of analytical simulations and experimental evalua- tions, it appears feasible to automatically point and focus the power beam with minimum wander (2250 meters) and automatic fail-safe operation (rapid beam defocusing).
B. REMAINING ISSUES
In addition to the preceding conclusions, certain remaining issues have been identified and must be addressed in any follow-on program. These issues are for the overall microwave PTAR system.
1. Microwave PTAR system performance
2. Noise and harmonic characteristics
3. Antenna transmission efficiency
4. Beam-forming accuracy
5. Beam-pointing accuracy
6 . Beam security
7. Power beam/pilot beam isolation
8. Effects of ionospheric/atmospheric disturbances on pilot signal
9. Mechanical alinement/tolerances
10. End-to-end system efficiency
11. Corona (tube configuration only)
12. Multipacting (tube configuration only)
13. Plasma (tube configuration only)
232

14. RFI effects on selected hardware
15. Unit costs
16. Alternate technologies
a. Solid state
b. Magnetron
17. Possible new technologies
a. Photoklystron
b. Gyrocon
More detailed issues identified for each subsystem are discussed in Section 111.
Lyndon B. Johnson Space Center National Aeronautics and Space Administration
Houston, Texas, November 12, 1980 953-36-00-00-72
233


APPENDIX - WORKSHOP ON MICROWAVE POWER TRANSMISSION SYSTEM FOR THE SOLAR POWER SATELLITE, REVIEW PANEL FINAL REPORT
INTRODUCTION
The Solar Power Satellite (SPS) Workshop on Microwave Power Transmission and Reception was held at the NASA Lyndon B. Johnson Space Center (JSC) in Houston, Texas, on January 15 to 18, 1980. The objectives of this workshop were ( 1 ) to assess and critique the assumptions, methodologies, and conclu- sions of the NASA SPS studies and (2) to identify and assess critical issues and make recommendations for follow-on work.
The workshop review panel consisted of individuals with expertise and experience in each of the areas relevant to the SPS microwave system. Dr. Robert C. Hansen of R. C. Hansen Inc. and Professor Bernard D. Steinberg of the University of Pennsylvania both provided expertise in the area of microwave beam shaping and phase control. Professor Aldo V. da Rosa of the Stanford University Radioscience Laboratory was the expert on microwave- ionosphere interactions. Mr. Harry Goldie of Westinghouse and Dr. Paul Tallerico of the Los Alamos Scientific Laboratory contributed in the area of high-power microwave tubes. Professor William L. Wilson, Jr., of Rice University provided expertise in the area of solid-state microwave devices and waveguides. Dr. John W. Freeman, Rice University Professor of Space Physics and Astronomy, and chairman of the workshop, represented a broad knowledge of the SPS concept and its historical development and of microwave energy conversion devices.
The format of the workshop consisted of presentations by NASA and con- tractor personnel in each of the following areas: system performance, phase control, power amplifiers, radiating elements, rectenna design, solid-state devices, and planned program activities. These presentations were arranged by Mr. R. H. Dietz of JSC. A large amount of material was presented. Follow- ing each day's presentation, the review panel met privately and discussed the material that was presented. They also met for the entire afternoon of the last day to discuss their conclusions. Administrative arrangements were made by Texas A. & M. University under the direction of Dr. Richard E. Thomas, Di- rector, Center for Strategic Technology.
The format of this report consists of a brief summary of the reference system, a presentation of general conclusions by the panel, specific conclu- sions in each of the major topic areas (including a discussion of solid-state microwave devices under the heading "Microwave Amplifiers"), and a summary.
235

SUMMARY OF THE REFERENCE SYSTEM
According to the DOE/NASA reference system report (ref. 11, the SPS mi- crowave system could consist of a large array (about 100 000) of high-power klystrons grouped into subarrays and feeding an array of slotted waveguides (spacetenna). The high-power klystrons would be powered by 40-kilovolt powerlines from a series/parallel solar cell array.
Solid-state microwave amplifiers have also been investigated.
The klystrons would be phase controlled at the subarray or individual klystron level in such a manner as to produce as nearly as possible a parallel-beam, plane wavefront launched from the 1-kilometer-diameter space- tenna and directed at a 10-kilometer-diameter rectenna located on the surface of the Earth. Phase control would be accomplished by a retrodirective pilot beam launched from the center of the rectenna and phase conjugated with the help of an onboard phase reference signal to provide the proper phase angle for each subarray or klystron.
Main beam conversion to direct-current (dc) electricity at the ground would be accomplished by rectifier-filter circuits attached to each dipole antenna in the rectenna array. The dc power output from the rectenna would be about 5 gigawatts.
The primary constraining factors on the beam power are the 21-kW/m2 heat dissipation limit on the spacetenna and the hypothetical 23-mW/cm2 power den- sity limit on heat-balance disturbances to the ionosphere. operating frequency of 2.45 gigahertz has been chosen. The overall microwave system efficiency for the reference system is estimated by NASA to be 61.1 percent. Microwave power levels at the rectenna edge are constrained to 1 mW/cm2 and are less than 0.1 mW/cm2 beyond 0.7 kilometer from the rectenna edge. For further details on the reference system, see references 1 and 5.
The main beam
GENERAL CONCLUSIONS BY THE PANEL
First and foremost, the review panel wishes to indicate that it is im- pressed with the large quantity of excellent work which has been done on the SPS microwave system. Given the relatively short time that the system has been under study and the modest funding available, the results to date are im- pressive. The dedication of a number of individuals is clearly apparent.
The panel believes that a microwave power transmission system for the SPS is probably technically feasible, given sufficient resources in terms of funding and time. is "cautious optimism." It is likely, however, that the final system will bear little resemblance to the present reference system. The panel feels that it is imperative that NASA not become locked on to the reference system as a basis for all future design. In some areas, such as the retrodirective phase control system and rectenna design, the review panel questions the pres- ent reference system approach.
Perhaps the best phrase to describe the panel's attitude
236

The panel believes that top priority should be given to determining a hard upper limit for the permissible microwave power density which can be sent through the ionosphere. The number being used, 23 mW/cm2, is based on an obsolete theoretical foundation and is without experimental support, and yet it is the constraining parameter in a number of the SPS design areas. Sufficient funds and resources should be allocated so that this question can be answered as soon as possible.
There should be more emphasis on systems engineering in the SPS and mi- crowave system design. Sensitivity trades should be employed more frequently to reveal optimum design parameters and directions. Design decisions made early in the program do not appear to have been subject to continued scru- tiny and review. overall concept should be done on a frequent basis. A systems-level failure analysis should be done. There should be some effort expended toward ensur- ing that the entire system will fail gracefully, and not in a catastrophic manner. some areas.
Updating the design approaches and major reviews of the
Detailed design work has gotten ahead of systems-level planning in
The design philosophy appears to be based solely on optimizing the effi- ciency of each individual component of the system. More emphasis is needed on evaluating the cost sensitivity of the design, with the possibility of achieving a slightly less efficient system that is considerably less expen- sive. One area in which this is particularly true is the rectenna. A lower cost rectenna, if it could be achieved, might allow one satellite to use widely separated rectennas, with the beam shifting from one to the other as the peak load shifts.
It would be useful to attempt to feed innovative or novel ideas into the design concept from time to time, rather than trying always to refine the original reference design. The panel feels that some of the major electron- ics and communications companies should become involved in the microwave system design, since some of the design concepts do not appear to be up to contemporary standards for equivalent military systems.
The panel feels that any experimental work at this stage of the SPS systems development should be very carefully considered. In some instances, some hard data are needed before further planning can be undertaken. Bread- boarding a particular system, however, just to demonstrate a concept, does not seem warranted until further systems review has been accomplished. Microwave systems are critically dependent on the precise configuration and components which are used in their construction. Building a system in the laboratory that does not resemble the deployed system will not yield much useful information and is probably a waste of resources.
The problem with radiofrequency (rf) interference from the SPS micro- wave system appears to the panel to be severe and not adequately addressed at this time. Not only are the noise sidebands from the transmitter uncom- fortably close to the maximum limits set by the radio astronomers, but the harmonic radiation from the SPS as well as reradiation from the rectenna appear particularly bothersome. At the power levels envisioned with this concept, intermodulation products between harmonics and many other rf sources
237
will be a major concern. There does not appear to be enough emphasis at the systems planning level for controlling the harmonic generation and radiation pro b 1 em.
It was apparent from the workshop presentation that not enough attention has been paid to the problem of security and antijamming. State-of-the-art cryptography and National Security Agency security standards should be built into the system design from the outset. Coordination with appropriate agen- cies should begin now so that a smooth integration of their requirements into the SPS system can be achieved.
Finally, the panel feels that the project organization and structure could be improved in the next phase of the program. Greater coordination is required between the various contractor efforts. In view of the large number of design areas now needing work, it is possible that the concept of two par- allel programs has outlived its usefulness. There should be a single NASA program office in charge of the SPS system which could oversee the develop- ment of the entire project.
SPECIFIC CONCLUSIONS ON MAJOR TOPIC AREAS
Beam Forming and Control
Phase control for beam forming is crucial to successful operation of the SPS. Phase control is more critical than many of the other subsystems and components because failure to function within tolerances can cause a sudden and complete loss of power transfer to the ground. The design must have some kind of redundancy or protection at the subsystem level to prevent catastroph- ic failure.
The reference system - The current LinCom scheme for achieving reference phase control has a major disadvantage. The power transmitters at 2.45 gigahertz tend to interfere with the onboard pilot receiver. This interfer- ence is suppressed by the use of a high-rejection-ratio/narrow-band notch filter, by separating the sidebands of the pilot waveform, and by the use of the spread-spectrum antijamming improvement ratio. This approach is unaccept- able because long-term stability of the deep notch filter is unlikely with existing technology. suppression is very beneficial. Spread spectrum should also be added to the system for antijamming and antispoofing. It is recommended that this approach be continued, provided the notch filter problem can be solved, and that the use of spread spectrum be expanded for antijamming protection also.
Use of the spread spectrum to achieve rf interference
Alternative phase control systems - The broadcast onboard reference sig- It is rugged, nal idea presented by Rockwell International appears feasible.
resilient, and relatively simple. It should be pursued. Any scheme which will lower the microwave parts count in the phase control system should be given a high priority for further study. to eliminate the uplink pilot system for beam forming. This step would elimi- nate possible ionosphere problems and reduce the possibility that the SPS
It would be desirable, if possible,
238

would suffer sudden and complete loss of function if the uplink should suddenly fail or be interrupted.
Ground-based pilot systems that have most of the sophisticated hard- ware and subsystems on the ground are the best of the pilot signal types and should be pursued further. There are two very severe problems, however. First, on the order of 150 to 200 decibels isolation is needed from the downlink signal. This is an extremely difficult task. Second, as the sys- tem ages, tuning drifts and changes in impedance levels will take place. As many components as possible should be under closed-loop control to compen- sate for phase changes due to drift. Every circuit shown to the review panel had some open-loop parts in the phase control scheme. It must be demonstra- ted that any proposed system can overcome these problems.
An even more subtle phase drift problem exists. Certain components under the closed-loop subsystem will, when they age and mistune, produce phase changes in the larger part of the system to which they belong; for example, the voltage-controlled oscillator (VCO) phase-lock loop that is frequency controlled. When the free-running frequency of the VCO drifts, its closed-loop frequency does not shift, which is proper. However, the loop bias voltage needed to maintain the correct frequency will change to compensate for the drift. This change will be reflected directly as a phase-shift change in the path through the phase-lock loop. Work should be undertaken to investigate the effects of aging on any system performance. All contractors should examine the aging tolerances of their systems.
Separation of steering and phase control - The one-sigma error of the attitude control system is several times larger than the required steering accuracy. The gimbal-angle steering error could be reduced to acceptable levels by using a monopulse aiming system. A secure coded transmitter on the ground would be received by a line of a few horns dispersed across the face of the spacetenna. The baseline should be roughly 200 meters. This link margin should allow a monopulse improvement factor of about 50, plus antijamming capability. performed independently by a system that only needs to keep the surface of the module phase center flat. Thus, beam steering would be accomplished with one system, and phase control and surface flattening would be achieved with another. The pointing of the beam in the axis normal to the gimbal axis may also need some improvement. For this function, another monopulse set may be used. The monopulse outputs could be used either to control the phase of the power modules or to drive small correction drive motors or thrusters. If the two functions of beam steering and phase control could be thus separated, a wider range of options would be available for the choice of the phase control system.
The actual power module phasing could then be
Phase and amplitude error estimation - The SPS spacetenna array of power modules will have a statistical error distribution over each subarray in the system. However, the phase at the center of each subarray will have a differ- ent statistical error distribution. should be developed to analyze this problem so that accurate tolerance values can be developed. Monte Carlo computer simulations are risky for two reasons.
A probabilistic random error theory
239

First, an array with more than a hundred thousand elements cannot be realis- tically simulated. Second, many computer runs must be made to establish the probability distribution function value. With only a few dozen runs, only smoothed values are obtained. Monte Carlo should be used as an adjunct to probabilistic formulas.
Far side lobes - The beam patterns generated thus far may be somewhat op- timistic in the far-out side lobes. Excluded from the analysis of the radia- tion pattern has been the effect of position errors in the phase centers of the subarrays and modules. distant side lobes has not been calculated. There is some angle away from the main lobe beyond which the side-lobe pattern begins to deviate from the design pattern and tends toward the side-lobe properties of a random array. This angle should be calculated and the effect determined. If the subarrays are rigid and ideally manufactured, and if all the in-plane distortion is associated with their relative positions, then the average side-lobe level be- yond the angle mentioned previously is below the main lobe by 38 decibels plus the relative gain of the subarray patterns in that angular region.
In particular, the effect of these errors on the
If there is also distortion in the subarray, then the problem becomes somewhat less obvious. The subarray levels probably become worse, although there might be a situation in which they would be improved by about 12 deci- bels (100 000 modules in contrast to 7000 subarrays). This effect should be studied. Even if the subarray is rigid, however, manufacturing and installa- tion tolerances on the modules within the subarray will introduce a priori un- known position errors which will affect the average far-out side-lobe level. Thus, it is possible that power which is lost to the side lobes may be some- what higher than predicted. This effect should also be given some consid- era t ion.
Beam taper - To achieve a high beam efficiency, an array amplitude taper of 8 to 10 decibels is indicated. This taper should not be approximated in a stairstep fashion by subarrays of constant amplitude. Instead, each sub- array should have its own amplitude taper in both coordinates to obtain the smoothest approximation to the desired array excitation. Of course, with square subarrays, a circularly symmetric array excitation cannot be exactly realized, but the stairstep can be bettered as it produces higher side lobes than necessary. In choosing the overall excitation function, distributions which are easy to integrate should be avoided. Instead of easy mathematics, the design should be based on good physics. The antenna art now designs distributions by placing zeros at the proper places for shaping the side-lobe envelope. There are, in fact, rotationally symmetric distributions with low Q, adjustable side-lobe level, and high efficiency. A more advanced design process would construct a distribution that optimizes beam efficiency subject to constraints on distribution edge pedestal and on side-lobe envelope. Such an optimization can be formulated as the ratio of two quadratic Hermitian forms; exact solutions can be calculated. For a program of the importance (and size) of the SPS, crude handbook array distributions are not adequate. At least a distribution with proper zeros should be used, and eventually a constrained synthesis should be employed to optimize beam efficiency. An improvement of 1 or 2 percent can easily pay for good antenna design.
240

Lattice design - Regarding the spacetenna array element lattice, exam- ination of the effective area of an element in an array or an examination of the element active gain which is equivalent, shows that, for small arrays, the lattice should be square with half-wave spacing to maximize gain. As the size of the array increases, the element spacing may be increased without ser- ious gain loss. In the limit of an infinitely large array, the element spacing can be just under one wavelength in a square lattice or 15 percent larger in a hexagonal lattice without any gain decrease. That is to say, the effective area of half-wave dipoles or slots is sufficient to allow these larger spacings in an infinite array as was shown rigorously in reference 56. Thus, since the spacecraft antenna is very large in wavelengths, the slot spacing can, in principle, be made nearly one wavelength except for the ele- ments near the edge. The practical implications are that the waveguides can be operated closer to cutoff to increase slot spacing and that the waveguides need not be contiguous but can be separated. This configuration reduces the weight and complexity of the antenna.
Miscellaneous items - Another consideration which should be included in the system design and evaluations is mutual coupling among the active ele- ments which may have pronounced effect on the phase control system and its behavior. These effects should be studied now. More studies should be under- taken to determine whether phase control at the subarray, rather than the power module, level would be sufficient. Such control could have some sig- nificant cost advantages. Ionospheric effects on the pilot beam are totally unknown, both in magnitude and in temporal behavior. These effects should be studied as soon as possible. Range measurements on the radiating elements will be difficult or impossible to accomplish to the 1-percent-accuracy level. Multipath effects are the major problem. However, it is the feeling of the panel that good range measurements are very important and are worth the in- vestment early in the program. The scan time (1 minute) of the closed-loop system presented by Novar is probably excessively slow to provide the required control.
Although there was not complete agreement, the panel tended to favor a closed-loop phase control system over the retrodirective approach. The on- board broadcast phase reference system presented by Rockwell in connection with the solid-state-sandwich configuration seems appealing because of its freedom from ionospheric variations and interruptions. Work should proceed on both closed-loop and open-loop systems. None of the phase control systems presented are clearly superior at this time.
Microwave Amplifiers
There is still no definite answer as to which choice is optimum for the microwave power amplifier devices. At this time, the klystron looks most fa- vorable, but either the solid-state or the magnetron source may look better later. The question of optimum power transmission voltage and amplifier size should be very carefully studied and reexamined. Some attempt should be made early to determine the maximum voltage which can be safely used in the SPS en- vironment, as this has a significant bearing on many design decisions. If it is not possible to operate at 40 to 50 kilovolts, klystrons can not be used.
24 1

Better ohmic efficiencies will be obtainable with higher voltages, and the klystron efficiencies will increase as well. On the other hand, reliability of power-conditioning equipment and the klystron tubes themselves will proba- bly decrease as the voltage increases. Some test of a high-voltage array, perhaps piggyback on a Space and Missile Systems Office (SAMSO) mission in geosynchronous orbit, should be considered. Tests in low Earth orbit will not be satisfactory since the two plasma environments differ significantly. Moreover, the SPS itself may significantly alter the geosynchronous-orbit plasma environment.
Noise and harmonics - One of the major problems with any of the power amplifiers being considered is that of noise and harmonic generation. It appears most likely that the klystron will have much less noise than either the field-effect transistor or the magnetron. The noise question should be answered at the device level first. Once a device has met the noise require- ments, subarray tests should be started to examine the mutual-coupling be- havior. Inasmuch as klystron characteristics do not scale well, no effort should be spent on developing a lower power klystron than that anticipated for actual use in the SPS.
Solid-state devices have to overcome problems of noise, efficiency, and high-temperature operation before they can become viable contenders in the SPS microwave system. answers to some of these more important questions before the devices are de- signed into an SPS system. Noise and harmonic generation, as well as opti- mum efficiency operation, can best be determined by a well-designed and well- executed computer model. A sophisticated model which takes into account all of the device parameters will be most useful in determining optimum perform- ance. The development of this computer model should be tightly coupled with a device development program. should be compared with the model to make it as realistic as possible. Once a good model has been built, global studies of device performance under var- ious load conditions should be undertaken. Sensitivity studies should be made to determine the extent of load mismatch which would be permissible with these devices. Finally, harmonic generation and sensitivity to changes in the load at the second harmonic should be made to determine the degree of harmonic suppression that can be reasonably achieved.
The solid-state program should be aimed at getting
Actual operating waveforms and efficiencies
Solid-state testing - As soon as reasonable solid-state devices can be fabricated, an extensive test program should be initiated for determining failure mechanisms and radiation sensitivity. Cooling and maximum allowed temperature are critical to the design of a solid-state microwave system. Further information on these parameters is needed. Cost may become a serious problem for the solid-state devices because of the large quantities that will be required.
Magnetrons - Injection-locked magnetrons may offer substantial promise from a cost point of view; however, substantial work is needed at the device level in the area of noise reduction and improved efficiency. The panel rec- ommends further work in this area.
242

Klystron cooling - The panel is concerned about the long-term stability of the.water-cooling design for the klystron. Corrosion and eventual leakage could be a major problem. Studies should be initiated soon to evaluate this problem. Of particular concern is electrolytic action among dissimilar metals and the effects of leaking water on the integrity of the rest of the SPS system.
Device efficiency - In most of the efficiency budgets produced so far, only the most optimistic predicted values have been used for the estimates of dc to rf conversion. A more conservative approach would be to use demon- strated efficiencies, with the variabilities of loading and performance in- cluded in the model. The best estimate and the worst estimate should be compared so that the expected range of system performance can be determined. For the klystron, the power lost in the collector power supply should be in- cluded in the efficiency estimate; otherwise, comparisons with other devices are not valid.
Ground-Based Exploratory Development recommendations - In summary, the Ground-Based Exploratory Development (GBED) Program should aim at producing a high-efficiency, high-power klystron. This tube should then be evaluated carefully for its noise and efficiency characteristics. Phase-locked magne- tron development should continue at the device level, with particular empha- sis placed on noise reduction and efficiency enhancement. The solid-state amplifier should be developed further with emphasis on research at the device level rather than at the systems level. Work on innovative concepts such as the photoklystron should be encouraged.
Radiating Elements
Materials - The principal problem the panel identified in the radiating-element area is related to materials. Aluminum appears attractive except for its poor thermal-expansion characteristics. Work should be initiated to determine whether there are any manufacturing or design tech- niques which would ameliorate this to some degree. An estimate should be made of the maximum thermal distortions which can be expected, and these should be fed back into the antenna radiating pattern calculations. Arbi- trarily picking a number of 0.64 centimeter ( 1 / 4 inch), as was done in the study, does not seem realistic enough.
Problems of 12R losses should also be addressed early so that poten- tial later snags can be avoided. Whatever manufacturing technique is fi- nally selected, low loss must remain one of the fundamental requirements. A set of principles should be developed for use in guiding the mechanical design.
Although low coefficient of thermal expansion composites were mentioned frequently during the workshop, no evidence was presented to indicate that these materials would in any way be suitable for microwave circuitry on the SPS. Obvious problems include outgassing from the epoxies, conductor adhe- sion problems, and fabrication techniques. Because little is known about
243

these materials currently, they should not be given extensive consideration in the SPS design.
Multipacting - The multipacting problem was mentioned frequently. A l - though this phenomenon is fairly well understood, data currently are insuffi- cient to enable predicting whether it will be a problem in the microwave sys- tem radiator. A set of experiments should be defined which will permit rea- sonable estimation of the extent of the problem in the SPS environment. This includes outgassing tests on the epoxy composite.
Testing - Many types of tests must be performed on both the power mod- ules and the subarrays before their microwave performance will be known with certainty. In particular, it is important to determine either the radiating power efficiency or the antenna gain. Measurement of either of these to an accuracy of 1 or 2 percent is extremely expensive, and perhaps not even feasi- ble. The large size of the subarray means that a very large range must be used for far-field testing. There is no existing range that has sufficiently low multipathing to allow such accurate measurements. Most anechoic chambers have background levels higher than -50 decibels. For a 1-percent-accuracy measurement, the background must be lower, as the low-level side lobes can have a significant effect on the antenna gain. One alternate approach would be to measure antenna patterns and waveguide losses separately. The antenna pattern would require a high-quality anechoic chamber and many pattern cuts. Waveguide attenuation losses could be made on long sections of guide. These measurements, coupled with carefully measured impedance characteristics of the entire subarray, would be sufficient to characterize the entire spacetenna performance.
Harmonics - Finally, the problem of harmonic interaction with the radiating structure needs to be addressed. It will not be feasible to place filters, circulators, or much else between the power amplifier and the radia- ting element without introducing unacceptable losses. Thus, harmonic suppres- sion on the SPS itself must be achieved with the design of the radiating elements.
The Rectenna
The rectenna was given much early work and development but has been neglected in more recent SPS history. as the present microwave system rectenna concept needs considerably more work. The major problems which the panel sees are those of weather protec- tion, parts count, and harmonic reradiation. The demonstrated efficiencies at Goldstone have shown that the basic concept is reasonable but have not answered the question of scaling this approach to SPS power levels and larger mass-produced arrays.
This does not seem to be a good idea,
Harmonics - The main concern of the panel was that of harmonic genera- tion and reradiation from the individual rectenna elements. The amount of harmonic suppression possible with any economically reasonable filter placed on 1O1O individual elements does not seem to be sufficient to limit the har- monic signals to an acceptable level. The only logical approach is to seek
244

ways to lower the number of individual receiving elements so that more care can be exercised in their design and construction. nic Institute work was pointing in that direction, and the panel feels that a lot more effort should be expended toward further developing microwave- concentrating schemes such as the Boeing hogline.
The Rensselaer Polytech-
Weather protection - It is a certainty that some form of weather protec- tion or radome will be needed over all of the active elements in the rectenna. This feature, which has not really been considered in current rectenna de- signs, must be considered from the outset, as it will have significant ef- fects on the physical construction of this costly component of the microwave system.
Element lattice design - With regard to the rectenna element lattice de- sign, the narrow beam width, the high gain, the active element impedance, and the active element pattern that are characteristic of a large phased array arise from the fact that the elements are phase-coherently combined by a mi- crowave network. The rectenna has external mutual coupling but not internal rf connections. Thus, the external mutual coupling affects the impedance of each element. But such an array, in which each element is connected to an in- dependent resistive load, does not have the narrow beam width, the high gain, etc., of the phased array. This is fortunate for it allows realistic toler- ances to enable satisfactory performance. There is, however, a corollary. The internal mutual coupling which increases element capture area as spacing increases, up to grating-lobe appearance, is not operative. Thus, for a half-wave slot or dipole over a ground plane, the effective area appears to be that of the isolated element, which is 0.261 times the square of the wavelength. Thus, the rectenna lattice should be square with a spacing just above one-half wavelength. However, it is not necessarily true that the ele- ment effective area is square, which may require an adjustment of the lat- tice. Clearly, more work should be done on this problem, but conventional unit cell active impedance approaches appear to be useless.
Cost effectiveness - The rectenna is currently a major cost factor in the total SPS system. As such, it should be subjected to careful cost- effectiveness-sensitivity studies, which might point toward a slightly less efficient system but with substantial cost savings. For example, at the outer edge of the rectenna, the cost in dollars per watt appears to be higher than that for surface-deployed solar cells at the SPS solar cell cost. In other words, it would be more cost effective to replace a substantial frac- tion of the outer area of the rectenna with solar cells.
SUMMARY
In summary, it is the consensus of the microwave power transmission and reception workshop review panel that a 5-gigawatt SPS microwave power trans- mission system is probably technically feasible. However, a large amount of work will be necessary in a number of areas to establish certainty and to de- termine system efficiency, reliability, rf compatibility, security, safety, longevity, and cost.
245

The panel believes that the final system will not resemble the current reference system and urges NASA to ‘recognize this in all future planning. The GBED appears too heavily locked into the reference system.
RE COMMENDAT IONS
The panel recommends more attention to systems engineering and failure There should be more sensitivity studies to optimize cost effec- Attention should be paid to system security and antijamming There should be periodic overall design reviews to update critical
analysis. tiveness. features. design parameters.
In view of the magnitude and potential importance of the SPS, the panel recommends major program management status and a single program office within NASA for greater coordination of the contractor effort. Finally, the panel applauds the outstanding effort to date by the SPS team and is impressed with the very good progress which has been made thus far.
246

mFERENCES
1. S a t e l l i t e Power System: Concept Development and Evaluat ion Program, Reference System Report. O c t . 1978. (Also a v a i l a b l e as NASA TM-79762, 1979.)
Rep. DOE/ER-0023, Department of Energy,
2. S a t e l l i t e Power System Concept Development and Evaluat ion Program Plan, J u l y 1977-August 1980. NASA TM-79400, 1978.
3.
4.
5.
6.
7 .
8.
9.
10.
11.
12.
Solar Power S a t e l l i t e System Def in i t i on Study - Phase 111, Fina l Report. Volume 111 - Laser SPS Analysis. Rep. D180-25969-3, Boeing Aerospace Co. (Contract NAS 9-156361, June 1980.
S a t e l l i t e Power System: ume I - Technical Assessment Summary Report. NASA TM-58232, 1980.
Concept Development and Evaluat ion Program, Vol-
Die tz , R. H . , coordinator: So la r Power S a t e l l i t e Microwave Power Trans- mission and Reception, A Workshop Held a t Lyndon B. Johnson Space Cen- ter , January 15-18, 1980. NASA CP-2141, 1980.
Arndt, G. D . ; and Monford, L . G.: So lar Power S a t e l l i t e System S iz ing Tradeoffs. NASA TP-1804, 1981.
Chie, C. M.: S a t e l l i t e , Volume I V , F i n a l Report. LinCom Corp. (Contract NAS 9-15782). NASA CR- 160458, 1980.
A Ground Based Phase Control System f o r the So la r Power
O t t , J. H.; and R i c e , J. S.: D i g i t a l SPS Phase Control Using Travel ing Wave Interferometry. Novar E lec t ron ic s Corp., Oct. 1978.
Belohoubek, E . F.; Et tenberg, M.; e t al.: F i n a l Report , Analysis of S-Band So l id - s t a t e Transmit ters f o r the Solar Power S a t e l l i t e . RCA Labora tor ies , David Sarnoff Research Center (Contract NAS 9-15755). NASA CR- 160320, 1979.
Gutmann, Ronald J.; and Borrego, Jose M.: S o l a r Power S a t e l l i t e Rec - tenna Design Study: Di rec t iona l Receiving Elements and Pa ra l l e l - S e r i e s Combining Analysis. Rensselaer Polytechnic I n s t i t u t e (Contract NAS 9-15453). NASA CR-151866, 1978.
Arndt, G. D.; and Ber l in , L. A.: Microwave System Performance f o r a Solar Power S a t e l l i t e During Startup/Shutdown Operations. of Fourteenth I n t e r s o c i e t y Energy Conversion Engineering Conference, Vol. 2, American Chemical Soc ie ty (Washington, D.C. 1, 1979, pp. 1500- 1505.
Proceedings
Solar Power S a t e l l i t e System Def in i t i on Study - Phase 11. Reference System Descript ion. Boeing Aerospace Co. (Contract NAS 9-15636). NASA CR-160443, 1979.
Volume I1 -
24 7

13.
14.
15.
16.
17.
18.
19.
20.
21.
22.
23.
24.
Microwave Power Transmission System - SPS System Evaluation - Phase 111, Vol. I. Rep. D180-24635-1, Boeing Aerospace Co. (Contract NAS 9-151961, Mar. 1978.
Solar Power S a t e l l i t e System Def in i t i on Study - P a r t 11. Volume I V - Microwave Power Transmission Systems. Boeing Aerospace Co. (Contract NAS 9-15196). NASA CR-151668, 1977.
Duncan, Lewis M.; and Gordon, W i l l i a m E.: Tonosphere/Microwave Beam I n t e r a c t i o n Study, F ina l Report. Rice Univers i ty (Contract NAS 9-15212). NASA CR-151517, 1977.
Maynard, 0. E.; Brown, W. C.; et al.: Microwave Power Transmission System Studies , Volume 2: In t roduct ion , Organization, Environmental and Spaceborne Systems Analyses. Raytheon Co. (Contract NAS 3-17835). NASA CR-134886, V O ~ . 2, 1975.
Rush, C. M. : Ionospheric Disturbance Overview. Paper presented a t S a t e l l i t e Power System (SPS) Program R e v i e w (Lincoln, Nebr.), Apr. 22- 25, 1980. Rep. DOE/ET-20175-1, Department of Energy, Apr. 1980, p. 64.
Gordon, W i l l i a m E.; and Duncan, L e w i s M.: Ionosphere/Microwave Beam I n t e r a c t i o n Study, F ina l Report. R i c e Univers i ty (Contract NAS 9-15212). NASA CR-151821, 1978.
Arndt, G. D.; and Leopold, L.: Environmental Considerat ions f o r t h e Microwave Beam From a Solar Power S a t e l l i t e . Proceedings of Thir- t een th I n t e r s o c i e t y Energy Conversion Engineering Conference, Vol. 1, Socie ty of Automotive Engineers (Warrendale, Pa.) , 1978, pp. 195-200.
Dickinson, R. M.: Beamed Microwave Power Transmit t ing and Receiving Subsystems Radiat ion Charac t e r i s t i c s . Rep. 80-11, Jet Propuls ion Lah- o ra to ry (Contract NAS 7-1001, June 15, 1980.
Dickinson, Richard M.: Rectenna Array Measurement Resul ts . Solar Power S a t e l l i t e Microwave Power Transmission and Reception, A Workshop Held a t Lyndon B. Johnson Space Center, January 15-18, 1980. NASA CP-2141, 1980, pp. 307-316.
Tracking and Data Relay S a t e l l i t e System - System Design Report, Volume 111. Rep. 2900-200-003-002, TRW Inc., Mar. 26, 1979.
Lindsey, W. C. ; Kantak, A. V. ; Chie, C. M. ; and Booth, R. W. D. : SPS Phase Control System Performance V i a Analy t ica l Simulation. LinCom Corp. (Contract NAS 9-15725). NASA CR-160582, 1979.
Lindsey, W. C.; Scholtz, R. A.; and Chie, C. M.: SPS P i l o t Signal De- s ign and Power Transponder Analysis, Phase 111 Fina l Report - Volume 11. LinCom Corp. (Contract NAS 9-15782). NASA CR-160537, 1980.
248

25.
26.
27.
28.
29.
30.
31.
32.
33.
34.
35.
36.
Brown, W i l l i a m C.: Progress Report on t h e Adapting of t h e Crossed- F i e l d D i r e c t i o n a l Amplif ier t o t h e Requirements of the SPS. S o l a r Power S a t e l l i t e Microwave Power Transmission and Reception, A Workshop Held a t Lyndon B. Johnson Space Center , January 15-18, 1980. NASA CP-2141, 1980, pp. 214-222.
Achievable F l a t n e s s i n a Large Microwave Power Antenna Study, F i n a l Report. General Dynamics Corp., Convair Div. (Contract NAS 9-15423). NASA CR-151831, 1978.
Lindsey, W. C.; and Kantak, A. V.: Automatic Phase Con t ro l i n S o l a r Power S a t e l l i t e Systems, F i n a l Report. LinCom Corp. (Contract NAS 9- 15237). NASA CR-151856, 1978.
Lindsey, W. C.: A S o l a r Power S a t e l l i t e Transmission System Incorpora- t i n g Automatic Beamforming, S t e e r i n g and Phase Control. Rep. TR-7806- 0977, LinCom Corp. (Contract NAS 9-152371, June 1978.
S o l a r Power S a t e l l i t e System D e f i n i t i o n Study - Phase I. Volume 111 - Reference System Desc r ip t ion . Boeing Aerospace Co. (Contract NAS 9- 15636). NASA CR-160372, 1979.
Schroeder, K. G.: White Paper on Experimental S tud ie s Leading t o a S o l i d S t a t e R e t r o d i r e c t i v e Phased Array f o r Microwave Power Transmis- s i o n From a So la r Power S a t e l l i t e . Rockwell I n t e r n a t i o n a l , Nov. 1979.
Nandi, A. K.; and Tomita, C. Y.: Ionospheric E f f e c t s i n Active Retro- d i r e c t i v e Array and M i t i g a t i n g System Design. Microwave Power Transmission and Reception, A Workshop Held a t Lyndon B. Johnson Space Center , January 15-18, 1980. NASA CP-2141, 1980, pp. 159-168.
S o l a r Power S a t e l l i t e
Nalos, E. J.: High E f f i c i e n c y SPS Klystron Design. S o l a r Power Sat- e l l i t e Microwave Power Transmission and Reception, A Workshop Held a t Lyndon B. Johnson Space Center , January 15-18, 1980. NASA CP-2141, 1980, pp. 175-184.
Weir, David G,: l i t e . So la r Power S a t e l l i t e Microwave Power Transmission and Reception, A Workshop Held a t Lyndon B. Johnson Space Center , January 15-18, 1980. NASA CP-2141, 1980, pp. 358-366.
S o l i d S t a t e Device Technology f o r S o l a r Power S a t e l -
S o l a r Power S a t e l l i t e System D e f i n i t i o n Study - Phase 11. Volume I1 - Reference System Descript ion. Rep. D180-25461-2, Rev. A, Boeing Aero- space Co. (Contract NAS 9-156361, Dec. 1979.
Lunden, C. D.; and Lund, W. W.: So la r Power S a t e l l i t e Antenna Element Evaluat ion, F i n a l Report. Rep. D180-25940-1, Boeing Aerospace Co. (Contract NAS 9-15636C), Feb. 1980.
Brown, W. C. : Microwave Beamed Power Technology Improvement. Monthly P rogres s Report no. 19, JPL Contract 955104, Raytheon Co., Jan. 1980.
249

37. Nalos, Ervin J.: Eva lua t ion of "Thick Wall" Wave Guide Element. So la r Power S a t e l l i t e Microwave Power Transmission and Reception, A Workshop Held a t Lyndon B. Johnson Space Center , January 15-18, 1980. NASA CP- 2141, 1980, pp. 245-252.
38. Schroeder, K. G.; Carlise, R. L.; and Tomita , C. Y.: The Resonant Cavi ty Rad ia to r (RCR). S o l a r Power S a t e l l i t e Microwave Power Transmis- s i o n and Reception, A Workshop Held a t Lyndon B. Johnson Space Center , January 15-18, 1980. NASA CP-2141, 1980, pp. 235-244.
39. Brown, W i l l i a m C.: Method f o r P r e c i s i o n Forming of Low-Cost, Thin- Walled S l o t t e d Waveguide Arrays f o r the SPS. S o l a r Power S a t e l l i t e Microwave Power Transmission and Reception, A Workshop Held a t Lyndon B. Johnson Space Center, January 15-18, 1980. NASA CP-2141, 1980, pp. 253-255.
40. F r e i l e y , A. 3.; Batelaan, P. D.; and Bathker, D. A.: Absolute F lux Densi ty C a l i b r a t i o n s of Radio Sources: 2.3 GHz. Jet Propuls ion Labo- r a t o r y (Contract NAS 7-100). NASA CR-156132, 1977.
41. Kozakoff, D. J.; Schuchardt, J. M.; and Ryan, C. E.: Considerat ions f o r High Accuracy Rad ia t ion E f f i c i e n c y Measurements f o r t h e S o l a r Power S a t e l l i t e Subarrays. s ion and Reception, A Workshop Held a t Lyndon B. Johnson Space Center , January 15-18, 1980. NASA CP-2141, 1980, pp. 256-265.
So la r Power S a t e l l i t e Microwave Power Transmis-
42. Woodcock, G. R.; and Andryczyk, R. W.: Rectenna System Design. S o l a r Power S a t e l l i t e Microwave Power Transmission and Reception, A Workshop Held a t Lyndon B. Johnson Space Center , January 15-18, 1980. NASA CP-2141, 1980, pp. 281-290.
43. Gutmann, Ronald J.: Rectenna Session: Micro Aspects. S o l a r Power Sat- e l l i t e Microwave Power Transmission and Reception, A Workshop Held a t Lyndon B. Johnson Space Center, January 15-18, 1980. NASA CP-2141, 198( pp. 291-299.
44. Few, A.: Macro Aspects. Paper p re sen ted a t SPS Workshop on Microwave Power Transmission and Reception (Houston, Tex.), Jan. 15-18, 1980.
45. S o l a r Power S a t e l l i t e System D e f i n i t i o n Study - Phase 111. Volume I V - S o l i d S t a t e SPS Analysis . Rep. D180-25969-4, Boeing Aerospace Go. (Contract NAS 9-156361, June 1980.
46. So la r Power S a t e l l i t e System D e f i n i t i o n Study - Phase 11. Microwave Power Transmission Systems. Boeing Aerospace Co. (Contract NAS 9-15636). NASA CR-160565, 1979.
Volume I V -
47. S o l a r Power S a t e l l i t e System D e f i n i t i o n Study - Phase 111. Volume I1 - F i n a l Br i e f ing . Rep. D180-25969-2, Boeing Aerospace Co., Gruwan Aero- space Corp., and Mass Science Northwest (Contract NAS 9-156361, June 1980.
250

48. Maynard, Owen E.: So l id S t a t e SPS Microwave Generation and Transmis- s i o n Study. Raytheon Co. (Contract NAS 8-331571, Apr. 1980.
S a t e l l i t e Power System (SPS) Concept D e f i n i t i o n Study, Exhi E. Rep. SSD-80-0062, Rockwell I n t e r n a t i o n a l (Contract NAS 8-324751, J u l y 1980.
49.
50. V a n e l l i , J. C.: Design and T e s t i n g of a Master Slave Returnable Timing System for the S o l a r Power S a t e l l i t e . Rep. LEC-10474, Lockheed Elec- t r o n i c s Co., Dec. 1979.
51. So la r Power S a t e l l i t e (SPS) F i b e r Op t i c Link Assessment, F i n a l Report. Boeing Aerospace Co. (Contract NAS 9-15636). NASA CR-160575, 1980.
52. Lunden, C. D.; Lund, W. W.; and Nalos, E. J.: SPS Antenna Element Eval- uat ion. Paper presented a t SPS Workshop on Microwave Power Transmis- s i o n and Reception (Houston, Tex.), Jan. 15-18, 1980.
53. Fitzsimmons, G. W.: SPS S o l i d S t a t e Antenna Power Combiner. S o l a r Power S a t e l l i t e Microwave Power Transmission and Reception, A Workshop Held at Lyndon B. Johnson Space Center, January 15-18, 1980. NASA CP-2141, 1980, pp. 338-347.
54. Brown, W. C.: High Power Microwave Generators of t h e Crossed-Field Type. J. Microwave Power, vo l . 5, no. 4, Dec. 1970, pp. 245-259.
55. Briggs, B. H.; and Parkin, I. A.: On t h e V a r i a t i o n of Radio S t a r and Sat- e l l i t e S c i n t i l l a t i o n s With Zenith Angle. J. Atmospheric Terrest. Phys., vol . 25, June 1963, pp. 339-366.
56. O l i n e r , A. A.; and Malech, R. G.: Mutual Coupling i n I n f i n i t e Scanning Arrays. Microwave Scanning Antennas, R. C. Hansen, ed., Volume 11, Array Theory and P r a c t i c e , ch. 3. Academic P r e s s , 1966, pp. 195-335.
25 1
1. Report No. 2. Government Accession No.
NASA RP-1076 4. Title and Subtitle
SATELLITE POWER SYSTEM: CONCEPT DEVELOPMENT A??D EVALUATION PROGRAM VOLUME I11 - POWER TRANSMISSION AND RECEPTION TECHNICAL SUMMARY AXD ASSESSMENT
7. Author(s1
R. H. Die tz , G. D. Arndt, J. W. Seyl , L. Leopold, and J. S. Kelley
9. Performing Organization Name and Address
Lyndon B. Johnson Space Center Houston, Texas 77058
12. Sponsoring Agency Name and Address
National Aeronautics and Space Administration Washington, D.C. 20546
I 15. Supplementary Notes
3. Recipient's Catalog No.
5. Report Date July 1981
6. Performing Organization W
8. Performing Organization Report No.
S-507 10. Work Unit No.
953-36-00-00-72 11. Contract or Grant No.
13. Type of Report and Period Covered
Reference Publ ica t ion 14. Sponsoring Agency code
I 16. Abstract
Activities i n t h e DOE/NASA Concept Development and Evaluation Program are discussed f o r t h e s o l a r power sa te l l i t e power t ransmission and recept ion system. A t e c h n i c a l summary i s provided together with a summary of system assessment a c t i v i t i e s . System opt ions and system d e f i n i t i o n d r i v e r s are b r i e f l y described. Major system assessment a c t i v i t i e s have been i n support of t h e re ference system d e f i n i t i o n , s o l i d - s t a t e system s t u d i e s , c r i t i c a l technology supporting i n v e s t i g a t i o n s , and var ious system and subsystem trade- o f f s . n a t i v e concepts f o r each of t h e subsystem areas. Conclusions reached as a r e s u l t of t h e numerous a n a l y t i c a l and experimental eva lua t ions are presented. ing i s s u e s f o r a p o s s i b l e follow-on program are i d e n t i f i e d .
These a c t i v i t i e s are descr ibed together with re ference system updates and alter-
F i n a l l y , remain-
17. Key Words (Suggested by Author(s1) RF transmission e f f i c i e n c y Rectenna Antenna Sol id-s ta te Ionospheric dis turbances devices Microwave Phase c o n t r o l Wave propagation RF power
ampl i f ie rs
18. Distribution Statement Unclassif ied - Unlimited
Subject Category 4 4
19. Security Classif. (of this report) 20. Security Classif. (of this page) 21. NO. of Pages 22. Price'
Unclass i f ied Unclassif ied 277 A1 3 L