savills plcir.savills.com/~/media/files/s/savills-ir-v2/annual reports/company... · results 1...
TRANSCRIPT
Savills plc
Results for the year ended 31 December 2017
15 March 2018
Disclaimer: Forward-looking statements
2
These slides contain certain forward-looking statements including the Group’s financial condition, results of
operations and business, and management’s strategy, plans and objectives for the Group. These statements
are not guarantees of future performance and are subject to risks, uncertainties and other factors, some of
which are beyond the Group’s control, are difficult to predict and could cause actual results to differ materially
from those expressed or implied or forecast in the forward-looking statements. These factors include, but are
not limited to, the fact that the Group operates in a highly competitive environment. All forward-looking
statements in these slides are based on information known to the Group on the date hereof. The Group
undertakes no obligation publically to update or revise any forward-looking statements, whether as a result of
new information, future events or otherwise.
Results
1 Introduction, Highlights & Business Development 2 Financial Review 3 Management Focus &
Summary & Outlook
3

Introduction, Highlights & Business Development
4
Highlights
5
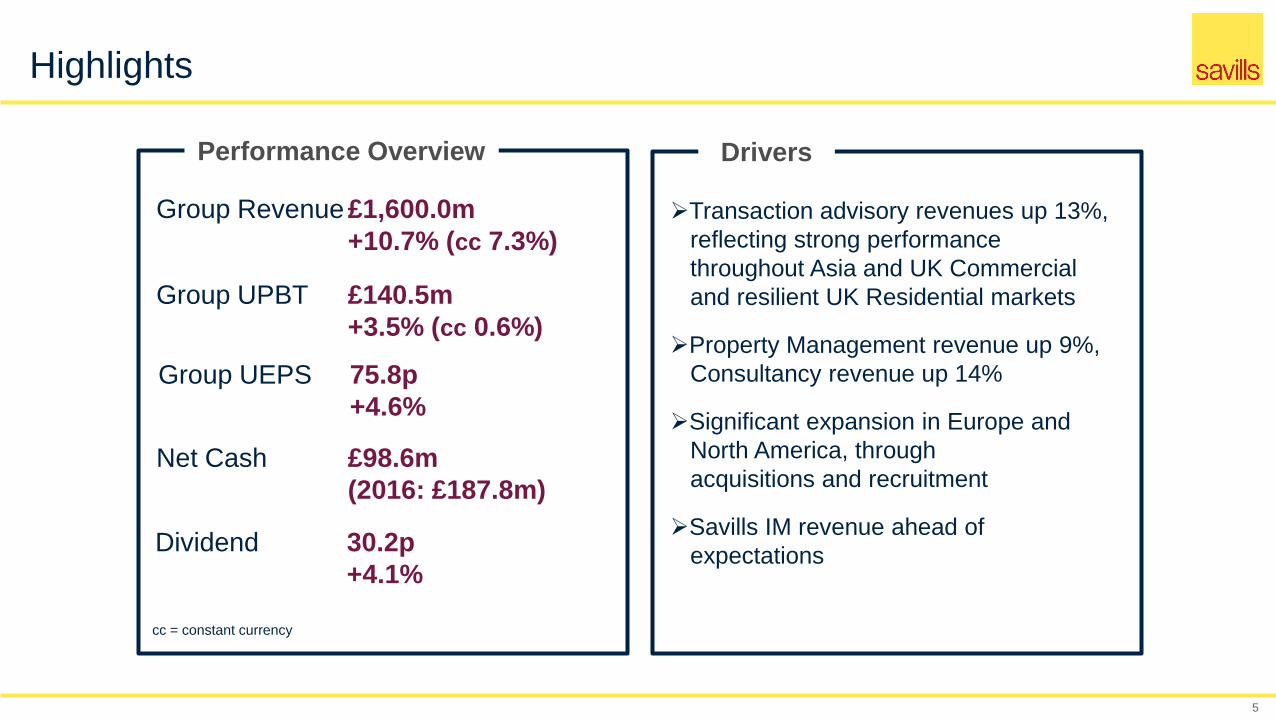
Performance Overview Drivers
Group Revenue£1,600.0m
+10.7% (cc 7.3%)
Group UPBT £140.5m
+3.5% (cc 0.6%)
Transaction advisory revenues up 13%,
reflecting strong performance
throughout Asia and UK Commercial
and resilient UK Residential markets
Property Management revenue up 9%,
Consultancy revenue up 14%
Significant expansion in Europe and
North America, through
acquisitions and recruitment
Savills IM revenue ahead of
expectations
Group UEPS 75.8p
+4.6%
Net Cash £98.6m
(2016: £187.8m)
Dividend 30.2p
+4.1%
cc = constant currency
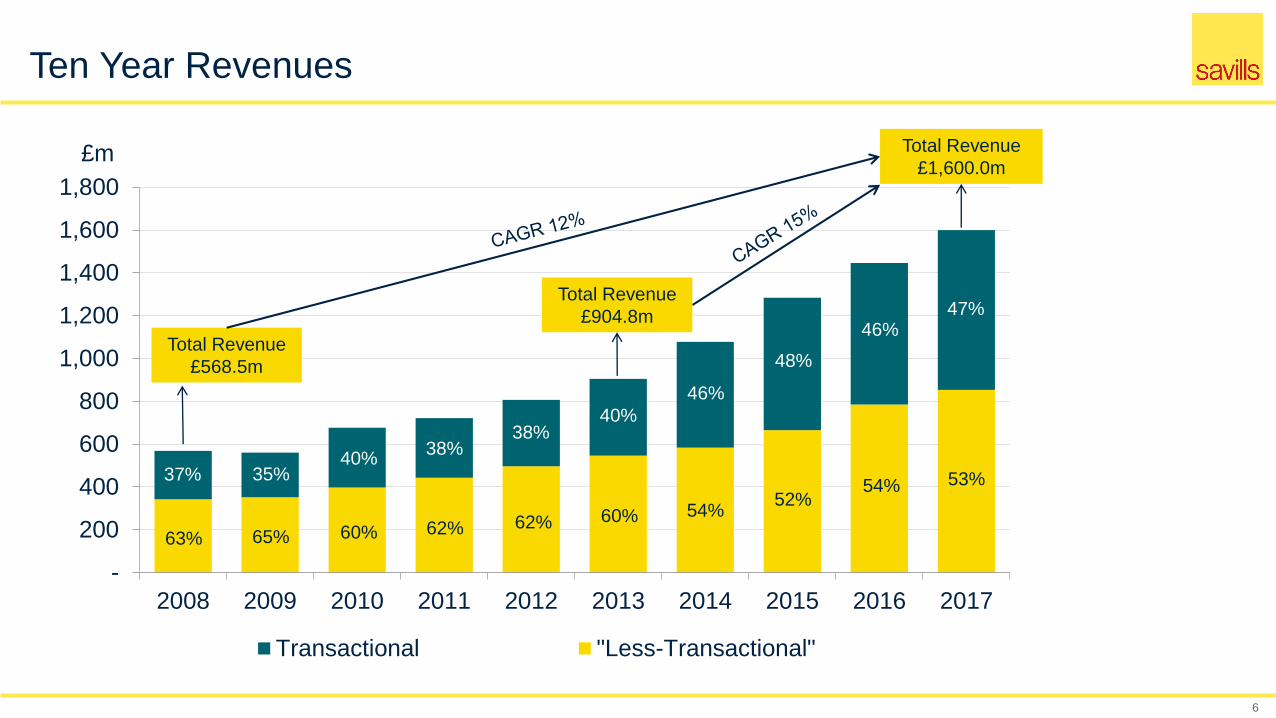
Ten Year Revenues
6
-
200
400
600
800
1,000
1,200
1,400
1,600
1,800
2008 2009 2010 2011 2012 2013 2014 2015 2016 2017
£m
Transactional "Less-Transactional"
Total Revenue
£904.8m
Total Revenue
£1,600.0m
Total Revenue
£568.5m
47%46%
48%
46%
40%38%
38%40%
35%37% 53%54%52%
54%60%62%62%60%65%63%
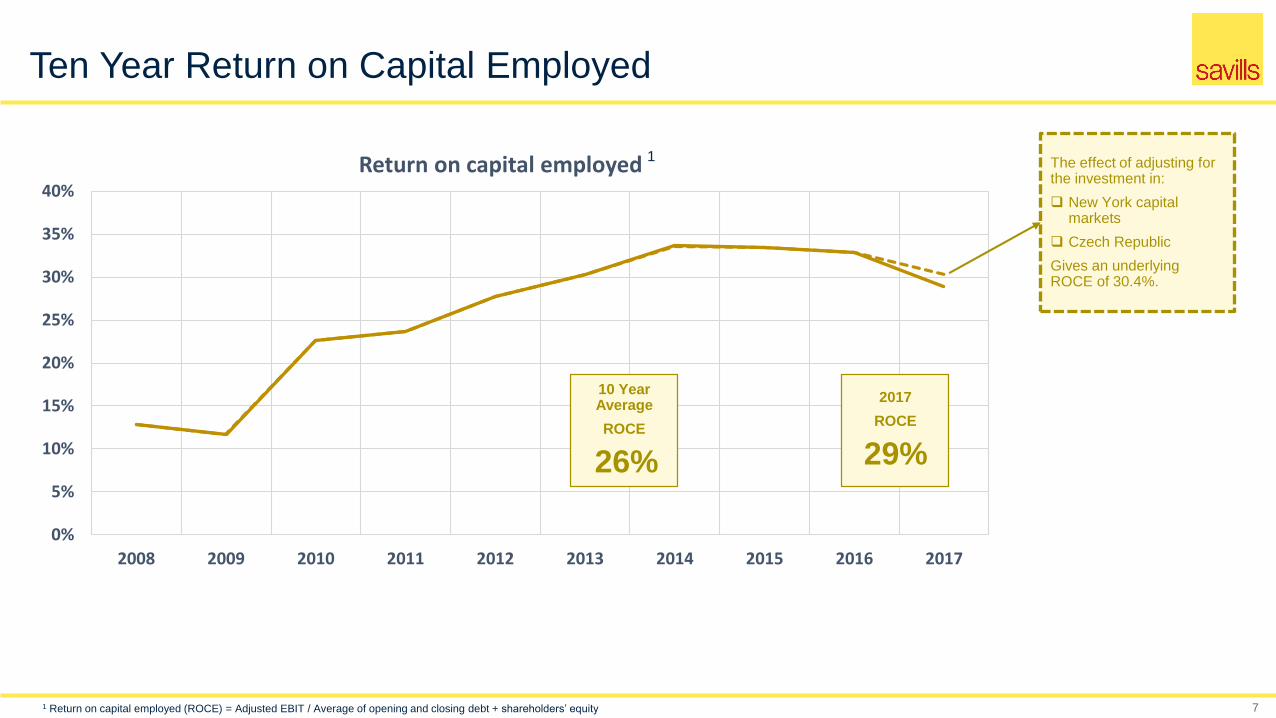
Ten Year Return on Capital Employed
71 Return on capital employed (ROCE) = Adjusted EBIT / Average of opening and closing debt + shareholders’ equity
The effect of adjusting for the investment in:
New York capital markets
Czech Republic
Gives an underlying ROCE of 30.4%.
0%
5%
10%
15%
20%
25%
30%
35%
40%
2008 2009 2010 2011 2012 2013 2014 2015 2016 2017
Return on capital employed
2017
ROCE
29%
10 Year Average
ROCE
26%
1
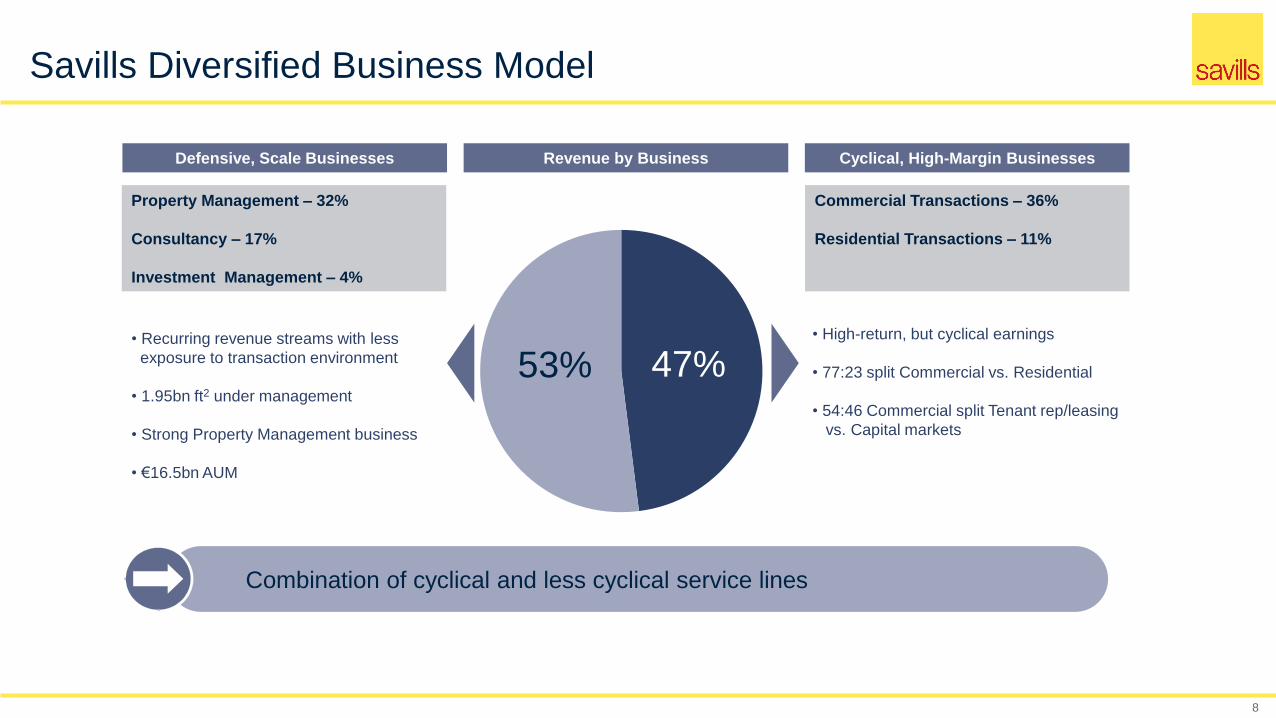
Savills Diversified Business Model
8
Defensive, Scale Businesses Revenue by Business Cyclical, High-Margin Businesses
Property Management – 32%
Consultancy – 17%
Investment Management – 4%
Commercial Transactions – 36%
Residential Transactions – 11%
• Recurring revenue streams with less
exposure to transaction environment
• 1.95bn ft2 under management
• Strong Property Management business
• €16.5bn AUM
• High-return, but cyclical earnings
• 77:23 split Commercial vs. Residential
• 54:46 Commercial split Tenant rep/leasing
vs. Capital markets
47%53%
Combination of cyclical and less cyclical service lines
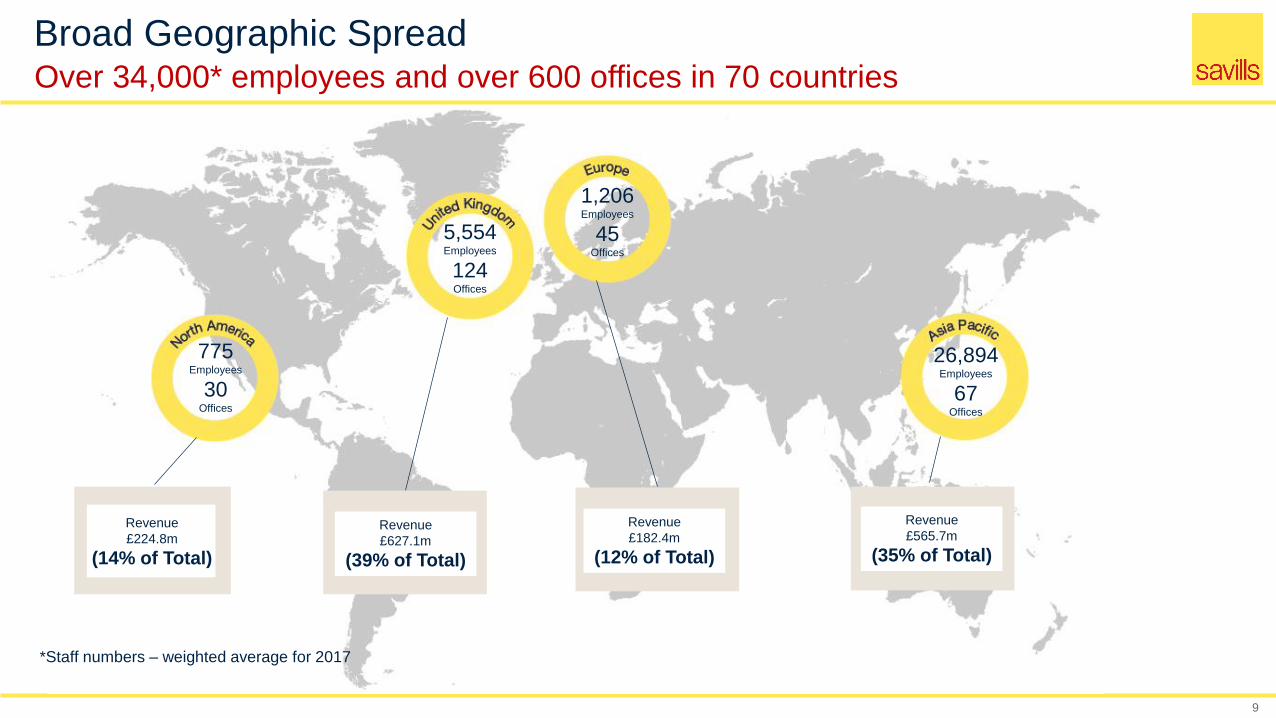
Broad Geographic Spread
9
580Employees
5,554Employees
124Offices
1,206Employees
45Offices
26,894Employees
67Offices
Revenue
£224.8m
(14% of Total)
775Employees
30Offices
*Staff numbers – weighted average for 2017
Revenue
£627.1m
(39% of Total)
Revenue
£182.4m
(12% of Total)
Revenue
£565.7m
(35% of Total)
Over 34,000* employees and over 600 offices in 70 countries
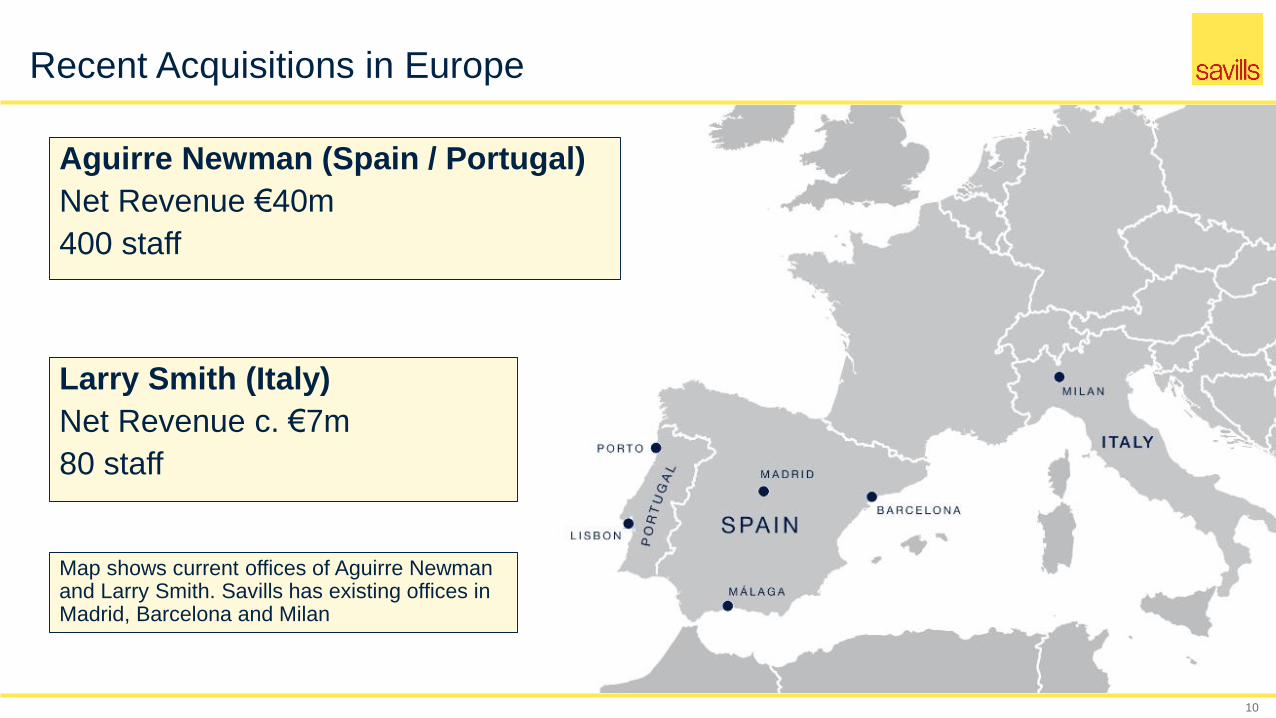
Recent Acquisitions in Europe
10
Larry Smith (Italy)
Net Revenue c. €7m
80 staff
Aguirre Newman (Spain / Portugal)
Net Revenue €40m
400 staff
Map shows current offices of Aguirre Newman and Larry Smith. Savills has existing offices in Madrid, Barcelona and Milan

Financial Review
11
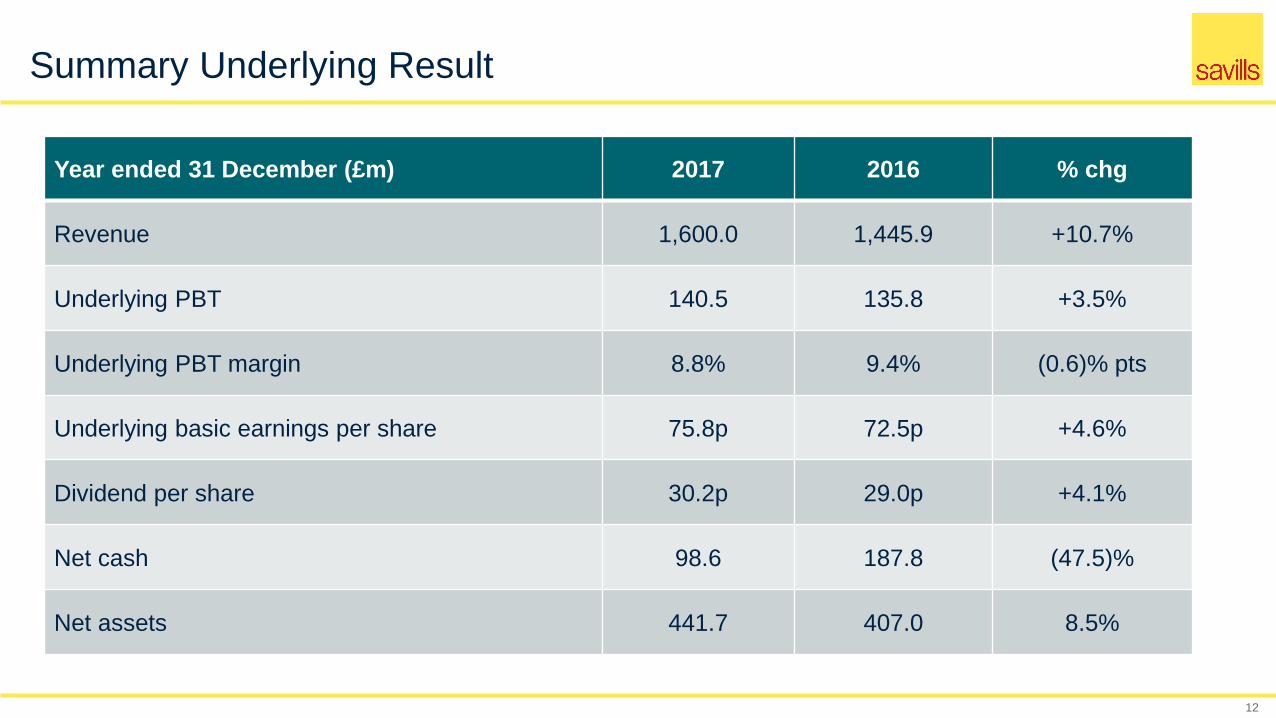
Summary Underlying Result
12
Year ended 31 December (£m) 2017 2016 % chg
Revenue 1,600.0 1,445.9 +10.7%
Underlying PBT 140.5 135.8 +3.5%
Underlying PBT margin 8.8% 9.4% (0.6)% pts
Underlying basic earnings per share 75.8p 72.5p +4.6%
Dividend per share 30.2p 29.0p +4.1%
Net cash 98.6 187.8 (47.5)%
Net assets 441.7 407.0 8.5%
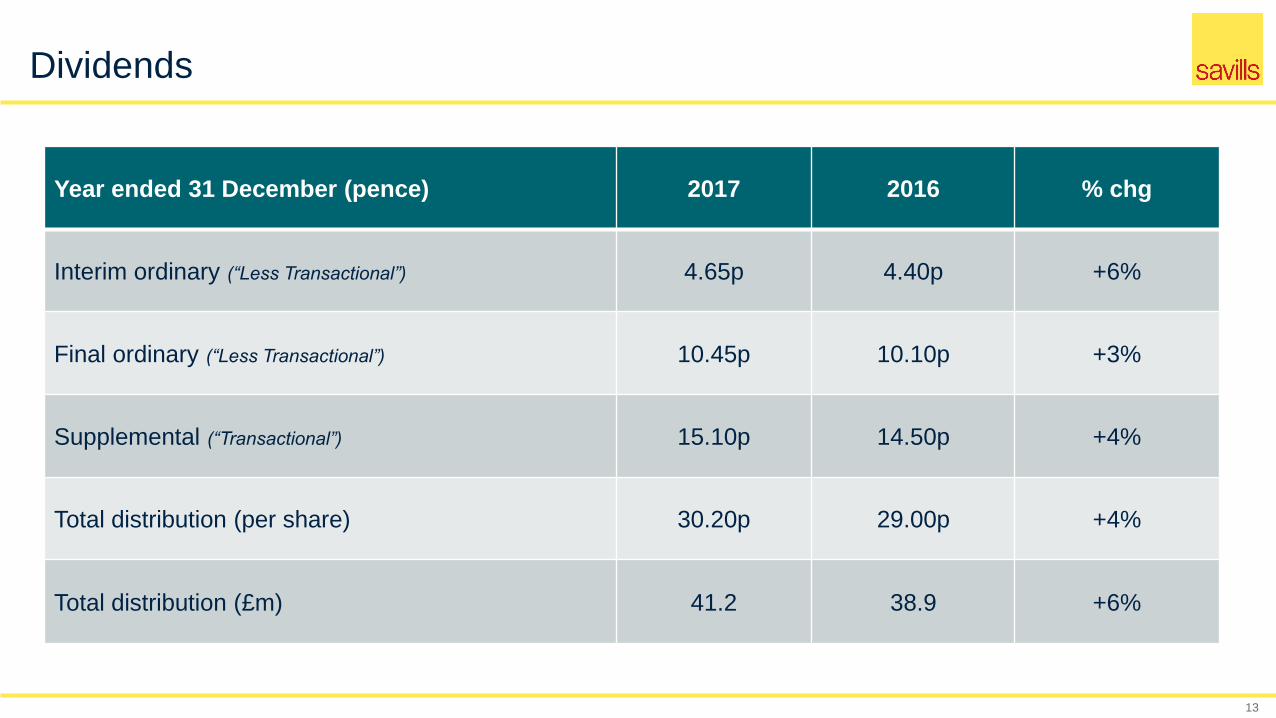
Dividends
13
Year ended 31 December (pence) 2017 2016 % chg
Interim ordinary (“Less Transactional”) 4.65p 4.40p +6%
Final ordinary (“Less Transactional”) 10.45p 10.10p +3%
Supplemental (“Transactional”) 15.10p 14.50p +4%
Total distribution (per share) 30.20p 29.00p +4%
Total distribution (£m) 41.2 38.9 +6%
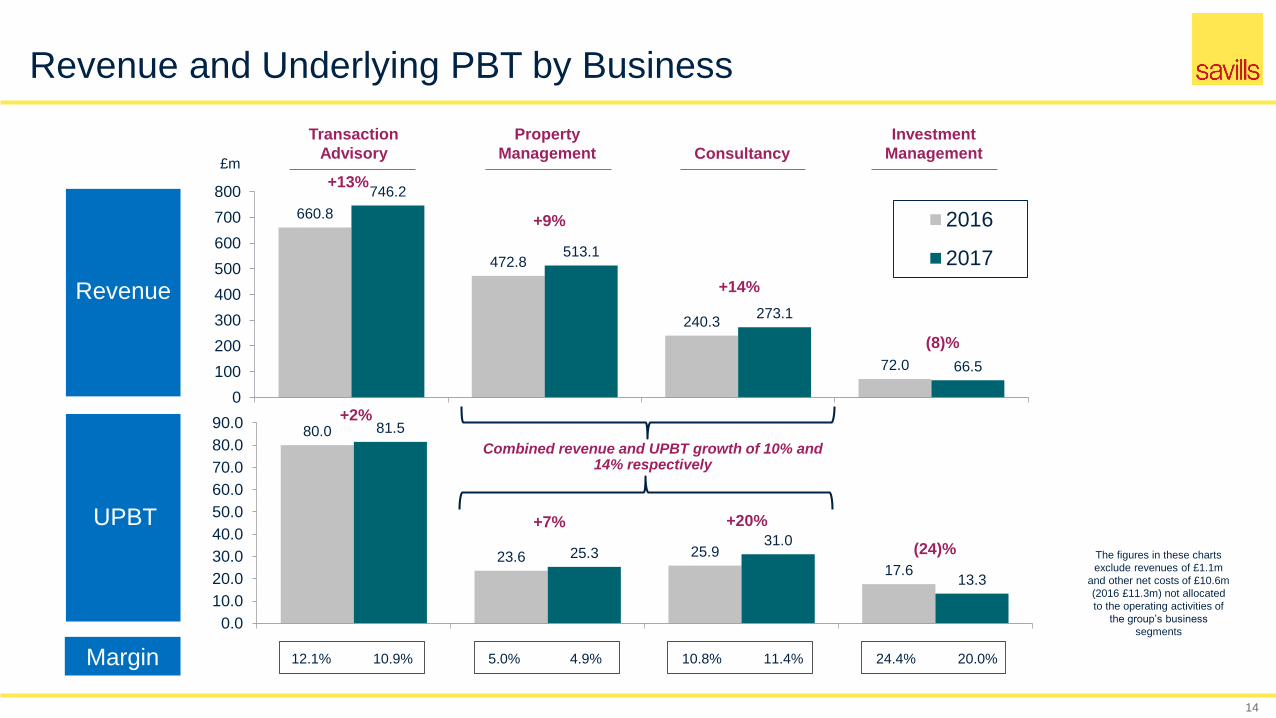
Revenue and Underlying PBT by Business
14
660.8
472.8
240.3
72.0
746.2
513.1
273.1
66.5
0
100
200
300
400
500
600
700
800
2016
2017
+9%
+14%
(8)%
Revenue
80.0
23.6 25.9
17.6
81.5
25.331.0
13.3
0.0
10.0
20.0
30.0
40.0
50.0
60.0
70.0
80.0
90.0
+7% +20%
(24)%
Transaction
Advisory
Property
Management Consultancy
Investment
Management
UPBT
+13%
+2%
Margin 12.1% 10.9% 5.0% 4.9% 10.8% 11.4% 24.4% 20.0%
£m
The figures in these charts
exclude revenues of £1.1m
and other net costs of £10.6m
(2016 £11.3m) not allocated
to the operating activities of
the group’s business
segments
Combined revenue and UPBT growth of 10% and 14% respectively

Revenue and Underlying PBT by Region
15
578.3
485.9
211.1170.6
626.0
565.7
224.8182.4
-
100.0
200.0
300.0
400.0
500.0
600.0
700.0
2016
2017
Revenue
UK Asia Pacific North America
UPBT
+8%
Continental Europe
72.1
42.6
18.913.5
76.5
55.6
7.811.2
0
10
20
30
40
50
60
70
80
90+6%
+16%
+6%+7%
+31%
(17)%(59)%
£m
Margin 12.5% 12.2% 8.8% 9.8% 9.0% 3.5% 7.9% 6.1%
The figures in these charts
exclude revenues of £1.1m
and other net costs of £10.6m
(2016 £11.3m) not allocated
to the operating activities of
the group’s business
segments
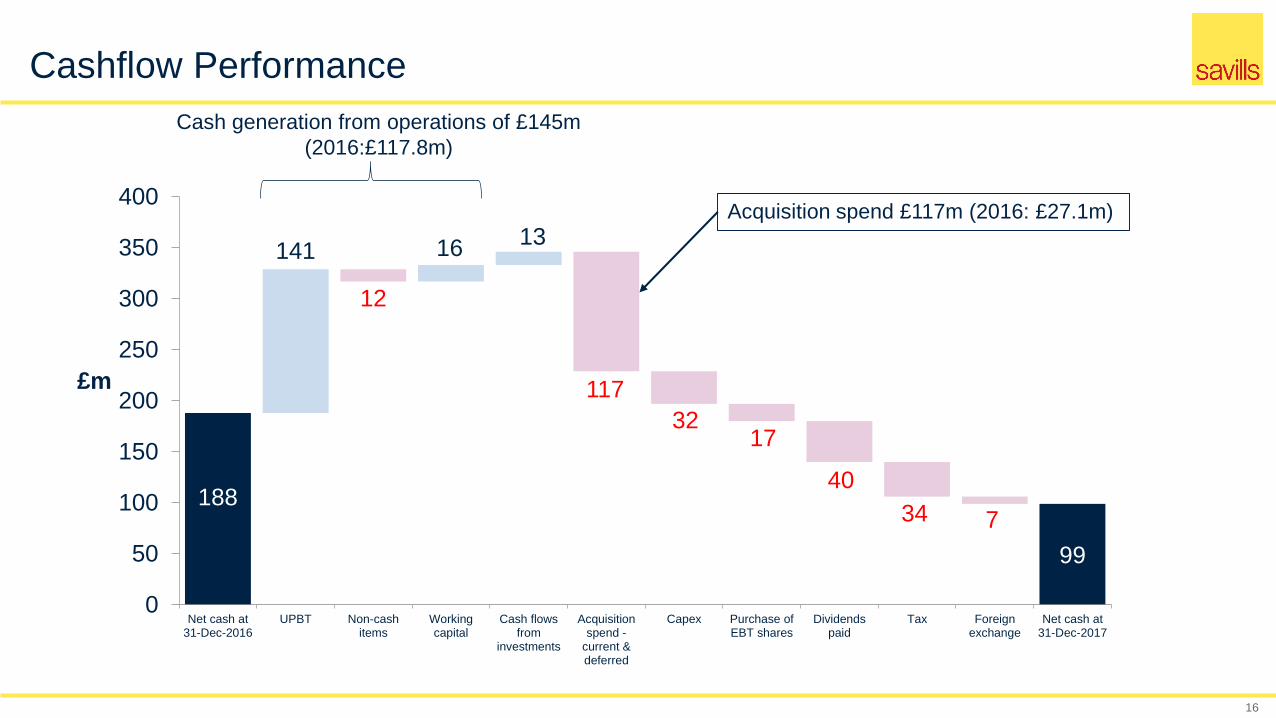
Cashflow Performance
16
188
99
141 1613
12
117
3217
40
34 7
0
50
100
150
200
250
300
350
400
Net cash at31-Dec-2016
UPBT Non-cashitems
Workingcapital
Cash flowsfrom
investments
Acquisitionspend -
current &deferred
Capex Purchase ofEBT shares
Dividendspaid
Tax Foreignexchange
Net cash at31-Dec-2017
£m
Cash generation from operations of £145m
(2016:£117.8m)
Acquisition spend £117m (2016: £27.1m)

Commercial Transaction Advisory
17
2017 Revenue £573.0m (+15%) 2017 UPBT £56.4m (-5%)
Asia Pacific strong growth in revenues and profitability in Hong Kong, Japan, Australia and Mainland China.
UK significant growth in Investment and Central London & International teams.
Europe revenue growth in both Tenant Rep/Leasing and Investment teams in particular Germany, Netherlands, Spain and Italy. New start-ups in
Czech Republic and developing logistics expertise in Netherlands and Poland affected profits.
North America Significant reduction in government and large/complex corporate transactions. Investment in Capital Markets and other team hires
significantly affected profits.
168.4
101.678.2
224.8
-
50
100
150
200
250
Asia Pacific UK Europe North America
Growth +30% +18% +9% +6%
26.9
17.2
4.5
7.8
-
5
10
15
20
25
30
Asia Pacific UK Europe North America
Growth +31% +17% (10)% (59)%
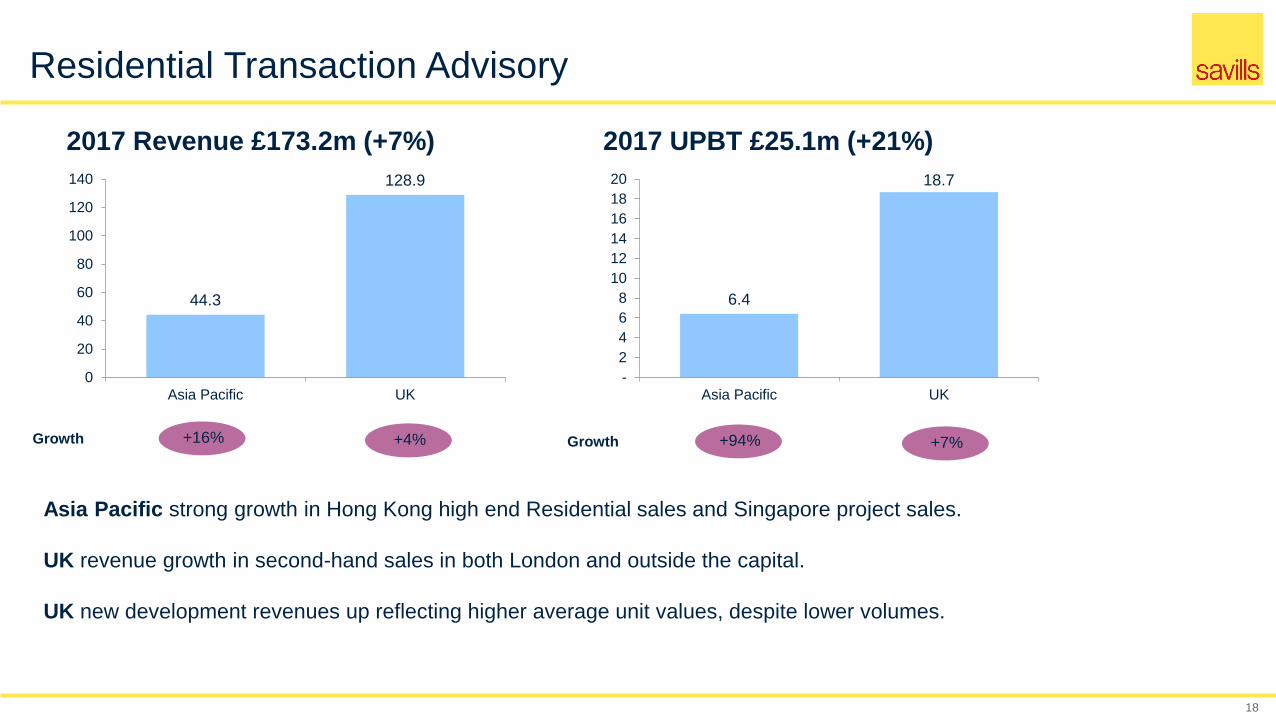
Residential Transaction Advisory
18
2017 Revenue £173.2m (+7%) 2017 UPBT £25.1m (+21%)
Asia Pacific strong growth in Hong Kong high end Residential sales and Singapore project sales.
UK revenue growth in second-hand sales in both London and outside the capital.
UK new development revenues up reflecting higher average unit values, despite lower volumes.
44.3
128.9
0
20
40
60
80
100
120
140
Asia Pacific UK
Growth +16% +4%
6.4
18.7
-
2
4
6
8
10
12
14
16
18
20
Asia Pacific UK
Growth +94% +7%
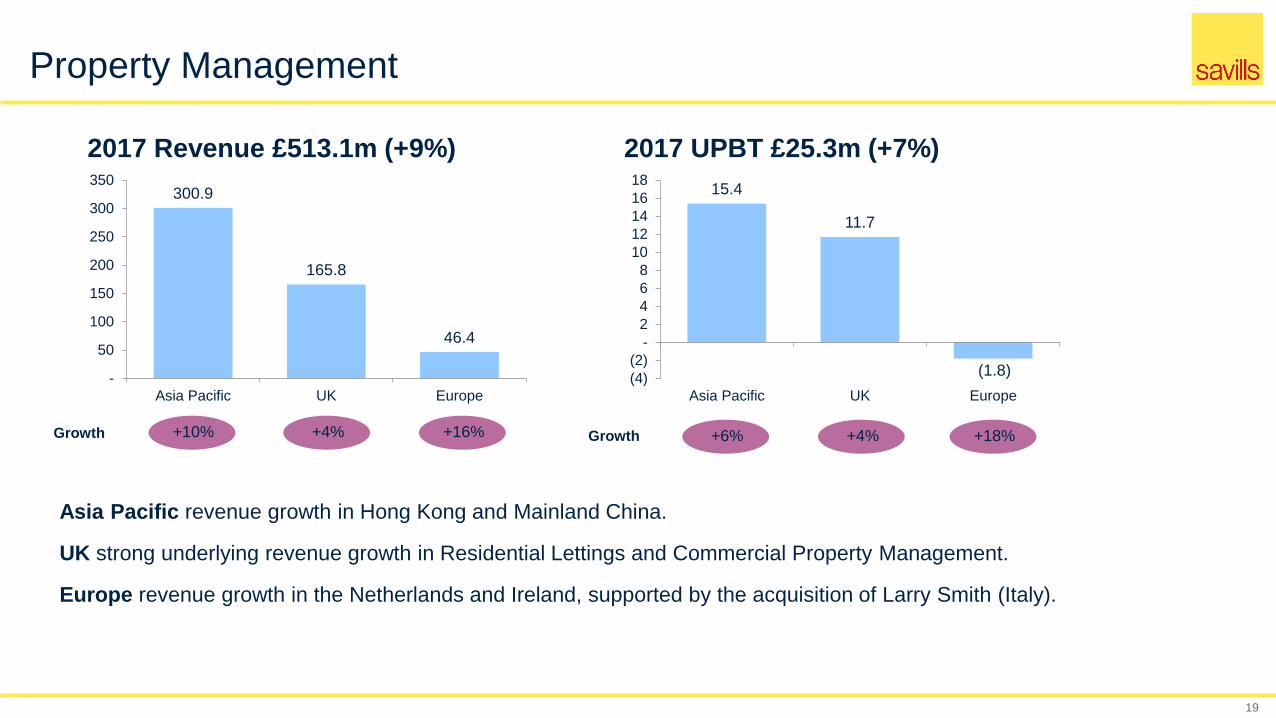
Property Management
19
2017 Revenue £513.1m (+9%) 2017 UPBT £25.3m (+7%)
Asia Pacific revenue growth in Hong Kong and Mainland China.
UK strong underlying revenue growth in Residential Lettings and Commercial Property Management.
Europe revenue growth in the Netherlands and Ireland, supported by the acquisition of Larry Smith (Italy).
300.9
165.8
46.4
-
50
100
150
200
250
300
350
Asia Pacific UK Europe
Growth +10% +4% +16%
15.4
11.7
(1.8)(4)
(2)
-
2
4
6
8
10
12
14
16
18
Asia Pacific UK Europe
Growth +6% +4% +18%
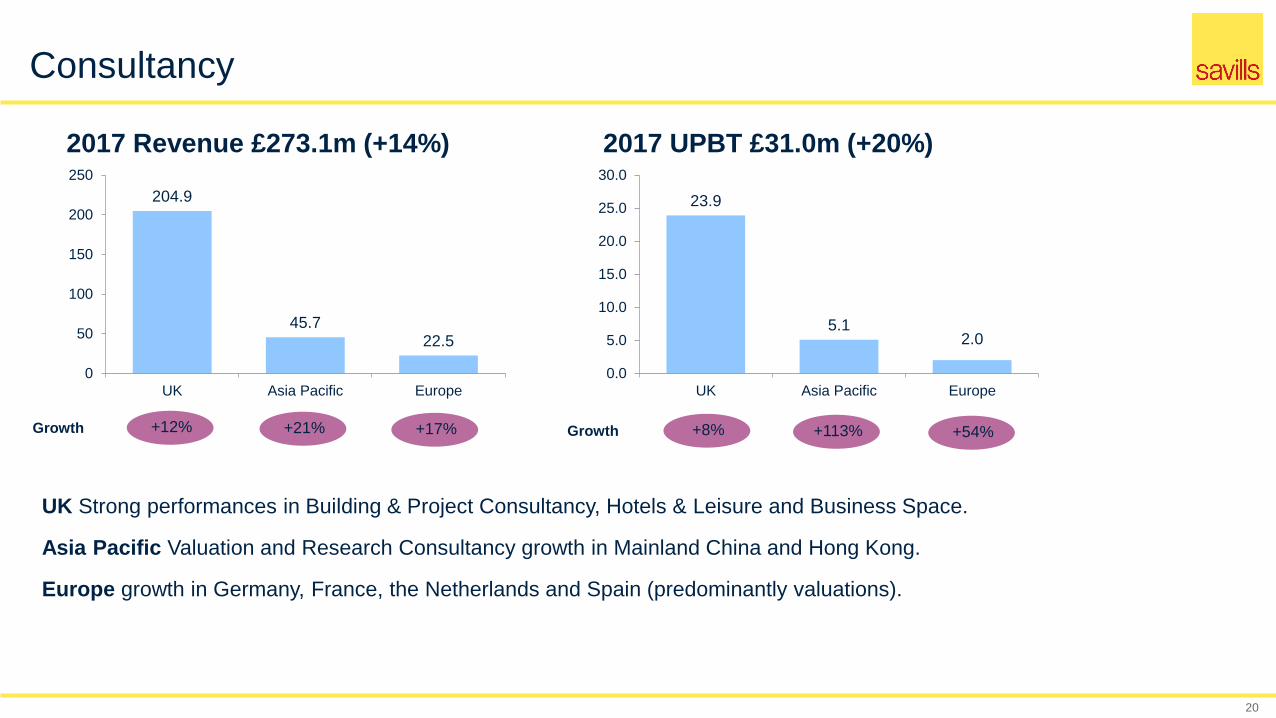
Consultancy
20
2017 Revenue £273.1m (+14%) 2017 UPBT £31.0m (+20%)
UK Strong performances in Building & Project Consultancy, Hotels & Leisure and Business Space.
Asia Pacific Valuation and Research Consultancy growth in Mainland China and Hong Kong.
Europe growth in Germany, France, the Netherlands and Spain (predominantly valuations).
204.9
45.722.5
0
50
100
150
200
250
UK Asia Pacific Europe
Growth +12% +21% +17%
23.9
5.12.0
0.0
5.0
10.0
15.0
20.0
25.0
30.0
UK Asia Pacific Europe
Growth +8% +113% +54%
Investment Management
21
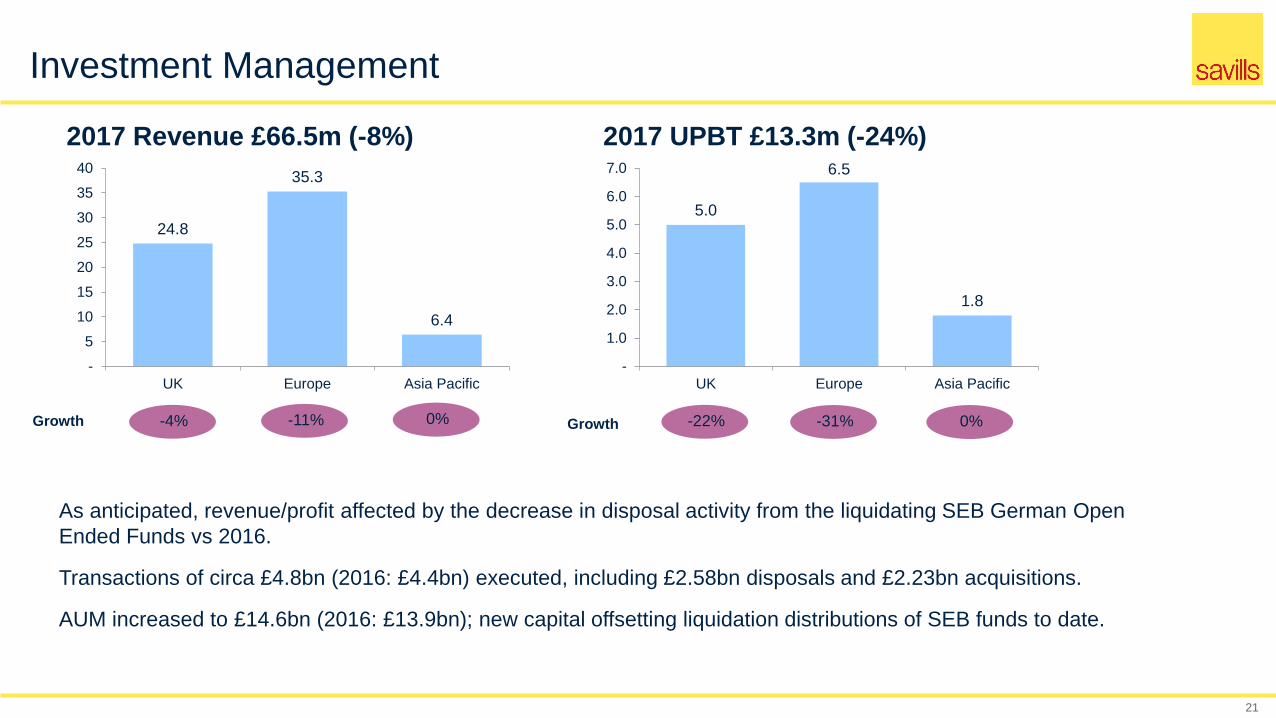
2017 Revenue £66.5m (-8%) 2017 UPBT £13.3m (-24%)
As anticipated, revenue/profit affected by the decrease in disposal activity from the liquidating SEB German Open
Ended Funds vs 2016.
Transactions of circa £4.8bn (2016: £4.4bn) executed, including £2.58bn disposals and £2.23bn acquisitions.
AUM increased to £14.6bn (2016: £13.9bn); new capital offsetting liquidation distributions of SEB funds to date.
24.8
35.3
6.4
-
5
10
15
20
25
30
35
40
UK Europe Asia Pacific
Growth
5.0
6.5
1.8
-
1.0
2.0
3.0
4.0
5.0
6.0
7.0
UK Europe Asia Pacific
Growth-11%-4% -31%-22%0% 0%
22
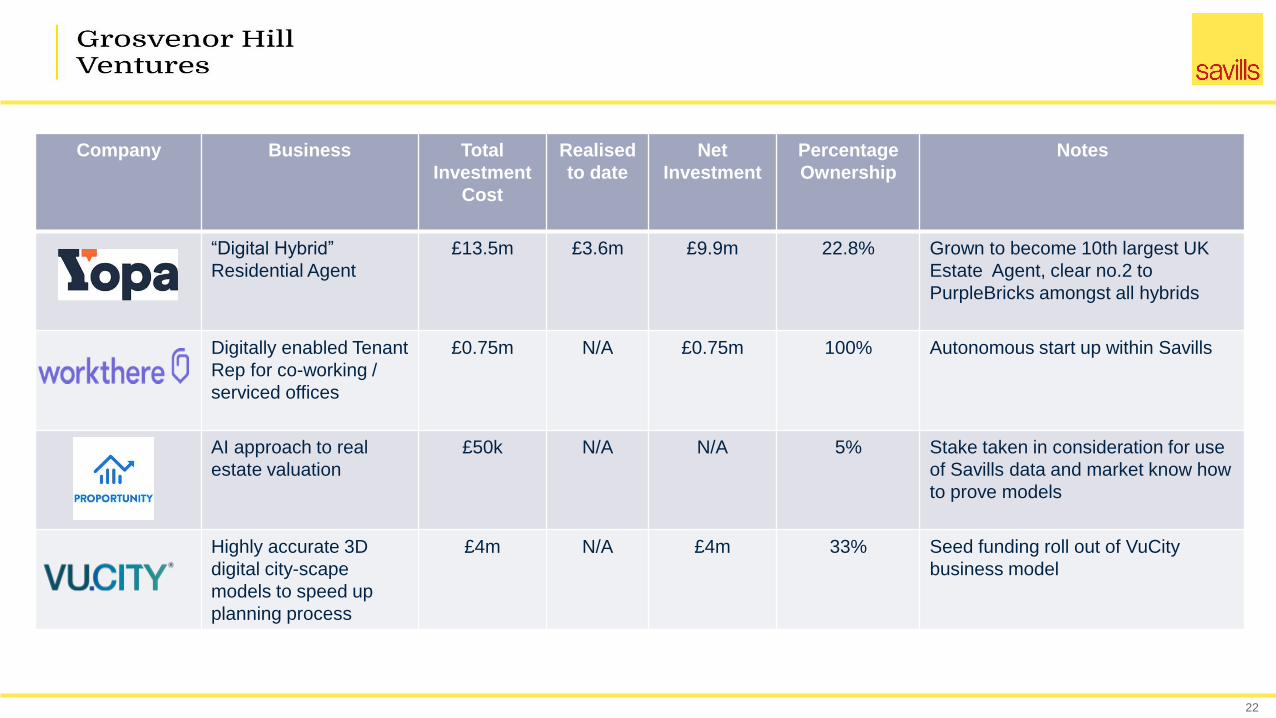
Company Business Total
Investment
Cost
Realised
to date
Net
Investment
Percentage
Ownership
Notes
“Digital Hybrid”
Residential Agent
£13.5m £3.6m £9.9m 22.8% Grown to become 10th largest UK
Estate Agent, clear no.2 to
PurpleBricks amongst all hybrids
Digitally enabled Tenant
Rep for co-working /
serviced offices
£0.75m N/A £0.75m 100% Autonomous start up within Savills
AI approach to real
estate valuation
£50k N/A N/A 5% Stake taken in consideration for use
of Savills data and market know how
to prove models
Highly accurate 3D
digital city-scape
models to speed up
planning process
£4m N/A £4m 33% Seed funding roll out of VuCity
business model

Management Focus &
Summary & Outlook
23
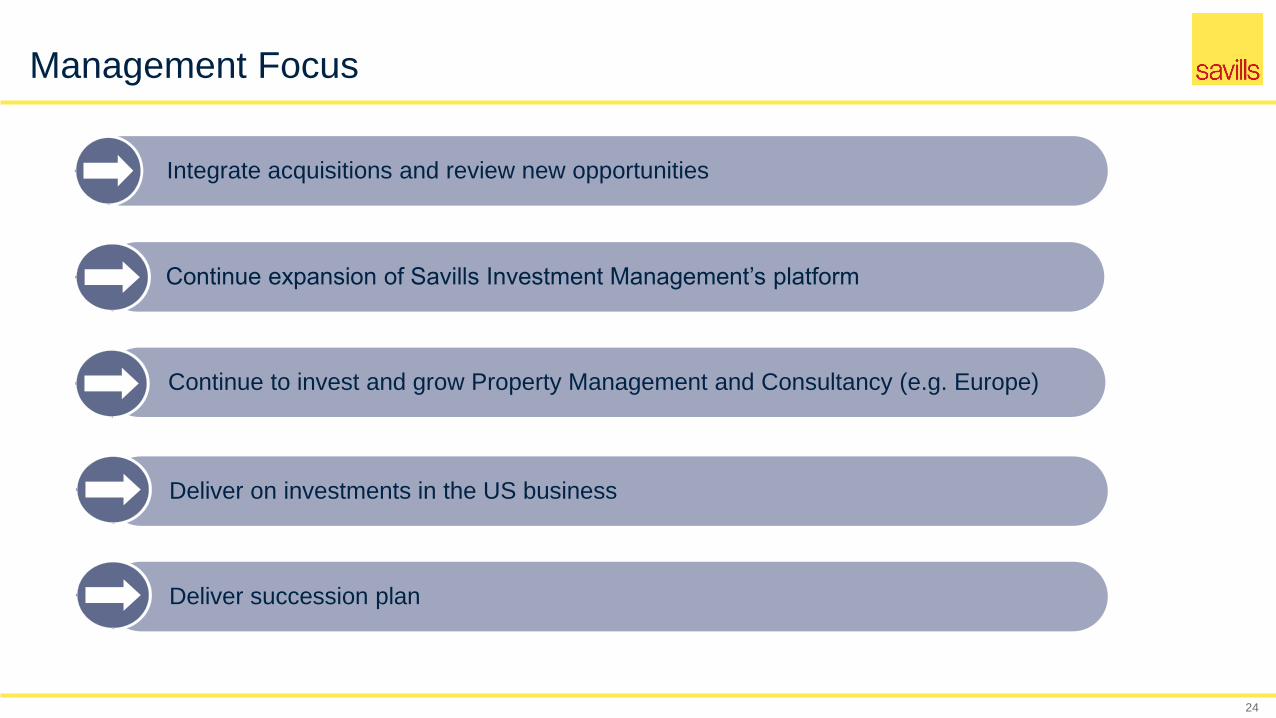
Integrate acquisitions and review new opportunities
24
Continue to invest and grow Property Management and Consultancy (e.g. Europe)
Continue expansion of Savills Investment Management’s platform
Management Focus
Deliver succession plan
Deliver on investments in the US business
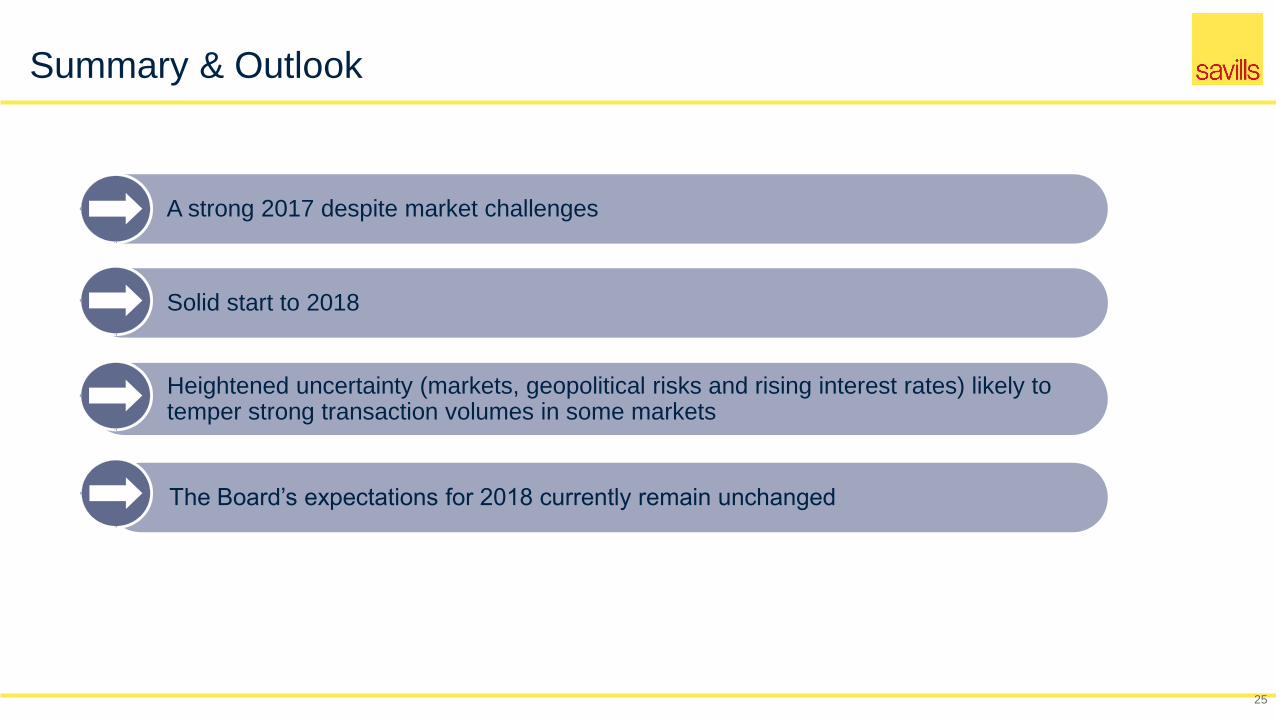
A strong 2017 despite market challenges
Solid start to 2018
25
The Board’s expectations for 2018 currently remain unchanged
Summary & Outlook
Heightened uncertainty (markets, geopolitical risks and rising interest rates) likely to temper strong transaction volumes in some markets

Connecting people and
property since 1855