savvy energy consumers: evaluating our energy costs and ... - savvy... · able to explain the...
TRANSCRIPT

Savvy Energy Consumers: Evaluating Our Energy Costs and Determining
Alternative Resources
Elizabeth K. Snyder
Objectives
This is my first year teaching as a regular education teacher in a classroom of my own.
This is also my first year at Alfred G. Waters middle school and teaching sixth grade. I
teach two classes of science and two classes of math. My objectives for this project have
changed greatly due to my change in location, grade and placement. Since I teach two
subjects, I wanted to reshape my objective so that I can incorporate goals for both math
and science. I also would like to expose students to real world problems that can be
solved through scientific processes and mathematical practice, which they are currently
mastering.
At this middle school, students are issued an iPad at the beginning of their sixth grade
year. It is each student’s responsibility to ensure that it is fully charged at the start of each
day. When a middle school student charges his device, he knows electricity is coming
from the outlet in the wall. He most probably knows that the source comes from overhead
or underground wires from the power plant. But where does the power plant get its
source? What does that cost his school and family? How can he help alleviate that
cost? The objective of this curriculum project will focus on the source of consumer
electrical power in our local area and how that initial source was created and attained.
Students will research and determine the district cost for this resource and how they can
help lower that cost. Our district is voting on a referendum to increase revenue for the
construction of new schools due to overcrowding. Many residents are alarmed by the
percentage of district budget that is spent on energy. Community members at local town
hall meetings have inquired as to what research has been done to lower costs for current
and future energy expenditures. To meld the science and literacy expectations together, I
want my students to research our school energy demands and persuasively communicate
both in writing and in a presentation how this high usage of electrical energy can be
solved, scientifically, at the local level. For the final objective, students will use the
evidence they gather to evaluate a system to reduce costs. Students may select an
alternative energy source to reduce the overall energy cost to their school. The
culminating project will be a persuasive writing piece presented to the class with
individual ideas to lower consumer costs. Throughout this curriculum unit, students will
research background through informational text, design an experiment with controlled
variables, and connect problem solving to mathematical skills.
Demographics

District
Alfred G. Waters middle school is part of the Appoquinimink school district located in
Middletown, DE. Our population has grown by 5% since last year and is projected to
continue to increase over the next ten years due to the influx of families to new
construction in the area. The Appoquinimink school district welcomed over 500 new
transfer students to raise the total number of students to more than 10,400 in a community
of 66,500 people. Due to this projected growth, the district will be voting to determine if
a referendum can be passed to raise money to build three new schools and upgrade three
existing schools to meet the capacity needs. Alfred G. Waters school currently holds four
classes in trailers and the construction of a new middle school in the community would
alleviate our overcrowding.
School
Alfred G. Waters school houses 937 sixth to eighth grade students, 334 of which are sixth
graders. According to the Delaware Department of Education, 16.1% of Alfred G. Waters
Middle School’s students are African American, 7.5% are Other Minorities, less than 5%
are Hispanic, and 71.9% are White. There is little variation in the socio-economic
background, 8.8% of our students are from a Low Income household.
Classes
Most middle school teachers at Alfred G. Waters school teach one content area to four
classes each day. I teach two classes of math and two classes of science each day. For this
reason, I do not have any students classified with special education needs. However, 10%
of my students have a 504 plan for emotional, physical, or academic accommodations.
Class sizes range from 28 to 32. My students are very diverse learners with varying
degrees of ability. Most of my students have similar backgrounds and experiences in this
community. The hope is that the community link of this project will foster interest and
drive creativity.
Background of Students
Science
Appoquinimink school district has been a member of the Delaware Science Coalition for
several years. This coalition was based on the Delaware State Science Standards and
supplied participating districts with curriculum, teacher training, and science materials
throughout the year to support and drive instruction in the science classroom. With the
adoption of the Next Generation Science Standards, our district has found the coalition
slow to update current curricula to incorporate more rigorous content and embrace
supporting science practices. Therefore, our district is piloting a new science curriculum

called Project Based Inquiry Science, which is written by Its About Time. The district has
been given a curriculum and limited teacher training to pilot an introductory launcher unit
and two full units per grade at the middle school level. Teacher and classroom supplies
are created and purchased by district personnel or directly from the publisher. It is the
district’s goal that the use of this outside curriculum will better foster Next Generation
Science Standards into daily teaching and student investigations as well as save money.
Sixth grade teachers have been given a launcher unit to familiarize students with the
scientific process and science practices created by this publisher. The first full unit
focuses on Earth’s materials and systems. The second full student unit taught this year is
forces and motion, focusing on electric and magnetic forces.
My intention for this curriculum unit is to pull information students learned in their
earth history and forces and motion science units to show the relationship between the
two. I intend to teach students how fossil fuels are formed from the geologic changes of
earth over time and how these fuels are used to produce electricity, which in turn power
their devices at school. This power comes at a cost, which is paid for by their community.
Current overcrowding and population increases of the area create a need for more power
and thus more revenue. Evaluation of current expenditures at the school level will allow
students see what resources cost and how this cost can be lowered. Discovery will be
made by direct instruction and individual research of informational text. Students will be
able to explain the difference between fossil fuel types due to differences in geologic
process and time. This information will help students understand the original source of
their energy, the availability and expected cost of fossil fuels, and why adults in their
community are looking to lower these costs.
Math
The Appoquinimink district has also adopted a new curriculum for the middle school
population named Envisions written by the Pearson Publishing group. Prior to this
curriculum, middle school lessons, workbooks, and assessments were teacher created
based on the Common Core State Standards for math. The major emphasis of sixth grade
math is to understand ratio concepts and reasoning to solve problems. The subsets of this
standard focuses on unit rate, creating tables and graphs demonstrating relationships
between ratios, and the solving of problems involving unit pricing and constant speed.
Students currently understand the basic four operations with rational numbers.
However their understanding of rational numbers includes integers, fractions, and
decimals. The relationship of rational numbers such as a fraction is internal, the
relationship of the numerator to the denominator and that a simple fraction has a value of
less than one. Throughout this curriculum, students will learn that rational numbers will
have a relationship with other numbers and that relationship can be expressed as a rate.
My intention is to draw upon what student’s will learn in math class about unit rates and
relationships, to have students determine the rate of energy use of their school.

Connections to mathematical practices of ratios and proportional reasoning will be
repeatedly utilized as students predict and calculate energy usage rates. Students can then
determine the costs of energy usage and transform units to the rate of energy usage over
time and represent this change graphically.
Science Background
Fossil Fuels
The US energy sources as of 2015 can broken down to natural gas-methane 29%,
petroleum (oil) 36%, coal 16%, nuclear 9%, and renewable energy 10% (geothermal 2%,
solar 6%, wind 19%, biomass 49%, hydroelectric 25%). Fossil fuels comprise over 80%
of our national fuel for energy. Fossil Fuels are composed of petroleum, coal and natural
gas and make up 82% of the world’s energy supply1 (Agency, 2016). The benefits of
fossil fuels are the high energy density and versatility for energy use in various
applications. Fossil fuels are known as non-renewable resources because they are found
in limited supply. Extraction of these fuels from under the earth’s surface can cause
disturbances in the land and lead to environmental impact of habitats that can occur in
already sensitive areas. Fossil fuel supplies have been decreasing steadily which can lead
to unconventional extraction and production of these products.
Fossil fuels are the product of dead organic marine plants, microorganisms and
organisms that sunk to the bottom of swamps and oceans approximately 360 to 286
million years ago during the Carboniferous period in the Paleozoic Era (Smil, Oil: A
Beginner's Guide, 2008). Over millions of years, sand, clay and other materials settled
over this decomposing material forming sedimentary rock. As more and more rock piled
on top, the weight increased, pressure increased and water was squeezed out of the
organic material. This subjected the organic material to intense heat and pressure and
converted it to a fossil fuel. The differences in fossil fuels is due to the origin of the
organic material, how long the material was buried, and what temperature range and
pressure that matter was subject to.
Petroleum or oil was originally small marine plant life called zooplankton and algae.
The organic material died and sunk to the bottom of the ocean and formed a spongy
material called peat. Oil forms under a limited range of temperatures called the ‘oil
window’. The geologic formations which encapsulate oil underground are called
reservoirs, and are comprised of sedimentary rock, and have tiny spaces which hold
water, natural gas or oil. Cap rock is void of reservoirs and surrounds this holding the
reservoir in place. Oil is composed of mainly hydrogen and carbon, or hydrocarbon
1 Agency, U. E. (2016, November 21). Electric Power Annual. Retrieved November 21,
2016, from http://www.eia.gov/electricity/annual/
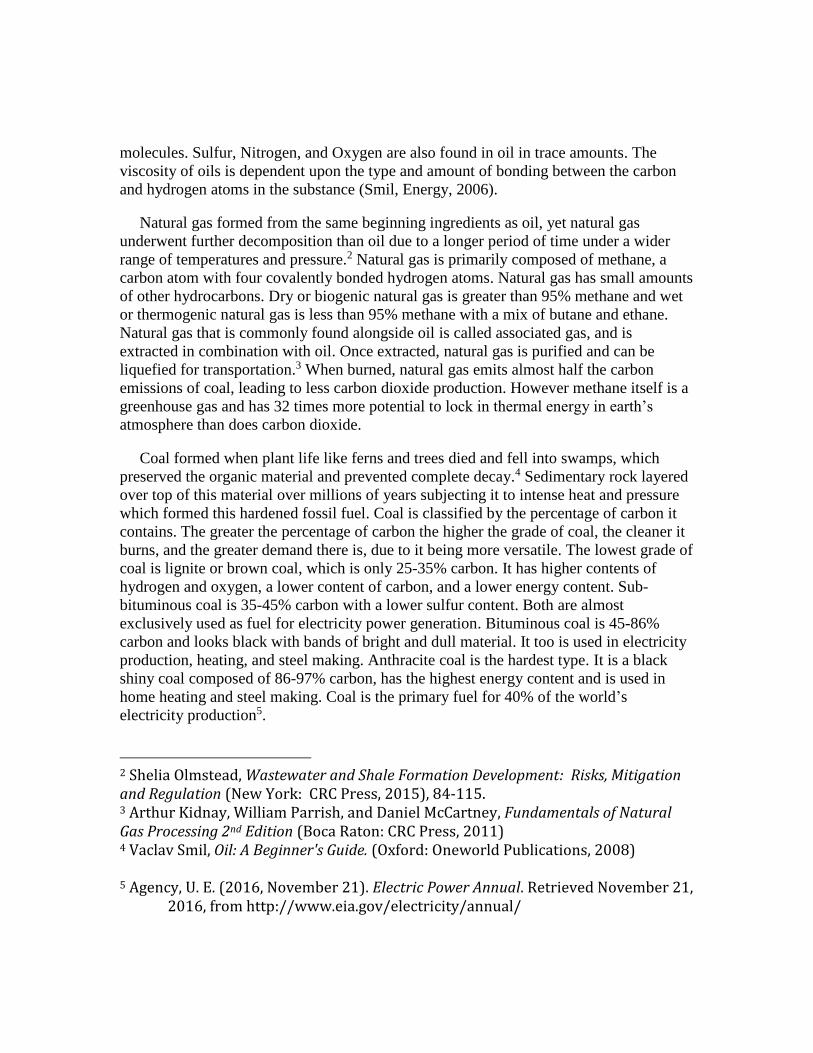
molecules. Sulfur, Nitrogen, and Oxygen are also found in oil in trace amounts. The
viscosity of oils is dependent upon the type and amount of bonding between the carbon
and hydrogen atoms in the substance (Smil, Energy, 2006).
Natural gas formed from the same beginning ingredients as oil, yet natural gas
underwent further decomposition than oil due to a longer period of time under a wider
range of temperatures and pressure.2 Natural gas is primarily composed of methane, a
carbon atom with four covalently bonded hydrogen atoms. Natural gas has small amounts
of other hydrocarbons. Dry or biogenic natural gas is greater than 95% methane and wet
or thermogenic natural gas is less than 95% methane with a mix of butane and ethane.
Natural gas that is commonly found alongside oil is called associated gas, and is
extracted in combination with oil. Once extracted, natural gas is purified and can be
liquefied for transportation.3 When burned, natural gas emits almost half the carbon
emissions of coal, leading to less carbon dioxide production. However methane itself is a
greenhouse gas and has 32 times more potential to lock in thermal energy in earth’s
atmosphere than does carbon dioxide.
Coal formed when plant life like ferns and trees died and fell into swamps, which
preserved the organic material and prevented complete decay.4 Sedimentary rock layered
over top of this material over millions of years subjecting it to intense heat and pressure
which formed this hardened fossil fuel. Coal is classified by the percentage of carbon it
contains. The greater the percentage of carbon the higher the grade of coal, the cleaner it
burns, and the greater demand there is, due to it being more versatile. The lowest grade of
coal is lignite or brown coal, which is only 25-35% carbon. It has higher contents of
hydrogen and oxygen, a lower content of carbon, and a lower energy content. Sub-
bituminous coal is 35-45% carbon with a lower sulfur content. Both are almost
exclusively used as fuel for electricity power generation. Bituminous coal is 45-86%
carbon and looks black with bands of bright and dull material. It too is used in electricity
production, heating, and steel making. Anthracite coal is the hardest type. It is a black
shiny coal composed of 86-97% carbon, has the highest energy content and is used in
home heating and steel making. Coal is the primary fuel for 40% of the world’s
electricity production5.
2 Shelia Olmstead, Wastewater and Shale Formation Development: Risks, Mitigation and Regulation (New York: CRC Press, 2015), 84-115. 3 Arthur Kidnay, William Parrish, and Daniel McCartney, Fundamentals of Natural Gas Processing 2nd Edition (Boca Raton: CRC Press, 2011) 4 Vaclav Smil, Oil: A Beginner's Guide. (Oxford: Oneworld Publications, 2008) 5 Agency, U. E. (2016, November 21). Electric Power Annual. Retrieved November 21,
2016, from http://www.eia.gov/electricity/annual/

Fossil fuels are composed mostly of carbon based on weight. Combustion of fossil
fuels causes the carbon to bond with atmospheric oxygen and produces carbon dioxide,
which enters the atmosphere increasing the amount of greenhouse gases. Greenhouse
gases prevent heat from exiting our atmosphere, trapping it in and causing global
temperatures to rise. Burning fossil fuels also causes other products in the material such
as sulfur, mercury and nitrogen to be released into the atmosphere, which can lead to acid
rain and pollution.
Electricity Generation
Electricity for community use is produced at power plants and transported via
transmission lines to buildings. But what is electricity and how is the energy transformed
from one substance (i.e., coal) to the charger of a student’s iPad? Electricity is a form of
energy involving the movement of charged atomic particles called electrons which
transfer energy from one atom to the next. Electrical energy is generated by the
transformation of other energies to electricity, which can be easily transported to homes
and businesses for use.6 Students need to learn the connection between the formation of
fossil fuels within the earth and the production of electricity to power their devices.
In Delaware, 85% of power plants are fueled by natural gas and 8% are coal fired. Most
of this natural gas is piped in from Pennsylvania. Natural gas contains stored chemical
energy. When burned the chemical energy is transformed into thermal energy and heats
water in a boiler to a temperature of at least 100oC to produce steam. The expanding
steam causes a dynamic pressure, is captured in the boiler and channeled to flow past the
fins of a turbine converting thermal energy to mechanical energy. The steam is then
cooled, condensed back into water and returned to the boiler to restart the process. The
movement of the turbine causes the spinning of a connected shaft that is connected to a
generator. Here the mechanical rotational energy is transformed into electrical energy.
Inside the generator the end of the shaft is surrounded by a highly conductive coiled
copper wire which are encased in a large magnet. As the copper wires spins inside the
magnetic field of the magnet, an electric current is induced. The flow of electrons travels
the length of the wire to high-capacity transmission wires, which enable the electrical
energy to be transported to other areas. The transmission wires are connected to the
electric grid by a network of power lines. Electricity travels through high-capacity lines,
to a substation, to smaller distribution lines, transformed to a lower voltage that is safe to
use, to the interior of a building and ultimately to an outlet. Electrical energy travels into
one prong, through a device, and out the other prong, completing a circuit that provides
the energy to charge an iPad or similar device.
6 Vaclav Smil, Energy (Oxford: Oneworld Publications, 2006).

School Use of Electricity
In the Appoquinimink school district, our school purchases electrical energy from
Delmarva Power.7 The local power plants which supply electricity to this area through
Delmarva Power are located in Delaware City with an output of 23 megawatts and
Smyrna with an output of 96 megawatts. Consumers are charged by the kilowatt hour
(kWh) which is the total energy in kilowatts delivered in one hour. The average kilowatt
hour charge was 9.65 cents in Delaware in 2015. The district spent $1,615,915 in total
energy costs in 2015. Our school uses an average of 7.5 kWh per square foot per year.
The school is 11,000 square feet which factors to a yearly power usage of 82,500 kWh or
yearly cost of $7,961.
Strategies
Background information on formation of fossil fuels and conversion of chemical energy
to electrical energy was taught in the first two full student units this year. Ratio
relationships were taught in previous math units this year. This curriculum unit is
intended to be a culminating activity for the sixth grade year, which will encompass one
week and can be used as a cumulative project as a summative grade. Students will learn
about the upcoming district referendum through direct instruction. They will be presented
with details of current district expenditures and the proportion of that total which is
energy. Ratio relationships between energy costs and total costs to run a district will be
discussed. We will discuss how energy is needed for heating buildings and water, but our
primary focus will be on electrical use to power lighting, computers, air ventilation and
cooling in the district. Next students will see the individual breakdown of electrical costs
for their school throughout a calendar year. This will be presented graphically so that
student can learn how usage and costs change throughout the year. Discussions will focus
on what months have higher costs and why. Are higher costs due to the number of
students present, weather, season, and amount of daylight, special events or holidays?
Students will receive a graphic organizer (Appendix B) and modified copies of last
month’s and current electrical bills, and will be taught that energy is based on Kilowatt-
hours, a ratio of the amount of electricity used per hour. Pictures and videos of electrical
meters will be used to help show students how the number of kilowatts used each hour in
a building are determined8. Student will then be prompted to factor the number of kWh
used at our school during the past month by subtracting the previous month’s meter
reading from the current meter reading. Students will find the kWh rate on the current bill
and multiply it by the number of kWh used to determine the current electric fee for their
7 Graves, L. (2012). Source Watch. Retrieved November 21, 2016, from
http://www.sourcewatch.org/index.php/NRG_Dover_Energy_Center 8 “Appoquinimink Referendum Calculator”, last modified November 21, 2016, http://www.apposchooldistrict.com/tax_calc.jsp

school. Given the average monthly total expenditures for the school, students will
determine the ratio of energy that our building uses to the total monthly costs. Lastly,
students will compare this ratio to the percentage of the district’s budget that is used for
energy. They will determine if our school’s ratio is higher or lower than that of the
district. Group discussions will help determine if and why there is a discrepancy between
the two. Once a relationship is made about the proportion of money needed for energy
use, and the push for a referendum to pay for rising costs, students will be challenged to
lower our school’s energy costs.
Before students research ways to decrease electrical costs, students need to understand
the source of their electrical power. Students will be asked to discuss in groups from
where this electricity comes which powers their iPads. Students will then complete a
KWL (Appendix C) to determine where they think electricity comes from, what they
would like to learn about powering their iPads, and a part to be completed later about
what they have learned. Questions to be answered on the sheet include: How does
electricity get to our school? Where does electricity come from? How is it transmitted?
How is electricity supplied to so many places at once? Do you have electricity
transmission lines near your house? How is electricity for your area generated? Is
electricity generated the same way all across the country? What are some other ways to
generate electricity and where in the country do you think these methods are most in use?
Groups will then share ideas with the class to discuss ideas of electrical sources. Students
will watch a video depicting an animated power plant where a fossil fuel is burned to
create steam to power a turbine to power a generator to transform to electrical energy to a
school. Students will complete a graphic organizer during the video. Student will then go
back to their KWL to list what they have learned about the source of electrical power to
their school.
The majority of power plants in Delaware are steam turbine powered by natural gas.9
In order to better understand how a steam turbine creates electricity, students will create
model aluminum steam turbines following a specified procedure10. The objective is to
teach that chemical energy in a fossil fuel is released via combustion and converted to
thermal energy, which heats water and converts it to steam. The pressurized steam allows
for the transformation of thermal energy to mechanical energy when it causes the fins on
the turbine to move. The mechanical energy can be transformed into electrical energy in a
generator. In addition, students are exposed to variables in the experiment. Discussions
9 “Delaware State Profile and Energy Estimates”, accessed November 21, 2016, https://www.eia.gov/state/analysis.cfm?sid=DE 10 “Going For a Spin, Making a Model Turbine”, accessed November 21, 2016, http://energyforkeeps.org/wp-content/uploads/2011/08/Pages-1-7-from-ch2_activities.pdf
emphasize that variables in the models can lead to changes in the speed of the turbine.
Variables discussed include the energy source and size of the turbine.
Students are separated into groups of four and each group creates one aluminum
turbine. To incorporate a variable, four different sized turbines are built by the class: 3,
3½, 4, and 4½ inch diameters so that students can compare class data at the end to
determine if turbine size affects speed. Throughout the lesson students are asked what
other variables can effect the spinning of the turbine. Two groups are assigned to each
size turbine. Students are given a procedure sheet (Appendix D), data sheet, and
calculation sheet.11 After creation of the turbine, groups determine how fast their turbines
spin by measuring the revolutions per minute (rpm) in three trials. Groups also measure
the diameter of their turbine to calculate the circumference. Next the speed of each
group’s turbine is calculated by multiplying the circumference by the rpm.12 Group data
is shared with the entire class. The class graphs the turbine size versus the speed, analyze
their results and determine if turbine size effects speed.
Now that students understand the origin of their electrical power in their classroom,
students will look at the cost of this service to their school. Unit costs of energy includes
the electricity and delivery of that service to their school. To relate this concept of
electrical energy generation to students in school, students will be given a partially
completed mock electrical bill for their school. A teacher led lesson shows students to
find the number of kWh which were used at the school in one month. Students will then
complete a math activity where they are given the price of kWh in their community.
Students must then compute what their school bill would be.
How can this cost be reduced? Thinking back to variables that can change the speed
of a turbine, classroom discussion will focus on changing the power source of the turbine.
In the classroom activity, water was heated to create steam with an electric hot plate.
Class instruction stressed that natural gas is the predominate energy source for steam
turbine generators in Delaware. Discussion will ask students to complete a list of energy
sources that are not fossil fuels to either heat the water or turn the turbine. After class
discussion, students will individually research alternative energies for 5 minutes on their
Ipads. As a class we will list ideas. If the class was unable to come up with alternatives,
11 Marilyn Nemzer, Energy for Keeps: Creating Clean Electricity from Renewable
Resources (Tilburon: Energy Education Group, 2010) 12 Dvorak, P. (2013, September 23). How to calculate blade tip speed, and more .
Retrieved November 21, 2016, from Windpower Engineering Development: http://www.windpowerengineering.com/design/mechanical/blades/calculate-blade-tip-speed/

give students the following alternative energies to be explored: nuclear, solar, wind,
hydropower, geothermal, and biomass. Students will be assigned to groups of five
students to research and present the ability to use these energies at the school or
community level.. Groups will construct a poster and presentation will be done in a
gallery walk style. Criteria for the research includes: Is this a renewable or non renewable
resource? How much of this resource is used in the US? How does it work? What are the
advantages of this energy? What are the disadvantages of this energy? When is this
energy available? What is the average kWh cost of this energy to a consumer? During
the gallery walk, all students will be given a graphic organizer to record the above criteria
for each of the 6 alternative energies.13
The culminating activity will allow each student to choose which alternative energy
source they feel would help alleviate energy costs for our school. Using the same criteria
as the poster presentation, students will write a persuasive letter to the school board
stating why use of their chosen alternative energy will reduce costs. Students will then
individually present their letter to the class.
13 Sherman, R. (n.d.). Renewables Are Ready. Retrieved from
http://www.ucsusa.org/sites/default/files/legacy/assets/documents/clean_energy/renewablesready_fullreport.pdf

Resources
Agency, U. E. (2016, November 21). Electric Power Annual. Retrieved November 21,
2016, from http://www.eia.gov/electricity/annual/ Dvorak, P. (2013, September 23). How to calculate blade tip speed, and more .
Retrieved November 21, 2016, from Windpower Engineering Development: http://www.windpowerengineering.com/design/mechanical/blades/calculate-blade-tip-speed/
Earth Echo International. (2015, March 16). How Is Electricity Generated? Retrieved November 21, 2016, from Discovery Education: http://earthecho.org/uploads/files/lesson-plans/Electricity_MS.pdf
Graves, L. (2012). Source Watch. Retrieved November 21, 2016, from http://www.sourcewatch.org/index.php/NRG_Dover_Energy_Center
Nemzer, M. (2010). Energy for Keeps: Creating Clean Electricity from Renewable Resources. Tilburon: Energy Education Group.
Sherman, R. (n.d.). Renewables Are Ready. Retrieved from http://www.ucsusa.org/sites/default/files/legacy/assets/documents/clean_energy/renewablesready_fullreport.pdf
Smil, V. (2006). Energy. Oxford: Oneworld Publications. Smil, V. (2008). Oil: A Beginner's Guide. Oxford: Oneworld Publications.

Appendix A
There are three Next Generation Science Standards addressed in this unit:
MS-ESS2-2. Construct an explanation based on evidence for how geoscience processes
have changed Earth’s surface at varying time and spatial scales.
MS-ESS2-1. Develop a model to describe the cycling of Earth’s materials and the flow of
energy that drives this process.
MS-PS2-3. Ask questions about data to determine the factors that affect the strength of
electric and magnetic forces. [Clarification Statement: Examples of devices that use
electric and magnetic forces could include electromagnets, electric motors, or generators.
Examples of data could include the effect of the number of turns of wire on the strength
of an electromagnet, or the effect of increasing the number or strength of magnets on the
speed of an electric motor).
There are seven Grade 6 Math Common Core State Standards addressed in this unit:
Ratios & Proportional Relationships, Understand ratio concepts and use ratio reasoning to
solve problems.
CCSS.MATH.CONTENT.6.RP.A.1 Understand the concept of a ratio and use ratio
language to describe a ratio relationship between two quantities.
CCSS.MATH.CONTENT.6.RP.A.2
Understand the concept of a unit rate a/b associated with a ratio a:b with b ≠ 0, and use
rate language in the context of a ratio relationship.
CCSS.MATH.CONTENT.6.RP.A.3
Use ratio and rate reasoning to solve real-world and mathematical problems
CCSS.MATH.CONTENT.6.RP.A.3.A
Make tables of equivalent ratios relating quantities with whole-number measurements,
find missing values in the tables, and plot the pairs of values on the coordinate plane. Use
tables to compare ratios.
CCSS.MATH.CONTENT.6.RP.A.3.B
Solve unit rate problems including those involving unit pricing and constant speed.
CCSS.MATH.CONTENT.6.RP.A.3.C
Find a percent of a quantity as a rate per 100; solve problems involving finding the
whole, given a part and the percent.
CCSS.MATH.CONTENT.6.RP.A.3.D
Use ratio reasoning to convert measurement units; manipulate and transform units
appropriately when multiplying or dividing quantities.

Appendix B
Name:______________________________Core:______________ Date:___________
Calculating our School’s Energy Costs Worksheet
October, 2016 Energy Bill (page 1)
ACCOUNT NUMBER DATE DUE AMOUNT DUE
XXXXXXXXXX 11/14/2016 $207.28
Delmarva Power
PO BOX 19003
Wilmington, DE 19801
Visit us on the Web
www.delmarvapower.com
CUSTOMER NAME AND ADDRESS ACCOUNT BILL DATE NEXT READ
A.G. Waters School
1253 Cedar Lane Rd.
Middletown, DE 19709
XXXXXXXXXX 10/21/2016 11/18/2016
SERVICE ACTIVITY
Meter No.
XXXXXX
Reading 10/18/2016 74500
Reading 09/19/2016 - 65000
Electricity Used (KWH) = ________
ELEC
_____KWH at $0.12061 = ________
Daily Customer Charge (30 days at $0.18740) 50.62
DE Low Income Assistance Fee 30.15
Total Electric Charges = ________
Average Monthly Operating cost of School = $4,092.13
Ratio of Energy Use = _____________

Appendix C
Name:______________________________Core:______________ Date:___________
KWL Worksheet
What do you know?
How does electrical energy get to our school?
Want to Learn
What would you like to learn about powering your Ipad?
Learn
What have you learned about electricity in our school?

Appendix D
Name:______________________________Core:______________ Date:___________
Turbine Procedure Worksheet Circle Group Turbine Size 3, 3½, 4, or 4½ inches
Materials Needed: Aluminum pie plates Metal funnel Compasses
Rulers Pencils Plastic Straws Scissors
Timers Markers
Push pins 500ml Beaker Hot plate Oven mitts
Procedure:
1. Using your compass, measure and draw a ___ inch diameter circle with a pencil
on the aluminum pie plates. Divide the circle into halves, then fourths, then
eighths (marking the divisions by drawing your pencil down the straight edge of
the ruler). As shown in the diagram, cut the circle into 8 blades by cutting along
the 8 divisions on the solid lines, to within 3 ⁄4 inch (2 cm) of the center. Make
sure not to cut all the way to the center.
2. Taking each blade, bend one side gently up (along the dashed lines) so that all blades are curved up the same direction. 3. Using the marker, color the entire front edge of one blade. 4. Using a push pin, attach the turbine to a straw at one end. 5. Teacher constructs a class steam device at a central station. 6. Test your turbine by blowing on it, to simulate the energy of steam. Gently
make adjustments to the turbine blades to get the most spin. 7. Using the heat source, fill the beaker ¼ full of water and bring to a boil.
Wearing oven mitts, place the steam device on top of the pan. 8. Wearing an oven mitt, hold your turbine face down over the funnel opening
where steam is escaping. Hold the turbine over the funnel opening again and raise and lower it slowly to see at which height it will spin fastest.
9. Using the timer, record the number of revolutions the turbine spins in one minute. Repeat this for two more trials. Record your data on the data sheet.

Appendix E
Name:______________________________Core:______________ Date:___________
Turbine Data Worksheet Our Turbine’s Diameter:________________
Revolutions Per Minute (RPM)
Trial 1 Trial 2 Trial 3 Average
Circumference and Speed of Turbine
Diameter of
our turbine
Formula C = π r2 Circumference
of our turbine
Average
RPM
Speed of our Turbine
Circumference x
Average RPM
Class Turbine Speeds
3” Diameter 3½” Diameter 4” Diameter 4½” Diameter
Graph of Turbine Speed versus Turbine Diameter:
