scenery assessment: scenic beauty at the ecoregion scale
TRANSCRIPT
Scenery Assessment: ScenicBeauty at the Ecoregion Scale
Steven J. Galliano and Gary M. Loeffler
United StatesDepartment ofAgriculture
Forest Service
Pacific NorthwestResearch Station
United StatesDepartment of theInterior
Bureau of LandManagement
General TechnicalReportPNW-GTR-472February 2000

AuthorsSteven J. Galliano and Gary M. Loeffler are landscape architects, Interior Columbia Basin EcosystemManagement Project, 112 E. Poplar Street, Walla Walla, WA 99362.
Scenery Assessment: Scenic Beauty at theEcoregion Scale
Steven J. Galliano and Gary M. Loeffler
Interior Columbia Basin Ecosystem ManagementProject: Scientific Assessment
Thomas M. Quigley, Editor
U.S. Department of AgricultureForest ServicePacific Northwest Research StationPortland, OregonGeneral Technical Report PNW-GTR-472February 2000

PrefaceThe Interior Columbia Basin Ecosystem Management Project was initiated by the Forest Serviceand the Bureau of Land Management to respond to several critical issues including, but not limitedto, forest and rangeland health, anadromous fish concerns, terrestrial species viability concerns, andthe recent decline in traditional commodity flows. The charter given to the project was to develop ascientifically sound, ecosystem-based strategy for managing the lands of the interior Columbia Riverbasin administered by the Forest Service and the Bureau of Land Management. The Science Integra-tion Team was organized to develop a framework for ecosystem management, an assessment of thesocioeconomic and biophysical systems in the basin, and an evaluation of alternative managementstrategies. This paper is one in a series of papers developed as background material for the framework,assessment, or evaluation of alternatives. It provides more detail than was possible to disclose directlyin the primary documents.
The Science Integration Team, although organized functionally, worked hard at integrating the ap-proaches, analyses, and conclusions. It is the collective effort of team members that provides depthand understanding to the work of the project. The Science Integration Team leadership included deputyteam leaders Russel Graham and Sylvia Arbelbide; landscape ecology—Wendel Hann, Paul Hessburg,and Mark Jensen; aquatic—Jim Sedell, Kris Lee, Danny Lee, Jack Williams, and Lynn Decker;economic—Richard Haynes, Amy Horne, and Nick Reyna; social science—Jim Burchfield, SteveMcCool, Jon Bumstead, and Stewart Allen; terrestrial—Bruce Marcot, Kurt Nelson, John Lehmkuhl,Richard Holthausen, and Randy Hickenbottom; spatial analysis—Becky Gravenmier, John Steffenson,and Andy Wilson.
Thomas M. QuigleyEditor
United StatesDepartment ofAgriculture
Forest Service
United StatesDepartment ofthe Interior
Bureau of LandManagement
Interior Columbia BasinEcosystem ManagementProject

AbstractGalliano, Steven J.; Loeffler, Gary M. 2000. Scenery assessment: scenic beauty at the ecoregion
scale. Gen. Tech. Rep. PNW-GTR-472. Portland, OR: U.S. Department of Agriculture, ForestService, Pacific Northwest Research Station. 30 p. (Quigley, Thomas M., ed.; Interior ColumbiaBasin Ecosystem Management Project: scientific assessment).
Scenic quality is an important amenity on public lands in the interior Columbia basin (hereafter referredto as the basin). People’s interests in and expectations about ecosystems can help establish desired aes-thetic conditions for the varied landscapes found in the basin. This paper, a portion of the social scienceassessment for the Interior Columbia Basin Ecosystem Management Project, explains the proceduresused to inventory scenic quality throughout the basin by using two primary indicators: landscape char-acter and scenic condition. Landscape character is expressed as landscape themes, which portray theoverall images of a large geographic area. Scenic condition is measured in degrees of scenic integrity,which express various levels of alteration to the landscape by humans to natural-appearing landscapes.Most landscapes in the basin are forests and shrub-grasslands having a predominantly natural appear-ance. Urban and rural developments visually dominate relatively few of the basin’s landscapes althoughthey are highly visible where they do occur. The overall scenic integrity of landscapes in the basin re-mains at a relatively high level with over 80 percent dominated by natural-appearing views.
Keywords: Scenery assessment, landscape character, scenic integrity, landscape themes, scenic beauty.

Contents1 Introduction
1 Definition of Scenery
1 Importance of Scenery Assessment
3 Importance of Scenery in the Interior Columbia Basin
4 Air Quality and Scenery
5 Conceptual Framework
5 Historical Overview
9 Demand for Scenery
10 Elements of Scenery Assessment
13 Methods
13 Landscape Theme Identification
14 Determining Scenic Integrity
16 Results, Limitations, and Recommendations
16 Landscape Character
19 Scenic Integrity
24 General Limitations
25 Acknowledgments
26 References

1
Introduction
Definition of Scenery
Scenery is defined as the general appearanceof a place and the features of its views orlandscapes—the arrangement of predominantlynatural features of the landscapes we see. Theadjective “scenic” has to do with natural scenery;affording beautiful views. Scenery assessmentillustrates how the features of the basin’s land-scapes can be inventoried and analyzed so thatmanagers can make decisions based on an under-standing of how people value and attach mean-ings to their environment.
The physical setting of various places is the prod-uct of both natural processes and human culture,combined in varying proportions (Eckbo 1969).Scenery consists of both biophysical elements(landforms, water, and vegetation) and culturalelements (positive features resulting from humanactivities in the landscape). These might includestructures: fences, rock walls, historic buildings;modified natural areas: fields, hedgerows,windbreaks, canals, or earth mounds; as wellas farmsteads, military posts, and plantations(Magill 1992).
Natural processes such as fires, lava flows,stream erosion, and deposition, or the effects ofinsects on plants are dynamic, perpetual, andinevitable, causing scenery to be ever changing.
Cultural alterations often influence decisionsmade by people at various times and places andresult in changes to the physical landscape. Hu-man activities occurring in a landscape are gen-erated by some type of objective or desire, suchas harvesting timber or planting wheat.
Both biophysical and social functions should beconsidered in any land management decision. Toachieve and maintain harmony among these func-tions, scenery management systems have beendeveloped by resource agencies as inventory andpredictive models. Although cultural attributesare often positive additions to many landscapes,the basic premise of these models is that onpublic lands, people expect natural-appearing
scenery to visually dominate cultural or humanalterations, especially in forested landscapes(Kaplan 1975, Smardon 1986).
The models these agencies produced have beendeveloped, tested, adopted, and applied nation-wide over the past 24 years or more. Presently,these models are being revised while retainingtheir original premises. The two primary scenicindicators used in this scenic assessment, land-scape character and scenic integrity, have beendeveloped from these models and are used toevaluate scenery.
Importance of Scenery Assessment
People are concerned about the quality of thescenery around them and have an impression ofwhat they expect to see when they visit publiclands (Newby 1971). Although our Nation’sexamples of exceptional natural beauty—Yellowstone National Park, Grand Tetons, theGrand Canyon, etc.—have long been recognizedand protected for their uniqueness and sceniccharisma, people also have acknowledged land-scapes that may not be considered as striking: therolling agricultural lands of Washington’s Palousecountry, the heavily dissected volcanic land-scapes of Idaho’s Snake River Plains, or thecanyoned plateaus of the Blue Mountains.
Although the old adage “beauty is in the eyeof the beholder” has truth for the individual, re-search has shown that high levels of agreementand predictability exist when a representativepopulation is tested (Litton and Tetlow 1978).This research shows that landscape settings withhigh degrees of natural-appearing character aremost desirable (Lee 1976, McGuire 1979, Newby1971, Noe 1988). Similar studies also haveshown that the public tends to have common per-ceptions of what constitutes natural scenic beauty(Zube 1976). One study, for example, measuredhow members of 26 different user, interest, andprofessional groups perceived six areas represent-ing a cross section of forest management in north-ern Arizona (Daniel and Boster cited in Zube1976). The most striking finding was the levelof agreement in scenic preferences among thesediverse groups.

2
The importance of scenery to humans is not anidea only recently developed by public resourcemanaging agencies. For centuries people havebeen concerned about scenery and have recog-nized that it has many benefits to society. Asearly as 1757, documented philosophical studiesof aesthetics were conducted by scientist EdmundBurke (Orians and Heerwagen 1992). In 1791,Gilpin published his “Remarks on Forest Sceneryand Other Woodland Views” (Gilpin 1791) fol-lowed by Marsh in his 1864 book entitled “Manand Nature” in which the significance of nature’sscenic beauty probably is described for the firsttime through an analytical approach.
Another indicator of the importance of the visualenvironment is the degree to which considera-tions for scenery are built into institutional poli-cies at the local, regional, and national levels.Scenery and related aesthetic values have longbeen recognized in nearly all land use planningactivities, perhaps beginning in the United Stateswith the design of Central Park in 1858. Thecreation of Yosemite National Park and the na-tional park system in 1872 are early examplesof preserving our natural landscapes.
The National Environmental Policy Act (NEPA1969) requires that all Federal agencies identifyand develop procedures for ensuring that pres-ently unquantified environmental amenities andvalues are considered on an equal basis with eco-nomic and technical aspects of major Federalactions affecting environmental quality.
Oregon’s long-range transportation plan (1992)includes a goal called “livability” that containseight policy statements. One of these specificallyaddresses aesthetic values: “It is the policy of theState of Oregon to protect and enhance the aes-thetic value of transportation corridors in orderto support economic development and preservequality of life.” Similarly, the “Shoreline MasterProgram Handbook” developed by the State ofWashington Department of Ecology includes apolicy recognizing that the “scenic, aesthetic,and ecological qualities of natural and developedshorelines should be recognized and preserved asvaluable resources” (State of Washington 1978).
At the local level, almost all comprehensive landuse plans use measures such as zoning, setbacks,and other ordinances to protect aesthetic, andother resources. One result of these policies hasbeen many attempts to define and measure publicperceptions of scenery and aesthetic values.These attempts began in the 1960s, gained mo-mentum in the 1970s, and continue today (Elsnerand Smardon 1979).
Contemporary research also indicates thatthere are measurable physical and psychologicalbenefits to humans when they view natural-appearing, attractive scenery (Driver and others1992, Ulrich 1984). For example, surgery pat-ients who are provided windows with views ofsettings with trees recover faster and with fewercomplaints than their counterparts with viewsof urban walls (Orians 1986). Thus, natural-appearing landscapes often serve as psycholog-ical escapes for a society where wildlands arebecoming increasingly scarce while people’s livesare becoming more complex. We suggest thatnatural-appearing, attractive scenery provides anessential contrast to urban settings where thestresses of traffic, crime, crowds, bright colors,and hard surfaces often create an unfriendlyenvironment.
Current research (Ulrich 1984, Ulrich and others1992) supports this position, indicating that soci-ety in general benefits from natural-appearing,attractive landscapes. When people feel better,they are more productive, interact better withtheir families, and tend to have increased involve-ment in community activities (Driver and others1992).
The characteristics of high-quality scenery fosterpsychological and physiological benefits to indi-viduals, communities, and society in general. Re-search indicates that people have both quantita-tive and qualitative expectations for scenery onpublicly owned lands that transcend shallowcosmetic concerns (Kaplan and Kaplan 1988,Ulrich 1984). According to this research, natural-appearing landscape settings have inherent capac-ities to promote both physical and mental health.Researchers Magill (1992), Lee (1976), Litton(1984), and Daniel and Boster (1976) conclude

3
that public acceptance, desire, and preference fornatural landscape features is not only identifiablebut also measurable.
Just knowing that unaltered landscape settingsexist provides psychological reassurance forsome people, even though they may never exper-ience those settings personally. The value to somepeople of knowing that desired environments,landscapes, services, or opportunities exist, al-though they personally might never use them, iswhat Randall and Stoll (1993) define as existencevalue.
In scenery assessment, existence value suggeststhat natural-appearing landscapes may not onlybe of importance for what they are, but for whatthey are not. To many people, it is the absenceof concrete, asphalt, geometric forms, and urbaninfrastructure that give the forest and shrub-grassland landscapes existence value. Thus, natu-rally evolving scenery found on congressionallyreserved public lands (like those of a designatedwilderness area) serve as the antithesis of a heavi-ly urbanized landscape (Randall and Stoll 1983).For people living in large cities lacking natural-appearing scenery who may never have an oppor-tunity to view the diverse landscapes of theinterior Columbia basin, simply knowing that nat-urally evolving and natural-appearing landscapesexist in this opposite corner of the continent givesthose landscapes existence value.
Besides the physical and social benefits presentedabove, there are several indicators that supportthe expanding value of high-quality, natural-appearing scenery to our society:
• Increased appreciation for natural beautywhen selecting parks, beaches, or otheroutdoor recreation areas (Alexander 1986).
• Increased importance of recreational settingsand scenery because of decreases in leisuretime.1
• Increased participation in scenery-orientedoutdoor recreation activities, specificallysightseeing, picnicking, day hiking, naturestudy, visiting historic sites, backpacking,and canoeing and kayaking (Molitor 1995).
• Increased numbers of people who view them-selves as environmentalists or at least sympa-thetic to environmental protection (RoperStarch, Inc. 1994).
• Increased actions by various levels of govern-ment to protect scenic quality in both builtand natural landscape settings (Trent 1995).
• Increased public recognition that scenery is alimited resource (Litton 1984).
• Increasing market strength for real estateoriented toward natural-appearing scenery,even distant views thereof (Bennett 1995,Gobster and Shroeder 1988).
Based on the above discussion, this study con-tends that scenery assessment can be considereda rational and artistic process, rather than merelya romantic or emotional process.
Importance of Scenery in theInterior Columbia Basin
The significance of scenery as a resource andhow it may be inventoried and sustained withinthe basin is a primary goal of this scenery assess-ment. The objectives of the assessment are to:
• Describe a rational approach to inventoryingand classifying scenery within the basin.
• Identify landscape themes associated withvarious geographic portions of the basin asa way of providing an overview of imagesassociated with broad landscape character.
• Inventory and classify the present level ofscenic integrity (or condition) of scenic re-sources within the basin as a baseline onwhich potential changes can be measured.
The quality of the visual environment is impor-tant to people living within the basin (Trent1995). Forest Service and Bureau of Land Man-agement (BLM) lands often serve as important
1 Recent studies indicate decreases in the amount of timeAmericans have available for leisure, primarily because ofincreases in the number of dual income households (Cordelland Siehl 1989, Hornback 1991), deferred child bearing(Szwak 1989), and an increase in the number of single-parent households (Luloff and Krannick 1990, McLellan andSiehl 1988, Szwak 1989).

4
backdrops for communities and residences inboth rural and urban settings scattered through-out the basin, offering large areas of wildlandviewing opportunities. These same lands alsoprovide the settings for various occupational andrecreational activities, serving a wide diversity ofpeople living both inside and outside the basin.
People living within the basin consider the scenicquality of publicly owned lands important. Mostpeople who value the basin’s scenic resourcerealize that landscape settings are dynamic andmay change over time, whether humans alterthem or not. These stake-holders also indicatethat they prefer not to see drastic changes in thecharacter or condition of geographic areas ofimportance to them (Galliano and Loeffler, inpress). Resource managers, therefore, also areconcerned about the integrity of scenery, specifi-cally visual changes resulting from human altera-tions to natural-appearing landscapes.
Air Quality and Scenery
Air quality is important to people who value thelandscapes within the basin. Clean air and goodvisibility are important contributors to the qualityof life for people who come to the basin to rec-reate or to earn a living.
Human perception of the scenic characteristics ofa place depend on clean air. Air that is smoky, orfull of dust or chemicals, often hampers visibilityof scenic characteristics. This is especially truewhen viewing landscape characteristics in back-ground distance zones, where important featuresoften become indistinguishable. Additionally,human health and comfort also may be affectedby poor air quality.
Throughout most of the year, most landscape set-tings within the basin have excellent air quality.The basin’s relatively dry air, predominatelysunny days, and frequent cleansing breezes pro-vide long-range views uncommon in other partsof the country. Intentional burning of forest res-idues and agricultural fields, however, can beseasonally detrimental to air quality, especiallywhen temperatures and wind conditions result
in inversions that prevent air movement. In de-veloped areas, air quality may be a significantproblem year-round, especially where largeindustrial developments exist.
In accordance with the 1977 Clean Air Act, theEnvironmental Protection Agency establishednational ambient air quality standards for severaltypes of air pollutants. These standards are pri-marily designed to protect public health and wel-fare but also include provisions to protect recrea-tional, scenic, and historical values from airquality deterioration. The Clean Air Act dividesclean air areas into three classes and specifiesthe increments of pollutants allowed in each area.Class I air-sheds include such areas as nationalparks, wilderness areas, and other congressionallydesignated areas established before August 7,1977. Class II air-sheds include national parks,wilder-ness areas, national monuments, nationalsea-shores, and other areas of special natural,scenic, or historic value that were establishedafter August 7, 1977 (CAA Part C, Sec. 160).Class III pertains to all other air-sheds outsideof classes I and II.
Each state, working in concert with variousFederal, state and local government agencies toprevent and control air pollution, is responsiblefor the administration of the Clean Air Act. Onfederally administered lands, Federal agencieshave the direct responsibility to protect air qualityrelated values, including visibility.
Inside class I areas, or within 125 miles of theirboundaries, proposed management activities mustbe evaluated for potential impacts on air quality.Road building, timber harvests, and prescribedfires are three major activities that fall within thisspecial review requirement. Outside of the class Iareas, the act stipulates nationally uniform stand-ards concerning maximum emission levels forstationary sources. For public lands within thebasin, these stipulations are pertinent to proposedmajor developments like geothermal and miningcomplexes. Although the Environmental Protec-tion Agency rarely exercises its authority to doso, it can essentially stop any proposed activitythat does not meet established standards.

5
Although the scale of the scenery assessment forthe basin does not permit the identification of airquality standards or mapping procedures, it doesrecognize the importance of maintaining clearviews of public lands as a component in eco-system management.
Conceptual Framework
Historical Overview
Early basin scenery—Until the beginning of the19th century, the overall scenic character of thebasin remained fairly constant. Human-inducedlandscape changes over extensive geographicareas have occurred exclusively during the past200 years. Before the 1800s, the hunter-fisher-gatherer lifestyle prevailed, with few large-scalechanges to the character of the basin until thenewcomers imposed cultural alterations on itslandscapes.
According to anthropologist Richard Hanes(1995), the entire basin was inhabited andused by highly mobile hunter-gatherers andsemisedentary lakeside dwellers. These earlyinhabitants were linked to their environment bycareful observation, economic calculation, ritualmonitoring, and mythical explanation. To thisday, their taking of plants is often accompaniedby prayers and occasional offerings to the plantspirits as symbols of respect (Hanes 1995). Withthe exception of the eruption of Mount Mazamaaround 4000 B.C., environmental conditionsremained relatively stable for at least 10,000years after the retreat of the huge glaciers thatonce covered a large portion of this part of thecontinent. According to historical records, thisrelative stability was disrupted by the northernspread of Spanish horses in the early 18th cen-tury, the assault of fur traders 100 years later, andthe introduction by Europeans of exotic diseasesthat devastated indigenous peoples (Robbins1993).
This does not mean that the scenery of the basinwas unaffected by humans. Archaeological andhistorical evidence suggests that many portions ofthe Pacific Northwest considered “natural” beforeEuropeans arrived consisted of humanized land-
scapes. Native Americans inhabiting these land-scapes purposely modified ecosystems to meettheir subsistence needs (Hanes 1995). Wide-spread burning practices by Native Americans,along with lightning-caused fires, created forestenvironments that often were open and parklikein character. Many grassland portions of the basinwere likewise the result of intentional and routineburning by these early inhabitants in an effort toimprove their hunting and food gatheringventures (Robbins 1993).
The journals of 19th century explorers Lewis andClark disclose the intricacies of Native Americanecology, especially the significance of fire. Ontheir return trip up the Columbia in spring 1806,Lewis reported that the plains of the Columbiawere “covered with a rich virtue of grass andherbs from four to nine inches high.” Fartherupstream, Clark remarked that a great portion ofthese valley bottoms had been burned, destroyingany timber that once grew there. Twenty yearslater, Peter Skene Ogden of Hudson’s Bay Com-pany2 remarked as he led a trapping party throughOregon’s upper Crooked River and into theHarney basin that the country was “overrun byfire,” clearly placing the responsibility on nativeinhabitants of the area (Beckham 1995).
Other early travelers to the interior Columbiabasin, including U.S. Army reconnaissance of-ficer John C. Fremont, Oregon Trail pioneer JohnKirk Townsend, Captain Benjamin Bonneville,missionary Jason Lee, and trapper James Clyman,also wrote of the important role Native Americanculture played in the ecology of the basin. Theirearly accounts of the “ravaging fires of theIndians” serve as testimony to the effect NativeAmericans had on the ecology of the basin.
As horses were acquired by Native Americans,especially as their herds grew in numbers, burn-ing and grazing practices intensified. By the 19thcentury, the abundance of horses used by NativeAmericans had an important effect in shaping thelandscapes of the basin (Robbins 1993).
2 The oldest continuing commercial venture in NorthAmerica, Hudson’s Bay Company, was chartered in 1670to engage in fur trade and colonize North America.
6
The arrival of Euro-Americans in the early 19thcentury had a profound effect on the landscapesof the basin. The construction of military roadsand railroads and newly introduced agricultureand livestock grazing all greatly accelerated bio-logical and cultural modifications that resulted inlarge-scale visual changes. Worldwide market op-portunities brought many fur trappers and farmersto the basin. These newcomers introduced exoticplants that inadvertently created artificial andheavily altered landscapes throughout the basin.They also brought contagious diseases that devas-tated Native American populations. Later camewagon loads of settlers with plants and animalsindigenous to other ecosystems, further accelerat-ing changes in the scenic character of the basin.
Beginning with the arrival of these early settlers,complex ecosystems have been progressivelymodified and simplified as single exotic speciesreplaced diverse native species. According toHann and others (1997), downy brome (Bromustectorum L., cheat grass), as well as other bromegrasses and exotic forbs like yellow star thistle(Centaurea solstitialis L.), continue to replacebluebunch wheatgrass (Agropyron spicatumPursh) on those basin lands used exclusively forgrazing. On the gentle slopes of the Palouse,monoculture crops of wheat eventually replacedvirtually all other vegetation. In the Blue Moun-tains and elsewhere, logging activities and thesuppression of fires resulted in the conversion ofhistoric stands of open parklike stands of ponder-osa pine (Pinus ponderosa Dougl. ex Laws) totrue fir and Douglas-fir (Pseudotsuga menziesii(Mirb.) Franco). Other similar scenic characterchanges can be detected throughout the basin.
The ensuing scenic changes since Europeansettlement can be summed up as a steady shiftin landscape character from naturally evolvingtoward agricultural and developed. This shiftalso is evidenced in broad-scale vegetative pat-tern analyses. According to Jones (1995), “Themost dramatic changes in the availability of plantcommunity groups across the landscape havebeen the increase in agricultural types, and thesubsequent decrease in shrublands. Many typespresently appear more fragmented relative to his-toric conditions.”
Based on comparisons between historical andcurrent vegetation layers, about 16 percent of thetotal landscape of the basin has changed fromnaturally evolving plants to exotic species duringthe past century. This equates to about 23 millionacres of naturally evolving forest lands andshrub-grasslands converted to agricultural land-scapes or urban developments. Furthermore, thecurrent landscape appears to be substantiallymore fragmented than the historical landscape,with measurable decreases in patch size andincreases in patch density and edge density.
Despite the fact that scenery in the basin has beeninfluenced by humans for centuries, some con-temporary resource planners refer to the region’spre-European settlement landscapes as “natural”or “unmanaged,” as if the early manipulation ofvegetation by native peoples was a natural occur-rence. This view is probably attributed to the no-tion that the ecosystems of the basin were chang-ing relatively slowly and appeared to be stable inhuman timeframes, in comparison to the rapidchanges occurring since European settlement.
Vegetative diversity has increased since Europeansettlement. Vegetative diversity, however, is notnecessarily the same as high-quality scenery.Although people value all landscape settings tosome degree, they generally regard those havingthe most positive combinations of variety, mys-tery, vividness, intactness, coherence, harmony,uniqueness, pattern, and balance as the most de-sirable (Daniel and Boster 1976). In many land-scapes, positive cultural elements are also attri-butes that contribute significantly to scenicquality. Abrupt changes to either the natural orcultural elements of the landscape are offensiveto many people (McCool and others 1986).
Scenery management: late 1800s to present—Conservation came about in America because ofthe waste, destruction, and uncontrolled exploita-tion of natural resources during the industrializa-tion era. Long before legislation declared it avalued resource, America’s high-quality sceneryhad been an important focus of the conservationmovement. By the late 1800s, there was a strongmovement toward protecting scenery on public

7
lands as the first Forest Reserves (forerunners toNational Forests) were established. As early as1908, special regulations were established forthe Forest Service concerning the preservationof scenic values along road corridors, lake fronts,and river corridors. By the 1950s, followingWorld War II, housing and construction demandsto meet the needs of an expanding economyreached new heights, creating increased needs fortimber. To meet these demands, an economicaltimber harvesting method was developed—clear-cutting. This method consisted of cutting all treesat one time, regardless of size or age, thus leavinglarge areas of unsightly bare ground.
This same period also saw a significant changein the leisure time of Americans, with paid vaca-tions, more dependable automobiles, and the de-sire to visit public lands. During the 1960s, theWilderness Act and the Multiple Use Act bothemphasized the importance of protecting high-quality scenery on public lands. Public expecta-tions for high-quality scenery soon conflictedwith the increasing demand for timber products,leading managers of public lands along a col-lision course.
Brought about by these conflicting demands forcommodity and amenity values, the 1969 NEPAsignificantly changed the way Federal agenciesmanage limited resources. This act requires theFederal Government to establish procedures thatwill ensure that all environmental amenities andvalues be given appropriate consideration indecisionmaking. Such analysis must include bothamenity and aesthetic elements, such as recrea-tion and scenery.
Protecting scenery and other important resourcesthrough prudent land use and management hasbeen the essence of our national conservationapproach. This approach to management was howsociety attempted to control profit-seeking, there-by preserving natural and historical resources andamenities (Nash 1975). Like the overall philoso-phy of ecosystem management, the objective wasto maintain a sustainable landscape in whichnature and people remain in equilibrium.
During the 1970s, visual resource managementbecame the focus of public land managing agen-cies like the Forest Service, BLM, and Soil Con-servation Service (SCS). Although their methodswere somewhat dissimilar because of their agen-cy missions, each developed a systematic ap-proach to inventorying and evaluating scenicvalues. The Forest Service’s visual managementsystem (VMS), BLM’s visual resource manage-ment (VRM) (USDI 1980), and SCS’s landscaperesource management (LRM) all responded tochanging attitudes regarding our Nation’s limitedscenic resources. The latter two systems weremodeled after the Forest Service approach butcontained several variations. According toSmardon (1986), there are six coinciding objec-tives among the visual resource managementsystems developed by these agencies. All threesystems were designed to:
• Inventory and evaluate scenic quality basedon a consistent set of physical characteristics.
• Identify relative degrees of human interestand public attitudes toward the landscape.
• Map the distance zones and locations fromwhich viewers observe public landscapes.
• Establish various visual management classesthat guide appropriate resource managementactivities and assign appropriate levels ofprofessional involvement to each class.
• Establish tolerance levels for the alterationof public landscapes and guidelines forrehabilitating scenery already modifiedbeyond tolerable levels.
• Integrate all of the above into agencydecisionmaking processes.
Further analysis indicates several additional com-monalities among the scenery management sys-tems developed by the three agencies. They allemphasize educating and encouraging supportfrom decisionmakers. They use intensive trainingprograms and publications as a way of encourag-ing support at all levels in their respective agen-cies. They use a broad foundation based on con-tributions from several experts in the field of

8
scenic resource management. Each agency con-tinues to learn from their own experiences andfrom those of other agencies.
While these agencies were developing, adopting,and implementing their scenery resource manage-ment systems, controversies about scenery devel-oped. Court cases like the Bitterroot (WyomingCouncil v. Butz 1974) and Monongahela (IzaakWalton League v. Butz 1973) added visibility tothe growing need for using sound methods tomanage scenery on public lands. Prompted bythese conflicts and the potential for many morelike them, legislation like the Forest and Range-land Renewable Resources Planning Act (1974),the Federal Land Policy and Management Act(1976), and the National Forest Management Act(1976), clearly recognize scenery as an identifi-able and valued resource. These mandates placeincreased emphasis on environmental and scenicvalues and stipulate that scenery be inventoriedand considered an integral component in resourcemanagement decisionmaking processes.
Starting as early as 1970, and continuing until thepresent, the Federal agencies discussed abovewere occupied with training employees and im-plementing their scenery management systems,with varying degrees of success. Several subsys-tems (e.g., visual absorption capability, existingvisual condition) were developed by the ForestService as creative methods for more thoroughlyanalyzing the scenic resource. Meanwhile, sever-al comments and critiques from professionalswithin the agencies, academic institutions, privatepractitioners, and other agencies occurred. Sincethe publication of the Forest Service’s VMS in1974, SCS’s LRM in 1978, and BLM’s VRM in1980, these systems have continued to evolve.
By the mid-1980s, agency administrators recog-nized that researchers and practitioners in scenerymanagement, the social sciences, and ecologywere providing additional knowledge of scenerymanagement that was unavailable during thecreation of these systems. Each agency, however,continued to operate within its own procedures,with the realization that updates would be neces-sary in the future (USDA Forest Service 1994).
In 1991, the Forest Service commissioned re-gional landscape architects to critique the scenerymanagement systems in use by these agencies.They also were asked to solicit an independentfirm to prepare an update incorporating recom-mendations and innovations that had occurredsince the inception of the original VMS. Thisfirm also was asked to make the necessary linksto other agency programs. Based on the natureand extent of the modifications suggested, theForest Service decided to change the title of its20-year-old system to “Landscape Aesthetics: AHandbook for Scenery Management” (USDAForest Service, in press). The reconstructed sys-tem is now known as the scenery managementsystem (SMS).
The SMS provides an objective process forassessing constituents’ preferences and expecta-tions for the character of the landscape. It furtherpresents a range of scenic integrity levels basedon the condition or wholeness of landscape char-acter and suggests a systematic approach for de-veloping landscape character goals.
The Interior Columbia Basin Ecosystem Manage-ment Project believes that the Forest Service’sSMS meets the needs of large-scale ecoregionassessments, and has used its procedures in thesocial assessment of the basin. In fact, the basinprovided a large-scale testing laboratory for ap-plying the new SMS. Several suggested changesresulting from its application have been incorpo-rated into the evolving SMS, including the use ofecological subsections as suitably scaled land-scape units for identifying large-scale landscapecharacter attributes; revisions and simplificationof the landscape themes; and simpler and moreefficient approaches to inventorying scenicintegrity.
The use of places as a key to link human identifi-cation, names, understanding, and meanings oflandscapes to geographic areas is also an incor-porated outgrowth of applying the SMS to theInterior Columbia Basin Ecosystem ManagementProject. The project has determined that places

9
are a way of combining many of the social andbiophysical data being inventoried and analyzedin this project (Williams 1995). Additional in-formation on sense of place can be found inGalliano and Loeffler (1999). In terms of theSMS, place attachment helps determine peoples’expectations and preferences for landscapecharacter and desired scenic integrity of a givenlandscape.
The SMS works best when landscape characterattributes are understood. For example, land-scapes may be valued by constituents for theirhistorical, spiritual, recreational, or other mean-ings. Thus, concepts of place attachment may beuseful for determining the importance of sceneryin various geographic areas.
Demand for Scenery
People who hunt, fish, and participate in “con-sumptive” recreation activities value sceneryhighly and choose where to recreate based notonly on abundance of fish and game but also onscenic and aesthetic qualities (Allen 1988). Infact, the demand for natural-appearing landscapesis expected to outpace the demand for modifiedlandscapes. The comprehensive outdoor recrea-tion plans for the State of Washington andOregon identified a need for nearly 19 millionacres of natural-appearing landscapes to meetprojected recreational demands by 2000, com-pared to about 5 million acres of heavily mod-ified landscapes (FEMAT 1993). Taken as awhole, these and related findings suggest thatscenery is not just a strong individual value butone held in common by a diversity of people.
Traditional approaches to scenery assessmentshave emphasized the supply of scenery becauseit is much more difficult to accurately quantifydemand. Some progress in demand analysis, how-ever, has been made. One technique considersthree factors: population increases, recreationparticipation rates, and peoples’ age. Projectedchange in human populations within the basin,together with established participation rates inrecreation activities that normally require natural-appearing scenery, is perhaps the single mostreliable basis for predicting demand for scenery.
Researchers (Murdock and others 1990) agree,stating that change in population structure is amajor driver of change in recreation participationbased on the natural appearance of scenery.
Population increases—McCool and Haynes(1995) suggest that projecting human populationswithin a biologically meaningful timeframe isproblematic. Based on data from the 1992 U.S.Bureau of the Census (U.S. Department of Com-merce 1992), however, they investigated twoseparate population change scenarios based onseveral relevant factors. Both scenarios show in-creased populations in the basin ranging from alow projection of 0.3 percent to a high projectionof 1.6 percent per year. From their analysis, itseems unlikely that a decrease in the populationin the basin will occur within the next 50 years.This means that the number of basin residentspotentially available to participate in recreation ismost likely to increase. Likewise, the number ofnonresident recreationists is similarly projected torise (Molitor 1995).
Recreation participation rates—According tothe 1990 Resources Planning Act (RPA) programupdate, scenery viewing has the highest participa-tion rate of any activity among the most popularrecreation activities in the United States, withabout 20 percent of the Nation’s population par-ticipating. The average for the basin is slightlyhigher than the national average (McCool andothers 1997). Although these participation ratesmay change over time, scenery viewing likelywill remain among the highest ranking recrea-tional activities in the basin.
Population age—Age distribution as a socialdemographic trend seems to be a driver of changeconcerning scenery-oriented recreation activities.Like the rest of the country, the population in thebasin is getting older as the baby boom genera-tion pushes past midlife. Haynes and Horne(1997) indicate that the age structure of the basinchanged markedly during the 1980s, with a morethan 27-percent increase in the number of resi-dents in the 65-and-older age group. Most of thisincrease is because of the aging of basin residentsrather than to inmigration.

10
Evidence suggests that changes in peoples’ phys-ical abilities mean corresponding changes in therecreational activities they choose (Molitor1995). With some exceptions, generally as peopleage, their available leisure time, amount of dis-cretionary income, and attention to family com-mitments change. Their involvement generallyshifts from the more active recreational activities(i.e., water skiing, running, and jogging) to themore passive (i.e., sightseeing and driving forpleasure).
Lifestyles—Another consideration influencingdemand for scenery is lifestyles. Research in-dicates that adults living within the fastest grow-ing counties in the basin have the highest rates ofparticipation in sightseeing (Claritas, Inc. 1994).Conversely, those counties with declining popula-tions generally indicate higher participation inhunting and freshwater angling. We speculate thatthose counties experiencing the greatest degreesof population growth are perhaps the areas wherepeoples’ demand for natural-appearing scenerymost likely will remain high in future years. Thismay be due, at least in part, to the fact that coun-ties with growing populations are also thecounties with the most recreational and scenicattractions.
Rasker (1993) and Rasker and Glick (1994)agree, suggesting that the fastest growing coun-ties are those that remain attractive to growingnumbers of retirees moving out of the cities andto owners of footloose industries (industrieshaving no ties to specific geographic locations)with a preference for rural locations. High-qualityscenery, according to Rasker, gives some basincommunities a comparative advantage in attract-ing new residents and businesses. Rasker (1994)continues saying that “intact landscapes are rec-ognized as the foundation on which sustainable,quality development depends.”
The basin, therefore, will continue to have anincreasing population, an overall aging popula-tion, and relatively constant recreation partici-pation rates. The fastest growing areas likely
will have the most people concerned about scenicquality. It also can be presumed that these trendssuggest an increase in demand for high-quality,natural-appearing scenery within the basin.
Although some developed portions of the basinalso may continue to offer pleasing scenery, thegreatest opportunity for meeting this predictedincrease in demand for scenery lies in theundeveloped and partially developed settings.These settings have a high degree of scenic integ-rity and offer landscape themes that are predom-inately naturally evolving or natural-appearingforests and shrub-grasslands, which are discussedin the following section.
Elements of Scenery Assessment
Two primary elements are used in broad-scaleecosystem scenery assessment and analysis:landscape character and scenic integrity. Allpublic lands within the basin were inventoriedand classified for these elements.
Landscape character is the overall impressioncreated by scenery resulting from both naturalprocesses and positive human influences. Land-scape themes are one aspect of landscape charac-ter that applies to large-scale geographic areas.Landscape character also serves as a frame ofreference for inventorying the scenic attractive-ness of smaller geographic areas.
Scenic integrity is the present condition or levelof visual wholeness or intactness of landscapes.Scenic integrity serves as a baseline measurementon which potential changes can be measured inrelative terms.
Landscape character—Landscape character canbe described spatially within an ecosystem as-sessment. For such broad-scale analysis, land-scape character is most useful when consideredat the ecological subsection scale. In this assess-ment, landscape character is described by usingfour primary attributes: landforms, vegetation,water forms, and cultural forms. These attributesserve later as a frame of reference for inventory-

11
ing scenic attractiveness,3 which is a measure ofinherent visual variety. Together, these attributesare used to describe the character of a large-scalelandscape and also form a general description oroverall impression that gives a landscape mean-ing and a “sense of place.” These images arecalled landscape themes and are further describedin the next section.
Following is an example of a landscape characterdescription for one ecological subsection withinthe basin:
Subsection M242Co Upper Yakima basin
Landform— The landform of this subsectionincludes U-shaped and hanging valleys withalluvial fans, cirque basins, glacial moraines, andsharp rocky ridges at the higher elevations. Manyrock outcroppings and avalanche chutes are com-mon at the upper elevations, and provide in-creased variety through their prominently visibleshapes. In contrast to the rockiness of the highereleva-tions, southern portions of this subsectionhave rounded, dissected ridges.
Vegetation forms—Grand fir (Abies grandis(Dougl. ex D. Don) Lindl.), western hemlock(Tsuga heterophylla (Raf.) Sarg.), Pacific silverfir (Abies Amabilis Dougl. ex Forbes) and moun-tain hemlock (Tsuga mertensiana (Bong.) Carr.)are found throughout this subsection. Grand firand western hemlock occupy the drier, warmerportions of the subsection, with Douglas-fir onthe driest of sites. Timber stands are predomi-nantly scattered and diverse, offering substantialscenic variety in textures and colors, especiallywhen combined with naturally occurring rockoutcrops, avalanche chutes, and other openings.
Aquatic forms—There are few rivers and lakesin this subsection, although there are manysprings found mostly in midslope glacial till de-posits. Surface water tends to seep quickly intothe coarse subsurface and is visible in drainagechannels only during brief periods of runoff.
Where springs are present, scenic variety tends tobe greater because of increased vegetative diver-sity. Water features generally attract attention inthe subsection because of their scarcity.
Cultural forms— Timber harvesting, wildfiresuppression, and limited grazing have affectedthe scenic character of this subsection by increas-ing vegetative patterns.
Landscape character descriptions similar to theabove example were completed for the 13 ecolog-ical subsections within the basin’s two test basins(Yakima and Silvies) but were not completed forthe remaining 381 subsections because of timeand resource constraints. Instead, landscapethemes were developed for each subsection.
Landscape themes—In large-scale ecologicalassessments like the Interior Columbia BasinEcosystem Management Project, scenery is con-sidered a primary resource that can be inventoriedand analyzed. Although visual impacts associatedwith project level decisions normally will not bediscernable at the scales used in this project, thecumulative effects of various broad alternativesor scenarios can be identified, mapped, andmonitored.
Various large geographic areas have identifiablelandscape themes (Ryden 1993). These themesare an indication of how people perceive theseenvironments in a general sense. The approach ofidentifying themes for geographic areas was usedin a scenery analysis prepared for the ColumbiaRiver Gorge National Scenic Area to capture theexperiential essence of various places (Gallianoand others 1990). Contained within the ColumbiaRiver Gorge are identifiable images or themesthat change as people move from one portion ofthe area to another. Each discrete place has itsown theme, even though that theme may not beunique; i.e., a given ecological subsection maycontain several images or themes. It is also com-mon for themes to repeat themselves from sub-section to subsection.
Landscape themes are a way of identifying anddescribing visual and cultural impressions createdby landscape settings and their existing land use
3 Scenic attractiveness (previously called “variety class” inthe Forest Service’s VMS) is not appropriate to analyze atthe basin scale but should be inventoried in subsequentlevels of planning.
12
patterns. They describe the general impressionsbrought about by the biophysical appearance of ageographic area within a cultural context. For ex-ample, the Silvies Valley in southeast Oregon islargely a forest and shrub-grassland landscape.Developed areas, such as the small town ofSeneca, exist within this landscape. People view-ing the Silvies Valley might have a general im-pression of a forest-shrub-grassland landscape,based on its vegetation and landforms, yet thedeveloped component is also part of this land-scape’s image.
In a broad sense, landscape themes serve as abaseline for assessing future changes in the sce-nic character of an area. Even at the large scalesused in an ecosystem assessment, changes in oneor more of the salient attributes composing thecharacter of a given area can have a predictableeffect on its scenery. In subsequent levels of plan-ning, such as forest or unit planning, landscapethemes are advantageous in identifying landscapecharacter goals. In broad assessments, landscapethemes are valuable in monitoring changes in theoverall images of large-scale geographic areas.
Every geographic area within the basin has atleast one identifiable landscape theme. Manyareas have several themes. For the purpose of thisassessment, however, only primary themes arediscussed for each geographic area because oftime and resource limitations.
Scenic integrity—As described previously, sce-nic integrity4 can be used to describe various de-grees of visual wholeness or completeness and isan indication of scenic condition. Scenic integritycan be used to describe scenery in the past, as itpresently exists, and as predicted for the future.For this assessment, scenic integrity is used tomeasure the condition of scenery as it presentlyexists and to predict its potential condition underproposed alternatives.
Large-scale changes in landscape character arerare within human timeframes. The eruption of
Mount St. Helens in 1980 changed the charac-ter of landscapes for miles around the volcano.Catastrophic fires, insect epidemics, as well ashurricanes and tornadoes in other parts of thecountry can alter the vegetation over vast areas.These events rarely change the character of thoselandscapes because the vegetation normally willreturn at some point in time, usually within hu-man lifetimes. Such “temporary” changes thataffect a single attribute like vegetation are con-sidered changes in condition rather thancharacter.
Scenic integrity is measured by using a continu-ous scale that ranges from very high to low.Landscapes with a high degree of scenic integrityhave virtually no discordant elements and containonly positive human alterations. They are intact,unimpaired, and appear to be in good visualcondition.
On the opposite end of the scale, landscapes withlow scenic integrity usually have negative humanalterations and are in poor visual condition. Theyoften contain discordant and contrasting featuressuch as geometric shapes resulting from vegeta-tive treatment, structures that do not blend withtheir surroundings, or roads that create large cutand fill slopes across steep hillsides.
Providing a high degree of scenic integrity onnatural-appearing landscapes usually requires athorough understanding of how healthy ecosys-tems function. It also requires a knowledge ofpeoples’ desires, preferences, and expectationsbased on constituent surveys, interviews, and ob-servations. Scenic integrity may, in some situa-tions, indicate the wholeness or condition of theecosystem. Although high scenic integrity some-times equates to high ecosystem integrity, onedoes not necessarily ensure the other.
The ecologically “intact” landscape may notalways be the most visually pleasing, especiallyin foreground situations where a greater degreeof detail is visible. These landscapes may seem“messy” and less orderly than people prefer. AsGobster (1995) explains it, “Although landscapesof high ecological integrity may not conform totraditional ideas of what is ‘scenic,’ they have an
4 Scenic integrity originally was called existing visualcondition in the Forest Service’s VMS.
13
inner beauty that can be rewarding to discover.”Educating the public about this “inner beauty”could be one solution to this apparent conflict.
MethodsThe methods used in this scenery assessmentinvolved two procedures:
1. Identify landscape themes, as a componentof landscape character, at the ecological sub-section scale.
2. Evaluate current levels of scenic integrity atthe watershed scale.
This section describes these two procedures indetail and is followed by a section indicatingconsequences, limitations, and recommendations.
Landscape Theme Identification
The appropriate context must be considered whendesignating themes for the broad landscapesanalyzed in the basin. Within the ecoregion con-text, it would be incorrect to assume that everyacre or every landscape within a given ecologicalsubsection will have a uniform landscape theme.These themes are only a broad description oflandscape character that describe the overallimages of the landscape contained within a sub-section. Based on field interviews in the Yakima,Washington, and Burns, Oregon, test areas during1994, constituents generally agree in describingall basin landscapes within a range of fivethemes:5
• Forest and shrub-grasslands (naturally evolv-ing)6 are those lands that have a vegetativecover of either forest species or shrub, forb,and grass species that are in a naturally evolv-ing state or condition. This means that humanintervention (manipulation or development)
is minimum or nonexistent; natural processesdominate visually. Examples are wildernessareas or research natural areas.
• Forest lands (natural appearing) are thoselands that have a vegetative cover of forestspecies (large trees creating the walls andceilings of visual space) that are in a natural-appearing state or condition. Human interven-tion (manipulation or development) may beevident, but such intervention does notdominate the natural landscape. Examples arethe scenic or recreational portions of wild andscenic rivers and scenic byways.
• Shrub-grasslands (natural appearing) arethose lands that have a vegetative cover ofshrub, forb, and grass species (small trees andplants that may create small walls of visualspace, but an overhead plane or ceiling isabsent) that are in a natural-appearing stateor condition. Human intervention (manipula-tion or development) may be evident but doesnot dominate the landscape. Examples arenational grasslands or open range lands wherefencing does not create visually dominantgeometric patterns.
• Agricultural lands are those “working land-scapes” that have geometric patterns that visu-ally dominate the landscape, usually becauseof fencing and monocrop planting and cultiva-tion patterns. Examples are irrigated crop-lands and some dry land crops (if their fieldsizes are small enough to create discerniblegeometric patterns). At the ecoregion scale,the agricultural land theme also includes in-tensively managed timber lands that oftenhave a cultivated, geometric appearance.
• Developed areas have gridded street patterns,commercial areas, and suburban residentialareas. These can range from small developedareas with a gas station, a general store orrestaurant, and surrounding homes (e.g.,Cliffdell, Washington), to larger towns orcities with gridded street patterns, commer-cial hubs, and many residential developments(e.g., Ellensburg, Washington).
5 This array of themes is similar to that found in the ForestService’s SMS.
6 These are actually two themes, forest lands (naturallyevolving [NE]) and shrub-grasslands (NE), combinedbecause of relatively small amounts of shrub-grasslands(NE) areas in the basin.

14
Within these five themes, emphasis shifts fromlandscapes with natural disturbances and succes-sional origins to human-dominated landscapes, orcommercial, working landscapes. Although thesedeveloped areas may, in some cases, be attractive,they have little resemblance to the natural land-scapes that once dominated the same geographicarea. In the Forest Service’s SMS, landscapethemes also may contain variations on the broadthemes that are an integral part of the desiredfuture condition of the ecosystem. Theme varia-tions, however, are normally applied to specificlandscape units such as watersheds and are toodetailed for application in this assessment.
As stated earlier, the theme of a large geographicarea is an indication of the overall image of thelandscapes within that area. It does not measurescenic condition, even in a broad sense. As amore precise measure of condition, the next sec-tion of this report, which deals with scenic integ-rity, will indicate the acres inventoried in variousscenic integrity levels, and should be consideredin conjunction with landscape themes.
Landscape themes were previously developedduring an assessment of place (Galliano andLoeffler 1999) based on Bailey’s (1980) na-tional hierarchical framework, which stratifiesthe Earth into progressively smaller areas of in-creasingly uniform ecological potentials. In thisframework, areas can be mapped according toassociations of biotic and environmental factorsincluding climate, physiography, water, soils, air,hydrology, and potential natural plant communi-ties (ECOMAP 1993).
A team of physical scientists assigned physio-graphic names and biophysical descriptions wereassigned to each ecological subsection. These be-came the foundation for developing place namesand landscape themes for subsections.
Test area interviews revealed that people oftendescribe places that are important to themthrough similar characteristics. People commonly
referred to places with similar references to“agricultural lands,” “forests,” or “rangelands”when they were asked to describe what they feltwas important about the places they identified orhow they would like to see those places managedin the future. With these similarities in mind, wedeveloped initial themes for all subsections basedon biophysical narrative descriptions of attributesdiscussed previously. These landscape themeswere sent to landscape architects at all NationalForests within the basin for confirmation. Basedon their concurrence or suggested changes, land-scape themes were identified for use in both theplace and scenery assessment.
Determining Scenic Integrity
Some National Forest lands within the basin hadscenic integrity (originally called existing sceniccondition in the old VMS) mapped for use inprevious land management planning projects.These data were gathered in the early 1980s butare now outdated, as some landscapes have re-covered and others have been further impacted.Only a few forests have been mapped more re-cently with current data. The BLM lands have notbeen mapped for scenic integrity at all. For BLMlands, desired scenery and recreation planningobjectives that indicated the degree of naturalnesswere used as a proxy for existing scenic condi-tion. Although these data were not ideal, theywere the best available at the time.
Considering the range of variability and the ageof many of the data described above, we con-sider the confidence level to be unacceptable. Acomputer-derived scenic integrity model was,therefore, developed to provide basin-wide con-sistency. This model was based on data layersavailable in CRBSUM,7 which were combined toform a synthesis of vegetation, landform, androad density. Assigning scenic integrity levels toinventoried landscapes within the basin was athree-step process:
7 The acronym CRBSUM stands for Columbia River basinsuccessional model and is a simulation model used to projectchanges in landscape attributes.

15
Step 1: Categorize landform and vegetative standtypes
Landforms were classified into (1) plains, (2) val-leys, (3) foothills, and (4) mountains. Biophysicalcharacteristics associated with each landform de-termine potential vegetation associations.
Four vegetation cover classes were developedfrom vegetative structural stages: (1) early-seralforest; (2) early-seral forest and shrub-grasslands;(3) multilayer young forests; and (4) old-growth,single or multilayer forests.
A set of 72 photographic slides depicting variouscombinations of vegetative stand structures, patchcompositions, landforms, and management sce-narios (consumptive, active, and passive) wereselected. A team of landscape architects reviewedthese slides and assigned scenic integrity levels toeach based on their expert judgment. Some gen-eral assumptions made during this task includedthe following:
• Early-seral stage forests tend to be associatedwith recent disturbances.
• When associated with moist or wet foothilllandforms, early-seral stage forests lack visualdiversity that is expected of most natural land-scape settings.
• Old-growth multilayer forests normally resultin naturally evolving forest landscapes.
• Late-seral stage, open, parklike old-growthponderosa pine or multilayered true fir-hemlock stands appear basically unalteredto most people.
• Road density is the primary factor used toclassify degree of alteration in ecosystemsdominated by shrubs and grasses, wherevertical stand structure is limited.
Step 2: Rank road densities
Road densities within the basin were reviewedto further assess human alterations to landscapesettings. This was most important where vegeta-tive considerations were thought to be insuf-ficient, as in some shrub-grassland ecosystems.
Even though road density data are limited,8
when used in combination with stand structure-landform categories, they provide an acceptablebroad-scale depiction of existing human altera-tion in the project area.
Road densities are ranked on a scale of one tofive, where five is the value assigned to a square-mile cell where no roads exist, and one representsmore than 4.6 miles of road per square mile. Fiveroad density classes, based on the preliminaryroad density analysis of January 1995, were usedin this step (table 1).
Step 3: Develop rule set
To use the geographic information system (GIS)technologies available. A rule set was developedto provide inventory classifications relative to themany possible combinations of vegetation struc-ture, landforms, and road alteration levels exist-ing within the basin. A total of 20 different pos-sible combinations of road density and standstructure-landform classes was divided into thespectrum of five scenic integrity levels corre-sponding to the Forest Service’s SMS (USDAForest Service, in press). The matrix shown intable 2 displays the scenic integrity levels derivedfrom this process.
Field testing was then done by using a samplingapproach throughout the basin that favored areasunfamiliar to the authors and that also offered afull range of scenic integrity levels. In the field,derived scenic integrity levels were compared toactual landscapes to verify their accuracy.
When applying this rule set to basin landscapes,it first appeared that agricultural lands and de-veloped areas could be rated for scenic integrityalong with other landscape themes. Problemswere encountered, however, in attempting to rankscenic integrity for these lands because criteria
8 Secondary travel routes, logging roads, and limited accessroads or roads used primarily by offroad vehicles are notadequately inventoried in this analysis.

16
for determining their visual condition have notbeen established in the Forest Service’s SMS.Although these criteria will eventually be formu-lated, there was not enough time to create andtest them during the short duration of this pro-ject. Agricultural lands and urban developmentswere therefore classified as “not assessed” inthis scenic integrity analysis.
Results, Limitations, andRecommendations
Landscape Character
Results—As stated earlier, people who visitpublic lands within the basin have an expectedimage concerning the landscapes they will see.This “mental picture” may have been created byprevious visits to the area (or to similar areas); byvideos, television, and photographs they haveseen; or through stories they have heard fromothers who have seen the basin’s landscapes.Whatever the origin, the images suggested repre-
sent the human knowledge, spirituality, anticipa-tion, imagination, and emotions associated withthe features of the area. Although several imagesfor a particular landscape can exist at the sametime, a particular geographic area tends to havean identifiable image.
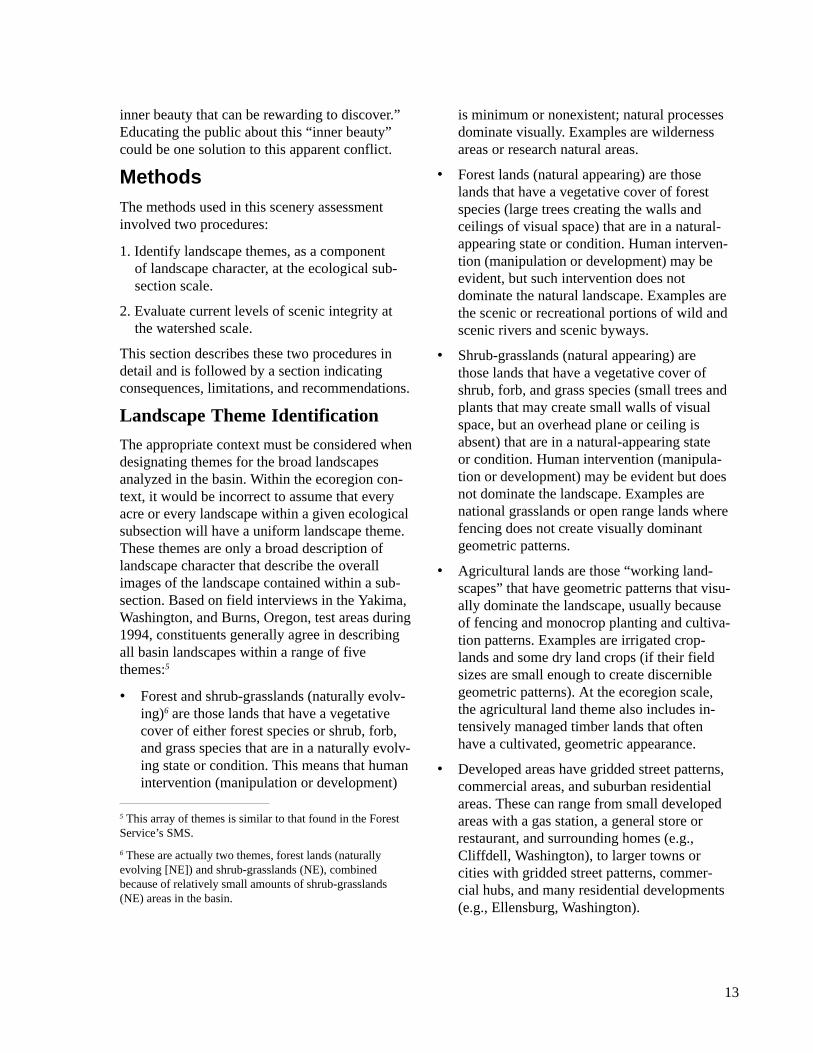
Recall that landscape themes are a combinationof natural attributes comprising the biophysicalcharacter and its human or cultural attributes.They are not goals for future management butmerely show what currently exists within a broadspectrum of degrees of naturalness or degrees ofdevelopment. Several themes may exist for eachsubsection, but as discussed earlier, only primarythemes are listed. In this assessment, landscapethemes have been identified for each of the 394ecological subsections within the basin. Ecologi-cal subsections, generally ranging from 250,000to 500,000 acres, seem to be an appropriate scalefor determining landscape themes. The locationsof inventoried subsection themes is shown infigure 1.
Table 1—Derived scenic integrity road alteration levels by roaddensity class
Road density class Road alteration level
NV = none to very low (0-0.1 mi/mi2) 5 = unalteredL = low (0.1-0.7 mi/mi2) 4 = very slightly alteredM = moderate (0.7-1.7 mi/mi2) 3 = slightly alteredH = high (1.7-4.7 mi/mi2) 2 = moderately alteredE = extreme (>4.7 mi/mi2) 1 = heavily altered
Table 2—Derived scenic integrity rule seta
Forest and wood-Landform, Forest and land structures—vegetation, and Agricultural woodland late multistory orstructure by and urban structures— Shrubland single-storyalteration level structures early seral structures midseral
Level 1 Not assessed Low Low Moderately lowLevel 2 Not assessed Moderately low Moderately low Moderately highLevel 3 Not assessed Moderately high Moderately high HighLevel 4 Not assessed High High Very highLevel 5 Not assessed High Very high Very higha These are landscape ecology classifications and are not necessarily the same as landscape themes discussed in the text.
17
Fig
ure
1—In
terio
r C
olum
bia
Riv
er b
asin
exi
stin
g la
ndsc
ape
them
es b
y ec
olog
ical
sub
sect
ions
.
ICB
EM
P
LEG
EN
D
Nat
ural
evo
lvin
gfo
rest
and
shr
ub/
gras
slan
ds
Nat
ural
app
earin
gfo
rest
lan
ds
Nat
ural
app
earin
gsh
rub/
gras
slan
ds
Agr
icul
tura
l la
nds
Dev
elop
ed a
reas
Una
ssig
ned
Sta
te b
ound
arie
s
Col
umbi
a R
iver
basi
n as
sess
men
tbo
unda
ry

18
Most BLM and Forest Service land within thebasin currently has themes that are primarilynature dominated rather than human altered. Asindicated in table 3, over 40 percent of thesepublic lands have general landscape themes ofnatural-appearing forests, and over 30 percent arenatural-appearing shrub-grasslands. Another 10percent are naturally evolving forests and shrub-grasslands, occurring primarily in wildernessareas, wild and scenic river corridors, andother specially designated areas. In total, about90 percent of the Forest Service- and BLM-administered lands within the basin currentlyhave nature-dominated themes.
Limitations— The appropriate context must betaken into account when considering thematicassignments for such broad-scale landscapes.Readers might imagine that they are flying overthese landscapes at a relatively low elevation, sothat they can observe significant landscape fea-tures, yet are forced to see them in an obliqueview within the context of surrounding land-scapes. Within this context, it would be incorrectto assume that 90 percent of a given view oroverlook would be essentially nature dominated.
Rather, this figure suggests that within the entirebasin, about 90 percent of all ecological subsec-tions have primary landscape themes that arenature dominated.
Recommendations—Landscape themes providea means of monitoring long-term changes inbroad-scale landscape character. The cultural andvisual impressions created by landscape settingsand their accompanying land use patterns arecontained within the themes identified for ecolog-ical subsections. Land use changes that occurgradually over several years may be difficult totrack day by day. These changes can be iden-tified, however, by reviewing thematic changesoccurring over a period of 10 or 20 years. Inven-tory updates at such regular intervals can identifywhere changes in landscape themes occur and towhat extent they affect scenic character. By usingthe GIS database developed for this project, com-parisons between inventories can be electroni-cally produced to indicate which subsections arerelatively static in terms of their scenic characterand which ones are changing. For those that arechanging, this approach will indicate both the di-rection and degree of scenic character changes.
Table 3—Percentage of existing landscape themes on Forest Service (FS) and Bureau of LandManagement (BLM) lands in the interior Columbia River basin
BLM and FSLandscape theme Current situation lands in the basin Total basin
Thousand hectares Thousand acres – – – – – – – Percent – – – – – – –
Naturally evolvingforest and shrub-grasslands 3913 9,666 10 7
Natural-appearingforest lands 21 561 53,256 46 37
Natural-appearingshrub-grasslands 17 826 44,030 34 30
Agricultural lands 11 540 28,503 8 20
Developed areas 3632 8,971 2 6
Not classified 19 47 <1 <1
Basin totala 58 491 144,473 100 100a Total areas may be slightly different from other basin totals because vector data were used in this analysis.

19
We do not recommend a finer spatial scale inmapping landscape themes for individual districtsor forests but do recommend obtaining additionalconstituent involvement to ensure that the themesidentified at the ecoregion scale are accurate andadequately detailed for sub-sequent planningprojects.
We suggest that criteria be developed during sub-sequent adjustments to scenery management sys-tems that clearly define positive cultural altera-tions as part of the definition of landscape charac-ter. This is especially important for agriculturallands and developed areas where human altera-tions tend to dominate these landscapes. It maybe necessary for these criteria to be developed atthe ecoregional scale so that different parts of thecountry may emphasize their own unique culturallandscape character.
Scenic Integrity
Results—Scenic integrity levels are how sceneryon public lands is measured in terms of degreesof deviation from the attributes of the natural-appearing landscape. Scenic integrity levels arebased on a standard set of criteria established inthe Forest Service’s SMS (USDA Forest Service,in press) and include the following five classes:
1. Very high scenic integrity—Settings wherethe landscape is visually intact with only minorpositive human alterations. Visual harmony ofthe existing landscape character is expressed atthe highest possible level.
2. High scenic integrity—Settings where thelandscape appears intact. Scenic deviations re-sulting from human activities may be presentbut must repeat the attributes common to thenatural-appearing character of the landscapeso completely and at such a scale that they arenot evident.
3. Moderately high scenic integrity—Settingswhere the landscape appears slightly frag-mented. Discernible deviations remain visuallysubordinate to the natural-appearing landscapecharacter viewed.
4. Moderately low scenic integrity—Settingswhere the landscape appears fragmented.Visual deviations resulting from humanactivities dominate the natural-appearinglandscape character. Visual deviations aresometimes unlike natural occurrences withinthe landscape viewed.
5. Low scenic integrity—Settings where thelandscape appears heavily fragmented.Deviations resulting from human activitiesstrongly dominate the natural-appearinglandscape character. Deviations must beblended with the natural landscape characterto a minimal level.9
Figure 2 displays the scenic integrity levels forthe entire basin.
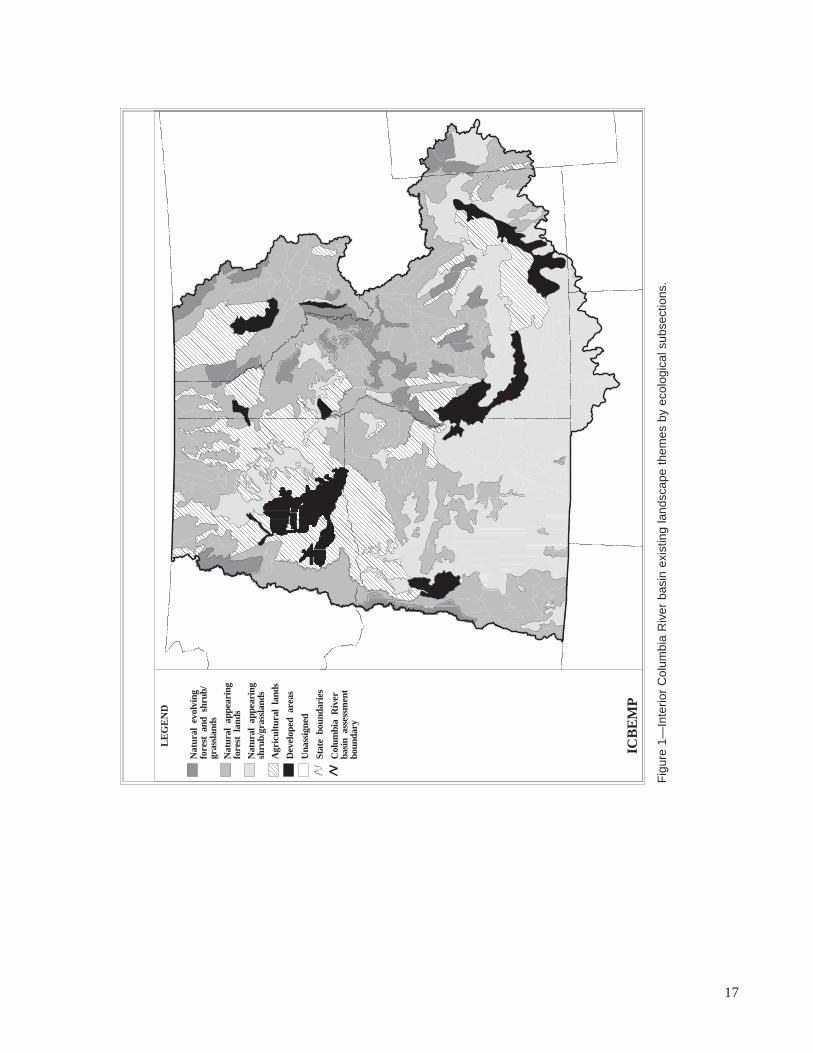
Table 4 displays the acres and hectares of inven-toried existing scenic integrity levels for theentire basin. It indicates that over 70 percent ofForest Service and BLM lands are within the highand very high range. This may indicate an overallcondition for these public lands that is among thehighest in the country.
Consistent with other basin assessment elements,scenery is displayed in tabular form by ecologicalreporting units (ERUs). The ERU boundarieswere determined as an integrated exercise, withparticipation of all disciplines. They are a com-bination of ecoregions and hydrographic bound-aries that are best suited to various scientific andresource interests. Their purpose is to facilitatethe assessment process by reducing variationsamong social, biophysical, and economic condi-tions. Eventually, ERUs will be used in the imple-mentation and monitoring of environmental im-pact statement decisions.
Thirteen ERUs have been determined for thebasin (see fig. 3).
9 Drastically altered landscapes, where visual harmony is notexpressed at all, are considered to be visually unacceptable.These landscapes often need rehabilitation. For the purposeof this assessment, unacceptably low scenic conditions wereconsidered part of low scenic integrity because they have notbeen inventoried in the basin.

20
Fig
ure
2—E
xist
ing
scen
ic in
tegr
ity in
the
inte
rior
Col
umbi
a R
iver
bas
in.
ICB
EM
P
LEG
EN
D
Ver
y hi
gh s
ceni
cin
tegr
ityH
igh
scen
ic i
nteg
rity
Mod
erat
ely
high
scen
ic i
nteg
rity
Mod
erat
ely
low
sce
nic
inte
grity
Low
sce
nic
inte
grity
Agr
icul
tura
l/dev
elop
edla
nds
Inte
rsta
te h
ighw
ayLi
mite
d ac
cess
/div
ided
high
way
Oth
er U
.S.
high
way
Sta
te b
ound
arie
sC
olum
bia
Riv
erba
sin
asse
ssm
ent
boun
dary

21
Table 4—Percentage of existing scenic integrity on Forest Service (FS) and Bureauof Land Management (BLM) lands in the interior Columbia River basin
BLM and FS landsScenic integrity Current situation in the basin Total basin
Thousand hectares Thousand acres – – – – – – Percent – – – – – –
Very high 8056 19,908 42 14High 18 054 44,613 33 31Moderately high 21 805 53,880 17 38Moderately low 6356 15,705 7 11Low 45 112 <1 <1Not classifieda 4045 9,996 <1 7
Basin totalb 58 361 144,214 100 100a No data are available currently for determining scenic integrity levels for lands with agricultural or developedthemes. Lands with these themes were not classified in this scenic assessment.
b Total areas may be slightly different from other basin totals because vector data were used in this analysis.Variations in vector data sources account for slight variations in totals.

22
Fig
ure
3—In
terio
r C
olum
bia
Riv
er b
asin
eco
logi
cal r
epor
ting
units
.
ICB
EM
P
CE
NTR
AL
IDA
HO
MO
UN
TAIN
SUP
PE
R C
LAR
K F
OR
K
OW
YH
EE
UP
LAN
DS
UP
PE
R S
NA
KE
SN
AK
E H
EA
DW
ATE
RS
SN
AK
E H
EA
DW
ATE
RS
NO
RTH
ER
N G
LAC
IATE
D M
OU
NTA
INS
UP
PE
R K
LAM
ATHN
OR
THE
RN
GR
EA
T B
AS
IN
BLU
E M
OU
NTA
INS
CO
LUM
BIA
PLA
TEA
U
SO
UTH
ER
N C
AS
CA
DE
S
NO
RTH
ER
N C
AS
CA
DE
S
LOW
ER
CLA
RK
FO
RK
LEG
EN
D
Eco
logi
cal
repo
rting
unit
boun
darie
sS
tate
bou
ndar
ies
Col
umbi
a R
iver
bas
inas
sess
men
t bo
unda
ry
23
The existing condition of lands in each ERU,shown in table 5, reveals interesting results. Dis-regarding ownership, there are five ERUs withmore than half of their total lands within the veryhigh and high scenic integrity levels, distinguish-ing these areas as some of the most scenic areasin the United States: Northern Great Basin, SnakeHeadwaters, Upper Snake, Central Idaho Moun-tains, and Owyhee Uplands.
Limitations— Based on field testing of the scenicintegrity model, we estimate the derived scenicintegrity model to be 70 to 80 percent accurate.This method, however, is not suitable forplanning applications at smaller scales withoutadjustments and refinements, some of which arediscussed in the following text.
The magnitude of visual disturbances may not beaccurately reflected in the scenic integrity figuresdisplayed in table 4. The scenic integrity modelwas based on a scale of watershed units averag-ing 20,000 acres. This relatively coarse resolu-tion may have had the effect of elevating scenicintegrity in the model from what actually mayexist to an on-the-ground viewer. For example,although an area occupied by a large geometricclearcut is identified within a watershed as onlya fraction of a percentage of the overall landscapesurrounding it, that clearcut may be seen frommiles around. It may have a dominating effect ona large portion of the scenery of the watershedunit as experienced by viewers moving throughthe landscape.
Table 5—Interior Columbia River basin existing scenic integrity by ecological reporting unit(ERU) on Forest Service and Bureau of Land Management lands
Scenic integrity Very Moderately Moderately Notby ERU high High high low Low classifieda
1 Northern Cascades 598 1,230 1,477 146 <1 5
2 Southern Cascades 166 101 1,193 422 12 5
3 Upper Klamath 99 62 1,487 178 <1 <1
4 N. Great Basin 450 3,962 2,850 484 59 <1
5 Columbia Plateau 59 482 1,084 951 <1 25
6 Blue Mountains 667 1,366 3,648 894 <1 15
7 N. Glaciated Mountains 1,702 576 4,224 222 <1 32
8 Lower Clark Fork 605 361 3,302 124 10 <1
9 Upper Clark Fork 1,233 524 1,186 116 <1 <1
10 Owyhee Uplands 375 7,659 6,721 630 <1 20
11 Upper Snake 101 2,253 600 573 <1 <1
12 Snake Headwaters 1,477 1,665 711 188 <1 <1
13 Central Idaho Mountains 5,718 5,244 5,135 694 <1 27
Basin totalb 13,250 25,485 33,618 5,622 91 128
a No data are available currently for determining scenic integrity levels for lands with agricultural or developed themes. Landswith these themes were not classified in this scenic assessment.
b Total areas may be slightly different from other basin totals because vector data were used in this analysis. Variations invector data sources account for slight variations in totals.

24
The derived scenic integrity model was basedon available data that do not indicate location-specific alterations to scenery. In developing thederived scenic integrity model, two major scenicimpacts were not analyzed: utility corridors, suchas high voltage power lines or fossil fuel pipe-lines; and mining activities, both surface andunderground. For this project, these inventorieswere not available in the proper GIS format.
The use of large-scale ERUs based on homo-geneity of attributes is another limitation similarto that described above. Within each ERU, scien-tific information is usually aggregated withinprovincial boundaries. This aggregation resultsin compromises that necessitate the eliminationof details concerning specific attributes (andanomalies) within each ERU.
Recommendations—Refined analysis tech-niques using the method suggested in this papershould be applied at smaller scales to specificwatersheds, viewsheds, or other geographic areaswithin the basin. These techniques need to berefined for use at subsequent planning levels atBLM district, National Forest, or other admin-istrative units.
It is suggested that the rule set developed for thederived scenic integrity model be amplified withadditional data layers to indicate degrees of hu-man alteration to otherwise natural-appearinglandscapes. For example, during the field verifi-cation, mining activities and utility transmissioncorridors produced a significant degree of humanalteration in some locations, yet these featureswere not available as data layers during the basinassessment. At smaller scale planning applica-tions, with less time restrictions, however, suchdata should be applied, thereby providing an ad-ditional degree of accuracy.
Also, because of the magnitude of the basin-wideassessment, scenic integrity was “averaged” forrelatively large watershed units of about 20,000acres. We suggest that a 160- to 200-acre cell sizebe used as a more precise resolution for district orforest planning and monitoring projects.
The current state of the environment is important,but future states may be even more important.Monitoring of scenic resources in the basin isessential to know whether or not established re-source goals are being met to see whether as-sumptions made in various analyses were accu-rate and to validate the concepts established inearlier planning processes. Scenery assessmentprovides an excellent medium for monitoringfuture changes in scenic integrity (condition). Byusing the same rule set displayed in table 2, thesame GIS data layers may be combined in asimilar manner to generate additional scenicintegrity models at regular intervals, such as 5,10, or 20 years. Comparing these newly createdmodels with previously generated models willdisplay broad-scale changes in scenic integritythroughout the basin.
We suggest that resource management agencieswork in concert with educational institutions todevelop a program that actively attempts to edu-cate the public concerning all aspects of ecosys-tem management, especially the beauty of bio-logically healthy, sustainable landscapes. This isrecognized as a tremendous challenge that mayrequire major efforts by the agencies in order tochange peoples’ perceptions. Eventually, sociallyacceptable limits concerning the definitions ofscenic beauty will be broadened to includehealthy ecosystems.
General Limitations
Natural resource allocation limitations—Formost public land management agencies, conflictsbetween the use of lands to provide amenitiesversus providing commodities have made themaware of several important messages. One of themost obvious of these messages is one of themost profound: the optimum use of the land andits resources must be achieved by keeping whatpeople desire and what the environment can pro-vide in equilibrium. Such a balance is not sim-ple in the management of vast and diverse land-scapes. There is a fundamental problem whereplanners are asked to satisfy all of society’s de-sires, not only because human demands on theland seem boundless, but also because to satisfysome desires negates others.

25
Existence value—Using recreation participationas an indicator of recreation demand has inherentlimitations. Presumably there are other scenery-dependent activities occurring on basin lands thatare not taken into account in the participationrates cited. The omission of existence value isperhaps the most conspicuous deficiency in thisapproach. For example, people may value theexistence of recreational lands for cultural,aesthetic, scientific, or spiritual reasons notexpressed in recreation participation indicators.
AcknowledgmentsPreparing a scenic inventory and analysis for anarea covering 144 million acres and occupyingsignificant portions of 7 states and 100 countiesis a challenge that required the contributions ofmany people. More than 30 professional land-scape architects, planners, and social scientiststhroughout the BLM and the Forest Service metthis challenge, each contributing significant data,insights, and recommendations that would ensure
the success of the project. Their zeal and willing-ness to participate in such a far reaching en-deavor made it possible to complete such anundertaking within the short timeframe provided.
The authors especially thank Stewart Allen,Warren Bacon, Jim Burchfield, ChristinaLilienthal, Steve McCool, and Wayne Tlusty fortheir contributions and willingness to participatein this, one of the largest applications of sceneryinventory and analysis ever undertaken. Theseprofessionals were indispensable in advancingthe “cutting edge” concepts used in the “SceneryAssessment.”
The planners and landscape architects at theKisatchie National Forest in Louisiana wereinstrumental in initiating the process for inven-torying existing scenic condition using GIS tech-nologies. With the assistance of Mark Hotz, DavePlume, Gini Stoddard, and Wendel Hann, theKisatchie approach was further developed in thisscenery assessment to become the derived scenicintegrity model.

26
ReferencesAlexander, L. 1986. Americans outdoors: the legacy, the challenge the report of the President’s
commission. Washington, DC: Island Press. 426 p.
Allen, S. 1988. Montana bio-economics study: results of the hunter preference study. Helena, MT:Montana Department of Fish, Wildlife and Parks. 241 p.
Bailey, R.G. 1980. Description of the ecoregions of the United States. Misc. Publ. 1391. Washington,DC: U.S. Department of Agriculture. 77 p.
Beckham, S.D. 1995. An interior empire: historical overview of the Columbia basin. Unpublishedreport. On file with: U.S. Department of Agriculture, Forest Service; U.S. Department of theInterior, Bureau of Land Management, Interior Columbia Basin Ecosystem Management Project,112 E. Poplar, Walla Walla, WA 99362.
Bennett, K. 1995. Human needs and dilemmas. Unpublished paper. On file with: U.S. Departmentof Agriculture, Forest Service; U.S. Department of the Interior, Bureau of Land Management,Interior Columbia Basin Ecosystem Management Project, 112 E. Poplar, Walla Walla, WA 99362.
Claritas Corporation. 1994. PRIZM market segmentation cluster snapshots: target analysis profilesfor Pacific Northwest recreationalists. Los Angeles, CA: Claritas Corporation. [Irregular pagina-tion]. On CD-ROM. Available from: Claritas, Inc. 5055 Wilshire Boulevard, Los Angeles, CA90036-4396.
Clean Air Act Amendments. Act of Aug 7, 1977. Public Law 95-95, 91 Stat. 685, as amended; 42U.S.C. 7401, 7418, 7470, 7472, 7474, 7475, 7491, 7506, 7602.
Cordell, H.K.; Siehl, G. 1989. Wildland recreation use trends. Trends. 26(3): 4-8.
Daniel, T.; Boster, R. 1976. Measuring landscape esthetics: the scenic beauty estimation method.Res. Pap. RM-167. Fort Collins, CO: U.S. Department of Agriculture, Forest Service, Rocky Moun-tain Forest and Range Experiment Station. 66 p.
Driver, B.L.; Brown, P.J.; Peterson, G. 1992. Benefits of leisure. State College, PA: VenturePublishing, Inc. 483 p.
Eckbo, G. 1969. The landscape we see. New York: McGraw-Hill. 223 p.
ECOMAP. 1993. National hierarchical framework of ecological units. Washington, DC: U.S.Department of Agriculture, Forest Service. 20 p.
Elsner, G.; Smardon, R.C., eds. 1979. Proceedings of our national landscape: a conference on ap-plied techniques for analysis and management of the visual resource; [Dates of meeting unknown];[Location of meeting unknown]. Gen. Tech. Rep. PSW-35. Berkeley, CA: U.S. Department ofAgriculture, Forest Service, Pacific Southwest Forest and Range Experiment Station. 660 p.
Forest and Rangeland Renewable Resources Planning Act. Act of Aug. 17, 1974. Public Law 93-378. 88 Stat. 476, as amended; 16 U.S.C. 1600-1614.
Forest Ecosystem Management Assessment Team [FEMAT]. 1993. Forest ecosystem management:an ecological, economic, and social assessment. Portland, OR: U.S. Department of Agriculture;U.S. Department of the Interior [and others]. [Irregular pagination].

27
Galliano, S.J.; Loeffler, G.M. 1999. Place assessment: how people define ecosystems. Gen. Tech.Rep. PNW-GTR-462. Portland, OR: U.S. Department of Agriculture, Forest Service, PacificNorthwest Research Station. 31 p.
Galliano, S.J.; Michaliszyn, B.; Moran, P. 1990. Corridor visual inventory for the Columbia RiverGorge National Scenic Area. Hood River, OR: Columbia River Gorge Commission. 124 p.
Gilpin, W. 1791. Remarks on forest scenery and other woodland views illustrated by the scenes ofnew-forest in Hampshire. [Reprinted 1973]. Surrey, England: Richmond Publishing Co. Ltd. (Inthree books).
Gobster, P.H. 1995. Aldo Leopold’s “ecological esthetic”: integrating esthetic and biodiversity values.Journal of Forestry. 93(2): 6-10.
Gobster, P.H.; Schroeder, H.W. 1988. Urbanites’ perceptions and aesthetic expectations of forestenvironments. In: Johnson, J.E., ed. Managing north-central forests for nontimber values: Proceed-ings, 4th Region 5 technical conference of the Society of American Foresters; 1988 November 29-December 1; Duluth, MT. Publ. 88-04. [Place of publication unknown]: Society of AmericanForesters.
Hanes, Richard. 1995. Personal communication, cultural anthropologist, U.S. Department of theInterior, Bureau of Land Management, P.O. Box 10226, Eugene, OR 97440-2226.
Hann, Wendel J.; Jones, Jeffrey L.; Karl, Michael G. [and others]. 1997. Landscape dynamicsof the basin. In: Quigley, Thomas M.; Arbelbide, Sylvia J., tech. eds. An assessment of ecosystemcomponents in the interior Columbia basin and portions of the Klamath and Great Basins. Gen.Tech. Rep. PNW-GTR-405. Portland, OR: U.S. Department of Agriculture, Forest Service, PacificNorthwest Research Station. Chapter 3. Vol. 2. (Quigley, Thomas M., tech. ed.; Interior ColumbiaBasin Ecosystem Management Project: scientific assessment).
Haynes, R.W.; Horne, A.L. 1997. Economic assessment of the basin. In: Quigley, Thomas M.;Arbelbide, Sylvia J., tech. eds. An assessment of ecosystem components in the interior Columbiabasin and portions of the Klamath and Great Basins. Gen. Tech. Rep. PNW-GTR-405. Portland,OR: U.S. Department of Agriculture, Forest Service, Pacific Northwest Research Station. Chapter6. Vol. 4. (Quigley, Thomas M., tech. ed.; Interior Columbia Basin Ecosystem Management Project:scientific assessment).
Hornback, K.E. 1991. Socio-economic outlook: outdoor recreation 2000. Trends. 28(2): 14-19.
Jones, J.L. 1995. Broad-scale pattern assessment. Draft report describing the metrics used to assessbroad-scale landscape structure. On file with: U.S. Department of Agriculture, Forest Service; U.S.Department of the Interior, Bureau of Land Management, Interior Columbia Basin EcosystemManagement Project, 112 E. Poplar, Walla Walla, WA 99362.
Kaplan, R. 1975. Some methods and strategies in the prediction of preference. In: Zube, E.H.Landscape assessment—values, perceptions, and resources. Stroudsburg, PA: Dowden, Hutchinsonand Ross, Inc.: 118-129.
Kaplan, S.; Kaplan, R. 1988. Cognition and the environment: functioning in an uncertain world. NewYork: Praeger. 132 p.
Lee, R.G. 1976. Assessing public concern for visual quality—landscape sensitivity research andadministrative studies. PSW-19. Berkeley, CA: U.S. Department of Agriculture, Forest Service,Pacific Southwest Forest and Range Experiment Station. 76 p.

28
Litton, R.B., Jr. 1984. Visual vulnerability of the landscape: control of visual quality. Res. Pap.WO-39. Washington, DC: U.S. Department of Agriculture, Forest Service. 28 p.
Litton, R.B., Jr.; Tetlow, R.J. 1978. A landscape inventory framework: scenic analysis of the north-ern Great Plains. PSW-135. Berkeley, CA: U.S. Department of Agriculture, Forest Service, PacificSouthwest Forest and Range Experiment Station: 117-124.
Luloff, A.E.; Krannich, R.S. 1990. Demographic correlates of outdoor recreation: trends andimplications. In: O’Leary, J.T. [and others], eds. Proceedings of the 3d outdoor recreation trendssymposium; 1990 March 29-31; Indianapolis, IN. [Place of publication unknown]: [Publisherunknown]: 131-146.
Magill, A.W. 1992. Managed and natural landscapes: What do people like? Res. Pap. PSW-RP-213.Albany, CA: U.S. Department of Agriculture, Forest Service, Pacific Southwest Research Station.28 p.
Marsh, G.P. 1864. Man and nature. [Reprinted 1965]. In: Lowenthal, D., ed. Cambridge, MA:Belknap Press of Harvard University Press.
McCool, S.; Haynes, R. 1995. Sustainability. 14 p. Unpublished report. On file with: U.S. Depart-ment of Agriculture, Forest Service; U.S. Department of the Interior, Bureau of Land Management,Interior Columbia Basin Ecosystem Management Project, 112 E. Poplar, Walla Walla, WA 99362.
McCool, S.F.; Benson, R.E.; Ashor, J.L. 1986. How the public perceives the visual effects of timberharvesting: an evaluation of interest group preferences. Environmental Management. 22.
McCool, S.F.; Burchfield, J.A.; Allen, S.D. 1997. Social assessment of the basin. In: Quigley,Thomas M.; Arbelbide, Sylvia J., tech. eds. An assessment of ecosystem components in the interiorColumbia basin and portions of the Klamath and Great Basins. Gen. Tech. Rep. PNW-GTR-405.Portland, OR: U.S. Department of Agriculture, Forest Service, Pacific Northwest Research Station.Chapter 7. Vol. 4. (Quigley, Thomas M., tech. ed.; Interior Columbia Basin Ecosystem ManagementProject: scientific assessment).
McGuire, J.R. 1979. Managing the forest landscape for public expectations. In: Proceedings of ournational landscape; 1979; Lake Tahoe, CA. Gen. Tech. Rep. PSW-35. Berkeley, CA: U.S. Depart-ment of Agriculture, Forest Service, Pacific Southwest Forest and Range Experiment Station:16-19.
McLellan, G.; Siehl, G.H. 1988. Trends in leisure and recreation: how we got to where we are.Trends. 25(4): 4-7.
Molitor, A. 1995. An assessment of natural resource-based recreation in the interior Columbia Riverbasin. 41 p. Unpublished report. On file with: U.S. Department of Agriculture, Forest Service; U.S.Department of the Interior, Bureau of Land Management, Interior Columbia Basin Ecosystem Man-agement Project, 112 E. Poplar, Walla Walla, WA 99362.
Murdock, S.H.; Backman, K.; Hoque, M.N.; Ellis, D. 1990. The impacts of future change inpopulation size and composition on recreational demand. In: O’Leary, J.T. [and others], eds.Proceedings of the 3d national recreation trends symposium; 1990 March 29-31; [Location ofmeeting unknown]. Bloomington, IN: Indiana University, Leisure Research Institute. 1: 147-195.Vol. 2. Sponsored by: Indiana University, Department of Recreation and Park Administration [andothers].

29
Nash, R. 1975. Qualitative landscape values: the historical perspective. In: Zube, E.H., ed. Landscapeassessment—values, perceptions, and resources. Stroudsburg, PA: Dowden, Hutchinson and Ross,Inc.: 117-125.
Newby, F.L. 1971. Perceptual assessment of forested roadside landscapes. Ann Arbor, MI: Universityof Michigan. 228 p. Ph.D. dissertation.
Noe, F.P. 1988. Effects of recreational and environmental values on tourist scenic preferences. In:Noe, F.P.; Hammit, W.E., eds. Visual preferences of travelers along the Blue Ridge Parkway.Scientific Monogr. Ser. No. 18. Washington, DC: U.S. Department of the Interior, National ParkService: 51-66.
Orians, G.H. 1986. Ecological and evolutionary approach to landscape aesthetics. In: Penning-Rousell; Lowenthal, D., eds. Landscape meanings and values. London, England: Allen and Unwin.271 p.
Orians, G.H.; Heerwagen, J.H. 1992. Evolved responses to landscapes. In: Barkow, J.H.; Cosmides,L.; Tooby, J. eds. The adapted mind: evolutionary psychology and the generation of culture. NewYork: Oxford University Press. 196 p.
Randall, A.; Stoll, J.R. 1983. Existence value in a total value framework. In: Rowe, R.D.; Chestnut,L., eds. Managing air quality and scenic resources at national parks and wilderness areas. Boulder,CO: Westview Press: 265-274.
Rasker, R. 1993. Rural development, conservation and public policy in the Greater Yellowstoneecosystem. Society and Natural Resources. 6: 109-126.
Rasker, R. 1994. A new look at old vistas: the economic role of environmental quality in westernpublic lands. University of Colorado Law Review. 65(2): 369-399.
Rasker, R.; Glick, D. 1994. Footloose entrepreneurs: Pioneers of the new West? Illahee. 10(1): 34-43.
Robbins, W.G. 1993. Landscape and environment—ecological change in the intermontane Northwest.Pacific Northwest Quarterly. 84(4): 140-149.
Roper Starch, Inc. 1994. From anxiety toward action a status report on conservation in 1994. TheTimes Mirror Magazine. [Not paged]. (National Environmental Forum Survey).
Ryden, K.C. 1993. Mapping the invisible landscape: folklore, writing, and the sense of place. IowaCity, IA: University of Iowa Press. 144 p.
Smardon, R.C. 1986. Historical evolution of visual resource management within three federalagencies. Journal of Environmental Management. 22(4): 301-317.
State of Oregon. 1992. Oregon State long range transportation plan. Unpublished report. On file with:Oregon Department of Transportation, 555 13th Street N.E., Salem, OR 97310.
State of Washington, Department of Ecology. 1978. Shoreline Master Program Handb. WAC 173-16. Report on file with: State of Washington, Department of Ecology, P.O. Box 47600, Olympia,WA 98504-7600.
Szwak, L.B. 1989. Social and demographic trends affecting outdoor recreation. In: Watson, A.E.,comp. Outdoor recreation benchmark 1988: Proceedings of the national outdoor recreation forum;1988 January 13-14; Tampa Bay, FL. Gen. Tech. Rep. SE-52. Asheville, NC: U.S. Department ofAgriculture, Forest Service, Southern Research Station: 22-26.
30
Trent, J. 1995. Attitudes, beliefs and values for Interior Columbia Basin Ecosystem ManagementProject. 53 p. On file with: U.S. Department of Agriculture, Forest Service; U.S. Department of theInterior, Bureau of Land Management, Interior Columbia Basin Ecosystem Management Project,112 E. Poplar, Walla Walla, WA 99362.
Ulrich, R.S. 1984. View through a window may influence recovery from surgery. Science. [Vol.unknown]: [pages unknown].
Ulrich, R.S.; Dimberg, U.; Driver, B.L. 1992. Benefits of leisure. In: Driver, B.L.; Brown, P.J.;Peterson, G.L., eds. [Title unknown]. State College, PA: Venture Publishing, Inc.: 73-89.
U.S. Department of Agriculture, Forest Service. 1994. Reform of the Forest Service budget struc-ture and budget process. Memorandum from Forest Service Chief Jack Ward Thomas, December 5,1994. Washington, DC.
U.S. Department of Agriculture, Forest Service. [In press]. Landscape aesthetics, a handbookfor scenery management. Agric. Handb. 701. Washington, DC: U.S. Government Printing Office.314 p.
U.S. Department of Commerce, Bureau of the Census. 1992. USA counties. Washington, DC:CD-ROM (Machine readable data files).
U.S. Department of the Interior, Bureau of Land Management. 1980. Visual resource managementprogram. U.S. Publ. Stock No. 024-011-0116-6. Washington, DC: Division of Recreation andCultural Resources
U.S. Laws, Statutes, etc. Public Law 94-579. The Federal Land Policy and Management Act of1976. Act of Oct. 21, 1976. 90 Stat. 2743, as amended; 43 U.S.C. 1701 (note), 1701-1702, 1711-1723, 1732-1737, 1740-1742, 1744, 1746-1748, 1751-1753, 1761-1771, 1781-1782.
U.S. Laws, Statutes, etc. Public Law 86-517. Multiple-Use Sustained-Yield Act of 1960. Act ofJune 12, 1960. 74 Stat. 215; 16 U.S.C. 528 (note), 528-531.
U.S. Laws, Statutes, etc. Public Law 91-190. National Environmental Policy Act of 1969. Act ofJan. 1, 1970. [An act to establish a national policy for the environment, to provide for theestablishment of a Council of Environmental Quality, and for other purposes.] In its: United Statesstatutes at large, 1969. 42 U.S.C. 4231, et. seq. (1970). Washington, DC: U.S. Government PrintingOffice: 852-856. Vol 83.
U.S. Laws, Statutes, etc. Public Law 94-588. National Forest Management Act of 1976. Actof October 22, 1976. 90 Stat. 2949, as amended; 16 U.S.C. 472a, 476, 500, 513-516, 518, 521b,528 (note), 576b, 594-2 (note), 1600 (note), 1601 (note), 1600-1602, 1604, 1606, 1608-1614).
U.S. Laws, Statutes, etc. Public Law 88-577. Wilderness Act. Act of September 3, 1964. 78 Stat.890; 16 U.S.C. 1121(note), 1131-1136.
Williams, D.R. 1995. Mapping place meanings for ecosystem management. Unpublished report. Onfile with: U.S. Department of Agriculture, Forest Service; U.S. Department of the Interior, Bureauof Land Management, Interior Columbia Basin Ecosystem Management Project, 112 E. PoplarStreet, Walla Walla, WA 99362.
Zube, E.H. 1976. Perception of landscape and land use. In: Altman, I.; Wohlwill, J.F., eds., Humanbehavior and environment. New York: Plenum: 62-80.

This page has been left blank intentionally.Document continues on next page.

This page has been left blank intentionally.Document continues on next page.

The Forest Service of the U.S. Department of Agriculture isdedicated to the principle of multiple use management of theNation’s forest resources for sustained yields of wood, water,forage, wildlife, and recreation. Through forestry research,cooperation with the States and private forest owners, andmanagement of the National Forests and National Grasslands,it strives—as directed by Congress—to provide increasinglygreater service to a growing Nation.
The U.S. Department of Agriculture (USDA) prohibitsdiscrimination in all its programs and activities on the basis ofrace, color, national origin, gender, religion, age, disability,political beliefs, sexual orientation, or marital or family status.(Not all prohibited bases apply to all programs.) Persons withdisabilities who require alternative means for communicationof program information (Braille, large print, audiotape, etc.)should contact USDA’s TARGET Center at (202) 720-2600(voice and TDD).
To file a complaint of discrimination, write USDA, Director,Office of Civil Rights, Room 326-W, Whitten Building, 14thand Independence Avenue, SW, Washington, DC 20250-9410or call (202) 720-5964 (voice and TDD). USDA is an equalopportunity provider and employer.
Pacific Northwest Research Station333 S.W. First AvenueP.O. Box 3890Portland, OR 97208-3890
