scheduling project management using crashing cpm … · mrs. ruchita shrimali vyas ... plan,...
TRANSCRIPT

Scheduling Project Management Using Crashing CPM Network
to get Project completed on Time
Mrs. Ruchita Shrimali Vyas
Mechanical Engineering Department
Pacific College Of Engineering
Udaipur, Rajasthan
International Journal of Engineering Research & Technology (IJERT)
Vol. 2 Issue 2, February- 2013ISSN: 2278-0181
1www.ijert.org
IJERT
IJERT
Abstract
Most of the companies suffer from
difficulties and challenges due to
complexity of project and because of
dependency on the traditional tool to
plan, schedule and control the project
development. The needs for continuous
control of time, cost and performance
of project also can be completed on
time with good quality and within the
allocated budget.
To reduce a projects completion time,
a technique called “Crashing” is
performed which involves bringing in
additional resources for activities
along the critical path of the network.
The research created model to
determine the order in which activities
should be crashed as well as using
CPM techniques helps good project
management in achieving the objective
with minimum of time and least cost
and also in predicting the probable
project duration and associates cost
meeting the desired project and by
using a Linear Programming Model we
provide a more easy and appropriate
way of crashing a problem.
This paper objective mainly provides a
framework for reducing total project
time at the least cost by crashing the
project network. Then the model is
solved with Linear Programming
Method.
Introduction
Project management is the discipline
that relates all those words that you
thought of that apply to project. This
discipline cultivates the expertise to
plan, monitor, track and manage the
people, the time, the budget, and the
quality of the work on project.
Project scheduling is a part of project
management which relates to the use of
schedules such as Grantt Charts,
CPM/PERT to plan and subsequently
report progress within the project
environment. Project scheduling looks
at which tasks need to be performed for
a project and assigns deadlines for their
completion. The project scheduler sets
these deadlines by calculating how
long each task should take to perform.
It requires a comprehensive
understanding of which actions needs
to get done and when.
The Objective:
Why is the project needed?
Broadly the objective must meet the
three fundamental criteria:
The project must be completed on
time.
The project must be accomplished
within the budgeted cost.
The project must meet the
prescribed quality requirement.
Keywords
International Journal of Engineering Research & Technology (IJERT)
Vol. 2 Issue 2, February- 2013ISSN: 2278-0181
2www.ijert.org
IJERT
IJERT
Project Management, Activities,
Critical Path Method (CPM), Slack
Time, Crashing.
The Methodology of the
Research
Study the CPM strategic planning
process for planning and development
of “Columbia Pkoana Precast Block
Production Plant” in order to get the
optimal time at minimum total cost to
complete implementation of project.
This research enables the project
management to study and analyze the
value of project activity during all
phases of project, so as to reach the
maximum benefits and minimum cost
palnning.
Time and Schedule
Management
Project Scheduling:
The target of project scheduling is to
construct a time table where each
individual activity receive a start time
and a corresponding finish time within
the predefined precedence relations
and the various predefined activity
constraints.
The scheduling process is based on the
traditional critical path based forward
(to create an earliest start time
schedule) and or backward (to create a
latest start schedule).Scheduling
calculations aiming to construct a
project schedule with a minimal project
lead time.Project scheduling is often
the most visible step in the sequence of
steps of project management. The two
most common techniques of basic
project scheduling are the Critical Path
Method (CPM) and Program
Evaluation and review technique
(PERT).
Network Techniques
Network techniques are used for
managing time, they are so called
because they are based on the network
diagrams to achieve the following:
Schedule activities namely define
the start and end time of each
activity and consequently the
duration of the entire project.
Analyze the allowable floats
slacks for non critical activities
(that do not increase the duration
of the project), which means
identifying those activities that if
delayed would prolong the
duration of the project and are
therefore known as critical.
There are three types of starting data:
a. The activities (task name or
identification code).
b. Their duration.
c. The links of precedence between
activities.
There are therefore various
network techniques:
International Journal of Engineering Research & Technology (IJERT)
Vol. 2 Issue 2, February- 2013ISSN: 2278-0181
3www.ijert.org
IJERT
IJERT

These are CPM (critical path method),
PERT (program evaluation and review
technique), GERT (graphical
evaluation and review technique),
VERT (venture evaluation and review
technique), but here we will be
discussing only two techniques.
Critical Path Method
The critical path method sometimes
referred to as Critical Path
Analysis(CPA) was developed in
1950’s by DuPont Corporation and
Remington Rand Corporation. It was
specifically developed to manage
Power Plant Maintenance Projects.
They wanted to develop a management
toll that would help in scheduling of
chemical plant shut downs for
maintenance and then restarting once
maintenance was complete.
Note: used when the duration of all the
activities is considered fixed and
likewise the links of precedence, which
are of the finish-to-start type (namely
the beginning of a certain activity is
linked to the end of a previous one).
Program Evaluation and Review
Technique (PERT)
PERT was originally developed in
1958 and 1959 to meet the needs of the
“age of massive engineering” where
the techniques of Taylor and Grantt
were inapplicable.
Note: PERT namely a CPM having all
durations expressed in a probabilistic
manner.
PERT and CPM Critical Path
Procedure
Develop a list of activities that make
up the project.
1. Determine the immediate
predecessors for each activity in
the project.
2. Estimate the completion time for
each activity.
3. Draw a project network depicting
the activities and immediate
predecessors listed in step 1 and 2.
4. Use the project network and the
activity time estimates to
determine the earliest start and
earliest finish time for each
activity by making a forward pass
through the network. The earliest
finish time for the last activity in
the project identifies the total time
required to complete the project.
5. Use the project completion time
identified in step 4 as the latest
finish time for the last activity and
make a backward pass through the
network to identify the latest start
and finish time for each activity.
Scheduling Individual
Activities (CPM
Computations)
International Journal of Engineering Research & Technology (IJERT)
Vol. 2 Issue 2, February- 2013ISSN: 2278-0181
4www.ijert.org
IJERT
IJERT
The actual duration of each activity
turns out to be the same as its
estimated duration.
Critical Path = Total activities on
this path is greater than any other path
through the network (delay in any task
on the critical path leads to delay in the
project.
Forward Pass (Earliest
Occurrence Times):
The earliest start time of an activity is
equal to the largest of the earliest
finish times of its immediate
predecessors.
ES = Earliest Start time for a
particular activity.
EF = Earliest Finish time for a
particular activity.
Where EF = ES + (estimated)
duration of the activity
(For each activity that starts the
project its earliest start time is ES =
0).
Backward Pass (Latest
Occurrence Times):
The latest start time for an activity is
the latest possible time that it can start
without delaying the completion of
the project.
LS = Latest Start times for a particular
activity.
LF = Latest Finish time for a
particular activity.
Where LS = LF – (estimated) duration
of the activity.
(Latest Finish Time of an activity is
equal to the smallest of the latest start
times of its immediate successors).
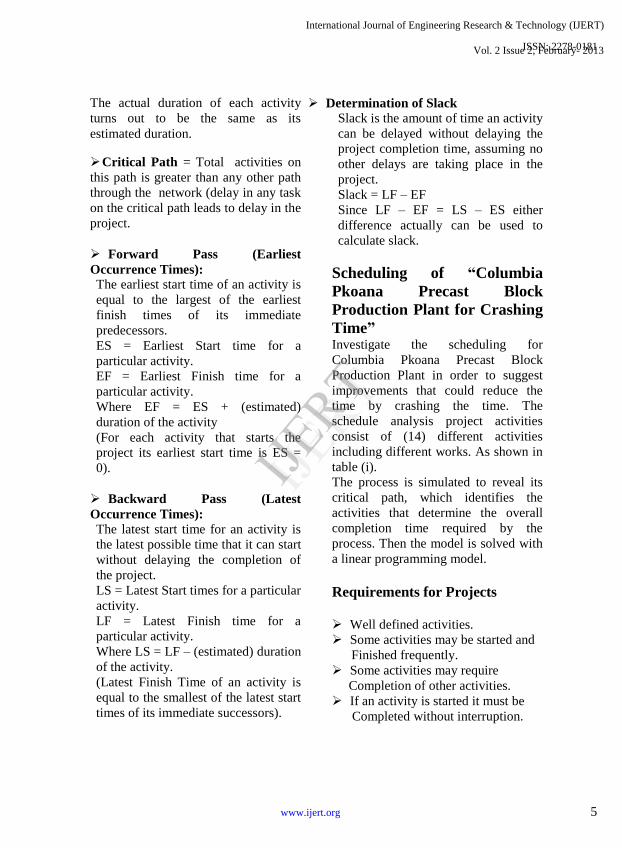
Determination of Slack
Slack is the amount of time an activity
can be delayed without delaying the
project completion time, assuming no
other delays are taking place in the
project.
Slack = LF – EF
Since LF – EF = LS – ES either
difference actually can be used to
calculate slack.
Scheduling of “Columbia
Pkoana Precast Block
Production Plant for Crashing
Time” Investigate the scheduling for
Columbia Pkoana Precast Block
Production Plant in order to suggest
improvements that could reduce the
time by crashing the time. The
schedule analysis project activities
consist of (14) different activities
including different works. As shown in
table (i).
The process is simulated to reveal its
critical path, which identifies the
activities that determine the overall
completion time required by the
process. Then the model is solved with
a linear programming model.
Requirements for Projects
Well defined activities.
Some activities may be started and
Finished frequently.
Some activities may require
Completion of other activities.
If an activity is started it must be
Completed without interruption.
International Journal of Engineering Research & Technology (IJERT)
Vol. 2 Issue 2, February- 2013ISSN: 2278-0181
5www.ijert.org
IJERT
IJERT

S.No Activity Activity Description Predecessors
Activity
Duration
(minutes)
1 ARaw material testing and
samplingNone 25
2 BLoading aggregate by
loader to four beanA 20
3 C
Loading cement through
cement screw
conveyorfrom cement silo
to pan mixer
B 12
4 D
Conveying Batched
aggregate as per mix design
through aggregate conveyor
belt from four bean to pan
mixer
B 15
5 E
Loading flyash through
flyash screw conveyor from
flyash silo to pan mixer
B 14
6 F
Mixing of batched
aggregate, cement, flyash
and water in pan mixer
C,D,E 5
7 G
Conveyor in grean mix
through mud Belt conveyor
from Pan mixer to SPM -20
machine
F 4
8 H
Stamping final product as
per mould through SPM -
20 machine
G 8
9 I
Loading pallet with final
product in to the rack
through hydraulic off bearer
H 5
10 JShifting rack into curing
klin chamberI 10
11 K Demoulding or depallesing J 20
12 L Storage and production K,M 30
13 MMoulds and pallets cleaning
and repairK 15
14 N Testing Visual / Laboratory L 20
Table 1 Activity List of Columbia Pkoana Precast Block Production
plant
Network Representation of a
Project
Project and activities are represented
by a network.
Network is a graph showing each
activity to be performed its predecessor
and successor.
Activities are represented by an arrow
generally needs some resources for its
performance (use letters)
Node Activities start or end at points
called node represented by circle.
Fig (i) Network Analysis Diagram with Duration of each activity
Establishment of Critical Path
The path and paths lengths through
Pkoana’s Project network
A-B-C-F-G-H-I-J-K-L-N =
25+20+12+5+4+8+5+10+20+30+20 =
159
A-B-C-F-G-H-I-J-K-M-L-N =
25+20+12+5+4+8+5+10+20+15+30+
20 = 174
A-B-D-F-G-H-I-J-K-L-N =
25+20+15+5+4+8+5+10+20+30+20 =
162
International Journal of Engineering Research & Technology (IJERT)
Vol. 2 Issue 2, February- 2013ISSN: 2278-0181
6www.ijert.org
IJERT
IJERT

A-B-D-F-G-H-I-J-K-M-L-N =
25+20+15+5+4+8+5+10+20+15+30+
20 = 177
A-B-E-F-G-H-I-J-K-L-N =
25+20+14+5+4+8+5+10+20+30+20 =
161
A-B-E-F-G-H-I-J-K-M-L-N =
25+20+14+5+4+8+5+10+20+15+30+
20 = 177.
Table (ii) Output of the Whole Project
Fig.(ii) Network Diagram Showing Critical Path
Time - Cost Trade Offs
Now our next step is to investigate how
much extra would it cost to reduce the
project duration.
Crashing the project refers to reduce
crashing a number of activities to
reduce the duration of project below its
normal value.
Crashing an activity refers to taking
some special measures to reduce the
duration of project below its normal
value. These special measures might
include using overtime, hiring
additional temporary help, using
special time saving materials, obtaining
special equipment and so forth.
CPM Method of Time Cost Trade Offs
is concerned with how much (if any) to
crash each of the activities to
anticipated duration of the project
down to a desired value.
The data necessary for determining
how much to crash a particular activity
is given by the time cost trade graph
for the activity.
Cost Scheduling Computations:
Let
NT = Normal Time = completion time
of an activity with allocation of
resources.
NC = Normal Cost = cost associated
with normal time.
CT = Crash Time = shortest
completion time of an activity with
extra resources.
CC = Crash Cost = cost associated
with crash time.
Cost Slope = Change in Cost / Change
in Time.
= (Normal Cost – Crash Cost) / (Crash
Time – Normal Time)
The time cost computations are as
shown in Table. With two exceptions:
Cost Slope (Change in Cost /
Change in Time) is computed for
all the activities on Critical Path.
(crashing of non critical activities
will result in reducing slack ,there
is no savings in project duration).
There is no cost reduction for
activities F, G, H, I, and L even
though all these are on the critical
path.
International Journal of Engineering Research & Technology (IJERT)
Vol. 2 Issue 2, February- 2013ISSN: 2278-0181
7www.ijert.org
IJERT
IJERT

Table (iii) Time Cost Trade off Data for Activities of Columbia Pkoana’s
Project
The table below lists all the paths
through the project network and
current length of each of these paths.
Table (iv) Initial table for starting marginal cost analysis for Columbia
Pkoana Plant
Procedure for the Marginal
Cost Analysis:
i. Take economic decision
concerning which activity should
be accelerated to reduce the
project duration.
ii. Crash that activity one time unit.
iii. Weigh this against the maximum
time reduction allowed for that
activity.
iv. Caution: make sure that critical path
does not change. v. Go back to step ii. And repeat till
minimum cost schedule is obtained.
Table (v) Final Table for starting
marginal cost analysis for Columbia
Pkoana Project
Using Linear Programming to
make Crashing Decisions:
The problem of finding the least
expensive way of crashing activities
can be rephrased in form more familiar
to linear programming as follows:
Restatement of the problem:
Let Z be the total cost of activities. The
problem then is to minimize Z, subject
to the constraint the project duration
ActivityImmediate
Predecessor
Normal
Time
(min.)
Crash
Time
(min.)
Normal
Cost (Rs.)
Crash
Cost(Rs.)
Maximum
Reduction
in Time
(min.)
Crash
Cost per
minute
saved
(Rs./min.)
A None 25 20 255 315 5 12.00
B A 20 13 65 118 7 7.55
C B 12 10 40 46 2 3.00
D B 15 12 25 34 3 3.00
E B 14 12 15 22 2 3.50
F C,D,E 5 5 20 20 N/A N/A
G F 4 4 22 22 N/A N/A
H G 8 8 58 58 N/A N/A
I H 5 5 32 32 N/A N/A
J I 10 7 52 69 3 5.67
K J 20 16 18 25 4 1.75
L K,M 30 30 30 30 N/A N/A
M K 15 12 15 18 3 1.00
N L 20 15 180 225 5 9.00
Activity to
CrashCrash
Cost
AB
CF
GH
IJK
LN
AB
CF
GH
IJK
ML
N
AB
DF
GH
IJK
LN
AB
DF
GH
IJK
ML
N
AB
EF
GH
IJK
LN
AB
EF
GH
IJK
ML
N
159 174 162 177 161 176
Length of Path
Activity
to CrashCrash
Cost
AB
CF
GH
IJK
LN
AB
CF
GH
IJK
ML
N
AB
DF
GH
IJK
LN
AB
DF
GH
IJK
ML
N
AB
EF
GH
IJK
LN
AB
EF
GH
IJK
ML
N
159 174 162 177 161 176
M 1.00 Rs. 159 173 162 176 161 175
M 1.00 Rs. 159 172 162 175 161 174
M 1.00 Rs. 159 171 162 174 161 173
K 1.75 Rs. 158 170 161 173 160 172
K 1.75 Rs. 157 169 160 172 159 171
K 1.75 Rs. 156 168 159 171 158 170
K 1.75 Rs. 155 167 158 170 157 169
D 3.00 Rs. 155 167 157 169 157 169
Length of Path (min.)
International Journal of Engineering Research & Technology (IJERT)
Vol. 2 Issue 2, February- 2013ISSN: 2278-0181
8www.ijert.org
IJERT
IJERT

must be less than or equal to the time
desired by the project manager.
The natural decision variables are
Xi = reduction in the duration of
activity j due to crashing this activity.
For j = A, B, C, E, F, G, H, I, J, K, L,
M, N.
By using the last column of table (iii)
the objective function to be minimized
then is
Z = 12XA + 7.55 XB +3.00XC +3.00XD
++3.50XE +5.67XJ +1.75XK +1.00XM
+9.00XN
Each of the nine decision variables on
the right hand side needs to be
restricted to non negative variables that
do not exceed the maximum given in
the next to last column of table (iii).
To impose the constraint that the
project duration must be less than or
equal to the desired value (169
minutes).
Let,
Yfinish = Project duration i.e the time at
which the FINISH node in the project
is reached the constraints then is,
Yfinish ≤ 169.
Yi = start time of activity (for j = (B,
C,…….., ,N) given the values of XB,
XC …… XN. No such variables are
needed for activity A since being the
starting activity is automatically
assigned a value 0 (zero). Similarly the
end activity is also assigned zero value.
The start time to each activity is
(including Finish) is directly related to
the start time and duration of each of
its immediate predecessors as
summarized below. Furthermore by
using the normal times from table
…the duration of each activity is given
by the following formula.
For each activity (B, C,………….N)
and each of its immediate predecessor
Start time of this activity ≥ (start time
+ duration) of its immediate
predecessors.
Furthermore by using normal time
from table…the duration of each
activity is given by
Duration of activity j = its normal time
– Xi.
To illustrate this
Consider the following relation for
the following activities:
By including relationships for all
activities as constraints we obtain the
complete linear programming model
given below:
Minimize
Z = 12XA + 7.55 XB +3.00XC +3.00XD
++3.50XE +5.67XJ +1.75XK +1.00XM
+9.00XN
Subjected to the following constraints
Maximum Reduction Constraints
Using the next to last column of table
(iii).
XA ≤ 5, XB ≤ 7, XC ≤ 2, XD ≤ 3, XE ≤
2, XJ ≤ 3, XK ≤ 4, XM ≤ 3, XN ≤ 5.
Non Negative Constraints
XA≥ 0, XB≥ 0, XC≥ 0, XD≥ 0, XE≥ 0,
XJ≥ 0, XK≥ 0, XM≥ 0, XN≥ 0
Start Time Constraints
As described above the objective
function, except for activity A (which
starts the project), there is one such
constraint for each activity with a
single immediate predecessor
(activities B, C, D, E, G, H, I, J, K, M)
with two immediate predecessors
(activity L) and three activity
International Journal of Engineering Research & Technology (IJERT)
Vol. 2 Issue 2, February- 2013ISSN: 2278-0181
9www.ijert.org
IJERT
IJERT
A B C D E F G H I J K
1
2
3
4
5 Normal Crash Normal Crash
6 A 25 20 255 315 5 12 0 0 25
7 B 20 13 65 118 7 7.5714286 25 0 45
8 C 12 10 40 46 2 3 45 0 57
9 D 15 12 25 34 3 3 45 1 59
10 E 14 12 15 22 2 3.5 45 0 59
11 F 5 5 20 20 0 N/A 59 0 64
12 G 4 4 22 22 0 N/A 64 0 68
13 H 8 8 58 58 0 N/A 68 0 76
14 I 5 5 32 32 0 N/A 76 0 81
15 J 10 7 52 69 3 5.6666667 81 0 91
16 K 20 16 18 25 4 1.75 91 4 107
17 L 30 30 30 30 0 N/A 107 0 137
18 M 15 12 15 18 3 1 137 3 149
19 N 20 15 180 225 5 9 149 0 169
Max.Time
169 169
Total Cost 840
Project Finish Time
(min.)
Columbia Pkoana's Precast Block Production Plant
Activity Time (minute) Cost (Rs.) Maximu
m Time
Reductio
n (min.)
Crash
Cost per
minute
saved
(Rs./min.)
Start
Time
(min.)
Time
Reducti
on
(min.)
Finish
Time
(min.)
Range Name Cells Range Name Cells
AFinish K6 IFinish K14
AStart I6 IStart I14
BFinish K7 JFinish K15
BStart I7 JStart I15
CFinish K8 KFinish K16
CrashCost F6:F19 KStart I16
CrashCostPerMinuteSavedH6:H19 LFnish K17
CrashTime D6:D19 LStart I17
CStart I8 Max. Time K22
DFinish K9 Max. Time Reduction G6:G19
DStart I9 MFinish K18
EFinish K10 MStart I18
EStart I10 NFinish K19
FFinish K11 Normal Cost E6:E19
FinishTime K6:K19 Normal Time C6:C19
FStart I11 NStart I19
GFinish K12 ProjectFinishTime I22
GStart I12 StartTime I6:I19
HFinish K13 TimeReduction J6:J19
HStart I13 TotalCost I24
constraints for each activity with three
immediate predecessors.
One immediate Predecessor
YB ≥ (0 + 25 – XA)
YC ≥ (YB + 20 – XB)
YD ≥ (YB + 20 – XB)
YE ≥ (YB + 20 – XB)
YG ≥ (YF +5 – XF)
YH ≥ (YG + 4 – XG)
YI ≥ (YH + 8 – XH)
YJ ≥ (YI + 5 – XI)
YK ≥ (YJ + 10 – XJ)
YM ≥ (YK + 20 – XK)
YN ≥ (YL + 30 – XL)
Two immediate Predecessors
YL ≥ (YK + 20 – XK)
YL ≥ (YM + 15 – XM)
Three immediate Predecessors
YF ≥ (YE + 14 – XE)
YF ≥ (YD + 15 – XD)
YF ≥ (YC + 12 – XC)
Project Duration Constraint
YFinish ≥ 169
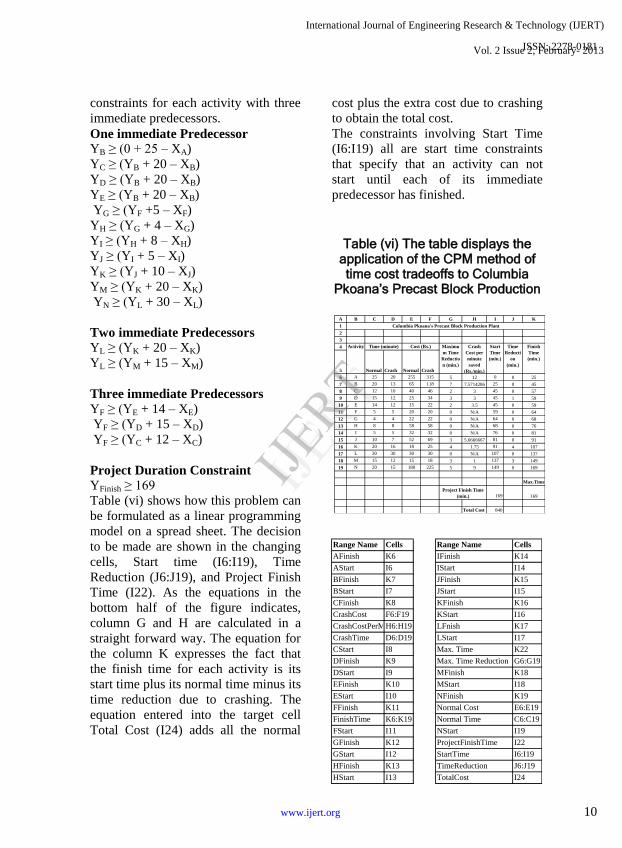
Table (vi) shows how this problem can
be formulated as a linear programming
model on a spread sheet. The decision
to be made are shown in the changing
cells, Start time (I6:I19), Time
Reduction (J6:J19), and Project Finish
Time (I22). As the equations in the
bottom half of the figure indicates,
column G and H are calculated in a
straight forward way. The equation for
the column K expresses the fact that
the finish time for each activity is its
start time plus its normal time minus its
time reduction due to crashing. The
equation entered into the target cell
Total Cost (I24) adds all the normal
cost plus the extra cost due to crashing
to obtain the total cost.
The constraints involving Start Time
(I6:I19) all are start time constraints
that specify that an activity can not
start until each of its immediate
predecessor has finished.
Table (vi) The table displays the application of the CPM method of time cost tradeoffs to Columbia
Pkoana’s Precast Block Production
International Journal of Engineering Research & Technology (IJERT)
Vol. 2 Issue 2, February- 2013ISSN: 2278-0181
10www.ijert.org
IJERT
IJERT

Result
Because crashing a non critical activity
does not affect the overall project time
to completion, only critical activities
that can be crashed are considered. The
activities to be crashed are chosen in
order of increasing expenses. Thus the
activity with the smallest crash cost in
table (vi) (Activity M) is chosen to be
crashed first. The next activity to be
crashed is Activity K. Then next
activity to be crashed is Activity D, but
it is crashed by one time unit only
because further crashing will result in
change in critical path so after that
crashing is stopped.
By using the linear programming
model presented in this paper we will
be able to determine how much (if any)
to crash each activity in order to
minimize the total cost of meeting any
specified deadline for the project.
Conclusion
The data needed for crashing project
Cost programming techniques are the
time and cost for each activity when it
is done in the normal way and then
when it is partially crashed. We can
investigate the effect on total cost of
changing the estimated duration of the
project to various alternative values.
In the project management literature,
quantitative models were developed for
project crashing to determine the
appropriate activities for crashing at
minimal cost. In this paper, we suggest
that the project quality may be affected
by project crashing and develop
tradeoffs among time, cost and quality.
Acknowledgement
I earnestly acknowledge with
a profound sense of gratitude my
indebtedness to Mr. Manish
Pokharna (Head and Associate
Professor, Mechanical Engineering
Deptt.) for his aspiring guidance,
valuable and constructive criticism and
sustained interest in my research work.
His valuable advice, suggestions and
cooperation have enabled my work to
see the light of the day.I would be
failing in my duties if I do not express
my gratitude to my parents (Mr. K.C.
Shrimali & Mrs. Vimla Shrimali)
and my husband (Mr. Saurabh
Vyas) for all their support and
encouragement. I m also thankful to
my little kid (Master Kavish) who has
helped me to work over my project
patiently. Finally I am indebted to the
almighty for the successful completion
of the project.
References:
1. Dr.B.C. Punmia, K.K. Khandelwal ,
Project, Planning and Control with
PERT and CPM, Fifth, 2006, Laxmi
Publication (P) Limited.
71-118, 125-297.
2. S.C.Sharma, Operation Research
PERT/CPM & Cost Analysis, First,
2006, Discovery Publishing House,
126-208.
International Journal of Engineering Research & Technology (IJERT)
Vol. 2 Issue 2, February- 2013ISSN: 2278-0181
11www.ijert.org
IJERT
IJERT
3. “A thesis” Allen D.Holliday,
Critical Path Method, Computer
Science Department, California
State University, 2009.
4. “An Article Journal” Law,C.E,
Lach, D.C, Academic Journal,
March 1966, volume 4, issue1,
P 4.
5. R. Sivarethinamohan Operations
Research, 2008, Tata Mc Graw Hill
An article in Journal
(1) Law, C.E ; Lach, D.C,
Academic Journal, March
1966, volume 4, issue 1, p 4.
International Journal of Engineering Research & Technology (IJERT)
Vol. 2 Issue 2, February- 2013ISSN: 2278-0181
12www.ijert.org
IJERT
IJERT

International Journal of Engineering Research & Technology (IJERT)
Vol. 2 Issue 2, February- 2013ISSN: 2278-0181
13www.ijert.org
IJERT
IJERT