schneider, william, jane waldfogel, and jeanne brooks-gunn
TRANSCRIPT

© The Russell Sage Foundation
To download additional chapters in this book, please go to:https://www.russellsage.org/children-great-recession
Schneider, William, Jane Waldfogel, and Jeanne Brooks-Gunn. 2016. “Mothers’ and Fathers’ Parenting.” In Children of the Great Recession, edited by Irwin Garfinkel, Sara McLanahan, and Christopher Wimer. New York: The Russell Sage Foundation.
Chapter 7
Mothers’ and Fathers’ ParentingWilliam Schneider, Jane Waldfogel,
and Jeanne Brooks-Gunn
In previous chapters, we see that recessions take an economic toll on fam-ilies. They also lead to reductions in parents’ health, relationship quality,
and contributions from nonresident fathers. In this chapter, we turn to the question of whether recessions also affect the experiences of children in their homes, as measured by the parenting provided by their mothers and fathers when the children are one, three, five, and nine years of age.
We ask how a large change in the unemployment rate, one similar to that of the Great Recession, affects mothers’ and fathers’ parenting. We look at three aspects of mothers’ parenting—use of harsh parenting, expression of warmth toward the child, and participation in cognitively stimulating activities with the child. Fathers were asked about use of harsh parenting. Most of our parenting measures were first observed when children were three years old (spanking, an indicator of harsh parenting, is an exception and was first measured at age one).
An important consideration for our chapter is that we analyze the par-enting of children who are experiencing dramatic developmental changes during the study and that interactions between parents and children change a great deal as children age. Parents seek activities and disciplinary strate-gies that are appropriate for their children’s age as well as their cognitive, emotional, and social capacities. The amount of time parents spend with school-age children, and the types of games and activities in which they engage, are different from the amount of time and kinds of activities par-ents and young children might do together. For example, spanking is much more common with younger than older children, given the increases in self-regulation that occur over the childhood years. Expressions of warmth tend to decline as children mature. Cognitively stimulating activities that parents engage in with a three- or five-year-old child, like playing with blocks or telling stories, are replaced by activities like helping with home-work, talking about current events in the child’s life, and watching televi-sion together by the time a child is nine years old. A nine-year-old child might arrive home from school, and together parent and child might work on the child’s homework or discuss the events of the day. A three-year-old, in contrast, may have spent the day in daycare or with the parent, and
174 children of the great recession
their interactions may focus more on care and age-appropriate play. Thus the specific parenting activities that parents are asked about in the Fragile Families Study vary according to their appropriateness to the age of child.
We analyze both mothers’ and fathers’ parenting. Mothers and fathers exhibit similar parenting behaviors, even though the frequency with which they engage in certain behaviors sometimes differs. Past studies indicate that parents from different socioeconomic backgrounds also differ in the amount of specific behaviors exhibited.1 Parents with more education are likely to spend more time doing things like reading to their children than their less-educated peers.2 Thus, as with other chapters in this volume, we use mothers’ education as an indicator of families’ socioeconomic status and ask whether more and less-educated parents respond to recessions in different ways.
ECONOMIC HARDSHIP, UNCERTAINTY, AND PARENTING
Perhaps the most famous study of how parenting is affected by eco-nomic conditions is Glen H. Elder Jr.’s study of families during the Great Depression.3 Elder, and in later work with his colleague Rand Conger, found that individual-level unemployment and job loss was associated with increased harsh parenting and more conflict between mothers and fathers.4 In their studies, and in replications in different contexts, Elder and Conger found that changes in parenting that result from economic hardship and uncertainty have negative effects for child well-being.5 These results are consistent with a body of research linking poverty and economic hardship to a range of parenting practices that may adversely affect children. In particular, individual-level experiences of poverty and economic hardship have been shown to be associated with increased puni-tive parenting behaviors as well as less warmth in parenting.6
How is parenting likely to be affected by a big recession? A number of recent studies have used macroeconomic measures to assess the effect of the Great Recession on parenting. These studies provide ample and grow-ing evidence that the Great Recession was associated with increases in harsh parenting. Worsening economic conditions (measured by increases in local unemployment rates, foreclosure rates, or state-level mass lay-offs) and declining consumer confidence (measured by changes in the national Consumer Sentiment Index) have been linked to indicators of harsh parenting such as increased physical and psychological aggression or increased reports of possible child maltreatment.7 However, increases in the unemployment rate during the Great Recession have not been related to more reports to or investigations by Child Protective Service agencies.8
Evidence on other types of parenting is more limited. Studies of prior recessions and the 1980s Iowa Farm Crisis indicate that individual-level measures of economic hardship and uncertainty are associated with reduced parenting warmth, consistent with Elder’s findings.9 This chapter
mothers’ and fathers’ parenting 175
builds on this body of research by focusing primarily on macroeconomic factors, not only on individual-level experiences of economic downturns (job losses). In this way, our results are less likely than results from prior studies to be driven by other individual differences between parents that could affect both their likelihood of experiencing unemployment or other economic shocks and their parenting.
TRENDS IN PARENTING: CHILDREN AGES THREE TO NINE
We begin by looking at some basic trends in parenting when children were three, five, and nine years old. We focus on three aspects of parenting: harsh-ness (spanking, physical aggression, and psychological aggression), warmth, and activities with children. The questions on harshness were drawn from the Conflict Tactics Scale, a well-established battery of questions designed to gauge parents’ physical and psychological aggression toward their chil-dren.10 Both mothers and fathers were asked a series of questions about their own and each other’s harsh parenting practices. A specific question on spanking was also asked when children were one, three, five, and nine years old. Child maltreatment is often thought of as occurring on a continuum with maltreatment on one end and more widely accepted parental disciplin-ary practices on the other.11 The more frequently a parent uses harsh par-enting, the greater the risk for child maltreatment. Parents were also asked about the kinds of activities they did with their children. These questions ranged from activities like reading books together and playing outside, to watching television or playing video games, and varied depending on the age of the child. Last, mothers were observed interacting with their child in the home. The number of warm interactions, like using terms of endear-ment or cuddling, between mother and child were recorded.12 The sample size for the warmth measure is somewhat smaller than those for harsh and cognitively stimulating activities given that the former is observed in the home rather than being based on parental self-report.
For each of our measures of parenting behavior we concentrate on behaviors that occur frequently. We focus on high-frequency parenting behaviors for two reasons. First, high-frequency harsh parenting is itself a particular risk factor for children and is associated with problem behav-iors.13 Second, we expect that deep recessions, like the Great Recession, would be more likely to move parents toward increasing or decreasing their current parenting behaviors, rather than exhibiting new ones.
Theory and empirical evidence would lead us to hypothesize that harsh parenting, and particularly high-frequency harsh parenting, would decline over time as children age. This might be for a number of reasons. First, as children mature, they are better able to regulate their own behavior, and parents are able to use other forms of discipline to influence them. Second, as children move from early childhood to middle childhood and early ado-lescence they gain greater autonomy and parents perform less monitoring
176 children of the great recession
and have fewer opportunities to administer corporal punishment or harsh parenting. Third, as children develop physically, corporal punishment and physically aggressive parenting become more difficult and are generally used less frequently. Warmth is also expected to decline as children mature. The trend in cognitively stimulating activities is more difficult to predict, given that the activities measured are different at the various ages.
mothers’ parenting
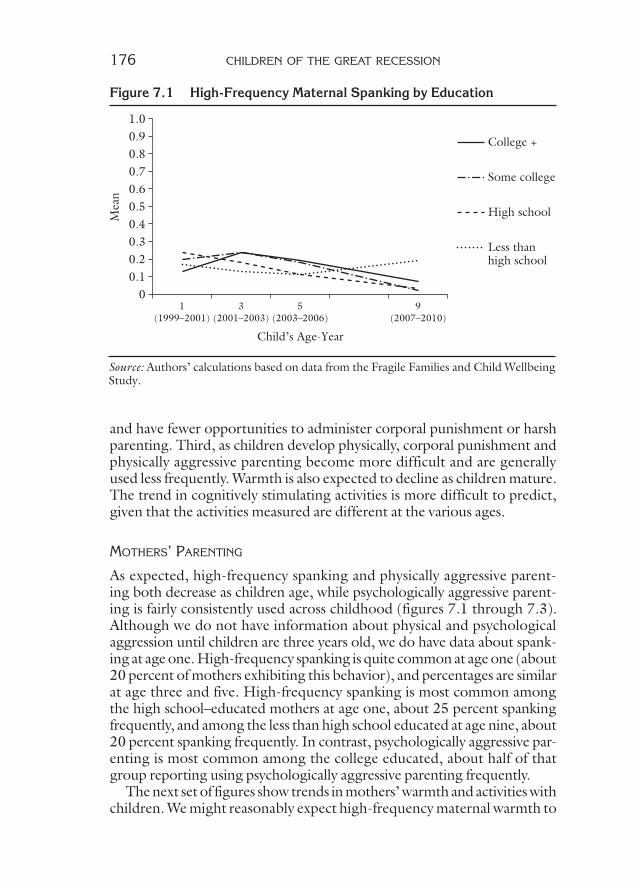
As expected, high-frequency spanking and physically aggressive parent-ing both decrease as children age, while psychologically aggressive parent-ing is fairly consistently used across childhood (figures 7.1 through 7.3). Although we do not have information about physical and psychological aggression until children are three years old, we do have data about spank-ing at age one. High-frequency spanking is quite common at age one (about 20 percent of mothers exhibiting this behavior), and percentages are similar at age three and five. High-frequency spanking is most common among the high school–educated mothers at age one, about 25 percent spanking frequently, and among the less than high school educated at age nine, about 20 percent spanking frequently. In contrast, psychologically aggressive par-enting is most common among the college educated, about half of that group reporting using psychologically aggressive parenting frequently.
The next set of figures show trends in mothers’ warmth and activities with children. We might reasonably expect high-frequency maternal warmth to
College +
Some college
High school
Less than high school
00.10.20.30.40.50.60.70.80.91.0
Mea
n
1(1999–2001)
3(2001–2003)
5(2003–2006)
9(2007–2010)
Child’s Age-Year
Source: Authors’ calculations based on data from the Fragile Families and Child Wellbeing Study.
Figure 7.1 High-Frequency Maternal Spanking by Education

mothers’ and fathers’ parenting 177
College +
Some college
High school
Less than high school
00.10.20.30.40.50.60.70.80.91.0
Mea
n
1(1999–2001)
3(2001–2003)
5(2003–2006)
9(2007–2010)
Child’s Age-Year
Source: Authors’ calculations based on data from the Fragile Families and Child Wellbeing Study.
Figure 7.3 High-Frequency Maternal Psychological Aggression by Education
College +
Some college
High school
Less than high school
00.10.20.30.40.50.60.70.80.91.0
Mea
n
1(1999–2001)
3(2001–2003)
5(2003–2006)
9(2007–2010)
Child’s Age-Year
Source: Authors’ calculations based on data from the Fragile Families and Child Wellbeing Study.
Figure 7.2 High-Frequency Maternal Physical Aggression by Education
178 children of the great recession
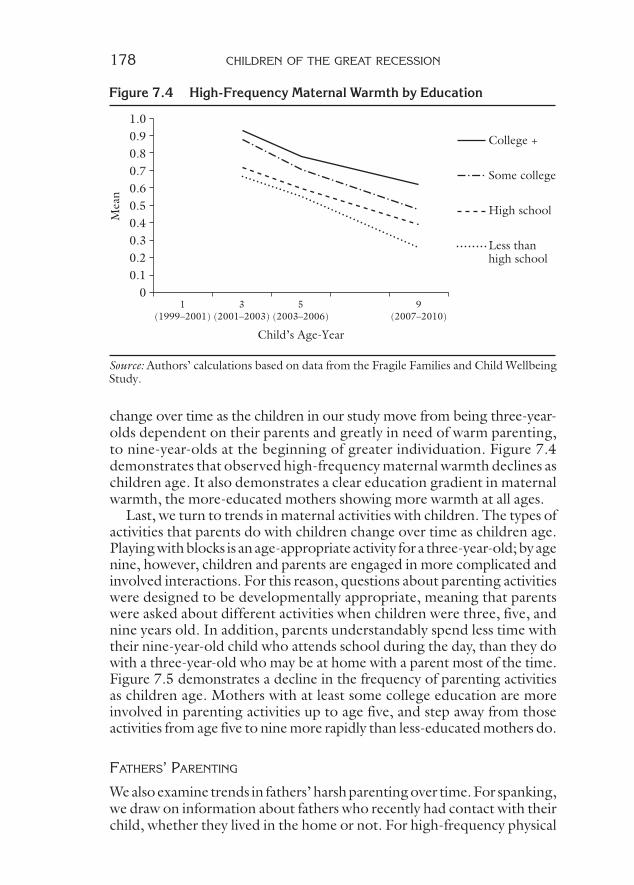
change over time as the children in our study move from being three-year-olds dependent on their parents and greatly in need of warm parenting, to nine-year-olds at the beginning of greater individuation. Figure 7.4 demonstrates that observed high-frequency maternal warmth declines as children age. It also demonstrates a clear education gradient in maternal warmth, the more-educated mothers showing more warmth at all ages.
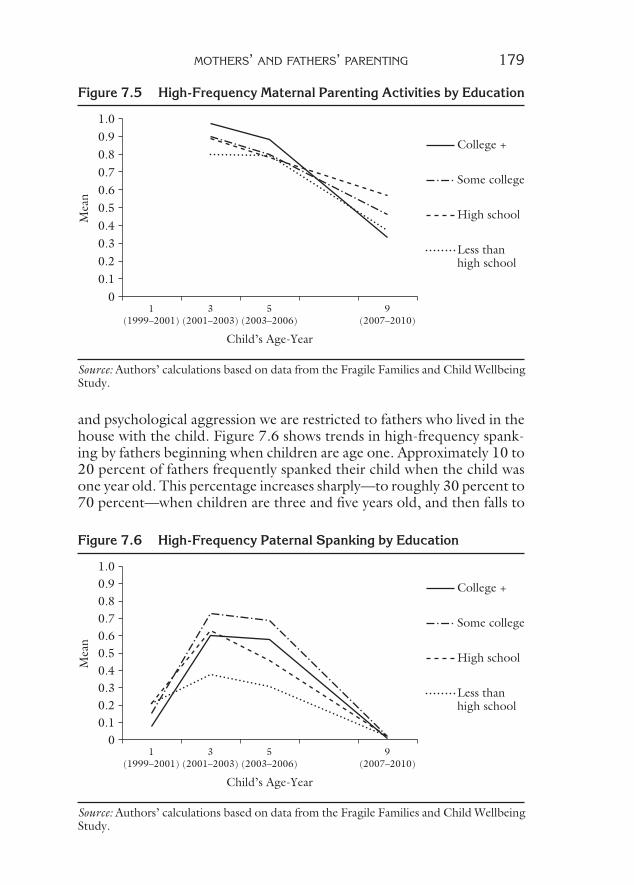
Last, we turn to trends in maternal activities with children. The types of activities that parents do with children change over time as children age. Playing with blocks is an age-appropriate activity for a three-year-old; by age nine, however, children and parents are engaged in more complicated and involved interactions. For this reason, questions about parenting activities were designed to be developmentally appropriate, meaning that parents were asked about different activities when children were three, five, and nine years old. In addition, parents understandably spend less time with their nine-year-old child who attends school during the day, than they do with a three-year-old who may be at home with a parent most of the time. Figure 7.5 demonstrates a decline in the frequency of parenting activities as children age. Mothers with at least some college education are more involved in parenting activities up to age five, and step away from those activities from age five to nine more rapidly than less-educated mothers do.
fathers’ parenting
We also examine trends in fathers’ harsh parenting over time. For spanking, we draw on information about fathers who recently had contact with their child, whether they lived in the home or not. For high-frequency physical
College +
Some college
High school
Less than high school
00.10.20.30.40.50.60.70.80.91.0
Mea
n
1(1999–2001)
3(2001–2003)
5(2003–2006)
9(2007–2010)
Child’s Age-Year
Source: Authors’ calculations based on data from the Fragile Families and Child Wellbeing Study.
Figure 7.4 High-Frequency Maternal Warmth by Education
mothers’ and fathers’ parenting 179
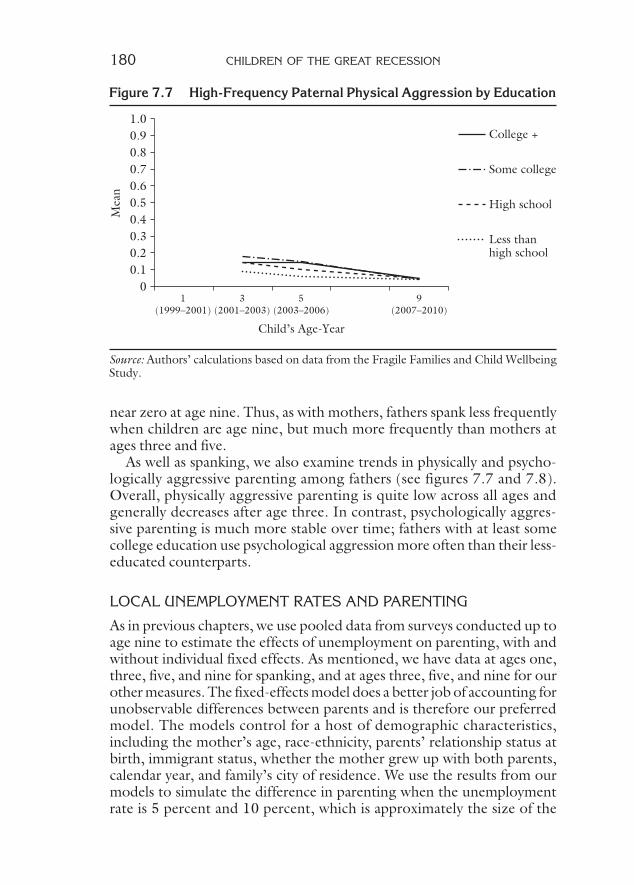
and psychological aggression we are restricted to fathers who lived in the house with the child. Figure 7.6 shows trends in high-frequency spank-ing by fathers beginning when children are age one. Approximately 10 to 20 percent of fathers frequently spanked their child when the child was one year old. This percentage increases sharply—to roughly 30 percent to 70 percent—when children are three and five years old, and then falls to
Source: Authors’ calculations based on data from the Fragile Families and Child Wellbeing Study.
College +
Some college
High school
Less than high school
00.10.20.30.40.50.60.70.80.91.0
Mea
n
1(1999–2001)
3(2001–2003)
5(2003–2006)
9(2007–2010)
Child’s Age-Year
Figure 7.5 High-Frequency Maternal Parenting Activities by Education
Source: Authors’ calculations based on data from the Fragile Families and Child Wellbeing Study.
College +
Some college
High school
Less than high school
00.10.20.30.40.50.60.70.80.91.0
Mea
n
1(1999–2001)
3(2001–2003)
5(2003–2006)
9(2007–2010)
Child’s Age-Year
Figure 7.6 High-Frequency Paternal Spanking by Education
180 children of the great recession
near zero at age nine. Thus, as with mothers, fathers spank less frequently when children are age nine, but much more frequently than mothers at ages three and five.
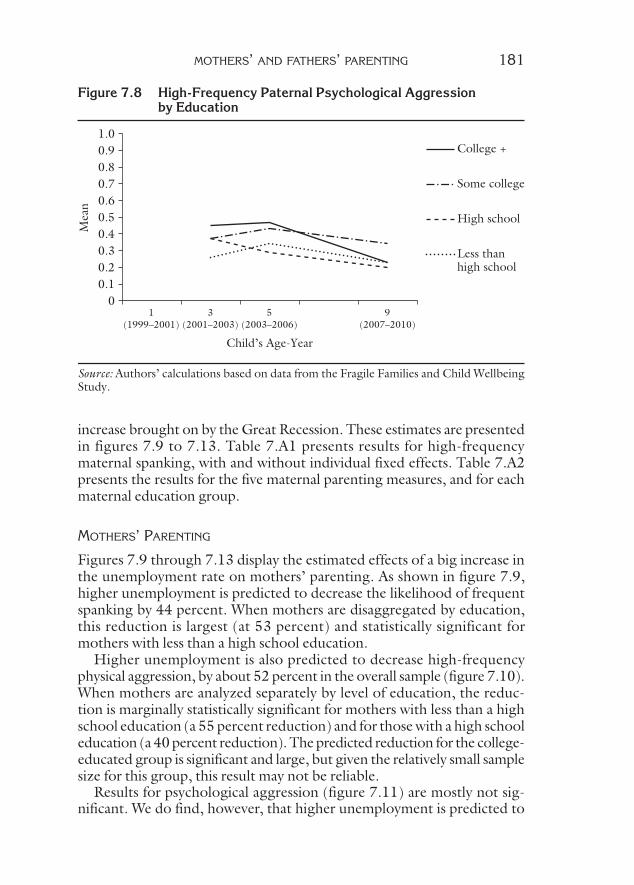
As well as spanking, we also examine trends in physically and psycho-logically aggressive parenting among fathers (see figures 7.7 and 7.8). Overall, physically aggressive parenting is quite low across all ages and generally decreases after age three. In contrast, psychologically aggres-sive parenting is much more stable over time; fathers with at least some college education use psychological aggression more often than their less-educated counterparts.
LOCAL UNEMPLOYMENT RATES AND PARENTING
As in previous chapters, we use pooled data from surveys conducted up to age nine to estimate the effects of unemployment on parenting, with and without individual fixed effects. As mentioned, we have data at ages one, three, five, and nine for spanking, and at ages three, five, and nine for our other measures. The fixed-effects model does a better job of accounting for unobservable differences between parents and is therefore our preferred model. The models control for a host of demographic characteristics, including the mother’s age, race-ethnicity, parents’ relationship status at birth, immigrant status, whether the mother grew up with both parents, calendar year, and family’s city of residence. We use the results from our models to simulate the difference in parenting when the unemployment rate is 5 percent and 10 percent, which is approximately the size of the
Source: Authors’ calculations based on data from the Fragile Families and Child Wellbeing Study.
College +
Some college
High school
Less than high school
00.10.20.30.40.50.60.70.80.91.0
Mea
n
1(1999–2001)
3(2001–2003)
5(2003–2006)
9(2007–2010)
Child’s Age-Year
Figure 7.7 High-Frequency Paternal Physical Aggression by Education
mothers’ and fathers’ parenting 181
College +
Some college
High school
Less than high school
00.10.20.30.40.50.60.70.80.91.0
Mea
n
1(1999–2001)
3(2001–2003)
5(2003–2006)
9(2007–2010)
Child’s Age-Year
Source: Authors’ calculations based on data from the Fragile Families and Child Wellbeing Study.
Figure 7.8 High-Frequency Paternal Psychological Aggression by Education
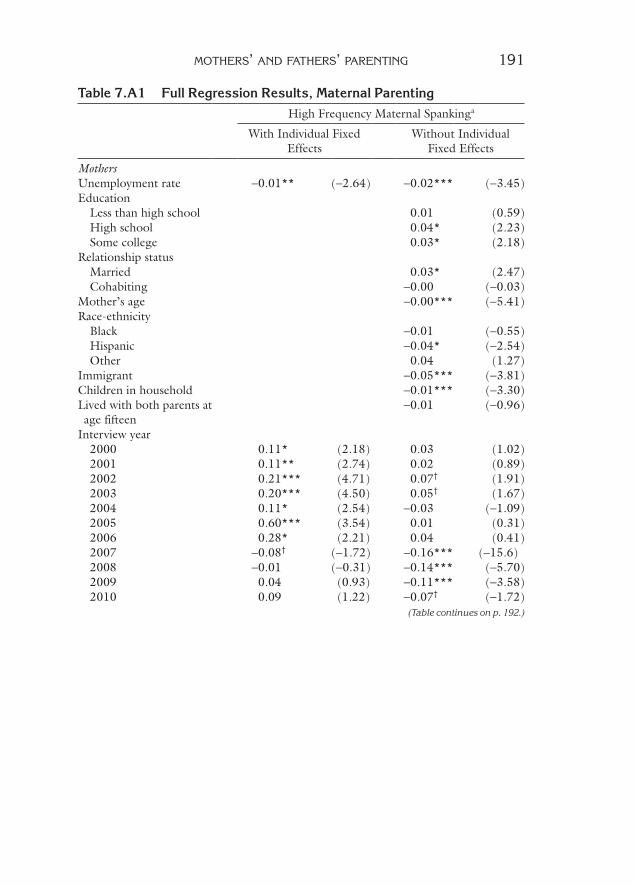
increase brought on by the Great Recession. These estimates are presented in figures 7.9 to 7.13. Table 7.A1 presents results for high-frequency maternal spanking, with and without individual fixed effects. Table 7.A2 presents the results for the five maternal parenting measures, and for each maternal education group.
mothers’ parenting
Figures 7.9 through 7.13 display the estimated effects of a big increase in the unemployment rate on mothers’ parenting. As shown in figure 7.9, higher unemployment is predicted to decrease the likelihood of frequent spanking by 44 percent. When mothers are disaggregated by education, this reduction is largest (at 53 percent) and statistically significant for mothers with less than a high school education.
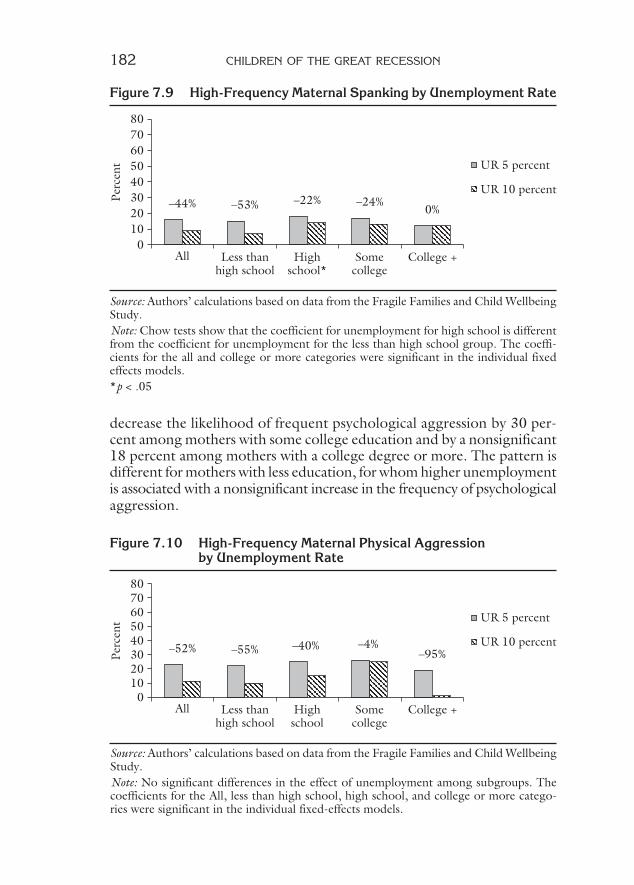
Higher unemployment is also predicted to decrease high-frequency physical aggression, by about 52 percent in the overall sample (figure 7.10). When mothers are analyzed separately by level of education, the reduc-tion is marginally statistically significant for mothers with less than a high school education (a 55 percent reduction) and for those with a high school education (a 40 percent reduction). The predicted reduction for the college- educated group is significant and large, but given the relatively small sample size for this group, this result may not be reliable.
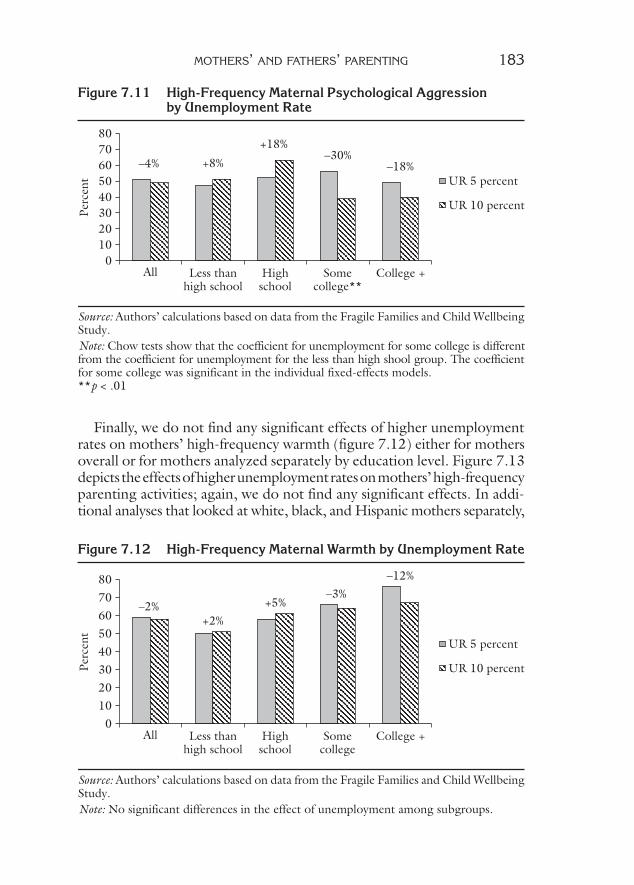
Results for psychological aggression (figure 7.11) are mostly not sig-nificant. We do find, however, that higher unemployment is predicted to
182 children of the great recession
–52% –55% –40% –4% –95%
All Less thanhigh school
Highschool
Somecollege
College +0
1020304050607080
Perc
ent UR 5 percent
UR 10 percent
Source: Authors’ calculations based on data from the Fragile Families and Child Wellbeing Study.Note: No significant differences in the effect of unemployment among subgroups. The coefficients for the All, less than high school, high school, and college or more catego- ries were significant in the individual fixed-effects models.
Figure 7.10 High-Frequency Maternal Physical Aggression by Unemployment Rate
–53% –22% –24%0%–44%
All Less thanhigh school
Highschool*
Somecollege
College +0
1020304050607080
Perc
ent UR 5 percent
UR 10 percent
Source: Authors’ calculations based on data from the Fragile Families and Child Wellbeing Study.Note: Chow tests show that the coefficient for unemployment for high school is different from the coefficient for unemployment for the less than high school group. The coeffi-cients for the all and college or more categories were significant in the individual fixed effects models.*p < .05
Figure 7.9 High-Frequency Maternal Spanking by Unemployment Rate
decrease the likelihood of frequent psychological aggression by 30 per-cent among mothers with some college education and by a nonsignificant 18 percent among mothers with a college degree or more. The pattern is different for mothers with less education, for whom higher unemployment is associated with a nonsignificant increase in the frequency of psychological aggression.
mothers’ and fathers’ parenting 183
Figure 7.11 High-Frequency Maternal Psychological Aggression by Unemployment Rate
–4% +8%
+18% –30%
–18%
All Less thanhigh school
Highschool
Somecollege**
College +0
1020304050607080
Perc
ent UR 5 percent
UR 10 percent
Source: Authors’ calculations based on data from the Fragile Families and Child Wellbeing Study.Note: Chow tests show that the coefficient for unemployment for some college is different from the coefficient for unemployment for the less than high shool group. The coefficient for some college was significant in the individual fixed-effects models.**p < .01
Figure 7.12 High-Frequency Maternal Warmth by Unemployment Rate
Source: Authors’ calculations based on data from the Fragile Families and Child Wellbeing Study.Note: No significant differences in the effect of unemployment among subgroups.
–2% +2%
+5%–3%
–12%
All Less thanhigh school
Highschool
Somecollege
College +0
1020304050607080
Perc
ent
UR 5 percent
UR 10 percent
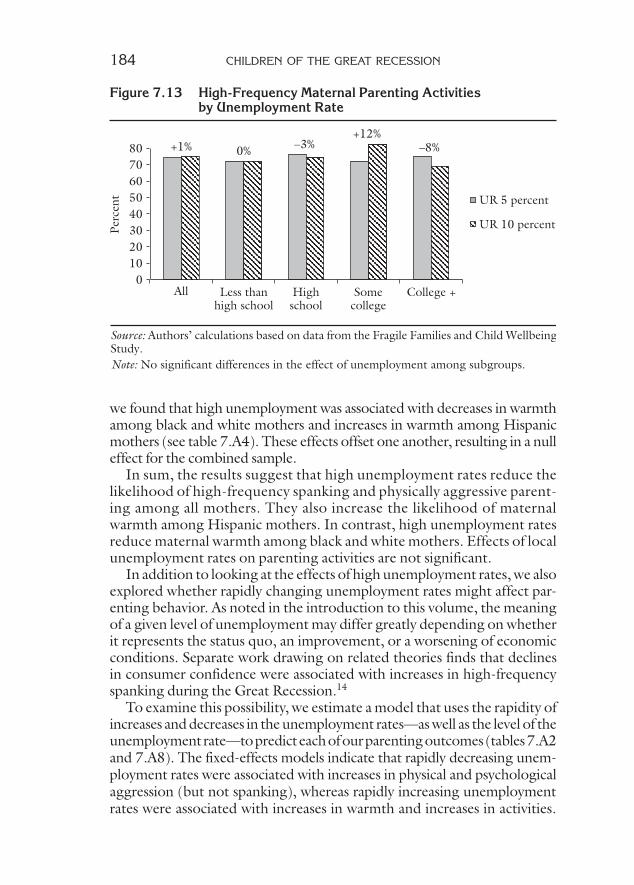
Finally, we do not find any significant effects of higher unemployment rates on mothers’ high-frequency warmth (figure 7.12) either for mothers overall or for mothers analyzed separately by education level. Figure 7.13 depicts the effects of higher unemployment rates on mothers’ high-frequency parenting activities; again, we do not find any significant effects. In addi-tional analyses that looked at white, black, and Hispanic mothers separately,
184 children of the great recession
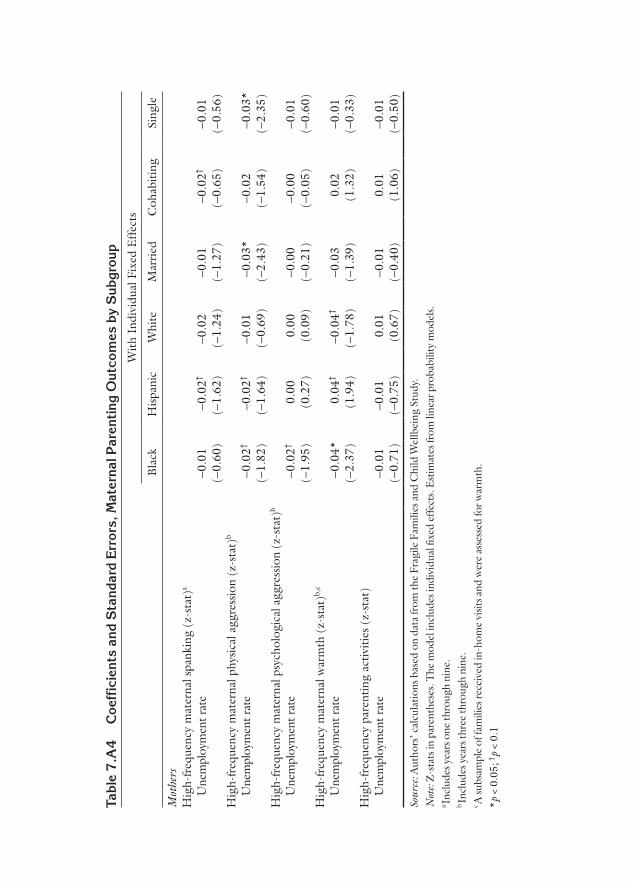
we found that high unemployment was associated with decreases in warmth among black and white mothers and increases in warmth among Hispanic mothers (see table 7.A4). These effects offset one another, resulting in a null effect for the combined sample.
In sum, the results suggest that high unemployment rates reduce the likelihood of high-frequency spanking and physically aggressive parent-ing among all mothers. They also increase the likelihood of maternal warmth among Hispanic mothers. In contrast, high unemployment rates reduce maternal warmth among black and white mothers. Effects of local un employment rates on parenting activities are not significant.
In addition to looking at the effects of high unemployment rates, we also explored whether rapidly changing unemployment rates might affect par-enting behavior. As noted in the introduction to this volume, the meaning of a given level of unemployment may differ greatly depending on whether it represents the status quo, an improvement, or a worsening of economic conditions. Separate work drawing on related theories finds that declines in consumer confidence were associated with increases in high-frequency spanking during the Great Recession.14
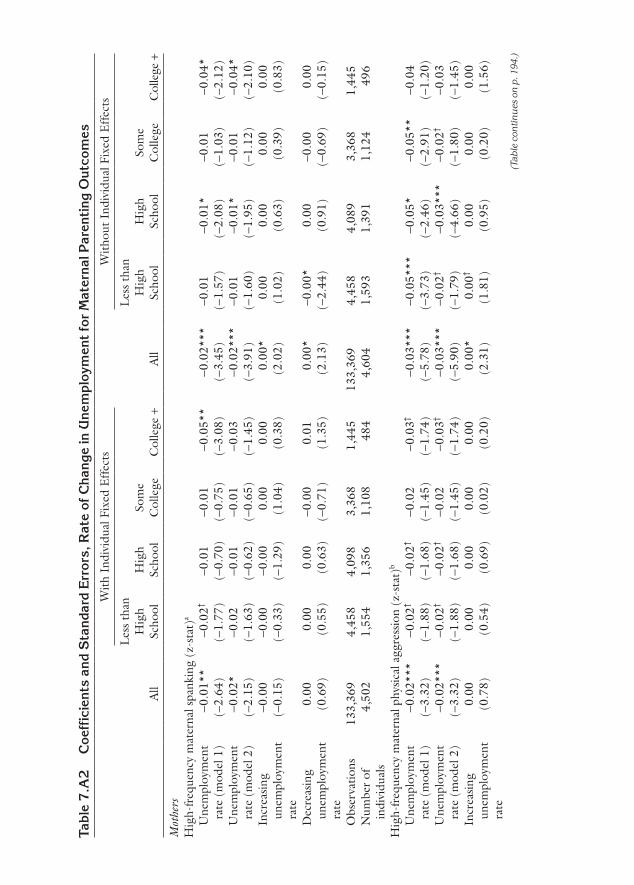
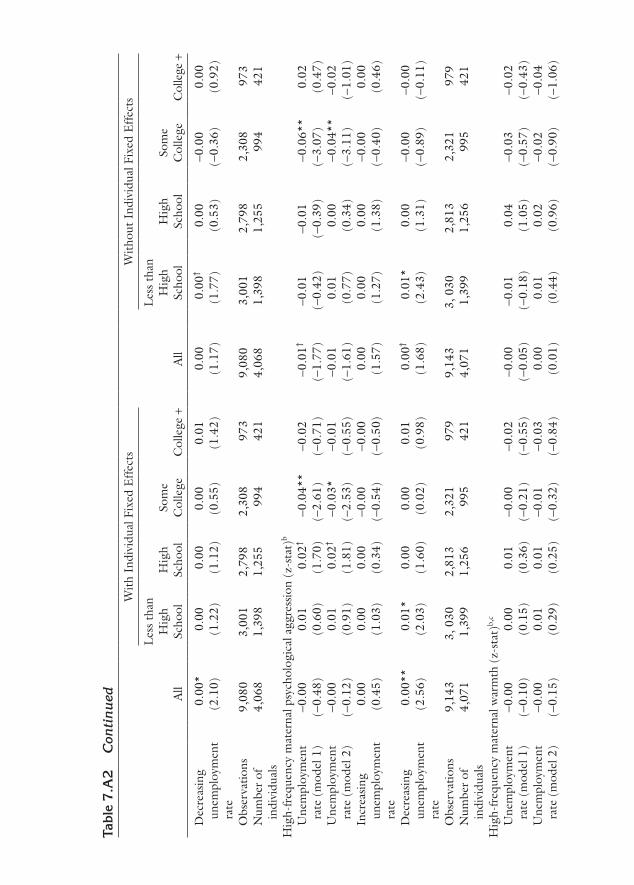
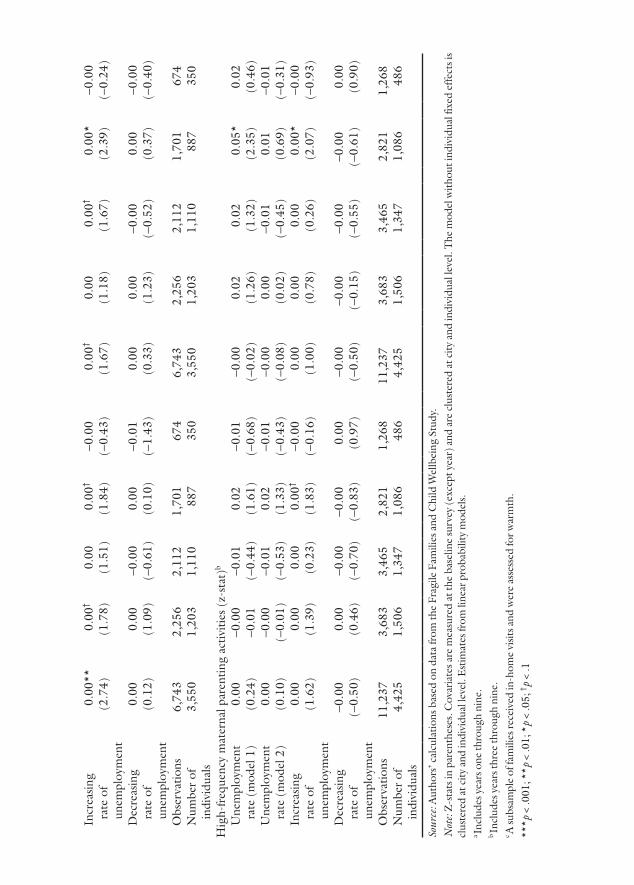
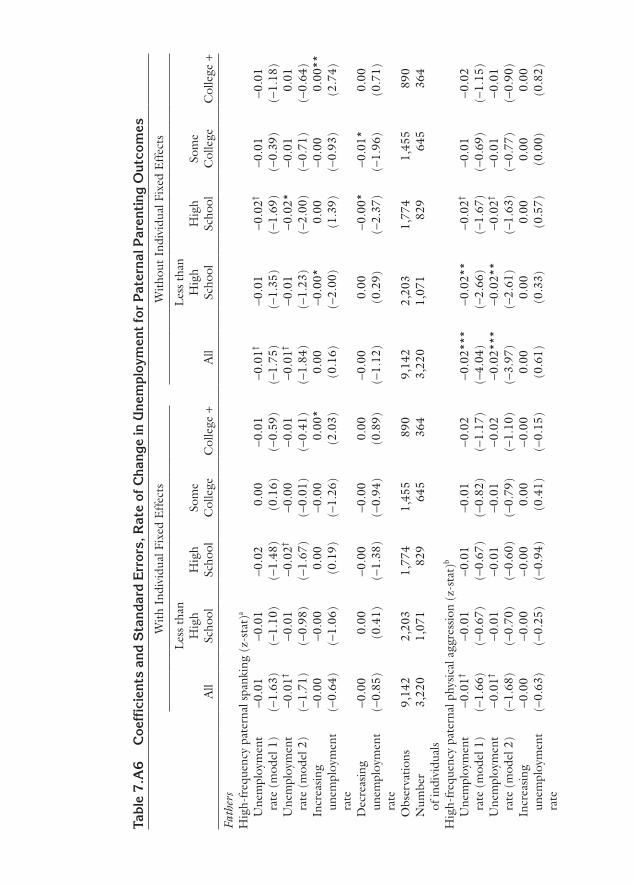
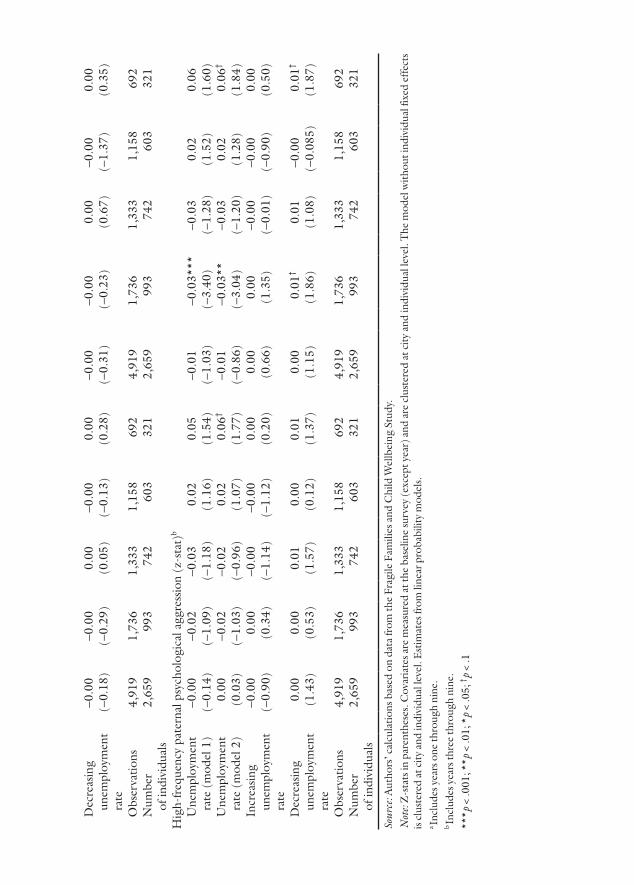
To examine this possibility, we estimate a model that uses the rapidity of increases and decreases in the unemployment rates—as well as the level of the unemployment rate—to predict each of our parenting outcomes (tables 7.A2 and 7.A8). The fixed-effects models indicate that rapidly decreasing unem-ployment rates were associated with increases in physical and psychological aggression (but not spanking), whereas rapidly increasing unemployment rates were associated with increases in warmth and increases in activities.
Figure 7.13 High-Frequency Maternal Parenting Activities by Unemployment Rate
+1% 0% –3% +12%
–8%
All Less thanhigh school
Highschool
Somecollege
College +0
1020304050607080
Perc
ent UR 5 percent
UR 10 percent
Source: Authors’ calculations based on data from the Fragile Families and Child Wellbeing Study.Note: No significant differences in the effect of unemployment among subgroups.
mothers’ and fathers’ parenting 185
The results for rapidly increasing unemployment rates are very sensitive to model specification, however. When we estimate odds ratios rather than a linear probability model, we find a positive relationship between rapidly increasing unemployment and physical aggression. These positive associa-tions between rapidly increasing unemployment and harsh parenting are consistent with our previous results for consumer confidence.
fathers’ parenting
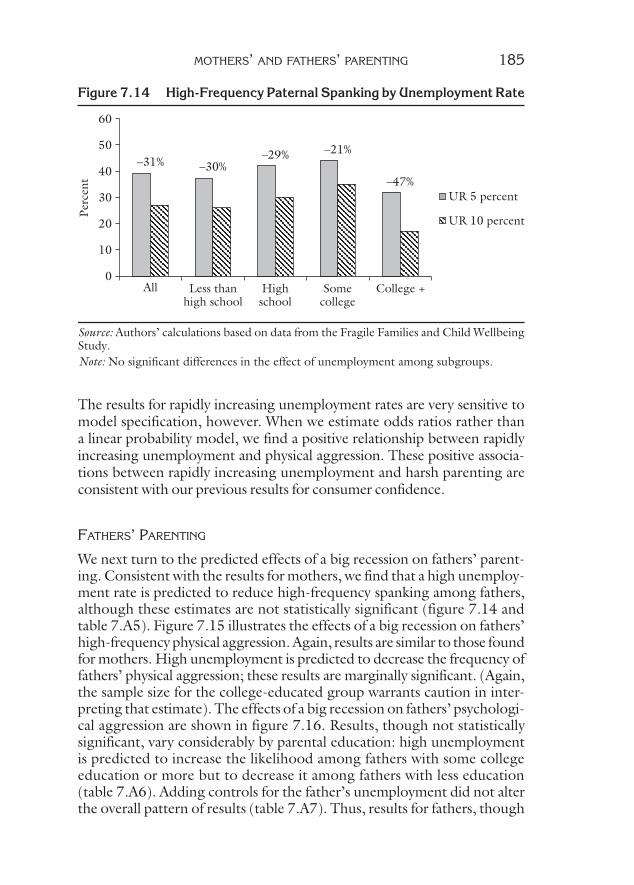
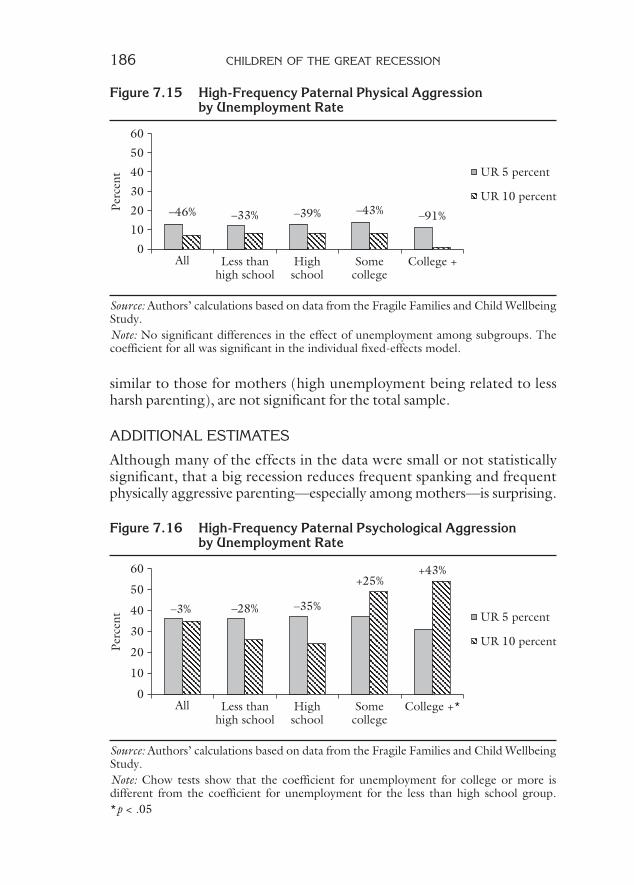
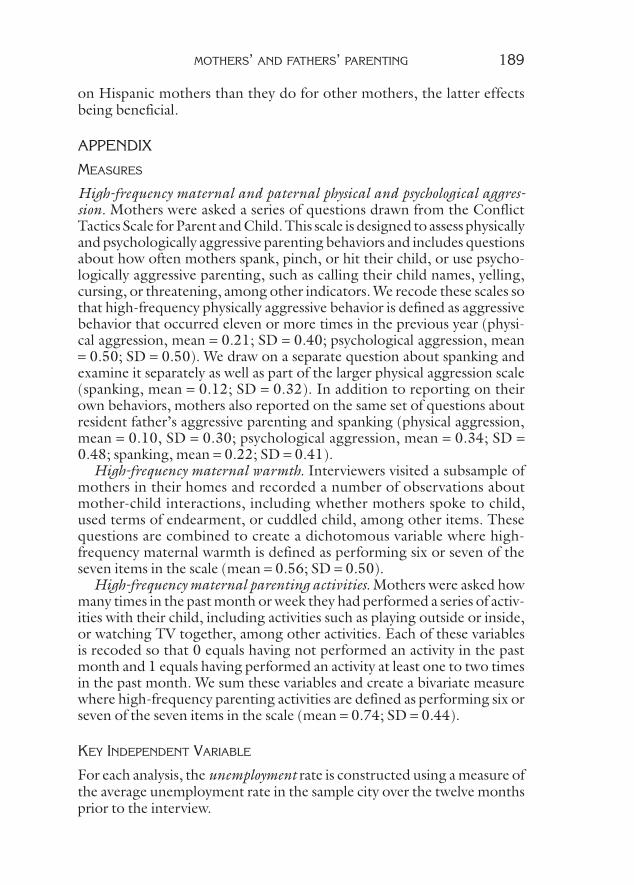
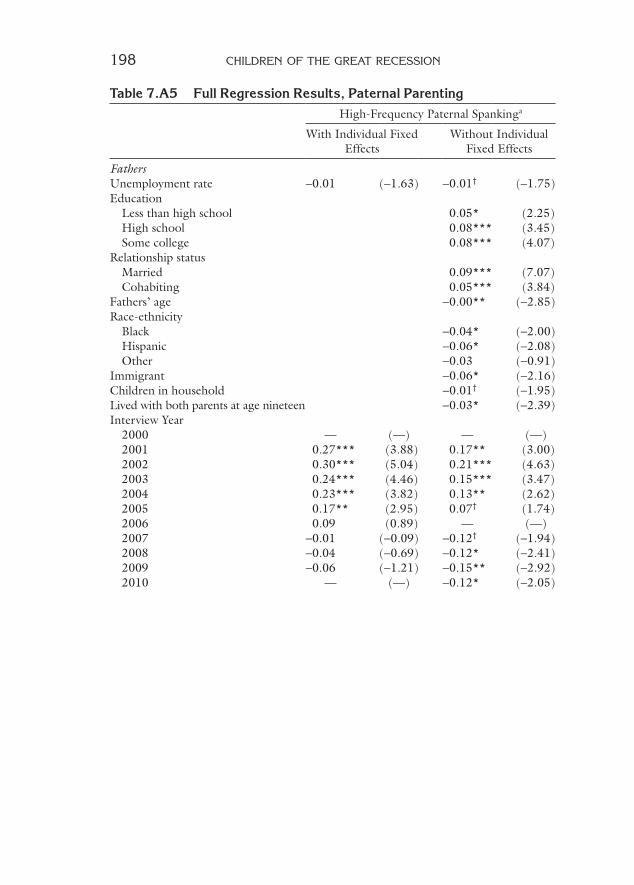
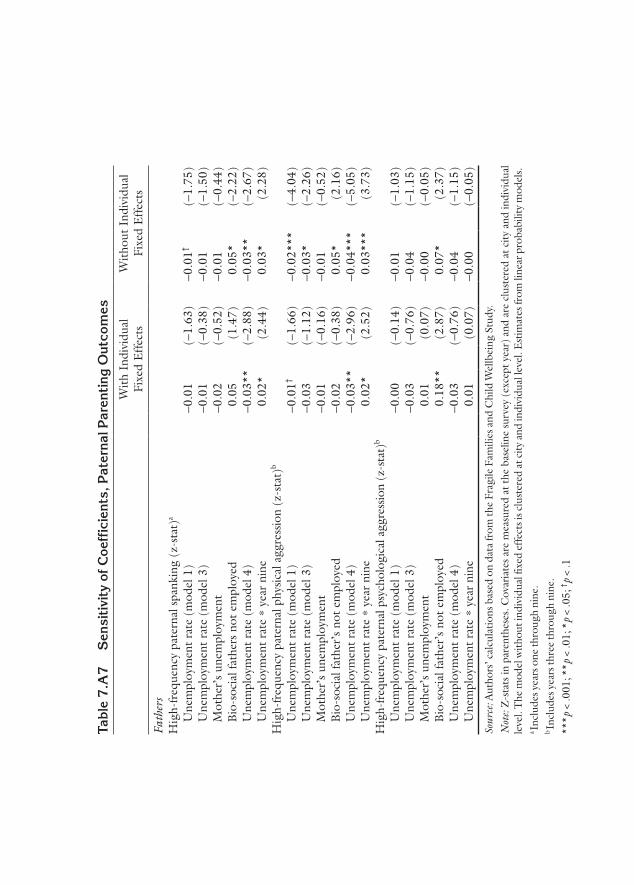
We next turn to the predicted effects of a big recession on fathers’ parent-ing. Consistent with the results for mothers, we find that a high unemploy-ment rate is predicted to reduce high-frequency spanking among fathers, although these estimates are not statistically significant (figure 7.14 and table 7.A5). Figure 7.15 illustrates the effects of a big recession on fathers’ high-frequency physical aggression. Again, results are similar to those found for mothers. High unemployment is predicted to decrease the frequency of fathers’ physical aggression; these results are marginally significant. (Again, the sample size for the college-educated group warrants caution in inter-preting that estimate). The effects of a big recession on fathers’ psychologi-cal aggression are shown in figure 7.16. Results, though not statistically significant, vary considerably by parental education: high unemployment is predicted to increase the likelihood among fathers with some college education or more but to decrease it among fathers with less education (table 7.A6). Adding controls for the father’s unemployment did not alter the overall pattern of results (table 7.A7). Thus, results for fathers, though
–29% –21%–31% –30%
–47%
All Less thanhigh school
Highschool
Somecollege
College +0
10
20
30
40
50
60
Perc
ent
UR 5 percent
UR 10 percent
Source: Authors’ calculations based on data from the Fragile Families and Child Wellbeing Study.Note: No significant differences in the effect of unemployment among subgroups.
Figure 7.14 High-Frequency Paternal Spanking by Unemployment Rate
186 children of the great recession
similar to those for mothers (high unemployment being related to less harsh parenting), are not significant for the total sample.
ADDITIONAL ESTIMATES
Although many of the effects in the data were small or not statistically significant, that a big recession reduces frequent spanking and frequent physically aggressive parenting—especially among mothers—is surprising.
–46% –33% –39% –43% –91%
All Less thanhigh school
Highschool
Somecollege
College +0
10
20
30
40
50
60
Perc
ent UR 5 percent
UR 10 percent
Source: Authors’ calculations based on data from the Fragile Families and Child Wellbeing Study.Note: No significant differences in the effect of unemployment among subgroups. Thecoefficient for all was significant in the individual fixed-effects model.
Figure 7.15 High-Frequency Paternal Physical Aggression by Unemployment Rate
–3% –28% –35%
+25%+43%
All Less thanhigh school
Highschool
Somecollege
College +*0
10
20
30
40
50
60
Perc
ent UR 5 percent
UR 10 percent
Source: Authors’ calculations based on data from the Fragile Families and Child Wellbeing Study.Note: Chow tests show that the coefficient for unemployment for college or more is different from the coefficient for unemployment for the less than high school group.*p < .05
Figure 7.16 High-Frequency Paternal Psychological Aggression by Unemployment Rate

mothers’ and fathers’ parenting 187
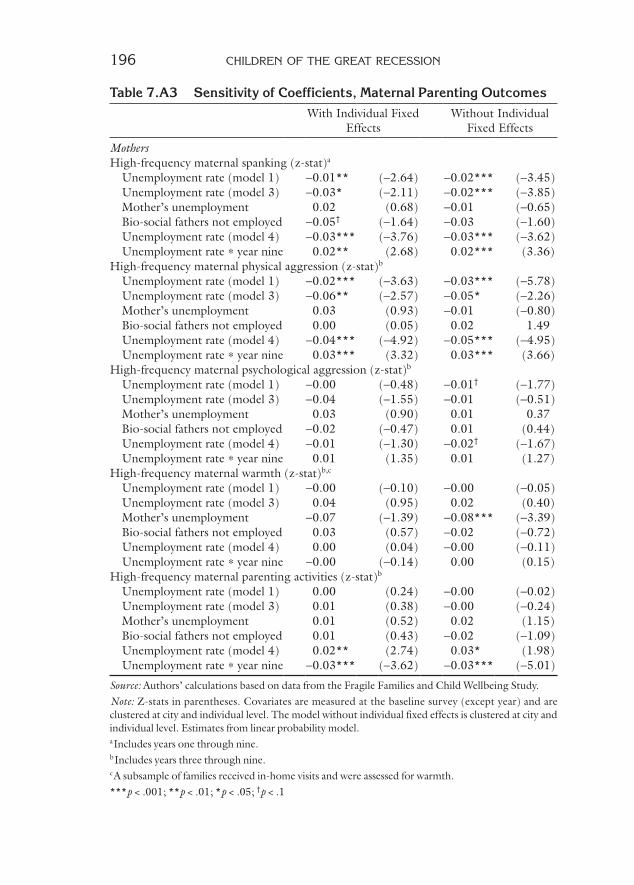
We therefore carry out several further sets of estimates for parenting out-comes. First we estimate models that controlled for parents’ unemploy-ment (tables 7.A3 and 7.A7). The estimates from these models do not change the basic story.
Next, we estimate models that include an interaction term that allows the effect of unemployment rates to vary by whether the data were drawn from the year nine survey, which for most families was in the midst of the Great Recession. Our rationale for these analyses is that by pooling the data over several years, we may have missed effects that were specific to the Great Recession. The results based on these models (tables 7.A3 and 7.A7) suggest that in fact, the effects of the unemployment rate on parenting did vary depending on whether the family was interviewed in year nine. Among mothers, we find that the associations between high unemploy-ment rates and less frequent spanking and less frequent physical aggres-sion were weaker during the Great Recession, though still in the same direction. The pattern is similar for fathers.
These results suggest that the effects of a high unemployment rate may well differ depending on the state of the overall economy or on the age of the child. Overall, a higher local unemployment rate is—surprisingly—associated with less harsh parenting by both mothers and fathers. However, this reduction is much smaller during the year nine interviews. Because these interviews were taken at the height of the Great Recession, it may be that unemployment rates have a different effect when the overall econ-omy is poor (and when unemployment rates are very high). It may also be, however, that the effects of the unemployment rate differ when children are older. As noted earlier, harsh parenting becomes less frequent when children are age nine; so perhaps then, parenting can be tipped toward greater harshness by an external factor such as high unemployment rates. Given the design of our data, it is difficult to distinguish between those two interpretations for the patterns at year nine. To further explore this puzzle, we run our models again separately for children of different ages and find that effects of high unemployment do seem to differ by child age, the strongest effects occurring at age three.
Finally, to better understand the patterns in the data, we reestimate all our models, stratifying our sample by the mothers’ race-ethnicity and mari-tal status. We focus on the former models here, because results from these models point to considerable heterogeneity. (Full results for both sets of models are in tables 7.A4 and 7.A8). First, looking at spanking, only the coefficient for Hispanics is significant, though the direction of the signs are similar for the other two ethnic groups. Both Hispanic and black mothers show a similar pattern for frequent physical aggression, but only black mothers have a significant negative coefficient for psychological aggres-sion. The most cautious interpretation is that black and Hispanic mothers may be more aggressive toward their children when the unemployment

188 children of the great recession
rate is lower. No evidence was seen for white mothers for either measure of aggression. Second, for high-frequency maternal warmth, the signs are different for Hispanic than for white and black mothers (all three coef-ficients at p < 0.10). Hispanic mothers are more likely to exhibit frequent warmth when local unemployment rates are high, and black and white mothers are less likely to do so. Although these effects are only marginally significant, they do point to a distinctive pattern for Hispanic mothers.
Why might higher unemployment rates be linked with more posi-tive changes in parenting among Hispanic mothers? Two possible inter-pretations come to mind. One is that maternal employment may be more stressful in Hispanic families, and thus reductions in employment associ-ated with higher unemployment rates might actually lead to improved parenting. If this is the case, then controlling for the mothers’ unemploy-ment should reduce the estimated effect of the local unemployment rate on her parenting. However, in additional models in which we add such controls, this is not the case. A second possibility is that when unemploy-ment rates are higher, the most stressed Hispanic mothers are likely to leave the sample (perhaps because they return to their countries of ori-gin), and thus the improved parenting reflects the select nature of the sample for Hispanics at age nine. Some evidence for this conjecture is in fact seen in our data; the attrition rate between age five and nine is higher for Hispanic mothers (17 percent) than for white and black mothers (13 percent each).
CONCLUSION
Overall, our results challenge some conventional wisdom about the effects of a big increase in unemployment rates on parenting. Previous research might suggest that a big recession would lead to harsher parenting. Our results suggest that overall, when unemployment rates are higher, both mothers and fathers are less likely to engage in very frequent spanking or physically aggressive parenting. At the same time, the evidence supports the thesis that when rates of unemployment increase or decrease rapidly, maternal parenting behavior is affected. When rates drop rapidly, physical and psychological aggression are higher. When rates increase rapidly, harsh parenting, warmth, and physical activities with the child increase. These trends are seen when maternal and paternal unemployment are controlled and, save for harsh parenting and rapidly increasing unemployment, are seen in both the models with and without fixed effects. What is intriguing is that these trends are seen for rapidly changing employment rates, sug-gesting that uncertainty in general might influence maternal aggression toward the child as well as other parenting behaviors.
Our results also point to some intriguing variation by race-ethnicity, though again we are unable to draw firm conclusions as to why. Clearly, however, higher local unemployment rates seem to have a different effect
mothers’ and fathers’ parenting 189
on Hispanic mothers than they do for other mothers, the latter effects being beneficial.
APPENDIX
measures
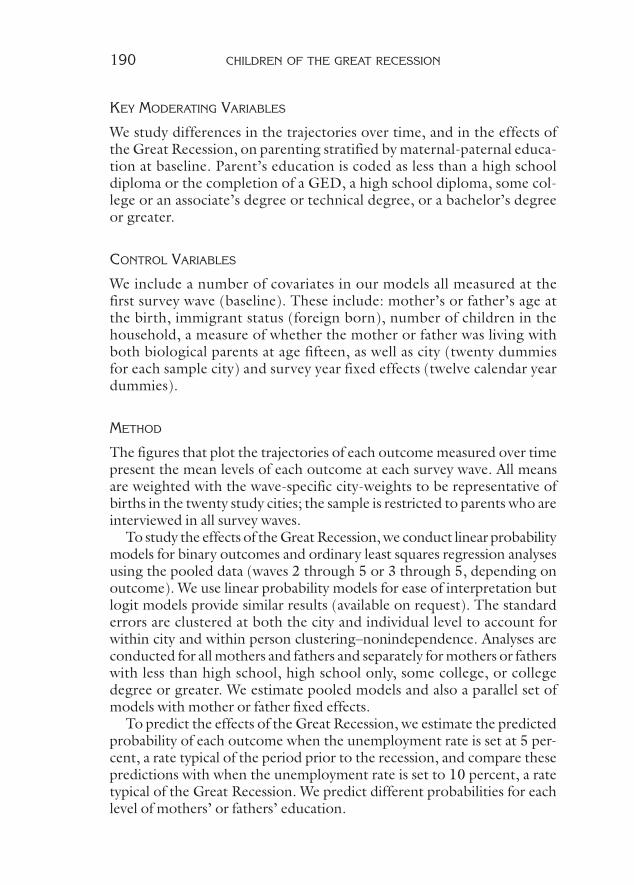
High-frequency maternal and paternal physical and psychological aggres-sion. Mothers were asked a series of questions drawn from the Conflict Tactics Scale for Parent and Child. This scale is designed to assess physically and psychologically aggressive parenting behaviors and includes questions about how often mothers spank, pinch, or hit their child, or use psycho-logically aggressive parenting, such as calling their child names, yelling, cursing, or threatening, among other indicators. We recode these scales so that high-frequency physically aggressive behavior is defined as aggressive behavior that occurred eleven or more times in the previous year (physi-cal aggression, mean = 0.21; SD = 0.40; psychological aggression, mean = 0.50; SD = 0.50). We draw on a separate question about spanking and examine it separately as well as part of the larger physical aggression scale (spanking, mean = 0.12; SD = 0.32). In addition to reporting on their own behaviors, mothers also reported on the same set of questions about resident father’s aggressive parenting and spanking (physical aggression, mean = 0.10, SD = 0.30; psychological aggression, mean = 0.34; SD = 0.48; spanking, mean = 0.22; SD = 0.41).
High-frequency maternal warmth. Interviewers visited a subsample of mothers in their homes and recorded a number of observations about mother-child interactions, including whether mothers spoke to child, used terms of endearment, or cuddled child, among other items. These questions are combined to create a dichotomous variable where high-frequency maternal warmth is defined as performing six or seven of the seven items in the scale (mean = 0.56; SD = 0.50).
High-frequency maternal parenting activities. Mothers were asked how many times in the past month or week they had performed a series of activ-ities with their child, including activities such as playing outside or inside, or watching TV together, among other activities. Each of these variables is recoded so that 0 equals having not performed an activity in the past month and 1 equals having performed an activity at least one to two times in the past month. We sum these variables and create a bivariate measure where high-frequency parenting activities are defined as performing six or seven of the seven items in the scale (mean = 0.74; SD = 0.44).
Key independent Variable
For each analysis, the unemployment rate is constructed using a measure of the average unemployment rate in the sample city over the twelve months prior to the interview.
190 children of the great recession
Key moderating Variables
We study differences in the trajectories over time, and in the effects of the Great Recession, on parenting stratified by maternal-paternal educa-tion at baseline. Parent’s education is coded as less than a high school diploma or the completion of a GED, a high school diploma, some col-lege or an associate’s degree or technical degree, or a bachelor’s degree or greater.
control Variables
We include a number of covariates in our models all measured at the first survey wave (baseline). These include: mother’s or father’s age at the birth, immigrant status (foreign born), number of children in the household, a measure of whether the mother or father was living with both biological parents at age fifteen, as well as city (twenty dummies for each sample city) and survey year fixed effects (twelve calendar year dummies).
method
The figures that plot the trajectories of each outcome measured over time present the mean levels of each outcome at each survey wave. All means are weighted with the wave-specific city-weights to be representative of births in the twenty study cities; the sample is restricted to parents who are interviewed in all survey waves.
To study the effects of the Great Recession, we conduct linear probability models for binary outcomes and ordinary least squares regression analyses using the pooled data (waves 2 through 5 or 3 through 5, depending on outcome). We use linear probability models for ease of interpretation but logit models provide similar results (available on request). The standard errors are clustered at both the city and individual level to account for within city and within person clustering–nonindependence. Analyses are conducted for all mothers and fathers and separately for mothers or fathers with less than high school, high school only, some college, or college degree or greater. We estimate pooled models and also a parallel set of models with mother or father fixed effects.
To predict the effects of the Great Recession, we estimate the predicted probability of each outcome when the unemployment rate is set at 5 per-cent, a rate typical of the period prior to the recession, and compare these predictions with when the unemployment rate is set to 10 percent, a rate typical of the Great Recession. We predict different probabilities for each level of mothers’ or fathers’ education.
mothers’ and fathers’ parenting 191
Table 7.A1 Full Regression Results, Maternal ParentingHigh Frequency Maternal Spankinga
With Individual Fixed Effects
Without Individual Fixed Effects
MothersUnemployment rate -0.01** (-2.64) -0.02*** (-3.45)Education Less than high school 0.01 (0.59) High school 0.04* (2.23) Some college 0.03* (2.18)Relationship status Married 0.03* (2.47) Cohabiting -0.00 (-0.03)Mother’s age -0.00*** (-5.41)Race-ethnicity Black -0.01 (-0.55) Hispanic -0.04* (-2.54) Other 0.04 (1.27)Immigrant -0.05*** (-3.81)Children in household -0.01*** (-3.30)Lived with both parents at age fifteen
-0.01 (-0.96)
Interview year 2000 0.11* (2.18) 0.03 (1.02) 2001 0.11** (2.74) 0.02 (0.89) 2002 0.21*** (4.71) 0.07† (1.91) 2003 0.20*** (4.50) 0.05† (1.67) 2004 0.11* (2.54) -0.03 (-1.09) 2005 0.60*** (3.54) 0.01 (0.31) 2006 0.28* (2.21) 0.04 (0.41) 2007 -0.08† (-1.72) -0.16*** (-15.6) 2008 -0.01 (-0.31) -0.14*** (-5.70) 2009 0.04 (0.93) -0.11*** (-3.58) 2010 0.09 (1.22) -0.07† (-1.72)
(Table continues on p. 192.)

192 children of the great recession
Table 7.A1 Continued
High Frequency Maternal Spankinga
With Individual Fixed Effects
Without Individual Fixed Effects
City Austin -0.02*** (-3.47) Baltimore -0.07*** (-4.32) Detroit 0.05** (2.86) Newark -0.03† (-1.67) Philadelphia -0.06** (-3.14) Richmond -0.01 (-0.74) Corpus Christi -0.02 (-1.51) Indianapolis 0.01 (0.60) Milwaukee -0.05*** (-3.34) New York -0.07*** (-4.86) San Jose -0.01 (-0.50) Boston -0.07*** (-4.80) Nashville 0.05*** (3.41) Chicago -0.01 (-0.39) Jacksonville -0.02 (-1.34) Toledo 0.00 (0.01) San Antonio -0.05** (-2.75) Pittsburgh -0.05** (-2.71) Norfolk -0.00 (-0.14)Constant 0.12** (2.66) 0.40*** (11.10)Observations 13,3369 13,369Number of individuals 4,502 4,604
Source: Authors’ calculations based on data from the Fragile Families and Child Wellbeing Study.Note: Z-stats in parentheses. Covariates are measured at the baseline survey (except year) and are clus-tered at city and individual level. Model 1 includes the level unemployment rate. The model without individual fixed effects is clustered at city and individual level.aIncludes years one through nine.***p < .001; **p < .01; *p < .05; †p < .1
(Tab
le c
onti
nu
es o
n p
. 194
.)
Tabl
e 7.A
2
Coe
ffic
ient
s an
d S
tand
ard
Err
ors,
Rat
e of
Cha
nge
in U
nem
ploy
men
t fo
r M
ater
nal P
aren
ting
Out
com
es
All
With
Ind
ivid
ual F
ixed
Eff
ects
All
With
out
Indi
vidu
al F
ixed
Eff
ects
Les
s th
an
Hig
h Sc
hool
Hig
h Sc
hool
Som
e C
olle
geC
olle
ge +
Les
s th
an
Hig
h Sc
hool
Hig
h Sc
hool
Som
e C
olle
geC
olle
ge +
Mot
hers
Hig
h-fr
eque
ncy
mat
erna
l spa
nkin
g (z
-sta
t)a
U
nem
ploy
men
t ra
te (
mod
el 1
)-0
.01*
*-0
.02†
-0.0
1-0
.01
-0.0
5**
-0.0
2***
-0.0
1-0
.01*
-0.0
1-0
.04*
(-2.
64)
(-1.
77)
(-0.
70)
(-0.
75)
(-3.
08)
(-3.
45)
(-1.
57)
(-2.
08)
(-1.
03)
(-2.
12)
U
nem
ploy
men
t ra
te (
mod
el 2
)-0
.02*
-0.0
2-0
.01
-0.0
1-0
.03
-0.0
2***
-0.0
1-0
.01*
-0.0
1-0
.04*
(-2.
15)
(-1.
63)
(-0.
62)
(-0.
65)
(-1.
45)
(-3.
91)
(-1.
60)
(-1.
95)
(-1.
12)
(-2.
10)
In
crea
sing
un
empl
oym
ent
rate
-0.0
0-0
.00
-0.0
00.
000.
000.
00*
0.00
0.00
0.00
0.00
(-0.
15)
(-0.
33)
(-1.
29)
(1.0
4)(0
.38)
(2.0
2)(1
.02)
(0.6
3)(0
.39)
(0.8
3)
D
ecre
asin
g un
empl
oym
ent
rate
0.00
0.00
0.00
-0.0
00.
010.
00*
-0.0
0*0.
00-0
.00
0.00
(0.6
9)(0
.55)
(0.6
3)(-
0.71
)(1
.35)
(2.1
3)(-
2.44
)(0
.91)
(-0.
69)
(-0.
15)
O
bser
vatio
ns13
3,36
94,
458
4,09
83,
368
1,44
513
3,36
94,
458
4,08
93,
368
1,44
5
Num
ber
of
indi
vidu
als
4,50
21,
554
1,35
61,
108
484
4,60
41,
593
1,39
11,
124
496
Hig
h-fr
eque
ncy
mat
erna
l phy
sica
l agg
ress
ion
(z-s
tat)
b
U
nem
ploy
men
t ra
te (
mod
el 1
)-0
.02*
**-0
.02†
-0.0
2†-0
.02
-0.0
3†-0
.03*
**-0
.05*
**-0
.05*
-0.0
5**
-0.0
4(-
3.32
)(-
1.88
)(-
1.68
)(-
1.45
)(-
1.74
)(-
5.78
)(-
3.73
)(-
2.46
)(-
2.91
)(-
1.20
)
Une
mpl
oym
ent
rate
(m
odel
2)
-0.0
2***
-0.0
2†-0
.02†
-0.0
2-0
.03†
-0.0
3***
-0.0
2†-0
.03*
**-0
.02†
-0.0
3(-
3.32
)(-
1.88
)(-
1.68
)(-
1.45
)(-
1.74
)(-
5.90
)(-
1.79
)(-
4.66
)(-
1.80
)(-
1.45
)
Incr
easi
ng
unem
ploy
men
t ra
te
0.00
0.00
0.00
0.00
0.00
0.00
*0.
00†
0.00
0.00
0.00
(0.7
8)(0
.54)
(0.6
9)(0
.02)
(0.2
0)(2
.31)
(1.8
1)(0
.95)
(0.2
0)(1
.56)
D
ecre
asin
g un
empl
oym
ent
rate
0.00
*0.
000.
000.
000.
010.
000.
00†
0.00
-0.0
00.
00(2
.10)
(1.2
2)(1
.12)
(0.5
5)(1
.42)
(1.1
7)(1
.77)
(0.5
3)(-
0.36
)(0
.92)
O
bser
vatio
ns9,
080
3,00
12,
798
2,30
897
39,
080
3,00
12,
798
2,30
897
3
Num
ber
of
indi
vidu
als
4,06
81,
398
1,25
599
442
14,
068
1,39
81,
255
994
421
Hig
h-fr
eque
ncy
mat
erna
l psy
chol
ogic
al a
ggre
ssio
n (z
-sta
t)b
U
nem
ploy
men
t ra
te (
mod
el 1
)-0
.00
0.01
0.02
†-0
.04*
*-0
.02
-0.0
1†-0
.01
-0.0
1-0
.06*
*0.
02(-
0.48
)(0
.60)
(1.7
0)(-
2.61
)(-
0.71
)(-
1.77
)(-
0.42
)(-
0.39
)(-
3.07
)(0
.47)
U
nem
ploy
men
t ra
te (
mod
el 2
)-0
.00
0.01
0.02
†-0
.03*
-0.0
1-0
.01
0.01
0.00
-0.0
4**
-0.0
2(-
0.12
)(0
.91)
(1.8
1)(-
2.53
)(-
0.55
)(-
1.61
)(0
.77)
(0.3
4)(-
3.11
)(-
1.01
)
Incr
easi
ng
unem
ploy
men
t ra
te
0.00
0.00
0.00
-0.0
0-0
.00
0.00
0.00
0.00
-0.0
00.
00(0
.45)
(1.0
3)(0
.34)
(-0.
54)
(-0.
50)
(1.5
7)(1
.27)
(1.3
8)(-
0.40
)(0
.46)
D
ecre
asin
g un
empl
oym
ent
rate
0.00
**0.
01*
0.00
0.00
0.01
0.00
†0.
01*
0.00
-0.0
0-0
.00
(2.5
6)(2
.03)
(1.6
0)(0
.02)
(0.9
8)(1
.68)
(2.4
3)(1
.31)
(-0.
89)
(-0.
11)
O
bser
vatio
ns9,
143
3, 0
302,
813
2,32
197
99,
143
3, 0
302,
813
2,32
197
9
Num
ber
of
indi
vidu
als
4,07
11,
399
1,25
699
542
14,
071
1,39
91,
256
995
421
Hig
h-fr
eque
ncy
mat
erna
l war
mth
(z-
stat
)b,c
U
nem
ploy
men
t ra
te (
mod
el 1
)-0
.00
0.00
0.01
-0.0
0-0
.02
-0.0
0-0
.01
0.04
-0.0
3-0
.02
(-0.
10)
(0.1
5)(0
.36)
(-0.
21)
(-0.
55)
(-0.
05)
(-0.
18)
(1.0
5)(-
0.57
)(-
0.43
)
Une
mpl
oym
ent
rate
(m
odel
2)
-0.0
00.
010.
01-0
.01
-0.0
30.
000.
010.
02-0
.02
-0.0
4(-
0.15
)(0
.29)
(0.2
5)(-
0.32
)(-
0.84
)(0
.01)
(0.4
4)(0
.96)
(-0.
90)
(-1.
06)
Tabl
e 7.A
2
Con
tin
ued A
ll
With
Ind
ivid
ual F
ixed
Eff
ects
All
With
out
Indi
vidu
al F
ixed
Eff
ects
Les
s th
an
Hig
h Sc
hool
Hig
h Sc
hool
Som
e C
olle
geC
olle
ge +
Les
s th
an
Hig
h Sc
hool
Hig
h Sc
hool
Som
e C
olle
geC
olle
ge +
In
crea
sing
ra
te o
f un
empl
oym
ent
0.00
**0.
00†
0.00
0.00
†-0
.00
0.00
†0.
000.
00†
0.00
*-0
.00
(2.7
4)(1
.78)
(1.5
1)(1
.84)
(-0.
43)
(1.6
7)(1
.18)
(1.6
7)(2
.39)
(-0.
24)
D
ecre
asin
g
rate
of
unem
ploy
men
t
0.00
0.00
-0.0
00.
00-0
.01
0.00
0.00
-0.0
00.
00-0
.00
(0.1
2)(1
.09)
(-0.
61)
(0.1
0)(-
1.43
)(0
.33)
(1.2
3)(-
0.52
)(0
.37)
(-0.
40)
O
bser
vatio
ns6,
743
2,25
62,
112
1,70
167
46,
743
2,25
62,
112
1,70
167
4
Num
ber
of
indi
vidu
als
3,55
01,
203
1,11
088
735
03,
550
1,20
31,
110
887
350
Hig
h-fr
eque
ncy
mat
erna
l par
entin
g ac
tiviti
es (
z-st
at)b
U
nem
ploy
men
t ra
te (
mod
el 1
)0.
00-0
.00
-0.0
10.
02-0
.01
-0.0
00.
020.
020.
05*
0.02
(0.2
4)-0
.01
(-0.
44)
(1.6
1)(-
0.68
)(-
0.02
)(1
.26)
(1.3
2)(2
.35)
(0.4
6)
Une
mpl
oym
ent
rate
(m
odel
2)
0.00
-0.0
0-0
.01
0.02
-0.0
1-0
.00
0.00
-0.0
10.
01-0
.01
(0.1
0)(-
0.01
)(-
0.53
)(1
.33)
(-0.
43)
(-0.
08)
(0.0
2)(-
0.45
)(0
.69)
(-0.
31)
In
crea
sing
ra
te o
f un
empl
oym
ent
0.00
0.00
0.00
0.00
†-0
.00
0.00
0.00
0.00
0.00
*-0
.00
(1.6
2)(1
.39)
(0.2
3)(1
.83)
(-0.
16)
(1.0
0)(0
.78)
(0.2
6)(2
.07)
(-0.
93)
D
ecre
asin
g
rate
of
unem
ploy
men
t
-0.0
00.
00-0
.00
-0.0
00.
00-0
.00
-0.0
0-0
.00
-0.0
00.
00(-
0.50
)(0
.46)
(-0.
70)
(-0.
83)
(0.9
7)(-
0.50
)(-
0.15
)(-
0.55
)(-
0.61
)(0
.90)
O
bser
vatio
ns11
,237
3,68
33,
465
2,82
11,
268
11,2
373,
683
3,46
52,
821
1,26
8
Num
ber
of
indi
vidu
als
4,42
51,
506
1,34
71,
086
486
4,42
51,
506
1,34
71,
086
486
Sour
ce: A
utho
rs’ c
alcu
latio
ns b
ased
on
data
from
the
Frag
ile F
amili
es a
nd C
hild
Wel
lbei
ng S
tudy
.N
ote:
Z-s
tats
in p
aren
thes
es. C
ovar
iate
s are
mea
sure
d at
the
base
line
surv
ey (e
xcep
t yea
r) a
nd a
re c
lust
ered
at c
ity a
nd in
divi
dual
leve
l. T
he m
odel
with
out i
ndiv
idua
l fix
ed e
ffec
ts is
cl
uste
red
at c
ity a
nd in
divi
dual
leve
l. E
stim
ates
from
line
ar p
roba
bilit
y m
odel
s.a I
nclu
des y
ears
one
thro
ugh
nine
.bIn
clud
es y
ears
thre
e th
roug
h ni
ne.
c A su
bsam
ple
of fa
mili
es re
ceiv
ed in
-hom
e vi
sits a
nd w
ere
asse
ssed
for w
arm
th.
***p
< .0
01; *
*p <
.01;
*p
< .0
5; † p
< .1
196 children of the great recession
Table 7.A3 Sensitivity of Coefficients, Maternal Parenting OutcomesWith Individual Fixed
EffectsWithout Individual
Fixed Effects
MothersHigh-frequency maternal spanking (z-stat)a
Unemployment rate (model 1) -0.01** (-2.64) -0.02*** (-3.45) Unemployment rate (model 3) -0.03* (-2.11) -0.02*** (-3.85) Mother’s unemployment 0.02 (0.68) -0.01 (-0.65) Bio-social fathers not employed -0.05† (-1.64) -0.03 (-1.60) Unemployment rate (model 4) -0.03*** (-3.76) -0.03*** (-3.62) Unemployment rate * year nine 0.02** (2.68) 0.02*** (3.36)High-frequency maternal physical aggression (z-stat)b
Unemployment rate (model 1) -0.02*** (-3.63) -0.03*** (-5.78) Unemployment rate (model 3) -0.06** (-2.57) -0.05* (-2.26) Mother’s unemployment 0.03 (0.93) -0.01 (-0.80) Bio-social fathers not employed 0.00 (0.05) 0.02 1.49 Unemployment rate (model 4) -0.04*** (-4.92) -0.05*** (-4.95) Unemployment rate * year nine 0.03*** (3.32) 0.03*** (3.66)High-frequency maternal psychological aggression (z-stat)b
Unemployment rate (model 1) -0.00 (-0.48) -0.01† (-1.77) Unemployment rate (model 3) -0.04 (-1.55) -0.01 (-0.51) Mother’s unemployment 0.03 (0.90) 0.01 0.37 Bio-social fathers not employed -0.02 (-0.47) 0.01 (0.44) Unemployment rate (model 4) -0.01 (-1.30) -0.02† (-1.67) Unemployment rate * year nine 0.01 (1.35) 0.01 (1.27)High-frequency maternal warmth (z-stat)b,c
Unemployment rate (model 1) -0.00 (-0.10) -0.00 (-0.05) Unemployment rate (model 3) 0.04 (0.95) 0.02 (0.40) Mother’s unemployment -0.07 (-1.39) -0.08*** (-3.39) Bio-social fathers not employed 0.03 (0.57) -0.02 (-0.72) Unemployment rate (model 4) 0.00 (0.04) -0.00 (-0.11) Unemployment rate * year nine -0.00 (-0.14) 0.00 (0.15)High-frequency maternal parenting activities (z-stat)b
Unemployment rate (model 1) 0.00 (0.24) -0.00 (-0.02) Unemployment rate (model 3) 0.01 (0.38) -0.00 (-0.24) Mother’s unemployment 0.01 (0.52) 0.02 (1.15) Bio-social fathers not employed 0.01 (0.43) -0.02 (-1.09) Unemployment rate (model 4) 0.02** (2.74) 0.03* (1.98) Unemployment rate * year nine -0.03*** (-3.62) -0.03*** (-5.01)
Source: Authors’ calculations based on data from the Fragile Families and Child Wellbeing Study.Note: Z-stats in parentheses. Covariates are measured at the baseline survey (except year) and are clustered at city and individual level. The model without individual fixed effects is clustered at city and individual level. Estimates from linear probability model.aIncludes years one through nine.bIncludes years three through nine.cA subsample of families received in-home visits and were assessed for warmth.***p < .001; **p < .01; *p < .05; †p < .1
Tabl
e 7
.A4
C
oeff
icie
nts
and
Sta
ndar
d Err
ors,
Mat
erna
l Par
enting
Out
com
es b
y S
ubgr
oup
With
Ind
ivid
ual F
ixed
Eff
ects
Bla
ckH
ispa
nic
Whi
teM
arri
edC
ohab
iting
Sing
le
Mot
hers
Hig
h-fr
eque
ncy
mat
erna
l spa
nkin
g (z
-sta
t)a
U
nem
ploy
men
t rat
e-0
.01
-0.0
2†-0
.02
-0.0
1-0
.02†
-0.0
1(-
0.60
)(-
1.62
)(-
1.24
)(-
1.27
)(-
0.65
)(-
0.56
)H
igh-
freq
uenc
y m
ater
nal p
hysi
cal a
ggre
ssio
n (z
-sta
t)b
U
nem
ploy
men
t rat
e-0
.02†
-0.0
2†-0
.01
-0.0
3*-0
.02
-0.0
3*(-
1.82
)(-
1.64
)(-
0.69
)(-
2.43
)(-
1.54
)(-
2.35
)H
igh-
freq
uenc
y m
ater
nal p
sych
olog
ical
agg
ress
ion
(z-s
tat)
b
U
nem
ploy
men
t rat
e-0
.02†
0.00
0.00
-0.0
0-0
.00
-0.0
1(-
1.95
)(0
.27)
(0.0
9)(-
0.21
)(-
0.05
)(-
0.60
)H
igh-
freq
uenc
y m
ater
nal w
arm
th (
z-st
at)b,
c
U
nem
ploy
men
t rat
e-0
.04*
0.04
†-0
.04†
-0.0
30.
02-0
.01
(-2.
37)
(1.9
4)(-
1.78
)(-
1.39
)(1
.32)
(-0.
33)
Hig
h-fr
eque
ncy
pare
ntin
g ac
tiviti
es (
z-st
at)
U
nem
ploy
men
t rat
e-0
.01
-0.0
10.
01-0
.01
0.01
-0.0
1(-
0.71
)(-
0.75
)(0
.67)
(-0.
40)
(1.0
6)(-
0.50
)
Sour
ce: A
utho
rs’ c
alcu
latio
ns b
ased
on
data
from
the
Frag
ile F
amili
es a
nd C
hild
Wel
lbei
ng S
tudy
.N
ote:
Z-s
tats
in p
aren
thes
es. T
he m
odel
incl
udes
indi
vidu
al fi
xed
effe
cts.
Est
imat
es fr
om li
near
pro
babi
lity
mod
els.
a Inc
lude
s yea
rs o
ne th
roug
h ni
ne.
bIn
clud
es y
ears
thre
e th
roug
h ni
ne.
c A su
bsam
ple
of fa
mili
es re
ceiv
ed in
-hom
e vi
sits a
nd w
ere
asse
ssed
for w
arm
th.
*p <
0.0
5; † p
< 0.
1
198 children of the great recession
Table 7.A5 Full Regression Results, Paternal ParentingHigh-Frequency Paternal Spankinga
With Individual Fixed Effects
Without Individual Fixed Effects
FathersUnemployment rate -0.01 (-1.63) -0.01† (-1.75)Education Less than high school 0.05* (2.25) High school 0.08*** (3.45) Some college 0.08*** (4.07)Relationship status Married 0.09*** (7.07) Cohabiting 0.05*** (3.84)Fathers’ age -0.00** (-2.85)Race-ethnicity Black -0.04* (-2.00) Hispanic -0.06* (-2.08) Other -0.03 (-0.91)Immigrant -0.06* (-2.16)Children in household -0.01† (-1.95)Lived with both parents at age nineteen -0.03* (-2.39)Interview Year 2000 — (—) — (—) 2001 0.27*** (3.88) 0.17** (3.00) 2002 0.30*** (5.04) 0.21*** (4.63) 2003 0.24*** (4.46) 0.15*** (3.47) 2004 0.23*** (3.82) 0.13** (2.62) 2005 0.17** (2.95) 0.07† (1.74) 2006 0.09 (0.89) — (—) 2007 -0.01 (-0.09) -0.12† (-1.94) 2008 -0.04 (-0.69) -0.12* (-2.41) 2009 -0.06 (-1.21) -0.15** (-2.92) 2010 — (—) -0.12* (-2.05)
mothers’ and fathers’ parenting 199
Table 7.A5 Continued
High-Frequency Paternal Spankinga
With Individual Fixed Effects
Without Individual Fixed Effects
City Austin 0.09*** (12.10) Baltimore 0.02 (0.82) Detroit 0.11*** (6.03) Newark 0.01 (1.01) Philadelphia 0.03* (2.22) Richmond 0.09*** (5.66) Corpus Christi 0.13*** (10.10) Indianapolis 0.11*** (9.50) Milwaukee 0.08*** (9.01) New York 0.04*** (4.08) San Jose 0.12*** (8.96) Boston -0.01 (-0.68) Nashville 0.23*** (20.20) Chicago 0.06*** (5.59) Jacksonville 0.11*** (9.24) Toledo 0.11*** (5.47) San Antonio 0.15*** (10.50) Pittsburgh 0.16*** (10.90) Norfolk 0.13*** (8.86)Constant 0.14† (1.77) 0.16** (2.73)Observations 9,142 9,142Number of individuals 3,220 3,220
Source: Authors’ calculations based on data from the Fragile Families and Child Wellbeing Study.Note: Z-stats in parentheses. Covariates are measured at the baseline survey (except year) and are clustered at city and individual level. Model 1 includes level unemployment rate. The model without individual fixed effects is clustered at city and individual level.aYears one through nine.***p < .001; **p < .01; *p < .05; †p < .1
Tabl
e 7
.A6
C
oeff
icie
nts
and
Sta
ndar
d Err
ors,
Rat
e of
Cha
nge
in U
nem
ploy
men
t fo
r Pat
erna
l Par
enting
Out
com
esW
ith I
ndiv
idua
l Fix
ed E
ffec
tsW
ithou
t In
divi
dual
Fix
ed E
ffec
ts
All
Les
s th
an
Hig
h Sc
hool
Hig
h Sc
hool
Som
e C
olle
geC
olle
ge +
All
Les
s th
an
Hig
h Sc
hool
Hig
h Sc
hool
Som
e C
olle
geC
olle
ge +
Fath
ers
Hig
h-fr
eque
ncy
pate
rnal
spa
nkin
g (z
-sta
t)a
U
nem
ploy
men
t ra
te (
mod
el 1
)-0
.01
-0.0
1-0
.02
0.00
-0.0
1-0
.01†
-0.0
1-0
.02†
-0.0
1-0
.01
(-1.
63)
(-1.
10)
(-1.
48)
(0.1
6)(-
0.59
)(-
1.75
)(-
1.35
)(-
1.69
)(-
0.39
)(-
1.18
)
Une
mpl
oym
ent
rate
(m
odel
2)
-0.0
1†-0
.01
-0.0
2†-0
.00
-0.0
1-0
.01†
-0.0
1-0
.02*
-0.0
10.
01(-
1.71
)(-
0.98
)(-
1.67
)(-
0.01
)(-
0.41
)(-
1.84
)(-
1.23
)(-
2.00
)(-
0.71
)(-
0.64
)
Incr
easi
ng
unem
ploy
men
t ra
te
-0.0
0-0
.00
0.00
-0.0
00.
00*
0.00
-0.0
0*0.
00-0
.00
0.00
**(-
0.64
)(-
1.06
)(0
.19)
(-1.
26)
(2.0
3)(0
.16)
(-2.
00)
(1.3
9)(-
0.93
)(2
.74)
D
ecre
asin
g
unem
ploy
men
t ra
te
-0.0
00.
00-0
.00
-0.0
00.
00-0
.00
0.00
-0.0
0*-0
.01*
0.00
(-0.
85)
(0.4
1)(-
1.38
)(-
0.94
)(0
.89)
(-1.
12)
(0.2
9)(-
2.37
)(-
1.96
)(0
.71)
O
bser
vatio
ns9,
142
2,20
31,
774
1,45
589
09,
142
2,20
31,
774
1,45
589
0
Num
ber
of
indi
vidu
als
3,22
01,
071
829
645
364
3,22
01,
071
829
645
364
Hig
h-fr
eque
ncy
pate
rnal
phy
sica
l agg
ress
ion
(z-s
tat)
b
U
nem
ploy
men
t ra
te (
mod
el 1
)-0
.01†
-0.0
1-0
.01
-0.0
1-0
.02
-0.0
2***
-0.0
2**
-0.0
2†-0
.01
-0.0
2(-
1.66
)(-
0.67
)(-
0.67
)(-
0.82
)(-
1.17
)(-
4.04
)(-
2.66
)(-
1.67
)(-
0.69
)(-
1.15
)
Une
mpl
oym
ent
rate
(m
odel
2)
-0.0
1†-0
.01
-0.0
1-0
.01
-0.0
2-0
.02*
**-0
.02*
*-0
.02†
-0.0
1-0
.01
(-1.
68)
(-0.
70)
(-0.
60)
(-0.
79)
(-1.
10)
(-3.
97)
(-2.
61)
(-1.
63)
(-0.
77)
(-0.
90)
In
crea
sing
un
empl
oym
ent
rate
-0.0
0-0
.00
-0.0
00.
00-0
.00
0.00
0.00
0.00
0.00
0.00
(-0.
63)
(-0.
25)
(-0.
94)
(0.4
1)(-
0.15
)(0
.61)
(0.3
3)(0
.57)
(0.0
0)(0
.82)
D
ecre
asin
g
unem
ploy
men
t ra
te
-0.0
0-0
.00
0.00
-0.0
00.
00-0
.00
-0.0
00.
00-0
.00
0.00
(-0.
18)
(-0.
29)
(0.0
5)(-
0.13
)(0
.28)
(-0.
31)
(-0.
23)
(0.6
7)(-
1.37
)(0
.35)
O
bser
vatio
ns4,
919
1,73
61,
333
1,15
869
24,
919
1,73
61,
333
1,15
869
2
Num
ber
of
indi
vidu
als
2,65
999
374
260
332
12,
659
993
742
603
321
Hig
h-fr
eque
ncy
pate
rnal
psy
chol
ogic
al a
ggre
ssio
n (z
-sta
t)b
U
nem
ploy
men
t ra
te (
mod
el 1
)-0
.00
-0.0
2-0
.03
0.02
0.05
-0.0
1-0
.03*
**-0
.03
0.02
0.06
(-0.
14)
(-1.
09)
(-1.
18)
(1.1
6)(1
.54)
(-1.
03)
(-3.
40)
(-1.
28)
(1.5
2)(1
.60)
U
nem
ploy
men
t ra
te (
mod
el 2
)0.
00-0
.02
-0.0
20.
020.
06†
-0.0
1-0
.03*
*-0
.03
0.02
0.06
†
(0.0
3)(-
1.03
)(-
0.96
)(1
.07)
(1.7
7)(-
0.86
)(-
3.04
)(-
1.20
)(1
.28)
(1.8
4)
Incr
easi
ng
unem
ploy
men
t ra
te
-0.0
00.
00-0
.00
-0.0
00.
000.
000.
00-0
.00
-0.0
00.
00(-
0.90
)(0
.34)
(-1.
14)
(-1.
12)
(0.2
0)(0
.66)
(1.3
5)(-
0.01
)(-
0.90
)(0
.50)
D
ecre
asin
g
unem
ploy
men
t ra
te
0.00
0.00
0.01
0.00
0.01
0.00
0.01
†0.
01-0
.00
0.01
†
(1.4
3)(0
.53)
(1.5
7)(0
.12)
(1.3
7)(1
.15)
(1.8
6)(1
.08)
(-0.
085)
(1.8
7)
O
bser
vatio
ns4,
919
1,73
61,
333
1,15
869
24,
919
1,73
61,
333
1,15
869
2
Num
ber
of
indi
vidu
als
2,65
999
374
260
332
12,
659
993
742
603
321
Sour
ce: A
utho
rs’ c
alcu
latio
ns b
ased
on
data
from
the
Frag
ile F
amili
es a
nd C
hild
Wel
lbei
ng S
tudy
.N
ote:
Z-s
tats
in p
aren
thes
es. C
ovar
iate
s are
mea
sure
d at
the
base
line
surv
ey (e
xcep
t yea
r) a
nd a
re c
lust
ered
at c
ity a
nd in
divi
dual
leve
l. T
he m
odel
with
out i
ndiv
idua
l fix
ed e
ffec
ts
is cl
uste
red
at c
ity a
nd in
divi
dual
leve
l. E
stim
ates
from
line
ar p
roba
bilit
y m
odel
s.a I
nclu
des y
ears
one
thro
ugh
nine
.bIn
clud
es y
ears
thre
e th
roug
h ni
ne.
***p
< .0
01; *
*p <
.01;
*p
< .0
5; † p
< .1
Tabl
e 7.A
7
Sen
siti
vity
of C
oeff
icie
nts,
Pat
erna
l Par
enting
Out
com
esW
ith I
ndiv
idua
l Fi
xed
Eff
ects
With
out
Indi
vidu
al
Fixe
d E
ffec
ts
Fath
ers
Hig
h-fr
eque
ncy
pate
rnal
spa
nkin
g (z
-sta
t)a
U
nem
ploy
men
t ra
te (
mod
el 1
)-0
.01
(-1.
63)
-0.0
1†(-
1.75
)
Une
mpl
oym
ent
rate
(m
odel
3)
-0.0
1(-
0.38
)-0
.01
(-1.
50)
M
othe
r’s
unem
ploy
men
t-0
.02
(-0.
52)
-0.0
1(-
0.44
)
Bio
-soc
ial f
athe
rs n
ot e
mpl
oyed
0.05
(1.4
7)0.
05*
(-2.
22)
U
nem
ploy
men
t ra
te (
mod
el 4
)-0
.03*
*(-
2.88
)-0
.03*
*(-
2.67
)
Une
mpl
oym
ent
rate
* y
ear
nine
0.02
*(2
.44)
0.03
*(2
.28)
Hig
h-fr
eque
ncy
pate
rnal
phy
sica
l agg
ress
ion
(z-s
tat)
b
U
nem
ploy
men
t ra
te (
mod
el 1
)-0
.01†
(-1.
66)
-0.0
2***
(-4.
04)
U
nem
ploy
men
t ra
te (
mod
el 3
)-0
.03
(-1.
12)
-0.0
3*(-
2.26
)
Mot
her’
s un
empl
oym
ent
-0.0
1(-
0.16
)-0
.01
(-0.
52)
B
io-s
ocia
l fat
her’
s no
t em
ploy
ed-0
.02
(-0.
38)
0.05
*(2
.16)
U
nem
ploy
men
t ra
te (
mod
el 4
)-0
.03*
*(-
2.96
)-0
.04*
**(-
5.05
)
Une
mpl
oym
ent
rate
* y
ear
nine
0.02
*(2
.52)
0.03
***
(3.7
3)H
igh-
freq
uenc
y pa
tern
al p
sych
olog
ical
agg
ress
ion
(z-s
tat)
b
U
nem
ploy
men
t ra
te (
mod
el 1
)-0
.00
(-0.
14)
-0.0
1(-
1.03
)
Une
mpl
oym
ent
rate
(m
odel
3)
-0.0
3(-
0.76
)-0
.04
(-1.
15)
M
othe
r’s
unem
ploy
men
t0.
01(0
.07)
-0.0
0(-
0.05
)
Bio
-soc
ial f
athe
r’s
not
empl
oyed
0.18
**(2
.87)
0.07
*(2
.37)
U
nem
ploy
men
t ra
te (
mod
el 4
)-0
.03
(-0.
76)
-0.0
4(-
1.15
)
Une
mpl
oym
ent
rate
* y
ear
nine
0.01
(0.0
7)-0
.00
(-0.
05)
Sour
ce: A
utho
rs’ c
alcu
latio
ns b
ased
on
data
from
the
Frag
ile F
amili
es a
nd C
hild
Wel
lbei
ng S
tudy
.N
ote:
Z-s
tats
in p
aren
thes
es. C
ovar
iate
s ar
e m
easu
red
at th
e ba
selin
e su
rvey
(ex
cept
yea
r) a
nd a
re c
lust
ered
at c
ity a
nd in
divi
dual
le
vel.
The
mod
el w
ithou
t ind
ivid
ual f
ixed
eff
ects
is c
lust
ered
at c
ity a
nd in
divi
dual
leve
l. E
stim
ates
from
line
ar p
roba
bilit
y m
odel
s.a I
nclu
des y
ears
one
thro
ugh
nine
.bIn
clud
es y
ears
thre
e th
roug
h ni
ne.
***p
< .0
01; *
*p <
.01;
*p
< .0
5; † p
< .1
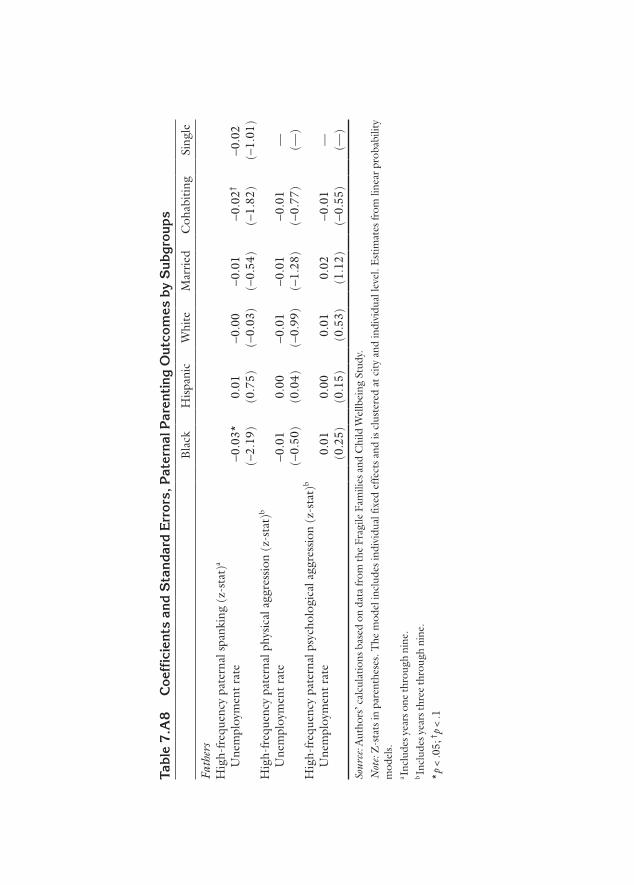
Tabl
e 7
.A8
Coe
ffic
ient
s an
d S
tand
ard
Err
ors,
Pat
erna
l Par
enting
Out
com
es b
y S
ubgr
oups
Bla
ckH
ispa
nic
Whi
teM
arri
edC
ohab
iting
Sing
le
Fath
ers
Hig
h-fr
eque
ncy
pate
rnal
spa
nkin
g (z
-sta
t)a
U
nem
ploy
men
t ra
te-0
.03*
0.01
-0.0
0-0
.01
-0.0
2†-0
.02
(-2.
19)
(0.7
5)(-
0.03
)(-
0.54
)(-
1.82
)(-
1.01
)H
igh-
freq
uenc
y pa
tern
al p
hysi
cal a
ggre
ssio
n (z
-sta
t)b
U
nem
ploy
men
t ra
te-0
.01
0.00
-0.0
1-0
.01
-0.0
1—
(-0.
50)
(0.0
4)(-
0.99
)(-
1.28
)(-
0.77
)(—
)H
igh-
freq
uenc
y pa
tern
al p
sych
olog
ical
agg
ress
ion
(z-s
tat)
b
U
nem
ploy
men
t ra
te0.
010.
000.
010.
02-0
.01
—(0
.25)
(0.1
5)(0
.53)
(1.1
2)(-
0.55
)(—
)
Sour
ce: A
utho
rs’ c
alcu
latio
ns b
ased
on
data
from
the
Frag
ile F
amili
es a
nd C
hild
Wel
lbei
ng S
tudy
.N
ote:
Z-s
tats
in p
aren
thes
es. T
he m
odel
incl
udes
indi
vidu
al fi
xed
effe
cts a
nd is
clu
ster
ed a
t city
and
indi
vidu
al le
vel.
Est
imat
es fr
om li
near
pro
babi
lity
mod
els.
a Inc
lude
s yea
rs o
ne th
roug
h ni
ne.
bIn
clud
es y
ears
thre
e th
roug
h ni
ne.
*p <
.05;
† p <
.1
204 children of the great recession
NOTES
1. Brooks-Gunn and Markman 2005; Lareau 2003.
2. Brooks-Gunn and Markman 2005; Raikes et al. 2006.
3. Elder 1974.
4. Elder and Conger 2000.
5. See, for example, Leinonen, Solantaus, and Punamki 2002.
6. On punative, McLoyd 1990; on warmth, Klebanov, Brooks-Gunn, and Duncan 1994.
7. Brooks-Gunn, Schneider, and Waldfogel 2013; Huang et al. 2011; Lee et al. 2013; Lindo, Hanson, and Schaller 2013.
8. Berger et al. 2013.
9. On prior recessions, Leinonen, Solantaus, and Punamaki 2002; on Iowa, Conger and Elder 1994; see also Elder 1974.
10. Straus et al. 1998.
11. Gershoff 2002.
12. Caldwell and Bradley 2001.
13. MacKenzie et al. 2014.
14. Brooks-Gunn, Schneider, and Waldfogel 2013.
REFERENCESBerger, Lawrence M., Sarah A. Font, Kristen S. Slack, and Jane Waldfogel. 2013.
“Income and Child Maltreatment: Evidence from the Earned Income Tax Credit.” Paper presented at the Association for Public Policy Analysis and Management annual conference. Washington, D.C. (November 8, 2013).
Brooks-Gunn, Jeanne, and Lisa Markman. 2005. “The Contribution of Parenting to Ethnic and Racial Gaps in School Readiness.” The Future of Children 15(1): 139–69.
Brooks-Gunn, Jeanne, William Schneider, and Jane Waldfogel. 2013. “The Great Recession and the Risk for Child Maltreatment.” Child Abuse & Neglect 37(10): 721–29.
Caldwell, Bettye M., and Robert H. Bradley. 2001. HOME Inventory Admin-istration Manual, 3rd ed. Little Rock: University of Arkansas at Little Rock.
Conger, Rand D., and Glen H. Elder Jr. 1994. “Families in Troubled Times: The Iowa Youth and Families Project.” In Families in Troubled Times: Adapting to Change in Rural America, edited by Rand D. Conger and Glen H. Elder Jr. Hillsdale, N.J.: Aldine.
Elder, Glen H., Jr. 1974. Children of the Great Depression: Social Changes in Life Experience. Boulder, Colo.: Westview Press.
Elder, Glen H., Jr., and Rand D. Conger. 2000. Children of the Land: Adversity and Success in Rural America. Chicago: University of Chicago Press.
mothers’ and fathers’ parenting 205
Gershoff, Elizabeth T. 2002. “Corporal Punishment by Parents and Associated Child Behaviors and Experiences: A Meta-Analytic and Theoretical Review.” Psychological Bulletin 128(4): 539–79.
Huang, Mary I., Mary Ann O’Riordan, Ellen Fitzenrider, Lolita McDavid, Alan R. Cohen, and Shenandoah Robinson. 2011. “Increased Incidence of Nonaccidental Head Trauma in Infants Associated with the Economic Recession.” Journal of Neurosurgery: Pediatrics 8(2): 171–76.
Klebanov, Pamela Kato, Jeanne Brooks-Gunn, and Greg J. Duncan. 1994. “Does Neighborhood and Family Poverty Affect Mothers’ Parenting, Mental Health, and Social Support?” Journal of Marriage and the Family 56(2): 441–55.
Lareau, Annette. 2003. Unequal Childhoods: Class, Race, and Family Life. Berkeley: University of California Press.
Lee, Dohoon, Jeanne Brooks-Gunn, Sara S. McLanahan, Daniel Notterman, and Irwin Garfinkel. 2013. “The Great Recession, Genetic Sensitivity, and Maternal Harsh Parenting.” Proceedings of the National Academy of Sciences 110(34): 13780–84.
Leinonen, Jenni A., Tytti S. Solantaus, and Raija-Leena Punamki. 2002. “The Specific Mediating Paths Between Economic Hardship and the Quality of Parenting.” International Journal of Behavioral Development 26(5): 423–35.
Lindo, Jason M., Jessamyn Schaller, and Benjamin Hansen. 2013. “Economic Conditions and Child Abuse.” NBER working paper no. 18994. Cambridge, Mass.: National Bureau of Economic Research.
MacKenzie, Michael J., Eric Nicklas, Jeanne Brooks-Gunn, and Jane Waldfogel. 2014. “Repeated Exposure to High-Frequency Spanking and Child Externalizing Behavior Across the First Decade: A Moderating Role for Cumulative Risk.” Child Abuse & Neglect 38(12): 1895–901.
McLanahan, Sara S., Irwin Garfinkel, Ronald Mincy, and Elizabeth Donahue. 2010. “Introducing the Issue.” The Future of Children 20(2): 3–17.
McLanahan, Sara S., and Gary Sandefur. 1994. Growing Up with a Single Parent: What Hurts, What Helps. Cambridge, Mass.: Harvard University Press.
McLoyd, Vonnie C. 1990. “The Impact of Economic Hardship on Black Families and Children: Psychological Distress, Parenting, and Socioemotional Development.” Child Development 61(2): 311–46.
Pleck, Joshua H. 2007. “Why Could Father Involvement Benefit Children? Theoretical Perspectives.” Applied Development Science 11(4): 196–202.
Raikes, Helen, Barbara A. Pan, Gayle Luze, Catherine Tamis-LeMonda, Jeanne Brooks-Gunn, Jill Constatine, Louisa B. Tarullo, H. Abigail Raikes, and Eileen T. Rodriguez. 2006. “Mother-Child Book Reading in Low-Income Families: Correlates and Outcomes During the First Three Years of Life.” Child Development 77(4): 924–53.
Straus, Murray A., Sherry L. Hamby, David Finkelhor, David W. Moore, and Desmond Runyan. 1998. “Identification of Child Maltreatment with the Parent Child Conflict Tactics Scales: Development and Psychometric Data for a National Sample of American Parents.” Journal of Child Abuse & Neglect 22(4): 249–70.