today’s families: an unstable and complex picture jeanne brooks-gunn october 18, 2010
TRANSCRIPT
Today’s Families: Today’s Families: An Unstable and Complex An Unstable and Complex
PicturePicture
Jeanne Brooks-GunnOctober 18, 2010
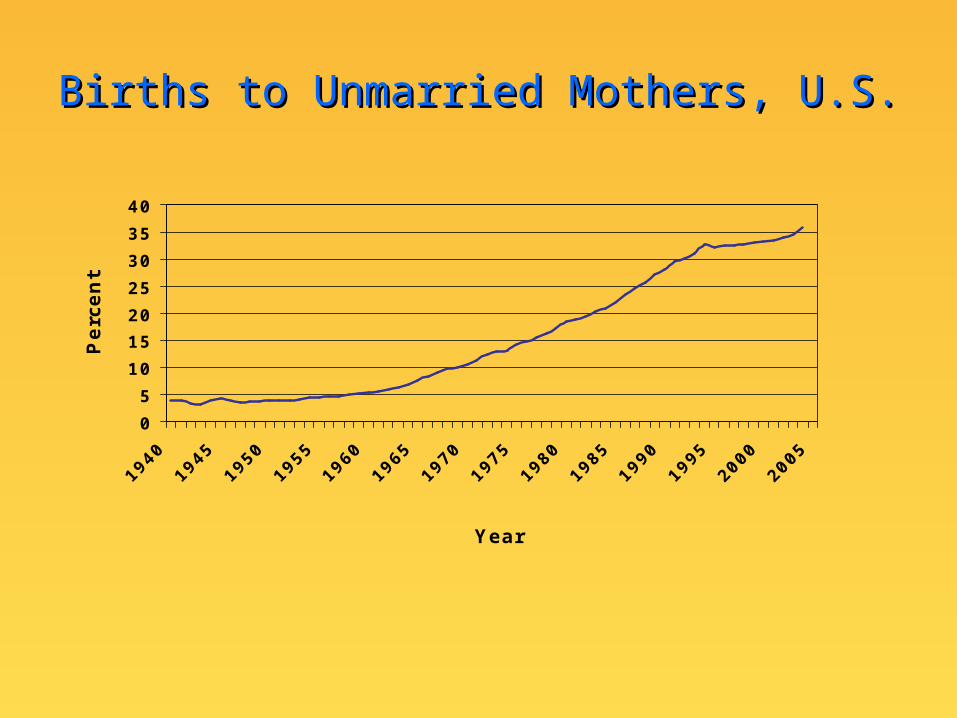
Births to Unmarried Mothers, U.S.Births to Unmarried Mothers, U.S.
0
5
10
15
20
25
30
35
40
1940
1945
1950
1955
1960
1965
1970
1975
1980
1985
1990
1995
2000
2005
Year
Perc
en
t
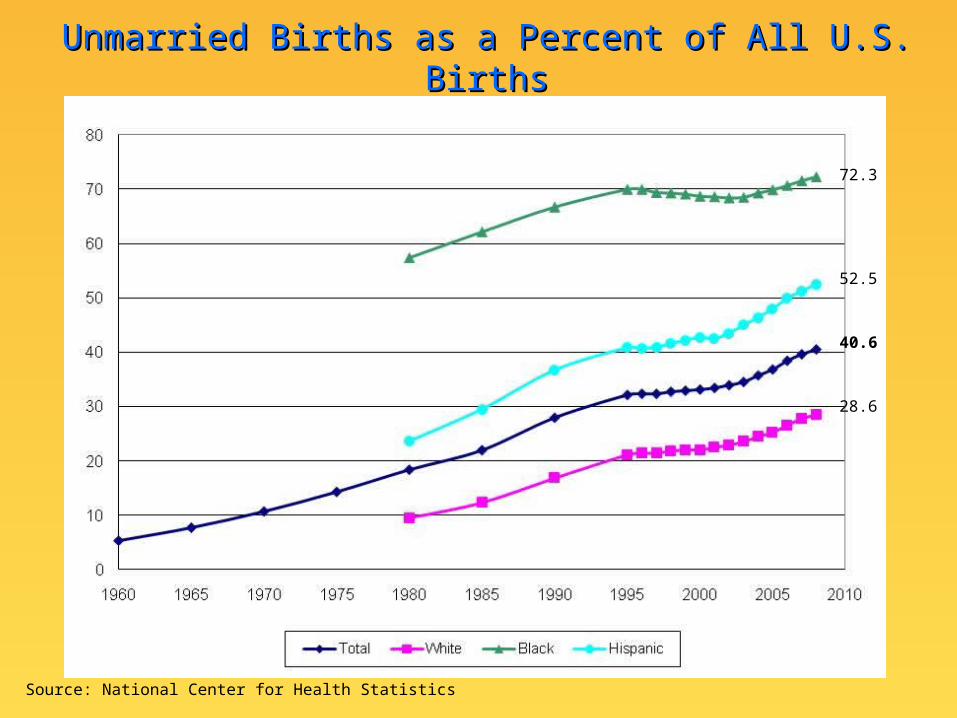
Unmarried Births as a Percent of All U.S. BirthsUnmarried Births as a Percent of All U.S. Births
Source: National Center for Health Statistics
72.3
52.5
40.6
28.6
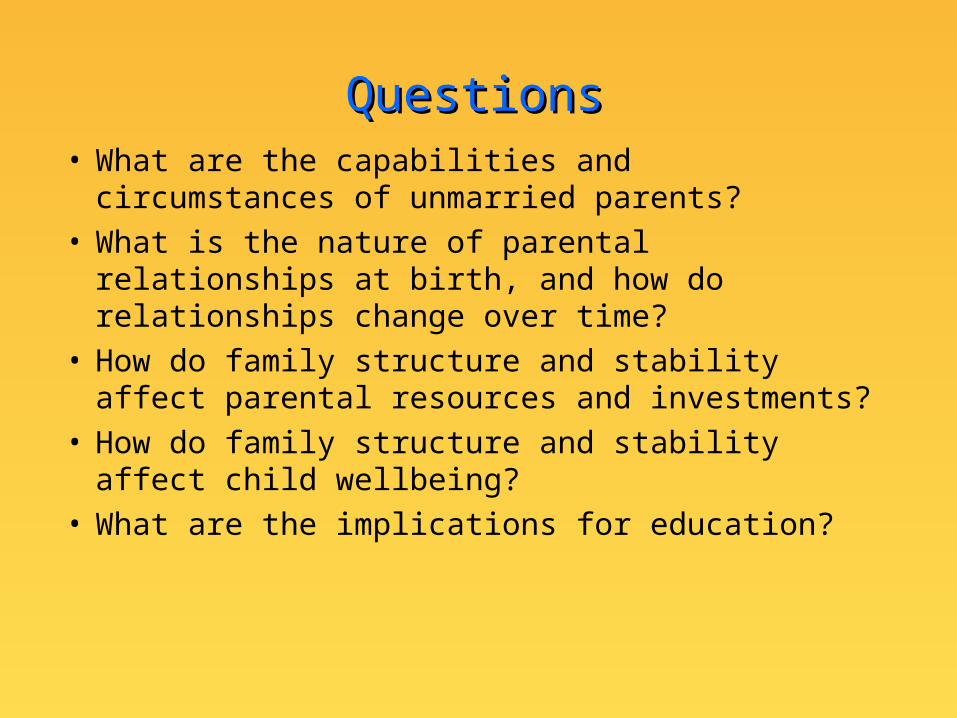
QuestionsQuestions• What are the capabilities and circumstances of
unmarried parents?• What is the nature of parental relationships at
birth, and how do relationships change over time?
• How do family structure and stability affect parental resources and investments?
• How do family structure and stability affect child wellbeing?
• What are the implications for education?
The Fragile Families Study The Fragile Families Study
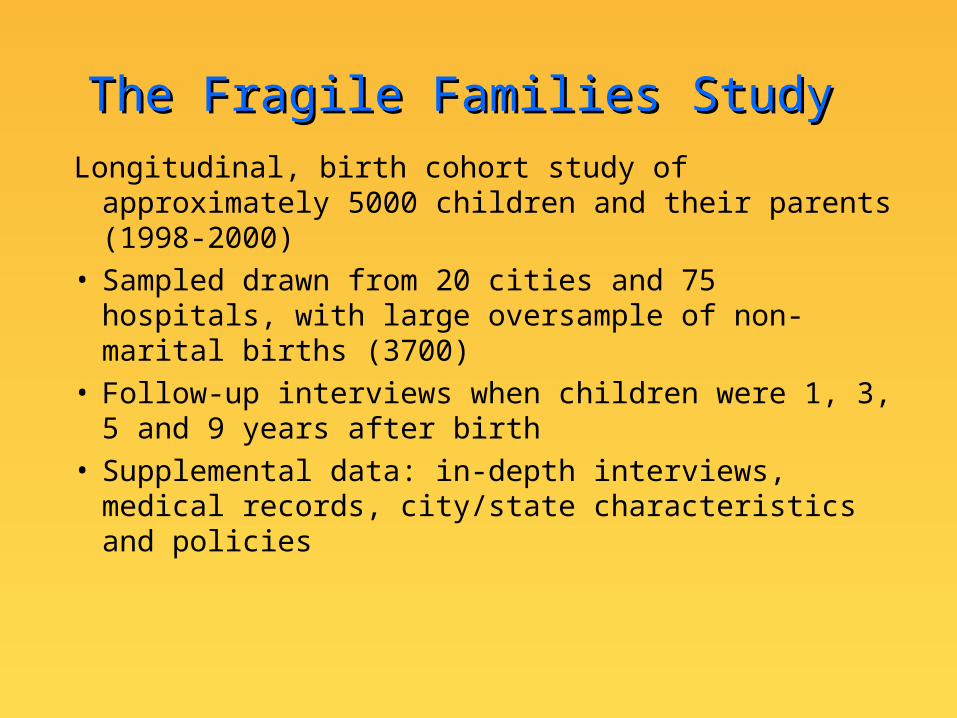
Longitudinal, birth cohort study of approximately 5000 children and their parents (1998-2000)
• Sampled drawn from 20 cities and 75 hospitals, with large oversample of non-marital births (3700)
• Follow-up interviews when children were 1, 3, 5 and 9 years after birth
• Supplemental data: in-depth interviews, medical records, city/state characteristics and policies

What are the capabilities and What are the capabilities and circumstances of unmarried parents?circumstances of unmarried parents?
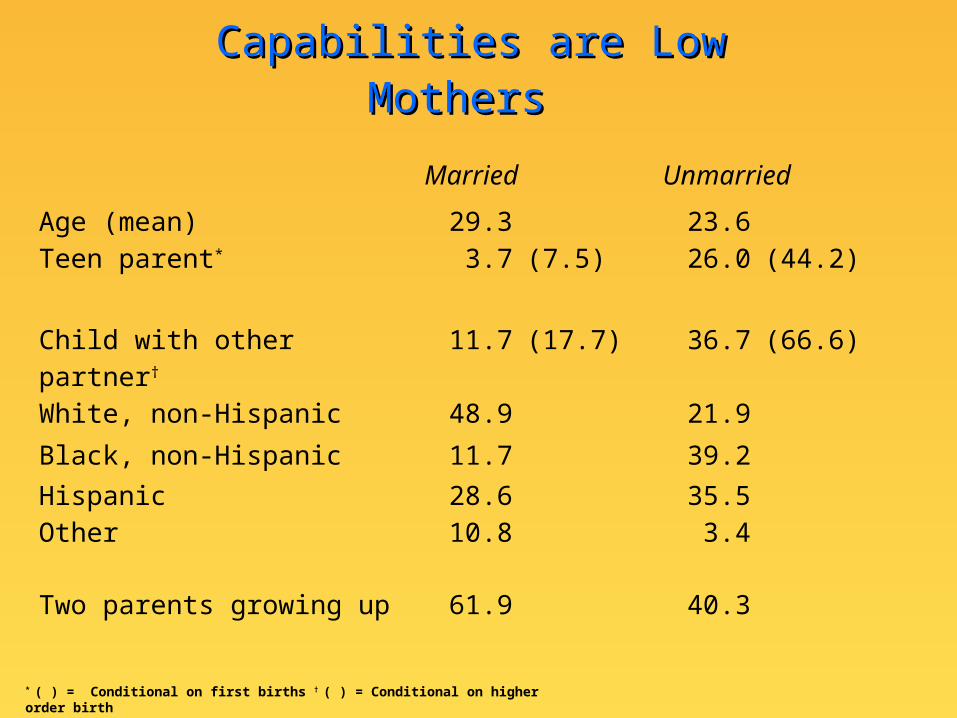
Capabilities are LowCapabilities are LowMothersMothers
Married Unmarried
Age (mean) 29.3 23.6Teen parent* 3.7 (7.5) 26.0 (44.2)
Child with other partner† 11.7 (17.7) 36.7 (66.6)
White, non-Hispanic 48.9 21.9
Black, non-Hispanic 11.7 39.2
Hispanic 28.6 35.5Other 10.8 3.4
Two parents growing up 61.9 40.3
* ( ) = Conditional on first births † ( ) = Conditional on higher order birth

Mother Capabilities cont’dMother Capabilities cont’d Married Unmarried Education Less than high school 17.8 44.9 High school or equivalent 25.5 36.7 Some college 21.1 15.8 College or higher 35.7 2.4Earnings ($ mean) 25,618.9 11,114.2
Poverty status 14.0 42.8Not working at birth -- --Health Poor/fair health 10.4 15.8 Health limitations 7.1 10.1 Depression 13.2 15.9 Heavy drinking 2.0 7.8 Illegal drugs 0.3 2.4Father incarcerated -- --
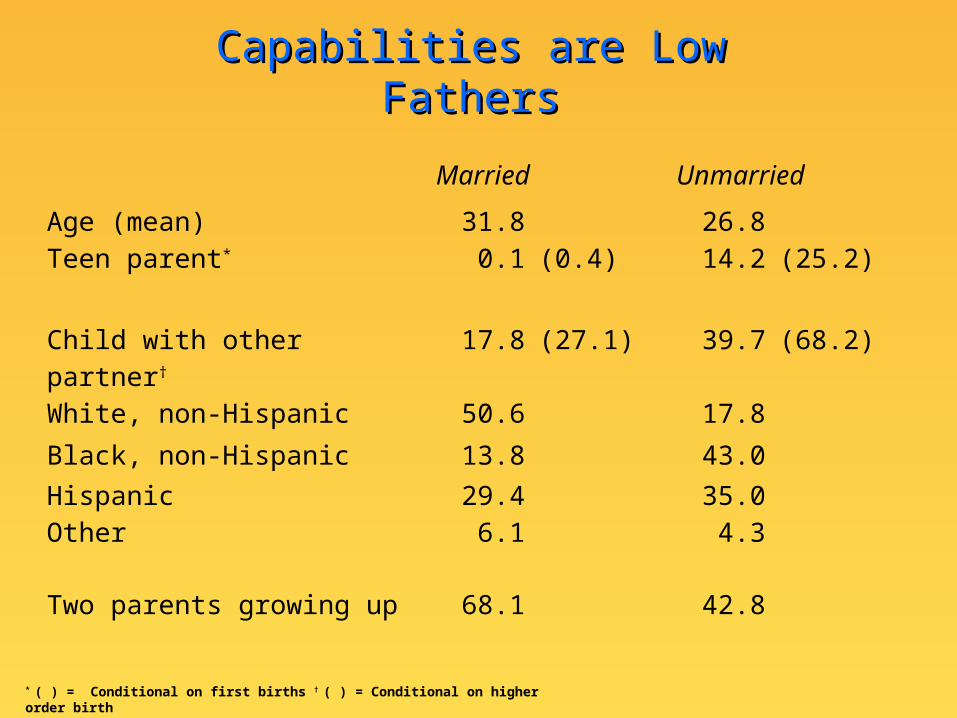
Capabilities are LowCapabilities are LowFathersFathers
Married Unmarried
Age (mean) 31.8 26.8Teen parent* 0.1 (0.4) 14.2 (25.2)
Child with other partner† 17.8 (27.1) 39.7 (68.2)
White, non-Hispanic 50.6 17.8
Black, non-Hispanic 13.8 43.0
Hispanic 29.4 35.0Other 6.1 4.3
Two parents growing up 68.1 42.8
* ( ) = Conditional on first births † ( ) = Conditional on higher order birth
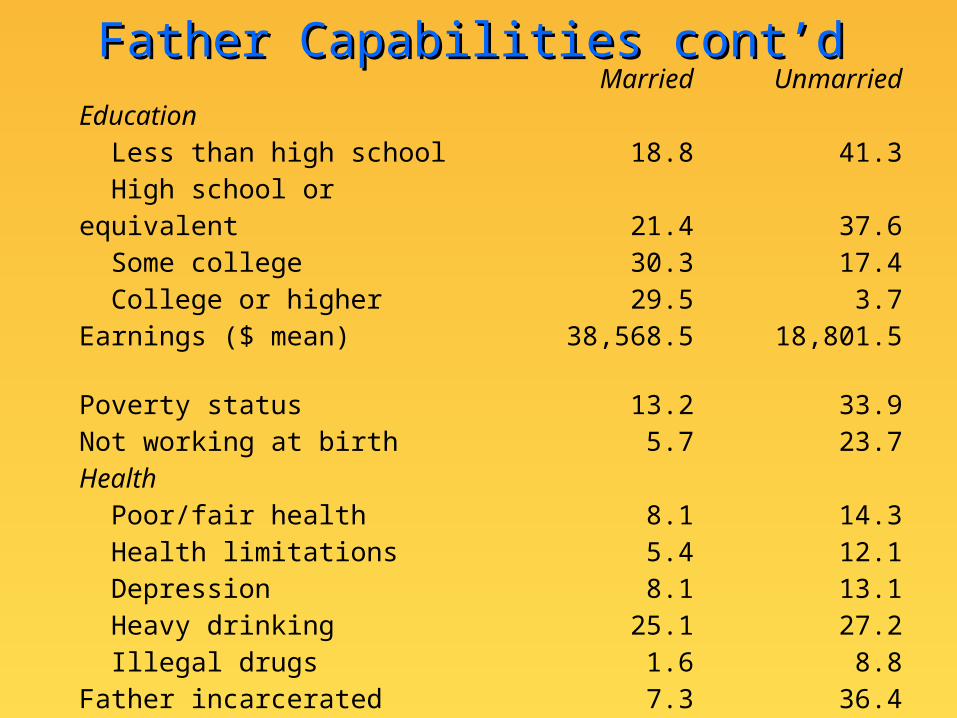
Father Capabilities cont’dFather Capabilities cont’d Married UnmarriedEducation Less than high school 18.8 41.3 High school or equivalent 21.4 37.6 Some college 30.3 17.4 College or higher 29.5 3.7Earnings ($ mean) 38,568.5 18,801.5
Poverty status 13.2 33.9Not working at birth 5.7 23.7Health Poor/fair health 8.1 14.3 Health limitations 5.4 12.1 Depression 8.1 13.1 Heavy drinking 25.1 27.2 Illegal drugs 1.6 8.8Father incarcerated 7.3 36.4

What is the nature of parental What is the nature of parental relationships at birth?relationships at birth?
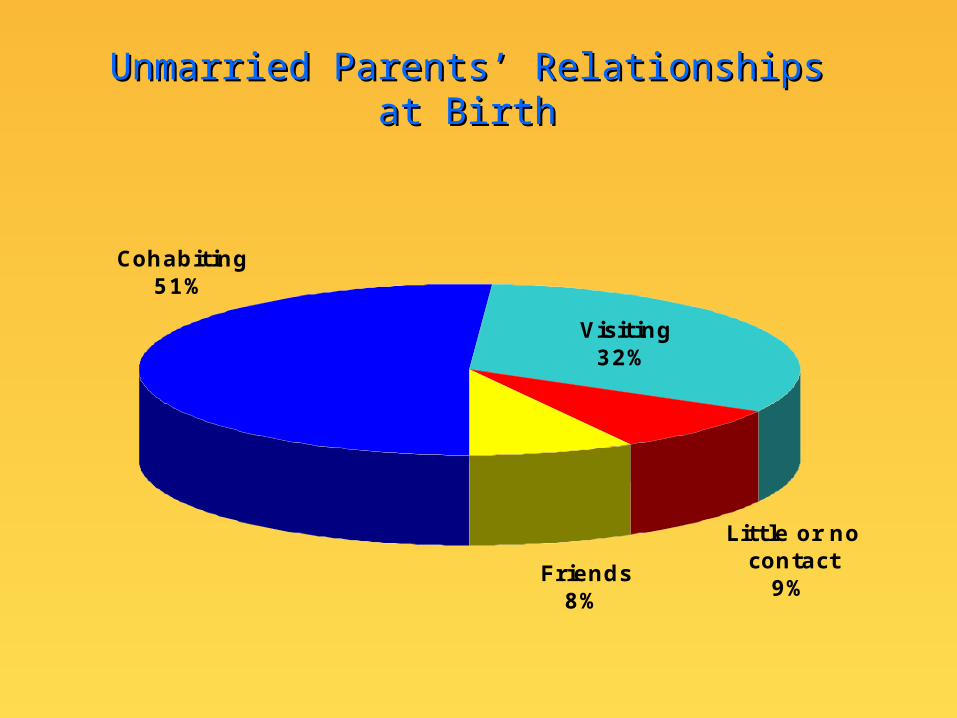
Unmarried Parents’ Relationships at BirthUnmarried Parents’ Relationships at Birth
Cohabiting51%
Visiting32%
Little or no contact
9%Friends
8%
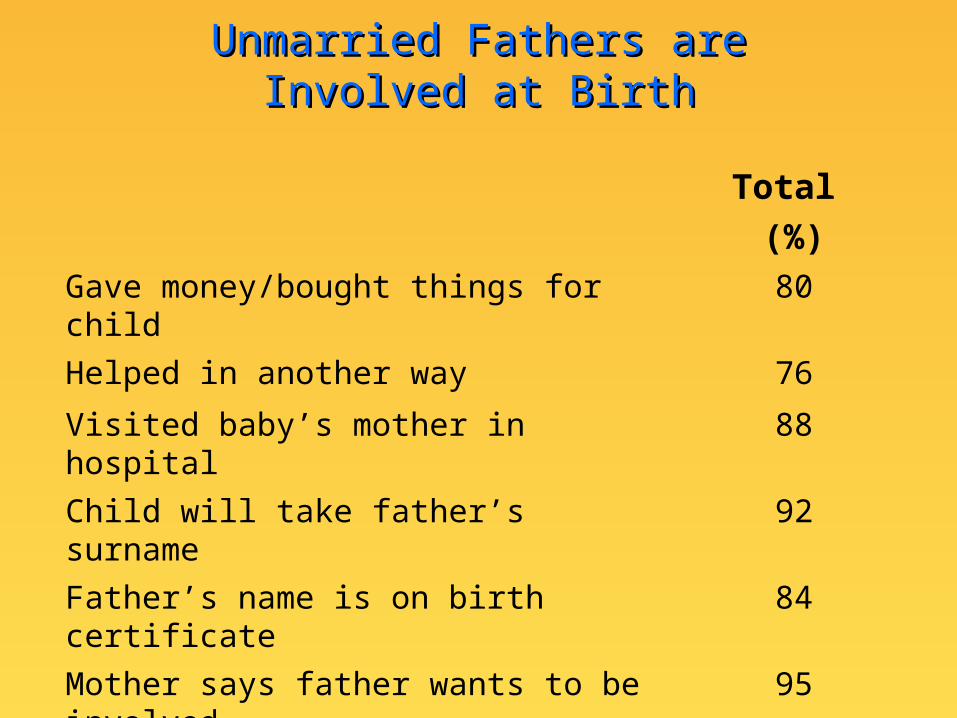
Unmarried Fathers areUnmarried Fathers areInvolved at BirthInvolved at Birth
Total (%)
Gave money/bought things for child 80
Helped in another way 76
Visited baby’s mother in hospital 88
Child will take father’s surname 92
Father’s name is on birth certificate 84
Mother says father wants to be involved
95
Mother wants father to be involved 94
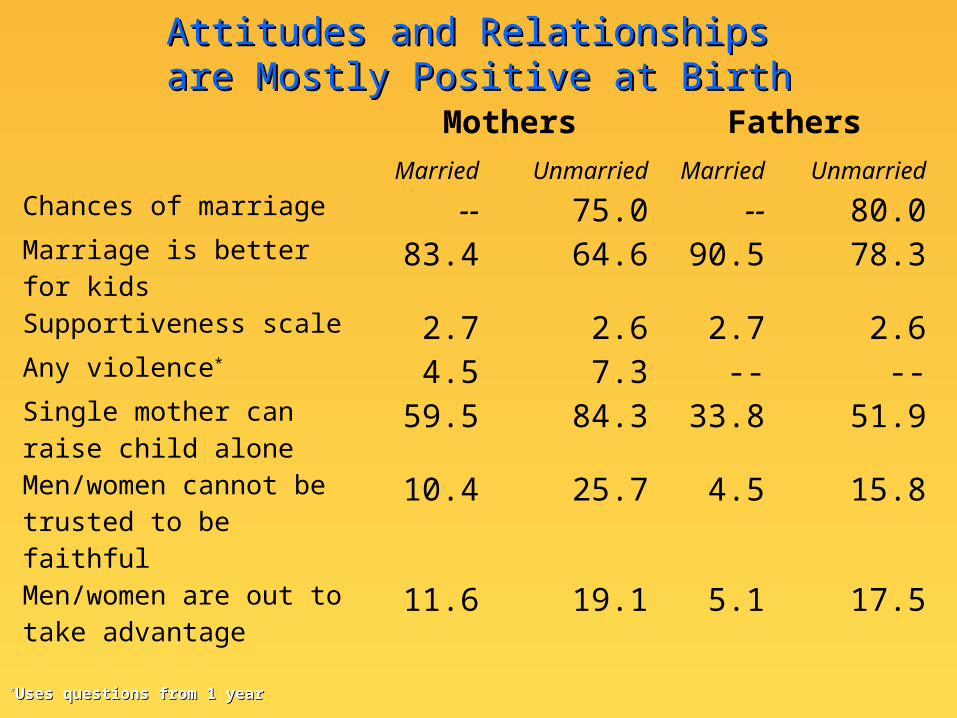
Attitudes and Relationships Attitudes and Relationships are Mostly Positive at Birthare Mostly Positive at Birth
Mothers Fathers Married Unmarried Married Unmarried
Chances of marriage -- 75.0 -- 80.0Marriage is better for kids
83.4 64.6 90.5 78.3
Supportiveness scale 2.7 2.6 2.7 2.6Any violence* 4.5 7.3 -- --Single mother can raise child alone
59.5 84.3 33.8 51.9
Men/women cannot be trusted to be faithful
10.4 25.7 4.5 15.8
Men/women are out to take advantage
11.6 19.1 5.1 17.5
**Uses questions from 1 yearUses questions from 1 year

How do parental relationships How do parental relationships change change
over time?over time?
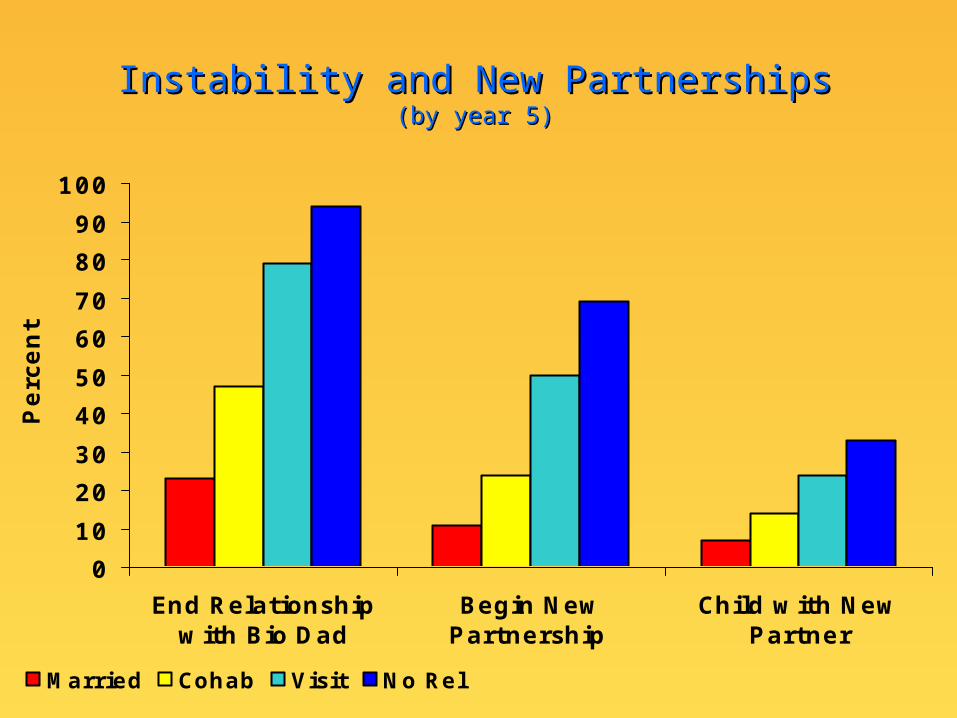
Instability and New PartnershipsInstability and New Partnerships(by year 5)(by year 5)
0
10
20
30
40
50
60
70
80
90
100
End Relationshipwith Bio Dad
Begin NewPartnership
Child with NewPartner
Perc
en
t
Married Cohab Visit No Rel
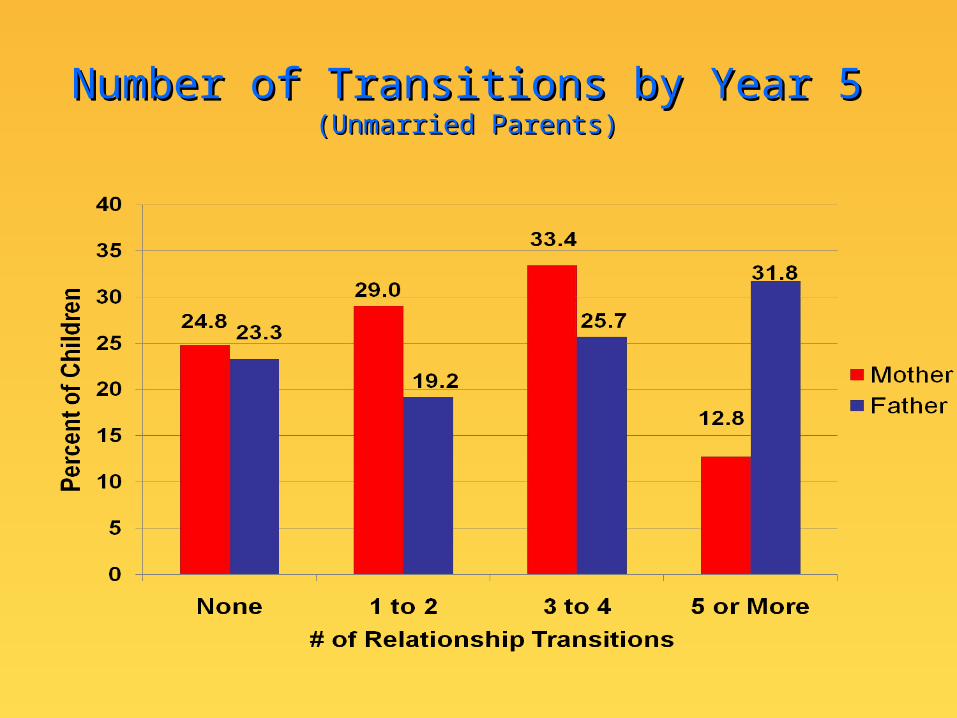
Number of Transitions by Year 5Number of Transitions by Year 5(Unmarried Parents)(Unmarried Parents)
How do family structure and stability How do family structure and stability affect parental resources and affect parental resources and
investments?investments?
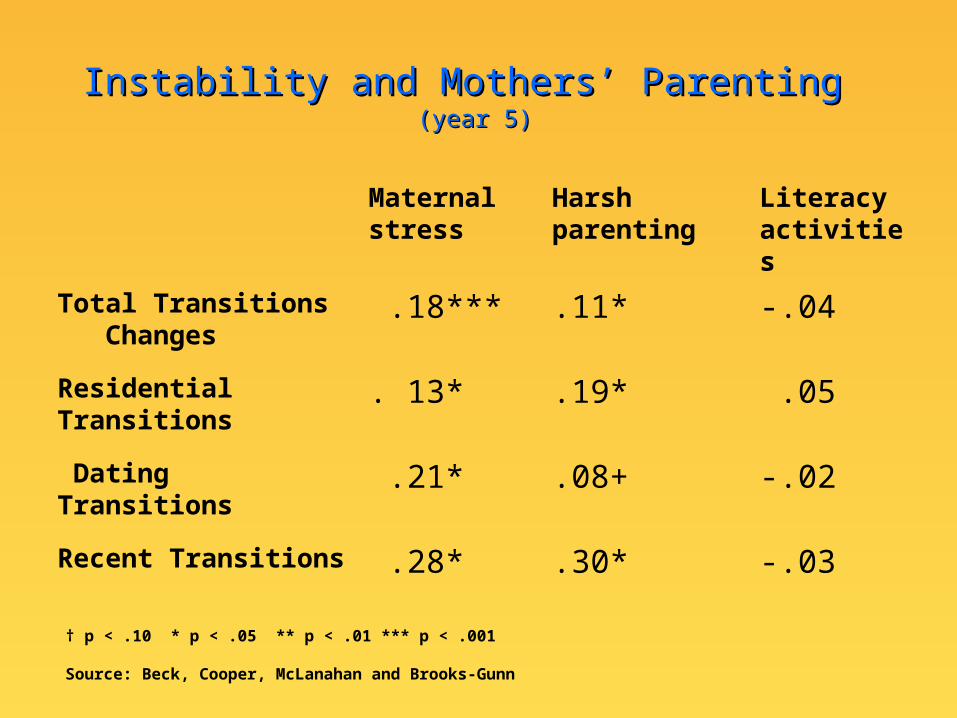
Instability and Mothers’ ParentingInstability and Mothers’ Parenting (year 5)(year 5)
† p < .10 * p < .05 ** p < .01 *** p < .001
Source: Beck, Cooper, McLanahan and Brooks-Gunn
Maternal stress
Harsh parenting
Literacy activities
Total Transitions Changes
.18*** .11* -.04
Residential Transitions
. 13* .19* .05
Dating Transitions .21* .08+ -.02
Recent Transitions .28* .30* -.03
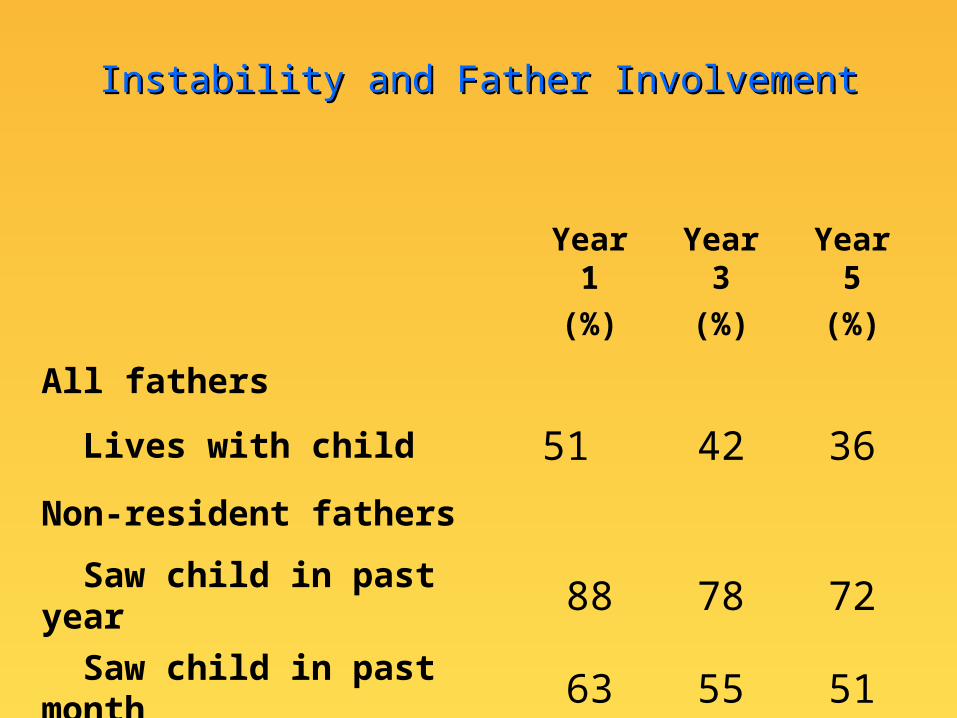
Instability and Father InvolvementInstability and Father Involvement
Year 1
(%)
Year 3
(%)
Year 5
(%)
All fathers
Lives with child 51 42 36Non-resident fathers
Saw child in past year 88 78 72 Saw child in past month 63 55 51
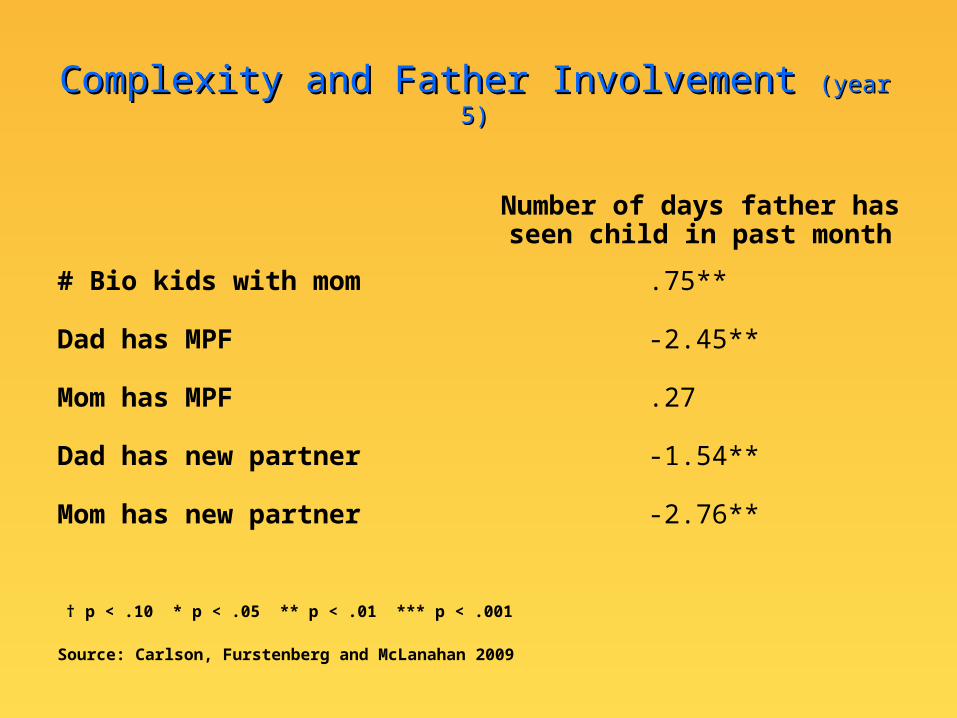
Complexity and Father Involvement Complexity and Father Involvement (year 5)(year 5)
† p < .10 * p < .05 ** p < .01 *** p < .001
Source: Carlson, Furstenberg and McLanahan 2009
Number of days father has seen child in past month
# Bio kids with mom .75**
Dad has MPF -2.45**
Mom has MPF .27
Dad has new partner -1.54**
Mom has new partner -2.76**
How do family structure and stability How do family structure and stability affect child wellbeing?affect child wellbeing?

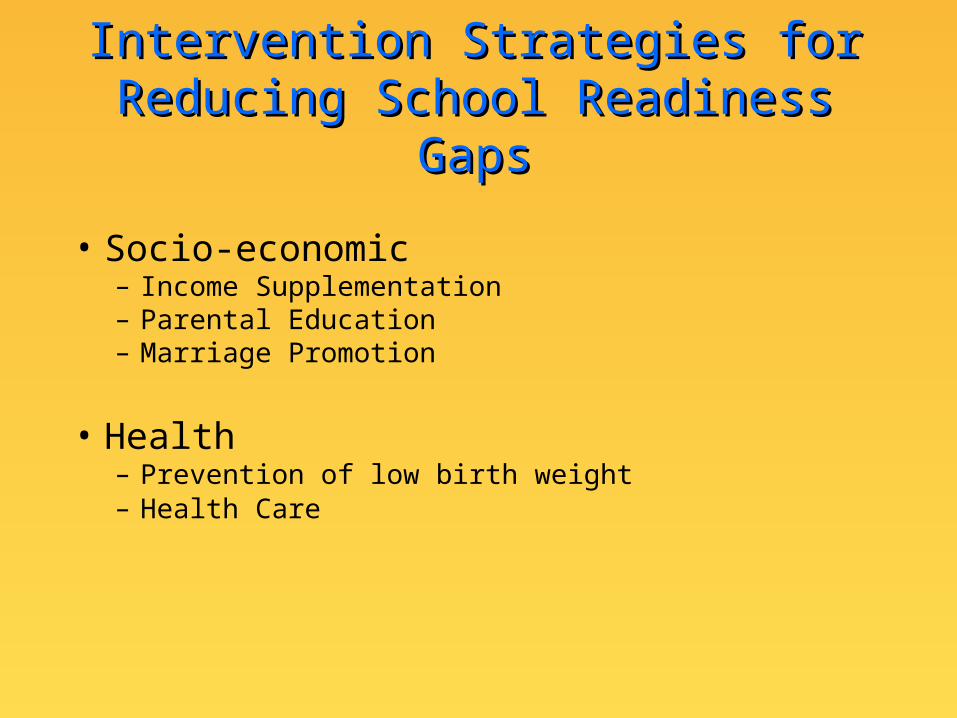
Intervention Strategies for Intervention Strategies for Reducing School Readiness GapsReducing School Readiness Gaps
• Socio-economic – Income Supplementation– Parental Education– Marriage Promotion
• Health– Prevention of low birth weight– Health Care
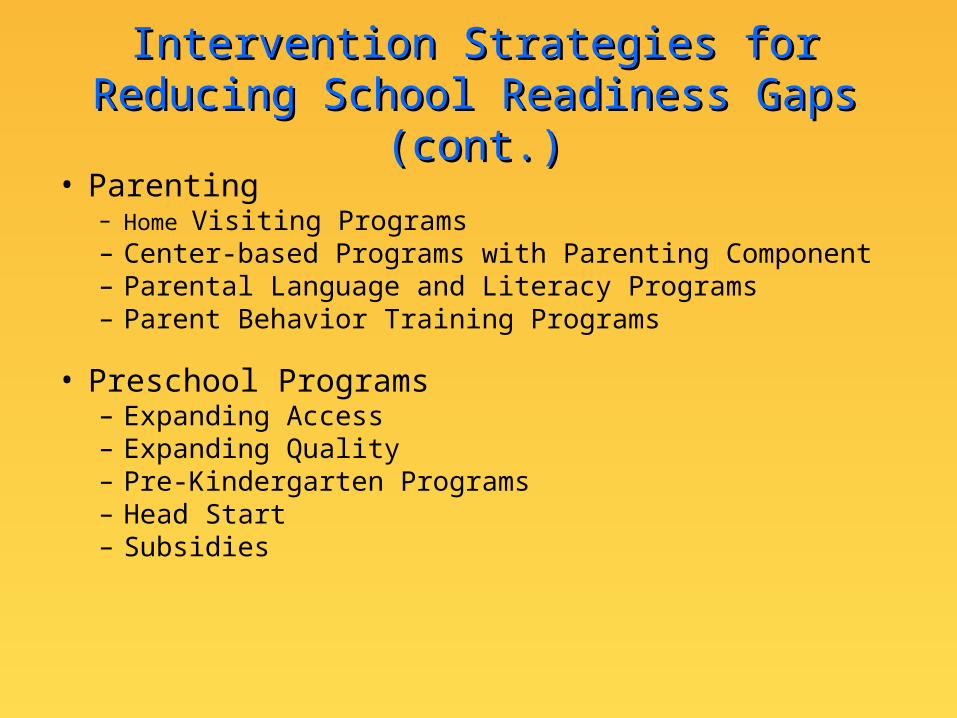
Intervention Strategies for Reducing Intervention Strategies for Reducing School Readiness Gaps (cont.)School Readiness Gaps (cont.)
• Parenting– Home Visiting Programs– Center-based Programs with Parenting Component– Parental Language and Literacy Programs– Parent Behavior Training Programs
• Preschool Programs– Expanding Access– Expanding Quality – Pre-Kindergarten Programs – Head Start – Subsidies
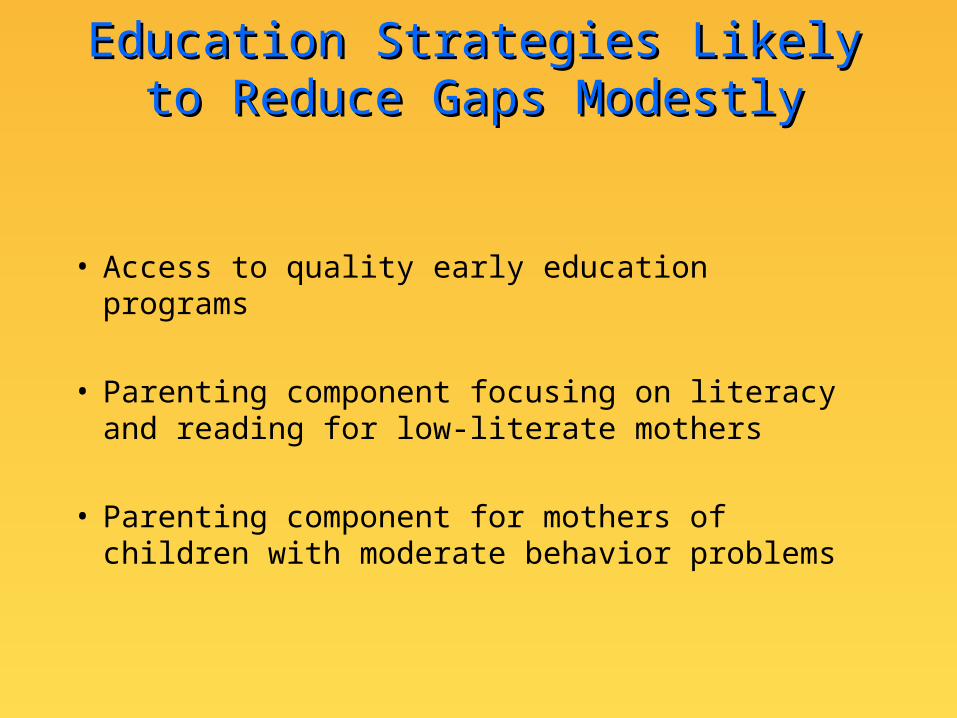
Education Strategies Likely to Education Strategies Likely to Reduce Gaps ModestlyReduce Gaps Modestly
• Access to quality early education programs
• Parenting component focusing on literacy and reading for low-literate mothers
• Parenting component for mothers of children with moderate behavior problems
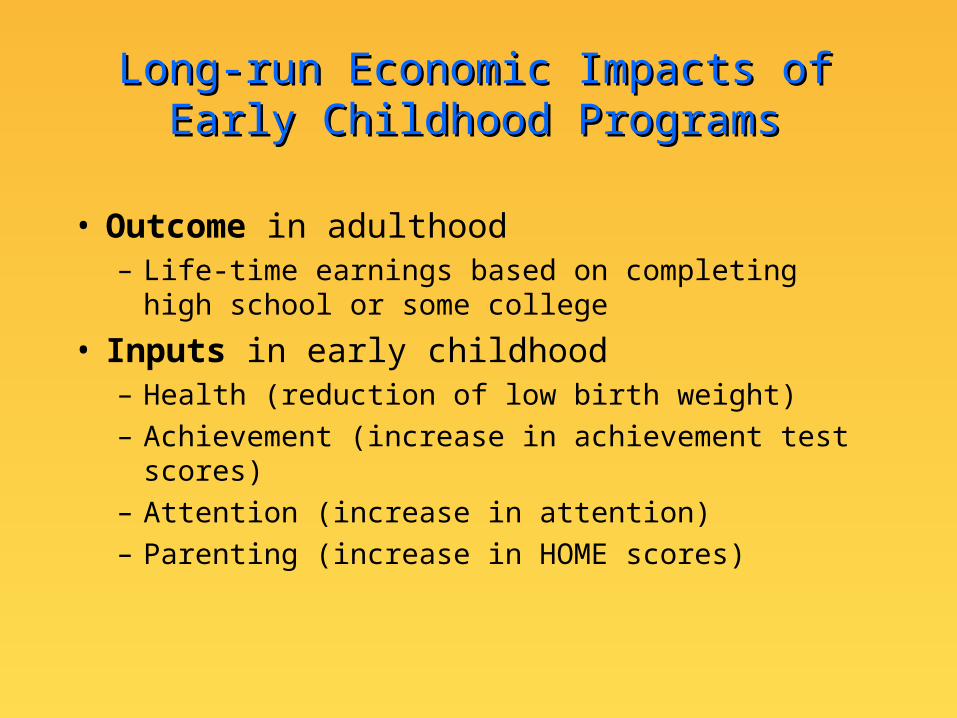
Long-run Economic Impacts of Early Long-run Economic Impacts of Early Childhood ProgramsChildhood Programs
• Outcome in adulthood– Life-time earnings based on completing high
school or some college
• Inputs in early childhood– Health (reduction of low birth weight)– Achievement (increase in achievement test
scores)– Attention (increase in attention)– Parenting (increase in HOME scores)
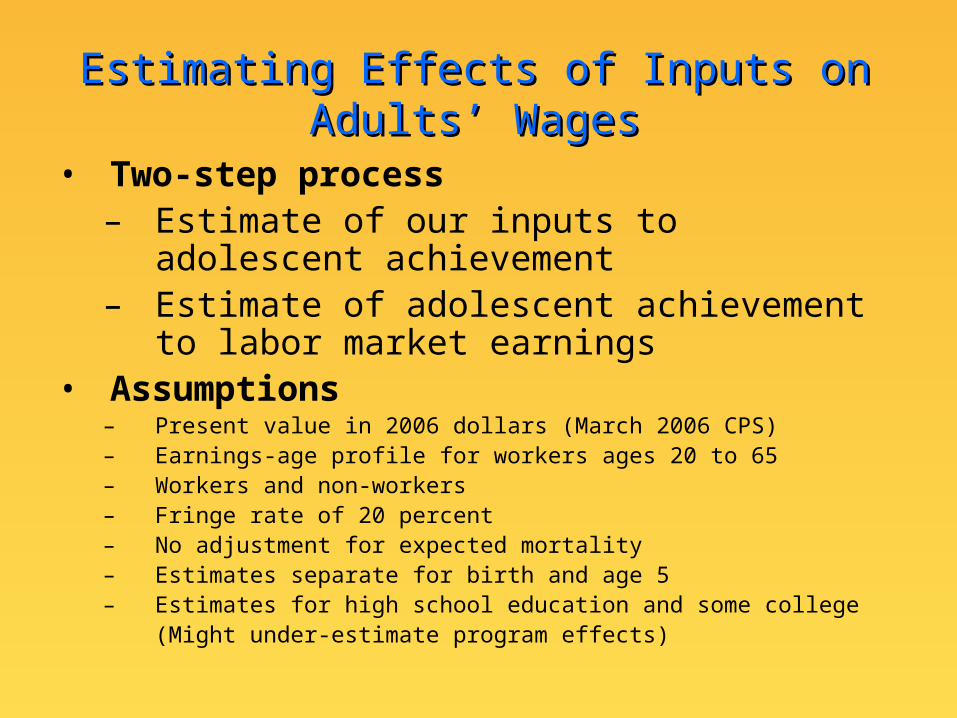
Estimating Effects of Inputs on Adults’ Estimating Effects of Inputs on Adults’ WagesWages
• Two-step process– Estimate of our inputs to adolescent
achievement– Estimate of adolescent achievement
to labor market earnings• Assumptions
– Present value in 2006 dollars (March 2006 CPS)– Earnings-age profile for workers ages 20 to 65– Workers and non-workers– Fringe rate of 20 percent– No adjustment for expected mortality– Estimates separate for birth and age 5– Estimates for high school education and some college
(Might under-estimate program effects)

Increasing Early Math and Reading Increasing Early Math and Reading SkillsSkills
• One SD increase in academic skills in adolescent is associated with 15% to 20% increase in LTE
• One SD increase in academic skills at ages 5-6 is associated with .16 (reading) & .22 (math) SD increase in youth achievement
• One SD increase in math and reading at ages 5-6 is associated with a .38 SD increase in youth achievement
• Close to the 80% fade-out of preschool program benefits (or, if both math & reading influenced, 60% fade-out)
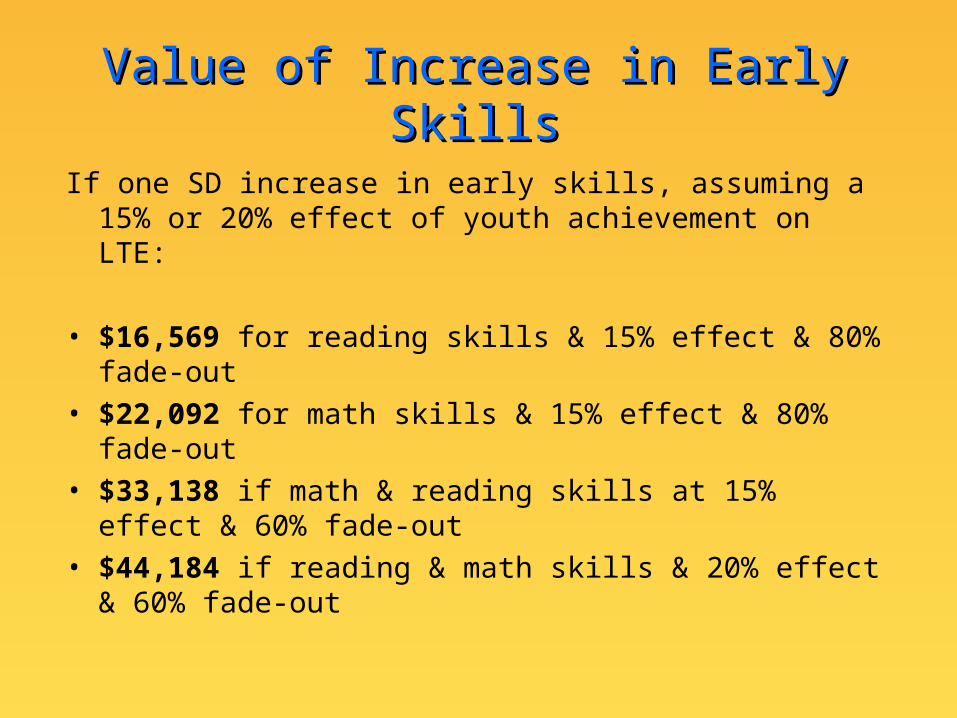
Value of Increase in Early SkillsValue of Increase in Early Skills
If one SD increase in early skills, assuming a 15% or 20% effect of youth achievement on LTE:
• $16,569 for reading skills & 15% effect & 80% fade-out
• $22,092 for math skills & 15% effect & 80% fade-out
• $33,138 if math & reading skills at 15% effect & 60% fade-out
• $44,184 if reading & math skills & 20% effect & 60% fade-out
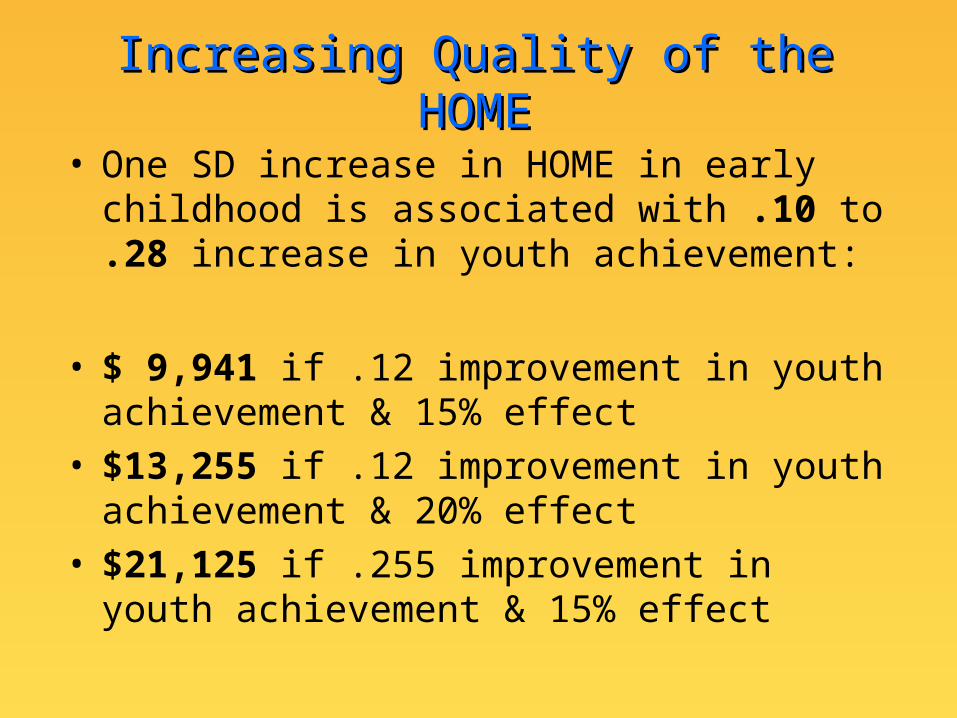
Increasing Quality of the HOMEIncreasing Quality of the HOME
• One SD increase in HOME in early childhood is associated with .10 to .28 increase in youth achievement:
• $ 9,941 if .12 improvement in youth achievement & 15% effect
• $13,255 if .12 improvement in youth achievement & 20% effect
• $21,125 if .255 improvement in youth achievement & 15% effect
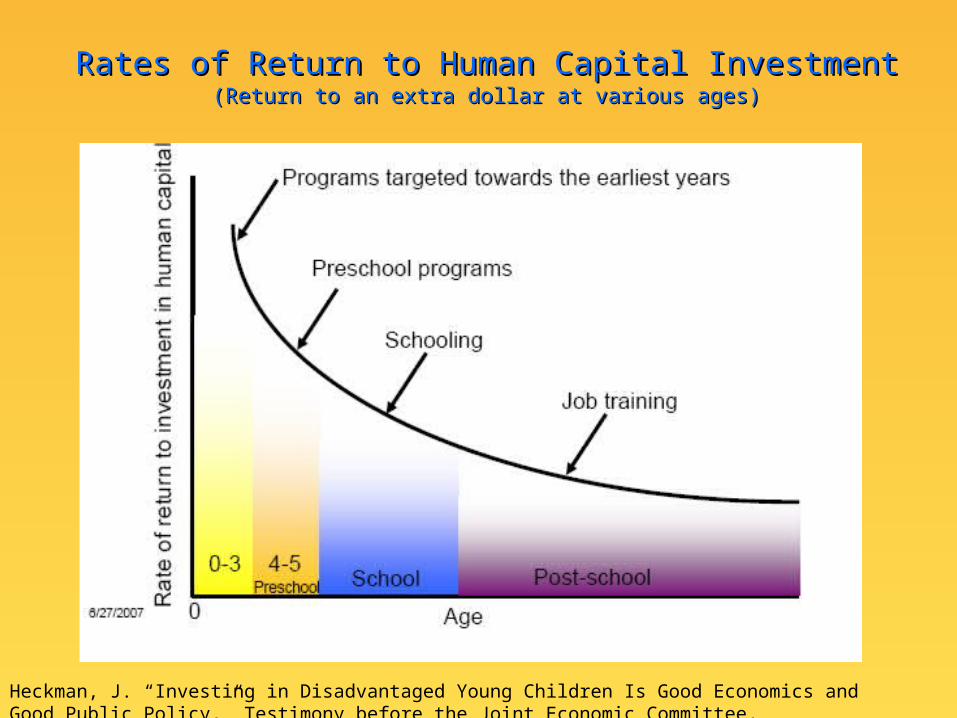
Heckman, J. “Investing in Disadvantaged Young Children Is Good Economics and Good Public Policy,” Testimony before the Joint Economic Committee, Washington D.C., June 27, 2007
Rates of Return to Human Capital InvestmentRates of Return to Human Capital Investment(Return to an extra dollar at various ages)(Return to an extra dollar at various ages)
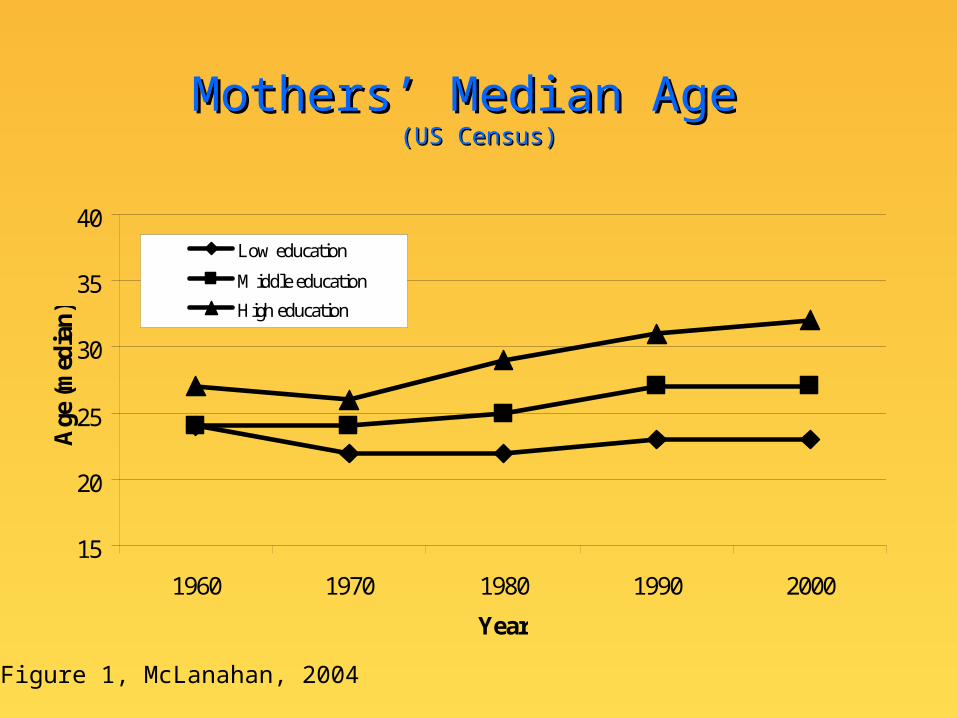
Mothers’ Median Age Mothers’ Median Age (US Census)(US Census)
15
20
25
30
35
40
1960 1970 1980 1990 2000
Year
Age
(m
edia
n)
Low education
Middle education
High education
Figure 1, McLanahan, 2004
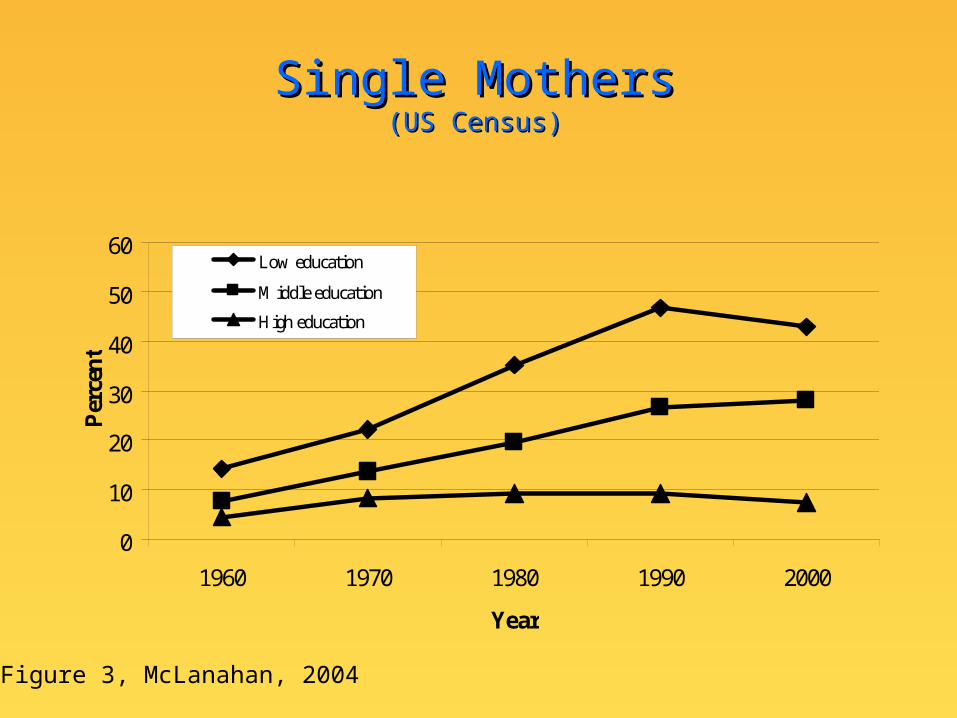
Single MothersSingle Mothers(US Census)(US Census)
0
10
20
30
40
50
60
1960 1970 1980 1990 2000
Year
Per
cen
t
Low education
Middle education
High education
Figure 3, McLanahan, 2004
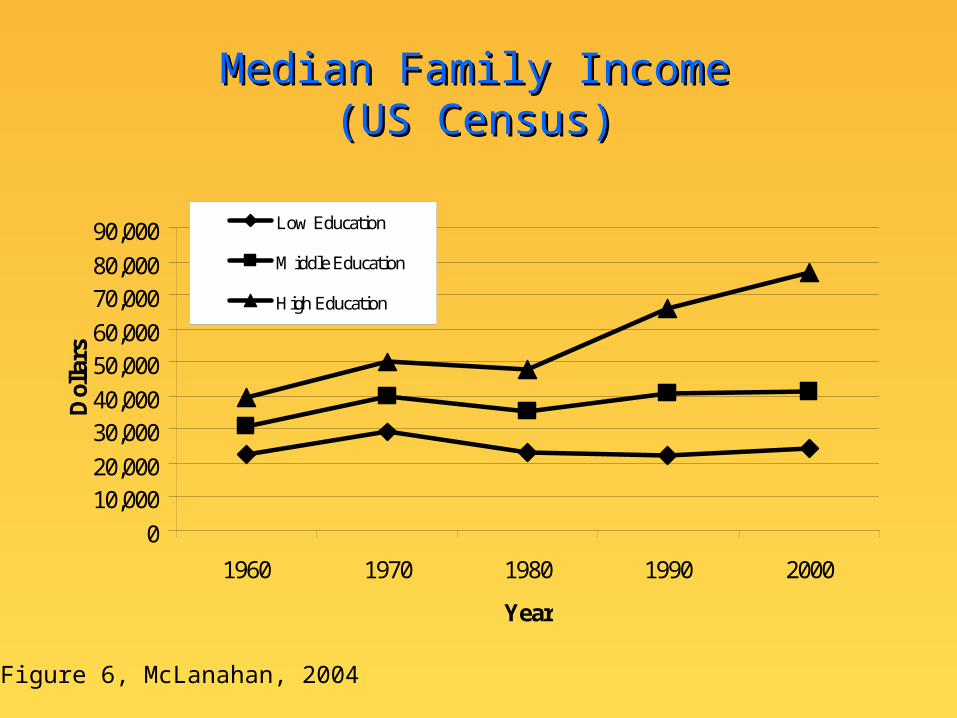
Median Family IncomeMedian Family Income(US Census)(US Census)
0
10,00020,000
30,00040,000
50,00060,000
70,00080,000
90,000
1960 1970 1980 1990 2000
Year
Dol
lars
Low Education
Middle Education
High Education
Figure 6, McLanahan, 2004
Thank YouThank You
National Institute of Child Health & Development (NICHD), California HealthCare Foundation, Commonwealth Fund, Ford Foundation, Foundation for Child Development, Fund for New Jersey, William T. Grant Foundation, Healthcare Foundation of New Jersey, William and Flora Hewlett Foundation, Hogg Foundation, Christina A. Johnson Endeavor Foundation, Kronkosky Charitable Foundation, Leon Lowenstein Foundation, John D. and Catherine T. MacArthur Foundation, A.L. Mailman Family Foundation, Charles S. Mott Foundation, National Science Foundation, David and Lucile Packard Foundation, Public Policy Institute of California, Robert Wood Johnson Foundation, St. David’s Hospital Foundation, St. Vincent Hospital and Health Services, and US Department of Health and Human Services (ASPE and ACF).