scholars journal of economics, business and management the
TRANSCRIPT
© 2020 Scholars Journal of Economics, Business and Management | Published by SAS Publishers, India 261
Scholars Journal of Economics, Business and Management
Abbreviated Key Title: Sch J Econ Bus Manag
ISSN 2348-8875 (Print) | ISSN 2348-5302 (Online)
Journal homepage: https://saspublishers.com/sjebm/
The Integrated Model for the Relationship between Banking Risks,
Liquidity, Capital Adequacy, and Profitability in Commercial Banks in
the Libyan West Salim Mohamed Alajili
1*, Tarq A. M. Mahmud
2, Abd Ussalam Mohamed Altunesi
3, Khalid Mustafa Mohsmmed Bin
Jumuah4
1Lecturer (Department of Business Administration) in Al-Marqab University 2Lecturer (financial department) in Al-Marqab University 3Lecturers (Department of Business Administration) in Al-Marqab University 4Lecturer (Department of Business Administration) in Al-Marqab University
DOI: 10.36347/sjebm.2020.v07i08.006 | Received: 07.07.2020 | Accepted: 21.07.2020 | Published: 22.08.2020
*Corresponding author: Salim Mohamed Alajili
Abstract Original Research Article
The essential aim of this study is to evaluate the influence of capital adequacy, liquidity, banking risk on bank
profitability. The relationships model was built based on liquidity and profitability theories and supported by previous
studies. Random sampling is adopted, 320 questionnaires among officers of banks were distributed and 270 out of
them were returned and valid for analysis. The findings revealed that liquidity don’t have any direct effect on
profitability, but it has indirect influence on profitability through banking risk since the mediation was complete. On
the contrary, in relation to financial risk, it has a direct impact on profitability and there is no significant indication
regarding its indirect impact. Moreover, the results referred that both market risk and liquidity risk had positive
significant effects on return on assets, whiles other factors did not support any influence. The study recommends the
use of mediator and non-quantitative factors such as the reputation of the bank, customer and employee satisfaction,
confidence in the direction of the bank in order to improve the profitability of banks.
Keywords: liquidity, banking risk, influence, banks. Copyright @ 2020: This is an open-access article distributed under the terms of the Creative Commons Attribution license which permits unrestricted
use, distribution, and reproduction in any medium for non-commercial use (NonCommercial, or CC-BY-NC) provided the original author and source
are credited.
INTRODUCTION This study examines the effect of bank capital,
bank liquidity and credit risk on the profitability of
commercial banks in the Libyan west from perspective
of officials and executives in those banks. The available
literature on the topic includes theoretical and
experimental discrepancies, consequently misleading
interested in this filed. The findings of past analyses
indicate that the effect of credit risk on the profitability
of banks is not clear; it may be positive or negative.
Theoretically, a bank that takes higher credit risk, it
normally earns a higher profit. In contrast, the
profitability of bank may drop when it management
fails to collect the loans. Further, the previous findings
of relationship between bank liquidity and profitability
referred to be inverse. Meaning, banks which keep a
greater amount of liquid assets they lose the profits in
term of opportunity costs [1]. In same line, capital
theory suggests that bank capital is one of the key
determinants of profitability increase and decrease,
since the high level of bank’s capital enhances trust of
the public about the soundness of the bank. Therefore,
this study aims to provide new insights based on
empirical findings.
The significance of the under-consideration
subject is clearly manifested by reviewing the opinions
of managers in the banks to arrive at a model that
logically explains the chronological arrangement of the
relationships under study. Moreover, and through a
critical review of previous studies that dealt with the
relationships among Bank’s Credit Risk, Liquidity, and
Capital Adequacy towards its Profitability such as, [1-
4]. Amaliah and Hassan (2019), Bassey, Tobi, Bassey,
and Ekwere (2016), and Abbas, Iqbal, and Aziz’s
(2019) works that included the direct relationships
ignoring the indirect impacts. Thus, this study will
examine direct and indirect models. The best model is
recommended that explains the profitability better than
others.
However, in last global financial crisis (2007-
2008), The Basel Committee on Banking Supervision
(BCBS) formulated new regulations. For example, the
Salim Mohamed Alajili et al., Sch J Econ Bus Manag, August, 2020; 7(8): 261-274
© 2020 Scholars Journal of Economics, Business and Management | Published by SAS Publishers, India 262
BCBS regulators recommend that financial institutions
be required to maintain a higher proportion of capital
and liquid assets. Accordingly, financial institutions
have to bear a heavy cost in terms of lower profitability
and slower economic activities.
This study highlights the effect of the liquidity,
banking risk, and capital Adequacy on the profitability
from perspective of managers and officials in
commercial banks in west Libya. In this study, the
questionnaire is established to measure the variables of
the study. Moreover, the authors try to extend the set of
relationships to include the influence of the four
dimensions of banking risk on the two dimensions of
profitability, thus this study could be the first in this
aria.
The findings of this study provide constructive
feedback to interestedabout the effect of banking risk,
liquidity and capital on profitability for further
decision-making and regulations.
The Problem Statement
Banks are seeking to maximize their expected
profits on investments, and at the same time they should
be ready to meet the obligations of their clients and
depositors who want to withdraw their savings. Today,
Libya is undergoing fragile economic, security, political
and social conditions. These issues affected the
performance of the Libyan institutions in general and
the banking sector in particular. Therefore, the problem
arises when the Bank is not able to meet these demands,
especially those unexpected ones, which may embarrass
the bank with its clients and may lose their trust over
the time, in light of the intensive competition in the
banking sector resulting from the increasing number of
local banks, as well as intensive competition from the
foreign banks that work in the local banking market.
RESEARCH OBJECTIVES This paper aims at investigating the influence of
the banking risk, liquidity, and capital adequacy on
profitability in the Libyan commercial banks,
considering the mediating role of the study variables.
LITERATURE REVIEW This research presents some of the previous
studies about the effect of banking risk, liquidity, and
capital adequacy on banks' profitability, and an
analytical view in order to identify the similarities and
differences between them and what the current study
offers in this regard.
Profitability
Profitability is the ability to make profit from the
overall business activities [3 Profitability defined as
“the ability of a given investment to earn a return from
its use”, 5]. Profitability consists of profit and ability.
Profit refers to an absolute amount of income generated
by the company within a period of time, while ability
indicates the power of a business entity to earn profits
[5].
Profitability can be measured using the
profitability ratio. Return on assets (ROA) and Return
on Equity (ROE) are the most important earnings ratios
used in assessing the bank profitability. The ROA ratio
measures the efficiency of a firm at generating profits
from each unit of shareholder equity, also known as net
assets or assets minus liabilities. While, ratio measures
the efficiency of a firm at generating profits from each
unit of shareholder equity, also known as net assets or
assets minus liabilities [6].
Capital adequacy
Capital adequacy is “the minimum reserves of
capital that the bank must have available [3, 7]” stated
that capital adequacy promote he strength of the bank
and improve the solvency of the bank because it works
to absorb unexpected expenses. Practically, adequate
capital prevents the bank failure by absorbing the losses
and provides a protection versus the insolvency and
liquidation arising from the risks. Therefore, capital
adequacy ensures that the bank is still on operation and
be able to sustain in the market and provides a
confidence that the bank is safe and is able to pay them
on demand [3].
Liquidity
Banks can only work under the state of adequate
liquidity. Banks seek to keep balanced cash in the vault
and do not allow excess liquidity. Accordingly, the
banks have to efficiently manage their liquidity in order
to maximized revenues while holding risks of
insolvency at a desired level. Liquidity is the ability to
pay on demand. It is an ability of the bank to increase
the funds and meet its short-term obligation without
incurring unreasonable loss [4]. Therefore, efficient and
effective liquidity management is crucial if the survival
and prosperity of organizations firms is to be assured.
There are a number of liquidity management
theories, as follows: First of all, The Liquid Asset
Theory which suggests that banks should maintain large
pool short-term asset in order to meet their short term
obligation as they mature. The second is Commercial
Loan Theory in which states that lending should be on
short-term because most deposits are also in short-term
[4].
Third is Liability Management Theory. This
theory states that there is no need to follow old liquidity
norms like maintaining liquid assets, liquid investments
etc, but considering both sides of a bank’s balance sheet
as sources of liquidity [8]. Lastly, Anticipated Loan
Theory in which concentrates on the earning strength
and the credit worthiness of the borrower as the main
source of bank liquidity. The anticipated income theory
encouraged bankers to treat long-term loans as potential
sources of liquidity. In this regard, these loans are
Salim Mohamed Alajili et al., Sch J Econ Bus Manag, August, 2020; 7(8): 261-274
© 2020 Scholars Journal of Economics, Business and Management | Published by SAS Publishers, India 263
typically paid off by the borrower in a series of
installments [8].
Banking Risk
Major risks for banks include credit, operational,
market, and liquidity risk [9]. Credit risk is the biggest
risk for banks. Although, the credit function of banks
enhances the ability of investors to exploit desired
profitable ventures, it exposes the banks to credit risk
[10].
Credit risk occurs when borrowers or
counterparties fail to meet contractual obligations in
accordance with agreed terms [11]. Credit risk takes
several shapes such as loans, acceptances, interbank
transactions, trade financing, foreign exchange
transactions, financial futures, swaps, bonds, and
equities [12]. The Basel committee on Banking
Supervision reported that the lenient on credit standard
for the borrowers is the main causes that lead to credit
risk [3]. Moreover, [10] suggested that the poor
management, inappropriate credit policies, fluctuation
of the interest rate, low capital and liquidity level,
inappropriate credit assessment, poor lending practices,
poor loan underwriting, government interference, and
inadequate supervision by the central bank are major
factors that leads to credit risk.
Credit risk is measured by several indicators,
which are: nonperforming loan ratio, nonperforming
loan to loan advance ratio, total loan and advance to
total deposit ratio, and loan loss provision to classified
loan ratio [3]. The most commonly used in literature is
nonperforming loan to total loan ratio, where non-
performing loans is a major threat in banking sector and
will directly affect the performance of the bank due to
the bad loans.
There are several types of market risks. They are
equity risk, Forex risks, and commodity risks. Equity
risk occurs when the banks are holding a large amount
of equity. Forex risks happen when the banks hold
foreign exchange. A commodity risk occurs when the
banks lend against commodities like gold, silver and
real estate. For facing these risks, banks have to use
hedging contracts. Hence, the banks use financial
derivatives which are freely available for sale in any
financial market. Using contracts like forwards, options
and swaps, banks are able to almost eliminate market
risks from their balance sheet.
Lastly, liquidity risk which is the inability of the
bank to provide duo to the banks were not fully taking
into account the importance of liquidity management
[3]. According to this definition, liquidity risk has two
essential dimensions which are liquidating the assets as
and when required; and at a fair market value [13]. In
literature, there are several source of liquidity risk [14]
revealed that the extensive commitment based, and
long-term lending may create serious liquidity issues. In
addition, [13] reported that credit risk also leads to the
vulnerability of liquidity, and therefore, non-
performance lone reduces the liquidity of the banks.
HYPOTHESES OF THE STUDY The Relationship between Bank Capital and
Profitability
Olalekan A, Adeyinka S [15] revealed a non-
significant relationship between capital adequacy and
profitability of bank for the primary data analysis. In the
relation of capital adequacy as a determinant of
profitability of banks [16] revealed that a high capital
adequacy ratio should signify a bank that is operating
over-cautiously and ignoring potentially profitable
trading opportunities. Accordingly, a negative
relationship is between equity to asset ratio and bank
profitability [15]. Suggested that the direction of the
relationship between bank capital and bank profitability
cannot be unanimously predicted in advance. This leads
to the first hypothesis:
Bank Capital does not impact on profitability of Libyan
commercial banks.
The Relationship between Bank Liquidity and
Profitability in Banking
The findings of studies that examined the
relationship between liquidity and profitability led to
conflicting results [17] argued that banks which have
well-various lending portfolio gathered higher profits
along with higher liquidity [18]. Detected that liquidity
has a positive influence on bank profitability. This is
duo to the higher liquid assets reduce the illiquidity and
financing cost of banks [19]. On the other hand [20],
appeared that liquidity (total loans to total deposit ratio)
has a positive influence on profitability in case of net
interest margin.
Unlike, [21] revealed that the relationship
liquidity and profitability was negative. Olalekan , A.,
& Adeyinka , S. [16] supported the negative
relationship. In this context, [22] opines that the banks
which create higher liquidity gain lower profits. More
important, [1] reported that the impact of liquidity on
the profitability of the USA large commercial banks is
negative and positive on Asian developed economies
commercial banks in the post crisis era. Moreover, the
results of [23] study revealed that there is a significant
impact of only liquid ratio on return on assets while
insignificant on return on equity and return on
investment. This leads to the second hypothesis:
Bank Liquidity affects profitability of Libyan
commercial banks.
The Relationship between Banking Risk and
Profitability
There is some degree of correlation between risk
and profit. The relationship between risk and profit
varies depending on economists or stock brokers [12].
Salim Mohamed Alajili et al., Sch J Econ Bus Manag, August, 2020; 7(8): 261-274
© 2020 Scholars Journal of Economics, Business and Management | Published by SAS Publishers, India 264
Results of [24] study pointed out a negative relationship
between less prudent lending (which may be interpreted
as a positive effect of more prudent lending) and net
interest margin [25]. Found a negative relationship
between equity levels and credit risk. In another study
[26], revealed that the liquidity risk has positive while
credit risk, insolvency risk and competition hurt
negatively the profitability of Pakistani banks.
In addition, Kolapo et al. also find a negative
relationship between credit risk and the profitability on
5 Nigerian commercial banks over 2000-2010 [27].
Ruziqa A [28] investigates the joint effect of
credit risk and liquidity risk on the profitability of large
banks of Indonesia and finds negative effect of credit
risk and positive effect of liquidity risk on the
profitability. This leads to the third hypothesis:
Banking Risk impacts on profitability of Libyan
commercial banks
METHODOLOGY Most of past studies used financial ratios for
determining the effect of credit risk on profitability.
However, the extent of those studies does not reach at
any conclusive evidence regarding the effect of credit
risk on profitability of the banks [3]. Therefore, this
study tries to measure the relationships among the
variables from perspective of officials and executives of
Libyan banks.
A questionnaire was used to data collection. The
questionnaire was designed to measure study variables
by the authors. It consists of 42 items, since 22 of them
measure banking risk which both credit risk and
operational risk involve on 5 items, 5 items for market
risk, while liquidity risk includes 7 items. In addition,
liquidity involves on 7 items, and lastly, profitability
was measured by 13 items.
The questionnaire was randomly distributed to
320 respondents of bank’s officers. The participants
belong to the four largest commercial banks in western
Libya. Those banks are Sahara Bank, Al-Wahda Bank,
Al- Gumhouria Bank, and National Commercial Bank.
40 questionnaires were excluded from the analysis.
SPSS version 22 was used to describe the study
population, conducting exploratory factor analysis and
reliability, while Amos used the 22 version to test the
hypotheses.
Analytic strategy
Data for this study were simple, multiple, and
hierarchical in nature. Therefore, multiple and
hierarchical linear modelling were used to account for
the nested nature of our data [29]. To find the best
model of the relationships among study’s variables, two
scenarios were employed. First scenario is to examine
direct impact by the multiple regressions. The second is
to test the indirect relationships that occur in existence a
mediator variable.
Exploratory Factor Analysis
Exploratory Factor Analysis (EFA) was used to
reduce the data having redundancy with each other by
way of Principal Component Analysis (PCA). The
EFA was performed several times for all the indicators
separately. The last analysis was done for all items
combined. The results of analysis revealed that five
items of banking risk, four items of liquidity, two
capital adequacy, and five items of profitability were
removed due to lower value of communalities for some
items than .6 or because some items are loaded for two
factors. Moreover, the value of Kaiser Meyer Olkin
(KMO) for all constraints exceeds the recommended
value of KMO that is 0.6 [30] as it is shown in Table 1.
In the other words, the adequacy of the sample has been
achieved.
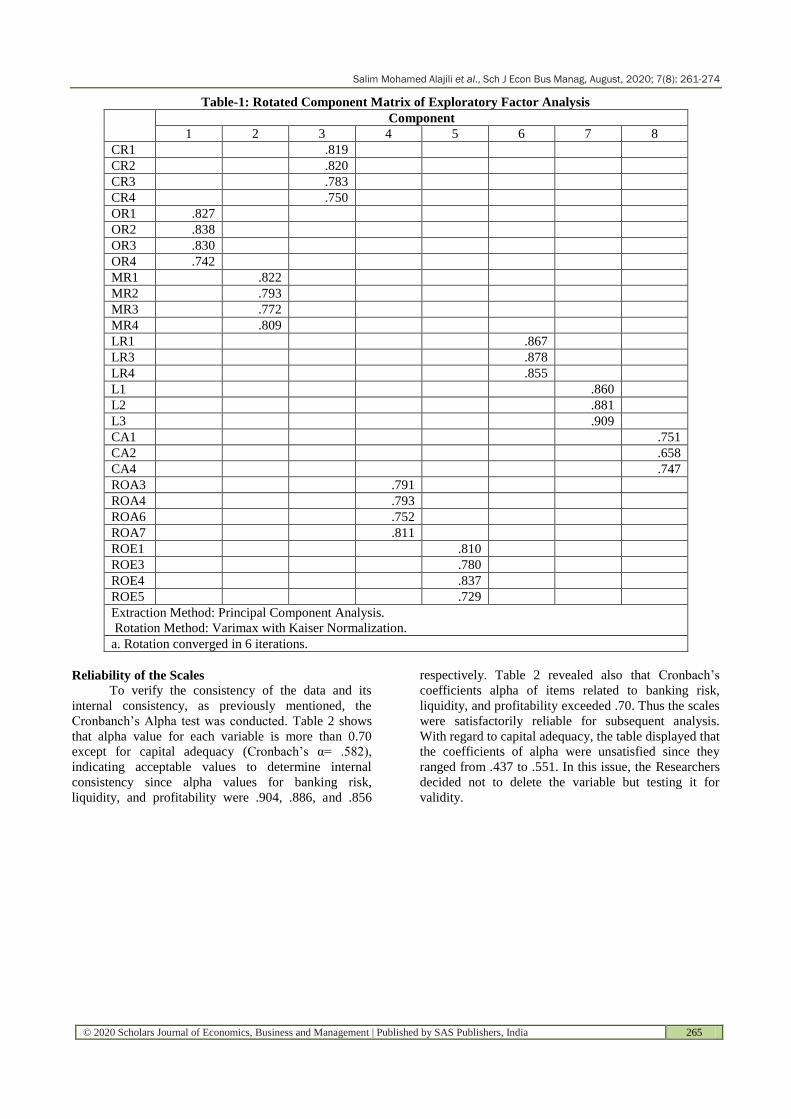
Table 1 showed that banking risk was loaded by
four factors which are Credit Risk (CR) (CR1 to CR4),
Operational Risk (OP) (OP1 to OP4), Market Risk
(MR) (MR1 to MR4), and Liquidity Risk (LR) (LR1,
LR3, LR4). On the other hand, profitability was loaded
by two factors which are Return on Assess (ROA)
including items (ROA3, ROA4, ROA6, ROA7), and
Return on Equity (ROE) involving items (ROE1,
ROE3, ROE4, ROE5). Whiles, liquidity by items (L1,
L2, L3) and capital adequacy by items (CA1, CA2,
CA4) were loaded by one factor for each.
Salim Mohamed Alajili et al., Sch J Econ Bus Manag, August, 2020; 7(8): 261-274
© 2020 Scholars Journal of Economics, Business and Management | Published by SAS Publishers, India 265
Table-1: Rotated Component Matrix of Exploratory Factor Analysis
Component
1 2 3 4 5 6 7 8
CR1 .819
CR2 .820
CR3 .783
CR4 .750
OR1 .827
OR2 .838
OR3 .830
OR4 .742
MR1 .822
MR2 .793
MR3 .772
MR4 .809
LR1 .867
LR3 .878
LR4 .855
L1 .860
L2 .881
L3 .909
CA1 .751
CA2 .658
CA4 .747
ROA3 .791
ROA4 .793
ROA6 .752
ROA7 .811
ROE1 .810
ROE3 .780
ROE4 .837
ROE5 .729
Extraction Method: Principal Component Analysis.
Rotation Method: Varimax with Kaiser Normalization.
a. Rotation converged in 6 iterations.
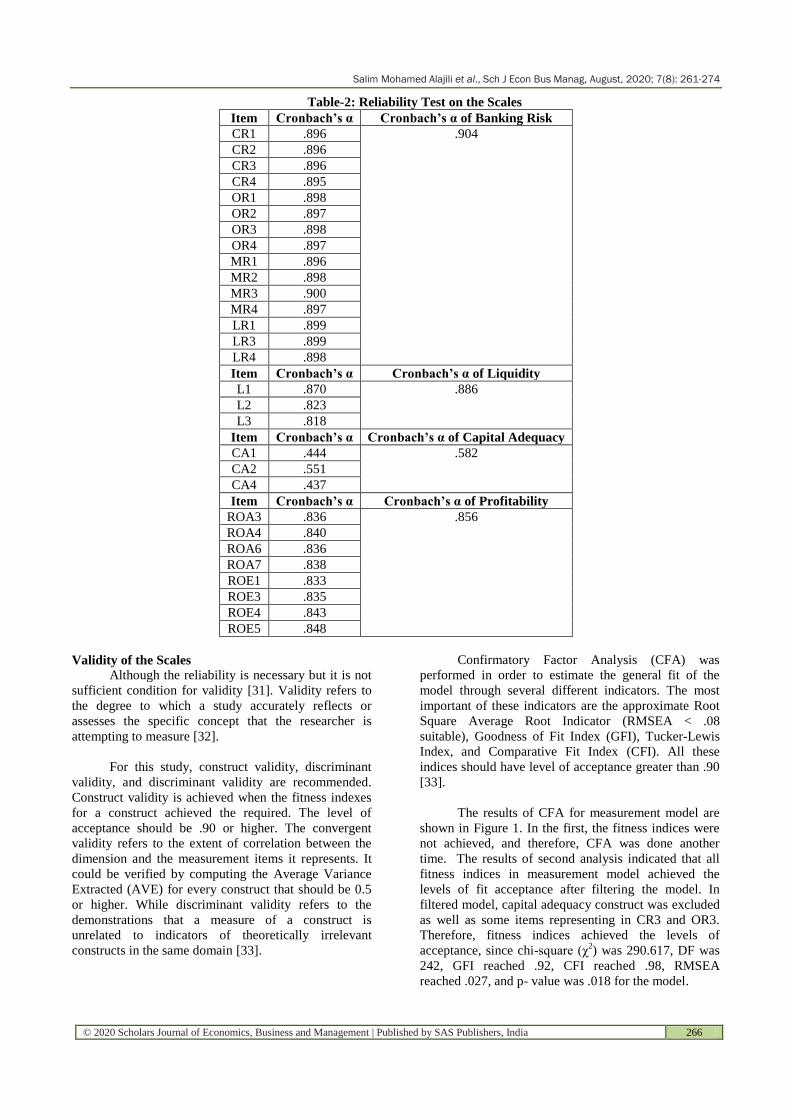
Reliability of the Scales
To verify the consistency of the data and its
internal consistency, as previously mentioned, the
Cronbanch’s Alpha test was conducted. Table 2 shows
that alpha value for each variable is more than 0.70
except for capital adequacy (Cronbach’s α= .582),
indicating acceptable values to determine internal
consistency since alpha values for banking risk,
liquidity, and profitability were .904, .886, and .856
respectively. Table 2 revealed also that Cronbach’s
coefficients alpha of items related to banking risk,
liquidity, and profitability exceeded .70. Thus the scales
were satisfactorily reliable for subsequent analysis.
With regard to capital adequacy, the table displayed that
the coefficients of alpha were unsatisfied since they
ranged from .437 to .551. In this issue, the Researchers
decided not to delete the variable but testing it for
validity.
Salim Mohamed Alajili et al., Sch J Econ Bus Manag, August, 2020; 7(8): 261-274
© 2020 Scholars Journal of Economics, Business and Management | Published by SAS Publishers, India 266
Table-2: Reliability Test on the Scales
Item Cronbach’s α Cronbach’s α of Banking Risk
CR1 .896 .904
CR2 .896
CR3 .896
CR4 .895
OR1 .898
OR2 .897
OR3 .898
OR4 .897
MR1 .896
MR2 .898
MR3 .900
MR4 .897
LR1 .899
LR3 .899
LR4 .898
Item Cronbach’s α Cronbach’s α of Liquidity
L1 .870 .886
L2 .823
L3 .818
Item Cronbach’s α Cronbach’s α of Capital Adequacy
CA1 .444 .582
CA2 .551
CA4 .437
Item Cronbach’s α Cronbach’s α of Profitability
ROA3 .836 .856
ROA4 .840
ROA6 .836
ROA7 .838
ROE1 .833
ROE3 .835
ROE4 .843
ROE5 .848
Validity of the Scales
Although the reliability is necessary but it is not
sufficient condition for validity [31]. Validity refers to
the degree to which a study accurately reflects or
assesses the specific concept that the researcher is
attempting to measure [32].
For this study, construct validity, discriminant
validity, and discriminant validity are recommended.
Construct validity is achieved when the fitness indexes
for a construct achieved the required. The level of
acceptance should be .90 or higher. The convergent
validity refers to the extent of correlation between the
dimension and the measurement items it represents. It
could be verified by computing the Average Variance
Extracted (AVE) for every construct that should be 0.5
or higher. While discriminant validity refers to the
demonstrations that a measure of a construct is
unrelated to indicators of theoretically irrelevant
constructs in the same domain [33].
Confirmatory Factor Analysis (CFA) was
performed in order to estimate the general fit of the
model through several different indicators. The most
important of these indicators are the approximate Root
Square Average Root Indicator (RMSEA < .08
suitable), Goodness of Fit Index (GFI), Tucker-Lewis
Index, and Comparative Fit Index (CFI). All these
indices should have level of acceptance greater than .90
[33].
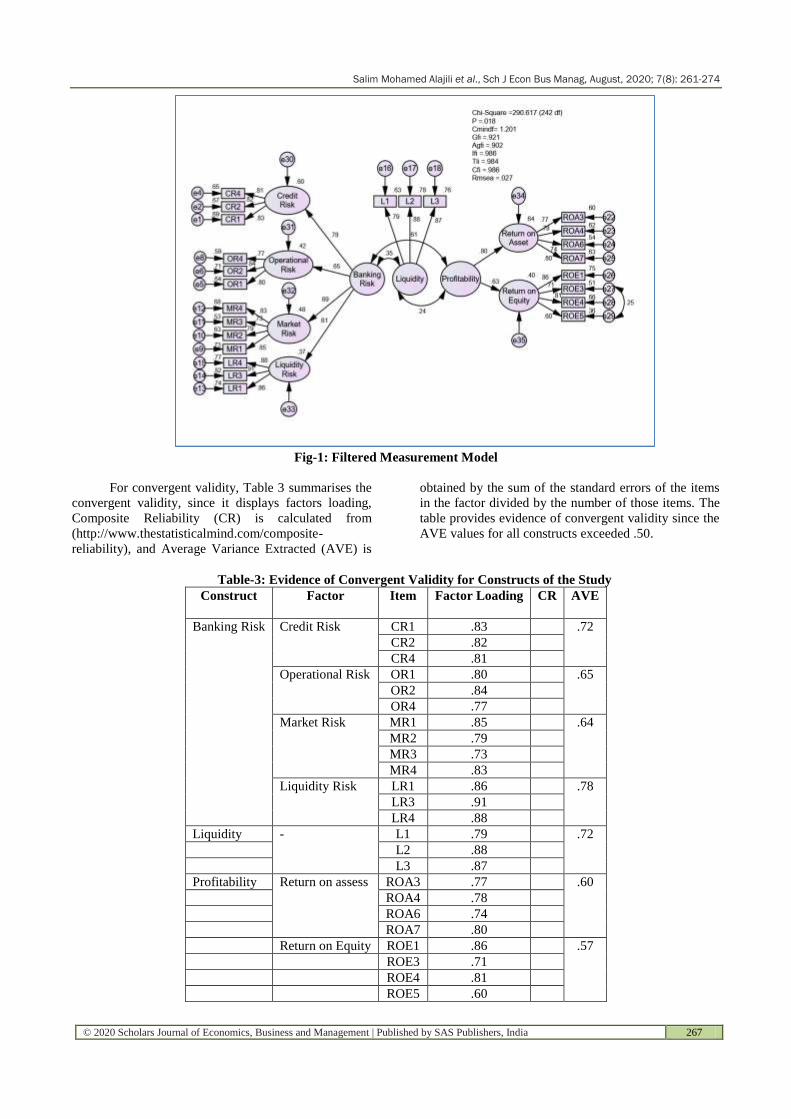
The results of CFA for measurement model are
shown in Figure 1. In the first, the fitness indices were
not achieved, and therefore, CFA was done another
time. The results of second analysis indicated that all
fitness indices in measurement model achieved the
levels of fit acceptance after filtering the model. In
filtered model, capital adequacy construct was excluded
as well as some items representing in CR3 and OR3.
Therefore, fitness indices achieved the levels of
acceptance, since chi-square (χ2) was 290.617, DF was
242, GFI reached .92, CFI reached .98, RMSEA
reached .027, and p- value was .018 for the model.
Salim Mohamed Alajili et al., Sch J Econ Bus Manag, August, 2020; 7(8): 261-274
© 2020 Scholars Journal of Economics, Business and Management | Published by SAS Publishers, India 267
Fig-1: Filtered Measurement Model
For convergent validity, Table 3 summarises the
convergent validity, since it displays factors loading,
Composite Reliability (CR) is calculated from
(http://www.thestatisticalmind.com/composite-
reliability), and Average Variance Extracted (AVE) is
obtained by the sum of the standard errors of the items
in the factor divided by the number of those items. The
table provides evidence of convergent validity since the
AVE values for all constructs exceeded .50.
Table-3: Evidence of Convergent Validity for Constructs of the Study
Construct Factor Item Factor Loading CR
AVE
Banking Risk Credit Risk CR1 .83 .72
CR2 .82
CR4 .81
Operational Risk OR1 .80 .65
OR2 .84
OR4 .77
Market Risk MR1 .85 .64
MR2 .79
MR3 .73
MR4 .83
Liquidity Risk LR1 .86 .78
LR3 .91
LR4 .88
Liquidity - L1 .79 .72
L2 .88
L3 .87
Profitability Return on assess ROA3 .77 .60
ROA4 .78
ROA6 .74
ROA7 .80
Return on Equity ROE1 .86 .57
ROE3 .71
ROE4 .81
ROE5 .60
Salim Mohamed Alajili et al., Sch J Econ Bus Manag, August, 2020; 7(8): 261-274
© 2020 Scholars Journal of Economics, Business and Management | Published by SAS Publishers, India 268
For discriminant validity, two conditions should
be met which are: a) Foreter and Larker’s criterion
which refers to the Average Variance Extracted (AVE)
is greater than Common Variance (CV); b) Composite
Reliability (CR) greater than Average Variance
Extracted (AVE). The discriminant validity is explained
in Table 4.
In Table 4, the diagonal values (in bold) is the
square root of AVE of the construct while other values
are the correlation among constructs. It is clear that
AVE greater than common variance and therefore,
discriminant validity is achieved for all constructs.
Table-4: Discriminant Validity using Foreter and Larker Criteria
Construct Banking Risk Liquidity Profitability
Banking Risk .82
Liquidity .35 .82
Profitability .61 .24 .76
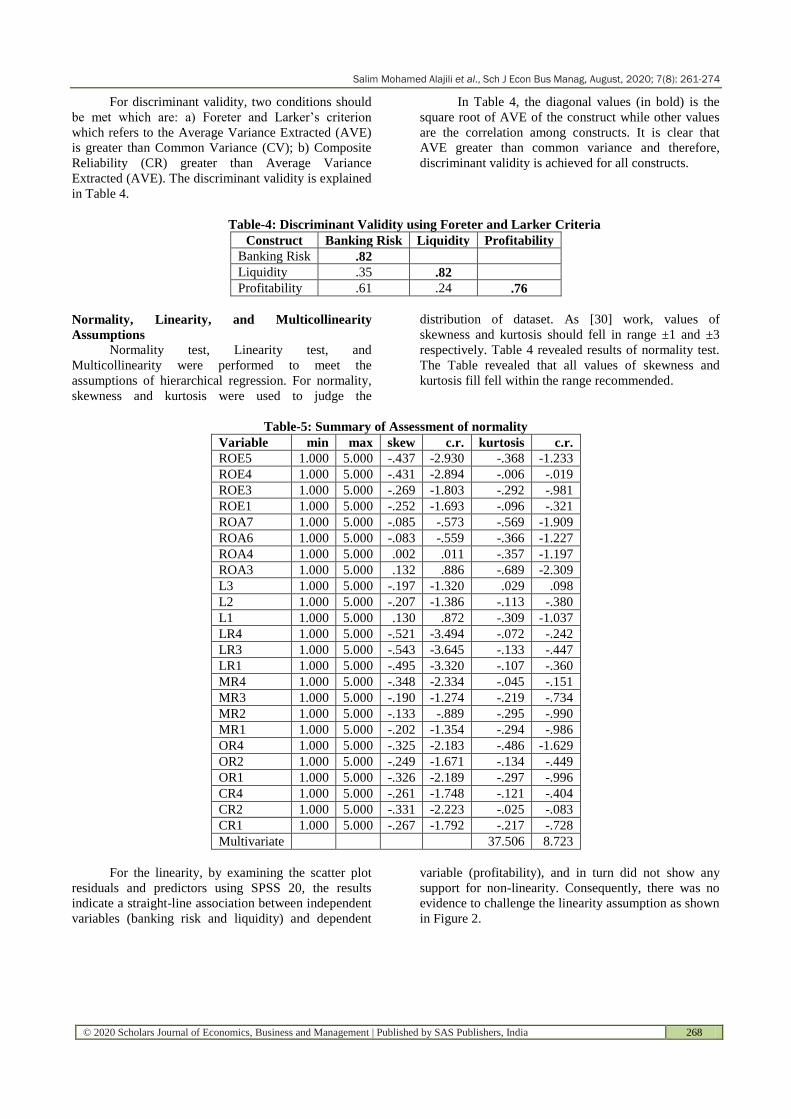
Normality, Linearity, and Multicollinearity
Assumptions
Normality test, Linearity test, and
Multicollinearity were performed to meet the
assumptions of hierarchical regression. For normality,
skewness and kurtosis were used to judge the
distribution of dataset. As [30] work, values of
skewness and kurtosis should fell in range ±1 and ±3
respectively. Table 4 revealed results of normality test.
The Table revealed that all values of skewness and
kurtosis fill fell within the range recommended.
Table-5: Summary of Assessment of normality
Variable min max skew c.r. kurtosis c.r.
ROE5 1.000 5.000 -.437 -2.930 -.368 -1.233
ROE4 1.000 5.000 -.431 -2.894 -.006 -.019
ROE3 1.000 5.000 -.269 -1.803 -.292 -.981
ROE1 1.000 5.000 -.252 -1.693 -.096 -.321
ROA7 1.000 5.000 -.085 -.573 -.569 -1.909
ROA6 1.000 5.000 -.083 -.559 -.366 -1.227
ROA4 1.000 5.000 .002 .011 -.357 -1.197
ROA3 1.000 5.000 .132 .886 -.689 -2.309
L3 1.000 5.000 -.197 -1.320 .029 .098
L2 1.000 5.000 -.207 -1.386 -.113 -.380
L1 1.000 5.000 .130 .872 -.309 -1.037
LR4 1.000 5.000 -.521 -3.494 -.072 -.242
LR3 1.000 5.000 -.543 -3.645 -.133 -.447
LR1 1.000 5.000 -.495 -3.320 -.107 -.360
MR4 1.000 5.000 -.348 -2.334 -.045 -.151
MR3 1.000 5.000 -.190 -1.274 -.219 -.734
MR2 1.000 5.000 -.133 -.889 -.295 -.990
MR1 1.000 5.000 -.202 -1.354 -.294 -.986
OR4 1.000 5.000 -.325 -2.183 -.486 -1.629
OR2 1.000 5.000 -.249 -1.671 -.134 -.449
OR1 1.000 5.000 -.326 -2.189 -.297 -.996
CR4 1.000 5.000 -.261 -1.748 -.121 -.404
CR2 1.000 5.000 -.331 -2.223 -.025 -.083
CR1 1.000 5.000 -.267 -1.792 -.217 -.728
Multivariate 37.506 8.723
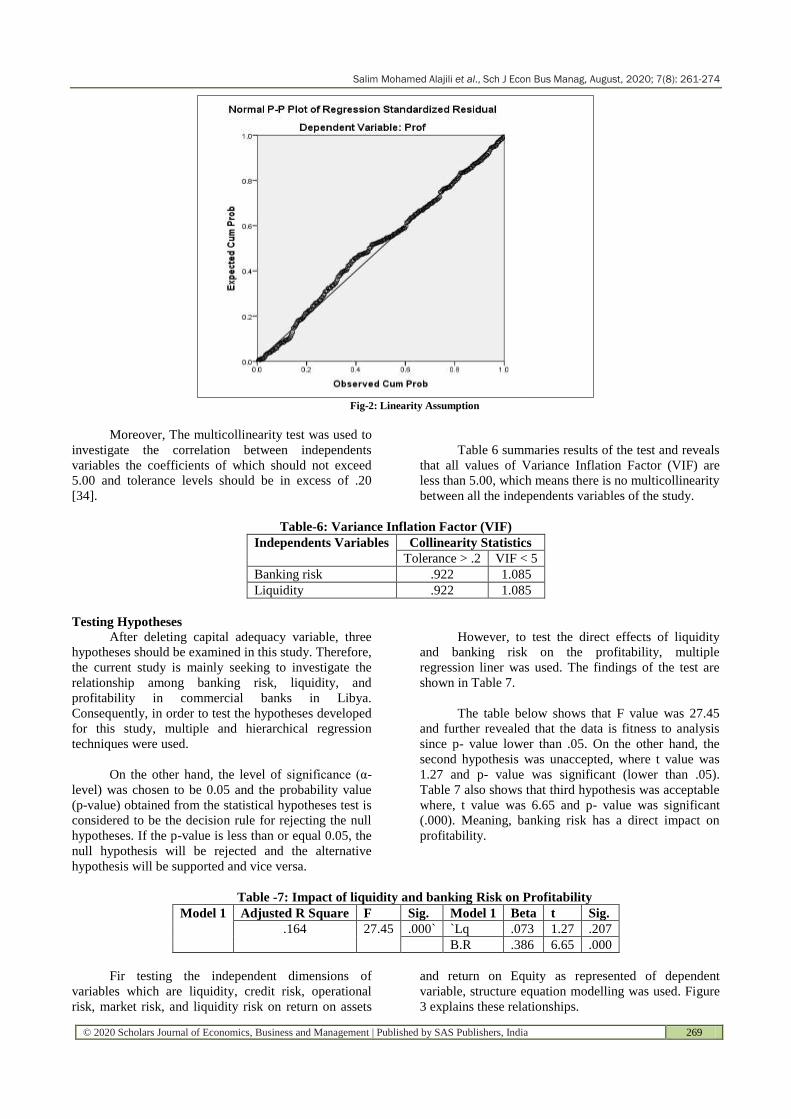
For the linearity, by examining the scatter plot
residuals and predictors using SPSS 20, the results
indicate a straight-line association between independent
variables (banking risk and liquidity) and dependent
variable (profitability), and in turn did not show any
support for non-linearity. Consequently, there was no
evidence to challenge the linearity assumption as shown
in Figure 2.
Salim Mohamed Alajili et al., Sch J Econ Bus Manag, August, 2020; 7(8): 261-274
© 2020 Scholars Journal of Economics, Business and Management | Published by SAS Publishers, India 269
Fig-2: Linearity Assumption
Moreover, The multicollinearity test was used to
investigate the correlation between independents
variables the coefficients of which should not exceed
5.00 and tolerance levels should be in excess of .20
[34].
Table 6 summaries results of the test and reveals
that all values of Variance Inflation Factor (VIF) are
less than 5.00, which means there is no multicollinearity
between all the independents variables of the study.
Table-6: Variance Inflation Factor (VIF)
Independents Variables Collinearity Statistics
Tolerance > .2 VIF < 5
Banking risk .922 1.085
Liquidity .922 1.085
Testing Hypotheses
After deleting capital adequacy variable, three
hypotheses should be examined in this study. Therefore,
the current study is mainly seeking to investigate the
relationship among banking risk, liquidity, and
profitability in commercial banks in Libya.
Consequently, in order to test the hypotheses developed
for this study, multiple and hierarchical regression
techniques were used.
On the other hand, the level of significance (α-
level) was chosen to be 0.05 and the probability value
(p-value) obtained from the statistical hypotheses test is
considered to be the decision rule for rejecting the null
hypotheses. If the p-value is less than or equal 0.05, the
null hypothesis will be rejected and the alternative
hypothesis will be supported and vice versa.
However, to test the direct effects of liquidity
and banking risk on the profitability, multiple
regression liner was used. The findings of the test are
shown in Table 7.
The table below shows that F value was 27.45
and further revealed that the data is fitness to analysis
since p- value lower than .05. On the other hand, the
second hypothesis was unaccepted, where t value was
1.27 and p- value was significant (lower than .05).
Table 7 also shows that third hypothesis was acceptable
where, t value was 6.65 and p- value was significant
(.000). Meaning, banking risk has a direct impact on
profitability.
Table -7: Impact of liquidity and banking Risk on Profitability
Model 1 Adjusted R Square F Sig. Model 1 Beta t Sig.
.164 27.45 .000` `Lq .073 1.27 .207
B.R .386 6.65 .000
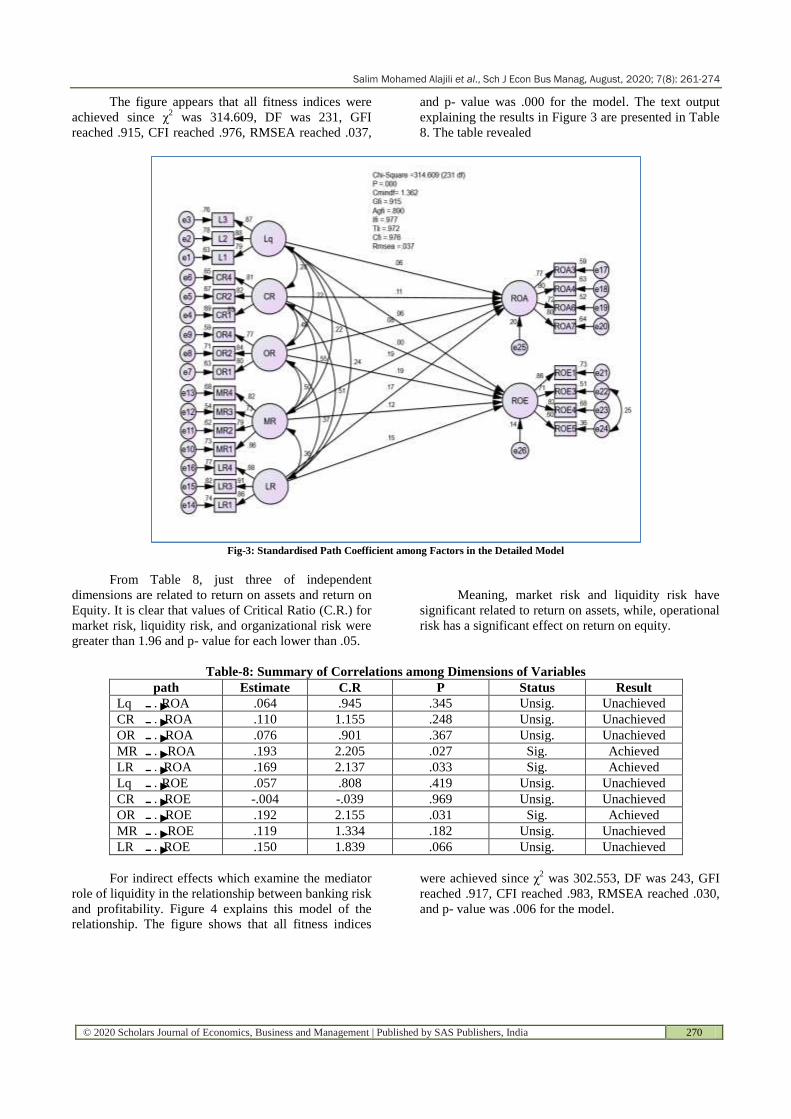
Fir testing the independent dimensions of
variables which are liquidity, credit risk, operational
risk, market risk, and liquidity risk on return on assets
and return on Equity as represented of dependent
variable, structure equation modelling was used. Figure
3 explains these relationships.
Salim Mohamed Alajili et al., Sch J Econ Bus Manag, August, 2020; 7(8): 261-274
© 2020 Scholars Journal of Economics, Business and Management | Published by SAS Publishers, India 270
The figure appears that all fitness indices were
achieved since χ2 was 314.609, DF was 231, GFI
reached .915, CFI reached .976, RMSEA reached .037,
and p- value was .000 for the model. The text output
explaining the results in Figure 3 are presented in Table
8. The table revealed
Fig-3: Standardised Path Coefficient among Factors in the Detailed Model
From Table 8, just three of independent
dimensions are related to return on assets and return on
Equity. It is clear that values of Critical Ratio (C.R.) for
market risk, liquidity risk, and organizational risk were
greater than 1.96 and p- value for each lower than .05.
Meaning, market risk and liquidity risk have
significant related to return on assets, while, operational
risk has a significant effect on return on equity.
Table-8: Summary of Correlations among Dimensions of Variables
path Estimate C.R P Status Result
Lq ROA .064 .945 .345 Unsig. Unachieved
CR ROA .110 1.155 .248 Unsig. Unachieved
OR ROA .076 .901 .367 Unsig. Unachieved
MR ROA .193 2.205 .027 Sig. Achieved
LR ROA .169 2.137 .033 Sig. Achieved
Lq ROE .057 .808 .419 Unsig. Unachieved
CR ROE -.004 -.039 .969 Unsig. Unachieved
OR ROE .192 2.155 .031 Sig. Achieved
MR ROE .119 1.334 .182 Unsig. Unachieved
LR ROE .150 1.839 .066 Unsig. Unachieved
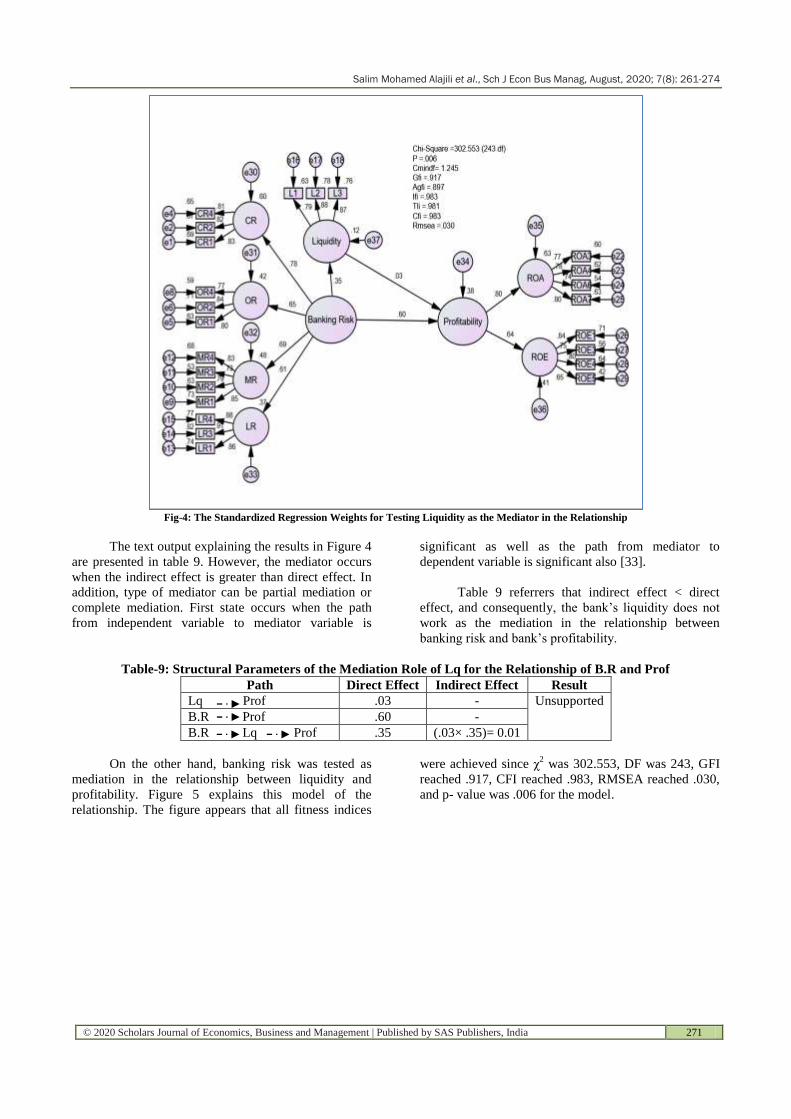
For indirect effects which examine the mediator
role of liquidity in the relationship between banking risk
and profitability. Figure 4 explains this model of the
relationship. The figure shows that all fitness indices
were achieved since χ2 was 302.553, DF was 243, GFI
reached .917, CFI reached .983, RMSEA reached .030,
and p- value was .006 for the model.
Salim Mohamed Alajili et al., Sch J Econ Bus Manag, August, 2020; 7(8): 261-274
© 2020 Scholars Journal of Economics, Business and Management | Published by SAS Publishers, India 271
Fig-4: The Standardized Regression Weights for Testing Liquidity as the Mediator in the Relationship
The text output explaining the results in Figure 4
are presented in table 9. However, the mediator occurs
when the indirect effect is greater than direct effect. In
addition, type of mediator can be partial mediation or
complete mediation. First state occurs when the path
from independent variable to mediator variable is
significant as well as the path from mediator to
dependent variable is significant also [33].
Table 9 referrers that indirect effect < direct
effect, and consequently, the bank’s liquidity does not
work as the mediation in the relationship between
banking risk and bank’s profitability.
Table-9: Structural Parameters of the Mediation Role of Lq for the Relationship of B.R and Prof
Path Direct Effect Indirect Effect Result
Lq Prof .03 - Unsupported
B.R Prof .60 -
B.R Lq Prof .35 (.03× .35)= 0.01
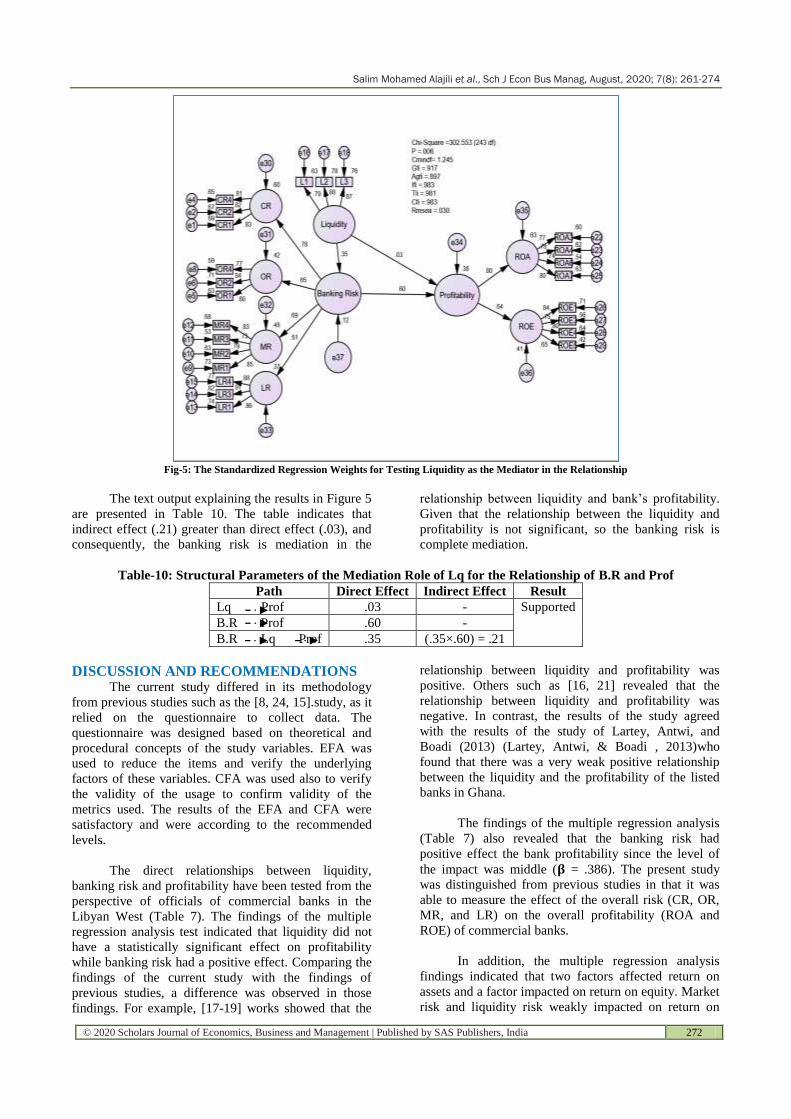
On the other hand, banking risk was tested as
mediation in the relationship between liquidity and
profitability. Figure 5 explains this model of the
relationship. The figure appears that all fitness indices
were achieved since χ2 was 302.553, DF was 243, GFI
reached .917, CFI reached .983, RMSEA reached .030,
and p- value was .006 for the model.
Salim Mohamed Alajili et al., Sch J Econ Bus Manag, August, 2020; 7(8): 261-274
© 2020 Scholars Journal of Economics, Business and Management | Published by SAS Publishers, India 272
Fig-5: The Standardized Regression Weights for Testing Liquidity as the Mediator in the Relationship
The text output explaining the results in Figure 5
are presented in Table 10. The table indicates that
indirect effect (.21) greater than direct effect (.03), and
consequently, the banking risk is mediation in the
relationship between liquidity and bank’s profitability.
Given that the relationship between the liquidity and
profitability is not significant, so the banking risk is
complete mediation.
Table-10: Structural Parameters of the Mediation Role of Lq for the Relationship of B.R and Prof
Path Direct Effect Indirect Effect Result
Lq Prof .03 - Supported
B.R Prof .60 -
B.R Lq Prof .35 (.35×.60) = .21
DISCUSSION AND RECOMMENDATIONS The current study differed in its methodology
from previous studies such as the [8, 24, 15].study, as it
relied on the questionnaire to collect data. The
questionnaire was designed based on theoretical and
procedural concepts of the study variables. EFA was
used to reduce the items and verify the underlying
factors of these variables. CFA was used also to verify
the validity of the usage to confirm validity of the
metrics used. The results of the EFA and CFA were
satisfactory and were according to the recommended
levels.
The direct relationships between liquidity,
banking risk and profitability have been tested from the
perspective of officials of commercial banks in the
Libyan West (Table 7). The findings of the multiple
regression analysis test indicated that liquidity did not
have a statistically significant effect on profitability
while banking risk had a positive effect. Comparing the
findings of the current study with the findings of
previous studies, a difference was observed in those
findings. For example, [17-19] works showed that the
relationship between liquidity and profitability was
positive. Others such as [16, 21] revealed that the
relationship between liquidity and profitability was
negative. In contrast, the results of the study agreed
with the results of the study of Lartey, Antwi, and
Boadi (2013) (Lartey, Antwi, & Boadi , 2013)who
found that there was a very weak positive relationship
between the liquidity and the profitability of the listed
banks in Ghana.
The findings of the multiple regression analysis
(Table 7) also revealed that the banking risk had
positive effect the bank profitability since the level of
the impact was middle (𝛃 = .386). The present study
was distinguished from previous studies in that it was
able to measure the effect of the overall risk (CR, OR,
MR, and LR) on the overall profitability (ROA and
ROE) of commercial banks.
In addition, the multiple regression analysis
findings indicated that two factors affected return on
assets and a factor impacted on return on equity. Market
risk and liquidity risk weakly impacted on return on
Salim Mohamed Alajili et al., Sch J Econ Bus Manag, August, 2020; 7(8): 261-274
© 2020 Scholars Journal of Economics, Business and Management | Published by SAS Publishers, India 273
assets since 𝛃 values were .19 and .17 respectively,
while the rest of the factors did not have any significant
effect. On the other hand, only on factor is called
operational risk had a significant poor effect on return
on equity, where the 𝛃 value scored.19 (Table 8).
On the other hand, the study showed good
results with regard to median relations. Although
liquidity has never directly affected profitability, it
indirectly affects it through bank risk, since liquidity
and banking risk as predictors of profitability explain
.38 of its variance (figure 4). This finding is very
important for commercial bank officials. In other
words, the relationship between liquidity and
profitability could be indirect. This issue supports that
most dependent variables are affected by a combination
of factors, not just one.
According to discussion above, this study
concludes that the results of previous studies that
indicated a negative relationship between liquidity and
profitability are not always correct due to a simple
reason since sometimes the bank profitability may
increase or decrease with good or bad reputation for it,
or high customer satisfaction and confidence towards
the bank. In conclusion, this study recommends
studying intermediate relationships, especially with
confidence, loyalty, contentment and reputation.
REFFERENCE 1. Abbas F, Iqbal S, Aziz B. The impact of bank
capital, bank liquidity and credit risk on
profitability in postcrisis period: A comparative
study of US and Asia. Cogent Economics &
Finance. 2019 Jan 1;7(1):1605683.
2. Adebayo O, David AO, Samuel OO. Liquidity
management and commercial banks’ profitability in
Nigeria. Research Journal of Finance and
Accounting. 2011;2(7/8):24-38.
3. Rifqah Amaliah S, Hassan HH. The Relationship
between Bank’s Credit Risk, Liquidity, and Capital
Adequacy towards its Profitability in Indonesia.
4. Bassey FA, Tobi EG, Bassey IF, Ekwere RE.
Liquidity management and the performance of
banks in Nigeria. International journal of academic
research in accounting, finance and management
sciences. 2016;6(1):41-8.
5. Tulsian M. Profitability Analysis (A comparative
study of SAIL & TATA Steel). Journal of
Economics and Finance. 2014;3(2):19-22.
6. Elsharif TA. The Impact of Liquidity Management
on Profitability. 2016; Retrieved May 24, 2020,
from Research Gate:
www.researchgate.net/publication.
7. Noman AH, Pervin S, Chowdhury MM, Banna H.
The effect of credit risk on the banking
profitability: A case on Bangladesh. Global journal
of management and business research. 2015 Apr
22.
8. Alshatti AS. The effect of the liquidity
management on profitability in the Jordanian
commercial banks. International Journa
9. Oberoi M Bank Risks: Everything You Need to
Know. 2019. Retrieved May 2, 2020, from Market
Realist: https://marketrealist.com.
10. Kolapo TF, Ayeni RK, Oke MO. Credit risk and
commercial banks'performance in nigeria: a panel
model approach. Australian journal of business and
management research. 2012 May 1;2(2):31.
11. Shaw S. What are various types of risks a bank
faces?. 2016. Retrieved April 17, 2020, from
Quora: www.quora.com.
12. Shaw S. What is the relationship between profit
and risk?.2016. Retrieved May 21, 2020, from
Quora: www.quora.com.
13. Maaka ZA. The relationship between liquidity risk
and financial performance of commercial banks in
Kenya (Doctoral dissertation, University of
Nairobi).
14. Kashyap AK, Rajan R, Stein JC. Banks as liquidity
providers: An explanation for the coexistence of
lending and deposit‐ taking. The Journal of
finance. 2002 Feb;57(1):33-73.
15. Olalekan A, Adeyinka S. Capital adequacy and
banks’ profitability: an empirical evidence from
Nigeria. American International Journal of
Contemporary Research. 2013 Oct;3(10):87-93.
16. Goddard J, Molyneux P, Wilson JO. Dynamics of
growth and profitability in banking. Journal of
money, credit and banking. 2004 Dec 1:1069-90.
17. Bourke P. Concentration and other determinants of
bank profitability in Europe, North America and
Australia. Journal of Banking & Finance. 1989 Mar
1;13(1):65-79.
18. Eichengreen B and Gibson HD. Greek Banking at
the Dawn of the New Millennium; 2001.
19. Bordeleau É, Graham C. The impact of liquidity on
bank profitability. Bank of Canada; 2010 Dec 23.
20. Islam MS, Nishiyama SI. The determinants of bank
profitability: dynamic panel evidence from South
Asian countries. Journal of Applied Finance and
Banking. 2016 May 1;6(3):77.
21. Molyneux P, Thornton J. Determinants of
European bank profitability: A note. Journal of
banking & Finance. 1992 Dec 1;16(6):1173-8.
22. Tran VT, Lin CT, Nguyen H. Liquidity creation,
regulatory capital, and bank profitability.
International Review of Financial Analysis. 2016
Dec 1;48:98-109.
23. Saleem Q, Rehman RU. Impacts of liquidity ratios
on profitability. Interdisciplinary journal of
research in business. 2011 Jul;1(7):95-8.
24. Berríos MR. The relationship between bank credit
risk and profitability and liquidity. The
International Journal of Business and Finance
Research. 2013;7(3):105-18.
25. Salah NB, Fedhila H. Effects of securitization on
credit risk and banking stability: Empirical
evidence from American commercial banks.
Salim Mohamed Alajili et al., Sch J Econ Bus Manag, August, 2020; 7(8): 261-274
© 2020 Scholars Journal of Economics, Business and Management | Published by SAS Publishers, India 274
International Journal of Economics and Finance.
2012 May;4(5):194-207.
26. Shair F, Sun N, Shaorong S, Atta F, Hussain M.
Impacts of risk and competition on the profitability
of banks: Empirical evidence from Pakistan. PloS
one. 2019 Nov 11;14(11):e0224378.
27. Kayode OF, Obamuyi TM, Owoputi JA, Adeyefa
FA. Credit risk and bank performance in Nigeria.
IOSR Journal of Economics and Finance.
2015;6(2):21-8.
28. Ruziqa A. The impact of credit and liquidity risk
on bank financial performance: the case of
Indonesian Conventional Bank with total asset
above 10 trillion Rupiah. International Journal of
Economic Policy in Emerging Economies. 2013
Jan 1;6(2):93-106.
29. Walumbwa FO, Hartnell CA. Understanding
transformational leadership–employee performance
links: The role of relational identification and self‐efficacy. Journal of occupational and
organizational psychology. 2011 Mar;84(1):153-
72.
30. Kaiser HF. An index of factorial simplicity.
Psychometrika.1974; 39: 31–36.
31. Vansickle T. Test Reliability Indicates More than
Just Consistency. Assessment Brief. April. 2015
Apr.
32. Drost EA. Validity and reliability in social science
research. Education Research and perspectives.
2011;38(1):105.
33. Awang Z. SEM Made Simple: A Gintle Approach
to Learning Structure Equation Modeling. Bandar
Baru Bangi, Selangor: MPWS Rich Publication
Sdn.2015.
34. Hair JJ, Black WC, Babin BJ and Anderson RE.
Multivariate Data Analysis: A Global Perspective.
(ed), Ed.) Englewood Cliffs, NJ: Pearson Prentice
Hall Upper Saddle River, NJ.2010.
35. Lartey VC, Antwi S and Boadi EK. The
Relationship between Liquidity and Profitability of
Listed Banks in Ghana. International Journal of
Business and Social Science. 2013; 4(3), 48-56.