scholarship project paper 2014 market's responses to ... · necessarily represent the capital...
TRANSCRIPT

www.set.or.th/setresearch
Disclaimer: The views expressed in this working paper are those of the author(s) and do not necessarily represent the Capital Market Research Institute or the Stock Exchange of Thailand. Capital Market Research Institute Scholarship Papers are research in progress by the author(s) and are published to elicit comments and stimulate discussion.
Scholarship Project Paper 2014
Market's Responses to Deferred Taxes: Evidence from Early Adoption and Effective Periods
Preeyanan Chotikasilp Management Accounting Staff
PTT Global Chemical Public Company Limited Bangkok, Thailand 10900
E-mail: [email protected]
Pailin Trongmateerut, PhD* Lecturer in Accounting Thammasat University
Department of Accounting Thammasat Business School
Bangkok, Thailand 10200 E-mail: [email protected]
*Corresponding author

www.set.or.th/setresearch
Disclaimer: The views expressed in this working paper are those of the author(s) and do not necessarily represent the Capital Market Research Institute or the Stock Exchange of Thailand. Capital Market Research Institute Scholarship Papers are research in progress by the author(s) and are published to elicit comments and stimulate discussion.
Chaiyuth Padungsaksawasdi, PhD Lecturer in Finance
Thammasat University Department of Finance
Thammasat Business School Bangkok, Thailand 10200
E-mail: [email protected]
20 February 2015
Abstract
This study examines how the market perceives the relevance of deferred tax assets and liabilities and
current period tax deferrals that reported by Thai companies under the balance sheet method of IAS 12 over the
period 2010 – 2013. Our results suggest that net deferred taxes are viewed as future tax saving. The market seems
to weigh deferred tax liabilities as liabilities but does not price deferred tax assets as assets. Furthermore, we finds
that the market values deferred tax assets reported by loss-making financial firms that early adopted IAS 12.
JEL Classification: Preeyanan was a graduate student, Master of Science in Finance (MIF), Thammasat Business
School when conducting this research. We thank Pornchai Chunhachinda, Anutchanat Jaroenjitrkam, for very helpful
comments and discussions. The opinions/suggestions/comments conveyed in this study are those of the authors,
and do not necessarily reflect that of PTT Global Chemical Public Company Limited. All remaining errors are owns. Keywords: Deferred Tax, Current Tax Deferral, TAS12, Value Relevance, Market Perception.
2014 Capital Market Research Institute, The Stock Exchange of Thailand
Content
Page
Chapter 1 Introduction 2
Chapter 2 Li terature Review 5
Chapter 3 Practices of Early Adoption 9
Chapter 4 IAS No. 12 and accounting environment 10
Chapter 5 Data and Methodology 11
5.1 Data
5.2 Regression Models
Chapter 6 Empirical Results 15
6.1 Descriptive statistics
6.2 Net deferred tax assets and net deferred tax liabilities
6.3 Net current tax deferrals
6.4 Deferred tax assets and deferred tax liabilities
6.5 Evidence in financial sector during early adoption period
Chapter 7 Conclusion, Limitation, and Future Research 21
References 23
Table
1. Industry classification 26
2. Descriptive Statistics 26
3. Pearson correlation metrics 29
4. Levels regression using unbalanced panel data and GLS 30
5. Returns regression using unbalanced panel data and GLS 31
6. Levels regression using unbalanced panel data and GLS 32
7. Levels regression: Financial sector versus other sectors in early adoption period 34
2014 Capital Market Research Institute, The Stock Exchange of Thailand
2
Chapter1 Introduction
Accounting for income tax has been mandatory practice worldwide. However, the
usefulness of deferred tax accounting remains inconclusive. IAS 12 requires deferred tax assets
and deferred tax liabilities be recognized under the balance sheet method. The deferred tax
assets are the amounts of income taxes recoverable in future period in respect of the
deductible temporary difference1 and the carryforwards of unused tax losses and tax credits.
The deferred tax liabilities are the amounts of income taxes payable in future periods in respect
of taxable temporary differences.2 Moreover, firms are required to disclose the major
components of deferred tax expense (income) relating to the origination and reversal of
temporary differences, for example, depreciation and amortization, loss carried forward and
provision of employee benefit.
Prior studies examine the market perception of the relevance of deferred tax
assets and liabilities by Australian companies under the income statement method3 specified by
the Australian Accounting Standards Board in 1020 (AASB 1020) (Chang, Herbohn and Tutticci,
2009) and by U.S. companies under the balance sheets method4 specified by Statement of
1 Temporary difference is the difference between the carrying amount of an asset or liability in the statement of financial position and its tax base. Deductible temporary difference is temporary difference that will result in amounts that are deductible in determining taxable profit (tax loss) of future periods when the carrying amount of the asset or liability is recovered or settled. 2 Taxable temporary differences is temporary difference that will result in amounts that are deductible in determining taxable profit (tax loss) of future periods when the carrying amount of the asset or liability is recovered or settled. 3 The income statement method recognizes timing differences between taxable income or loss and accounting profit or loss as deferred tax assets or liabilities. 4 The balance sheet method of tax accounting recognizes temporary differences between the carrying amount of an asset or liability and its tax base as deferred tax accruals. The balance sheet method results in an increase in components giving rise to deferred tax assets and liabilities.
2014 Capital Market Research Institute, The Stock Exchange of Thailand
3
Financial Accounting Standards No.109, Accounting for Income Taxes (SFAS 109) (Amir, 1997;
Miller and Skinner 1998) and under the income statement method specified by Accounting
Principles Board Opinion No.11, Accounting for Income taxes (APB 11) ( Givoly and
Hayn,1992; Chaney and Jeter, 1994). In general, the result of studies suggest that the market
views the deferred tax liabilities as other reported liabilities, although the relation may be
tempered by recurring items that have little reversal and views the deferred tax assets as future
tax saving, although the relation may be reduced since the market could be interpreted as a
signal of future losses.
Research Objective:
We aim to investigate how the market views deferred tax assets and deferred tax
liabilities surrounding the IFRS environment. Though prior research does not substantiate
enough evidence to formulate directional hypotheses, the required disclosure under IAS 12
guides our propositions as follows. Our main research question is whether deferred taxes are
priced by the market. To gain more insight, we conjecture that the market accounts for the net
change of deferred tax balance. The loss reporting firms are of our interest as well, since the
way the market processes the information content of loss is different from that of net income
(Hayn, 1995). More importantly, loss firms usually report the loss carryforwards as a
component of their deferred tax assets that will reverse in the short run according to IAS 12.
Furthermore, Thai market offers a unique way to explore the impact of early and mandatory
adoption of IAS 12.5 We also investigate how market perceives components of deferred
taxes disclosed by early adopters and mandatory adopters. The industry effect appears to play
roles in how market processes deferred tax information (Chang et al., 2009); we thus
5 The Federation of Accounting Profession (FAP), the sole Thai accounting standard setting body, mandates the adoption of the Thai Accounting Standard No. 12 Income Taxes (TAS No. 12) by January 1, 2013. TAS No. 12 is directly translated from IAS No. 12. FAP explicitly encourages listed firms to early adopt the standard.
2014 Capital Market Research Institute, The Stock Exchange of Thailand
4
separately examine the financial sector due to its distinct business characteristics and highly
regulatory requirements (Skinner, 2008).
Expected outcomes
Our findings contribute to the body of income taxes literature in a number of ways.
1. We examine the information content of deferred taxes in the IFRS regime using
rigorous statistical analytical method.
2. We find the early adoption effect on how market prices deferred tax balance.
Timing of adoption is a significant factor in deferred tax content.
3. We include the loss firms in our study to gain more insight how the market
differentially perceives deferred taxes of loss firms.
4. The financial industry variable in our analysis helps explain the market
perception and deferred tax balance reversal expectation.
The results offer practical implications.
1. Our study informs standard setting bodies how presentation and disclosure of
deferred taxes are viewed. Deferred tax assets and deferred tax liabilities are asymmetrically
valued.
2. Regulatory monitoring of the deferred tax balances and movement is
quintessential for the financial industry because our evidence suggests the market prices the
information content of deferred tax assets disclosed by early adopters in the financial sector.

2014 Capital Market Research Institute, The Stock Exchange of Thailand
5
Chapter 2 Literature Review
The particular purpose of accounting for deferred taxes is to report tax information
useful to stakeholders. Importantly, accounting for income taxes serves as a linkage between financial
statements and tax returns (Graham et al., 2012). Deferred tax disclosure is the only source of
information about current and future taxes for investors. However, deferred tax accounting is a
complex, debatable issue in financial reporting. The differences between accounting principles and
revenue codes result in book-tax differences, namely the temporary and the permanent differences.
Temporary differences are the differences between the book value of an asset (a
liability) and its tax base resulting in taxable amount. The differences must be accounted for and
presented on financial statements. These differences in bases result in taxable or deductible amounts
in future years, when the asset is recovered or the liability is settled.6 Permanent differences, another
type of book-tax differences, will never reverse due to tax law. Certain expenses are never allowed as
tax deductions, such as entertainment expenses; and certain revenues are never taxed, such as
research grant for educational purpose. Permanent differences hence are not a concern for financial
reporting. Accounting for income taxes technically affects every transaction in which a firm engages
and causes the complex as well as costly accounting process of deferred tax allocation. In sum, the
benefits of deferred tax disclosures remain controversial.
Although accounting for income taxes was first prescribed in 1942 in the U.S. and has
long been evolved from the income statement approach to the balance sheet approach, prevailing
6 As an illustration of temporary differences, if the market price of merchandise inventory declines permanently, the inventory must be marked down to the market price and the loss is recognized immediately for financial reporting. For tax purpose, this write-down will be deductible through the actual sales of the inventory. Thus, tax benefit will arise until the loss is realized under tax law. To further explain the timing difference, the book and tax treatments of property, plant, and equipment are diverged. Given faster depreciation under tax law, the amount of tax depreciation is higher than that of book depreciation. Consequently, the tax amount of property, plant, and equipment is lower than the book amount resulting in the deferred tax liability.
2014 Capital Market Research Institute, The Stock Exchange of Thailand
6
research in the value relevance of deferred taxes is scant.7 Given the non-extensivity of the numbers
of studies and the limitations of prior research designs, past research in the incremental information
content of the income taxes reveal inconclusive evidence. Hence, we group prior evidence into two
categories; the U.S. and the rest of the world, due to the fact of large empirical evidence emphasizing
in the U.S. capital markets.
First, we group deferred tax studies in the U.S. into two parts based on the accounting
standards, namely the income statement and the balance sheet approaches.8 Up to date, the findings
on price-deferred tax relation remain mixed. Early empirical works conducted under the income
statement approach according to APB No. 11 establish that deferred tax liabilities are value relevant
(Beaver and Dukes, 1972; Givoly and Hayn, 1992; Amir et al., 1997; and Ayres, 1998). Givoly and
Hayn (1992) document that the market perceives deferred tax liabilities as future tax costs, since the
enactment of the Tax Reform Act of 1986 reduced the corporate tax rate from 46 percent to 34
percent.9 Particularly, abnormal stock returns positively associate with the amount of deferred tax
liabilities. In different findings, Chaney and Jeter (1994) find a negative relation between deferred tax
liabilities and stock returns. They conclude that the market views deferred tax liabilities as future tax
payment and provides information about level of manipulation in reported earnings.
7 Graham et al. (2012) provide the background and an excellent review of pertinent research of accounting for income taxes. 8 The income statement approach recognizes timing differences between taxable income and accounting income as deferred tax assets or deferred tax liabilities. This approach compares revenues and expenses recognized for book and tax purposes, eliminates permanent differences, and computes income tax expenses based on book income before taxes (excluding permanent differences). The difference between the income tax expense based on book income and the current income tax to be paid to the tax authority is either deferred tax asset or deferred tax liabilities. APB No. 11 requires firms to report only the net deferred tax liabilities without separate disclosure of deferred tax assets. The balance sheet approach recognizes timing differences between the carrying amount of an asset (a liability) and its tax base as deferred tax accruals. The balance sheet method results in an increase in components giving rise to deferred tax assets and deferred liabilities. The recognition of deferred taxes reflects that it is probable that the recovery or settlement of the carrying amount will make future tax payment smaller (or larger) than they would be if such recovery or settlement were to have no tax consequences. 9 The decrease in tax rate causes the decrease in cash outlays. The DTL as future tax payment would decrease at lower tax rate. Subsequently, the smaller the DTL, the larger the firm value.
2014 Capital Market Research Institute, The Stock Exchange of Thailand
7
The balance sheet method, consequently prescribed in SFAS No. 10910 superseding
APB No. 11 in 1992, instigates further empirical studies in the incremental value relevance of deferred
tax accounts. Using a price levels approach, Amir et al. (1997) examine the market valuation of
various deferred tax components. They document that the market prices the components of deferred
tax accounts differently, depending on the likelihood of the reversal in these accounts.11 This means
that the deferred tax liabilities from depreciation and amortization are not priced significantly because
of continuing investment in depreciable assets and low probability of reversal. Differently, the market
significantly prices the deferred taxes from restructuring charges as this component is expected to
reverse in the near future. Interestingly, the loss carryforwards component is not value relevant,
implying that investors do not expect the loss carryforwards to be utilized. Ayers (1998) indicates that
the separate recognition of deferred tax assets, the valuation allowance, and the adjustments for tax
law changes are associated with firm value. SFAS No. 109 indeed provides value relevant information
beyond APB No. 11. Amir and Sougiannis (1999) find a strong positive relation between deferred
taxes from loss carryforwards and share prices, since it represents as future tax saving. Chen and
Schoderbek (2000) find no evidence that financial analysts accounted for a higher tax rate alter their
earnings forecasts. Lev and Nissim (2004) find no significant relation between deferred tax expense
and annual stock returns, suggesting the value irrelevance of deferred taxes.
Second, in addition to the evidence in the U.S. discussed above, Zeng (2003)
examines the valuation of loss carryforwards (one of deferred tax components) in Canadian market
and finds that loss carryforwards enhance firms' market values. Chang, Herbohn, and Tutticci (2009),
who study the roles of deferred tax in Australia, consider the value relevance of deferred tax assets
and liabilities under the income statement approach specified by AASB No. 1020. They conclude that
10 SFAS No. 109 requires firms to disclose deferred tax assets and deferred tax liabilities, as well as to classify them either as current or noncurrent, which is based on the classification of the related nontax assets or nontax liabilities for financial reporting. Tax assets or liabilities that are not associated with a respective underlying asset or liability are classified based on the expected reversal period. 11 DTA and DTL will reverse when the transaction settlements incur following the tax code. For example, warranty expense must be estimated and booked since the sale transaction occurs in the first year. Thus, warranty expense and liability are recognized. This give rises of DTA and tax deductible. In the following year, warranty claim is made. Then, the reversal of DTA occurs.
2014 Capital Market Research Institute, The Stock Exchange of Thailand
8
the market perceives deferred tax assets as future tax saving and deferred tax liabilities as future tax
payment. They elaborate that an increase in deferred tax assets from loss carryforwards is viewed as
future cash saving when firms make profits. Chludek (2011) examines the value relevance of deferred
taxes based on German firms surrounding with the IFRS environment. In general, investors in German
market do not consider deferred tax as important information. However, large net deferred tax assets
are most likely to translate into actual cash flow and considered value relevance.
A few studies in deferred taxes are conducted in Thailand. Toommanon (2007)
investigates the change of tax accounting policies from tax payable method to deferred tax method
during the period of 1995 to 2006. The results indicate that the market does not react positively to a
possible upward in future earnings, which the deferred tax asset causes such an increase. This
means that the market does not perceive deferred tax assets as a signal of future tax saving.
From a practical viewpoint, accounting professional and regulatory bodies agree that
mandating IAS No. 12 enhances the quality and usefulness of financial reporting for users. The body
of income tax research seems to advocate the value relevance of the deferred taxes. Nevertheless,
growing academic literature provide inconclusive support. Under the income statement approach, later
research on the components of deferred taxes, assets, and liabilities, provides mixed results, since the
components are not easily disentangled. Then, the balance sheet approach superseding the income
statement approach appears to provide the transparency of deferred tax components as advocated by
practitioners. Academic works based on the balance sheet method, particularly under the IFRS
environment, are quite limited and provides inconsistent evidence with research under the income
statement approach (Chludek, 2011). To bridge this research gap, our study aims to examine the net
deferred tax balance and the components under the IFRS context. Our data provides a unique way to
additionally investigate the effect of the IFRS early adoption.
2014 Capital Market Research Institute, The Stock Exchange of Thailand
9
Chapter 3 Practices of Early Adoption
Morris (1987) posits that higher quality firms would adopt the best accounting policy to
signal higher quality, which is in line with the signaling theory. Superior performing firms, in particular,
would choose to early adopt an accounting standard advocated by accounting professional bodies to
make their high qualities publicly visible. In other words, firms early adopt a certain accounting
standard because they attempt to communicate their positive prospects resulted from the adoption to
the market. Cassidy, Urbancic, Sylvestre, and Ralston (1993) argue that the reason of early adopting
accounting standard(s) is a beneficial effect on the financial statement, especially the likelihood of an
increase in reported earnings.
Eakin and Gramlich (2000) examine the insider trading and the early adoption of SFAS No.
96 during the period of 1987 to 1988. The pooled regressions suggest that regardless of the
magnitude of the income effect, managers of adopting firms have unfavorable outlooks in their
performances. The finding of partitioned sample demonstrates that managers of firms with large
increasing net income from early adopting SFAS No. 96 signal their positive outlooks by purchasing
their own firms’ stocks. Using 394 firm-years in the Stock Exchange of Thailand during the period of
2004 to 2008, Acaranupong (2010) examines the equity valuation and the voluntary adoption of the
accounting for deferred taxes under the balance sheet approach. The market prices deferred tax
assets and deferred tax liabilities disclosed by early adopters. Surprisingly, the market prices deferred
tax assets for non-adopters. The result should be interpreted with care because of the
operationalization of non-adopters and the small sample size.12 These issues are fairly common in
past accounting research for income taxes (see the discussion of econometric issues in Graham, et
al., 2012 and Holthausen and Watts, 2001).
12 Acaranupong (2010) defines non-adopters as firms that do not adopt the deferred tax policies or use the deferral method. The sample includes 394 firm-years from the SET100, which is relatively small.

2014 Capital Market Research Institute, The Stock Exchange of Thailand
10
Chapter 4 IAS No. 12 and accounting environment
Because our study is performed under the Stock Exchange of Thailand, we are obliged to
provide the background of the IAS No. 12 adoption and relevant contextual information. IAS No. 12 as
in 2009 bound volume was adopted and titled as Thai Accounting Standard No. 12 (TAS No. 12).13
This standard was mandated to be effective by January 1, 2013. The implementation of IAS No. 12 in
Thailand exhibits some distinctive characteristics. First, deferred tax assets can be recognized if it is
probable that the tax benefits can be utilized in the near future. As the restriction of probability for
reversal and the timing of IAS No. 12 adoption, we can disregard the valuation allowance account,
which was a concern in prior studies (e.g., Miller and Skinner, 1998). Second, both deferred tax
assets and deferred tax liabilities are classified as net balance as noncurrent on the balance sheet with
supplemental note disclosure. This presentation requirement of IAS 12 facilitates our research design
to further investigate the effect of loss versus profit firms. Third, a constant effective tax rate in
Thailand during the time period in this study helps us rule out the effect of tax rate changes as
studied by Chen and Schoderbek (2000) and Givolyn and Hayn (1992) that might confound our
results. Last and practically, there is a single tax authority in the country, the Revenue Department,
eliminating any potential effect of multiple jurisdictions, which do not allow for netting the deferred tax
asset and deferred tax liability balances.
13 The Federation of Accounting Profession (FAP), the sole Thai accounting standard setting body, announced the IFRS compliance and adoption phases commencing in 2011. The IAS and IFRS are translated to Thai language and named as Thai Accounting Standard (TAS) and Thai Financial Reporting Standard (TFRS). A set of IAS and IFRS was approved and announced in the Government Gazette on May 26, 2010. The FAP and the SEC aim for full compliance by 2013 for all Thai listed companies. Particularly, listed firms are mandated to adopt Thai Accounting Standard No. 12 Income Taxes (TAS No. 12) by January 1, 2013. TAS No. 12 is directly translated from IAS No. 12 (2009 Bounded Volume). The FAP explicitly encourages listed firms to early adopt the standard. By the end of 2013, all listed companies must report and provide full disclosure of income taxes.
2014 Capital Market Research Institute, The Stock Exchange of Thailand
11
Chapter 5 Data and Methodology
5.1 Data
We begin with 534 companies listed in the Stock Exchange of Thailand during the period of
March 2010 to September 2013. We winsorize the data following these criteria. First, 45 property
funds and 19 companies under rehabilitation are excluded. Second, 25 companies are excluded
because the fiscal year does not start at January 1st. Third, 20 companies had no record of deferred
tax asset or deferred tax liability in any of sample quarters. Last, 23 companies are removed due to
substantial incomplete data. The final sample consists of 402 listed companies. The data is
unbalanced panel set of 2,028 firm-quarters. We hand-collect data for profits, book values, assets,
and liabilities from financial statements and notes (Form 56-1) filed at the Securities and Exchange
Commission (SEC). Stock prices are from DataStream.
Table 1 shows the sample classified by the types of industry and the time period of
deferred tax adoption. The data consist of eight sectors, namely the Agro & Food Industry, Consumer
Products, Financials, Industrials, Property & Construction, Resources, Services, and Technology. We
also separate the data into two time period intervals, the early adoption period (Quarter 1, 2010 to
Quarter 4, 2012) and the effective period (Quarter 1, 2013 to Quarter 3, 2013). There are 84
companies over the early adoption period and 402 companies over the effective period, respectively.
More specifically, companies in Financial and Property & Construction sectors are dominant over both
periods and may confound the results. We take these two sectors into consideration as the industry
effect (as presented in regression models in section 5.2.
5.2 Regression Models
We employ both price levels and returns models to validate the market’s response on
deferred taxes. The price levels model presented in equation (1) is based on the Ohlson (1995)
valuation framework that the market value or share price equals the book value adjusted for the

2014 Capital Market Research Institute, The Stock Exchange of Thailand
12
current profitability and other information, including the net deferred tax variable. We start our analysis
on the net deferred taxes account, which TAS No. 12 requires listed firms to classify both deferred tax
assets and deferred tax liabilities as noncurrent net deferred taxes balance on the balance sheets.
This feature is unique and allows us an excellent opportunity to investigate the role of net deferred
taxes on the markets' perception. The price levels model is as follows.
𝑃𝑖𝑡 = 𝛽0 + 𝛽1𝑋𝑖𝑡 + 𝛽2𝐵𝑉𝑖𝑡 + 𝛽3𝑁𝐷𝑇𝑖𝑡 + 𝛽4𝐺𝑟𝑖𝑡 + 𝛽5𝑃𝑅𝑂𝑃𝑖𝑡 + 𝛽6𝐹𝐼𝑁𝑖𝑡 + 𝛽7𝐿𝑂𝑆𝑆𝑖𝑡 + 𝛽8𝐿𝑂𝑆𝑆
× 𝑋𝑖𝑡 + 𝛽9𝐿𝑂𝑆𝑆 × 𝐵𝑉𝑖𝑡 + 𝛽10𝐿𝑂𝑆𝑆 × 𝑁𝐷𝑇𝑖𝑡 + 𝜀𝑖𝑡
(1)
where
𝑃𝑖𝑡 is the share price of company i 3 months after quarterly financial statement end t.
𝑋𝑖𝑡 is the net profit after tax and abnormal items less outside equity interests for
company i during the quarter t.
𝐵𝑉𝑖𝑡 is the book value of equity before deferred tax assets and liabilities and excluding
outside equity for company i at the end of quarter t.
𝑁𝐷𝑇𝑖𝑡 is the end-of-period recorded book value of net deferred taxes for company i by
coding net deferred tax assets as positive numbers and net deferred tax liabilities as
negative numbers. All of accounting variables are deflated by the number of share outstanding.
Control variables:
𝐺𝑟𝑖𝑡 is the percentage growth in property, plant, and equipment for company i at the over
the quarter t.14
𝑃𝑅𝑂𝑃𝑖𝑡 is a dummy variable for companies listed in property & construction industry sector
with a value of 1, otherwise 0.15
14 Chaney and Jeter (1994) show that growth in assets is highly correlated with timing differences on depreciation and leads to increasing DTL. If firm's growth is viewed as a positive signal of expected future cash flows, a positive relation between stock prices and firm's growth variable would be expected.
2014 Capital Market Research Institute, The Stock Exchange of Thailand
13
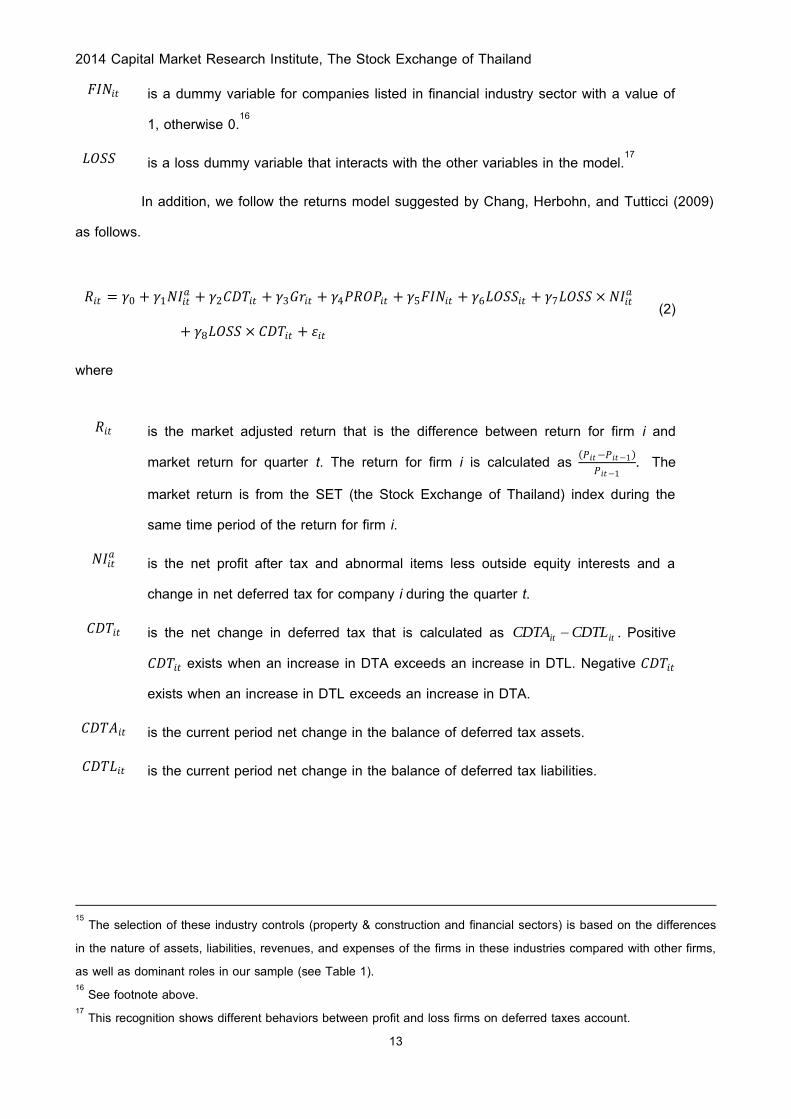
𝐹𝐼𝑁𝑖𝑡 is a dummy variable for companies listed in financial industry sector with a value of
1, otherwise 0.16
𝐿𝑂𝑆𝑆 is a loss dummy variable that interacts with the other variables in the model.17
In addition, we follow the returns model suggested by Chang, Herbohn, and Tutticci (2009)
as follows.
𝑅𝑖𝑡 = 𝛾0 + 𝛾1𝑁𝐼𝑖𝑡
𝑎 + 𝛾2𝐶𝐷𝑇𝑖𝑡 + 𝛾3𝐺𝑟𝑖𝑡 + 𝛾4𝑃𝑅𝑂𝑃𝑖𝑡 + 𝛾5𝐹𝐼𝑁𝑖𝑡 + 𝛾6𝐿𝑂𝑆𝑆𝑖𝑡 + 𝛾7𝐿𝑂𝑆𝑆 × 𝑁𝐼𝑖𝑡𝑎
+ 𝛾8𝐿𝑂𝑆𝑆 × 𝐶𝐷𝑇𝑖𝑡 + 𝜀𝑖𝑡
(2)
where
𝑅𝑖𝑡 is the market adjusted return that is the difference between return for firm i and
market return for quarter t. The return for firm i is calculated as 𝑃𝑖𝑡−𝑃𝑖𝑡−1
𝑃𝑖𝑡−1. The
market return is from the SET (the Stock Exchange of Thailand) index during the
same time period of the return for firm i.
𝑁𝐼𝑖𝑡𝑎 is the net profit after tax and abnormal items less outside equity interests and a
change in net deferred tax for company i during the quarter t.
𝐶𝐷𝑇𝑖𝑡 is the net change in deferred tax that is calculated as itit CDTLCDTA . Positive
𝐶𝐷𝑇𝑖𝑡 exists when an increase in DTA exceeds an increase in DTL. Negative 𝐶𝐷𝑇𝑖𝑡
exists when an increase in DTL exceeds an increase in DTA.
𝐶𝐷𝑇𝐴𝑖𝑡 is the current period net change in the balance of deferred tax assets.
𝐶𝐷𝑇𝐿𝑖𝑡 is the current period net change in the balance of deferred tax liabilities.
15 The selection of these industry controls (property & construction and financial sectors) is based on the differences in the nature of assets, liabilities, revenues, and expenses of the firms in these industries compared with other firms, as well as dominant roles in our sample (see Table 1). 16 See footnote above. 17 This recognition shows different behaviors between profit and loss firms on deferred taxes account.
2014 Capital Market Research Institute, The Stock Exchange of Thailand
14
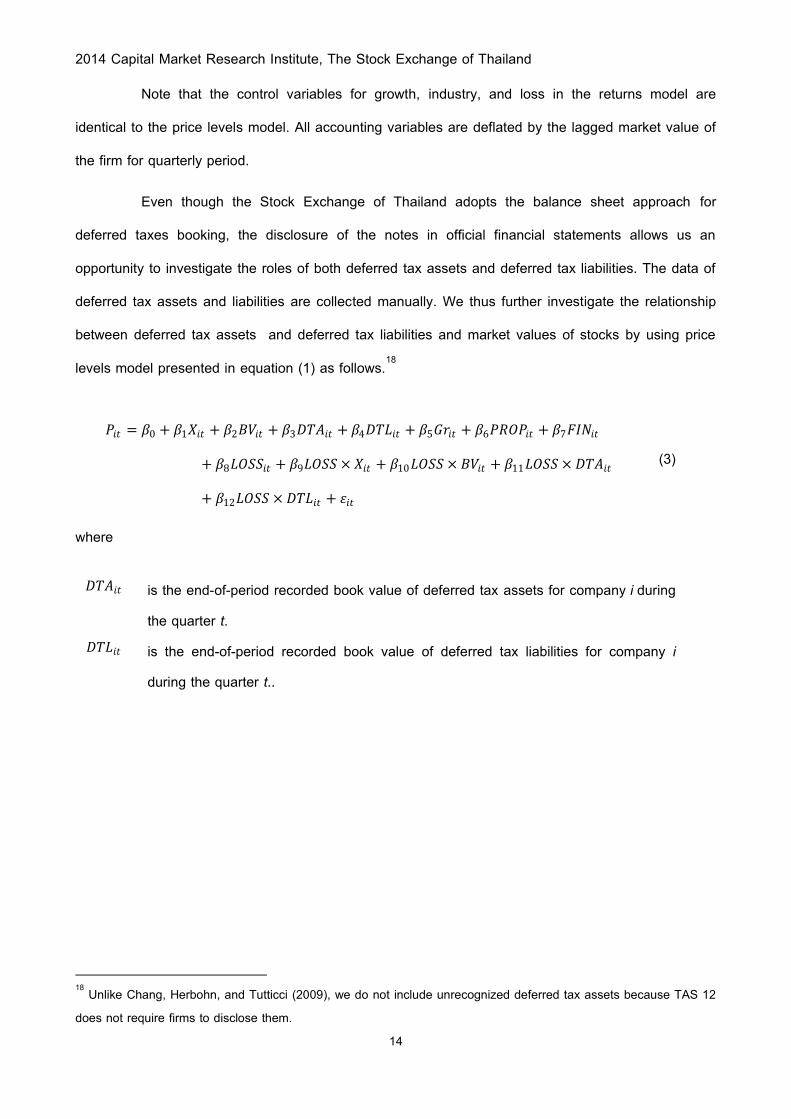
Note that the control variables for growth, industry, and loss in the returns model are
identical to the price levels model. All accounting variables are deflated by the lagged market value of
the firm for quarterly period.
Even though the Stock Exchange of Thailand adopts the balance sheet approach for
deferred taxes booking, the disclosure of the notes in official financial statements allows us an
opportunity to investigate the roles of both deferred tax assets and deferred tax liabilities. The data of
deferred tax assets and liabilities are collected manually. We thus further investigate the relationship
between deferred tax assets and deferred tax liabilities and market values of stocks by using price
levels model presented in equation (1) as follows.18
𝑃𝑖𝑡 = 𝛽0 + 𝛽1𝑋𝑖𝑡 + 𝛽2𝐵𝑉𝑖𝑡 + 𝛽3𝐷𝑇𝐴𝑖𝑡 + 𝛽4𝐷𝑇𝐿𝑖𝑡 + 𝛽5𝐺𝑟𝑖𝑡 + 𝛽6𝑃𝑅𝑂𝑃𝑖𝑡 + 𝛽7𝐹𝐼𝑁𝑖𝑡
+ 𝛽8𝐿𝑂𝑆𝑆𝑖𝑡 + 𝛽9𝐿𝑂𝑆𝑆 × 𝑋𝑖𝑡 + 𝛽10𝐿𝑂𝑆𝑆× 𝐵𝑉𝑖𝑡 + 𝛽11𝐿𝑂𝑆𝑆 × 𝐷𝑇𝐴𝑖𝑡
+ 𝛽12𝐿𝑂𝑆𝑆 × 𝐷𝑇𝐿𝑖𝑡 + 𝜀𝑖𝑡
(3)
where
𝐷𝑇𝐴𝑖𝑡 is the end-of-period recorded book value of deferred tax assets for company i during
the quarter t. 𝐷𝑇𝐿𝑖𝑡 is the end-of-period recorded book value of deferred tax liabilities for company i
during the quarter t..
18 Unlike Chang, Herbohn, and Tutticci (2009), we do not include unrecognized deferred tax assets because TAS 12 does not require firms to disclose them.

2014 Capital Market Research Institute, The Stock Exchange of Thailand
15
Chapter 6 Empirical Results
6.1 Descriptive statistics
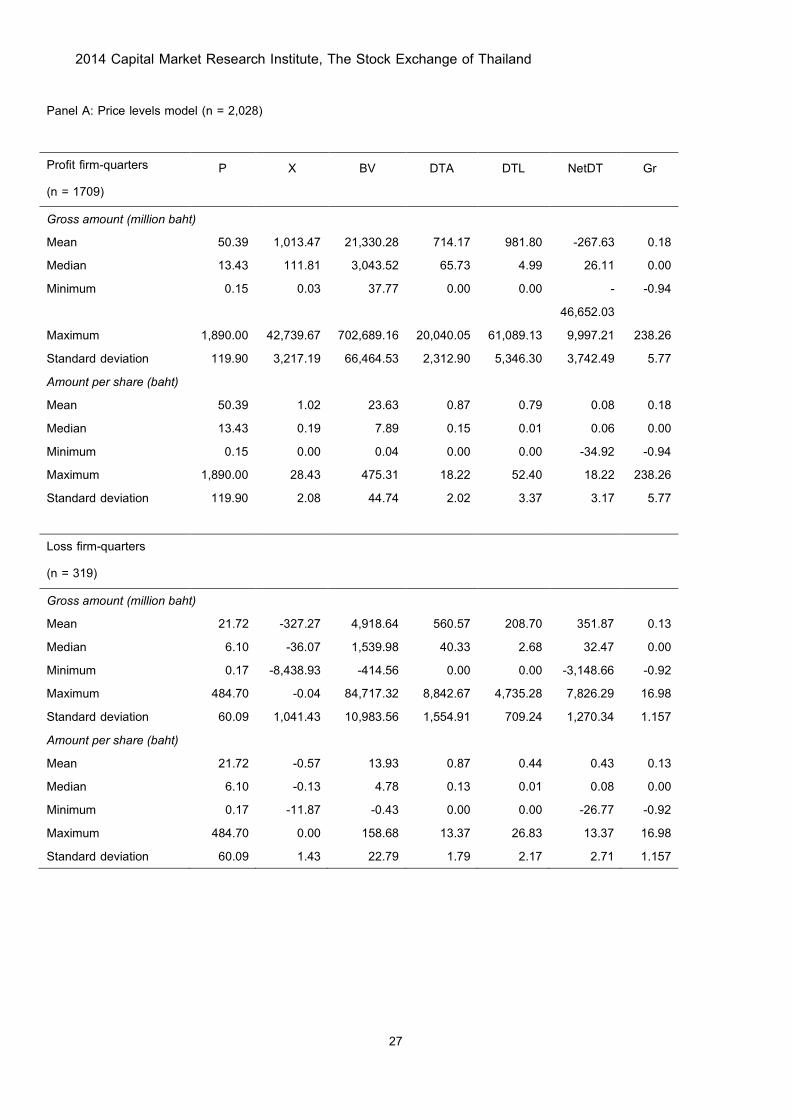
Table 2 presents the summary statistics of key variables for quarterly samples data. We
categorize data into profit and loss firms. This confirms fundamental differences between profit and
loss firms. Panel A presents the summary statistics in terms of gross amount and amount per share
for the 2,028 firm-quarter in the price levels model, which separates into the 1,709 profit firm-quarter
and the 319 loss firm-quarter.19 The stock price, profit, book value, and deferred taxed assets and
deferred tax liabilities are, on average, higher for profit firms than loss firms. The average growth in
property, plant, and equipment is not much difference for profit firms (18%) and loss firms (13%). The
mean deferred tax liabilities of 981.80 million baht are higher than the mean deferred tax asset of
714.17 million baht. This indicates income-decreasing manipulation for tax benefit by recording more
deferred tax liabilities (Chaney and Jeter, 1994). Loss firms show that the mean deferred tax assets of
560.57 million baht are higher than the mean deferred tax liabilities of 208.70 million baht. This
indicates the manipulation on reported increasing earnings by recording more deferred tax assets
(Chaney and Jeter, 1994). The means net deferred tax assets/liabilities per share have positive sign
for both profit and loss firms at 0.08 and 0.43, respectively, which indicates that more firms have net
deferred tax assets rather than net deferred tax liabilities.
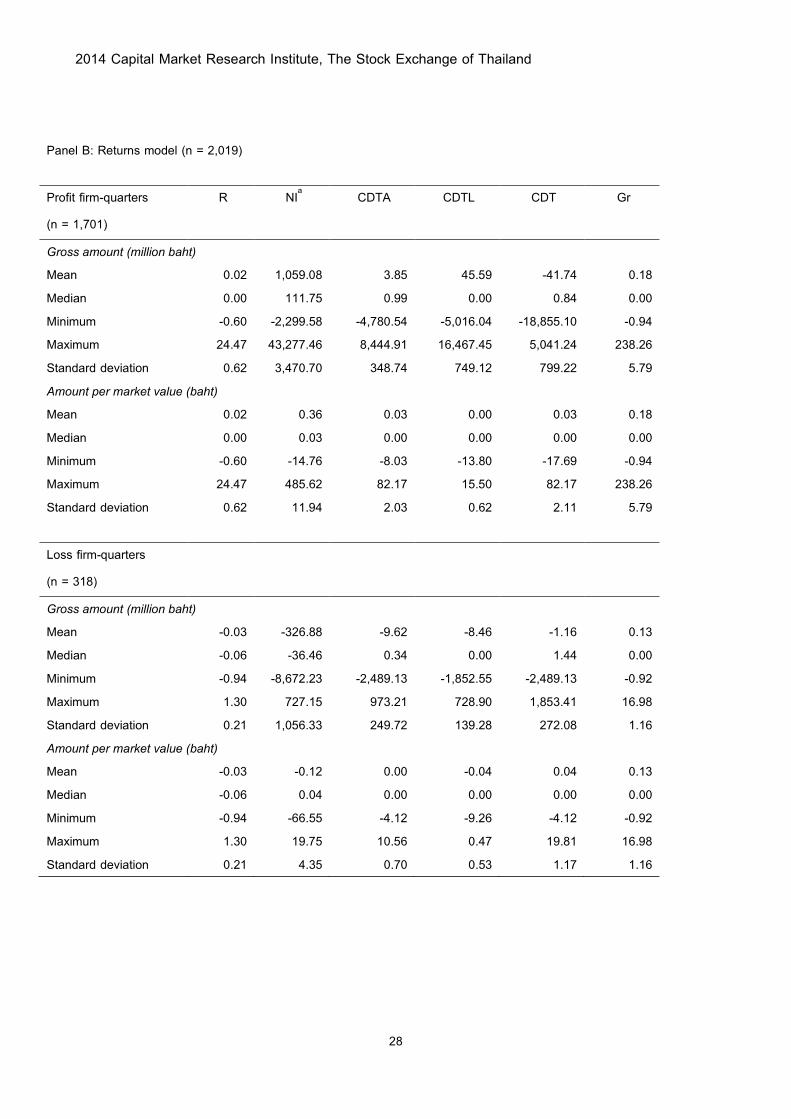
Panel B of Table 2 presents the summary statistics in terms of gross amount and amount
per share for the 2,019 firm-quarter in the returns model, which separates into the 1,701 profit firm-
quarter and the 318 loss firm-quarter. The reduction in the samples of returns model is due to missing
data for calculating lagged market values. The average return for profit firm is 2% and loss firm is - 19 Profit firm-quarter observations are firms that have positive net profit after tax and abnormal items less outside equity interest (positive X) during the quarter t. Loss firm-quarter observations are firms that have negative net profit after tax and abnormal items less outside equity interest (negative X) during the quarter t.
2014 Capital Market Research Institute, The Stock Exchange of Thailand
16
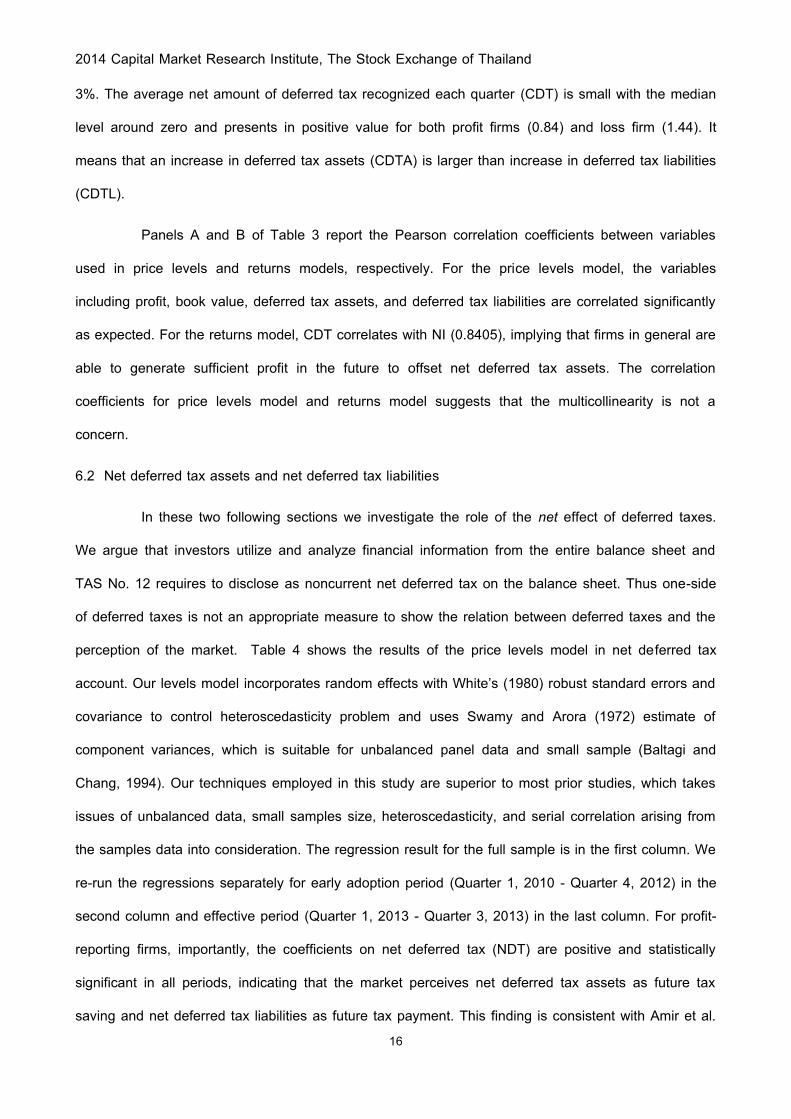
3%. The average net amount of deferred tax recognized each quarter (CDT) is small with the median
level around zero and presents in positive value for both profit firms (0.84) and loss firm (1.44). It
means that an increase in deferred tax assets (CDTA) is larger than increase in deferred tax liabilities
(CDTL).
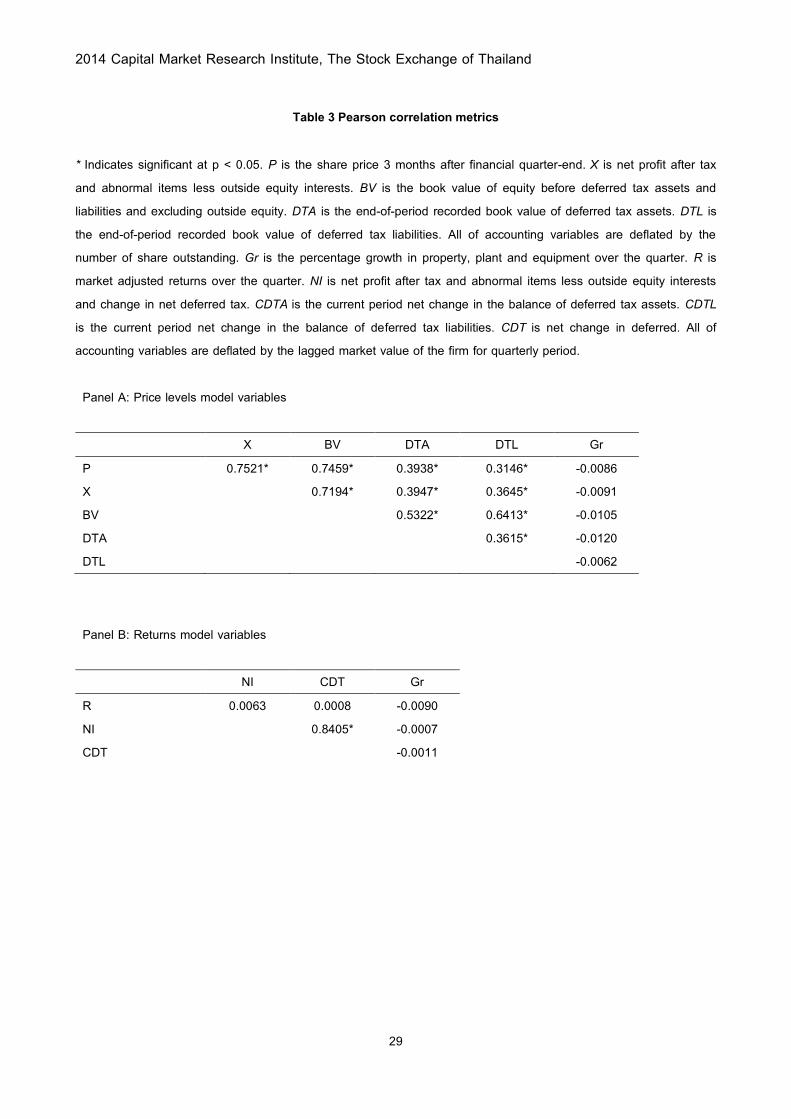
Panels A and B of Table 3 report the Pearson correlation coefficients between variables
used in price levels and returns models, respectively. For the price levels model, the variables
including profit, book value, deferred tax assets, and deferred tax liabilities are correlated significantly
as expected. For the returns model, CDT correlates with NI (0.8405), implying that firms in general are
able to generate sufficient profit in the future to offset net deferred tax assets. The correlation
coefficients for price levels model and returns model suggests that the multicollinearity is not a
concern.
6.2 Net deferred tax assets and net deferred tax liabilities
In these two following sections we investigate the role of the net effect of deferred taxes.
We argue that investors utilize and analyze financial information from the entire balance sheet and
TAS No. 12 requires to disclose as noncurrent net deferred tax on the balance sheet. Thus one-side
of deferred taxes is not an appropriate measure to show the relation between deferred taxes and the
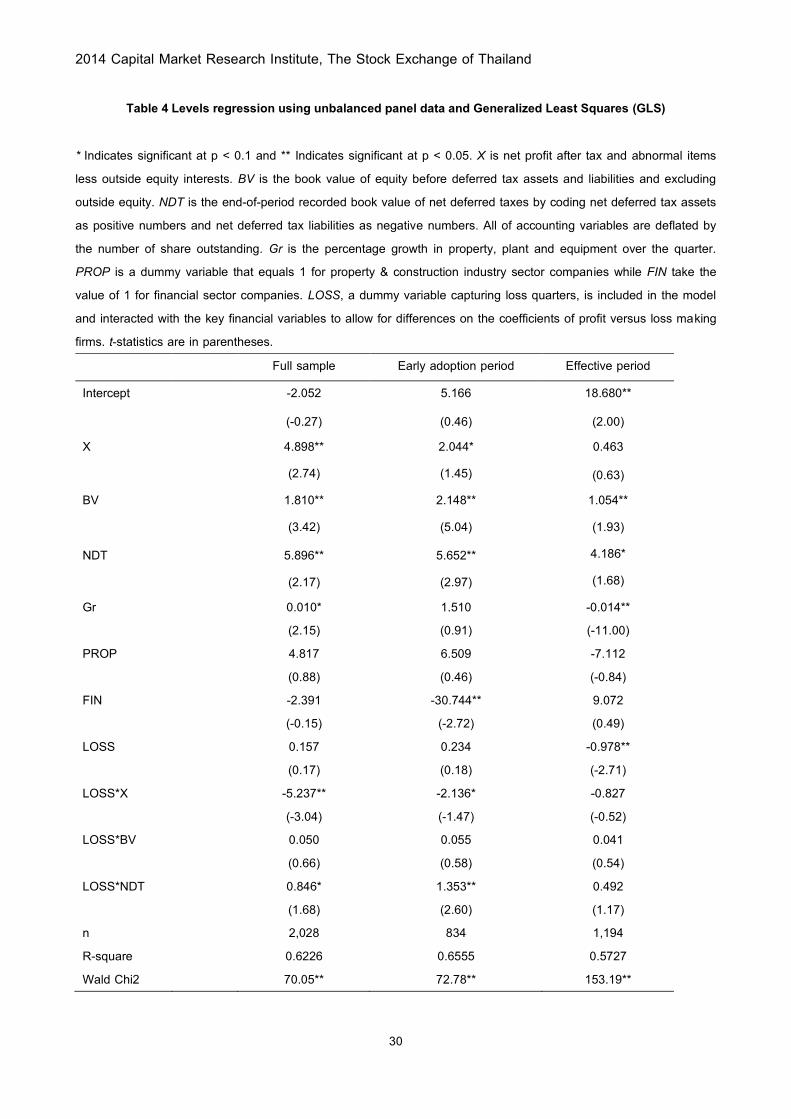
perception of the market. Table 4 shows the results of the price levels model in net deferred tax
account. Our levels model incorporates random effects with White’s (1980) robust standard errors and
covariance to control heteroscedasticity problem and uses Swamy and Arora (1972) estimate of
component variances, which is suitable for unbalanced panel data and small sample (Baltagi and
Chang, 1994). Our techniques employed in this study are superior to most prior studies, which takes
issues of unbalanced data, small samples size, heteroscedasticity, and serial correlation arising from
the samples data into consideration. The regression result for the full sample is in the first column. We
re-run the regressions separately for early adoption period (Quarter 1, 2010 - Quarter 4, 2012) in the
second column and effective period (Quarter 1, 2013 - Quarter 3, 2013) in the last column. For profit-
reporting firms, importantly, the coefficients on net deferred tax (NDT) are positive and statistically
significant in all periods, indicating that the market perceives net deferred tax assets as future tax
saving and net deferred tax liabilities as future tax payment. This finding is consistent with Amir et al.

2014 Capital Market Research Institute, The Stock Exchange of Thailand
17
(1997). Moreover, the results show that earnings (X) and book value (BV) are positively associated
with stock price and statistically significant, promising the efficacy of the Ohlson's (1995) model and
being consistent with previous findings.20 It is worth to note that the financial industry plays an
important role only during early adoption period.
It is logical to document that markets expect the persistence in future positive
performance, but it is not true for negative performance (Hayn, 1995). Thus, the impact of net profit
firms is greater than that of net loss firms. The coefficient of profit firms should be greater than one
and statistically significant, while that of loss firms should not be statistically significant. To take this
issue into consideration, we investigate the interactive roles of profit and loss firms on other
accounting variables in our models. The interaction between earnings and a loss dummy variable
shows when firms are not able to generate profits, the reduction in earnings coefficient is noticeable
(Chang, Herbohn, and Tutticci, 2009). This is confirmed by the reduction in coefficients of the
interaction terms.21 This could be interpreted that an increase in earnings of loss-reporting firms
causes a decrease in stock prices by 0.339 and 0.092 over the full sample and early adoption
periods, respectively.22 This is also logical to say that markets react negatively to poor performing
firms, causing the reduction in stock prices. The same phenomenon appears in book values, though it
is not negative and not significant. Our prime interest is the sign of the net deferred taxes on loss-
reporting firms, which are the same as those of on profit-reporting firms, meaning that markets are
likely to perceive the benefit of less negative net deferred taxes. Due to the same positive signs of
these two variables, the magnitude effect of deferred tax on loss making firms is amplified, showing
that investors expect that loss-reporting firms can use the benefit of the future tax saving from loss
carryforwards in the near future, otherwise overoptimistic. We conclude that investors do understand
the role of net positive deferred taxes in saving future cash of companies. The evidence during early
20 With the exception of the insignificance of earnings during effective period. A potential reason is a small sample size. 21 The coefficients of earnings (the interaction between a loss dummy varible and earnings) in full sample, early adoption, and effective periods are 4.898 (-5.237), 2.044 (-2.136), and 0.463 (-0.827), respectively. 22 The magnitude effect of an interaction term (dummy and main accounting variables) is the summation between the coefficient of the interaction term and its respective main accounting variable
2014 Capital Market Research Institute, The Stock Exchange of Thailand
18
adoption period is stronger than the other sample periods, implying that deferred taxes account is
value relevant and signals important information to the market.
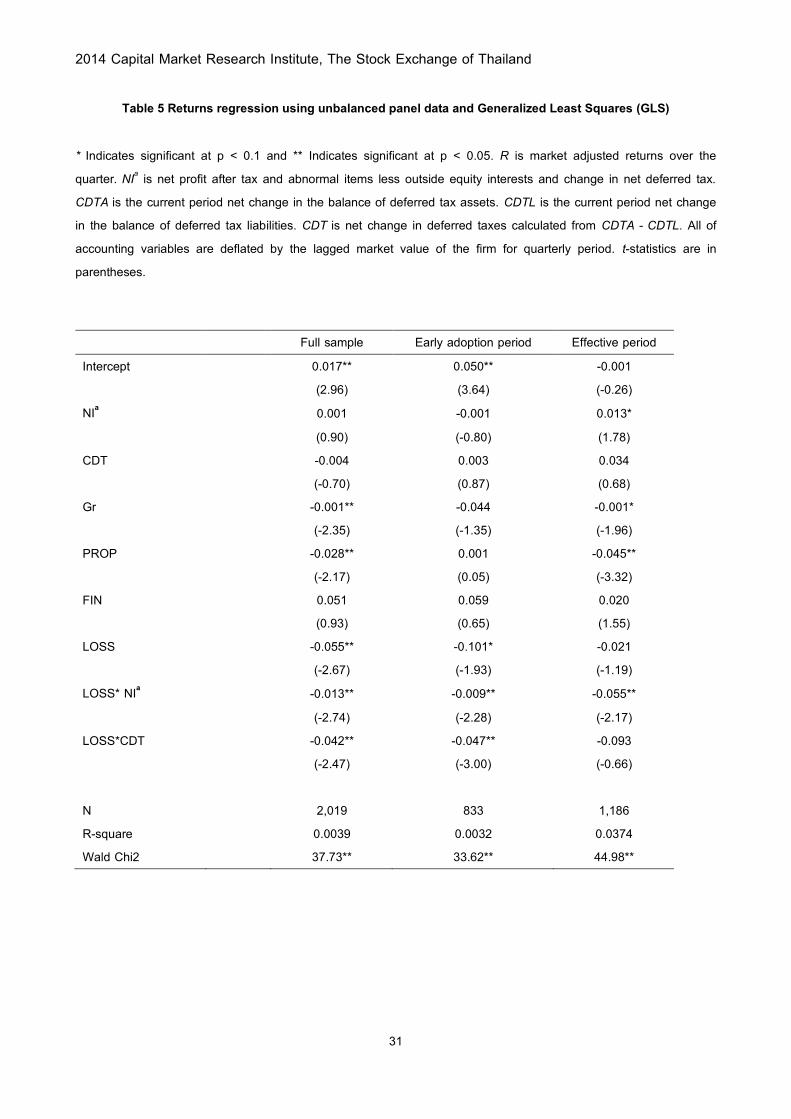
6.3 Net current tax deferrals
We further analyze the net change of current period deferred tax (CDT) accruals by using
the returns model as presented in equation (2).23 The most striking and surprising result is the
insignificance of the CDT for profit firms in all periods studied. However, it is not true for loss-
reporting firms. They do play more important roles in this experiment. Net increase in DTA is inversely
related to the return. To gain further insight, the two sub-period models are executed. Our early
adoption model highlights the effect of early adoption on the market's response. The interaction
between LOSS and CDT is significant (-0.047). This can be interpreted that the increase in CDT is
viewed as future tax payment for loss-reporting early adopter firms. We obtain the explanation from
the notes to financial statements of loss firms and find that the major component of deferred tax
assets is loss carryforwards. The increase in net change of deferred taxes therefore conveys the
lower probability of reversing loss carryforwards to the market. Market interprets the larger net change
of DTA relative to the change of DTL as the persistent loss and the questionable reversal of loss
carryforwards.
Taken together, the findings suggest the asymmetric market responses to deferred taxes
reported under IAS No. 12. In the big picture, the market seems to weight DTL as liabilities, but does
not price DTA. Interestingly, the information content of NDT is confirmed in our study. The market
prices net deferred taxes as required by IAS No. 12. The net change in deferred taxes for the early
adopters is negatively associated with the market price. Our statistical analyses illuminate the effect of
early adoption in the accounting for income taxes literature. Early adoption of IAS No. 12 plays a
significant role in signaling the components of deferred taxes to the market. Among early adopters,
the DTA of loss-reporting financial firms is priced positively. In contrast, the DTL of loss-reporting
mandatory adopters is viewed as future tax liabilities.
23
The results of price levels model is available upon request.

2014 Capital Market Research Institute, The Stock Exchange of Thailand
19
6.4 Deferred tax assets and deferred tax liabilities
Our full sample shows that earnings (X) and book value (BV) are positively associated with
stock price and statistically significant for profit firms, while the interaction of earnings and loss dummy
(LOSS*X) shows that the coefficient on earnings decrease when firm makes a loss that consistent
with expectations. Growth in property, plant and equipment is positively significant with a coefficient of
0.008 (p < 0.05).
Focusing on the full sample, the coefficient on DTA for profit firms is not statistically
significant, meaning that the market does not view DTA as future tax benefits (e.g., Amir et al., 1997;
Toommanon, 2007; and Chludek, 2011). Possible explanations are the uncertain cash flow
implications and reversal of deferred tax asset components including post-retirement benefit liabilities,
depreciation, and amortization. For the loss firms in early adoption period, the coefficient on deferred
tax assets (LOSS*DTA) is positive and statistically significant (2.503), which is consistent with Amir
and Sougiannis (1999) and Chang et al. (2009). The market perceives the DTA reported by loss firms
early adopting IAS No. 12 would reverse and save future cash flow for the firms. Contrarily, for the
firms adopting IAS No. 12 as mandated, the market does not perceive DTA as assets but views DTL
as liabilities. We conclude that only loss firms with early adopting IAS No. 12 successfully signal the
market about their potential future tax savings. Since the coefficient of FIN during early adoption
period is large and significantly negative (-26.696), this provides an opportunity to further investigate
financial industry as a control variable in the early adoption period by comparing with the other
industries in later analysis.24 The DTL is viewed as future tax liabilities as the coefficients of DTL in
the full sample (-8.217), early adoption (-9.864), and effective period (-4.246) are negative and
significant as presented in Table 6. This suggests that the market discounts DTL when pricing the
security (Ayers, 1998; Tse and Holtzman, 1995). The DTL reported by loss-reporting mandatory
adopters is viewed as liabilities as the coefficient of LOSS*DTL is negative and significant (-0.991),
while DTL reported by the early adopters that also report loss is not value relevant. Confirming the
industry effect, the coefficient of DTL in Table 6 suggests the market discount the price of early
24 Though property & construction sector are dominant in our analyses, it does not play an important role in the regression models.
2014 Capital Market Research Institute, The Stock Exchange of Thailand
20
adopters in other sectors. Taken together, the market responds to the DTL because the components
of DTL are expected to reverse in the short run.
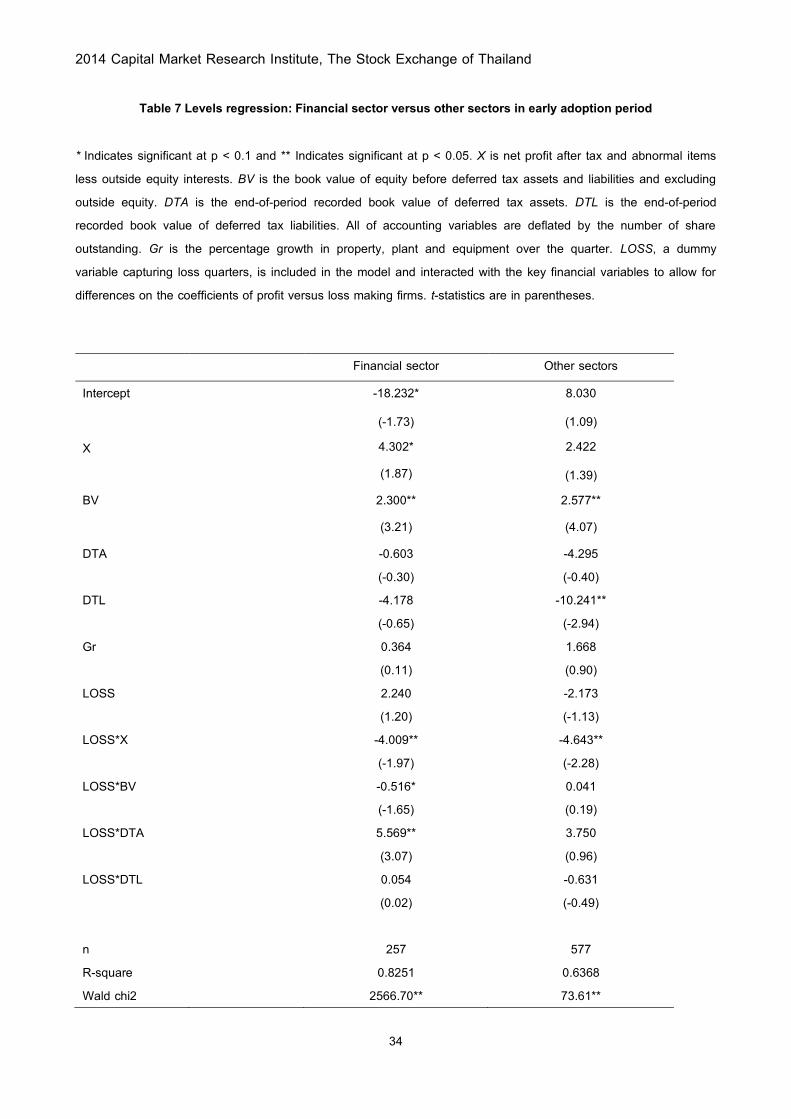
6.5 Evidence in financial sector during early adoption period
The results in Table 7 show that the coefficient of LOSS*DTA of the financial firms is large,
positive, and statistically significant (5.569). While the coefficient of LOSS*DTA of the other sectors is
positive but not significant (3.750), the DTL is negative and significant (-10.241). Thus, the market
values only DTA reported by loss firms in financial industry during early adoption period but not DTA
reported by early adopters in the other sectors. This market's response may be attributed to that the
main components of deferred tax assets for loss firms in financial sector are from provision of doubtful
debt and outstanding claim reserve. For insurance companies, outstanding claim reserve represents
estimate of ultimate obligations in respect of actual claim or known incidents expected to give rise to
claims. This reserve is expected to reverse as tax expense when actual claim happens. Alternatively,
Skinner (2008) reports that bank management in Japan uses DTA to manage reported levels of
regulatory capital to avoid falling below the minimum capital thresholds. Therefore, it indicates that
market perceives deferred tax assets from these components as future tax saving.
2014 Capital Market Research Institute, The Stock Exchange of Thailand
21
Chapter 7 Conclusion, Limitation, and Future Research
This study examines how the market perceives the relevance of deferred tax assets and
liabilities reported by companies listed on the Stock Exchange of Thailand under IAS No. 12 and
whether current period tax deferrals have any value relevance. Our analysis uses the price levels and
returns models. The levels model of full sample suggests that the market does not perceive future
benefits from deferred tax assets. Nonetheless, our further investigation reveals intriguing
observations that the loss-reporting early adopters effectively convey the future tax saving to the
market. The market views deferred tax assets of loss firms in financial industry as assets because the
main components of deferred tax assets are provision of doubtful debt and outstanding claim reserve
that are expected to reverse in the short run. For deferred taxed liabilities, the market views as future
tax payment because main components of deferred taxed liabilities are from unrealized gain on
available-for-sale financial assets and revaluation surplus on assets that investors expect to reverse
as taxable income in the short run. For the offsetting balance, market perceives net deferred tax
assets as future tax saving and net deferred tax liabilities as deferred tax payment. This may indicate
that net deferred tax assets provide more value relevance to investors than separate deferred tax
assets. This confirms that the net balance disclosure requirement under IAS No. 12 is warranted.
The returns model centralizes on the market perception of net current tax deferrals. We do
not find enough support for the relation between net current tax deferrals and returns for profit firms.
Specifically to the case of loss firms, the net current tax deferrals are negatively correlated with
returns. Investors interpret the larger increasing deferred tax assets over the increasing deferred tax
liabilities as a signal of higher future losses and the less likely reversal of loss carryforwards.
In conclusion, our results suggest that the market perception of deferred tax assets and
liabilities under the balance sheet method depend on the deferred tax accounts, the adoption period,
as well as the likelihood of reversal. The timing of deferred tax balance reversal and cash flow

2014 Capital Market Research Institute, The Stock Exchange of Thailand
22
implications are differentially perceived depending on the characteristics of deferred tax components
and the financial performance.
We acknowledge that small sample size may compromise our statistical power. We address
this issue by using quarterly data and panel regression models. Subsequent research may expand the
time interval to detect the changes in the deferred taxes and market perception.
2014 Capital Market Research Institute, The Stock Exchange of Thailand
23
References
Amir, E., M. Kirschenheiter, and K. Willard (1997), “The valuation of deferred taxes”, Contemporary
Accounting Research 14, 597–622.
Amir, E., and T. Sougiannis (1999), “Analysts’ interpretation and investors’ valuation of tax
carryforwards”, Contemporary Accounting Research 16, 1–33.
Ayres, B. C. (1998), “Deferred tax accounting under SFAS, 109: An empirical investigation of its
incremental value-relevance relative to APB No.11”, Accounting Review 73, 195–212.
Baltagi, B. H., and Y.-J. Chang. 1994. Incomplete panels: A comparative study of alternative estimators
for the unbalanced one-way error component regression model. Journal of Econometrics 62: 67–89.
Cassidy, J., F. R. Urbancic, J. Sylvestre, and F. Ralston (2011), “Accounting for income taxes: A study of
early vs. postponed adoption decisions for controversial accounting standards”, Journal of Applied Business
Research 9, 52-57
Chaney, P. K., and D. C. Jeter (1994), “The effect of deferred taxes on security prices”, Journal of
Accounting, Auditing and Finance 9, 91–116.
Chandra, U. and B. T. Ro (1997), “The association between deferred taxes and common stock risk”,
Journal of Accounting and Public Policy 16, 311-333.
Chang, C., K. Herbohn and I. Tutticci (2009), “Market's perception of deferred tax accruals”, Accounting
and Finance 49, 645-643.
Chludek, A. K. (2011), “Perceived versus actual cash flow implications of deferred taxes—An analysis of
value relevance and reversal under IFRS”, Journal of International Accounting Research 10(1), 1-25.
Dhaliwal, D., R. Trezevant, and M. Wilkins (2000), “Tests of deferred tax explanation of the negative
association between the LIFO reserve and firm value”, Contemporary Accounting Research 17, 41-59.
Eakin, C. F. and J. D. Gramlich (2000), “Insider trading and the early adoption of SFAS 96: A test of the
signaling hypothesis”, Advances in Accounting 17, 111-133.

2014 Capital Market Research Institute, The Stock Exchange of Thailand
24
Graham, J. R., J. S. Raedy, and D. A. Shackelford (2012), “Research in accounting for income taxes”,
Journal of Accounting and Economics 53, 412-434.
Guenther, D. and R. Sansing (2004), “The valuation relevance of reversing deferred tax liabilities”, The
Accounting Review 79, 437-451.
Federation of Accounting Professions (2009), “Draft Thai accounting standard No.56 Income Taxes”,
http://www.fap.or.th
Federation of Accounting Professions (2010), “Thai accounting standard No.12 Income Taxes”,
http://www.fap.or.th
Givoly, D. and C. Hayn (1992), “The valuation of the deferred tax liability: Evidence from the stock
market”, The Accounting Review 67, 394-410.
Graham, J. R., J. S. Raedy, and D. A. Shackelford (2012), “Research in accounting for income taxes”,
Journal of Accounting and Economics 53, 412-434.
Holthausen, R. and R. Watts (2001). “The relevance of value-relevance literature for financial accounting
standard setting”, Journal of Accounting and Economics 31, 3-75.
International Accounting Standards Board (2009), “International accounting standard No.12 Income
Taxes”, http://www.ifrs.org
Lev, B. and D. Nissim (2004), “Taxable income, future earnings, and equity values”, The Accounting
Review 79(4), 1039-1074.
Miller, G. S. and D. J. Skinner (1998), “Determinants of the valuation allowance for deferred tax assets
under SFAS No.109”, The Accounting Review 73, 213-233
Ohlson, J. (1995), “Earnings, book values and dividends in security valuation”, Contemporary Accounting
Research 11, 661–687.
Porteba, J., N. Rao, and J. Seidman (2011) “Deferred tax positions and incentives for corporate
behavior around corporate tax changes”, National Tax Journal 64(1), 27-58.
Sansing, R. (1998) “The deferred tax liability”, Journal of Accounting Research 36, 357-363.
2014 Capital Market Research Institute, The Stock Exchange of Thailand
25
Skinner, D. J. (2008) “The rise of deferred tax assets in Japan: The role of deferred tax accounting in
the Japanese banking crisis”, Journal of Accounting and Economics 46, 218-239.
Swamy, P. A. V. B. and S. S. Arora (1972), “The exact finite sample properties of estimators of
coefficients in the error components regression models”, Econometrica, Vol. 40, pp. 253-260.
Tse, S. and M. Holtzman (1995), “The cross-sectional valuation of deferred income taxes: Effects of
industry-specific tax policies”, Working paper, University of Texas at Austin.
Tummanon, V. (2007), “The effects of the adoption of deferred taxes accounting policy during B.E. 2538-
2549”, Journal of Accounting Professions 7, 27-47
White, H. (1980), A heteroskedasticity-consistent covariance matrix estimator and a direct test for
heteroskedasticity", Econometrica 48 (4): 817–838.
Zeng, T. (2003), “The valuation of loss carryforwards”, Canadian Journal of Administrative Sciences 20,
166–176.
2014 Capital Market Research Institute, The Stock Exchange of Thailand
26
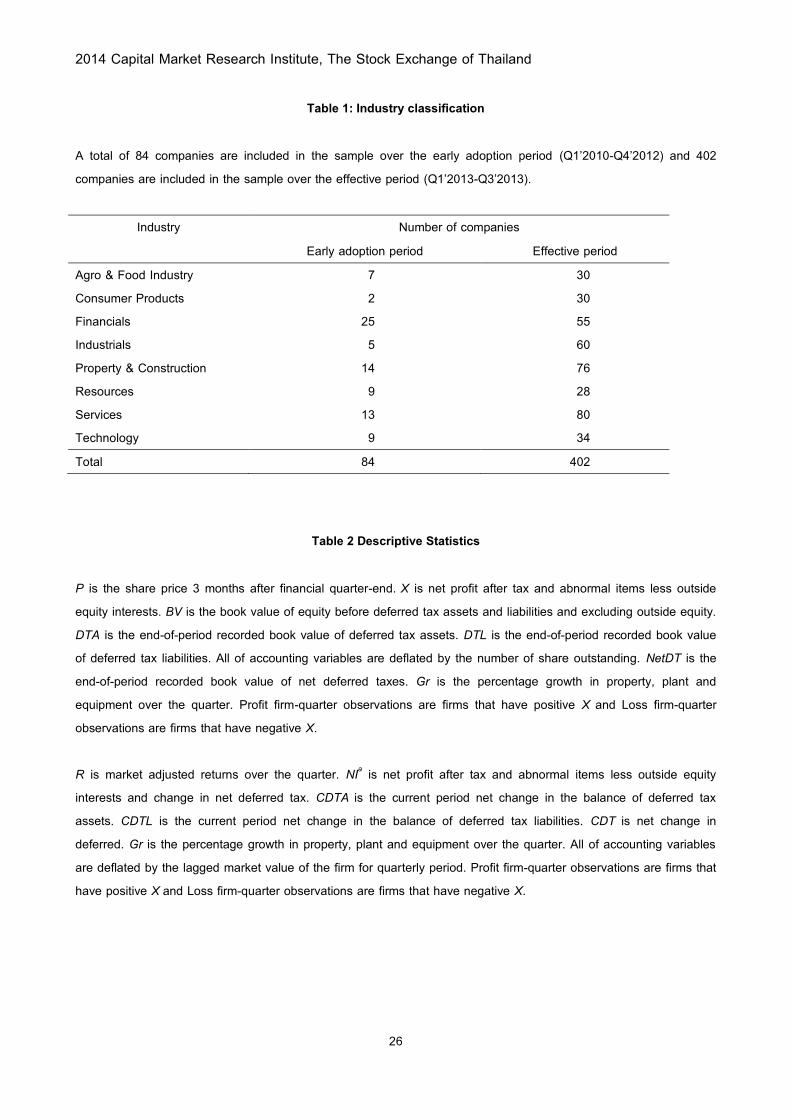
Table 1: Industry classification
A total of 84 companies are included in the sample over the early adoption period (Q1’2010-Q4’2012) and 402 companies are included in the sample over the effective period (Q1’2013-Q3’2013).
Industry Number of companies Early adoption period Effective period
Agro & Food Industry 7 30 Consumer Products 2 30 Financials 25 55 Industrials 5 60 Property & Construction 14 76 Resources 9 28 Services 13 80 Technology 9 34 Total 84 402
Table 2 Descriptive Statistics P is the share price 3 months after financial quarter-end. X is net profit after tax and abnormal items less outside equity interests. BV is the book value of equity before deferred tax assets and liabilities and excluding outside equity. DTA is the end-of-period recorded book value of deferred tax assets. DTL is the end-of-period recorded book value of deferred tax liabilities. All of accounting variables are deflated by the number of share outstanding. NetDT is the end-of-period recorded book value of net deferred taxes. Gr is the percentage growth in property, plant and equipment over the quarter. Profit firm-quarter observations are firms that have positive X and Loss firm-quarter observations are firms that have negative X. R is market adjusted returns over the quarter. NIa is net profit after tax and abnormal items less outside equity interests and change in net deferred tax. CDTA is the current period net change in the balance of deferred tax assets. CDTL is the current period net change in the balance of deferred tax liabilities. CDT is net change in deferred. Gr is the percentage growth in property, plant and equipment over the quarter. All of accounting variables are deflated by the lagged market value of the firm for quarterly period. Profit firm-quarter observations are firms that have positive X and Loss firm-quarter observations are firms that have negative X.
2014 Capital Market Research Institute, The Stock Exchange of Thailand
27
Panel A: Price levels model (n = 2,028)
Profit firm-quarters
(n = 1709) P X BV DTA DTL NetDT Gr
Gross amount (million baht) Mean 50.39 1,013.47 21,330.28 714.17 981.80 -267.63 0.18 Median 13.43 111.81 3,043.52 65.73 4.99 26.11 0.00 Minimum 0.15 0.03 37.77 0.00 0.00 -
46,652.03 -0.94
Maximum 1,890.00 42,739.67 702,689.16 20,040.05 61,089.13 9,997.21 238.26 Standard deviation 119.90 3,217.19 66,464.53 2,312.90 5,346.30 3,742.49 5.77 Amount per share (baht) Mean 50.39 1.02 23.63 0.87 0.79 0.08 0.18 Median 13.43 0.19 7.89 0.15 0.01 0.06 0.00 Minimum 0.15 0.00 0.04 0.00 0.00 -34.92 -0.94 Maximum 1,890.00 28.43 475.31 18.22 52.40 18.22 238.26 Standard deviation 119.90 2.08 44.74 2.02 3.37 3.17 5.77
Loss firm-quarters
(n = 319)
Gross amount (million baht) Mean 21.72 -327.27 4,918.64 560.57 208.70 351.87 0.13 Median 6.10 -36.07 1,539.98 40.33 2.68 32.47 0.00 Minimum 0.17 -8,438.93 -414.56 0.00 0.00 -3,148.66 -0.92 Maximum 484.70 -0.04 84,717.32 8,842.67 4,735.28 7,826.29 16.98 Standard deviation 60.09 1,041.43 10,983.56 1,554.91 709.24 1,270.34 1.157 Amount per share (baht) Mean 21.72 -0.57 13.93 0.87 0.44 0.43 0.13 Median 6.10 -0.13 4.78 0.13 0.01 0.08 0.00 Minimum 0.17 -11.87 -0.43 0.00 0.00 -26.77 -0.92 Maximum 484.70 0.00 158.68 13.37 26.83 13.37 16.98 Standard deviation 60.09 1.43 22.79 1.79 2.17 2.71 1.157
2014 Capital Market Research Institute, The Stock Exchange of Thailand
28
Panel B: Returns model (n = 2,019) Profit firm-quarters
(n = 1,701)
R NIa CDTA CDTL CDT Gr
Gross amount (million baht) Mean 0.02 1,059.08 3.85 45.59 -41.74 0.18 Median 0.00 111.75 0.99 0.00 0.84 0.00 Minimum -0.60 -2,299.58 -4,780.54 -5,016.04 -18,855.10 -0.94 Maximum 24.47 43,277.46 8,444.91 16,467.45 5,041.24 238.26 Standard deviation 0.62 3,470.70 348.74 749.12 799.22 5.79 Amount per market value (baht) Mean 0.02 0.36 0.03 0.00 0.03 0.18 Median 0.00 0.03 0.00 0.00 0.00 0.00 Minimum -0.60 -14.76 -8.03 -13.80 -17.69 -0.94 Maximum 24.47 485.62 82.17 15.50 82.17 238.26 Standard deviation 0.62 11.94 2.03 0.62 2.11 5.79
Loss firm-quarters
(n = 318)
Gross amount (million baht) Mean -0.03 -326.88 -9.62 -8.46 -1.16 0.13 Median -0.06 -36.46 0.34 0.00 1.44 0.00 Minimum -0.94 -8,672.23 -2,489.13 -1,852.55 -2,489.13 -0.92 Maximum 1.30 727.15 973.21 728.90 1,853.41 16.98 Standard deviation 0.21 1,056.33 249.72 139.28 272.08 1.16 Amount per market value (baht) Mean -0.03 -0.12 0.00 -0.04 0.04 0.13 Median -0.06 0.04 0.00 0.00 0.00 0.00 Minimum -0.94 -66.55 -4.12 -9.26 -4.12 -0.92 Maximum 1.30 19.75 10.56 0.47 19.81 16.98 Standard deviation 0.21 4.35 0.70 0.53 1.17 1.16
2014 Capital Market Research Institute, The Stock Exchange of Thailand
29
Table 3 Pearson correlation metrics
* Indicates significant at p < 0.05. P is the share price 3 months after financial quarter-end. X is net profit after tax and abnormal items less outside equity interests. BV is the book value of equity before deferred tax assets and liabilities and excluding outside equity. DTA is the end-of-period recorded book value of deferred tax assets. DTL is the end-of-period recorded book value of deferred tax liabilities. All of accounting variables are deflated by the number of share outstanding. Gr is the percentage growth in property, plant and equipment over the quarter. R is market adjusted returns over the quarter. NI is net profit after tax and abnormal items less outside equity interests and change in net deferred tax. CDTA is the current period net change in the balance of deferred tax assets. CDTL is the current period net change in the balance of deferred tax liabilities. CDT is net change in deferred. All of accounting variables are deflated by the lagged market value of the firm for quarterly period. Panel A: Price levels model variables X BV DTA DTL Gr P 0.7521* 0.7459* 0.3938* 0.3146* -0.0086 X 0.7194* 0.3947* 0.3645* -0.0091 BV 0.5322* 0.6413* -0.0105 DTA 0.3615* -0.0120 DTL -0.0062
Panel B: Returns model variables
NI CDT Gr R 0.0063 0.0008 -0.0090 NI 0.8405* -0.0007 CDT -0.0011
2014 Capital Market Research Institute, The Stock Exchange of Thailand
30
Table 4 Levels regression using unbalanced panel data and Generalized Least Squares (GLS)
* Indicates significant at p < 0.1 and ** Indicates significant at p < 0.05. X is net profit after tax and abnormal items less outside equity interests. BV is the book value of equity before deferred tax assets and liabilities and excluding outside equity. NDT is the end-of-period recorded book value of net deferred taxes by coding net deferred tax assets as positive numbers and net deferred tax liabilities as negative numbers. All of accounting variables are deflated by the number of share outstanding. Gr is the percentage growth in property, plant and equipment over the quarter. PROP is a dummy variable that equals 1 for property & construction industry sector companies while FIN take the value of 1 for financial sector companies. LOSS, a dummy variable capturing loss quarters, is included in the model and interacted with the key financial variables to allow for differences on the coefficients of profit versus loss making firms. t-statistics are in parentheses.
Full sample Early adoption period Effective period
Intercept -2.052 5.166 18.680**
(-0.27) (0.46) (2.00) X 4.898** 2.044* 0.463
(2.74) (1.45) (0.63) BV 1.810** 2.148** 1.054**
(3.42) (5.04) (1.93)
NDT 5.896** 5.652** 4.186*
(2.17) (2.97) (1.68)
Gr 0.010* 1.510 -0.014** (2.15) (0.91) (-11.00) PROP 4.817 6.509 -7.112 (0.88) (0.46) (-0.84) FIN -2.391 -30.744** 9.072 (-0.15) (-2.72) (0.49) LOSS 0.157 0.234 -0.978** (0.17) (0.18) (-2.71) LOSS*X -5.237** -2.136* -0.827 (-3.04) (-1.47) (-0.52) LOSS*BV 0.050 0.055 0.041 (0.66) (0.58) (0.54) LOSS*NDT 0.846* 1.353** 0.492 (1.68) (2.60) (1.17) n 2,028 834 1,194 R-square 0.6226 0.6555 0.5727 Wald Chi2 70.05** 72.78** 153.19**
2014 Capital Market Research Institute, The Stock Exchange of Thailand
31
Table 5 Returns regression using unbalanced panel data and Generalized Least Squares (GLS)
* Indicates significant at p < 0.1 and ** Indicates significant at p < 0.05. R is market adjusted returns over the quarter. NIa is net profit after tax and abnormal items less outside equity interests and change in net deferred tax. CDTA is the current period net change in the balance of deferred tax assets. CDTL is the current period net change in the balance of deferred tax liabilities. CDT is net change in deferred taxes calculated from CDTA - CDTL. All of accounting variables are deflated by the lagged market value of the firm for quarterly period. t-statistics are in parentheses.
Full sample Early adoption period Effective period Intercept 0.017** 0.050** -0.001 (2.96) (3.64) (-0.26) NIa 0.001 -0.001 0.013* (0.90) (-0.80) (1.78) CDT -0.004 0.003 0.034 (-0.70) (0.87) (0.68) Gr -0.001** -0.044 -0.001* (-2.35) (-1.35) (-1.96) PROP -0.028** 0.001 -0.045** (-2.17) (0.05) (-3.32) FIN 0.051 0.059 0.020 (0.93) (0.65) (1.55) LOSS -0.055** -0.101* -0.021 (-2.67) (-1.93) (-1.19) LOSS* NIa -0.013** -0.009** -0.055** (-2.74) (-2.28) (-2.17) LOSS*CDT -0.042** -0.047** -0.093 (-2.47) (-3.00) (-0.66) N 2,019 833 1,186 R-square 0.0039 0.0032 0.0374 Wald Chi2 37.73** 33.62** 44.98**

2014 Capital Market Research Institute, The Stock Exchange of Thailand
32
Table 6 Levels regression using unbalanced panel data and Generalized Least Squares (GLS)
* Indicates significant at p < 0.1 and ** Indicates significant at p < 0.05. X is net profit after tax and abnormal items less outside equity interests. BV is the book value of equity before deferred tax assets and liabilities and excluding outside equity. DTA is the end-of-period recorded book value of deferred tax assets. DTL is the end-of-period recorded book value of deferred tax liabilities. All of accounting variables are deflated by the number of share outstanding. Gr is the percentage growth in property, plant and equipment over the quarter. PROP is a dummy variable that equals 1 for property & construction industry sector companies while FIN take the value of 1 for financial sector companies. LOSS, a dummy variable capturing loss quarters, is included in the model and interacted with the key financial variables to allow for differences on the coefficients of profit versus loss making firms. t-statistics are in parentheses.

2014 Capital Market Research Institute, The Stock Exchange of Thailand
33
Full sample Early adoption period Effective period
Intercept -2.373 3.563 18.278**
(-0.30) (0.33) (2.02)
X 5.095** 2.389* 0.443
(2.71) (1.69) (0.59)
BV 2.022** 2.523** 1.073**
(3.37) (5.18) (1.75)
DTA -1.372 1.094 4.227 (-0.34) (0.41) (1.02) DTL -8.217** -9.864** -4.246* (-2.44) (-3.83) (-1.57) Gr 0.008** 1.622 -0.013** (1.99) (0.94) (-9.55) PROP 5.195 4.982 -6.868 (0.92) (0.39) (-0.82) FIN 7.035 -26.696** 9.127 (0.48) (-2.33) (0.50) LOSS 0.235 0.684 -0.808** (0.23) (0.40) (-2.86) LOSS*X -5.990** -2.855* -0.570 (-3.05) (-1.87) (-0.33) LOSS*BV 0.026 -0.032 0.112 (0.25) (-0.16) (1.15) LOSS*DTA 1.717 2.503** -1.121 (1.51) (2.48) (-0.98) LOSS*DTL -0.488 -0.222 -0.991* (-0.72) (-0.18) (-1.67) n 2,028 834 1,194 R-square 0.6353 0.6714 0.5732 Wald chi2 67.09** 85.45** 157.57**
2014 Capital Market Research Institute, The Stock Exchange of Thailand
34
Table 7 Levels regression: Financial sector versus other sectors in early adoption period
* Indicates significant at p < 0.1 and ** Indicates significant at p < 0.05. X is net profit after tax and abnormal items less outside equity interests. BV is the book value of equity before deferred tax assets and liabilities and excluding outside equity. DTA is the end-of-period recorded book value of deferred tax assets. DTL is the end-of-period recorded book value of deferred tax liabilities. All of accounting variables are deflated by the number of share outstanding. Gr is the percentage growth in property, plant and equipment over the quarter. LOSS, a dummy variable capturing loss quarters, is included in the model and interacted with the key financial variables to allow for differences on the coefficients of profit versus loss making firms. t-statistics are in parentheses.
Financial sector Other sectors
Intercept -18.232* 8.030
(-1.73) (1.09)
X 4.302* 2.422
(1.87) (1.39) BV 2.300** 2.577**
(3.21) (4.07)
DTA -0.603 -4.295 (-0.30) (-0.40) DTL -4.178 -10.241** (-0.65) (-2.94) Gr 0.364 1.668 (0.11) (0.90) LOSS 2.240 -2.173 (1.20) (-1.13) LOSS*X -4.009** -4.643** (-1.97) (-2.28) LOSS*BV -0.516* 0.041 (-1.65) (0.19) LOSS*DTA 5.569** 3.750 (3.07) (0.96) LOSS*DTL 0.054 -0.631 (0.02) (-0.49) n 257 577 R-square 0.8251 0.6368 Wald chi2 2566.70** 73.61**